There have been two main dynamics driving investor sentiment in recent weeks, and the unpredictable nature of both has led to increased volatility in the stock and bond markets. The first is the approach of interest rate hikes in the United States, and the second is political turmoil in the Eurozone. In the case of interest rates, that rates will eventually rise is assured, but the timing of rate hikes in uncertain. The Federal Reserve is anxious to begin restoring interest rates to more typical levels, but sees little inflationary pressure in the economy and is wary of slowing economic growth. Given the recent volatility in the capital markets, we expect the Fed to wait until later this year or early 2016 before raising policy rates.
As for Europe, the issues are much more tangled, and the plans and calculations of politicians more difficult to discern. As the third quarter begins, the Greek government has agreed to the demands of the country’s creditors, and the possibility of an immediate exit of Greece from the Eurozone has abated. This (albeit short-term) resolution has been good for risky assets, including stocks, and has put pressure on bond prices as investors unwind some of their ‘safe-haven’ positions. It is unlikely that we have seen the end of the drama in Europe, but in the longer term whether Greece remains in the Eurozone is not of much importance to the global economy, nor to investors.
EUROZONETURMOIL
The markets were shaken by the Greek government’s decision to break off negotiations with Eurozone leaders in late June, and as the second quarter concluded volatility in the capital markets was high.
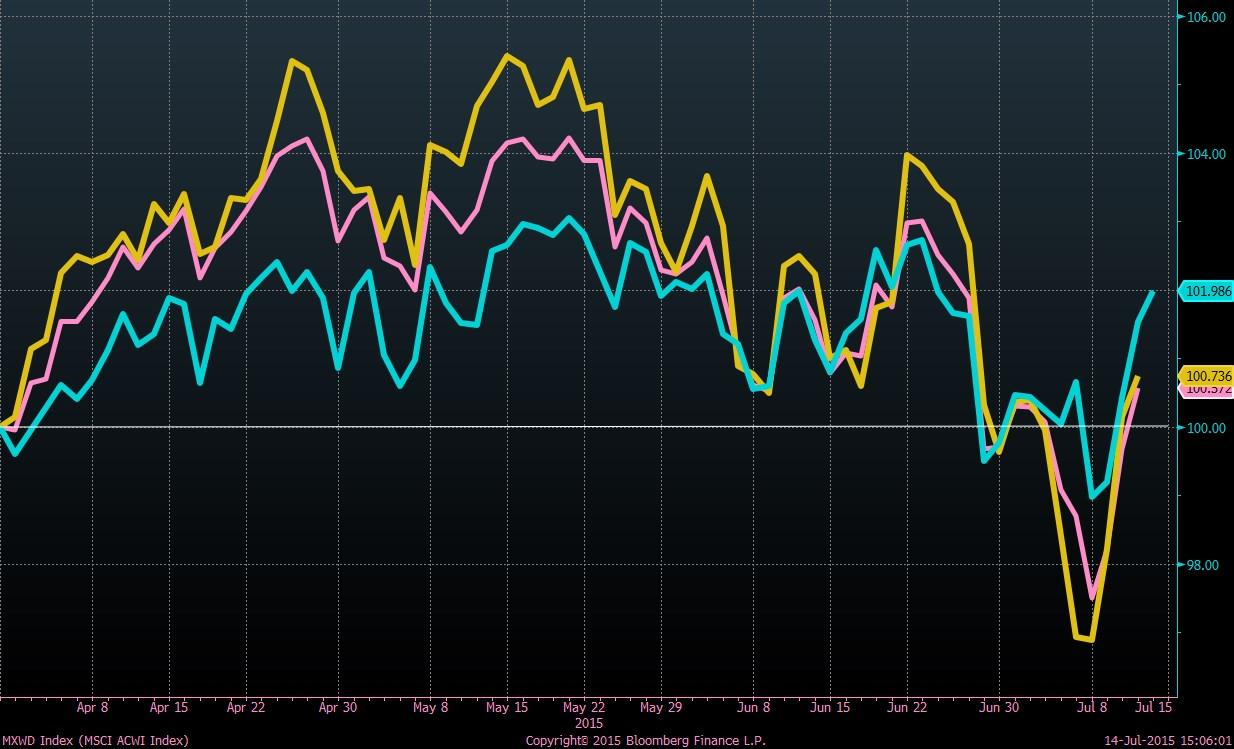
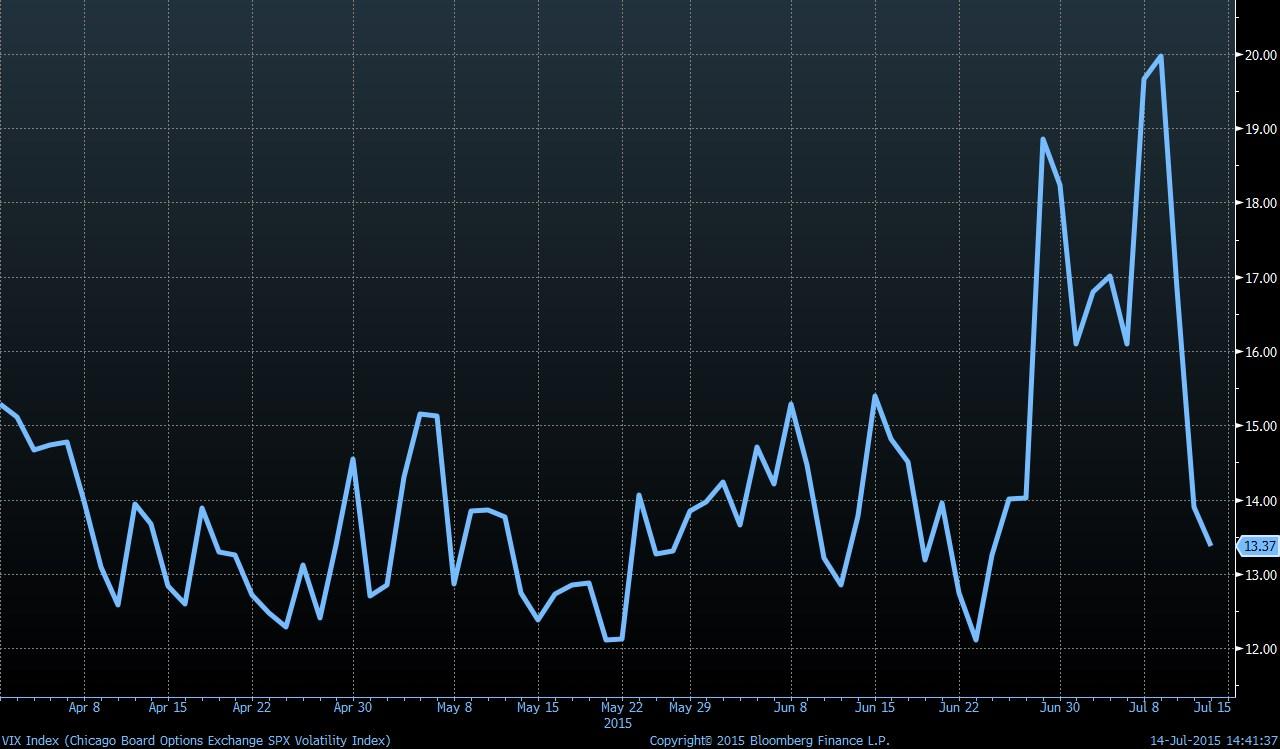
The MSCI All Country Index of global stocks fell 4.8% from June 26 to July 8, though stocks gained back some of those losses in subsequent days. The VIX, a measure of market volatility, spiked in late June and early July. Markets always hate uncertainty, and the brinksmanship shown by Greece’s prime minister produced significant uncertainty in the minds of investors. When analyzing the situation facing Europe, some perspective is required. Greece has a population of 11
million and a gross domestic product of $300 billion, which is roughly the size of Connecticut’s economy.
The broader Eurozone, on the other hand, has a population of more than 330 million and a GDP of $13 trillion. Obviously, Greece on its own is not terribly significant to the Eurozone, let alone to the global economy. Some investors are still wary of the possibility, however, that an exit of Greece from the monetary union could cause a new crisis in the continent’s financial system. This possibility, albeit small, is what has driven the spike in market volatility in recent weeks.
Investors’ fears are exaggerated. The private institutions that hold Greek debt have had years to prepare for a possible default and haircut. Moreover, over 80% of the debt that Greece owes is held not by private banks and investors, but by other Eurozone governments, the IMF, and the European Central Bank, who can absorb a loss. The European Central Bank is now deep into its quantitative easing program, and, if faced with Greece leaving, is almost certain to buy additional bonds to keep interest rates low in the rest of the monetary union. ECB chairman Mario Draghi has not backed down from his pledge to do ‘whatever it takes’ to save the euro, and he has credibility with bond investors.
Having Greece out of the Eurozone would probably be better for
European markets in the long run, as the brinkmanship that has become a recurrent theme in the negotiations between Greece and its creditors creates significant uncertainty and
worry among investors. In the short run, however, a collapse in negotiations would cause renewed volatility in the financial markets.
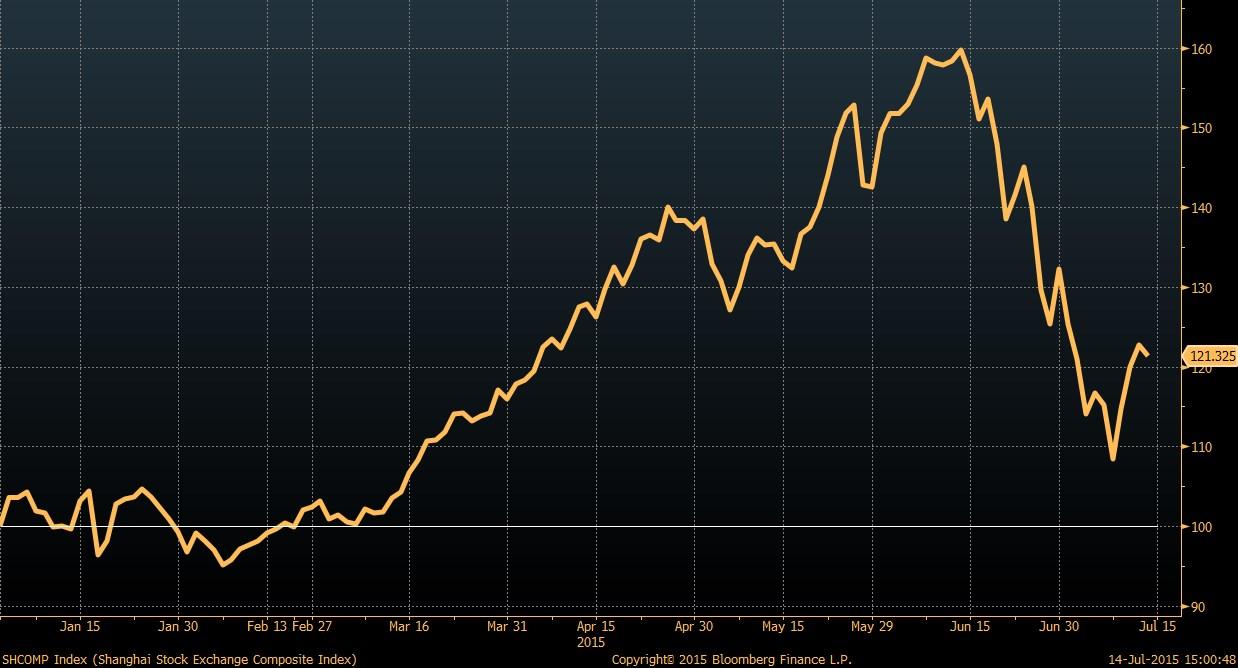
A few words are in order regarding the tumultuous ride of the Chinese stock market during the last few months. Chinese stocks had an excellent first quarter, with the Shanghai Composite Index up 60% through mid-June. The gain was driven by speculators and Chinese retail investors, many of whom opened brokerage accounts for the first time, seeking to cash in on the positive momentum of stocks. Cracks began appearing in early June, and in the following weeks the Shanghai Composite fell 30%. The government, alarmed by the fall, has taken drastic action to prop up the stock market. Initial public offerings have been suspended, margin rules have been relaxed, and large institutions now face restrictions on the sale of equities. These actions have helped to arrest the
CHINA
short-term fall, but this kind of meddling is deleterious to investor confidence in the long run.
This episode is relevant to investors because it demonstrates the fragility of financial markets in China, and offers insight into the thinking of Chinese policymakers. China’s leaders are clearly wary of markets and will continue to interfere when they view market results as excessive in any direction. The policies during the last few months were erratic and have greatly shaken investor confidence in the
competence of China’s leaders. Investors desire predictable policies from political leaders, and this has been in short supply in recent days.
China’s economy will continue to grow, and the country’s rise as an economic power is little affected by these events. The adoption of China’s currency as a global reserve currency has been delayed, however. For investors it will take some time for China’s policymakers to overcome the damage recently done to their
Despite heightened volatility in recent weeks, the stock market is up slightly year-todate. There has been significant variance in the returns among sectors, however. Healthcare, consumer discretionary, and consumer staples have all performed well, while energy, industrials, and utilities have underperformed.
EQUITIES
Energy stocks began to fall at the end of last year, after Saudi Arabia announced that it would bring new supply on the market, and the price of oil has fallen from over $100 per barrel to around $50. Demand is increasing, but this has been outweighed by new supply. Additionally, the recently announced deal between Iran and the West is likely to have a big impact on global oil supply during the coming years. Iran has the fourth largest oil reserves worldwide, but sanctions have prevented the country from accessing cutting-edge production technology and from selling to most of the world. That technology will now be in reach. Iran produced 6 million barrels per day in the 1970s and today produces about 3 million barrels per day, so the
potential to increase supply is obvious. Finally, supply from the U.S. and Iraq continues to increase. Given these dynamics, we expect oil prices to remain low for some time.
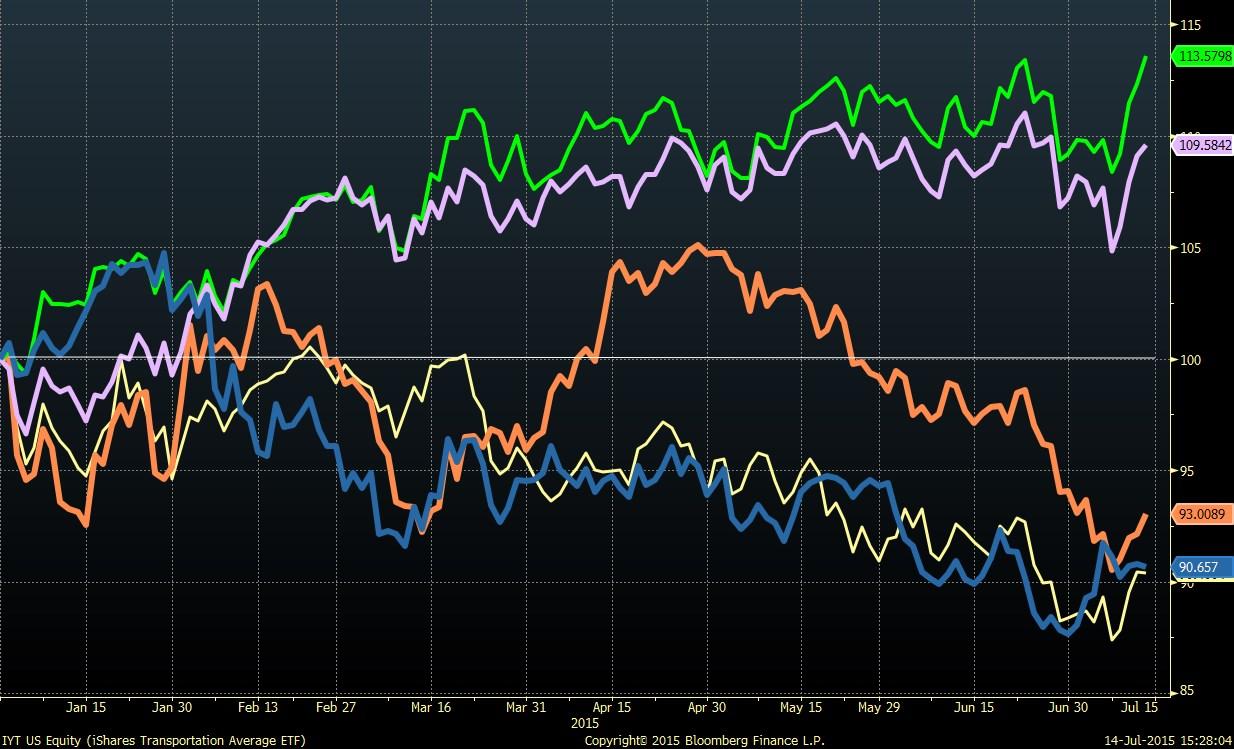
The most attractive equity sectors are industrials and, specifically, transportation stocks, which have underperformed recently and are trading at deep discounts to the broader market. Healthcare continues to be attractive despite the recent run-up, and consumer discretionary stocks are poised to make further gains as the U.S. economy continues to report decent growth numbers. Utilities will face further pressure in the coming period of Fed tightening.
Brandon Fitzpatrick
FIXEDINCOME
U.S. Treasury yields rose in June as bond investors anticipated interest rate hikes in the U.S. Yields fell in the first days of July, however, as investors braced for a possible exit of Greece from the Eurozone. While the Federal Open Market Committee (FOMC) has reiterated its position to raise the Fed Funds rate in 2015, the financial markets now calculate only a 57% chance of a rate increase by December. The Fed wants to begin raising rates, but will do so only when it is confident that rate hikes will not cause excessive turbulence in the financial markets.
The U.S economy added two hundred and eighty thousand jobs in May, bringing the unemployment rate to 5.5%. Average hourly wages and housing data also improved, as did consumer confidence. As the economic outlook has improved in the U.S., the yield of the benchmark 10-year Treasury bond rose to 2.35% at the end of June from 2.12% a month earlier. Similarly, yields were up in Europe despite the European Central Bank’s ongoing quantitative easing program. 10-year German bunds jumped from 0.05% in mid-April to 0.90% in June. The increase was not steady or gradual, however. The bond market seesawed amid the standoff between Greece and its creditors.
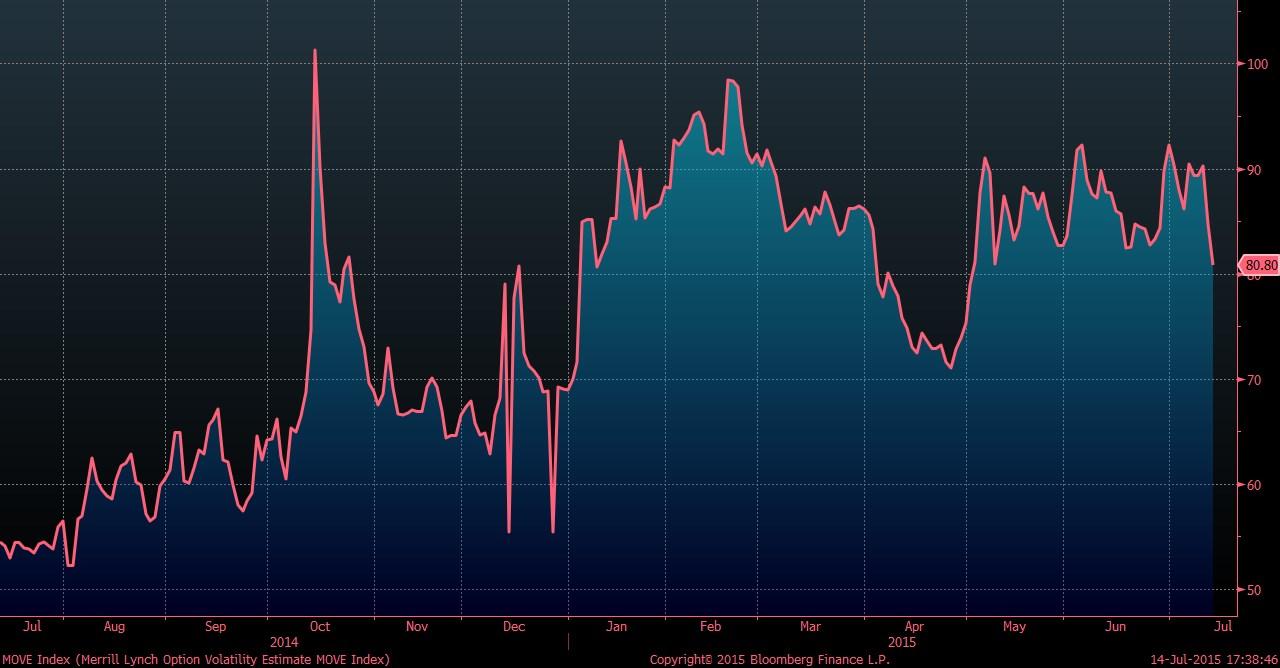
The turbulence in Europe has added to volatility in the fixed income market, as
demonstrated by the MOVE index. We expect elevated volatility to persist for the remainder of the year as investors interpret the impact of divergent monetary policies around the world, economic data from the U.S. and abroad, and grapple with the fallout of the latest crisis in Europe.
As interest rates rose in June, the Barclays U.S. Aggregate index returned -1.09% during the month.
Within the U.S. Aggregate Index, corporates returned -1.84%, while Treasuries and MBS returned -0.88% and -0.76%, respectively. Year-to-date, the Barclays US Aggregate index has returned -0.10%.
Agency MBS have slightly underperformed Treasuries year-to-date, as demonstrated by the Barclays U.S. Government Intermediate Index and the Barclays U.S.
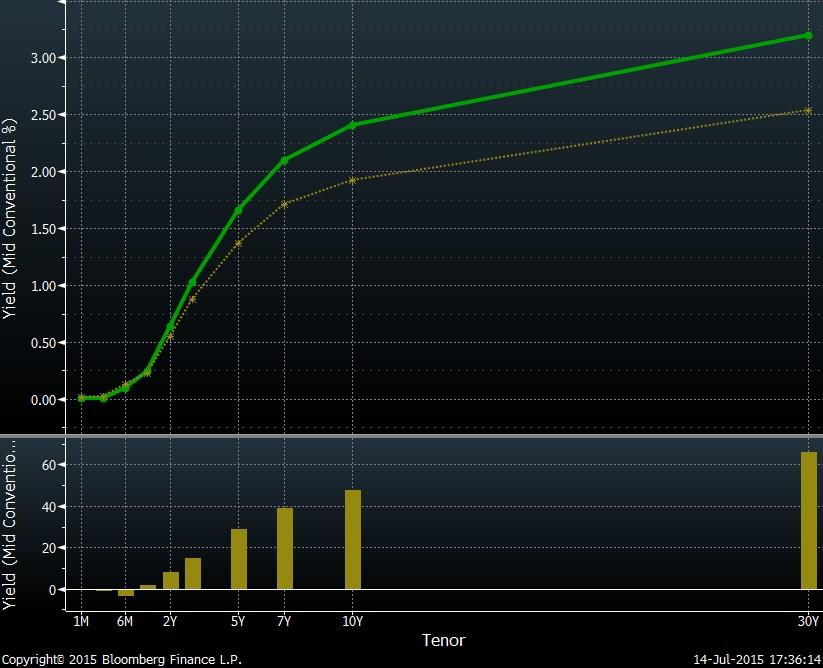
Treasury Yield Curve
7/14/15
3/31/15
MBS Index. This relative underperformance can be attributed to higher agency MBS issuance, a steeping of the yield curve, and higher interest rate volatility. Agency MBS issuance has increased by 58% to $661 billion as of June 2015, up from $419 billion in the same period last year. Within the MBS sector, Ginnie Mae securities have underperformed Fannie Mae and Freddie Mac MBS, as the FHA reduced annual MIP (mortgage insurance premium) from 1.35% to 0.85% earlier this year, prompting a rise in prepayments. With the recent underperformance, MBS now offer better value than U.S. Treasuries.
Q3 Q4 Q1 Q2
TIPS have outperformed Treasuries year-to-date, as the Merrill Lynch 3-5 year U.S. TIPS Index is up 1.58%, while the Merrill Lynch 3-5 year U.S. Treasuries Index has gained 1.34%. Year-to-date inflation, demonstrated by U.S. CPI Urban Consumer NSA Index, has increased by 1.27%. Inflation expectations have also increased as oil prices stabilized around $60 a barrel in May and June. Annual expected inflation during the next three years is 1.35%, up from 0.75% at year-end 2014. We expect inflation to rise to 2.0% to 2.5 % in the next 2-3 years.
Investment grade corporate bonds were hit the hardest in June, with the Barclays Corporate bond index returning -1.84% during the month. The index has returned -0.92% for the year. $592 billion of investment grade corporate debt has been issued
through May, vis-à-vis $511 billion in the same period last year. Corporations have been taking advantage of the low yield environment to lock in cheap financing for longer periods. The maturity of recently-issued corporate bonds averages 16.5 years vis-à-vis 12 years for debt issued during 2004-2014. Utilities have been the worst-performing corporate bond sector, returning -2.74% year-to-date. Meanwhile, the industrial and financial sectors have returned -1.12% and -0.14%, respectively, through June.
As the third quarter begins investment grade corporate bonds are attractive vis-à-vis agency MBS, as corporate spreads have widened. We prefer corporate credits over MBS in the intermediate duration space, as MBS have extension risk. We see significant value in longer maturity corporate bonds offered in the metals & mining, energy, communications, and financial sectors.
Prabhab Banskota
THIS PUBLICATION IS FOR INFORMATIONAL PURPOSES ONLY. THIS PUBLICATION IS IN NO WAY A SOLICITATION OR OFFER TO SELL SECURITIES OR INVESTMENT ADVISORY SERVICES, EXCEPT WHERE APPLICABLE, IN STATES WHERE D.B. FITZPATRICK & COMPANY IS REGISTERED OR WHERE AN EXEMPTION OR EXCLUSION FROM SUCH REGISTRATION EXISTS.
INFORMATION THROUGHOUT THIS PUBLICATION, WHETHER STOCK QUOTES, CHARTS, ARTICLES, OR ANY OTHER STATEMENT OR STATEMENTS REGARDING MARKET OR OTHER FINANCIAL INFORMATION, IS OBTAINED FROM SOURCES WHICH WE AND OUR SUPPLIERS BELIEVE RELIABLE, BUT WE DO NOT WARRANT OR GUARANTEE THE TIMELINESS OR ACCURACY OF THIS INFORMATION. NEITHER WE NOR OUR INFORMATION PROVIDERS SHALL BE LIABLE FOR ANY ERRORS OR INACCURACIES, REGARDLESS OF CAUSE, OR THE LACK OF TIMELINESS OF, OR FOR ANY DELAY OR INTERRUPTION IN THE TRANSMISSION THEREOF TO THE USER. THERE ARE NO WARRANTIES, EXPRESSED OR IMPLIED, AS TO ACCURACY, COMPLETENESS, OR RESULTS OBTAINED FROM ANY INFORMATION CONTAINED IN THIS PUBLICATION.
NOTHING IN THIS PUBLICATION SHOULD BE INTERPRETED TO STATE OR IMPLY THAT PAST RESULTS ARE AN INDICATION OF FUTURE PERFORMANCE. ALL RETURNS ARE MODEL RETURNS FROM A COMPOSITE. ALL RETURNS ARE NET OF FEES AND ANNUALIZED.