


JANUARY16





Dennis
Founder, CEO, and Chairman


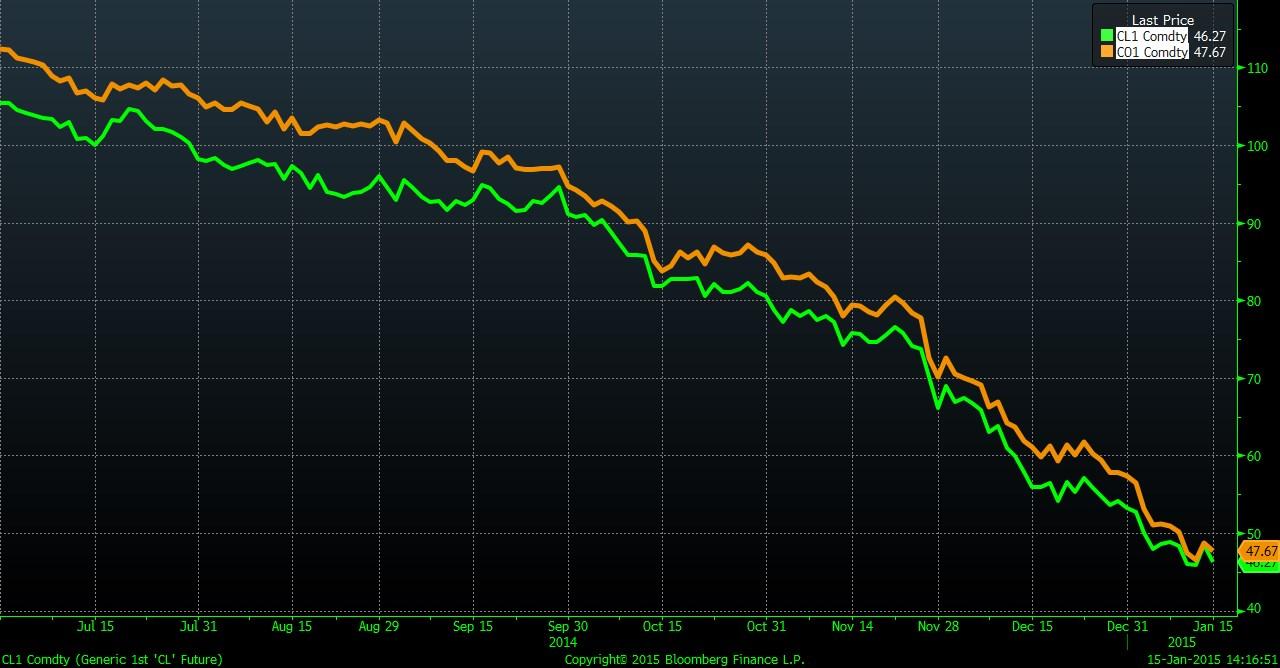
Volatility in the equity markets has increased in the last four months as disinflation in Europe and the falling price of oil down 50% since September have rattled investor confidence. Cheaper oil is good for the economy, but the reverberations sent through the energy sector, as seen in both falling stock prices and rising corporate bond yields, have impacted the broader markets.
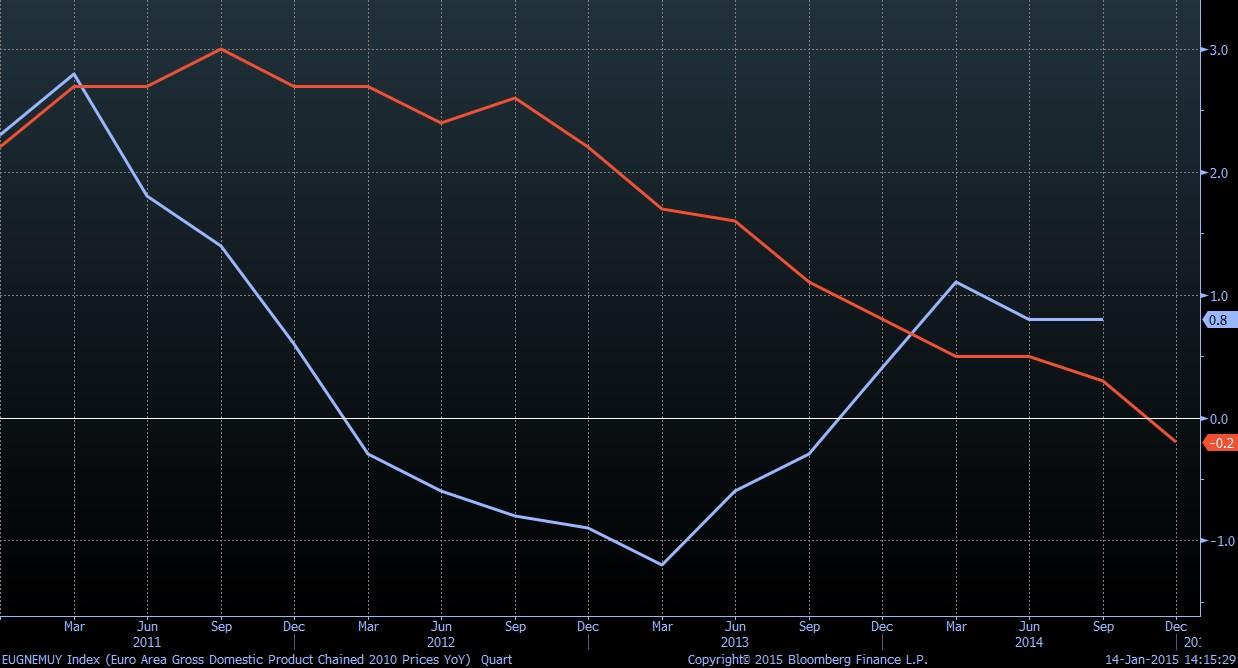
The Eurozone economy is growing less that 1.0% and year-over-year inflation reported in December was -0.2%. Europe’s weak economy has affected growth elsewhere in the world and disinflation in the Eurozone
has pushed down global interest rates. For example, in spite of an improving U.S. economy, the 10-year U.S. Treasury yield has fallen to 1.79%, and 10-year sovereign bond yields from all Eurozone countries except Portugal and Greece are even lower.
In many ways the global economy and financial markets are still grappling with the aftermath of the recession of 2007-2009. The U.S. economy has come a long distance during the last six years, but Europe’s slow progress means the aftershocks of the crisis will be with us a while longer.
OILTAKESADIVE
The price of oil has plunged in the last six months. West Texas Intermediate crude has fallen from $100/barrel last June to $47/barrel today, and the drivers of OPEC strategy have promised to maintain production no matter how low the price falls. Their obvious goal is to force oil producers around the world to scuttle marginally profitable projects, and to force solvency crises among the most highly-leveraged producers. Both of these goals have already been accomplished to a significant degree. Oil services firm Baker Hughes announced on January 9 that U.S. drillers had 1,420 rigs in use for oil production, down from 1,535 in late December. Some small and highly leveraged U.S. exploration and production companies have already seen their
stock prices fall 70-80% since September.
OPEC’s goal for the medium and long term is to lower the production capacity of non-OPEC members, and, of course, for the price of crude to eventually rise again. Saudi Arabia has considerable resources in reserve as it executes its plan. The Saudi government announced plans to spend US$230 billion as part of its normal budget in 2015, and is assuming a budget deficit of $40
billion (this figure is an estimate and will ultimately depend on how the price of oil evolves during the next year). The International Monetary Fund estimates that the Saudi government has $750 billion in foreign reserves, so clearly Saudi leaders have the ability to withstand low prices for a significant period, even years if necessary. Many small and medium-sized producers in the U.S. and elsewhere could not survive if oil prices stayed low that long. Some OPEC countries, such
as Iran, Venezuela, and Ecuador, will also suffer extreme difficulties if there is no recovery in prices soon (12-year U.S. dollar bonds of Venezuela’s state -run oil company PDVSA have a yield of 20%, implying a high likelihood of default), but in the end, Saudi Arabia’s voice is what matters and Saudi leaders are evidently not concerned with these smaller OPEC producers. Oil prices will remain low until Saudi leaders decide that their goals have been achieved. The timing of this is unpredictable.
In many cases surviving companies will come out of this downturn in a stronger position, as competition is either eliminated or absorbed. There is likely to be a round of mergers and acquisitions in the near future, as the largest and most conservatively-managed companies can still raise capital at attractive rates.
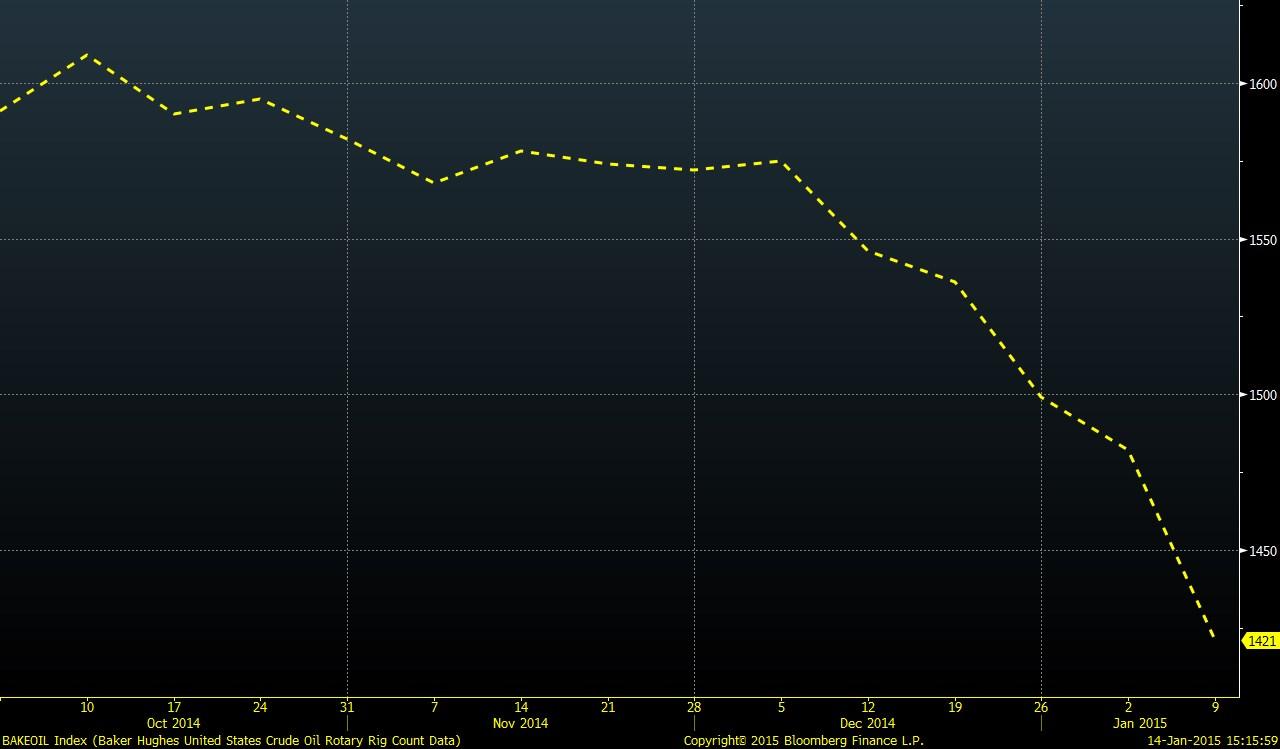
Baker Hughes U.S. Crude Oil Rig Count
Corporate Bond Yields of U.S. Oil Producers (date of maturity in parenthesis)
EUROPE
Europe’s very weak economy remains a source of concern for investors and lowers the potential for global economic growth. The Eurozone is on much more solid ground as a currency bloc than was the case two years ago when dissolution was a real possibility, but its economy is on the precipice of a new recession and year-over-year inflation dipped below zero in December. Political realities in Europe have made badly needed fiscal stimulus impossible and monetary stimulus very difficult. It has taken actual deflation for quantitative easing to become politically palatable, and even today the opposition is loud and rancorous.
The market expects, as we do, that the European Central Bank will begin a bond buying scheme in the first or second quarter of this year. This quantitative easing project will include the purchase of Eurozone sovereign bonds and might include corporate bonds. This will provide a short-term boost to European and global equity markets, but is unlikely to be enough to give the real economy in Europe the shot in the arm that is desperately needed. The success of the program, ultimately, will depend on the credibility of the ECB regarding the size of purchases and how long the program will last. The prospects for an overwhelmingly large and long-lived QE project, as
was implemented in the U.S., are not good, however. ECB leaders have to build a consensus with politicians who are absolutely averse to monetary stimulus, thus the plan is likely to be underwhelming from the point of view of the financial markets. Most of the Eurozone economy’s fundamental problems – notable among them an utter aversion to fiscal and monetary stimulus among key political groups and policymakers – are unchanged, and present a headwind to European growth prospects.
One piece of good news for Europe, however, is the euro, which has fallen 14% vis-à-vis the U.S. dollar since last June. The lower euro should begin to have an important effect on Eurozone exports in the months ahead. Exports of goods and services represent 27% of the Eurozone’s GDP. The weaker euro may prove to be the most important achievement of the ECB’s QE program.
UNITEDSTATES
The U.S. economy continues to show considerable strength. GDP growth is accelerating and will be close to 2.5% for 2014 when the final data come in. The unemployment rate has fallen to 5.6%, industrial production was up 5.2% year-over-year in November, and consumer confidence is as high as it’s been since 2007. Retail sales in December were weak, but this does not change the clear story of a significant and continued improvement in the U.S. economy.
The ultimate source of these encouraging numbers is the steady improvement in the U.S. housing sector. Housing starts and new building permits both are back to levels last seen in 2008, and the Case-Shiller
National Home Price Index was last up 4.5%, and has been mostly positive since 2010 (the index was negative in 2011, and this was a result of prices falling after a temporary tax incentive scheme was ended in 2010). Consumers’ personal balance sheets have improved substantially during the last few years and it is clear that
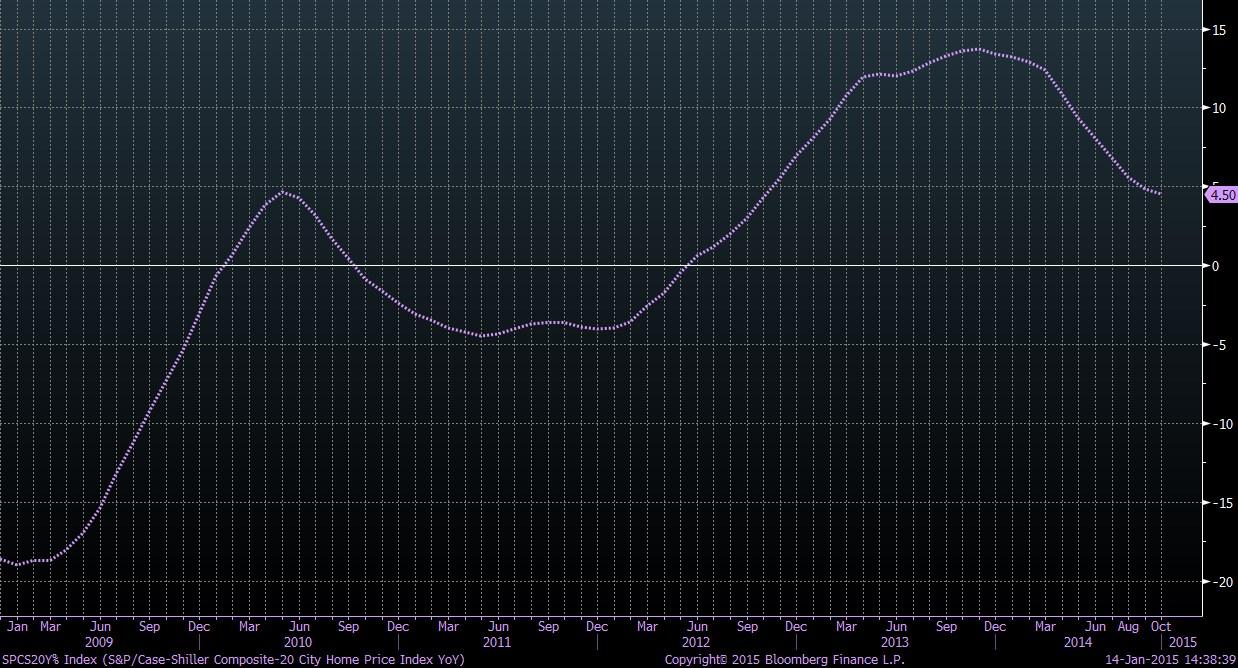
the economy has turned a corner. We expect the U.S. economy to continue building momentum and GDP growth to reach 3.0% in 2015.
The U.S dollar was up significantly in the second half of 2014 as the U.S. economy strengthened and the likelihood of a new monetary stimulus regime in the Eurozone has been factored into currency prices.
EQUITIES
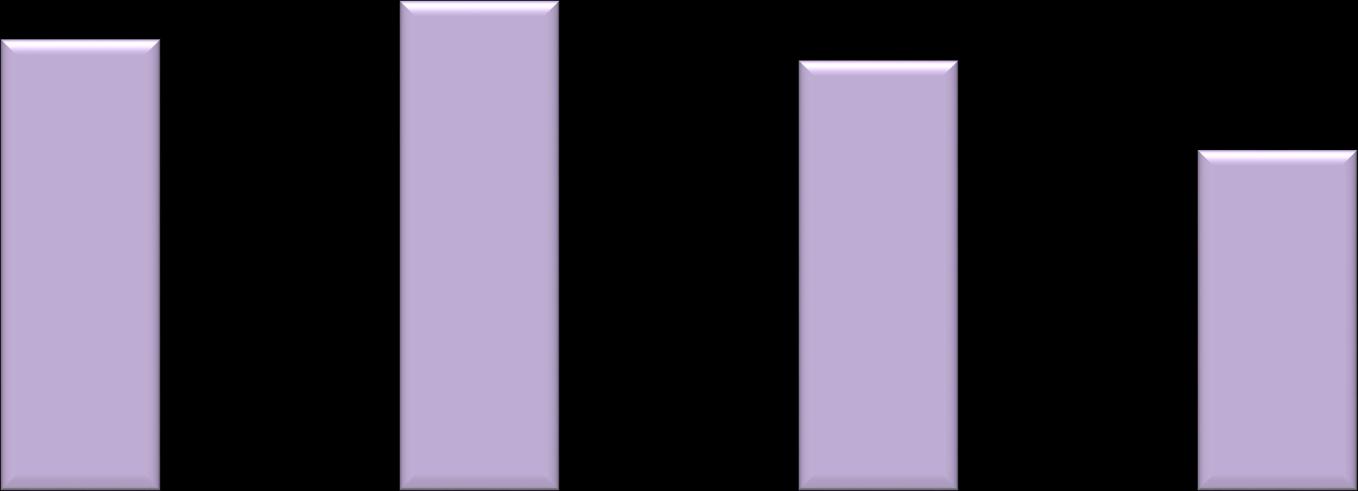
U.S. equities have performed well in 2014 but at 16.4x estimated 2015 earnings are fully valued. The MSCI EAFE Index of international developed countries is trading at 14.4x forward earnings and the MSCI Emerging Market Index is trading at 11.4x. Very low interest rates in the U.S., Europe, and Japan have pushed money into the safest areas of the equity market, including utilities and healthcare, as the “search for yield” in the bond markets has bled into select equity sectors. This is likely to continue during the first quarter of 2015 as interest rates remain low.
The higher dollar will be a drag on economic growth, but that drag should be relatively slight as foreign trade makes up only 15% of U.S. GDP.
Forward price to earnings ratio (current price, expected 2015 earnings)

generate returns in the long run, though pessimism regarding emerging market assets is high today. The valuations are compelling and the pessimism among investors will not last forever.
We see long-term value in healthcare stocks and industrials. International exposure will be important to
FIXEDINCOME
The fixed income market performed better than expected in 2014 as the U.S. Treasury yield curve declined and flattened. 2-year and 3-year U.S. Treasury rates increased 0.28% and 0.31%, respectively, while 10year and 30-year U.S. Treasury rates decreased 0.86% and 1.22%. As a result, longer duration bonds fared
better than short duration bonds.
The Barclays U.S. Aggregate index gained 5.97% for the year, while the U.S. Mortgage Back Securities (MBS) and Intermediate U.S. Government indices returned 6.08% and 2.52%, respectively.
The Fed took unprecedented steps to
spur growth in the U.S. economy after the financial crisis of 20072008, including decreasing the Fed Funds rate to 0.25% and embarking on multiple asset purchase programs. The Fed ended its final bond purchase program in October 2014, and with the unemployment rate at 5.6% and two quarters of
solid growth, the market expects the Fed to increase short-term rates in 2015. The Fed, however, “frets that a premature tightening of policy may damage an economy that is still bearing the scars of the financial crisis of 2007-2008”. An anemic global economy and disinflation in Europe add to those fears.
Fixed income markets and inflation (and inflationary expectations) are normally highly correlated; as inflation declines yields fall and bonds appreciate. In 2013, however, the opposite occurred as yields soared in an environment of declining inflation expectations. This divergence of nominal bond yields and inflation was a result of the Fed’s “unwinding” of its extraordinary monetary stimulus.
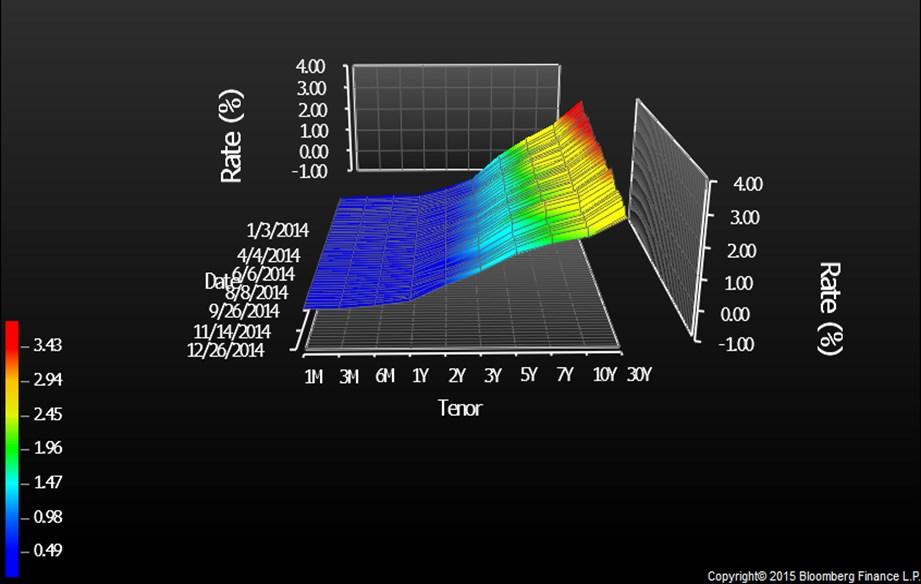
U.S. Treasury Yield Curve: January 2014 December 2014
10-year Government Bond Yields
The real interest rate rose on the shorter tenors of the yield curve in 2014 as inflation declined with slumping energy prices and a stronger dollar. The real interest rate on the higher tenors has fallen. Investors expect an annual inflation rate of 1.55% during the next 10 years as measured by the difference between the yields of 10-year U.S. Treasury and 10year TIPS (Treasury Inflation Protected Securities).
U.S Spain Germany Japan
The MBS sector outperformed Treasury and corporate bonds in 2014 as the Merrill Lynch 3-5 year U.S. MBS index returned 3.9%, while the Merrill Lynch 3-5 U.S. Treasury and 3-5 year U.S. Corporate bond indices returned 2.1% and 3.1%, respectively. The MBS sector outperformed as lower mortgage refinancing led to a decrease in gross issuance to $0.98 trillion in 2014, down from $1.6 trillion in 2013.
Most bond investors expect the Federal Reserve to raise
the Fed Funds rate in the second half of 2015. Such an increase, however, would threaten U.S growth and would depress already low inflation. We believe the Fed will move slowly, if at all, to raise rates in the last quarter of 2015, and that the U.S. 10-year Treasury yield will be between 2.2% to 2.7% by the end of this year. If energy prices recover, inflation and inflation expectations should edge higher in the second half of 2015.
We see value in longer maturity corporate bonds vis-àvis MBS and we are increasing our allocation to high quality credit securities. Additionally, we are
maintaining our TIPS positions, as we expect inflation expectations to rise in the coming year. MBS remain an attractive sector for the long term, but the risk of increased prepayments as interest rates have fallen makes MBS somewhat less attractive in the present environment.
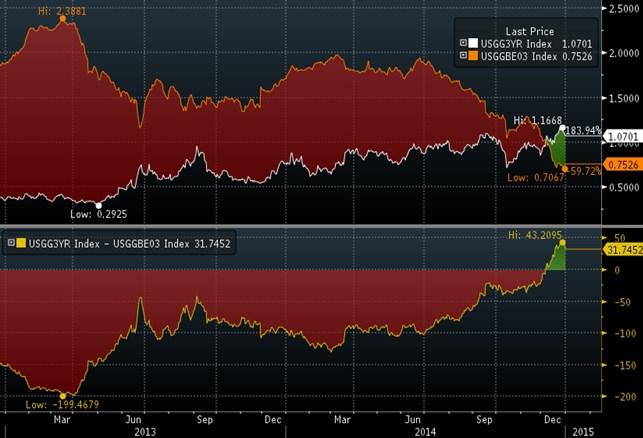
3-year inflation expectation
U.S. 3-year nominal Treasury Yield
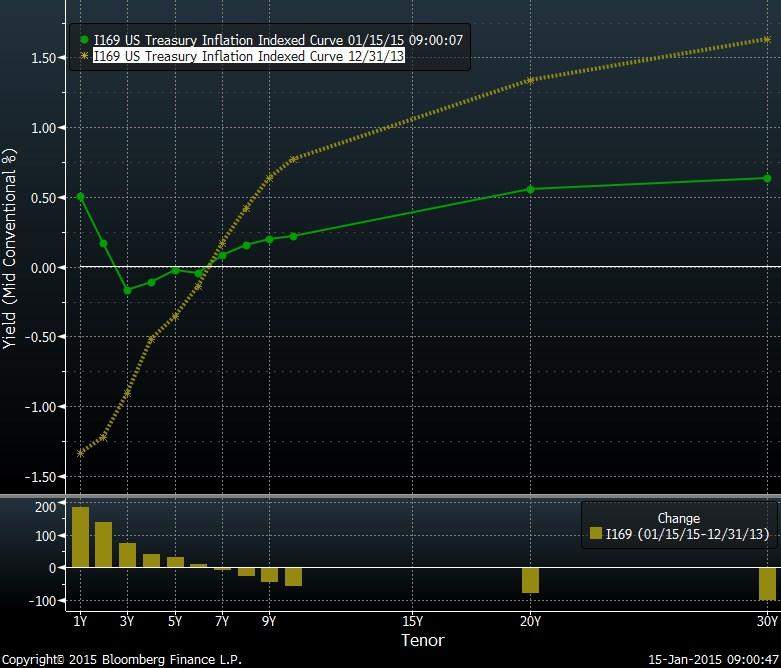
U.S. Treasury Inflation Indexed Curve

THIS PUBLICATION IS FOR INFORMATIONAL PURPOSES ONLY. THIS PUBLICATION IS IN NO WAY A SOLICITATION OR OFFER TO SELL SECURITIES OR INVESTMENT ADVISORY SERVICES, EXCEPT WHERE APPLICABLE, IN STATES WHERE D.B. FITZPATRICK & COMPANY IS REGISTERED OR WHERE AN EXEMPTION OR EXCLUSION FROM SUCH REGISTRATION EXISTS.
INFORMATION THROUGHOUT THIS PUBLICATION, WHETHER STOCK QUOTES, CHARTS, ARTICLES, OR ANY OTHER STATEMENT OR STATEMENTS REGARDING MARKET OR OTHER FINANCIAL INFORMATION, IS OBTAINED FROM SOURCES WHICH WE AND OUR SUPPLIERS BELIEVE RELIABLE, BUT WE DO NOT WARRANT OR GUARANTEE THE TIMELINESS OR ACCURACY OF THIS INFORMATION. NEITHER WE NOR OUR INFORMATION PROVIDERS SHALL BE LIABLE FOR ANY ERRORS OR INACCURACIES, REGARDLESS OF CAUSE, OR THE LACK OF TIMELINESS OF, OR FOR ANY DELAY OR INTERRUPTION IN THE TRANSMISSION THEREOF TO THE USER. THERE ARE NO WARRANTIES, EXPRESSED OR IMPLIED, AS TO ACCURACY, COMPLETENESS, OR RESULTS OBTAINED FROM ANY INFORMATION CONTAINED IN THIS PUBLICATION.
NOTHING IN THIS PUBLICATION SHOULD BE INTERPRETED TO STATE OR IMPLY THAT PAST RESULTS ARE AN INDICATION OF FUTURE PERFORMANCE. ALL RETURNS ARE MODEL RETURNS FROM A COMPOSITE. ALL RETURNS ARE NET OF FEES AND ANNUALIZED.