ISSUE
Nō �4
TALK TO US
FOLLOW US
Comments/questions phase3editor@dawnbreaker.com dawnbreaker.com
@Dawnbreaker
EXECUTIVE EDITOR
Jenny Servo, Ph.D.
MANAGING EDITOR
Julie S. Krull
20 18
DESIGNER
Annie Browar
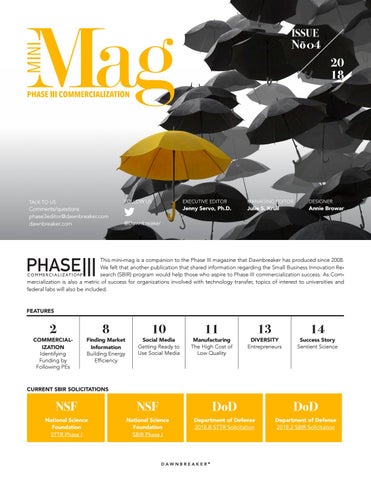
This mini-mag is a companion to the Phase III magazine that Dawnbreaker has produced since 2008. We felt that another publication that shared information regarding the Small Business Innovation Research (SBIR) program would help those who aspire to Phase III commercialization success. As Commercialization is also a metric of success for organizations involved with technology transfer, topics of interest to universities and federal labs will also be included.
FEATURES
2
COMMERCIALIZATION Identifying Funding by Following PEs
8
Finding Market Information Building Energy Efficiency
10
Social Media Getting Ready to Use Social Media
11
Manufacturing The High Cost of Low Quality
13
DIVERSITY Entrepreneurs
14
Success Story Sentient Science
CURRENT SBIR SOLICITATIONS
NSF
NSF
DoD
DoD
National Science Foundation STTR Phase I
National Science Foundation SBIR Phase I
Department of Defense 2018.B STTR Solicitation
Department of Defense 2018.2 SBIR Solicitation
DAWNBREAKER®
C O M MERCI AL I ZATI ON
SOLVING THE POR PUZZLE:
Identifying Funding by Following PEs
S
mall Business Concerns (SBCs), with SBIR/STTR Phase II contracts from the Department of Defense, need to understand how to transition their technologies into acquisition programs of record (PORs) and how that is best accomplished. While every instance of technology
transition offers unique and intricate considerations depending on POR timing, capability gap and operational requirements, and availability of funding the following article summarizes the process and makes straightforward, useful recommendations for moving forward.
2
MINI-MAG
First, a strong case must be presented to a program manager with a current or aspiring POR in order to potentially gain admission into the said POR. As a Program or Record, or preliminary work towards a POR, matures in its current lifecycle spiral, technology insertion typically becomes more difficult. The most opportune time to approach a program manager is when a current or candidate POR is involved in Concept Refinement and/or as the execution of an approved Analysis of Alternatives (AoA) plan takes place. This occurs well before the Milestone A review. During the consequent technology development stage (from Milestone A to Milestone B), technology is matured in preparation for the post-Milestone B System Development and Demonstration (SDD) stage.
Only technologies that are consistent with prevailing technology development strategy are part of the technology development stage.
MINI-MAG
3
Only technologies that are consistent with the prevailing technology development strategy are part of the technology development stage. Because it increases programmatic risks, a technology that was not part of the concept refinement AoA consideration is not typically admitted. Moreover, no program has unlimited funds or time. Finally, per Public Law 109-163, Section 801, all technologies in an acquisition program should achieve Technology Readiness Level (TRL) 6 prior to Milestone B. This means that the Technology Development Stage should bring all candidate technologies from TRLs 2 to 4 to a solid TRL 6 or higher. Few SBIR/STTR-seeded technologies are properly qualified, tested or assessed prior to Phase II completion, so it is fair to say that most of these technologies are relatively immature. This uncertainty requires the program manager to assume additional programmatic risk when including such technologies. To better position the technology for inclusion in a POR, an SBC should try to align the technology with documented capability gaps and program requirements early in the acquisition cycle of the candidate transition POR. In general, transitions into acquisition programs of record (PORs) require substantial effort and dedication. In this effort, it is critical to research public sources concerning the targeted POR, learning as much as possible about the program and preparing the technology to fill a capability need. Particularly helpful sources of program information are the descriptive summaries of Program Elements (PE). RDT&E program elements (accounting for 6.1-6.7 spending) are easily found via the online DoD Investment Budget Search system. For example, consider the summary of the PE 0604212N Other Helicopter Development. Whereas the PE is nominally a 6.4 (Advanced Component Development and Prototypes (ACD&P)), it is actually designated as a Budget Activity 5 (as a 6.5 PE would normally be), for System Development & Demonstration. The PE is used to fund various aspects of three airlift helicopter Projects: CH/MH-53, VH-3/VH-60 (Figure 1) and some others under the Attack and Utility Replacement Aircraft grouping. As expected, the two of the three projects in PE 0604212N are fairly mature and as of this article’s writing, most activities are product development, test and evaluation and ongoing support and services (Figures 2 and 3). A summary of these various activities shows that most funding is going to major aerospace companies (Sikorsky, Rockwell Collins) and Navy’s own system commands and support activities (e.g., NAWCAD, Patuxent River) (Figures 4 and 5). Attempting to insert a new technology at these advanced stages would be difficult, at best. UNCLASSIFIED Date: February 2018
Exhibit R-2, RDT&E Budget Item Justification: PB 2019 Navy Appropriation/Budget Activity 1319: Research, Development, Test & Evaluation, Navy / BA 5: System Development & Demonstration (SDD) COST ($ in Millions)
Prior Years
FY 2017
FY 2018
R-1 Program Element (Number/Name) PE 0604212N / Other Helicopter Development
FY 2019 Base
FY 2019 OCO
FY 2019 Total
FY 2020
FY 2021
FY 2022
Cost To FY 2023 Complete
Total Cost
Total Program Element
87.883
5.889
26.786
32.128
-
32.128
33.940
52.813
135.992
148.325 Continuing Continuing
1109: CH/MH-53
53.448
4.554
17.500
16.969
-
16.969
16.042
9.120
2.601
2.662 Continuing Continuing
2460: VH-3/VH-60
34.435
1.335
1.309
1.310
-
1.310
0.000
0.000
0.000
0.000
0.000
7.977
13.849
-
13.849
17.898
43.693
133.391
3406: Attack and Utility Replacement Aircraft
0.000
0.000
38.389
145.663 Continuing Continuing
Program MDAP/MAIS Code: Project MDAP/MAIS Code(s): 390
Figure 1 Description and Budget Item Justification A. Mission
UNCLASSIFIED
This Program Element includes funding for the development support for improvements to current systems for CH/MH-53, MH-60 development, VH-3/VH-60, and new Date: February 2018 sweeping Exhibit R-4, RDT&E Schedule development of Future Vertical Profile: Lift (FVL)PB 2019 Navy capability. The H-53 is the premier heavy lift helicopter for the Marine Corps and the only operational airborne mine platform for the Navy. H-53 RDT&E efforts focus on trade studies and risk reduction measures to identify candidate survivability, safety, avionics, cargo handling, Appropriation/Budget Activity R-1 Program Element (Number/Name) Project (Number/Name) cockpit VH-3/VH-60 required to provide safe and timely 1319 / 5 and other airframe specific improvements to extend the service life. ThePE 0604212N is / Other Helicopter 1109 /transportation CH/MH-53 for the President and Vice President of the United States, heads of state and others as directed by the White House Military Office. Future Vertical Lift (FVL) is a Joint Department initiative to Development address vertical lift capability requirements and determine feasible and affordable solutions in support of the Joint Warfighter.
B. Program Change Summary ($ in Millions) Previous President's Budget Current President's Budget Total Adjustments • Congressional General Reductions • Congressional Directed Reductions • Congressional Rescissions • Congressional Adds • Congressional Directed Transfers • Reprogrammings • SBIR/STTR Transfer Figure 2 • Rate/Misc Adjustments • Congressional Directed Reductions Adjustments
4
FY 2017 6.268 5.889 -0.379 - - - - - - -0.079 0.000 -0.300
FY 2018 26.786 26.786 0.000 - - - - - - 0.000 0.000 -
FY 2019 Base 32.685 32.128 -0.557
FY 2019 OCO - - -
FY 2019 Total 32.685 32.128 -0.557
-0.557 -
- -
-0.557 -
MINI-MAG PE 0604212N: Other Helicopter Development Navy
UNCLASSIFIED Page 1 of 24
R-1 Line #104
UNCLASSIFIED Date: February 2018
Exhibit R-4, RDT&E Schedule Profile: PB 2019 Navy Appropriation/Budget Activity 1319 / 5
R-1 Program Element (Number/Name) PE 0604212N / Other Helicopter Development FY 2017 2 3 4
1
1
FY 2018 2 3 4
1
FY 2019 2 3 4
1
FY 2020 2 3 4
1
Project (Number/Name) 2460 / VH-3/VH-60
FY 2021 2 3 4
1
FY 2022 2 3 4
1
FY 2023 2 3 4
VH-3/VH-60 Engineering Milestones: VH-3D / VH-60N ALMP Engineering Milestones: Systems
Figure 3 Development: VH Comms Upgrade Aircraft
Prototype Engineering and Flight Test Exhibit R-3, RDT&E Project Cost Analysis: PB 2019 Navy Engineering Milestones: Systems Development: VH Comms Appropriation/Budget ActivityUpgrade System 1319 Integration /5 Engineering Milestones: Systems Development: VH Comms Upgrade Software Product Development ($ in Millions) Integration Contract Method & Type
Cost Category Item Systems Engineering
WR
Systems Engineering Contract
C/CPFF
Systems Engineering
Figure 4 Design and Development Systems Engineering Contract R-3, RDT&E Exhibit
Performing Activity & Location
Prior Years
1319 / 5
FY 2017
Cost
FY 2019 Base
FY 2018
Award Date
Cost
Award Date
FY 2019 OCO
Award Date
Cost
Project (Number/Name) 1109 / CH/MH-53 FY 2019 Total
Award Date
Cost
Cost
Cost To Complete
Total Cost
Target Value of Contract
4.953
1.464 Nov 2016
1.618 Nov 2017
0.784 Nov 2018
-
0.784 Continuing Continuing Continuing
Sikorsky : Stratford, CT
0.482
0.614 Feb 2017
0.500 Feb 2018
0.000
-
0.000
0.000
1.596
1.596
WR
Various : Various
0.000
0.344 Nov 2016
0.600 Nov 2017
2.075 Nov 2018
-
2.075 Continuing Continuing Continuing
TBD
TBD : TBD
0.000
0.000
4.995 Mar 2018
2.218 Mar 2019
-
2.218
0.000
7.213
-
TBD
TBD : TBD
0.000
0.000
0.000
2.100 Feb 2019
-
2.100
0.000
2.100
-
0.000 0.000 Project (Number/Name) 2460 / VH-3/VH-60
19.475
-
7.177 Continuing Continuing
N/A
TBD TBD : TBD Activity Subtotal
19.475
0.000
24.910
2.422
Support ($ in Millions) Product Development ($ in Millions)
Contract Contract Method Performing Performing Method Cost Category Item & Type Activity & Location Cost Category Item Activity & Location & Type Software Development Various Various : Various Sikorsky : Stratford, PE 0604212N: Other Helicopter Systems Engineering SS/CPFF Development NAWC AD : Patuxent GFE Various CT Navy River, MD Sikorsky : Stratford, Primary HW Development SS/CPFF Subtotal CT
Figure 5
Software Development Test and Evaluation
Date: February 2018 R-1 Program Element (Number/Name) PE 0604212N / Other Helicopter Development
NAWC AD : Patuxent River, MD
Project Cost Analysis: PB 2019 Navy
Prior Year Prod Dev no Appropriation/Budget longer funded in the FYDP
UNCLASSIFIED
Rockwell Collins : ($ SS/FFP in Millions) Cedar Rapids, IA
UNCLASSIFIED
0.000 0.000 R-1 Program Element (Number/Name) PE 0604212N / Other Helicopter 7.713 7.177 Development
FY 2017 FY 2017 Prior Prior Years Years 3.885
FY 2018 FY 2018
Award Award Cost Date Cost Date 0.786 Dec 2017
Award Award Cost Date Cost Date 4.876 Mar 2018
8.675 3.581
UNCLASSIFIED 0.000 0.000 0.319 Nov 2016 0.137 Nov 2017
0.899 7.466
0.000 1.105
2.425
0.000 FY 2017
NAWCAD : Patuxent Contract WR MD Method River, Performing & Type Various Activity: & Location Various Various
FY 2019 FY 2019 Base Base
- -
Date: February 2018
FY 2019 FY 2019 OCO OCO
Award Award Cost Date Cost Date 3.277 Mar 2019
Cost Cost
-
FY 2019 FY 2019 Total Total
Target Target Cost To Total Value of Cost To Total Value of Cost Complete Cost Contract Cost Complete Cost Contract 3.277 Continuing Continuing Continuing
Award Award Date Date
0.000 0.280 Nov 2018
-
0.000 0.000 8.675 8.675 0.280 Continuing Continuing Continuing
0.000 5.013
0.000 3.557
-
0.000 Continuing 0.000 Continuing 0.899 3.557
0.000 FY 2018
FY 2019 0.000 Base
R-1 Line - #104
Page 16 of 24
FY - 2019 OCO
FY 2019 0.000 Total
0.000
0.899 N/A
2.425
2.425
Target Systems Engineering 1.987 (3406/Attack 0.000 0.000 0.000 0.000 1.987 namely - However, on the other hand, the third project and0.000 Utility Replacement Aircraft) - is featuring a new start POR, Prior Award Award Award Award Cost To Total Value of Cost Category Item Years Cost Date Cost Date Cost Date Cost Date Cost Complete Cost Contract Systems Engineering 0.607 0.000 0.000 0.000 - 0.000 0.000 0.607 - Future Vertical Lift (FVL) (Figure 6:A). FVL is a Joint POR led by the US Army, aimed to develop the next generation vertical takeoff Developmental Prior Year Prod Test Dev & no Various Various : Various 7.980 0.407 Mar 2017 1.674 Mar 2018 3.065 Mar 2019 - 3.065 Continuing Continuing Continuing Various Various : Various 5.321 0.000 0.000 0.000 - 0.000 0.000 5.321 - aircraft forinthe Army and the US Marine Corps (Figure 6:B). Initially planning its AoA in 3Q17 (Figure 6:C), the program was not funded Evaluation longer funded the FYDP Subtotal 7.980 0.407 1.674 3.065 - 3.065 Continuing Continuing Subtotal 19.914 0.000 0.000 0.000 - 0.000 0.000 19.914 N/A in 2017 and is now looking to do the AoA and concomitant Technology Readiness Assessments (TRAs) of candidate technologiesN/A in the FY18-20 timeframe and likely reaching a Milestone A decision by 1Q21. Following an RFP will be issued FY 2019 the Milestone FY 2019 A decision, FY 2019 Test and Evaluation ($ in Millions) FY 2017 FY 2018 Base for candidate technologies, with TRAs likely ongoing and until Milestone B decision some timeOCO in FY23 orTotal later (Figures 7 andTarget 8). Contract Method Development Performing Prior PE 0604212N: Other Helicopter Cost Category Item & Type Activity & Location Years Navy Exhibit R-2A, RDT&E Project Justification: PB 2019 Navy Development Test &
NAWCAD : Patuxent
WR
Evaluation-WBLoS Appropriation/Budget Activity River, MD 1319 / 5
Management Services ($ in Millions) Prior COST ($ in Millions) Years Contract
3406: Attack and Utility Cost Category Item Replacement Aircraft
Method & Type
Government Engineering WR Quantity Support of RDT&E Articles Program Management WR A. Mission Description and Support
Subtotal
UNCLASSIFIED Award Award UNCLASSIFIED Date Cost Date
1.875
0.227 Nov 2016
1.875
0.227
FY 2017
9.493 -
NAWCAD : Patuxent 2.208 Budget Item Justification River, MD
Page 8 of 24
FY FY 2017
FY 2018
Performing Prior 0.000 0.000 Activity & Location Years
NAWCAD : Patuxent River, MD
Cost
7.977
Cost
Cost
0.299 Nov 2017
Award Date
0.304 Nov 2018
R-1 Program Element (Number/Name) PE0.299 0604212N / Other0.304 Helicopter Development
2019 Base
FY FY 2019 2018 FY 2019 OCO Total
Award 13.849 Date
Cost
FY 2019 Base
FY 2020
- Award 13.849 Date
Cost
Award Date
Cost
Cost
R-1 Line #104
Award 17.898 Date
0.000 - Nov 2016-
0.000 Nov - 2017
- 0.000 Nov 2018 -
1.026 Nov 2016
0.960 Nov 2017
0.958 Nov 2018
-
-
0.304
FY 2022 Date
- - -
0.000
2.705
FY 2019 Total
43.693 Award 133.391
Cost
Total Cost
Value of Contract
Project (Number/Name) 3406 / Attack0.304 and Utility Replacement 0.000 2.705 Aircraft
FY 2019 OCO
FY 2021
Cost To Complete
Date: February 2018
-
Cost To FY 2023 Complete
- N/A
Total Cost Target
Cost To Total Continuing Value of 145.663 Continuing
Cost
Complete
Cost
Contract
0.000
- 0.000
9.493
-
0.958
0.000 6:A
5.152
-
Future Vertical Lift (FVL) is a Joint Department initiative to address vertical lift capability requirements and determine feasible and affordable solutions in support of the Joint Warfighter. The FVL Capability Set 3 (CS3) program, led by the Department of the Army, will develop and field a replacement for US Army and USMC aircraft with a more capable, maintainable, and reliable rotorcraft to meet the needs of the services. FVL will provide unmatched strategic, operational, and tactical agility to perform a multitude of missions currently unachievable rotorcraft. FVL will be a force multiplier with superior performance, payload, survivability, UNCLASSIFIED PE 0604212N: Other Helicopter Development by any conventionally configured agility, endurance, and reliability that enables warfighters to win in a complex world. FVL revolutionary operational over current Vertical Take Off Navy Page 14 of offers 24 R-1 Lineopportunities #104 Landing (VTOL) aircraft and will field by 2031. The Marine Corps FVL requirements emphasize range and speed similar to the MV-22. FVL will increase the Marine Air Ground Task Force's (MAGTF) capacity of long-range fires. FVL will utilize DOTmLPF-P that will include all facets of a program with particular focus on life-cycle cost reductions through common processes, support equipment, logistic support and component commonality utilizing non-materiel solutions, such as maintenance strategies, training solutions, and infrastructure requirements. The air vehicle will include primary mechanical, electrical, pneumatic, and structural components such as drivetrain, generators, landing gear, pumps, MINI-MAG controls, seats, etc. The mission subsystems will include all on- and off-board components with embedded control software for those components that provide all mission functionality, cockpit displays, cockpit hardware subsystem controllers, and interfaces. The architecture will include the fundamental organization of the complete system,
5
COST ($ in Millions)
Years
3406: Attack and Utility Replacement Aircraft
0.000
Quantity of RDT&E Articles
FY 2017
FY 2018
Base
OCO
Total
FY 2020
FY 2021
FY 2022
FY 2023 Complete
0.000
7.977
13.849
-
13.849
17.898
43.693
133.391
-
-
-
-
-
-
-
-
Cost
145.663 Continuing Continuing
-
A. Mission Description and Budget Item Justification Future Vertical Lift (FVL) is a Joint Department initiative to address vertical lift capability requirements and determine feasible and affordable solutions in support of the Joint Warfighter. The FVL Capability Set 3 (CS3) program, led by the Department of the Army, will develop and field a replacement for US Army and USMC aircraft with a more capable, maintainable, and reliable rotorcraft to meet the needs of the services. FVL will provide unmatched strategic, operational, and tactical agility to perform a multitude of missions currently unachievable by any conventionally configured rotorcraft. FVL will be a force multiplier with superior performance, payload, survivability, agility, endurance, and reliability that enables warfighters to win in a complex world. FVL offers revolutionary operational opportunities over current Vertical Take Off Landing (VTOL) aircraft and will field by 2031. The Marine Corps FVL requirements emphasize range and speed similar to the MV-22. FVL will increase the Marine Air Ground Task Force's (MAGTF) capacity of long-range fires. FVL will utilize DOTmLPF-P that will include all facets of a program with particular focus on life-cycle cost reductions through common processes, support equipment, logistic support and component commonality utilizing non-materiel solutions, such as maintenance strategies, training solutions, and infrastructure requirements. The air vehicle will include primary mechanical, electrical, pneumatic, and structural components such as drivetrain, generators, landing gear, pumps, controls, seats, etc. The mission subsystems will include all on- and off-board components with embedded control software for those components that provide all mission functionality, cockpit displays, cockpit hardware subsystem controllers, and interfaces. The architecture will include the fundamental organization of the complete system, the processing method/component(s), the system level software, the operating environment, and the on-aircraft infrastructure to facilitate integration of all subsystems and platform. FVL is a new start in FY2018.
6:B
B. Accomplishments/Planned Programs ($ in Millions, Article Quantities in Each)
FY 2017 FY 2018 0.000 7.977 Articles: - -
Title: Future Vertical Lift
FY 2019 FY 2019 FY 2019 Base OCO Total 13.849 0.000 13.849 - - -
FY 2018 Plans: Provide initial support for Future Vertical Lift (FVL) Analysis of Alternatives (AoA) to assess the technical feasibility, technical risk, and affordability of potential strategic solutions with the intent to develop the next generation of rotary wing aircraft supporting new Vertical Take Off Landing capabilities common with the US Army. Tasks to be performed include but are not limited to: AoA support, Acquisition Program Management PE 0604212N: Other Helicopter Development Figure 6 Navy
UNCLASSIFIED Page 18 of 24
6:C R-1 Line #104
UNCLASSIFIED
Date: February 2018
Exhibit R-4, RDT&E Schedule Profile: PB 2019 Navy Appropriation/Budget Activity 1319 / 5
R-1 Program Element (Number/Name) PE 0604212N / Other Helicopter Development
Project (Number/Name) 3406 / Attack and Utility Replacement Aircraft
Figure 7 UNCLASSIFIED Date: February 2018
Exhibit R-4A, RDT&E Schedule Details: PB 2019 Navy Appropriation/Budget Activity 1319 / 5
R-1 Program Element (Number/Name) PE 0604212N / Other Helicopter Development
Project (Number/Name) 3406 / Attack and Utility Replacement Aircraft
Schedule Details PE 0604212N: Other Helicopter Development Navy Events by Sub Project
UNCLASSIFIED Page 23 of 24
Quarter
Start R-1 Line Year#104
End Quarter
Year
Proj 3406 MSA Phase: Capability Refinement
2
2018
4
2020
RFP: Milestone A
1
2021
1
2021
RFP: Request for Proposal
1
2021
3
2021
Technology Maturation & Risk Reduction (TM&RR) Phase: TM&RR
1
2021
4
2022
Figure 8 6
MINI-MAG
A review of funded activities (R-3) shows that no contractors have been selected yet on this project (Figure 9). Thus, SBCs and others would be encouraged to offer their technologies to the FVL for AoA consideration. Without a question, offering new technologies or inserting additional technologies that may address capability gaps that are being identified within the FVL is much more likely and should be easier than attempting the same insertion with more mature activities. UNCLASSIFIED
Date: February 2018
Exhibit R-3, RDT&E Project Cost Analysis: PB 2019 Navy Appropriation/Budget Activity 1319 / 5
R-1 Program Element (Number/Name) PE 0604212N / Other Helicopter Development
Product Development ($ in Millions) Cost Category Item
Contract Method & Type
Primary Hardware Development
C/CPFF
FY 2017
Performing Activity & Location TBD : TBD Subtotal
Prior Years
Cost
FY 2018
Award Date
Cost
Award Date
FY 2019 Base
Cost
Project (Number/Name) 3406 / Attack and Utility Replacement Aircraft FY 2019 OCO
Award Date
Award Date
Cost
0.000
0.000
0.000
0.000
-
0.000
0.000
0.000
0.000
-
Figure Support9 ($ in Millions)
FY 2017
Contract Method & Type
Performing Activity & Location
Prior Years
Method & Type
Performing Activity & Location
Prior Years
FY 2018
FY 2019 Base
FY 2019 Total
Cost
Cost To Complete
Target Value of Contract
Total Cost
0.000 Continuing Continuing Continuing 0.000 Continuing Continuing
FY 2019 OCO
N/A
FY 2019 Total Target
Award Award Cost To Total Value of While brief exposure to POR and isAward by no means a definitive information, Cost this Category Item discussion provides introductoryCost Cost transition Date Cost Date Cost Date Cost source Complete ofCost Contract Development Support WR technology TBD : TBD 0.000situation 0.000 may well exhibit 4.850 Mar 2018 Jan 2019 SBCs - with SBIR/STTR, 3.740 Continuing Continuing Continuing keep in mind that every transition unique3.740 properties. and other seed S&T Subtotal 0.000 4.850 3.740 3.740 Continuing Continuing N/A contracts that wish to transition technology in this0.000 manner should devote substantial resources- to technology maturation (including FY 2019 the same) FY 2019 FY 2019 informal technology assessments and documentation and testing towards and establish corporate processes Test and Evaluation ($ inreadiness Millions) FY 2017 FY 2018 Base OCO Total and other steps that serve to reduce technology insertion risk for prospective candidate PORs. Contract Target Cost Category Item Development Test and Evaluation Studies and Anaylsis
Cost
Award Date
Cost
Award Date
Cost
Award Date
Award Date
Cost
Cost
Cost To Complete
Total Cost
Value of Contract
WR
TBD : TBD
0.000
0.000
0.575 Mar 2018
0.587 Nov 2018
-
0.587 Continuing Continuing Continuing
C/CPFF
TBD : TBD
0.000
0.000
0.175 Mar 2018
6.929 Jan 2019
-
6.929 Continuing Continuing Continuing
0.000
0.000
0.750
7.516
-
7.516 Continuing Continuing
Subtotal
Management Services ($ in Millions) Cost Category Item
Award Date
Contract Method & Type
Performing Activity & Location
FY 2017 Prior Years
Cost
FY 2018
Award Date
Cost
Award Date
FY 2019 Base
Cost
FY 2019 OCO
Award Date
Award Date
Cost
N/A
FY 2019 Total
Cost
Cost To Complete
Total Cost
Target Value of Contract
Contractor Engineering Support
C/CPIF
Various : Various
0.000
0.000
0.100 Mar 2018
0.000 Nov 2018
-
0.000 Continuing Continuing Continuing
Program Management Support
TBD
Various : Various
0.000
0.000
2.072 Mar 2018
2.113 Nov 2018
-
2.113 Continuing Continuing Continuing
WR
NAVAIR : Patuxent River, MD
0.000
0.000
0.205 Mar 2018
0.480 Oct 2018
-
0.480 Continuing Continuing Continuing
Travel
PE 0604212N: Other Helicopter Development Navy
UNCLASSIFIED Page 21 of 24
R-1 Line #104
MINI-MAG
7
F IN DI NG MARK ET I NF ORM AT IO N
| Market Snapshot |
Building
Energy
Efficiency The concepts of green building and building energy efficiency seem to be everywhere, but what do they really mean, and how do they impact both our lives and the economy? BY ELIZA GOUGH 8
MINI-MAG
T
he concepts of green building and building energy efficiency seem to be everywhere, but what do they really mean, and how do they impact both our lives and the economy? The Department of Energy’s Building Technologies Office’s (BTO’s) MultiYear Program Plan (MYPP) for Fiscal Years 2016-2020 is a helpful resource to learn about energy use in the buildings sector, new opportunities for cost-effective energy savings, the barriers to their achievement, and BTO’s strategies and goals for achieving significant reductions in building energy use intensity. According to the BTO, “We spend more than $400 billion each year to power our homes and commercial buildings, consuming approximately 74% of all electricity used in the United States, about 40% of our nation's total energy bill. And much of this energy and money is wasted—over 30% on average. If we cut the energy use of U.S. buildings by 20%, we could save approximately $80 billion annually on energy bills and help create jobs.” Given these figures, what are the potential market opportunities for technical solutions in this space? BCC Research reports that the global market for renewable energy and energy-efficient technologies in building applications reached $294.0 billion in 2015 and reach $492.0 billion in 2021, increasing at a compound annual growth rate (CAGR) of 9.1% from 2016 to 2021. BCC Research also provides coverage on the commercial buildings segment for energy–efficient technologies, a market which should reach $60.2 billion in 2019, growing at a CAGR of 8% from 2014 to 2019.
“
If we cut the energy use of U.S. buildings by 20%, we could save approximately $80 billion annually on energy bills and help create jobs.
”
MarketsandMarkets reports that the global smart building market is projected to grow from an estimated $7.42 billion in 2017 to $31.74 billion by 2022, at a CAGR of 33.7% during the period 2017–2022. Some of the major solution and service vendors include the ABB Group (Switzerland), Siemens AG (Germany), Schneider Electric (France), Cisco Systems, Inc. (US), International Business Machines Corporation (US), Delta Controls (Canada), Johnson Controls (US), Honeywell International Inc. (US), United Technologies Corporation (US), Legrand (France), BuildingIQ (US), Echelon Corporation (US), Hitachi, Ltd. (Japan), and Panasonic Corporation (Japan), and others. The US EPA provides information for both residential and commercial green building on its website and the US Green Building Council also provides extensive coverage on Leadership in Energy and Environmental Design (LEED), which is the most widely used green building rating system in the world LEED v4 is the newest version of LEED. To learn more in person, try out some of these upcoming events or webinars.
Energy Efficiency Technologies for commercial use include:
01 Efficient heating and cooling Tankless water heaters »» Heat pump water heaters »» Commercial evaporative coolers »» Water source and ground source heat pumps
02 Efficient lighting »» Light emitting diodes (LEDs)
03 Weather barriers and efficient insulation »» Weather barriers »» Efficient insulation
04 Advanced windows and window coverings »» Low emissivity windows »» Window films »» Window attachments
05 Efficient roof coverings »» Elastomeric roof coverings »» Green roofs »» Cool roofs
06 Efficient electric transformers »» Efficient transformers for commercial buildings
MINI-MAG
9
W E B SI TE
Getting Ready to Use
Social Media
Social media has become commonplace in our personal and professional lives, but figuring out how to make it work for your small business can feel daunting. However, just like with other aspects of your business, developing a clear plan upfront is a worthwhile investment. BY Eliza Gough
To help guide this plan, lay out a list of objectives for your social media marketing efforts, for example, »» What is the goal of your social media marketing effort? »» Who is your target audience? »» How does this audience use social media? What specific platforms and other methods do they use to learn about your content area? »» What type of message are you trying to convey through your social media marketing? After defining your basic goals and audience, you can begin to think about content. This includes both what and how often you will be posting, as well as where you will be posting it. In terms of developing high quality content, take some time to do some research and look at what your competitors and peers are doing to see if it looks helpful or not. Regardless of what industry you are working in, the following tips are helpful ways to frame your content, »» Make your content all about your customers, their needs and applications »» Your social media content needs to provide value to your readers with information that they can use for their own company »» Humanize your brand 10
MINI-MAG
What exactly do those points mean? It means that while increased sales are likely a driving force behind your social media plan, your content shouldn’t be filled with sales pitches. Research indicates that users prefer content that helps them. For example, Trew Marketing reports that 60% of engineers spend up to 1.6 hours per week reading content for work, and may spend up to 3.6 hours per week reading content for educational purposes. Given that customer and reader time is precious, your content must provide a clear benefit and value. Also, taking the time to personalize the content indicates your interest in investing time and attention in users and customers, and helps develop your specific brand identity. If you’re an expert in your field, let people see it through informed and helpful posts. Once you’ve figured out what type of content you will be creating, it’s time to make a calendar. By planning out who is responsible for the different aspects of your social media marketing plan you can avoid redundancy or lapses in content, and focus on major goals and events. For example, if you have a big event coming up in a few months, don’t forget to start the buzz ahead of time. Creating a calendar can also help match up your goals with a realistic investment of time. While a regular posting schedule is important, it doesn’t all have to happen immediately, it’s okay to start small and build out your presence, little by little.
M ANUFAC T URIN G
BY BOB LARSEN
Oversight of Quality Issues Will Impact the Bottom Line
THE BUSINESS MODEL of choice for some small businesses is to become a manufacturer. Once a company decides to become a manufacturer, the team must understand the level of commitment that is required to assure that the company becomes a quality supplier. As a new manufacturer, the firm needs to plan for and implement quality control measures for every step of the manufacturing process. The firm which invests the time and processes that enhance the detection and prevention of poor quality products will find its investment offset by the reduction in product failures. MINI-MAG
11
Defining Quality To begin to understand the cost of poor quality (COPQ), it must first be defined and then taken very seriously. In a typical situation, the cost of quality can be identified as one of four components:
1 External Failure Cost The defects found after the customer receives the product or service. This cost drives processing customer complaints, customer returns, warranty claims, product recalls and potential lawsuits.
2 Internal Failure Cost The defects found before the customer receives the product or service. This cost drives scrap, rework, re-inspection, re-testing, material review, potentially additional material and the cost of material procurement.
3 Inspection Cost This is the cost to determine the degree of conformance to quality requirements, measuring, evaluating and or auditing. This drives the cost of inspection, testing, process or service audits, calibration of measuring and test equipment.
4 Prevention Cost This is the cost to prevent poor quality. This cost drives new product review, quality planning, supplier surveys, process reviews, quality improvement teams, education and training. Poor quality cost can be measured in a number of terms including, scrap, rework, returns, customer complaints, compromised service levels, customer losses, recalls and lawsuits. The costs associated with poor quality can range from 15 to 40 percent (20 percent being the average) of total business cost, so no matter the definition, the cost of poor quality can make or break a company. Reducing or completely eliminating quality costs starts with designing in quality at the very beginning. 12
MINI-MAG
Building a Quality Foundation
So what are the elementary steps a new manufacturer must take when beginning the process of manufacturing a product? First, it must be designed to meet and exceed performance requirements. A high quality design must consider material selection based on specifications and reliability, as well as the tolerances to ensure manufacturing repeatability (the ability to reliably manufacture a product in quantity). As the design develops, prototypes are tested and evaluated for performance, with changes being considered to achieve the necessary requirements. When the design is completed and thoroughly tested, it is ready to transition into production, but before that can happen, production operations, tooling and inspection points must be decided and documented in order to optimize product performance and meet design specifications. With the process mapped ahead of time, it is much more likely that products that do not meet the specifications will be caught before they reach the customer’s hands. The earlier a quality problem is detected and remedied, the less it will cost.
Realistic COPQ
Independent studies reveal that COPQ is costing companies millions of dollars each year and its reduction can transform marginally successful companies into profitable ones. While most executives believe that their company’s COPQ is less than 5 percent, businesses need to recognize that quality is an absolute necessity to survive and succeed in business. To see what the actual implications of COPQ are, picture this -- a manufacturing company with annual sales of $250 million calculated the total cost of repair, rework, scrap, service calls, warranty claims and write-offs from obsolete finished goods. Their COPQ was 20 percent of their annual sales, which implied that one day of each five-day workweek, the entire company essentially made scrap, representing a loss of nearly $100,000 per day. Corrective Actions To systematically reduce COPQ, businesses need to institute corrective and preventative actions (CAPA) to remedy problems as soon as they are detected. The root cause needs to be investigated and CAPA items created for approval and implementation. Actions may include, among other things, amendments to procedures, a recalibration in manufacturing equipment, examination of supplier specifications, or training an employee to improve skill sets. There are several “lean manufacturing” techniques/systems that can be employed by manufacturers to assist with reducing waste and improving quality. Value stream mapping, which was discussed in an earlier issue of this publication, is one of the tools that can be utilized in lean manufacturing. Six Sigma is another highly regarded system for manufacturers to consider – companies that implement six sigma have been reported to have reduced their COPQ to as low as 1 percent of sales. Whichever system is utilized, information needs to flow out of the CAPA process quickly and accurately without missteps. This will save the company money down the line.
DIV ERS ITY
Many people with disabilities, particularly those in rural areas where jobs are often scarce, have already created opportunities for themselves through entrepreneurship. In fact, according to the U.S. Census Bureau, people with disabilities are nearly twice as likely to be self-employed as the general population, 14.7 percent compared to 8 percent.
According to the U.S. Department of Labor: Nearly half of all persons with a disability were age 65 and over, about three times larger than the share of those with no disability. In 2016
17.9%
of persons with a disability were employed Service occupations
21.3%
With Disability
17.6%
With No Disability
Work in production, transportation, and material moving occupations
14.6%
With Diasbility
11.6%
With No Disability
The Office of Disability Employment Policy (ODEP) has put together a handy guide on self-employment & entrepreneurship, which outlines many available resources.
MINI-MAG
13
SU C C E SS STORY
| Where are They Now? |
Sentient BY JULIE S. KRULL
In
the early 2000s, the Department of Defense sought a way to predict the remaining useful life of critical parts on aircraft. They thought that if a prognostics and health management (PHM) technology could be developed, it would
drastically reduce maintenance costs for military aircraft while simultaneously improving safety. Sentient Science, a small business based in Buffalo, NY, came to the table with a solution, and has been an active innovator in the Small Business Innovation Research (SBIR) program ever since.
14
MINI-MAG
Sentient’s flagship product, developed with the help of the SBIR program, is its DigitalClone software. DigitalClone predicts the short and long-term failure rates of mechanical systems like wind turbines, rotorcraft & rail to identify life extension actions that reduce costs. During its journey through the program, Sentient realized the vast applicability of such a technology. There was no need to limit the solution to military applications, when nearly every industry imaginable has moving parts and mechanisms that could benefit from such a proactive technology. The company soon began applying its PHM technology to customers in the wind industry and partnered with the Department of Energy (DOE) in the process. DigitalClone Live Software as a service is an evolution of their flagship product, and it applies materials science and physics-based monitoring to simulate when cracks initiate in the microstructure of critical components and major systems of rotating mechanical equipment. Sentient’s mission is to lower their customers’ costs to operate equipment by 13% of revenues through the digitalization of assets, providing an ecosystem of operators and suppliers to achieve life extension, sustainability and reliability. “When we deployed live in the commercial wind industry, we discovered a high percentage of difference between physical test results and the failures seen in the field,” says Jill Szpylman, Director of Investor Relations & Public Relations at Sentient. “To account for the discrepancies, we needed our customer’s field data to accurately predict the short and long-term failure rates of the turbines deployed in the fleet. Today, our customers use the platform to buy replacements based on life and to take actions for life extension and based on the optimal return on investment.” DigitalClone Live leverages data already being collected by health monitoring systems, such as HUMs, and combines it
with Sentient’s advanced “lifing” models “We found the government’s support to assess the health and life expectancy of to be invaluable,” says Szpylman. “Bekey components within a machine. Using tween SBIR and the Transition Assistance the software, operators can assess which Program (TAP), we were able to take our life extension solutions, recommended technology and correlate our results within DigitalClone Live, would best fit against physical testing. It showed us we within their operations and maintenance were commercially ready to deploy. We budgets and strategies. By providing went to wind energy first, developed the more time and visibility into asset health, platform, and we are now ready to enasset managers can lower their cost of grain ourselves in the commercial aeroO&M and reduce safety stock stored in space market.” inventory. This ultimately lowers their cost of energy produced. In fact, Sentient has stated that they want to help lower the cost of energy by 13% of revenue through the digitalization of fielded assets, providing an ecosystem of equipment owners/ operators and equipment manufacturers to achieve life extension, sustainability and reliability.
“
Sentient has worked with Sikorsky on issues involving Blackhawk helicopters, as well as Boeing on projects involving fatigue crack initiation prediction tools for rotorcraft gears. In the energy field, Sentient’s largest customers are Acciona Energy and Duke Energy, and the company is receiving demand for its technology all over the world. Today, Sentient is in the process of digitalizing 35% of the world’s wind turbine models. It’s current customer base includes 40,000 wind turbines, but with the digital models available in DigitalClone, has the ability to monitor 135,000 wind turbines for life extension immediately. The team continues to tackle government problems by providing innovative solutions, such as its recent contract with the Navy to develop a reliability-centered design framework for additive manufacturing that could very well set the standard to qualify parts for the aerospace and defense industries. Looking back on its work within the SBIR program, Sentient is grateful for the opportunity to get its technology in front of the right people.
Between SBIR and the Transition Assistance Program (TAP), we were able to take our technology and correlate our results against physical testing. It showed us we were commercially ready to deploy. We went to wind energy first, developed the platform, and we are now ready to engrain ourselves in the commercial aerospace market.
”
Sentient Science
672 Delaware Avenue Buffalo, NY 14209 sentientscience.com MINI-MAG
15