Quarter Three
Market Report SAVANNAH AREA
20 26
Curators of the unique featured homes
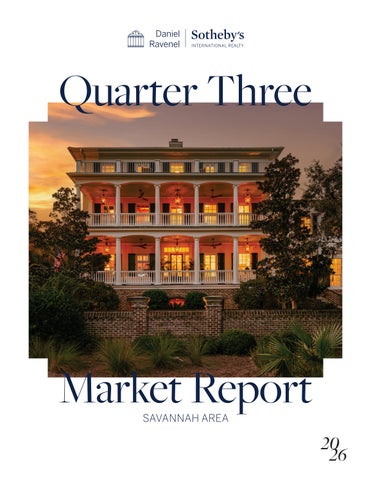
Cover Home 733 MCALLISTER LANDING | FORD FIELD & RIVER CLUB OFFERED AT $3,900,000
21 WYLLY ISLAND DRIVE | WYLLY ISLAND OFFERED AT $2,300,000
9657 WHITEFIELD AVENUE | MONTGOMERY OFFERED AT $1,825,000
Historic District Starland Whitemarsh Island
Midtown
Wilmington Island
Tybee Island
Isle of Hope
Skidaway Island
Savannah, Georgia
01
SAVANNAH Area
Historic District Residential Sales | Greater Savannah Area METRIC
2026 Q3
2025 Q3
CHANGE YOY
NUMBER OF SALES
25
26
-3.80%
AVG DAYS ON MARKET
143
96
49.00%
AVG SOLD PRICE/SQ FT
$515.99
$620.11
-16.80%
AVG SALES PRICE
$1,138,005
$1,332,779
-14.60%
LIST TO SALES PRICE RATIO
95.94%
95.65%
0.28%
METRIC
2026 Q3
2025 Q3
CHANGE YOY
NUMBER OF SALES
13
11
18.20%
AVG DAYS ON MARKET
98
54
81.50%
AVG SOLD PRICE/SQ FT
$271.59
$343.85
-21.00%
AVG SALES PRICE
$517,143
$709,727
-27.10%
LIST TO SALES PRICE RATIO
96.52%
96.98%
-0.46%
Starland Residential Sales | Greater Savannah Area
Ardsley Park Residential Sales | Greater Savannah Area METRIC
2026 Q3
2025 Q3
CHANGE YOY
NUMBER OF SALES
16
11
45.50%
AVG DAYS ON MARKET
71
116
-38.80%
AVG SOLD PRICE/SQ FT
$346.30
$332.66
4.10%
AVG SALES PRICE
$1,194,484
$1,099,309
8.70%
LIST TO SALES PRICE RATIO
94.68%
95.67%
-0.99%
METRIC
2026 Q3
2025 Q3
CHANGE YOY
NUMBER OF SALES
27
16
68.80%
AVG DAYS ON MARKET
74
41
80.50%
AVG SOLD PRICE/SQ FT
$284.96
$316.13
-9.90%
AVG SALES PRICE
$500,307
$488,125
2.50%
LIST TO SALES PRICE RATIO
98.01%
99.42%
-1.41%
Midtown Residential Sales | Greater Savannah Area
The Landings/Modena/South Harbor Residential Sales | Greater Savannah Area METRIC
2026 Q3
2025 Q3
CHANGE YOY
NUMBER OF SALES
65
67
-3.00%
AVG DAYS ON MARKET
92
67
37.30%
AVG SOLD PRICE/SQ FT
$304.15
$312.88
-2.80%
AVG SALES PRICE
$974,028
$1,004,796
-3.10%
LIST TO SALES PRICE RATIO
95.72%
96.86%
-1.14%
Isle of Hope/Dutch Island Residential Sales | Greater Savannah Area METRIC
2026 Q3
2025 Q3
CHANGE YOY
NUMBER OF SALES
16
17
-5.90%
AVG DAYS ON MARKET
66
44
50.00%
AVG SOLD PRICE/SQ FT
$371.38
$259.30
43.20%
AVG SALES PRICE
$936,219
$623,700
50.10%
LIST TO SALES PRICE RATIO
97.63%
97.44%
0.19%
Tybee Island Residential Sales | Greater Savannah Area METRIC
2026 Q3
2025 Q3
CHANGE YOY
NUMBER OF SALES
33
33
0.00%
AVG DAYS ON MARKET
115
112
2.70%
AVG SOLD PRICE/SQ FT
$451.30
$469.50
-3.90%
AVG SALES PRICE
$868,123
$625,791
38.70%
LIST TO SALES PRICE RATIO
97.65%
94.96%
2.69%
Wilmington/Whitemarsh Islands Residential Sales | Greater Savannah Area METRIC
2026 Q3
2025 Q3
CHANGE YOY
NUMBER OF SALES
82
102
-19.60%
AVG DAYS ON MARKET
57
70
-18.60%
AVG SOLD PRICE/SQ FT
$257.79
$279.03
-7.60%
AVG SALES PRICE
$512,098
$609,307
-16.00%
LIST TO SALES PRICE RATIO
96.44%
95.07%
1.36%
Southbridge Residential Sales | Greater Savannah Area METRIC
2026 Q3
2025 Q3
CHANGE YOY
NUMBER OF SALES
24
16
50.00%
AVG DAYS ON MARKET
47
73
-35.60%
AVG SOLD PRICE/SQ FT
$217.28
$212.87
2.10%
AVG SALES PRICE
$640,996
$627,431
2.20%
LIST TO SALES PRICE RATIO
97.37%
97.94%
-0.58%
METRIC
2026 Q3
2025 Q3
CHANGE YOY
NUMBER OF SALES
121
180
-32.80%
AVG DAYS ON MARKET
101
67
50.70%
AVG SOLD PRICE/SQ FT
$183.35
$183.06
0.20%
AVG SALES PRICE
$416,995
$389,415
7.10%
LIST TO SALES PRICE RATIO
98.46%
98.56%
-0.10%
Pooler Residential Sales | Greater Savannah Area
Richmond Hill Residential Sales | Greater Savannah Area METRIC
2026 Q3
2025 Q3
CHANGE YOY
NUMBER OF SALES
116
111
4.50%
AVG DAYS ON MARKET
47
77
-39.00%
AVG SOLD PRICE/SQ FT
$226.46
$206.36
9.70%
AVG SALES PRICE
$520,429
$419,284
24.10%
LIST TO SALES PRICE RATIO
97.85%
100.15%
-2.30%
METRIC
2026 Q3
2025 Q3
CHANGE YOY
NUMBER OF SALES
5
3
66.70%
AVG DAYS ON MARKET
75
35
114.30%
AVG SOLD PRICE/SQ FT
$667.73
$690.26
-3.30%
AVG SALES PRICE
$2,753,000
$2,116,667
30.10%
LIST TO SALES PRICE RATIO
93.11%
107.63%
-14.52%
Ford Plantation Residential Sales | Greater Savannah Area
One of
a kind
300 Bull Street, Suite 101, Savannah, GA, 31401 DANIELRAVENELSIR.COM Each Office is Independently Owned and Operated. Statistics are compiled quarterly based on figures and data generated by the Multiple Listing Service. Due to possible reporting inconsistencies, Days on Market (DOM), average prices and rates of appreciation should be used to analyze trends only. Property and statistical data derived from this information is solely for your personal, non-commercial use in buying or selling a property and is deemed reliable but not guaranteed and should be verified. All representations and warranties regarding the information are disclaimed. Reproduction or any other use is prohibited. Sotheby’s International Realty® and the Sotheby’s International Realty Logo are service marks licensed to Sotheby’s International Realty Affiliates LLC and used with permission. We fully supports the principles of the Fair Housing Act and the Equal Opportunity Act. Each franchise is independently owned and operated.