
May 2026
May 2026
Prepared by
Meng Tian, PhD
Philip Huang, MD, MPH
Dallas County Health and Human Services
A large body of economic literature finds that routine childhood immunization is among the most cost-effective public health interventions. Studies have shown that vaccination programs generate substantial savings by avoiding medical treatment costs, outbreak response expenditures, and productivity losses (Zhou et al., 2014). When vaccination coverage declines, the economic cost per measles case rises sharply, quickly exceeding the cost of routine vaccine delivery and outreach (Yemeke et al., 2021).
This appendix describes the method used to estimate the annual cost of maintaining measles herd immunity in Dallas County. The analysis focuses on the total resource cost required to deliver routine MMR vaccination under current guidelines.
We assume the annual county-wide cost (������������������������ ) is given by:
Where �������� represents the size of the relevant age cohort eligible for vaccination (1-year-olds and 4-year-olds), and �������� represents the total cost per administered dose.
Under the routine two-dose childhood schedule, children receive MMR at approximately 12–15 months and again at 4–6 years of age. Texas Health and Human Services reports approximately 37,000 live births annually in Dallas County. In a steady-state population, this implies that roughly 37,000 children become eligible for the first dose each year, and a comparable cohort becomes eligible for the second dose.
This baseline yields an estimated 74,000 doses annually (two doses multiplied by one birth cohort). The estimate is adjusted upward by approximately 5–10 percent to reflect net inmigration of young families, catch-up vaccination, and replacement doses administered due to incomplete records or early doses that do not satisfy school-entry requirements. Incorporating
these factors yields a rounded planning estimate of approximately 80,000 MMR doses administered annually under routine conditions.
The CDC vaccine price for MMR is approximately $26.30 per dose
This cost represents the primary measles-specific input. Multiplying by the projected annual dose volume:
80,000 × $26 30 ≈ $2 1 million
Thus, approximately $2.1 million annually reflects the direct acquisition cost of measles vaccine antigen.
This component represents the true disease-specific incremental cost of maintaining immunity.
In addition to vaccine acquisition, providers typically receive an administration fee of approximately $25.00 per dose. This fee supports:
• Clinical staffing
• Facility operations
• Appointment scheduling systems
• Cold-chain management
• Electronic record documentation
• Billing and compliance functions
Multiplying this administration fee by the projected 80,000 doses yields:
80,000 × $25.00 ≈ $2.0 million
Importantly, these inputs are not exclusive to MMR. They support a shared pediatric delivery platform used for multiple vaccines and routine well-child services. Even in the absence of measles risk, most of this infrastructure would remain necessary. Attributing the full $25 administration cost to MMR therefore overstates the strictly measlesspecific burden. However, for purposes of the ROI calculation, the full administration fee is included alongside vaccine acquisition cost. This approach is methodologically conservative: it
assumes that the entire clinical delivery cost scales with MMR, even though in practice vaccination is often bundled with other services and shares overhead across multiple immunizations.
Combining vaccine acquisition and administration yields:
80,000 × ($26.30 + $25.00) ≈ $4.1 million
Accordingly, the annual direct health-system expenditure associated with routine MMR delivery is approximately $4.1 million.
Some cost-of-illness frameworks incorporate additional household resource inputs, including:
• Caregiver time spent attending vaccination appointments
• Transportation expenses associated with clinic visits
When these inputs are fully allocated to MMR, the per-dose resource estimate increases to approximately $90.55, yielding an aggregate annual resource value of roughly $7.2 million.
However, caregiver time and transportation are not uniquely attributable to MMR vaccination. Immunizations are typically delivered during scheduled well-child visits alongside other vaccines and routine pediatric services. The incremental time associated solely with MMR administration is therefore limited.
For this reason, caregiver opportunity costs and transportation expenses are reported for completeness but are not included in the primary ROI calculation. Assigning the full household time burden to MMR would treat joint routine pediatric utilization as a measles-specific cost and materially overstate the marginal cost of maintaining measles immunity.
Economic literature distinguishes between direct medical costs and broader economic impacts associated with measles outbreaks. Prior studies commonly group these costs into three categories: (1) public health response costs, (2) direct medical costs, and (3) productivity losses (Pike et al., 2021; International Vaccine Access Center, 2025). A key finding in this literature is that outbreak costs do not increase proportionally with the number of cases. Instead, larger outbreaks impose disproportionately higher costs on local health systems, particularly through sustained public health response activities (Sriudomporn and Patenaude, 2025).
To estimate measles outbreak costs in Dallas County, we follow the framework proposed by Sriudomporn and Patenaude (2025), which models total outbreak costs as the sum of a fixed response cost and an incremental cost that scales with the number of confirmed cases. This approach captures the fact that even a single measles case triggers a substantial initial response, while additional cases generate further costs through contact tracing, medical treatment, and productivity losses.
The total cost of an outbreak (����) 1 can be expressed as:
Where ���� is the number of confirmed measles cases. Fixed represents the immediate activation of the public health response, including laboratory mobilization, enhanced surveillance, and initial staffing. And Incremental Cost covers case-specific expenses, such as contact tracing, medical care, quarantine enforcement, and productivity losses.
For Dallas County, we adopt the fixed-cost estimate reported by Sriudomporn and Patenaude (2025). This estimate is likely conservative, as Dallas County is the ninth most populous county in the United States and has higher labor and operational costs than the national average. As a result, actual response costs in a large urban setting may exceed those observed in smaller jurisdictions.
1 The model does not assign monetary values to mortality risk or long-term health impairment; therefore, results represent conservative lower-bound economic estimates.
To localize incremental cost estimates, national averages from the literature are adjusted using Dallas County–specific labor and price indices. These adjustments are summarized in Table B1.
Table B1. Components of Incremental Cost of Measles Cases in the context of Dallas County
Table B2. Components of Direct Medical Cost
The average Nurse RN in Dallas Texas makes 11% 2 above the national average Nurse RN salary.
See Exhibit B2 below.
DFW MSA wage is slightly above but very close to national average 3, and adjusted for inflation.
2 https://www.4cornerresources.com/salary- data/registered-nurse-rn/dallas-tx/
3 https://www.bls.gov/regions/southwest/newsrelease/occupationalemploymentandwages_dallasfortworth.htm#:~:text=Workers%20in%20the%20Dallas %2DFort,Dallas
Outbreak costs are estimated from two perspectives. First, public health costs (PHC) include the fixed response cost, contact tracing labor, and direct medical treatment, representing expenditures with direct implications for public budgets. Second, total economic costs (TEC) include productivity losses in addition to public health and medical costs, capturing the broader societal impact of an outbreak. To streamline calculations, we assume an average of 20 contacts per case, consistent with prior outbreak studies and conservative for a dense urban setting.
Using these assumptions, Table B3 presents estimated public health costs and total economic costs under three outbreak scenarios.
A: 1 Case
B. 50 Cases (medium outbreak)
C: 200 Cases (Large)
$1,264,630 $2,218,180
$3,467,480 $7,281,680
PHC: $244,480 (Fixed) + $9,840 (Contacts) + $10,563 (Medical)
TEC: PHC + $19,071 (Productivity)
PHC: $244,480 (Fixed) + $492,000 (Contacts) + $528,150 (Medical)
TEC: PHC + $953,550 (Productivity)
PHC: $244,480 (Fixed) + $1,968,000 (Contacts) + $2,112,600 (Medical)
TEC: PHC + $3,814,200 (Productivity)
Table B3 illustrates how the total economic cost of a measles outbreak in Dallas County increases with the number of confirmed cases. The upward-sloping line reflects the combination of a large fixed response cost and incremental costs that accumulate with each additional case. Even at low case counts, total costs rise quickly because the first confirmed case
4 PHC=Fixed Cost+(n*Contacts*Labor Cost)+(n*Medical Costs); TEC=PHC+(n*Productivity Loss)
triggers immediate public health response activities, including surveillance, laboratory testing, and contact tracing.
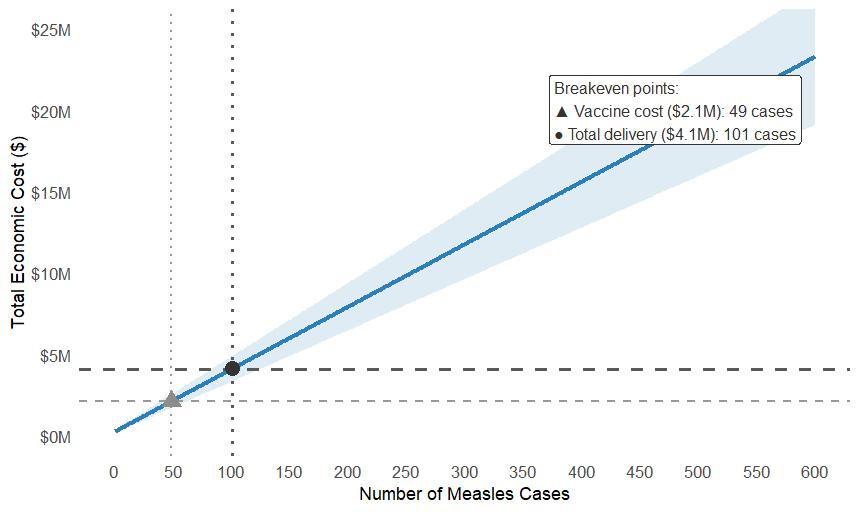
The horizontal dashed line represents the estimated $4.1 million annual cost of routine MMR vaccination, reflecting vaccine purchase and administration under current delivery practices. As shown in the figure, total outbreak costs exceed this annual prevention cost once the outbreak reaches roughly 100 cases. Beyond that point, each additional case increases the cost differential, making response progressively more expensive relative to maintaining routine coverage.
The model also makes clear that outbreak costs are not purely proportional to case counts. There is a fixed response cost estimated at approximately $244,000 that is incurred once the first case is identified. This reflects the immediate mobilization of investigation teams, communication protocols, and containment measures. After this baseline expenditure, total costs rise linearly with additional cases, driven by medical treatment, contact tracing, and productivity losses. Even relatively small outbreaks therefore impose meaningful fiscal burdens,
while moderate outbreaks quickly surpass the cost of prevention. In economic terms, the figure illustrates the scale at which reactive response becomes more costly than maintaining routine immunization in a large urban jurisdiction.
This appendix describes the three-step quantitative method used to model the economic consequences of eliminating MMR vaccination for newly entering cohorts: (1) estimating the susceptible population, (2) projecting annual case counts using the effective reproduction number, and (3) calculating total economic costs using the outbreak cost framework from Appendix B. The model is deterministic and tracks the annual accumulation of unvaccinated cohorts over a five-year horizon
1. Calculating the susceptible population.
We approximate the size of the susceptible population by tracking the annual inflow of children who miss scheduled MMR vaccination. The calculation follows the two-dose structure of the MMR schedule and considers two cohorts entering the susceptible pool each year.
Group A (Age 1): Approximately 40,000 infants miss the first MMR dose. These individuals are assumed to have no protection and are therefore treated as fully susceptible.
Group B (Age 4–6): Approximately 40,000 children miss the second MMR dose. These children have received one dose and are assumed to have 93% protection. However, because singledose immunity is not complete, they retain a 7% probability of vaccine failure and thus remain partially susceptible to infection.
To combine these groups, we convert partially protected individuals into effective susceptibles by applying the implied failure rate.
• Group A contributes 40,000 effective susceptibles.
• Group B contributes 40,000 × 0.07 = 2,800 effective susceptibles.
The annual inflow into the susceptible pool is therefore:
40,000 + 2,800 = 42,800
Under the simplifying assumption that this inflow remains constant over time, the susceptible population accumulates linearly. After five years, the pool of fully or partially unprotected individuals reaches approximately:
42,800 × 5 = 214,000
This measure represents the effective susceptible population, combining individuals who are completely unvaccinated with those who retain residual susceptibility due to incomplete vaccination
Projected case counts are derived using the effective reproduction number �������� , which represents the average number of secondary infections generated by a single case in a population with partial immunity.
�������� = ����0 × ����
where:
• ����0 denotes the basic reproduction number, assumed at 15 for measles based on epidemiological estimates.
• ���� denotes the share of the population that is susceptible to infection.
As vaccination coverage declines, the susceptible share ���� increases over time. This gradually raises the effective reproduction number and changes the expected transmission dynamics. In the early years of the simulation, susceptibility remains relatively low, implying �������� < 1
Under these conditions, outbreaks remain limited in scale; for example, the model projects approximately 140 cases in Year 1.
A critical threshold emerges once the susceptible share exceeds 1/����0 ≈ 6 7%. At this point, �������� exceeds one and transmission becomes self-sustaining. This transition occurs around Year 3–4 in the simulation. Once the threshold is crossed, transmission accelerates rapidly, with projected cases rising from roughly 450 cases to 1,100 and then to 3,800 as the susceptible population continues to accumulate.
Two mechanisms further amplify transmission:
Social mixing
Children primarily interact with peers of similar age in daycare and school environments. When vaccination stops for new cohorts, susceptible individuals become concentrated in these settings, increasing the probability of sustained transmission.
Household transmission
Measles exhibits secondary attack rates approaching 90 percent within households. Infected school-age children frequently transmit the virus to siblings or other household members, including infants who are not yet vaccinated.
These dynamics contribute to the rapid increase in projected cases observed in later years of the simulation.
3. Calculation of Economic Cost
The total economic loss is calculated for each year based on the method presented in Appendix B.
As the simulation evolves from small outbreaks toward sustained transmission, the model introduces two nonlinear adjustments to reflect the rising marginal cost of outbreak management.
When annual case counts exceed approximately 500 cases (beginning around Years 2–3 in the simulation), the local public health response moves beyond its baseline operational capacity. Maintaining containment requires additional staffing, contract tracing, vaccination campaigns, and administrative overtime.
To capture these additional response costs, the model applies a surge multiplier
�������� = 1.20 to labor-related outbreak response expenditures once the threshold is reached.
At higher case volumes (Years 4–5), the healthcare system experiences increasing capacity constraints. Large outbreaks raise the probability that severe measles complications require intensive hospital treatment
To approximate this effect, the model incorporates an additional clinical overflow adjustment ���������������� which reflects higher treatment costs associated with intensive care utilization. Specifically, the model assumes a $50,000 incremental cost for the 15 percent of cases requiring intensive care, along with an adjustment reflecting the expected value of preventable mortality using standard Value of a Statistical Life (VSL) estimates.
The analysis compares these outbreak costs to the annual vaccination program budget, estimated at approximately $4.1 million per year. Under the zero-coverage scenario, eliminating vaccination generates short-term fiscal savings but produces substantially higher outbreak costs.
The return on prevention investment (ROI) is calculated as ������������ = Outbreak Cost Vaccination Budget
This implies that each dollar not spent on vaccination results in approximately more than $69 in economic losses. Cumulatively, the five-year simulation produces total economic losses approaching $450 million, reflecting the combined effects of rising susceptibility, clustered social transmission, and escalating healthcare system costs.
This analysis has several limitations. In most cases, these limitations suggest that the estimated costs of measles outbreaks in Dallas County are likely underestimated.
Fixed response costs may be understated.
The analysis uses a national average estimate for the fixed cost of initiating an outbreak response. Given the size and population density of Dallas County, the actual response costs are likely higher than the national average. Dallas County's high density and labor rates ($492/contact) suggest that actual mobilization may exceed national averages by 11-15%. The estimate also assumes that outbreak response systems are fully in place. If laboratory capacity or specialized staffing has been reduced, the initial cost of mobilizing a response during an outbreak could be higher than assumed.
Indirect economic costs are not fully captured.
Longer-term productivity losses are difficult to measure and are not well captured in most existing studies. For example, if a caregiver loses employment or experiences long-term income loss due to a prolonged quarantine, those effects are not reflected in this analysis. As a result, household-level economic impacts may be larger than estimated.
Contacts per case may be higher in some settings.
The model assumes an average of 20 contacts per case. In practice, contact numbers can vary widely. Exposure in large public settings, such as major events or transportation hubs, could result in far more contacts, which would increase public health labor and response costs.
Clinical severity may be underestimated.
The analysis assumes an average hospitalization rate of 11% 5 and typical hospitalization costs. If an outbreak affects a more vulnerable population, hospitalization rates could be higher. Severe cases requiring intensive care, such as measles encephalitis, can cost far more than the average case and would increase total medical costs.
Overall, these limitations mean that the cost estimates presented in this report should be interpreted as conservative estimates of the economic impact of measles outbreaks in Dallas County.
5 CDC 2025 Hospitalization Rate: https://www.cdc.gov/measles/data-research/index.html