
7 minute read
We dug through over a decade of eating club tax returns. Here’s what we found.


By Grace Zhao & David Yan Data Contributors
With Street Week 2023 currently in progress for the Class of 2025 and some members of the Class of 2024, Princeton’s eating clubs have been the main topic of interest. In addition to questions such as “What is bicker?” and “Which clubs are sign-in?” many students may wonder how the eating clubs generate income, manage their budgets, and fund operations.
Advertisement
To answer those questions, The Daily Princetonian analyzed each eating club’s publicly available Form 990 filings over the past 16 years. Form 990s — required for all income tax-exempt
Investment Income
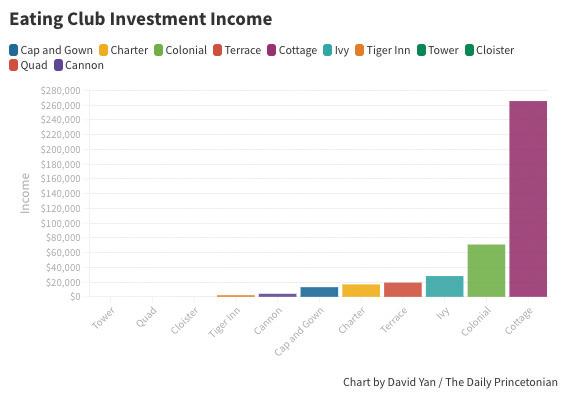
The ‘Prince’ analyzed a select set of stocks that the eating clubs invested in, mostly from the period between 2008 and 2010. Eating clubs invest their endowments to provide an additional revenue stream. In 2019, Colonial had the best stock returns with $81,995 on its $1,632,766 investment, or 5.02 percent. Meanwhile, Cloister had just a $34 return on its $424,307 investment, or 0.008 percent. Some of the reported stocks may not be stocks chosen by the clubs themselves, but rather stocks received in donations. organizations — detail everything about an eating club’s finances, from stock investments to expenditures for food and beverages.
The ‘Prince’ reached out to every club and the Interclub Council (ICC), and received a response from Cloister’s general manager. Every other club and the ICC either did not reply or declined requests for comment.
Gain or (loss) from sale of assets other than inventory
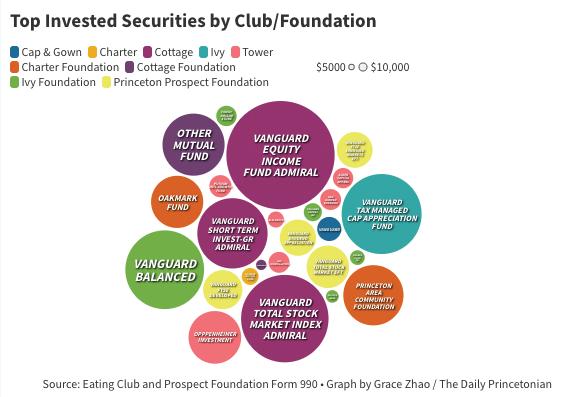
foundations.
Of the disclosed securities, Vanguard’s collection of securities is a popular option with over $13 million invested by multiple different clubs and
Total revenue
The eating clubs earn money in a variety of ways. The biggest component is program revenue, which includes money received by providing a good or service directly related to the social function of the club, such as undergraduate student dues, lodging, and events. Across all clubs, an average of 85 percent of all revenue comes from program revenue. Non-program revenue may include investments, donations, and occasional sales of property. Colonial had the smallest percentage of total revenue with program revenue at an average of 75 percent — their slightly more successful investments demonstrate that the club relies less on program revenue. Another component of total income is “Contribution and Grants” which are mainly alumni dues and donations.
According to Cloister’s general manager Jason Miller, “Alumni contributions are important not
From 2004 to 2019, each club on average spent 1.3 million per year. The largest component is employee salary averaging 450,000 dollars per year per club, accounting for 34 percent of total expenses. Next up is food and beverages: across the clubs, it averages out to 288,000 dollars annually. The Club Manager, who is responsible for the day to day operations of the entire club and an important point of contact for students, is usually the highest earning individual within the club. The notable exception being the kitchen manager of Tiger Inn who experienced a much higher pay raise compared to the club manager.
Among club employees, the club manager, usually responsible for day-to-day operations of the entire club, is the highest earning employee of 10 of the 11 clubs. The exception is Tiger Inn, where the kitchen manager draws a higher salary than the club manager.
The ‘Prince’ broke down club dues by club, focusing on 2017 specifically. Ivy was the most expensive, with dues of $9,680 while Cottage had the lowest dues, at $8,675. The difference in dues between clubs varied only by about a thousand dollars. On the other hand, spending per capita, or the amount that the clubs spend per member, varies widely, with Terrace averaging $5,442 per member to Cloister averaging $13,767 per member. Seven clubs charged only financially, they also show how engaged your alumni members are in the club. We typically receive 10 to 15 percent of our revenue from Alumni contributions.”
Donations typically make up about 10 to 15 percent of club revenues, but the number varies year to year. In years when Tiger Inn and Cap & Gown were renovating, there were sharp increases in donations, likely due to expansion and renovation fundraising. Out of all the clubs, Ivy had the highest percentage of revenue that came from contributions and grants, at 21 percent.
Actual worth of donations sometimes fluctuate. For example, in 2010-2011, Ivy received $1,131,603 in securities contributions, which are tradable financial assets such as stocks. Clubs also sometimes get revenue in the form of loans — such as when Quad received a $50,000 loan from the chairperson of its board in 2011 and a
$200,000 loan from one of its trustees in 20122013. The trustee does not appear to be charging significant interest on loans, with no repayment totalling more than one percent interest.
This amount may be an underestimate of how much some clubs receive in donations, as almost all the clubs at some point received grants through the Princeton Prospect Foundation (PPF). The PPF is a nonprofit that is associated with all of the clubs except Cottage. The PPF is responsible for the historic preservation and support of the Princeton Eating Clubs. They also host open houses to the general public and have published a book on the history of the eating clubs.
Many eating club alumni prefer to donate through the Princeton Prospect Foundation, as opposed to directly to the club, because the foundation’s contributions are tax deductible,
Total expenses
members more than their spending per student, whereas Cap & Gown, Colonial, Ivy, and Cloister charged less. These numbers might have also been influenced by the number of events each club hosts — for example, Ivy spent $131,260 on entertainment, more than three times the $34,400 that Cottage spent on the same.
The club with the highest total spending is not the highest spender per student. Tower was the club that spent the most for total spending, but Tower also had the second most number of members, at 231 in 2017. Club membership varied widely, with the smallest club, Cloister, having 96 members in 2017. Therefore, in spending per capita, Tower comes in seventh. Tiger Inn, which was fourth in spending, was tenth in spending per capita. On the other hand, Cloister is ranked eighth for total spending, but due to its small membership, it spent the most per member.
Pandemic impact
The 2018-2019 academic year was the last uninterrupted school year before students were sent home due to the COVID-19 pandemic in March 2020. The forms from the 2019-2020 school year in which the last two and a half months were when Princeton was primarily virtual show a clear decrease in spending.
On average the clubs spent $93,000 less on
Net assets or fund balances at end of year
Ivy Club has kept its historical place as the most affluent club across the analyzed period, with their most recent net valuation — the sum of how much cash, stock, and property the club has minus all debts — at $9,089,607. Cap & Gown Club and Tiger Inn are a close second and third with net valuations of $8,058,989 and $6,979,512, respectively. Two clubs that have seen substantial increases in their net valuation over the period are Cap & Gown and Tiger Inn. Both clubs went through substantial renovations in the early 2010s. Charter Club, which also underwent renovations, did not see a similar increase in net valuation. Quadrangle Club and Cloister Inn are the clubs with the lowest net valuations, with net valuations of $752,720 and $602,212, respectively.
The largest assets that clubs tend to own are their building and land. Ivy reported their building and land to be worth almost $7.5 million, more than 20 times what Cloister reported for its building and land. Every year, clubs can claim on their tax form that their property has depreciated, up to a certain level. Quadrangle and Cloister reported substantial depreciation of their properties, reporting the depreciated value of their property as over 70 percent less than the original price. In mid2020, Quad reported its property, comprising the building and 1.2 acres of land, to be worth just below $600,000, drastically different from the official assessment of the property from the county at about $2.2 million, indicating that the market value of the property may be even higher.
Grace Zhao is a contributing writer for the Data section of the ‘Prince.’
David Yan is a contributing writer for the Data section of the ‘Prince.’ food and beverages in the 2019-2020 school year than the 2018-2019 school year, a roughly 30 percent decrease. Total expenses dropped by $173,000 for each club, an 11.5 percent decrease from previous year. During the same period revenue from campus income streams dropped on average $134,000, likely due to loss of funds from room and board and hosted events. For many clubs, fundraising spiked during the 2019-2020 school year, possibly due to club fundraising drives after students were sent home. whereas donations to the eating clubs usually are not — which is a difference many clubs warn about on their respective websites. A few clubs also have their own charitable or educational foundations that allow its members to donate tax deducted, such as the Ivy 1879 Foundation, the Cottage 1886 Foundation, the Princeton Charter Foundation, and the Princeton Cannon Dial Elm Foundation. While all donations are theoretically transferred to the club, they are not always reported for larger projects such as construction. Over the past 15 years, the percent of tax-deductible donations vary between clubs, from 45 percent at Cannon to 94 percent at Tiger Inn, which comes out to an average of 80 percent across all of the eating clubs.
Head Data Editor Elaine Huang contributed data collection.
Approximately nine weeks of the 2019-2020 school year were virtual, about a third of the academic year.
At the time of publication, only three clubs had data for 2020-2021, with an average of $1,000 in program revenue — a 99.93 percent decrease. Despite all the clubs being shut down beginning in mid-March, the clubs still had significant expenses such as salaries, which were about half of the usual expense, insurances, and tax. Each club was kept afloat by $500,000 donations or grants each. The sources of these grants cannot be confirmed.
Food and Beverage
In 2014, Tower had spent the most on food and beverages out of any club for any single year in the period analyzed, at $482,615. Tower prepares many meals to order, possibly leading to higher expenses. In 2014, the total spent on food and beverage for all clubs was $3,620,765, the highest across the decade. In 2009, Cottage spent $42,931 on beverages alone.
Property Tax
Another significant cost for eating clubs is property tax. The current tax rate is about 2.4 percent of the property value. Ivy leads the pack, paying $112,881 per year in property taxes, while Terrace pays only $43,776. In 2010, Cottage Club took the Princeton Borough to court over property taxes and demanded $550,000 in back taxes, a case the club lost. Tower also did not pay any property tax for the past few decades by hosting precepts and seminars in their rooms, according to their 2022 report to the Princeton Prospect Foundation.


