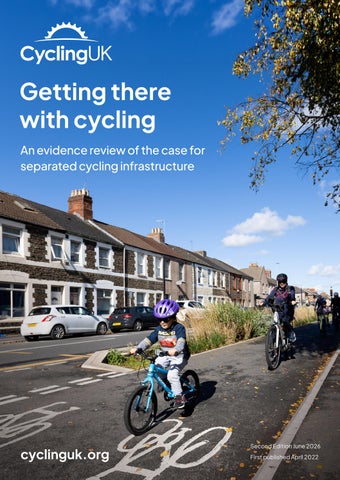
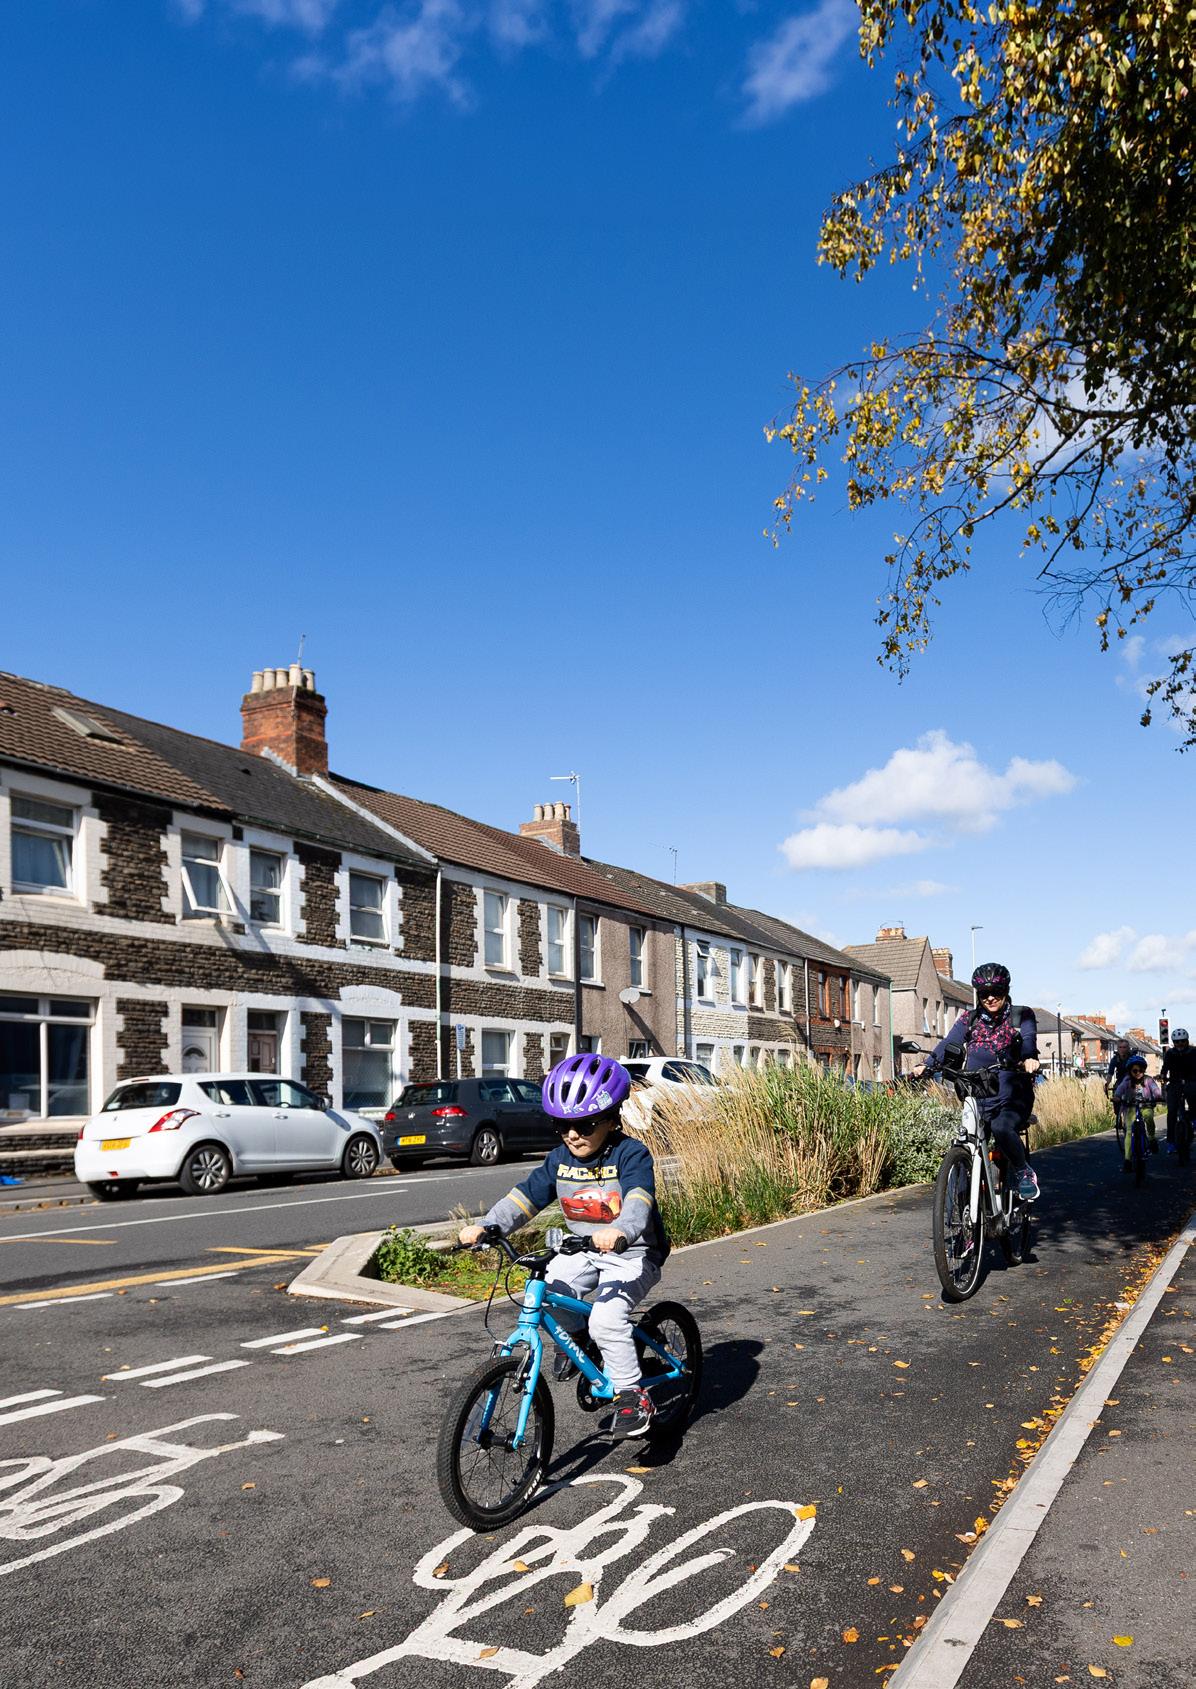
Getting there with
The challenges cycling infrastructure helps to address
£6.5bn spent by the NHS every year on obesity-related ill-health1
30,000 deaths in the UK every year linked to air pollution2
UK greenhouse gas pollution - Road transport is the biggest source of UK carbon pollution 4 31%
£11bn estimated losses to the UK economy due to traffic congestion5 hours average time individuals lost to traffic congestion in 20256 of adults in Wales are classed as physically inactive, with less than 30 minutes a week* the mortality risk for regular cycle commuters compared to nonactive commuters 3 1/2 of daily trips in England are under 5 miles.
Executive Summary
This 2026 reviewed edition of Getting there with cycling brings together the evidence for separated cycling infrastructure.
It presents how unlocking more cycling through protected cycle lanes and infrastructure can deliver wide-reaching benefits to all four nations of the UK, and the regions and local communities within.
We show how cycling infrastructure:
• Boost safety and confidence, helping the UK to reduce the disproportionate burden of road danger felt by people walking, wheeling and cycling.
• Is as an affordable form of everyday transport that more people would use to get to work, to school, or for their everyday needs, with infrastructure in place to support and enable it.
• Is in demand, and when good infrastructure has been built, demand has outpaced expectations, demonstrating how there is untapped potential everywhere.
For the UK’s economy, the returns are significant.
• With growing cities and crowded roads, cycling can be thought of as a space-efficient mass transit system, easing congestion and cutting travel times, boosting productivity in our cities and towns.
• The infrastructure to support cycling is inherently quick to deliver at a lower cost than most interventions available to governments and highway authorities. Treasury ranks average cost-benefit ratios as ‘Very High’ with an average £5.62 returned for every £1 invested.
• The most popular high streets and town-centres are those which prioritise people over traffic and are accessible for people cycling, which can support our ailing high streets
For a country facing the health costs of obesity and physical inactivity, cycling is a mode of active travel that weaves exercise unnoticeably into everyday life, boosting productivity and longevity while cutting sickness and ill-health, supporting people’s health, independence and wellbeing throughout life.
It does all of the above without contributing to air pollution or greenhouse gas emissions beyond the factories that make them, and the logistics that bring a cycle to market. Taken together, this shows the case for getting there with cycling is stronger than ever.
Recommendations
To capture the many clear benefits outlined in this report, we recommend governments provide:
1. Sufficient funding for walking, wheeling and cycling, reaching £50 per person per year.
2. High quality standards including statutory guidance so that money is spent on high-quality schemes and capacity and capability is built at a local level.
3. Clear and ambitious targets to provide vision and drive progress, including national indicators for active travel at local authority level in each UK nation.
4. Political leadership for the transformative cultural change required to put cycling on equal footing with other modes of transport.
Introduction
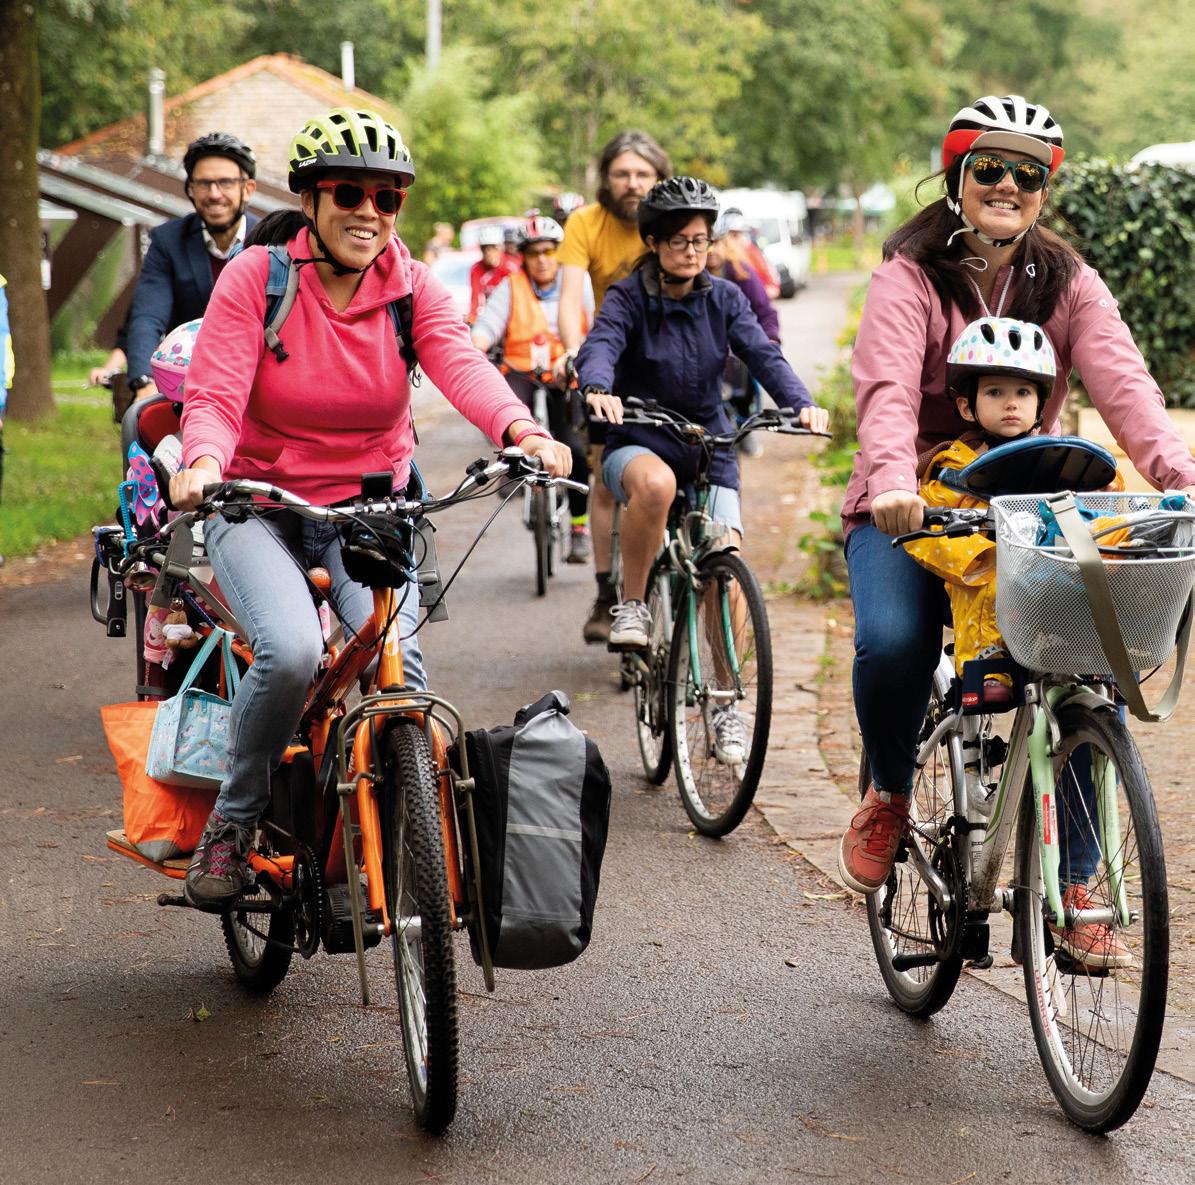
Councils across the UK are gradually turning the tide on the country’s lack of safe cycling infrastructure. Those who have invested in high quality safe cycle routes are seeing the benefits as more and more people use them for everyday journeys. The Netherlands may have had a decades long headstart in investing and planning with cycling in mind, but with continued effort we, too, can get there with cycling.
Designing safe infrastructure
For the purposes of this report, cycling infrastructure is anything in the built environment which helps people to cycle safely. 7
The best cycling infrastructure provides physical separation from motor-traffic and from people walking and wheeling.8
Cycle infrastructure can include:
• Protected cycle lanes (separated from motor-traffic by a kerb, verge or other physical barrier).
• Cycle routes on quiet or low-traffic roads.
• Shared-use paths and bridleways (including off-road cycle paths , where suitable).
Supported by area-wide measures, that reduce traffic speeds and volumes across a cycle network, including:
• 20mph speed limits for most streets in built-up areas.
• Traffic reduction measures such as filtered permeability, pedestrianisation, motor vehicle restrictions or charges.
“It is clear from the research that most noncyclists and recreational cyclists will only consider cycling regularly if they are segregated from traffic, and that pedestrians are hostile to pavement cyclists.”9
Why get there with cycling infrastructure?
This report highlights evidence to show why UK Government, devolved governments and councils should be investing in and creating high-quality cycling infrastructure.
It’s an unashamed sales pitch to national and local government, giving 12 reasons why they must get there with cycling.
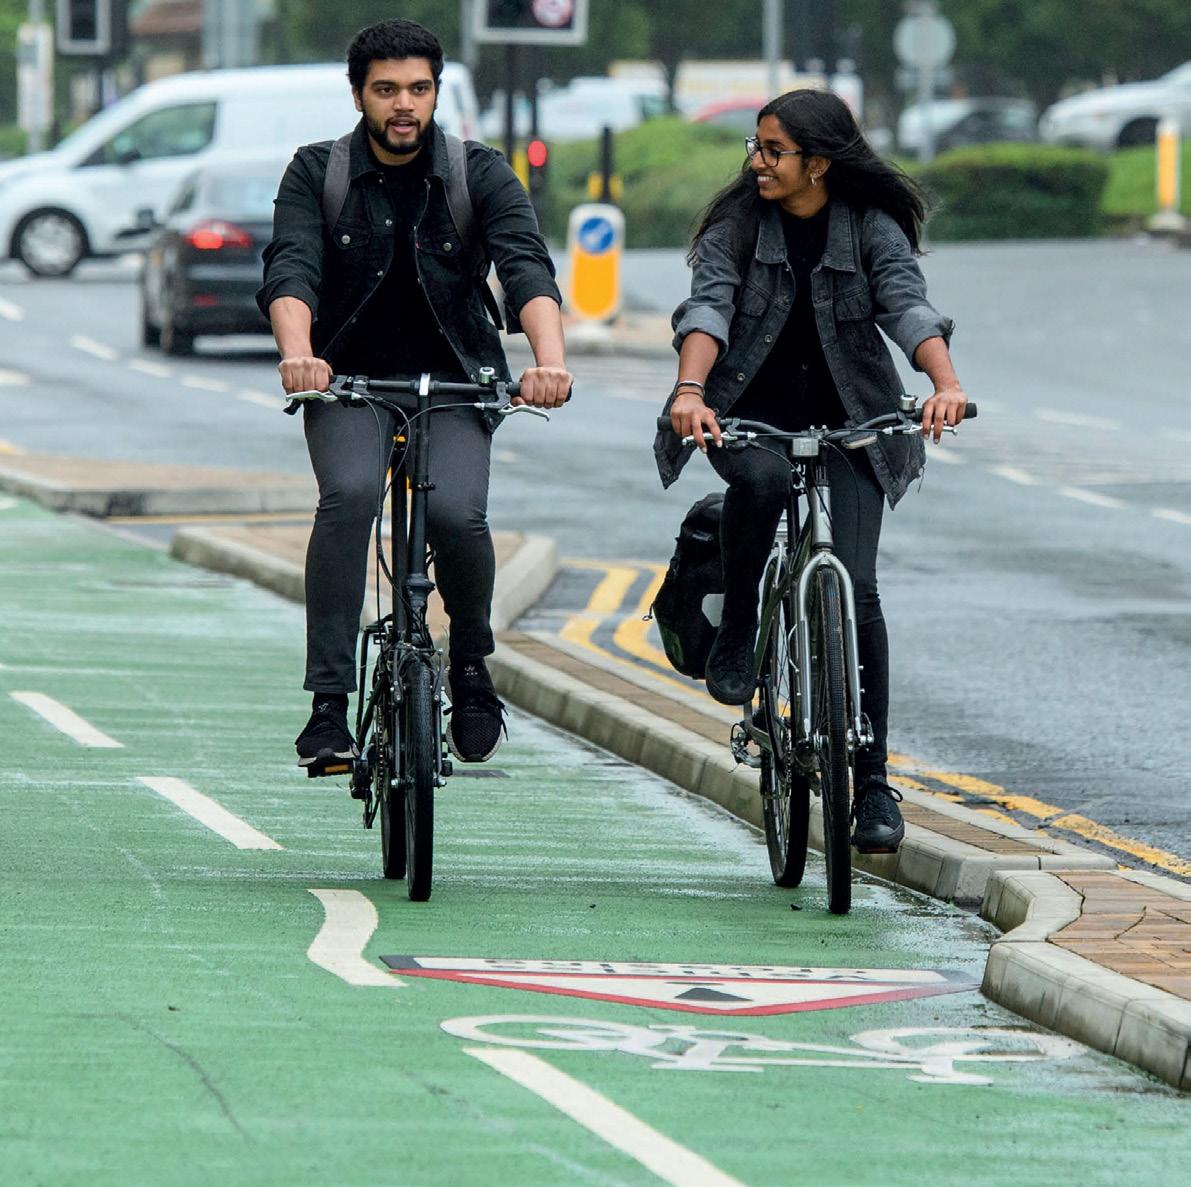
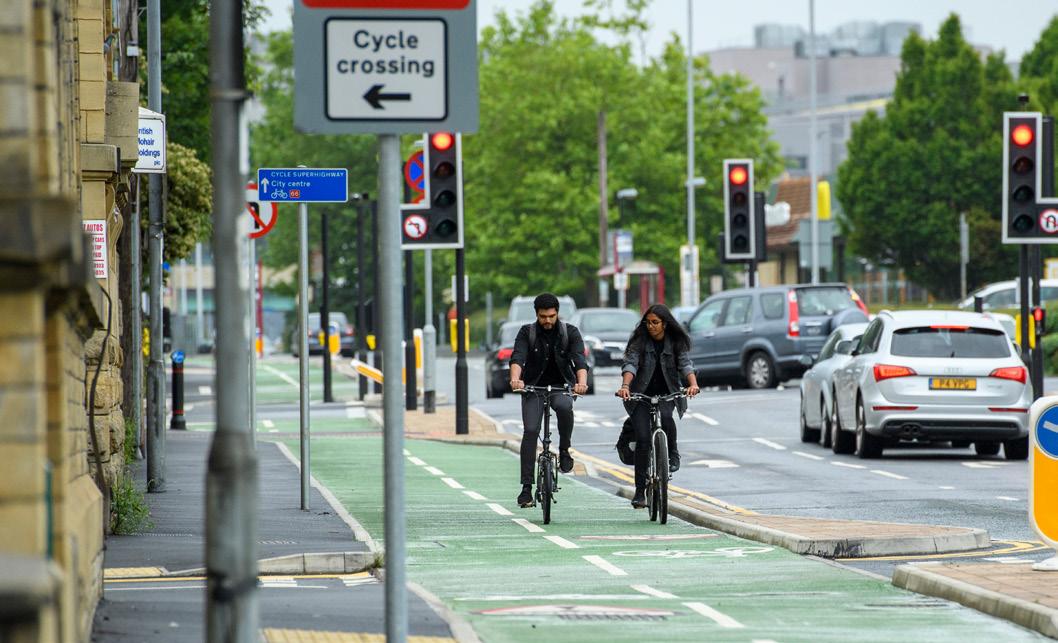
Protected cycle routes, like this one in Bradford, tackle road safety, reducing odds of injury by 40-65%
Direct benefits, felt quickly
Improving cycling infrastructure delivers clear, direct benefits and quickly compared to other transport infrastructure interventions. Here are three clear examples:
1 Boost safety and confidence
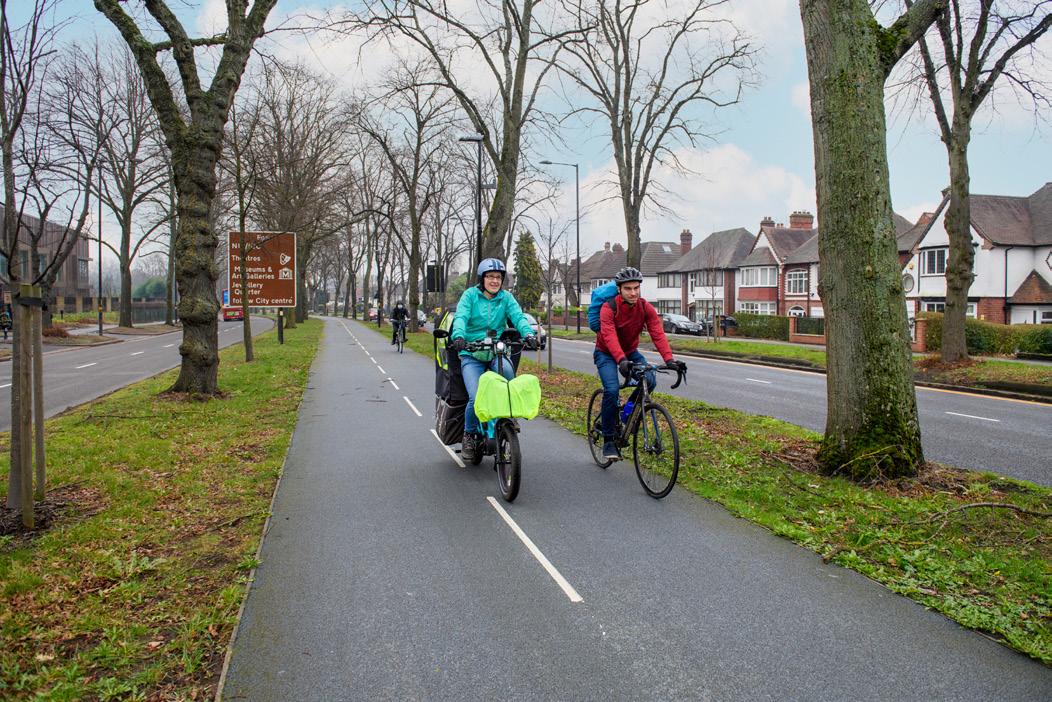
The primary reason for cycle tracks and other infrastructure is to increase safety.
Monitoring in London found 76% of cyclists felt safe on the capital’s designated bike routes while only 40% felt safe on roads outside the capital’s cycle network.10
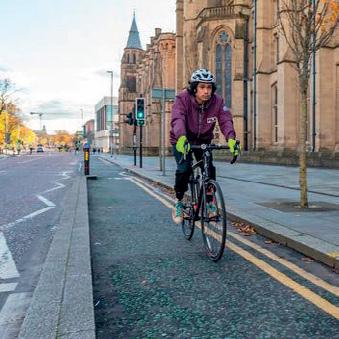
The gold standard is infrastructure which physically separates riders from motor-traffic. Evidence shows that when compared to no infrastructure, protected cycle routes reduce injury odds by 40-65%.11
20 is Plenty
20mph zones and limits are lifesaving.
The same study suggested that advisory cycle lanes (dashed white lines denoting the cycle lane) may do more harm than good.12
Enabling more people to cycle by building quality safe cycling infrastructure creates a ‘safety in numbers’ effect. Evidence shows that a doubling of the number of cyclists in the morning commute reduces cycling injury odds by 13%.13
Cycling infrastructure protects people simply going about their daily business by bike, improving safety on UK roads.
20mph limits on London’s roads was associated with a 34% reduction in the number of people killed and seriously injury.14
A year after introducing a default 20mph speed limit on restricted roads in Wales, casualties were there lowest since records began in 1979, with 100 fewer people killed or seriously injured.
A person is five times more likely to be killed if hit by a vehicle travelling at 30mph than at 20mph.15 For children the differences between survivability in collisions on 20mph or 30mph streets is much greater.16
2 Tackle the cost of living
Transport is among the largest expenses for UK families, and it is growing.
Excluding mortgage payments, it is the single largest expense for rural households17 and second largest for urban households. Indeed, spending on transport saw the greatest year-on-year increase between 2023 and 2024,
up 12 per cent following a steady decline through the early 2000s.18 And UK households continue to be exposed to price shocks from global events, such as the 2026 Iran conflict. Transport is one of the areas where households are most alert to the cost of living.
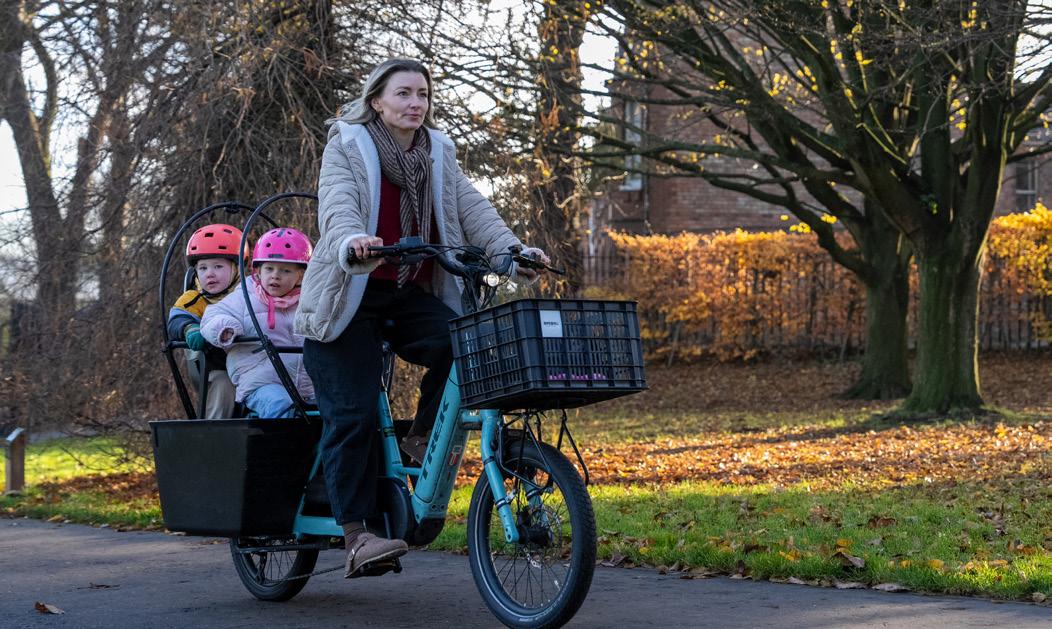
Cycling provides affordable day-to-day transport, with cycles generally costing very little to purchase and maintain.1 While the average UK family spends £33.50 a week or £1,742 a year on car running costs. They spend 30p a week or £15.60 a year on bicycle maintenance.19 Without cycling infrastructure to unlock and enable these journeys for everyone, it remains an increasingly narrow group who can enjoy the savings of cycling.
Many lower income households reduce their spending as costs increase. But this impacts their access to opportunities and quality of life. ‘Forced car ownership’ in the academic literature describes places and households where cars are seen as essential to everyday life but their costs push people into poverty. In 2012, 6.7% of UK households fell into this definition.20
“[Walking, wheeling and cycling] are low and no cost ways to travel, and we want them to be easy, enjoyable and realistic choices for more people” UK Government25
3 People want to cycle
A similar concept is transport poverty. One million people in Scotland are at high risk of ‘transport poverty’ - whereby motoring costs place pressures on income, and alternatives to accessing key services are not available.21 A much larger group (40%) of British households in the lowest income quintile do not have access to a car.22
People living in low-income communities are more likely to suffer the harms of motor-traffic, including air pollution and road traffic casualties.23
Safe cycle infrastructure provides affordable transport while improving population health and reducing health inequalities.24
People cycling now outnumber cars on Glasgow’s South City Way
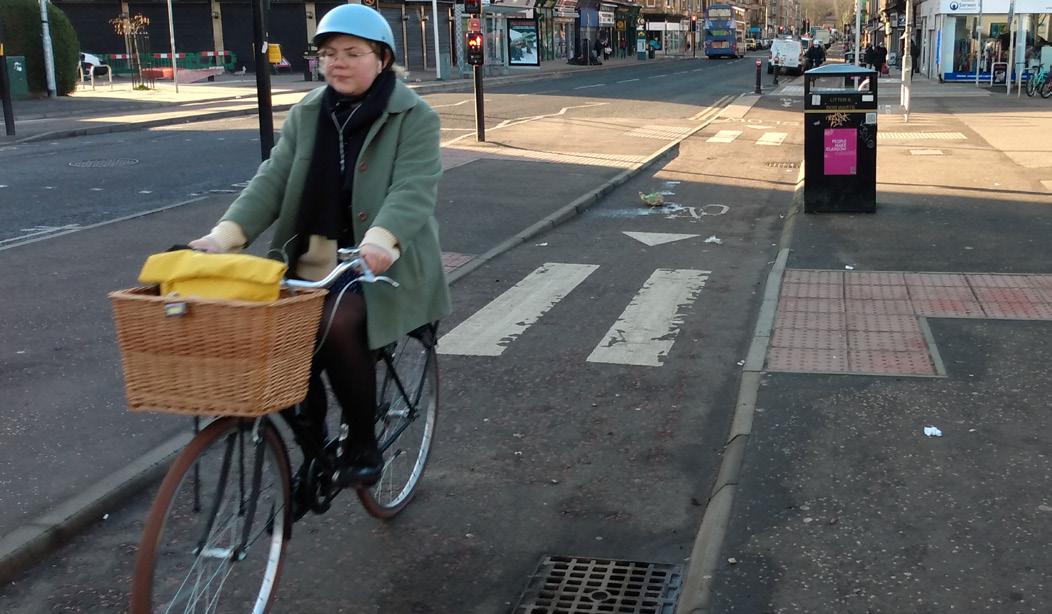
People want more cycling infrastructure in their neighbourhoods.
Across the UK, 60 per cent of the public travel by walking, wheeling or cycling, at least every other day. The highest level is 70 per cent of Greater London residents, while the lowest is 51 per cent in Wales, which is still a majority.26
With majorities across the UK taking active forms of transport so regularly, support for better infrastructure remains very high, even with trade-offs. A 2024 More in Common survey found net support at +46% for the statement ‘the UK government should invest in improving public transport and active travel, even if it means taking road space away from cars.’ 63 per cent agreed and only 17 per cent disagreed.27 Policy support is rarely so high.
In urban areas, six-in-ten (58%) support building more cycle paths physically separated from traffic and pedestrians, even when this would mean less room for other road traffic.28
The pattern is repeated across Scotland and Wales.
• In Scotland, two-thirds (62%) agreed they would support reallocating road space in their local area for cycling.29
• In Wales, a similar majority (58%) support redesigning streets to make them safer for pedestrians and cyclists with net support at +29 per cent.30
Even supposedly controversial schemes carry broad support. Restricting ‘through-traffic’ and preventing ‘rat running’ with Low Traffic Neighbourhoods (LTNs) carries more public support than opposition (+18% net public support).31 The gap between what politicians estimate and reality is large, for example MPs overestimated opposition to LTNs by 32 percentage points.32
“LTNs became a culture-war battleground but the evidence now is that people rather like them” Emma Duncan, The Times33
There are exceptions where non-standard or adapted cycles carry a significant premium, see Wheels for Wellbeing (2025) Guide to Inclusive Cycling, 2.3.1
Following the wide scale roll out of slower 20mph speed limits across Edinburgh between 2016 and 2018, support rose and detraction decreased. A pattern echoed across England, where a DfT study found net support for 20mph limits rose from +58% to +63% after implementation.35
While there may be complaints as schemes and the resultant changes bed in, safe active travel infrastructure is popular in principle and in practice.
Cycling infrastructure and transport’s gender inequity
Women are more likely than men to make more short trips throughout the day. They are less likely to have use of a car and typically make many local journeys that are not well served by public transport.36 For women, cycling has enormous, untapped potential.
But 58% of women still think their cycle journeys are limited by safety concerns and a lack of suitable infrastructure.37 Women in Scotland told YouGov the most common thing (31%) that would motivate them to cycle more was ’If there was better infrastructure for bicycles (e.g. segregated cycle lanes, cycle paths etc.)’38
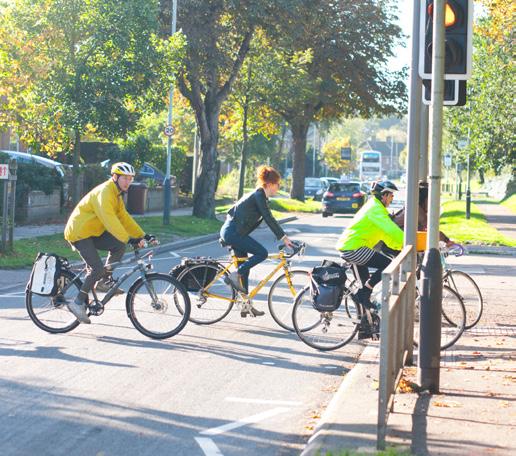
Research suggests cycling infrastructure that reinforces the legitimate place of cycling on our streets could also help lessen the verbal abuse directed at women cycling.39 Read more in Cycling UK (2026) Making cycling work for women: five steps for local authorities.*
4 People will cycle
Where people need to travel, there is untapped potential for cycling. And high-quality cycling and walking infrastructure is the key to unlock this demand.40
A year after Glasgow City Council completed the segregated ‘South City Way’ between the city centre and southern suburbs, cycles outnumber cars – with 16% of all travel along the route by cycle. Long-term counters show cycling levels rising across Glasgow in line with the growth of its network of protected routes.41
Only four months after opening, London’s Embankment cycleway saw over a million cycle trips.42 Increases of up to 53% were recorded in 2018 where new cycle lanes had been installed compared to a smaller 5% increase citywide.43 From 2019 to 2025, daily cycling rates in the capital have tripled.44
A US study found people prefer cycling away from traffic, on ‘off-street bike paths, enhanced
neighbourhood bikeways with traffic calming features … and bridge facilities.45
During the 2020 Covid pandemic, cycling rates skyrocketed. Roads emptied of cars and people cycled for a covid-safe means of travel and exercise.46 It showed how quieter, safer streets would motivate more people to cycle.
Most people are aware of what needs to change. A survey found that a third of people (36%) said they would rethink their travel habits in the future to use cars and motor vehicles less, if there was:
• Traffic-free cycle tracks and paths to high streets and town centres,
• More designated cycle lanes on roads,
• Traffic restrictions in residential streets.47
*Available at: https://www.cyclinguk.org/my-ride-our-right/five-ways-improve-cycling-women
This pattern is repeated across the world where separated cycle lanes have been built.
Bogota – Cycling in the city has steadily increased from around half-a-percent of daily trips in 1996, to six per cent in 2014 following the construction of its protected cycle network.50 Furthermore, the safety of cyclists improved in the city as cycling levels increased and people used the segregated infrastructure.
The Netherlands – well documented as having built cycling infrastructure since the 1980s, it now boasts 22,000 miles of cycle infrastructure and a quarter of journeys being taken by bike.48
Copenhagen – Boasts 62% of its residents commuting to work or school by bike every day. More recent expansion of cycle highways extending more than 20 kilometres out from the city centre has increased bicycle traffic up to 68%, with 14% of new bicycle commuters switching over from the car – based on 2018 evaluations. The city has invested nearly €38 (£33) per resident per year.49
Seville – Seville’s decision to build 50 miles of cycle lanes in just a few years led to an 11-fold increase in numbers. They began installing segregated cycling infrastructure in 2006. By 2012, the share of cycling had increased from one to five percent.51 A more recent report states that six percent of all trips are cycled, and nine percent of non-commuter journeys.52 Seville’s infrastructure has also improved safety.53
Protected cycle routes get people cycling by dramatically improving the experience of cycling in the UK, delivering quick results which often surpass expectations.
Returns on investment
Investment in cycling infrastructure offers clear returns to the national economy, Treasury and local economies.
5 Boost urban productivity and our economy
Cycling can boost our urban economies. Our cities’ relatively limited public transport, walking and cycling networks relative to their European peers mean fewer people can access Britian’s big city centres compared to the European equivalents. Centre for Cities estimates this limitation on our cities’ effective working populations costs the UK economy £23.1 billion each year.54 Cycling can be a crucial part in enhancing urban transport and in turn our productivity through urban ‘agglomeration’ effects.
Private vehicles are the least efficient way for mass city transport to work. While cars remain essential for some needs, our economy bears one of costs of mass motoring through congestion. In 2025, congestion cost the UK economy an estimated £11 billion, with UK road users on average losing 59 hours and £822 a year to congestion.55
Walking, wheeling and cycling are much more space efficient. The same 3.5-metre-wide traffic lane can move over four times as many people by foot or bicycle as it can by car.56 Cycle parking occupies one-fifth of the space of a standard car parking bay. Cycling is a key part of the toolkit for boosting urban productivity, while freeing up land for other uses - supporting intensification of our towns and cities.57
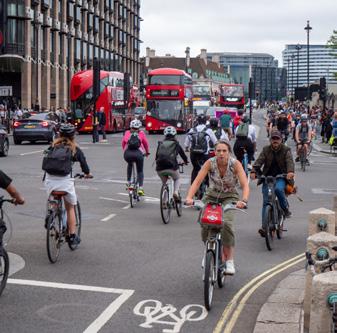
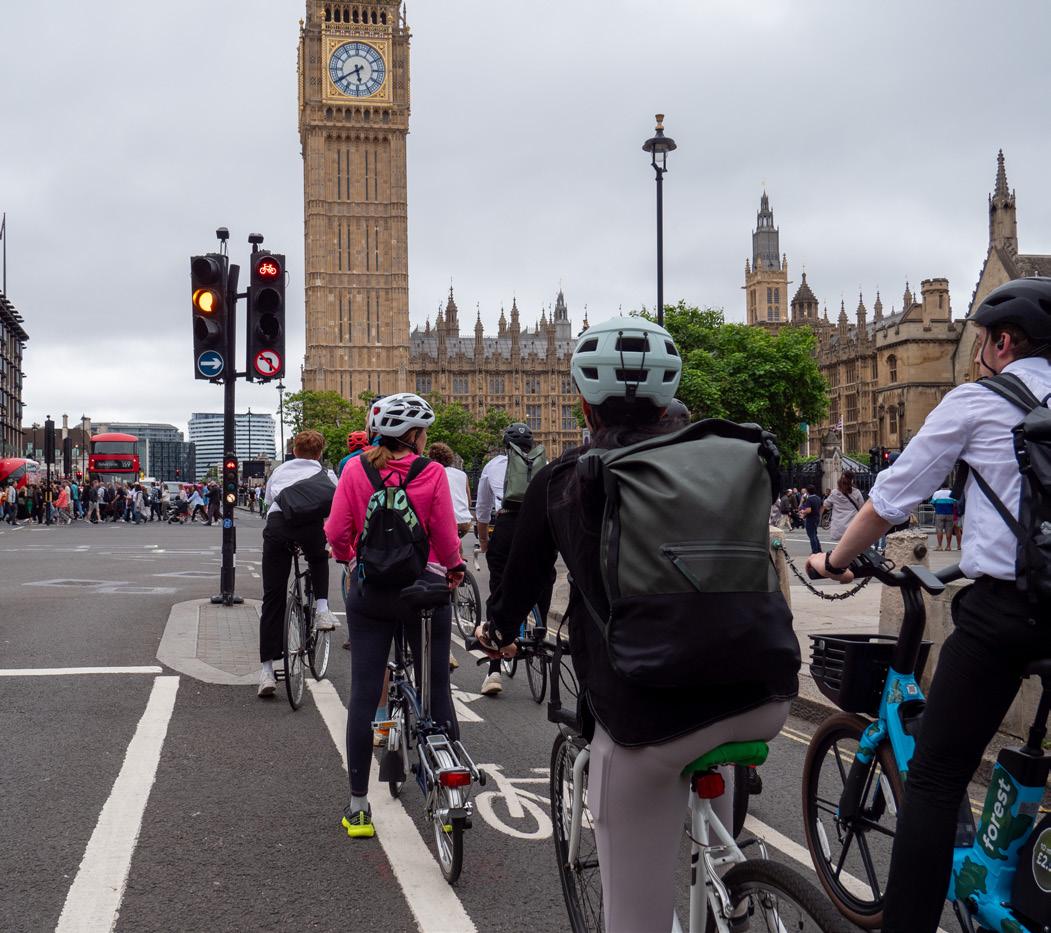
On London’s Blackfriars Bridge, the protected cycle tracks take up 20% of the road space but accommodate 70% of the people crossing the bridge at peak times.58
Indeed, cycling can support new development and the delivery of government housing targets by enabling more compact, dense development close to existing towns and services. The infrastructure costs of compact, walkable urban areas can be up to a third-less than sprawling, cardependent alternatives.59
Cycling’s health benefits also translate into productivity benefits for the economy. People who are physically active take 27% fewer sick days than their colleagues. In the Netherlands, employees regularly cycling to work are less frequently ill, and less likely to be absent than colleagues who do not cycle to work.
Whether an efficient way to move lots of people over short distances, or improve health, cycling is a key enabler of improved productivity.
6 Real returns on public investment
Investment in cycling is excellent value for money and better than many other transport investments. The UK Government estimates that for every £1 spent on cycling and walking schemes, an average £5.62 worth of benefits are achieved.60 Some studies suggest it could be as high as £13 of benefit for every £1 spent.61 The Treasury classifies such Benefit-Cost-Ratios (BCRs) as ‘very high.’ While typical motorway upgrades and bypasses have ‘high’ BCRs of 3.1:1 and 3.7:1, respectively. Cycle infrastructure being relatively quick to build, government can realise returns more swiftly.
7 Support local high streets
Reinvigorating high streets designing town centres for people rather than for cars can attract people to spend more time and enjoy themselves.
“The evidence strongly suggests that the town centres and high streets that flourish are the ones that are safe and easy to reach, and not entirely dependent on cars or dominated by fast and polluting vehicles once you are there.”62

Those walking and cycling visit local shops, restaurants, cafés or other local businesses more than users of other transport modes.63
Improving town centres and high streets by making them more pleasant places to be on foot or cycle can increase retail sales by up to 30%.64 Shop vacancy rates are higher on streets with higher levels of traffic. In a Leicester study, the vacancy rate on pedestrianised streets was 3 per cent, but up to 15 per cent on streets with 200-500 vehicles per hour.65 Similarly, retail turnover in pedestrianised streets generally outperforms non-pedestrianised streets.66
Cycle-friendly neighbourhoods are often popular with business owners. Following pedestrianisation of Union Street in Dundee, 84% of traders said that the changes have been positive for the street, with 62% saying it has been good for their business. Studies have found retailers estimate double the number of customers arriving by car compared to the reality.
Cycle parking delivers 5 times the retail spend per square metre than the same area of car parking
A happier, healthier society
Investment in cycling infrastructure unlocks the health benefits of active travel to wider groups of society across the course of our lives.
8 A building block for the nation’s health
Cycling infrastructure is the key to unlock everyday active travel, the easiest ways to incorporate physical activity into everyday life. Physical inactivity directly contributes to 1-in-6 deaths in the UK and costs £7.4 billion a year to business and wider society.70
“The weight of evidence suggests that if walking and cycling can be increased, they have potential to lead to important health gains at the population level, and thus benefit the NHS and the wider health and care system.”71
Whether starting from scratch, or gradually building towards a network, each new piece of infrastructure is a building block for better public health.
Physical activity, including cycling, reduces a range of health risks
As the four Chief Medical Officers for UK’s nations write, “there is strong evidence to demonstrate the protective effect on physical activity on a range of many chronic conditions including coronary heart disease, obesity and type 2 diabetes, mental health problems and social isolation. Regular physical activity can deliver cost savings for the health and care system and has wider social benefits for individuals and communities. These include increased productivity in the workplace, and active travel can reduce congestion and reduce air pollution.”72
For example:
• A large-scale Scottish study found cycling to work is linked with a 45% lower risk of developing cancer, and a 46% lower risk of cardiovascular disease (CVD), compared to commuting by car or public transport.73
• A Danish study found cycling to work or for leisure is consistently associated with lower risk of type-2 diabetes,74 and late-in-life initiation of or continued engagement in cycling also lowers risk.
• Cycle commuting improves fitness in men and women and is associated with a lower body mass index, lower rates of obesity, lower blood pressure, among other health indicators.75
• There are significant associations between overall psychological wellbeing and active travel compared to car travel.76 Furthermore, the health benefit of a shift from car to active transport is by far the biggest positive and that: “the benefits of bicycling completely overwhelm any concern over pollution exposure of bicyclists.”77
“If physical activity were a drug, we would refer to it as a miracle cure, due to the great many illnesses it can prevent and help treat.”
Chief Medical Officers for England, Wales, Northern Ireland and Scotland
Healthier people are happier, more productive and place a lesser burden on healthcare services. Money spent on cycling infrastructure can be overwhelmingly positive for people’s health and local NHS services.
A recent review by Public Health Scotland found that taking road space away from cars has multiple health and health inequality benefits on its own, but these health benefits can be compounded by reusing that space with health-enhancing features, for example, active travel infrastructure.78
Despite traffic, people cycling are exposed to less pollution than those driving. A study found that cyclists could travel faster than cars and were exposed to less pollution as a result.79 Even in cities and towns with poor air quality, it is still better for health to cycle in the pollution than not to cycle.80 In fact, a study showed that stopping cycling when pollution is bad had no positive impact on a person’s health.81
9 Set children up for a brighter future
Over decades children have becoming less active. In 2025, half of all children did not achieve the recommended minimum amount of daily physical activity.82 More than one in five children in the last year of primary school are overweight.
“Active children are healthy, happy, school ready and sleep better.”
Four Chief Medical Officers
Every day active travel is one of the easiest ways to weave physical activity into daily life and turn this picture around.
As the four Chief Medical Officers for the UK’s nations write, “In children and young people, regular physical activity is associated with improved learning and attainment, better mental health and cardiovascular fitness, also contributing to healthy weight status.”83
A study of over 8,000 UK children found those who switched to active transport between the ages of 7 and 14 had lower body mass index and healthier body weights than those who continued to travel by car. A greater number of children from lower-income households walked or cycled to school.84
Enabling children to be active, cycling on safe welcoming local streets, and in public spaces should be part of a happy childhood.
People agree that cycling infrastructure separated from traffic is needed to enable children to cycle – and give parents confidence to let their children out on bikes.85
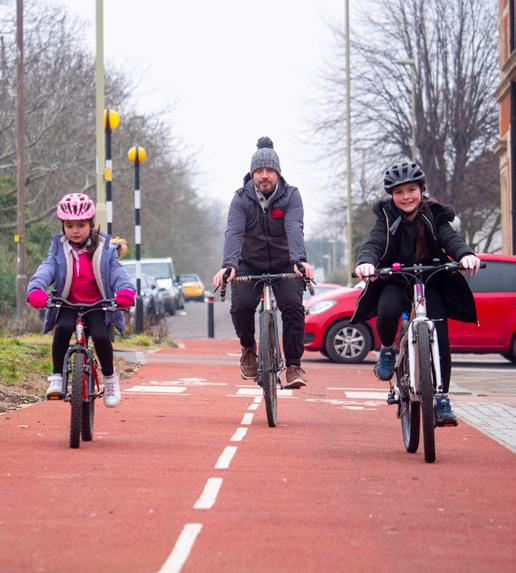
One of Walk Wheel Cycle Trust’s benchmarks for a cycle route is whether a 12-year-old child can cycle safety.86 Unfortunately, in 2018, up to two in every five miles of the National Cycle Network was found to be unsafe and requiring mitigation work.87 High quality cycle infrastructure enables children to cycle and many groups are calling for this across the UK.88
10 Help people age well
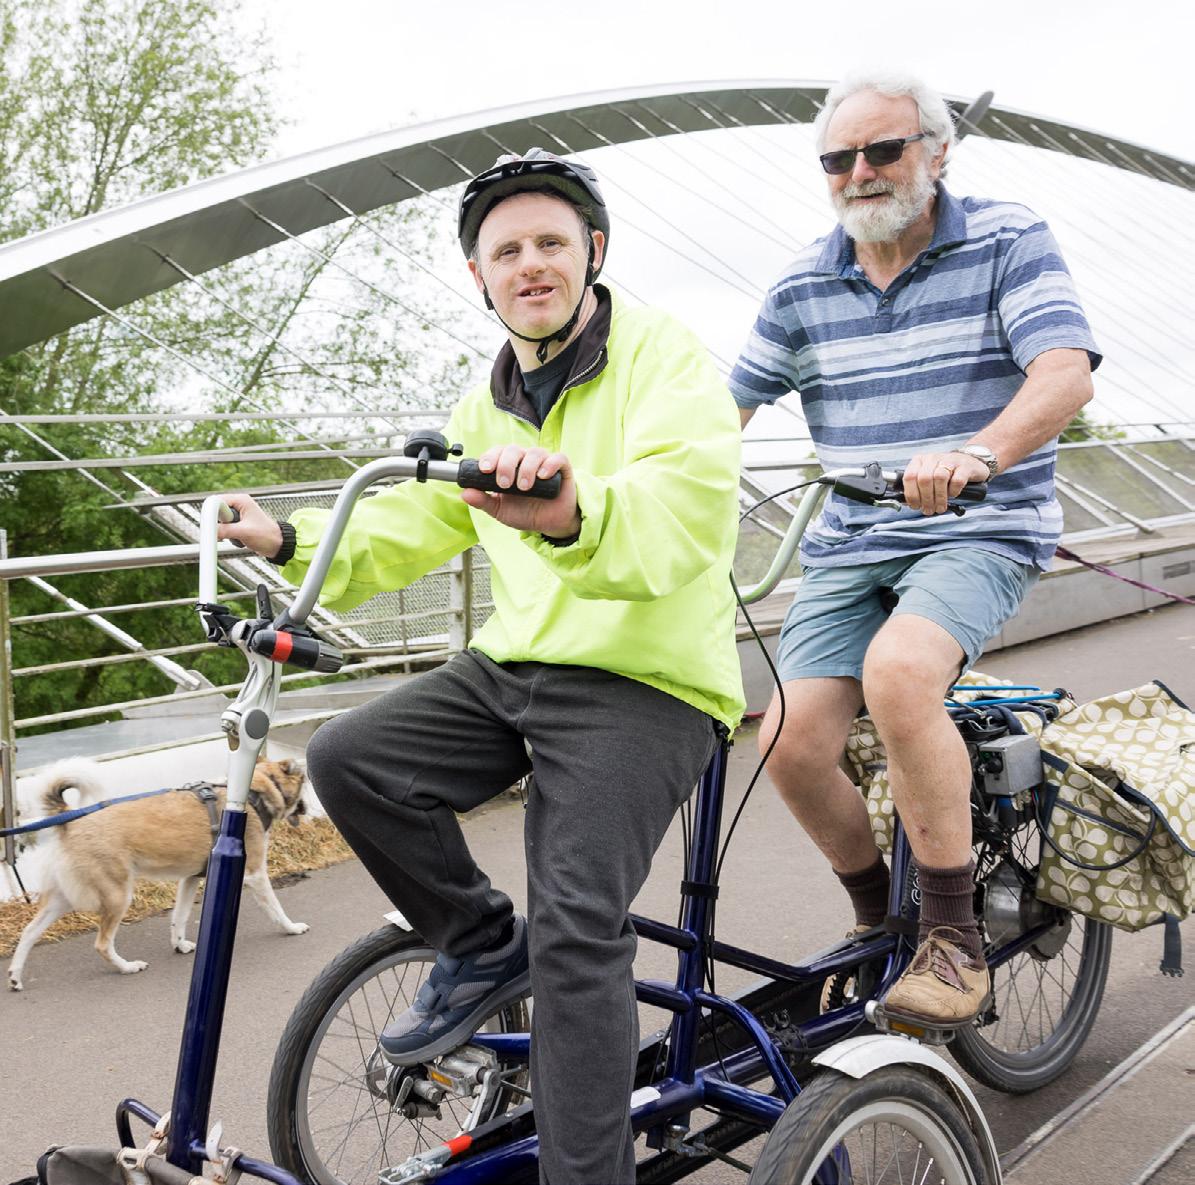
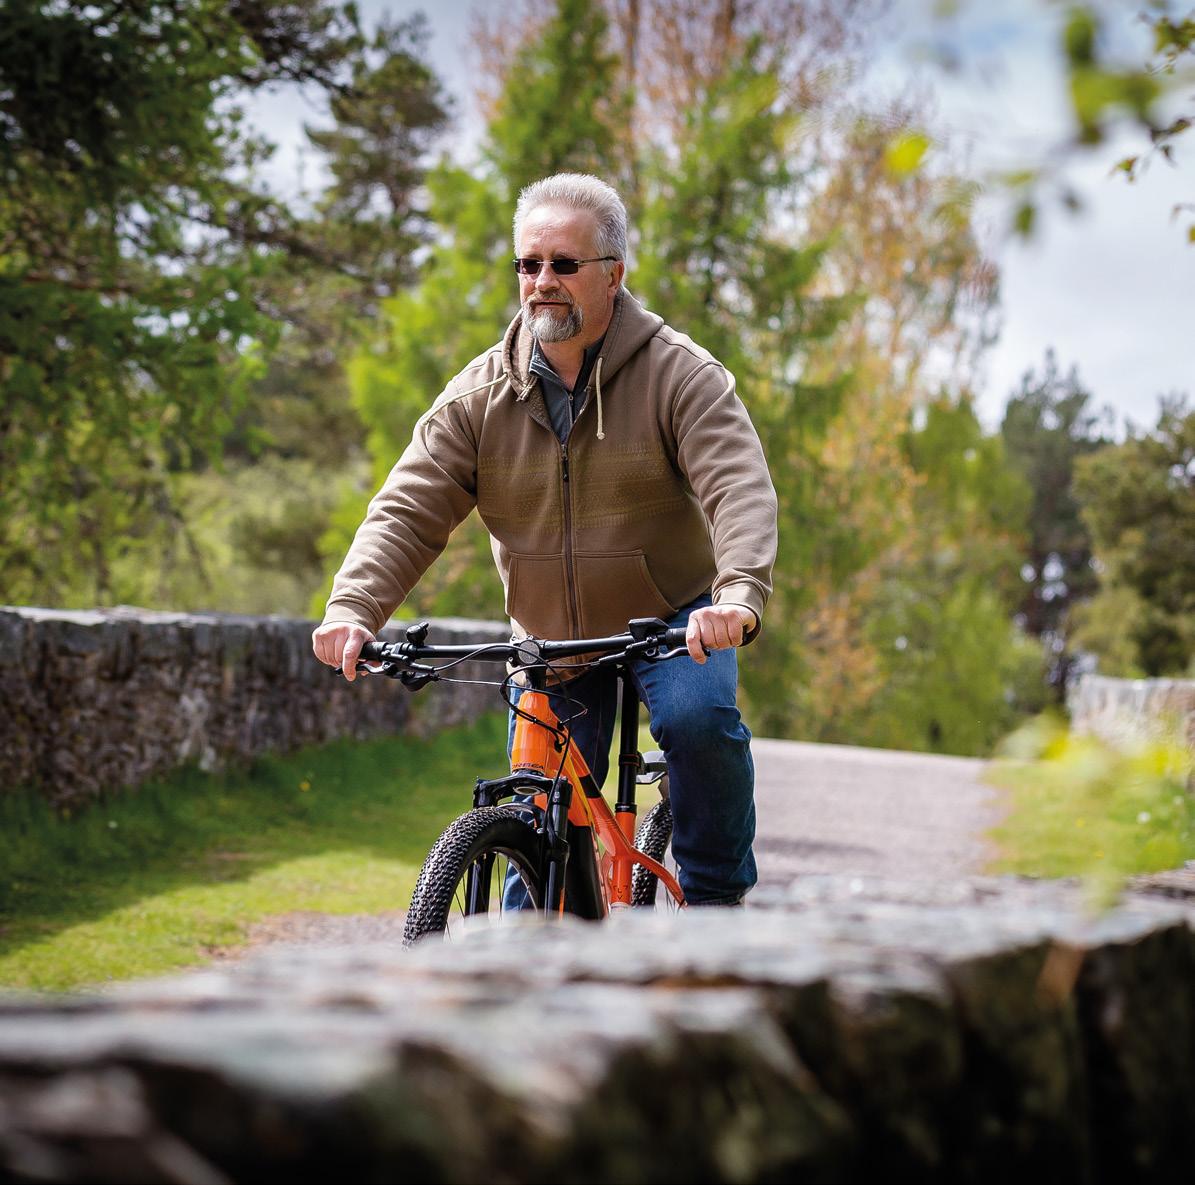
Cycling can extend life expectancy but perhaps more importantly, cycling can enhance quality of life for older people by improving health and wellbeing.89,90 As a low impact activity, cycling is recommended for older people as it has positive effects on health, as well as on social inclusion.91
E-bikes are proving beneficial for older people helping them to cycle further and to experience the freedom of
cycling. In general, people who switch to e-bikes more than double their use of bikes for transport.92
Investment in cycling and cycling infrastructure can giver older people a new lease of life, reduce isolation, help maintain physical activity and reduce pressure on health services.
Improving our environment
Cycling has long been understood as environmentally friendly way to travel. With the onset of e-bikes and e-cargo bikes expanding the opportunities to shift travel for families, businesses and older people, so too as the potential for emissions cuts.
11 Cut air pollution
Despite recent progress, road-traffic continues responsible for a significant amount of air pollution where most people live. As the Royal College of Physicians (RCP) state “… there is no safe level of air pollution, and increasingly ambitious action needs to be taken to improve air quality across the country to reduce avoidable deaths and improve the health of our population.”93
Cycling is truly a zero-emission form of transport. Replacing short car trips with cycling reduces the pollution.
A study of five cities showed that a shift from private motor car use to cycling produced significant reductions in the emissions of air pollutants, improved air quality and health outcomes.94 A conclusion of the Royal College of Physicians is that governments need to deliver the infrastructure needed for increased active travel, aiming for half of all of urban journeys being active by 2030.95
12 Cut carbon pollution
Domestic transport remains the UK’s single largest source of carbon pollution, responsible for a third of emissions (31%).96 Despite the gradual electrification of the vehicle fleet, the pace of change requires further action to change behaviours in line with European peers. The Climate Change Committee ‘balanced pathway’ includes a 4% shift away from cars by 2030 and 7% by 2035.97 Shifting from car to bike use ‘drastically lowers’ carbon emissions – a switch of one journey per day reduces a person’s carbon footprint by approximately 0.5 tonnes over a year, “a substantial share of average per capita CO2 emissions from transport.”98
Cycling and active travel infrastructure are an essential part of the mix of solutions to decarbonising transport and ensuring carbon reduction targets are met. This includes longer distance ‘superhighways’ which can speed up active travel journeys and make cycling more convenient than driving100 and the promotion of e-bikes. Analysis suggests e-bikes have the capability to reduce car CO2 emissions by 24.2m tonnes per year in England, with the greatest per capita emissions reductions from residents of rural areas and the rural urban fringe (750kg CO2 per person per year).101
Reducing carbon emissions – how does enabling cycling compare?
Cycling a 2.5-mile (20min) commute and back, instead of driving
Switching to a renewable energy provider, per person
Retrofitting insulation to an average home, per person
Planting 10 trees (once fully grown)
Recommendations
To unlock the benefits outline in this report, governments need to provide:
1. Sufficient funding: Ramping up investment in walking, wheeling and cycling to a sustained, cumulative £50 per person per year, to transform our streets and roads, and to support people with skills and confidence to cycle and use the cycling infrastructure. Total funding for the whole of England outside London would equate to a quarter of the projected cost of the Lower Thames Crossing, or one-tenth of the Department for Transport’s annual spending (excluding HS2). For the populations of Scotland, Wales and Northern Ireland, the figure equates to one per cent of devolved government budgets, respectively.2
2. High quality standards: Including statutory guidance that helps local transport authorities and developers design quality schemes that are consistent across the UK, building capacity and capability at a local level. First-rate schemes are vital to attract people new to cycling and ensure everyone’s safety.
Conclusion
This report has brought together evidence around the benefits of cycling and separated cycling infrastructure, showing how cycling: Boost safety and confidence, cuts the cost of living and is a core building block for better public health. We know it is in demand, and when good infrastructure has been built, it gets used.
The economy stands to benefit in its own terms with cycling viewed as a space-efficient mass-transit system, contributing to productivity improvements in our cities and towns.
What’s more, cycling infrastructure is ‘quick’ to deliver at a lower cost than many public infrastructure options.
For local economies, the most popular high streets and town-centres are those which prioritise people over traffic, for which cycling infrastructure can be designed in.
For a country facing the health costs of obesity and physical inactivity, cycling is a mode of active travel
3. Clear and ambitious targets: Providing vision and driving progress, governments should set stretching targets, backed by monitoring and evaluation to assess progress and capture lessons learned. Monitoring and targets should be disaggregated by age, sex, race, ethnicity and disability to ensure benefits are shared equitably, including national indicators for active travel at local authority level in each UK nation.
4. Political leadership: Leading the cultural change required to put cycling on equal footing with other modes of transport, helping to normalise active travel, communicating changes required, and consulting positively with communities.
that weaves exercise unnoticeably into everyday life, boosting productivity and longevity while cutting sickness and ill-health.
It does all the above without contributing to air pollution or greenhouse gas emissions beyond the energy and materials to make them, and the logistics that bring a cycle to market.
Which is why, we recommend:
1. Sufficient funding
2. High quality standards
3. Clear and ambitious targets
4. Political leadership
Taken together, this shows the case for getting there with cycling is stronger than ever.
Frontier Economics (2022) Estimating The Full Costs of Obesity: A report for Novo Nordisk. Available at: https://www.frontier-economics.com/media/hgwd4e4a/the-fullcost-of-obesity-in-the-uk.pdf (Accessed: 20 April 2026)
2Royal College of Physicians (2025) A breath of fresh air: Responding to the health challenges of modern air pollution. Available at: https://www.rcp.ac.uk/policy-andcampaigns/policy-documents/a-breath-of-fresh-air-responding-to-the-healthchallenges-of-modern-air-pollution/
3Friel, C., et al. (2024) ‘Health benefits of pedestrians and cyclists commuting: evidence from the Scottish Longitudinal Study’, BMJ Public Health, https://doi.org/10.1136/ bmjph-2024-001295
4Great Britain. Department for Energy Security & Net Zero (2025) 2024 UK greenhouse gas emissions: provisional figures – statistical summary. Available at: https://www.gov. uk/government/statistics/provisional-uk-greenhouse-gas-emissions-statistics-2024 (accessed 20 April 2026)
5Inrix (2025) INRIX 2025 Global Traffic Scorecard: Traffic Jams Ease Across the U.K. as London Delays Fall 10 Percent, Available at: https://inrix.com/press-releases/2025global-traffic-scorecard-uk/ (Accessed 20 April 2026)
6Ibid.
7Cycling UK (2017) Space for Cycling – Guide for decisionmakers, Available at: https:// www.cyclinguk.org/sites/default/files/document/2017/10/space_for_cycling_guide_ for_decision_makers.pdf (accessed: 20 April 2026)
8Walk Wheel Cycle Trust (undated) ‘Walking and cycling infrastructure design guidance: Current guidance and best practice’, Available at: https://www.Walk Wheel Cycle Trust. org.uk/for-professionals/infrastructure/walking-and-cycling-infrastructure-designguidance (accessed 20 April 2026)
9Pooley, et al. (2011) Understanding walking and cycling: summary of key findings and recommendations, Engineering and Physical Sciences Research Council, University of Leeds, Oxford Brookes University and Lancaster University, available at: https://www.its. leeds.ac.uk/fileadmin/user_upload/UWCReportSept2011.pdf (accessed: 20 April 2026)
10Transport for London (2025) ‘New TfL data shows the number of daily cycling journeys in London has risen by 43 per cent since 2019’, 25 November 2025, available at: https:// tfl.gov.uk/info-for/media/press-releases/2025/november/new-tfl-data-shows-thenumber-of-daily-cycling-journeys-in-london-has-risen-by-43-per-cent-since-2019 (accessed: 20 April 2026)
11Adams, T. and Aldred, R. (2020) ‘Cycling Injury Risk in London: Impacts of Road Characteristics and Infrastructure’, Transport Findings. Available at: https:// findingspress.org/article/18226-cycling-injury-risk-in-london-impacts-of-roadcharacteristics-and-infrastructure (accessed 20 April 2026)
12Adams, T. and Aldred, R. (2020) ‘Cycling Injury Risk in London: Impacts of Road Characteristics and Infrastructure’, Transport Findings. Available at: https:// findingspress.org/article/18226-cycling-injury-risk-in-london-impacts-of-roadcharacteristics-and-infrastructure (accessed 20 April 2026)
13Adams, T. and Aldred, R. (2020) ‘Cycling Injury Risk in London: Impacts of Road Characteristics and Infrastructure’, Transport Findings. Available at: https:// findingspress.org/article/18226-cycling-injury-risk-in-london-impacts-of-roadcharacteristics-and-infrastructure (accessed 20 April 2026)
14Deans, D. (2025) ‘First 20mph year sees 100 fewer killed or badly hurt’, BBC news, 30 January 2025. Available at: https://www.bbc.co.uk/news/articles/c78w1891z03o (accessed 20 April 2026)
15Rosen E. and Sander, U., (2009) ‘Pedestrian fatality risk as a function of car impact speed’, Accident, analysis and prevention, 41 (3) 536–542. Available at: https://doi. org/10.1016/j.aap.2009.02.002
16United States. Department of Transportation (1999) Literature Review on Vehicle Travel Speeds and Pedestrian Injuries
17Salutin, G. (2023) Getting the measure of transport poverty: Understanding and responding to the UK’s hidden crisis, Social Market Foundation, available at: https://www. smf.co.uk/publications/transport-poverty-hidden-crisis/ (accessed 15/04/2026)
18Office for National Statistics (2025) Family spending in the UK: April 2023 to March 2024, 10 September 2025, available at: https://www.ons.gov.uk/ peoplepopulationandcommunity/personalandhouseholdfinances/expenditure/ bulletins/familyspendingintheuk/april2023tomarch2024#family-spending-in-the-uk (accessed 15/04/2026)
19Office for National Statistics (2025) Family spending in the UK: April 2023 to March 2024, 10 September 2025, available at: https://www.ons.gov.uk/ peoplepopulationandcommunity/personalandhouseholdfinances/expenditure/ bulletins/familyspendingintheuk/april2023tomarch2024#family-spending-in-the-uk (accessed 15/04/2026)
20Mattioli, G. (2017) ‘’Forced Car Ownership’ in the UK and Germany: Socio-Spatial Patterns and Potential Economic Stress Impacts’, Social Inclusion, 5(4), pp. 147-160, DOI: 10.17645/si.v5i4.1081
21Walk Wheel Cycle Trust (2016) Transport Poverty in Scotland, Available at: https://www. Walk Wheel Cycle Trust.org.uk/media/2880/transport_poverty_in_scotland_2016.pdf (accessed: 20 April 2026)
22Great Britain. Department for Transport (2025) NTS 2024: Household car availability and trends in car trips, London: Department for Transport, available at: https://www.gov. uk/government/statistics/national-travel-survey-2024/nts-2024-household-caravailability-and-trends-in-car-trips (accessed 20 April 2026)
23Public Health Scotland (2022) Road space reallocation in Scotland: a health impact assessment, available: https://www.publichealthscotland.scot/media/12261/roadspace-reallocation-in-scotland-a-health-impact-assessment.pdf (accessed: 20 April 2026)
24Le Gouais, A., et al. (2021) ‘A natural experimental study of new walking and cycling infrastructure across the United Kingdom: The Connect2 programme’, Journal of Transport & Health, 20, 100968, available at: https://www.sciencedirect.com/science/ article/pii/S2214140520301729?via%3Dihub (accessed: 20 April 2026)
25Great Britain. Department for Transport (2026) Better Connected: A Strategy for Integrated Transport, London: Department for Transport, available at: https://assets. publishing.service.gov.uk/media/69ce2f0bb5210036050bc6d7/dft-betterconnected-strategy.pdf
26Climate Outreach (2024) ‘Investment in active travel is popular: most people want more options for walking, wheeling and cycling’ Climate Outreach 24 October 2024, available at: https://climateoutreach.org/active-travel-is-popular-walking-cycling/ 27James, E. and Hawkins, N. (2024) ‘Investment in active travel is popular: most people want more options for walking, wheeling and cycling’, Climate Outreach 24 October 2024, available at: https://climateoutreach.org/active-travel-is-popular-walkingcycling/ (accessed 20 April 2026)
28Walk Wheel Cycle Trust (2026) Walking and Cycling Index 2025: UK report. Available at: https://www.walkwheelcycletrust.org.uk/the-walking-and-cycling-index/ (accessed: 20 April 2026)
29Progressive, Cycling Scotland (2023), Attitudes and Behaviours toward Cycling in Scotland – Wave 5, November 2023, p22, available at: https://cycling.scot/media/ eqyfwy3r/cycling-attitudes-and-behaviours-wave-5-2023-main-data.pdf
30YouGov / Cycling UK (unpublished) Survey results, 1092 adults in Wales 2-9 February 2026
31Climate Barometer (2023) ‘Tracker data: Public support for low traffic neighbourhoods is higher than MPs’, available at: http://climatebarometer.org/topic/clean-airzones/#module-2584 (Accessed: 20 April 2026)
32Massey-Chase, B., Akehurst, S., and Alvis, S. (2026) Apathy and opposition: Understanding the real threats to Net Zero, Institute for Public Policy Research, Available at: https://www.ippr.org/articles/apathy-and-opposition?x-craft-preview=8c54a 3c0511bff3a46150a1f1f0be913cc0e2b2b8414636ed7a172c42c0cbe52axvhhqlmgx (accessed: 20 April 2026)
33Duncan, E. (2026) ‘Low-traffic schemes aren’t so toxic, after all’, The Times, 09 April 2026, available at: https://www.thetimes.com/article/75b6d332-c5d6-4eaf-935d9d51caf5815d?shareToken=4843be3cc2d1e0f1c042aba5d96679ea (accessed: 15/04/2026)
34James Williams, A. et al (2022) ‘Public attitudes to, and perceived impacts of 20mph (32 km/h) speed limits in Edinburgh: An exploratory study using the Speed Limits Perceptions Survey (SLiPS)’, Transportation Research Part F: Traffic Psychology and Behaviour, 84. Available at: https://doi.org/10.1016/j.trf.2021.11.022
35Great Britain. Department for Transport (2018) 20mph research study: process and impact evaluation, p. 7. Available at: https://www.gov.uk/government/publications/20mph-speed-limits-on-roads
36Great Britain. Department for Transport (2014) National Travel Survey Factsheet: Trip Chaining 2002-2014, Available at: https://assets.publishing.service.gov.uk/ government/uploads/system/uploads/attachment_data/file/509447/nts-trip-chaining. pdf (accessed: 20 April 2026)
37Banfield-Nwachi, M. (2025) ‘Women put off cycling by safety fears and intimidatingdrivers – study’ The Guardian, 31 March 2025, available at: https://www. theguardian.com/news/2025/mar/31/women-put-off-cycling-by-safety-fears-andintimidating-driversstudy (last accessed 02/12/2025)
38YouGov / Cycling UK unpublished).
39Aldred, R. (2016) ‘Cycling near misses: Their frequency, impact, and prevention’ Transportation Research Part A: Policy and Practice, 90, pp. 69-83
2
40Le Gouais, A., et al. (2021) ‘A natural experimental study of new walking and cycling infrastructure across the United Kingdom: The Connect2 programme’, Journal of Transport & Health, 20, 100968, available at: https://www.sciencedirect.com/science/ article/pii/S2214140520301729?via%3Dihub (accessed: 20 April 02026)
41Glasgow City Council (2026) Cycling surges as new data shows Glasgow’s routes driving record growth. Available at: https://www.glasgow.gov.uk/article/14841/Cyclingsurges-as-new-data-shows-Glasgow-s-routes-driving-record-growth (accessed: 20 April 2026)
42Robinson, J. (2018) ‘Cycle-commuters passing through Embankment and Blackfriars hits 1 million since February’, Cyclist, 26 June. Available at: https://www.cyclist.co.uk/ news/4891/cyclists-passing-through-embankment-and-blackfriars-hits-1-millionsince-february (accessed: 20 April 2026)
43Lydall, R. (2019) ‘Cycling in London at record levels, new figures reveal’, Evening Standard, 03 July, available at: https://www.standard.co.uk/news/london/cycling-inlondon-at-record-levels-according-to-new-figures-a4181176.html
44Transport for London (2025) ‘Travel in London 2025: Annual Overview.’ Available at: https://board.tfl.gov.uk/documents/s25367/board-20251203-item08bAppendix%201%20travel-in-london-2025-report.pdf (accessed 06 May 2025)
45Broach, J., Dill, J. and Gliebe, J. (2012) ‘Where do cyclists ride? A route choice model developed with revealed preference GPS data’ Transportation Research Part A: Policy and Practice 46(10), pp. 1730-1740. Available at: https://www.sciencedirect.com/ science/article/abs/pii/S0965856412001164 (accessed: 20 April 2026)
46Densham, J. (2020)’ Increased cycling during Scotland’s lockdown proves surveys right’ Cycling UK Blog, 09 July. Available at: https://www.cyclinguk.org/blog/increasedcycling-during-scotlands-lockdown-proves-surveys-right (accessed: 20 April 2026)
47Wills, A. (2020) ‘Third of people agree they could ditch the car in favour of cycling’, Cycling UK Blog, 18 May. Available at: https://www.cyclinguk.org/press-release/thirdpeople-agree-they-could-ditch-car-favour-cycling (accessed 20 April 2026)
48Van der Zee, R. (2015) ‘How Amsterdam became the bicycle capital of the world’ The Guardian 5 May, Available at: https://www.theguardian.com/cities/2015/may/05/ amsterdam-bicycle-capital-world-transport-cycling-kindermoord (accessed: 20 Apri 2026)
49Copenhagenize Index 2025 (2025) Copenhagen. Available at: https:// copenhagenizeindex.eu/index.php/project/copenhagen/ (accessed 20 April 2026)
50Verma, P, Lopez Valderrama, J. S., Pardo, C., (2015) Bicycle Account Bogota 2014, Despacio. Available at: https://despacio.org/wp-content/uploads/2015/01/BicycleAccount-BOG-2014-20150109-LR.pdf (accessed: 20 April 2026)
51Marquez, R. Hernandez-Herrador, V., Calvo-Salazar, M., Garcia-Cebrain, J. A. (2015), ‘How infrastructure can promote cycling in cities: Lessons from Seville’,Research in Transportation Economics 53, pp. 31-44. Available at:https://www.sciencedirect.com/ science/article/abs/pii/S073988591500061X (accessed: 20 April 2026)
52Walker, P. (2015) ‘How Seville transformed itself into the cycling capital of southern Europe’, The Guardian 28 January. Available at: https://www.theguardian.com/ cities/2015/jan/28/seville-cycling-capital-southern-europe-bike-lanes (accessed: 20 April 2026)
53Davis, A. (2019) ‘Essential Evidence 4 Scotland No 18: Does building cycle networks lead to more and safer cycling?’ Transport Research Institute Edinburgh Napier University. Available at: https://blogs.napier.ac.uk/tri/wp-content/uploads/sites/56/2019/11/ Essential-Evidence-4-Scotland-No-18-Cycling-safety-growth-through-buildingcycle-networks.pdf (accessed 20 April 26)
54Rodrigues, G., Breach, A. (2021) Measuring up: Comparing public transport in the UK and Europe’s biggest cities, London: Centre for Cities, Available at: https://www. centreforcities.org/reader/measuring-up-comparing-public-transport-uk-europecities/ (accessed: 20 April 2026)
55Inrix (2025) INRIX 2025 Global Traffic Scorecard: Traffic Jams Ease Across the U.K. as London Delays Fall 10 Percent, Available at: https://inrix.com/press-releases/2025global-traffic-scorecard-uk/ (Accessed 20 April 2026)
56Create Streets (2024) Move Free: Why and how making it easy to get about towns and cities in as many ways as possible boosts prosperity, high streets and freedom, happiness, health and house-building, available at: https://www.createstreets.com/wpcontent/uploads/2025/06/Move-Free.pdf
57Walk Wheel Cycle Trust (2017) Bike Life Summary Report, p.2. available at: https://www. walkwheelcycletrust.org.uk/media/2953/bike-life-2017-summary-report.pdf
58Walker, P. (2016) ‘Cycle lanes don’t cause traffic jams: they’re part of the solution’, 6 October 2016, The Guardian https://www.theguardian.com/environment/bikeblog/2016/oct/06/cycle-lanes-dont-cause-traffic-jams-theyre-part-of-the-solution
59Rajé, F. and Saffrey, A., (undated) The value of cycling, University of Birmingham and Phil
Jones Associates for the Department of Transport, available at:https://assets.publishing. service.gov.uk/government/uploads/system/uploads/attachment_data/file/509587/ value-of-cycling.pdf (accessed: 20 April 2026)
60Great Britain. Department for Transport (2014) Claiming the Health Dividend: A summary and discussion of value for money estimates from studies of investment in walking and cycling, Available at: https://assets.publishing.service.gov.uk/government/uploads/ system/uploads/attachment_data/file/371096/claiming_the_health_dividend.pdf (accessed: 20 April 2026)
61Great Britain. Government Office for the South West and Department of Health (2010) Value for Money: An Economic Assessment of Investment in Walking and Cycling, Available at: https://bikehub.ca/sites/default/files/ valueformoneyaneconomicassessmentofinvestmentinw.pdf (accessed 20 April 2026)
62Create Streets (2024) Move Free: Why and how making it easy to get about towns and cities in as many ways as possible boosts prosperity, high streets and freedom, happiness, health and house-building, available at: https://www.createstreets.com/wpcontent/uploads/2025/06/Move-Free.pdf (accessed: 20 April 2026)
63Blondiau, T., van Zeebroeck, B., Haubold, H. (2016) ‘Economic benefits of increased cycling’, Transportation Research Procedia 14, pp. 2306 – 2313
64Transport for London (undated) Walking and cycling: the economic benefits, Available at: https://content.tfl.gov.uk/walking-cycling-economic-benefits-summary-pack.pdf (accessed 20 April 2026)
65Walk Wheel Cycle Trust (2019) Common Misconceptions of Active Travel Investment available at: https://www.walkwheelcycletrust.org.uk/media/5224/commonmisconceptions-of-active-travel-investment.pdf (accessed: 20 April 2026)
66Walk Wheel Cycle Trust (2019) Common Misconceptions of Active Travel Investment available at: https://www.walkwheelcycletrust.org.uk/media/5224/commonmisconceptions-of-active-travel-investment.pdf (accessed: 20 April 2026)
67Dundee & Angus Chamber of Commerce (2020) Union Street Success. Available at: https://www.dundeeandanguschamber.co.uk/news/article/8733/union-streetsuccess# (accessed: 20 April 2026)
68Walk Wheel Cycle Trust (2019) Common Misconceptions of Active Travel Investment available at: https://www.walkwheelcycletrust.org.uk/media/5224/commonmisconceptions-of-active-travel-investment.pdf (accessed: 20 April 2026)
69World Health Organisation (2021) Promoting cycling can save lives and advance health across Europe through improved air quality and increased physical activity, 3 June 2021, available at: https://www.who.int/europe/news/item/03-06-2021-promoting-cyclingcan-save-lives-and-advance-health-across-europe-through-improved-air-qualityand-increased-physical-activity (accessed: 20 April 2026)
70Public Health England (2016) Working together to promote active travel: a briefing for local authorities, available at: https://assets.publishing.service.gov.uk/government/uploads/ system/uploads/attachment_data/file/523460/Working_Together_to_Promote_Active_ Travel_A_briefing_for_local_authorities.pdf (last accessed 28 April 2026)
71England. Public Health England (2018) Cycling and walking for individual and population health benefits: A rapid evidence review for health and care system decision-makers, PHE Publications, 2018. Available at: https://assets.publishing.service.gov.uk/ media/5bf41840e5274a2af47c464e/Cycling_and_walking_for_individual_and_ population_health_benefits.pdf (accessed 20 April 2026)
72United Kingdom. Department of Health and Social Care, Llwodraeth Cymru/Welsh Government,Department of Health Northern Ireland, and the Scottish Government (2019) UK Chief Medical Officers Physical Activity Guidelines. Available at: https://assets. publishing.service.gov.uk/media/5d839543ed915d52428dc134/uk-chief-medicalofficers-physical-activity-guidelines.pdf (accessed: 20 April 2026)
73Celis-Morales, C .A., Lyall, D. M., Welsh, P., Anderson, J., Steell, L., Guo Y., et al. (2017) ‘Association between active commuting and incident cardiovascular disease, cancer, and mortality: prospective cohort study’, BMJ 357, Available at: http://www.bmj.com/ content/357/bmj.j1456 (accessed: 20 April 2026)
74Rasmussen, Martin G et al. (2016) ‘Associations between Recreational and Commuter Cycling, Changes in Cycling, and Type 2 Diabetes Risk: A Cohort Study of Danish Men and Women’ PLOS Medicin, available at: http://journals.plos.org/plosmedicine/ article?id=10.1371/journal.pmed.1002076 (accessed 20 April 2026)
75Gordon-Larsen, P., Boone-Heinonen, J., Sidney, S., Sternfeld, B., Jacobs, DR Jr., Lewis, C.E (2009) ‘Active commuting and cardiovascular disease risk: the CARDIA study.’ Arch Intern Med. 2009 Jul 13;169(13):1216-23. Available at: https://pubmed.ncbi.nlm.nih. gov/19597071/ (accessed: 20 April 2026)
76Martin, A., Goryakin, Y., Suhrcke, M. (2014) ‘Does active commuting improve psychological wellbeing? Longditudinal evidence from eighteen waves of the British Household Panel Survey Preventive Medicine 69 pp296-303, available at: http://dx.doi. org/10.1016/j.ypmed.2014.08.023 (accessed 20 April 2026)
77Rabl, A., de Nazelle, A. (2012) ‘Benefits of shift from car to active transport’, Transport Policy, 19(1), pp. 121–131. Available at: http://www.sciencedirect.com/science/article/pii/ S0967070X11001119 (accessed: 20 April 2026)
78Scotland. Public Health Scotland (2022) Road space reallocation in Scotland: a health impact assessment. Available at: https://www.publichealthscotland.scot/media/12261/ road-space-reallocation-in-scotland-a-health-impact-assessment.pdf (accessed 20 April 2026)
79Tate, J., Godward, M. and Mounsor, D. (2018) ‘Exposure to the traffic-related air pollutants particle number and NO2 when commuting by modes: Walk, Cycle, Car and Bus’, Monitoring Ambient Air 2018: Development in Air Quality – Current Issues and New Technologies, Royal Society of Chemistry 11-12th December, London: Burlington House. Available at:https://www.slideshare.net/JamesTate22/exposure-to-the-trafficrelatedair-pollutants-particle-number-and-no2-when-commuting-by-modes-walk-cyclecar-and-bus (accessed 20 April 2026)
80Slawson, N. (2020) ‘Physical and mental health benefits of cycling outweigh dangers of air pollution research finds,’ Evening Standard. 17 August 2020. Available at: https:// www.standard.co.uk/optimist/theairwebreathe/cycling-physical-mental-healthbenefits-a4503346.html (Accessed 15/04/2026)
81Giallouros et al. (2020) ‘The long-term impact of restricting cycling and walking during high air pollution days on all-cause mortality: Health impact Assessment study’, Environment International, 140, 105679, Available at: https://www.sciencedirect.com/ science/article/pii/S0160412019337122 (accessed: 20 April 2026)
82Sport England (2025) Children’s activity levels rising by inactivity remains too high. Available at: https://www.sportengland.org/news-and-inspiration/childrens-activitylevels-rising-inactivity-remains-too-high (accessed 28 April 2026)
83United Kingdom. Department of Health and Social Care, Llwodraeth Cymru/Welsh Government, Department of Health Northern Ireland, and the Scottish Government (2019) UK Chief Medical Officers Physical Activity Guidelines. Available at: https://assets. publishing.service.gov.uk/media/5d839543ed915d52428dc134/uk-chief-medicalofficers-physical-activity-guidelines.pdf (accessed: 20 April 2026)
84Laverty A. A., Hone, T., Goodman A, et al (2021) ‘Associations of active travel with adiposity among children and socioeconomic differentials: a longitudinal study’ BMJ Open;11:e036041. doi: 10.1136/bmjopen-2019-036041
85Aldred, R. (2015) ‘Adults’ attitudes towards child cycling: a study of the impact of infrastructure’ European Journal of Transport and Infrastructure Research 52 (2), https:// doi.org/10.18757/ejtir.2015.15.2.3064
86Walk Wheel Cycle Trust (2018) Paths for everyone - review of the national cycle network, available at: https://www.walkwheelcycletrust.org.uk/media/2804/paths_for_ everyone_ncn_review_report_2018.pdf (accessed: 20 April 2026)
87BBC. https://www.bbc.co.uk/news/uk-46179270
88Densham, J. (2022) ‘How you can encourage more children to cycle’ Cycling UK Blog, 22 March. Available at: https://www.cyclinguk.org/blog/how-you-can-encourage-morechildren-cycle (accessed 20 April 2026)
89Utrecht University (2015) Dutch bikers live six months longer, 22 June. Available at: https://www.uu.nl/en/news/dutch-bikers-live-six-months-longer (accessed 20 April 2026)
90United Kingdom. Department of Health and Social Care, Llwodraeth Cymru/Welsh Government, Department of Health Northern Ireland, and the Scottish Government (2019) UK Chief Medical Officers Physical Activity Guidelines. Available at: https://assets. publishing.service.gov.uk/media/5d839543ed915d52428dc134/uk-chief-medicalofficers-physical-activity-guidelines.pdf (accessed: 20 April 2026)
91United Kingdom. Department of Health and Social Care, Llwodraeth Cymru/Welsh Government, Department of Health Northern Ireland, and the Scottish Government (2019) UK Chief Medical Officers Physical Activity Guidelines. Available at: https://assets. publishing.service.gov.uk/media/5d839543ed915d52428dc134/uk-chief-medicalofficers-physical-activity-guidelines.pdf (accessed: 20 April 2026)
92Fyhri, A. and Sundfør, H. B. (2020) ‘Do people who buy e-bikes cycle more?’ Transportation Research Part D: Transport and Environment 86 102422. Available at: https://www.sciencedirect.com/science/article/pii/S136192092030609X (accessed: 20 April 2026)
93Royal College of Physicians (2025) A breath of fresh air: responding to the health challenges of modern air pollution. Available at: https://www.rcplondon.ac.uk/policyand-campaigns/policy-documents/a-breath-of-fresh-air-responding-to-the-healthchallenges-of-modern-air-pollution/ (accessed: 20 April 2026)
94European Cyclist Federation (2014) Cycling and urban air quality: A study of European
experiences, Brussels: European Cyclists’ Federation asbl. Available at: https://www. researchgate.net/publication/280383184_Cycling_and_Air_Quality_A_study_of_ European_Experiences (accessed 20 April 26)
95Royal College of Physicians (2025) A breath of fresh air: responding to the health challenges of modern air pollution, available at: https://www.rcplondon.ac.uk/policyand-campaigns/policy-documents/a-breath-of-fresh-air-responding-to-the-healthchallenges-of-modern-air-pollution/
96Great Britain. Office for National Statistics (2025) Greenhouse gas emissions, UK: provisional estimates, 2024. Available at: https://www.ons.gov.uk/economy/ environmentalaccounts/bulletins/greenhousegasintensityprovisionalestimatesuk/2024 (Accessed 20 April 2026)
97Climate Change Committee (2025) The Seventh Carbon Budget, available at: https:// www.theccc.org.uk/publication/the-seventh-carbon-budget/ (accessed 20 April 2026)
98Brand, C., Götschi, T., Dons, E., Gerike, R., Anaya-Boig, E., Avila-Palencia, I., de Nazelle, A., Gascon, M., Gaupp-Berghausen, M., Iacorossi, F., Kahlmeier, S., Int Panis, L., Racioppi, F., Rojas-Rueda, D., Standaert, A., Stigell, E., Sulikova, S., Wegener, S. and Nieuwenhuijsen, M.J. (2021) ‘The climate change mitigation impacts of active travel: Evidence from a longitudinal panel study in seven European cities’ Global Environmental Change, 67: 102224. Available at: https://www.sciencedirect.com/science/article/abs/ pii/S0959378021000030?via%3Dihub
99Brand et al. (2021) ‘The climate change mitigation effects of daily active travel in cities’ Transportation Research Part D: Transport and Environment, 93, 102764 https://www. sciencedirect.com/science/article/pii/S1361920921000687?via%3Dihub
Good Energy. 2020. How much do you save in carbon emissions by being a Good Energy customer? https://www.goodenergy.co.uk/blog/2020/06/09/how-much-do-you-save-incarbon-emissions-by-being-a-good-energy-customer/
Webber et al, 2015. The impacts of household retrofit and domestic energy efficiency schemes: A large scale, ex post evaluation. Energy Policy, Volume 84, September 2015, Pages 35-43 https://www.sciencedirect.com/science/article/pii/S0301421515001706
100 Transport Scotland, 2021. https://www.transport.gov.scot/publication/ decarbonising-the-scottish-transport-sector/
101 Philips, I. Anable, J. and Chatterton, T. (2022) ‘E-bikes and their capability to reduce car CO2 emissions’, Transport Policy 116, pp. 11-23. Available at: https://www.sciencedirect. com/science/article/pii/S0967070X21003401 (accessed: 20 April 2026)