ProSTUD Motion Frame Connector cancels noise made by steel-to-steel contact. Ideal for both new construction and retrofits, it eliminates studs from the list of racket-causing culprits and helps deliver peace of mind. Learn more at clarkdietrich.com.
Publisher Vertical Urbanism is published by the Council on Vertical Urbanism (CVU).
As a platform for interdisciplinary discourse on the sustainable densification of cities, Vertical Urbanism solicits articles from diverse fields of expertise. Contributors are independent from CVU, unless explicitly stated otherwise. The opinions expressed by contributors are their own and do not represent CVU’s official stance nor carry its endorsement.
Submissions
We welcome content ideas from our readers. Please email submissions to dsafarik@cvu.org.
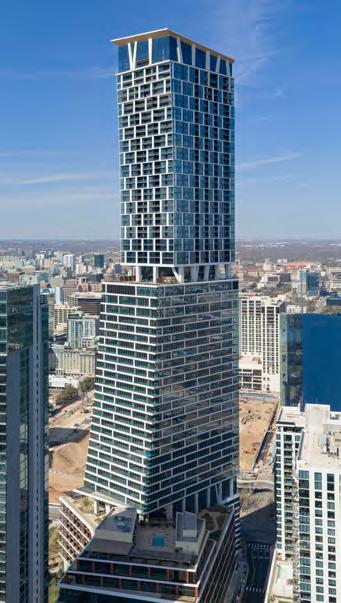
IF THE LAST FEW MONTHS building this issue have taught me anything, it’s that assumptions should never supplant direct observation or detailed discussions with those who live closest to the subject. We may assume, for instance, that the spirit of vertical urbanism has been crushed in Paris, where a 37-meter height ban, imposed in 1977, waived in 2010, and reimposed in 2023, has people lamenting that the just-topped-out 181-meter Tour Triangle will be the last skyscraper inside the Périphérique. Three Parisians with a long history of practice and pedagogy say non—see the essays on pages 22 and 26.
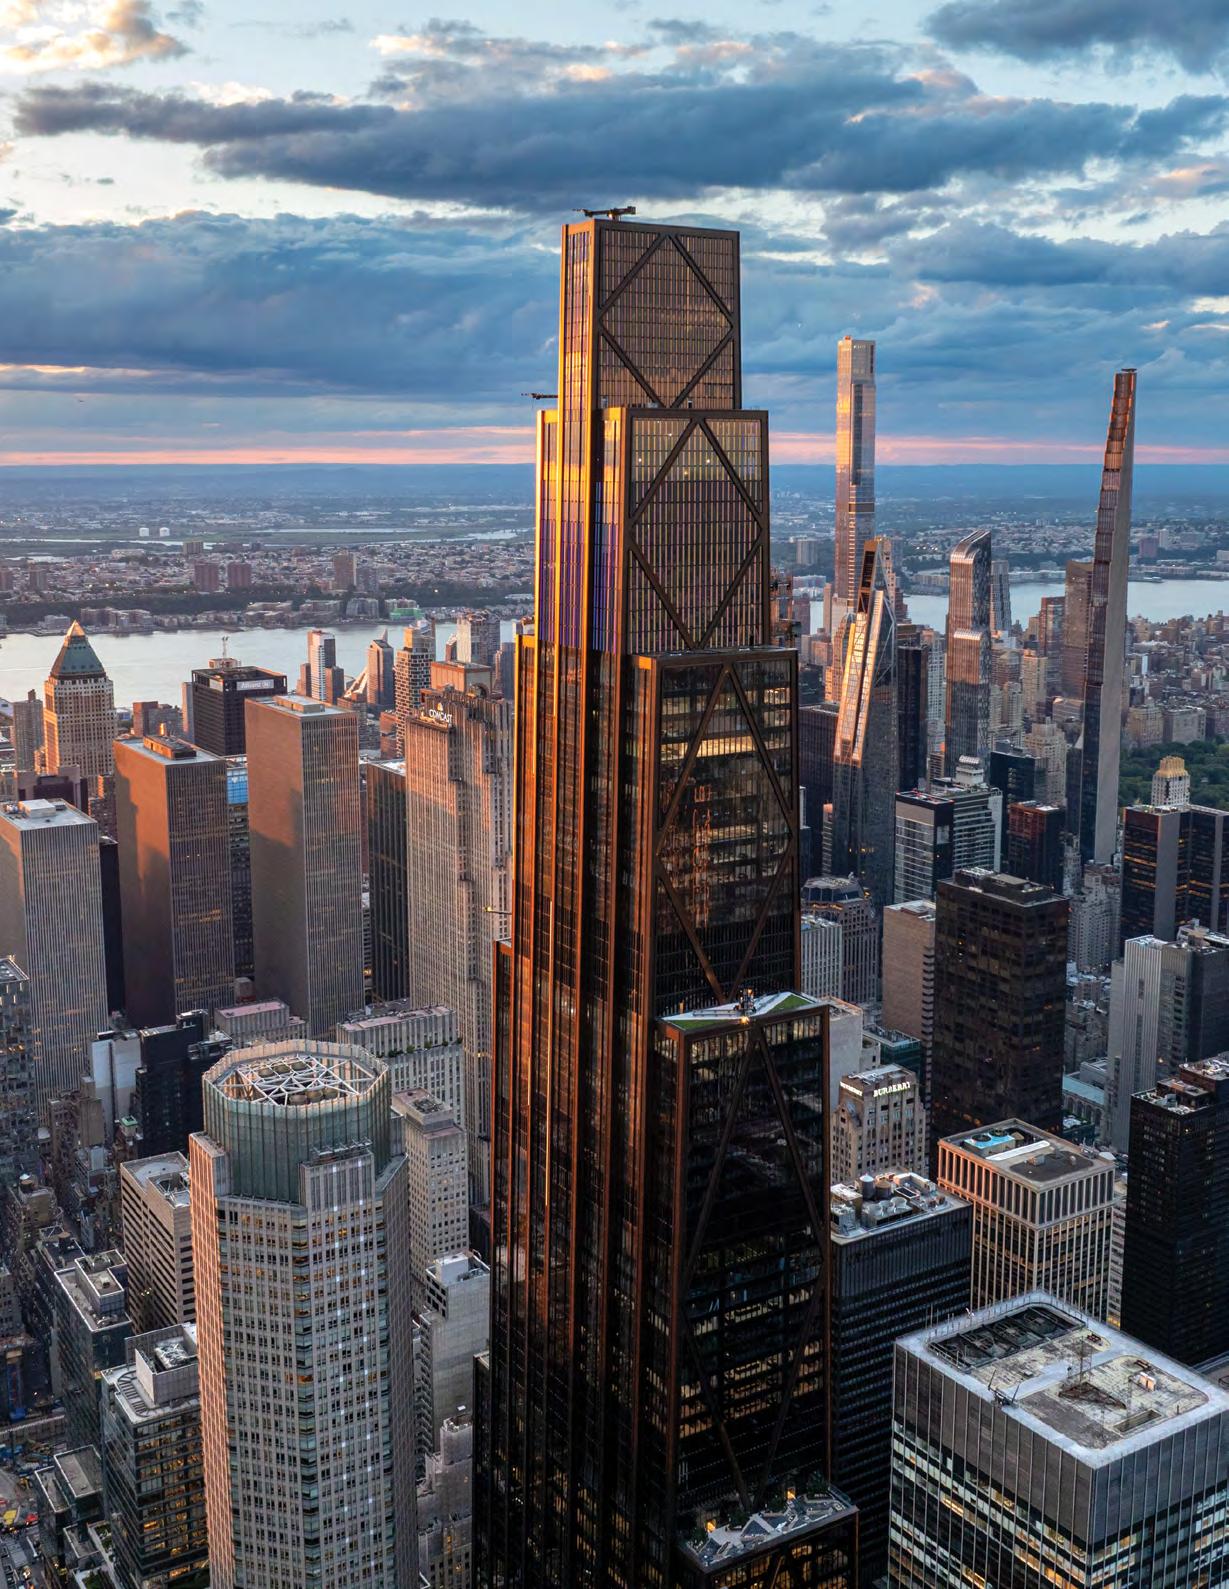
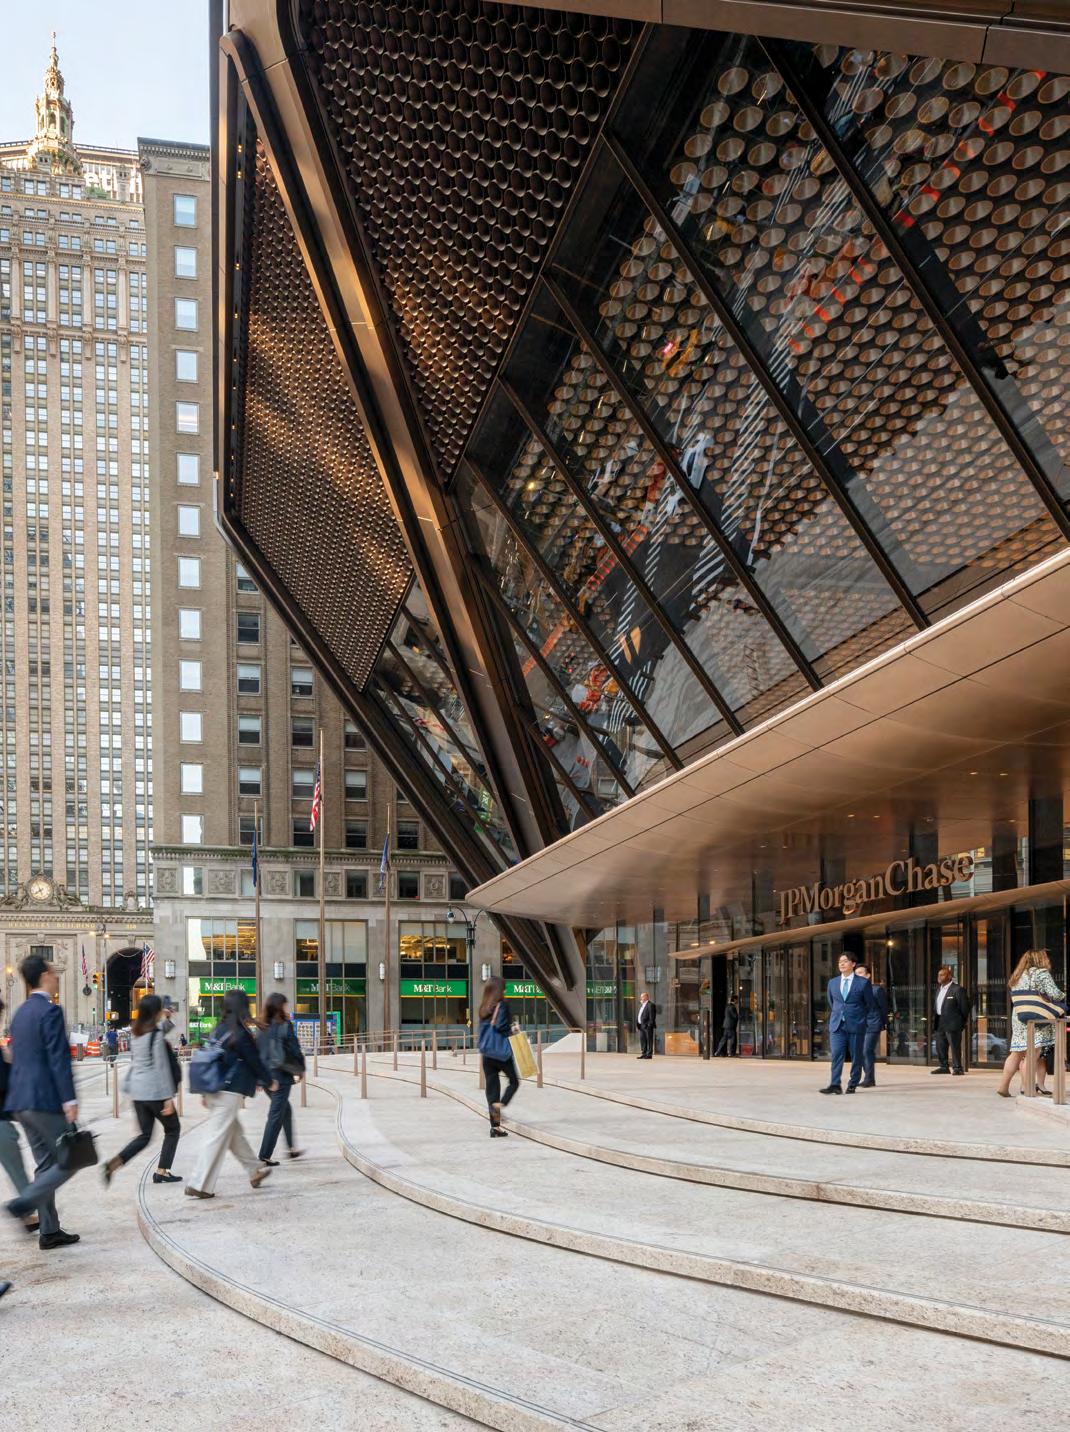
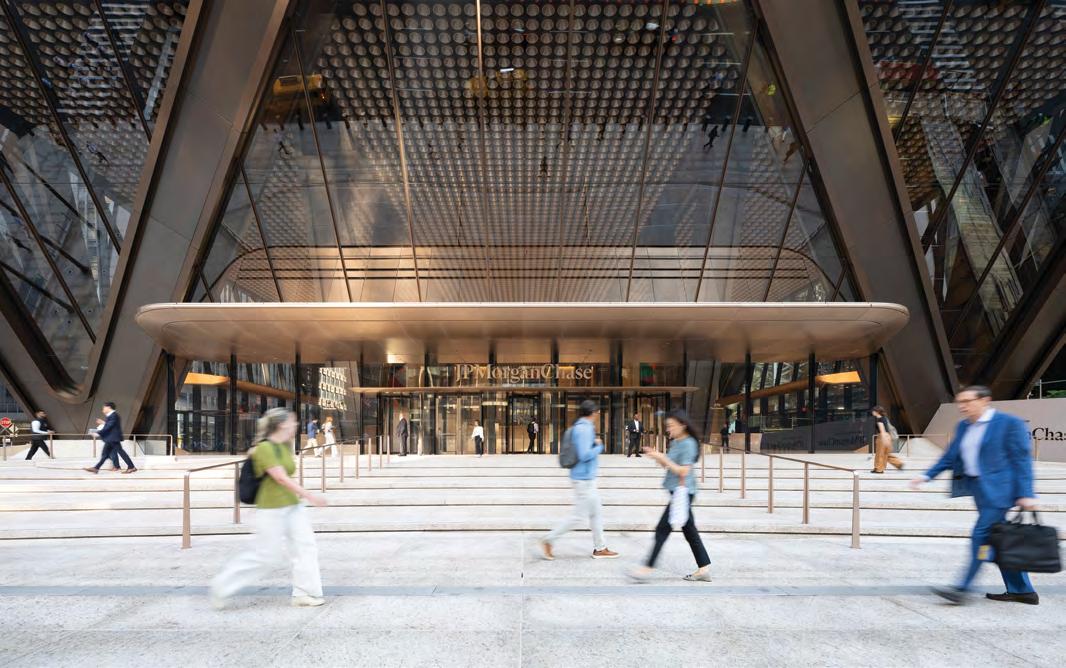
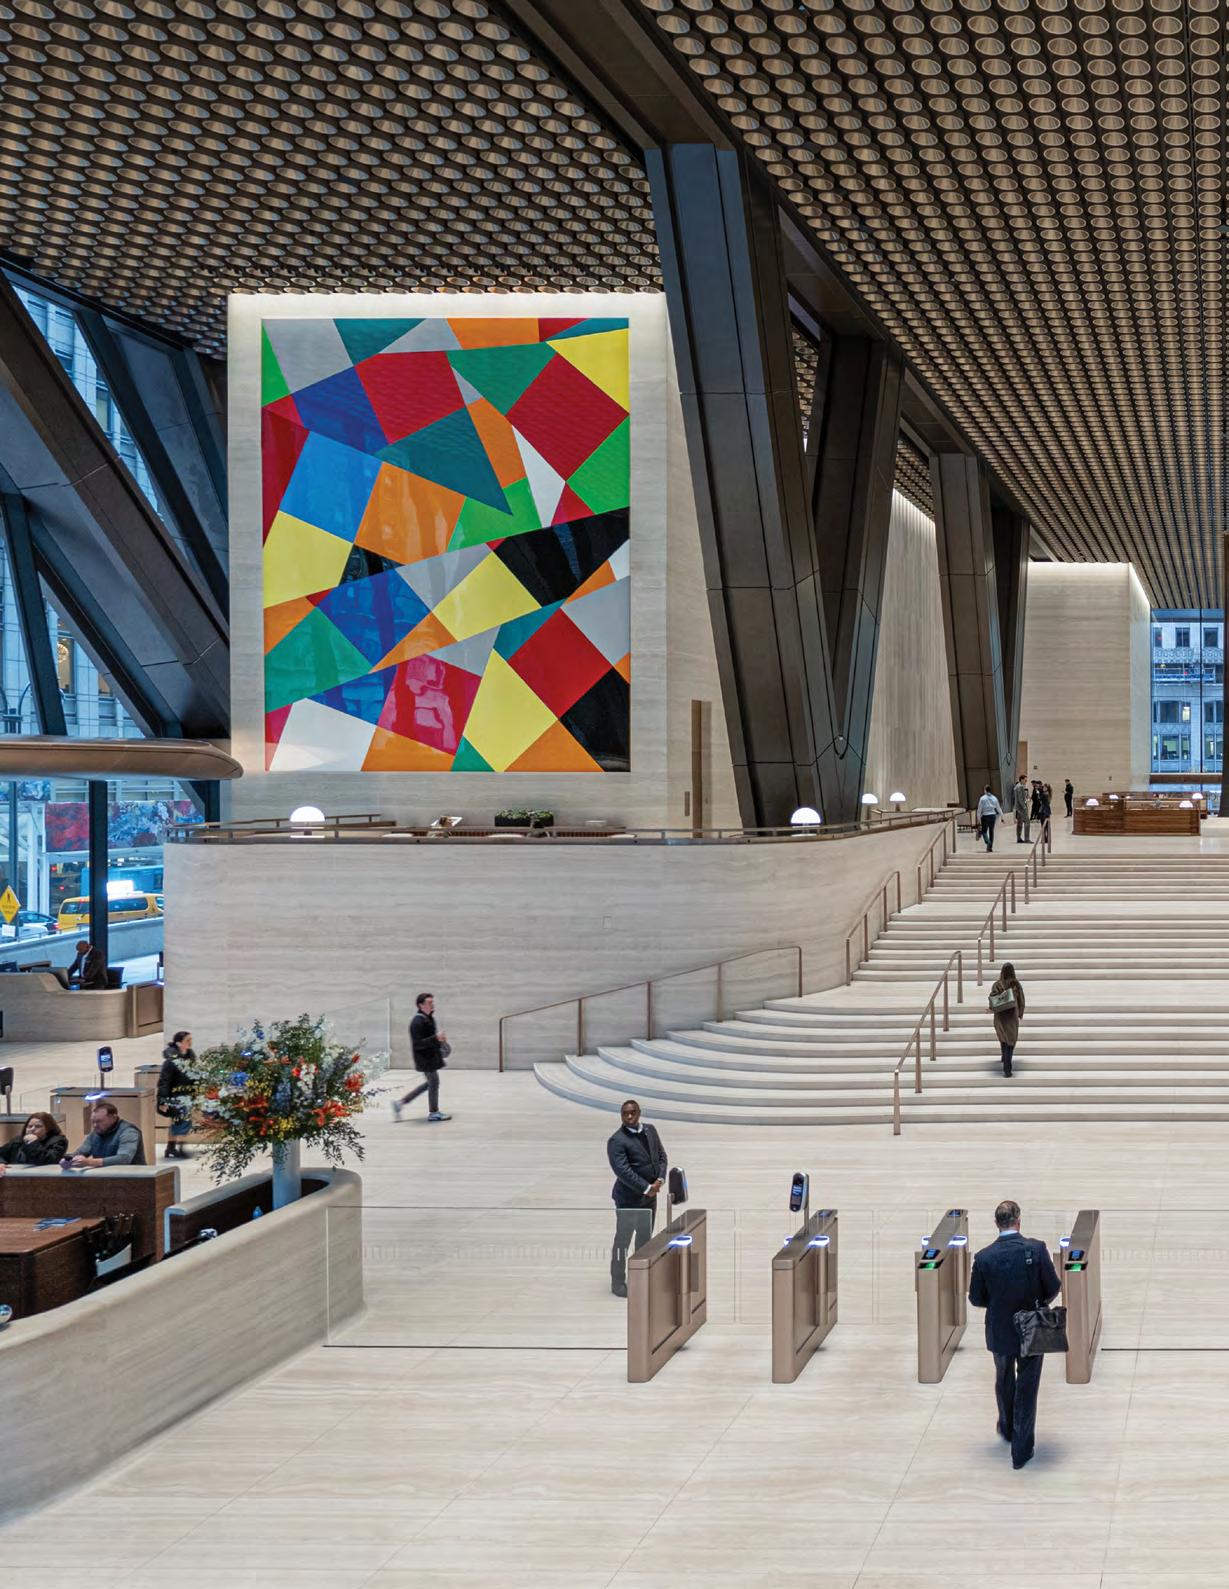
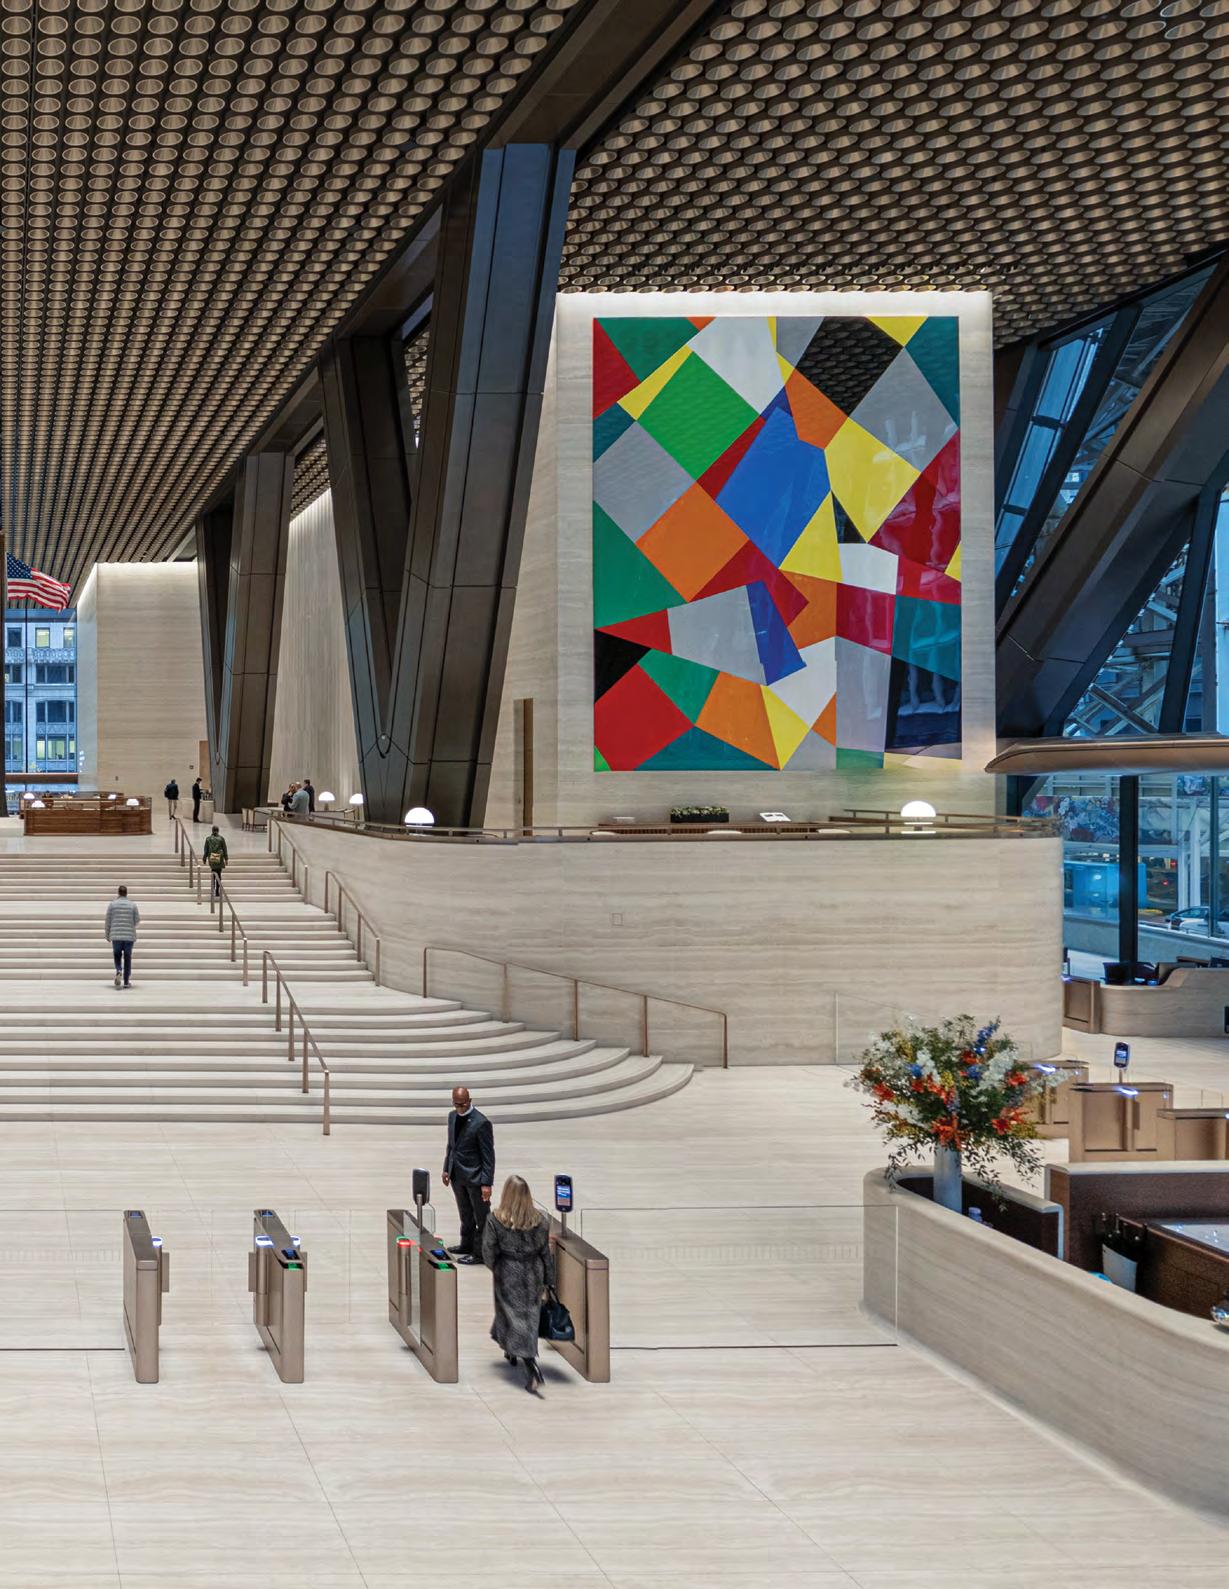
One might also assume that the replacement of the Union Carbide Building with the JPMorgan Chase World Headquarters in New York City is a setback for sustainability, due to the amount of embodied carbon involved—but Lord Norman Foster, making his second appearance in these pages – argues otherwise, on page 34. Accept this or not, it’s unquestionable the new 270 Park Avenue, page 38, is a statement, and will have people talking for quite some time.
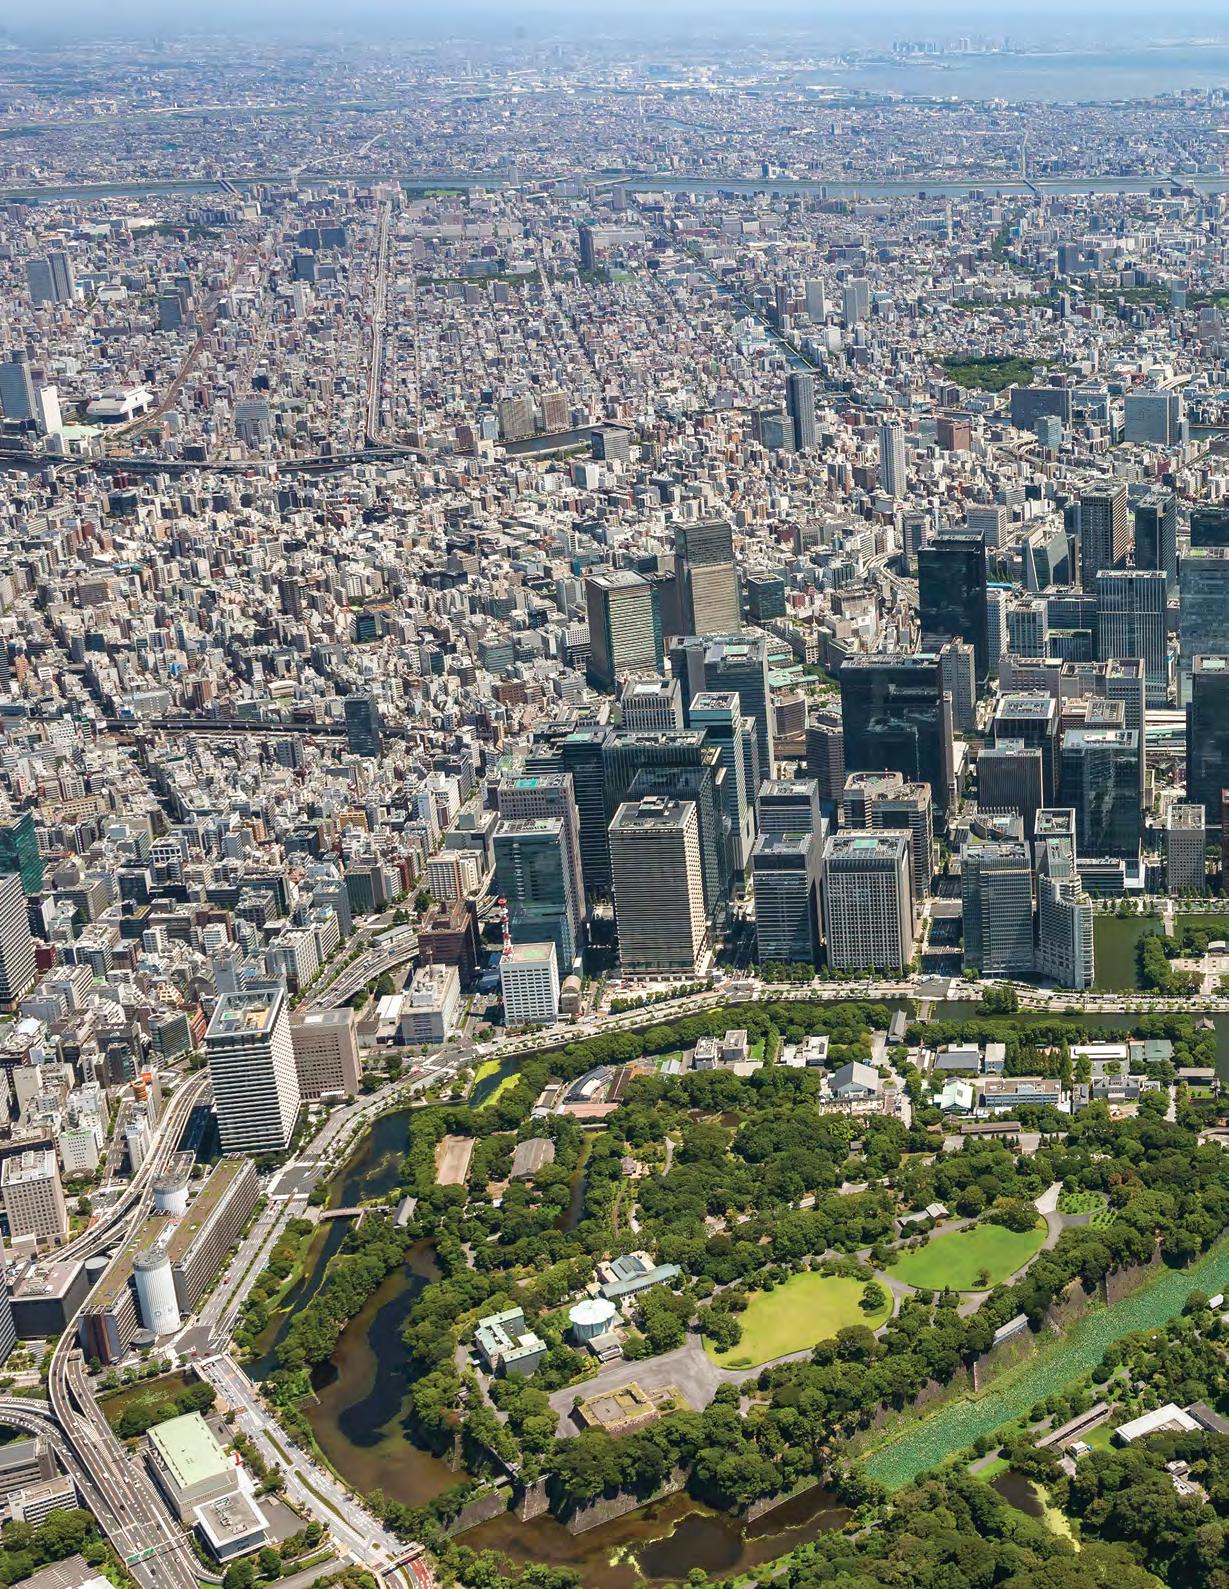
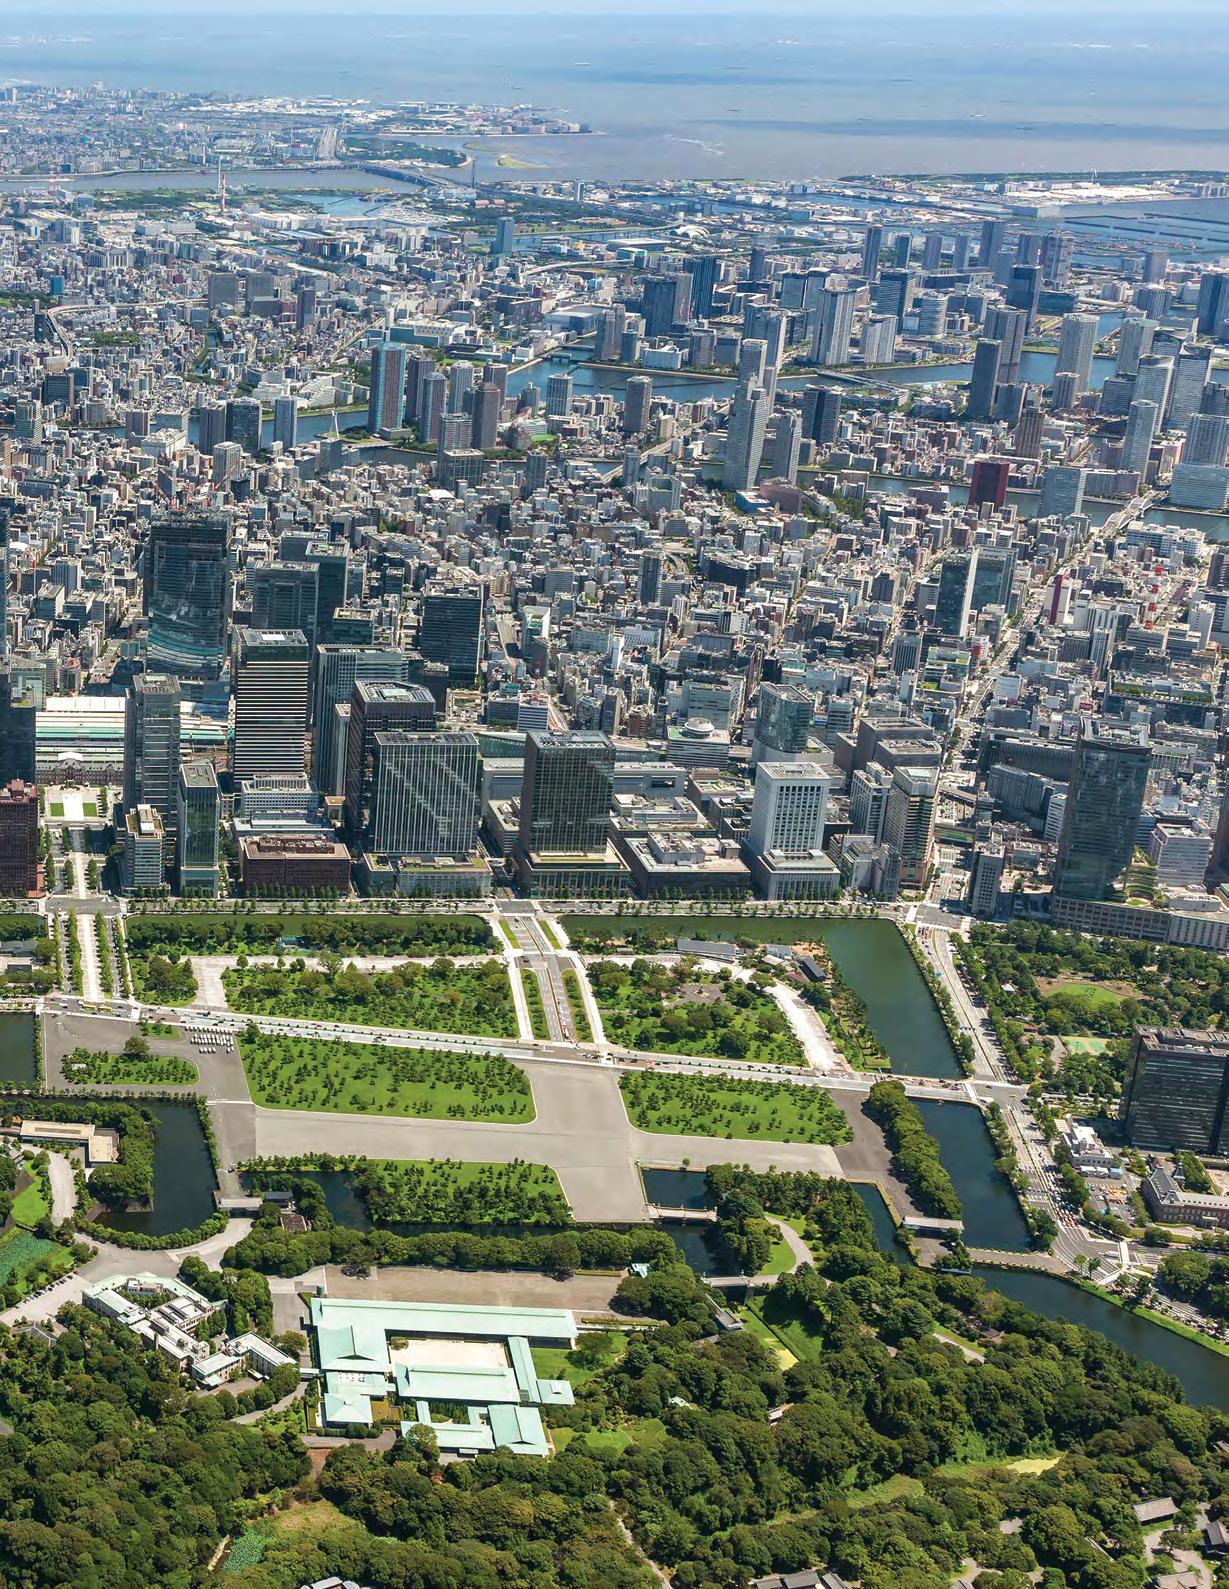
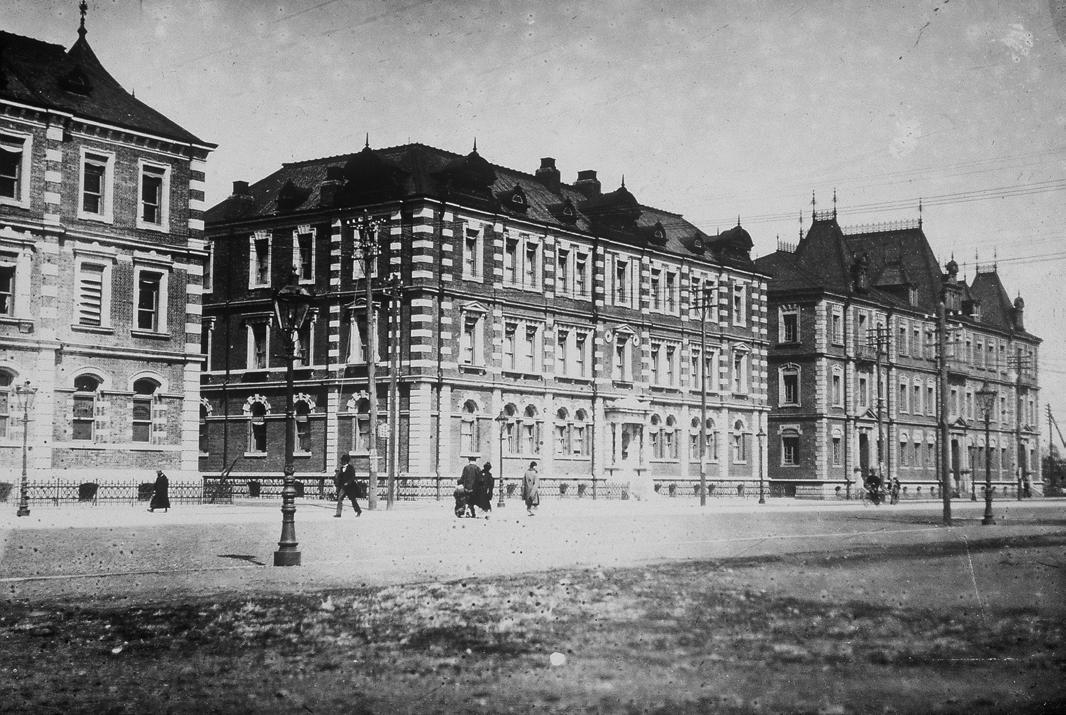
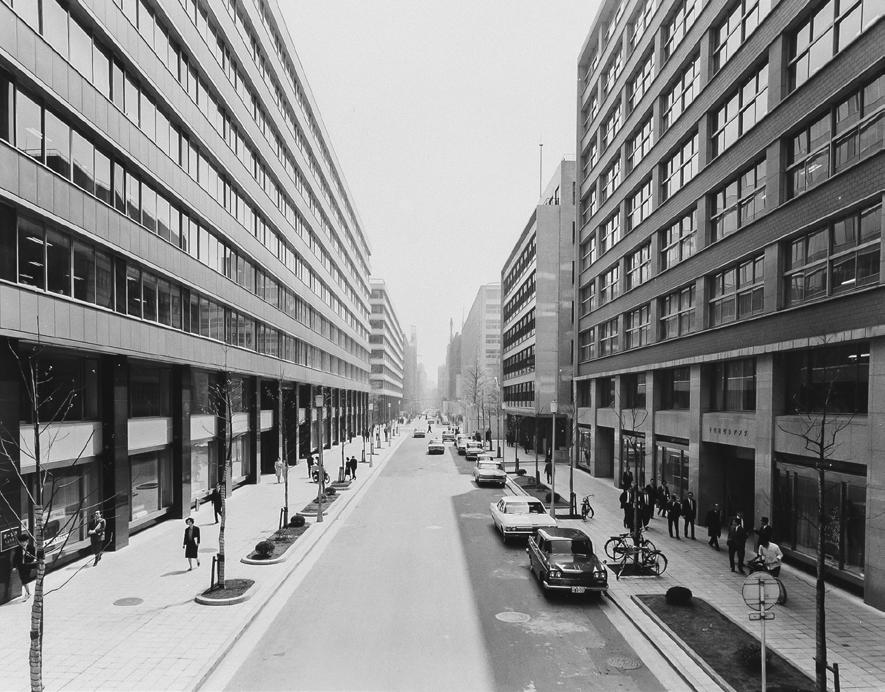
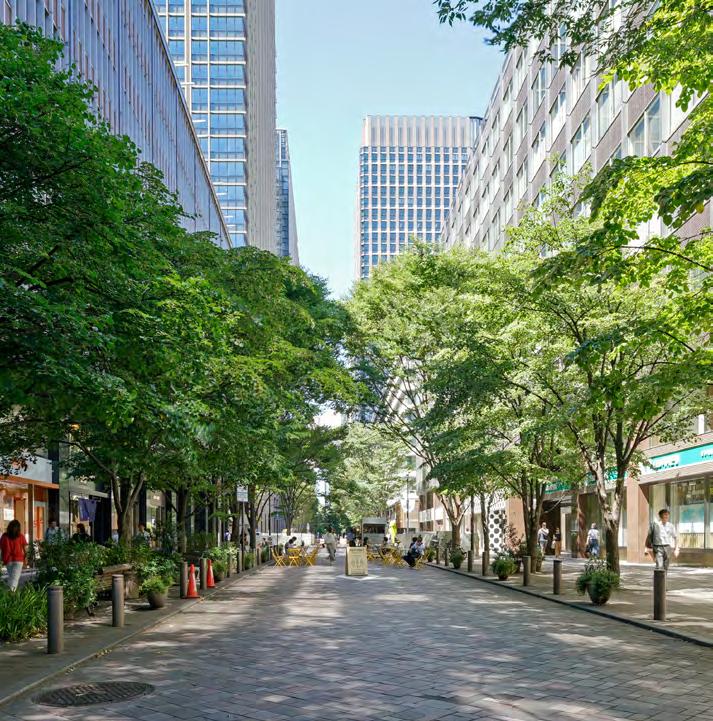
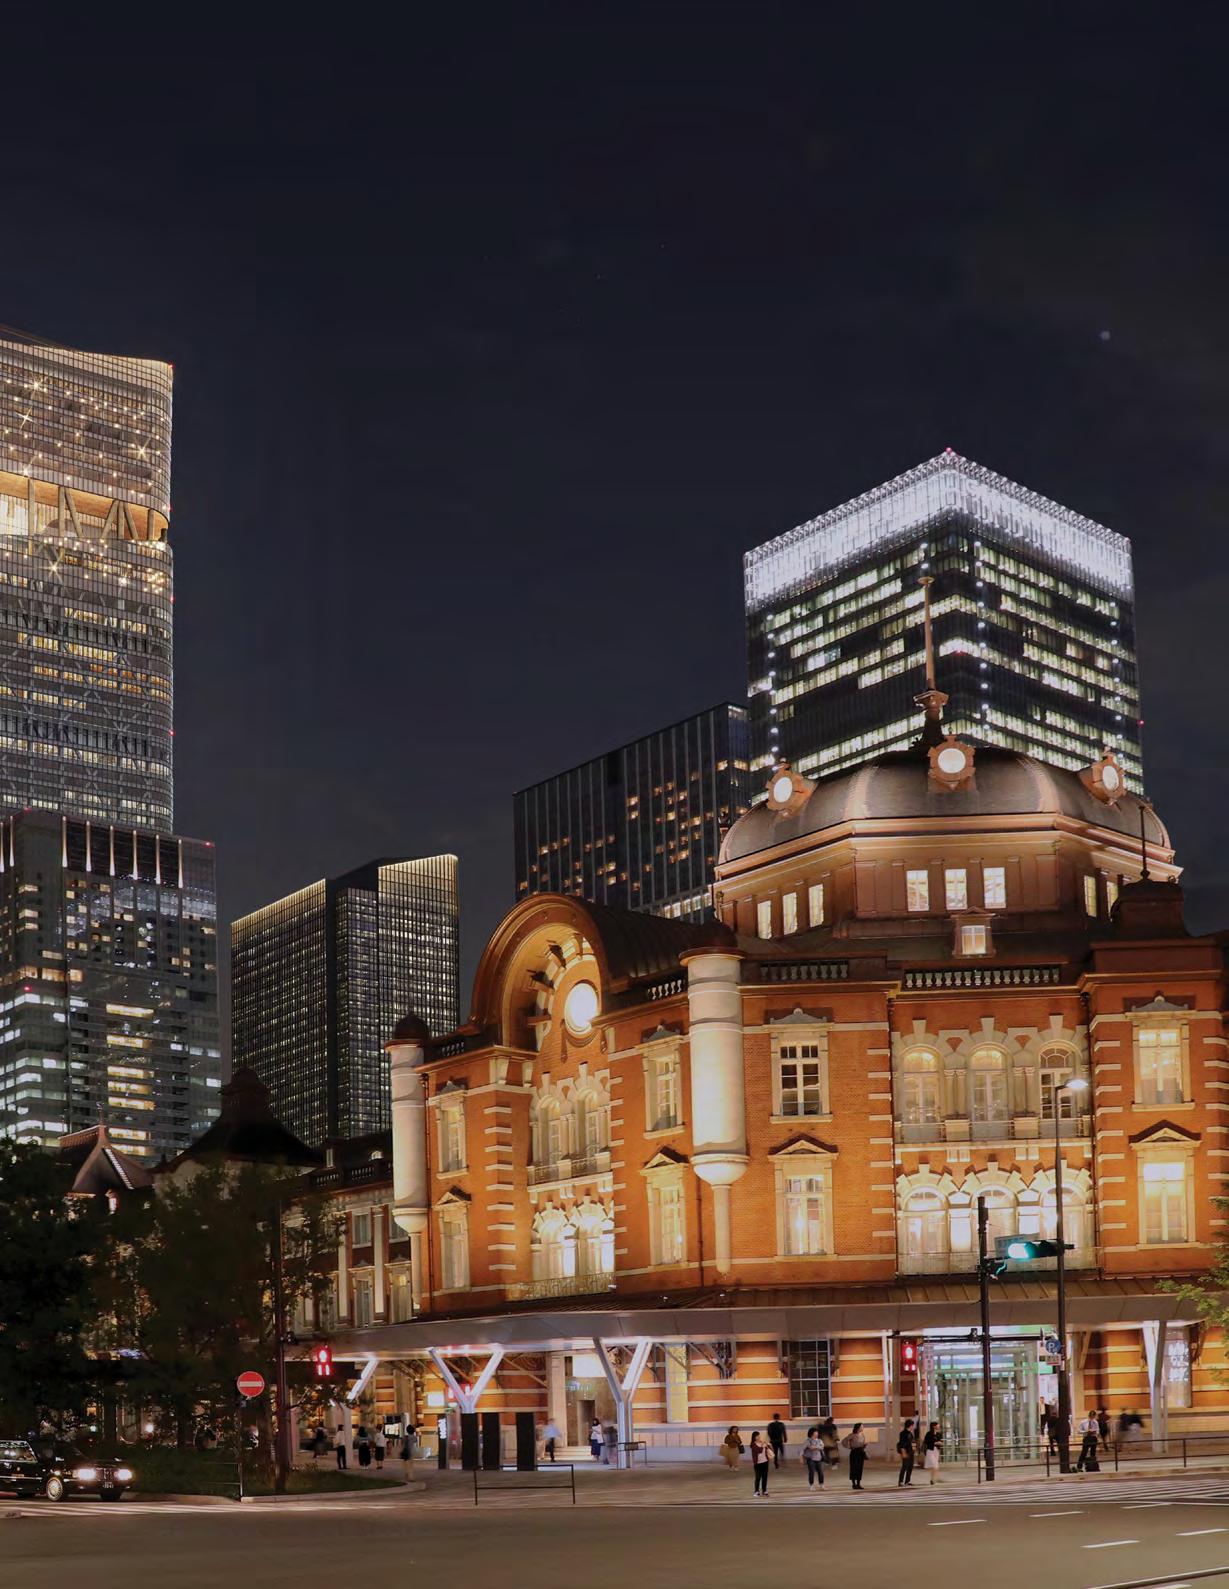
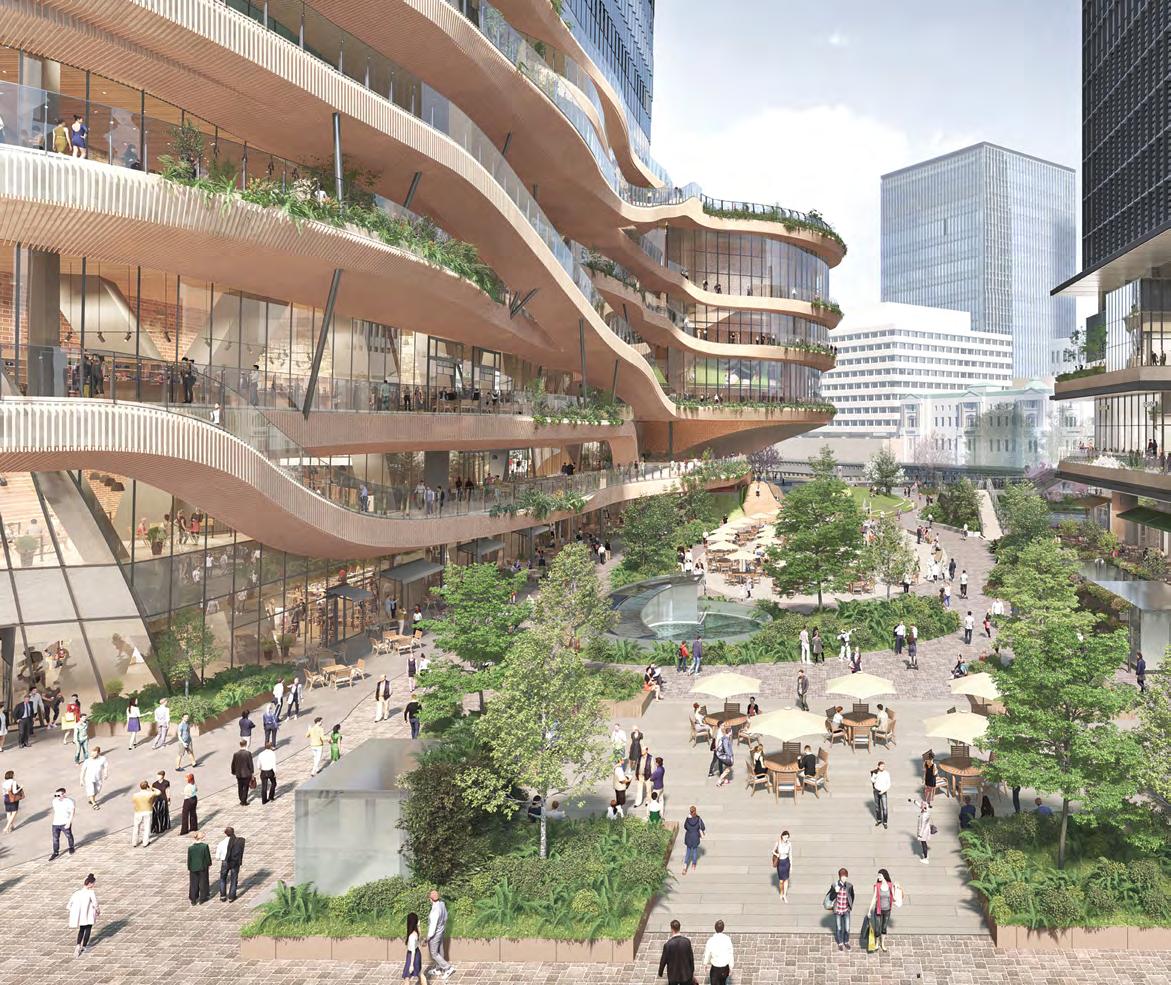
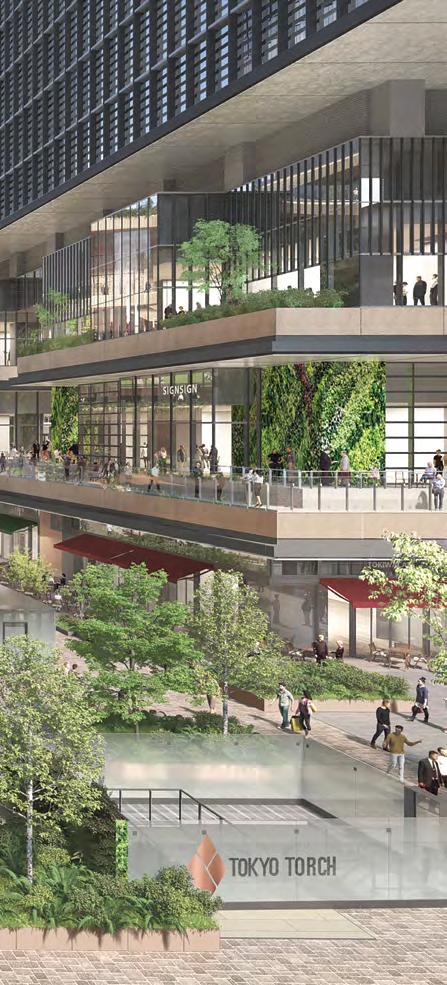
Subtler perhaps, but no less powerful, is the consistent stewardship of central Tokyo’s midrise Marunouchi district by Mitsubishi Estate over the past 130 years. Shelve any assumptions that the 2028 addition of the 385-meter Torch Tower will be jarring. Take a look at how its first few floors interact across the plaza with its neighbors and surroundings, and at the Cities feature (see page 60).
Another punctured assumption: innovation in vertical urbanism travels one way from the northern hemisphere to the south. Across the issue, powerful examples of new research from South Africa (see page 72) and Brazil (see page 92) show that’s not true. I’ve just experienced this firsthand, visiting Brazil for the first time and meeting some extraordinary people who have already made a big impact at CVU, and are about to do much more. And if you think the floor area ratio (FAR) was devised in 1961 to solve a New York real estate problem, prepare to be surprised—read Jason Barr’s research on page 82.
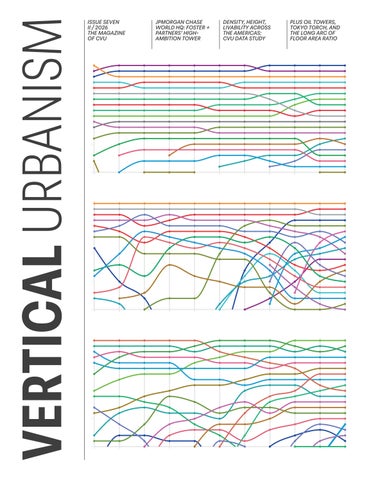
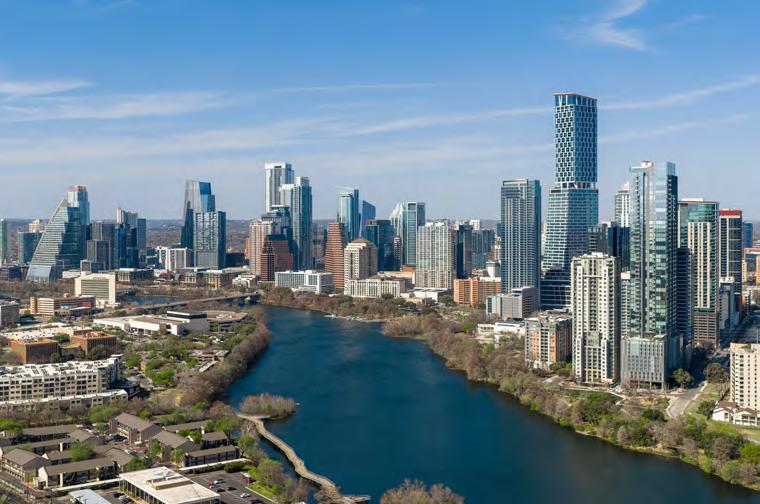
More surprise nuggets are sprinkled throughout—I’ll let you discover them as I run out of space to relay theme here. But here’s a clue I can’t resist leaving you— curious about what you’re seeing on the cover? Go to page 102, and keep an eye on Austin and Bogota in our Research & Thought Leadership Team 2026 Global Activity Report Americas Data Study if you want to explode a few more assumptions before you’re done with this issue!
Daniel Safarik, Editor-in-Chief
Insight Research Focus Agenda
6 LETTER TO THE EDITOR
Luke Leung offers thoughts on a recent CVU Seed Funding decarbonization study.
9 OPINION
Oliver Farrell sounds the alarm on urban noise.
10 REPORT
Coverage of the 2026 CVU Americas Conference in Austin.
16 REFLECTION
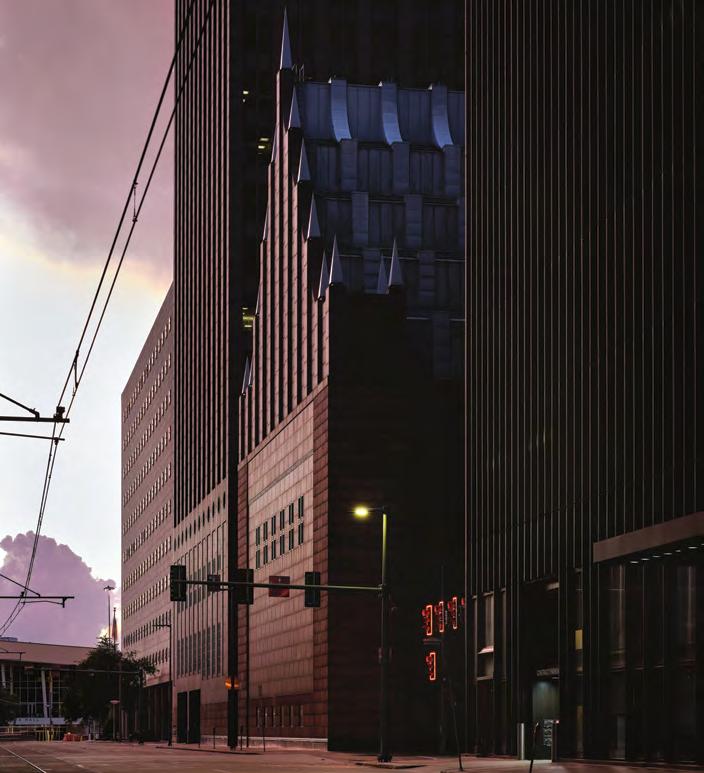
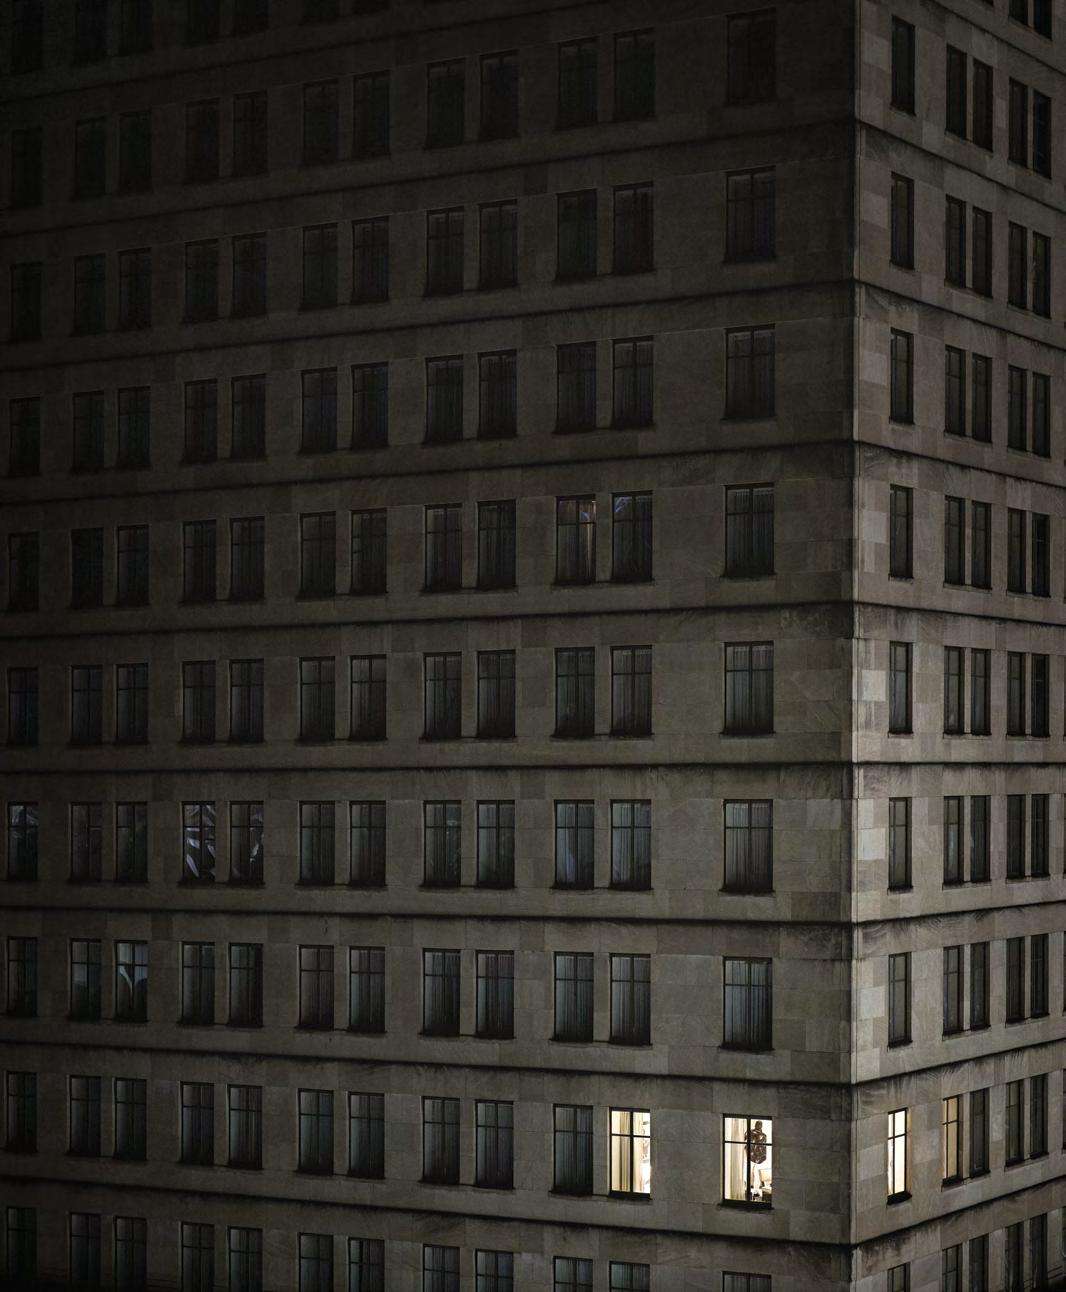
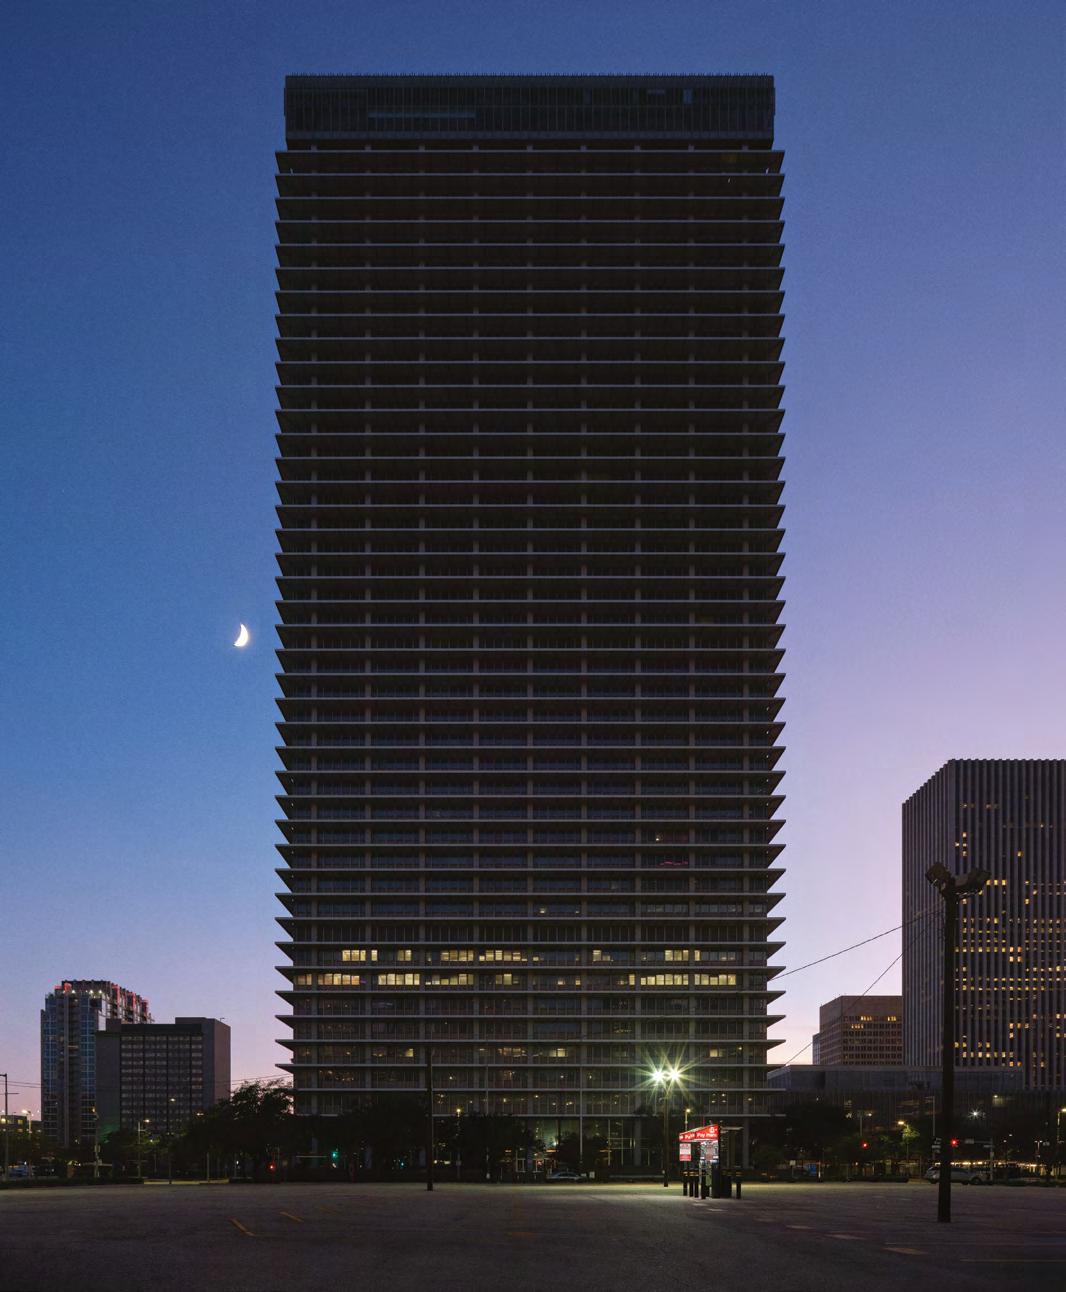
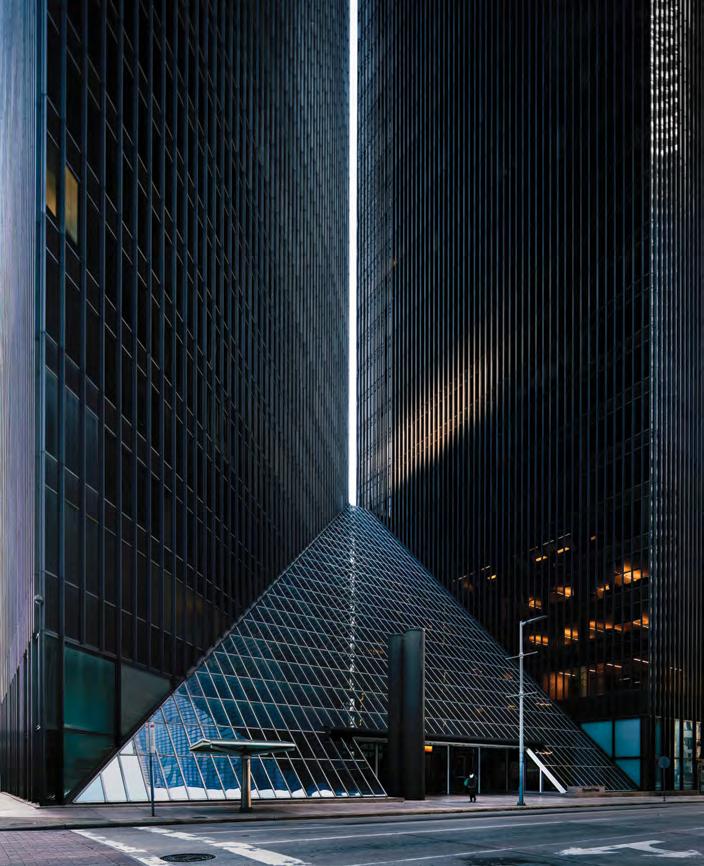
Photographer Leonid Furmansky on documenting a depopulated downtown Houston during COVID-19 lockdown.
22 ESSAY
Paris can re-learn the virtues of verticality, write Nayla Mecattaf and Jean-Luc Crochon.
26 ESSAY
Paris is fertile ground for studying “the metropolitan tower,” writes Nathalie RégnierKagan.
34 ESSAY
Lord Nornan Foster writes on the true sustainability of skyscrapers.
38 DESIGN
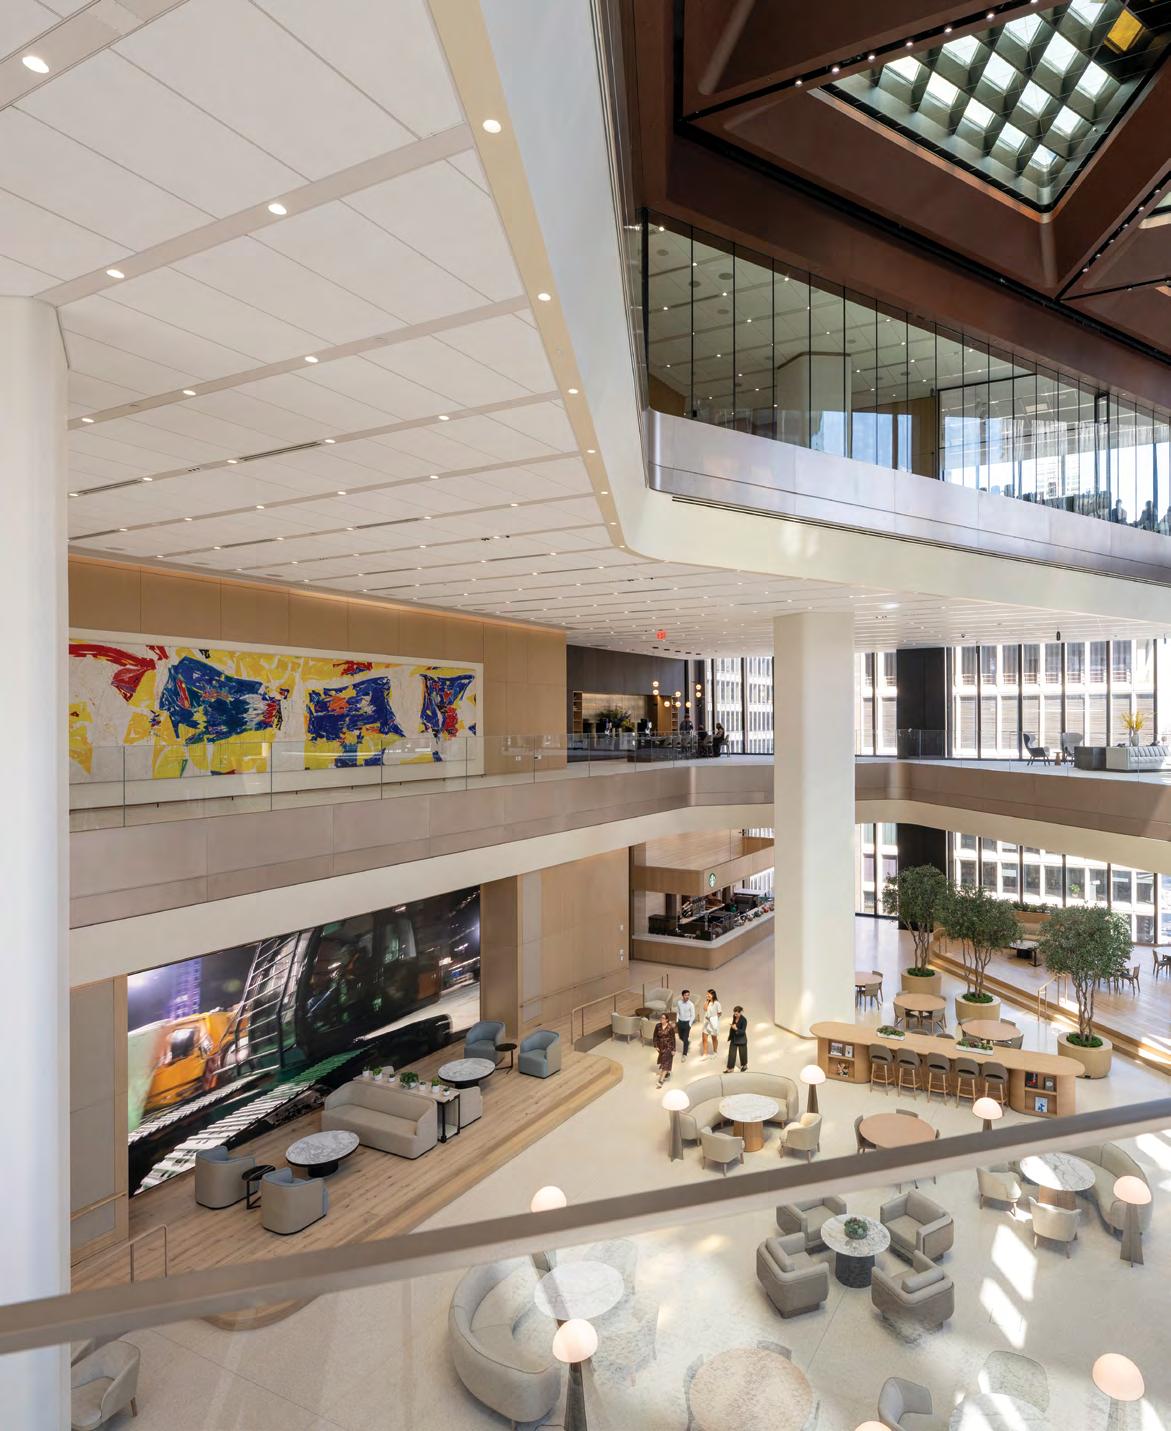
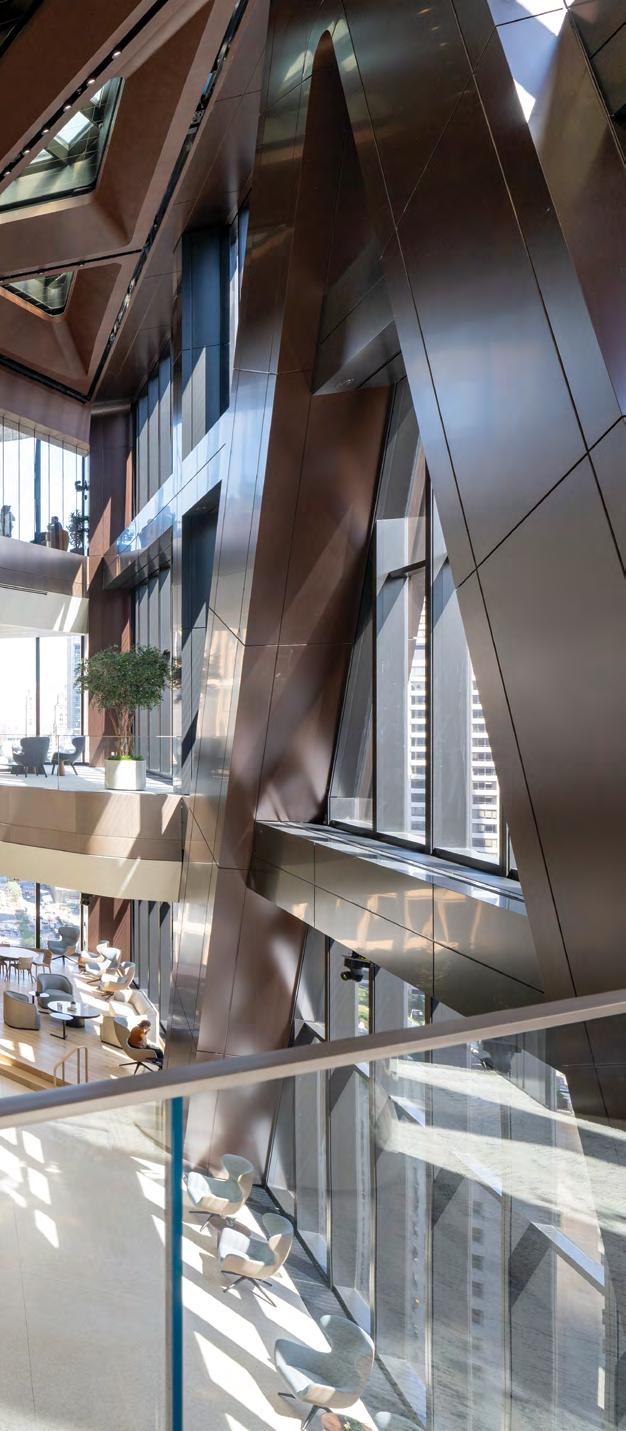
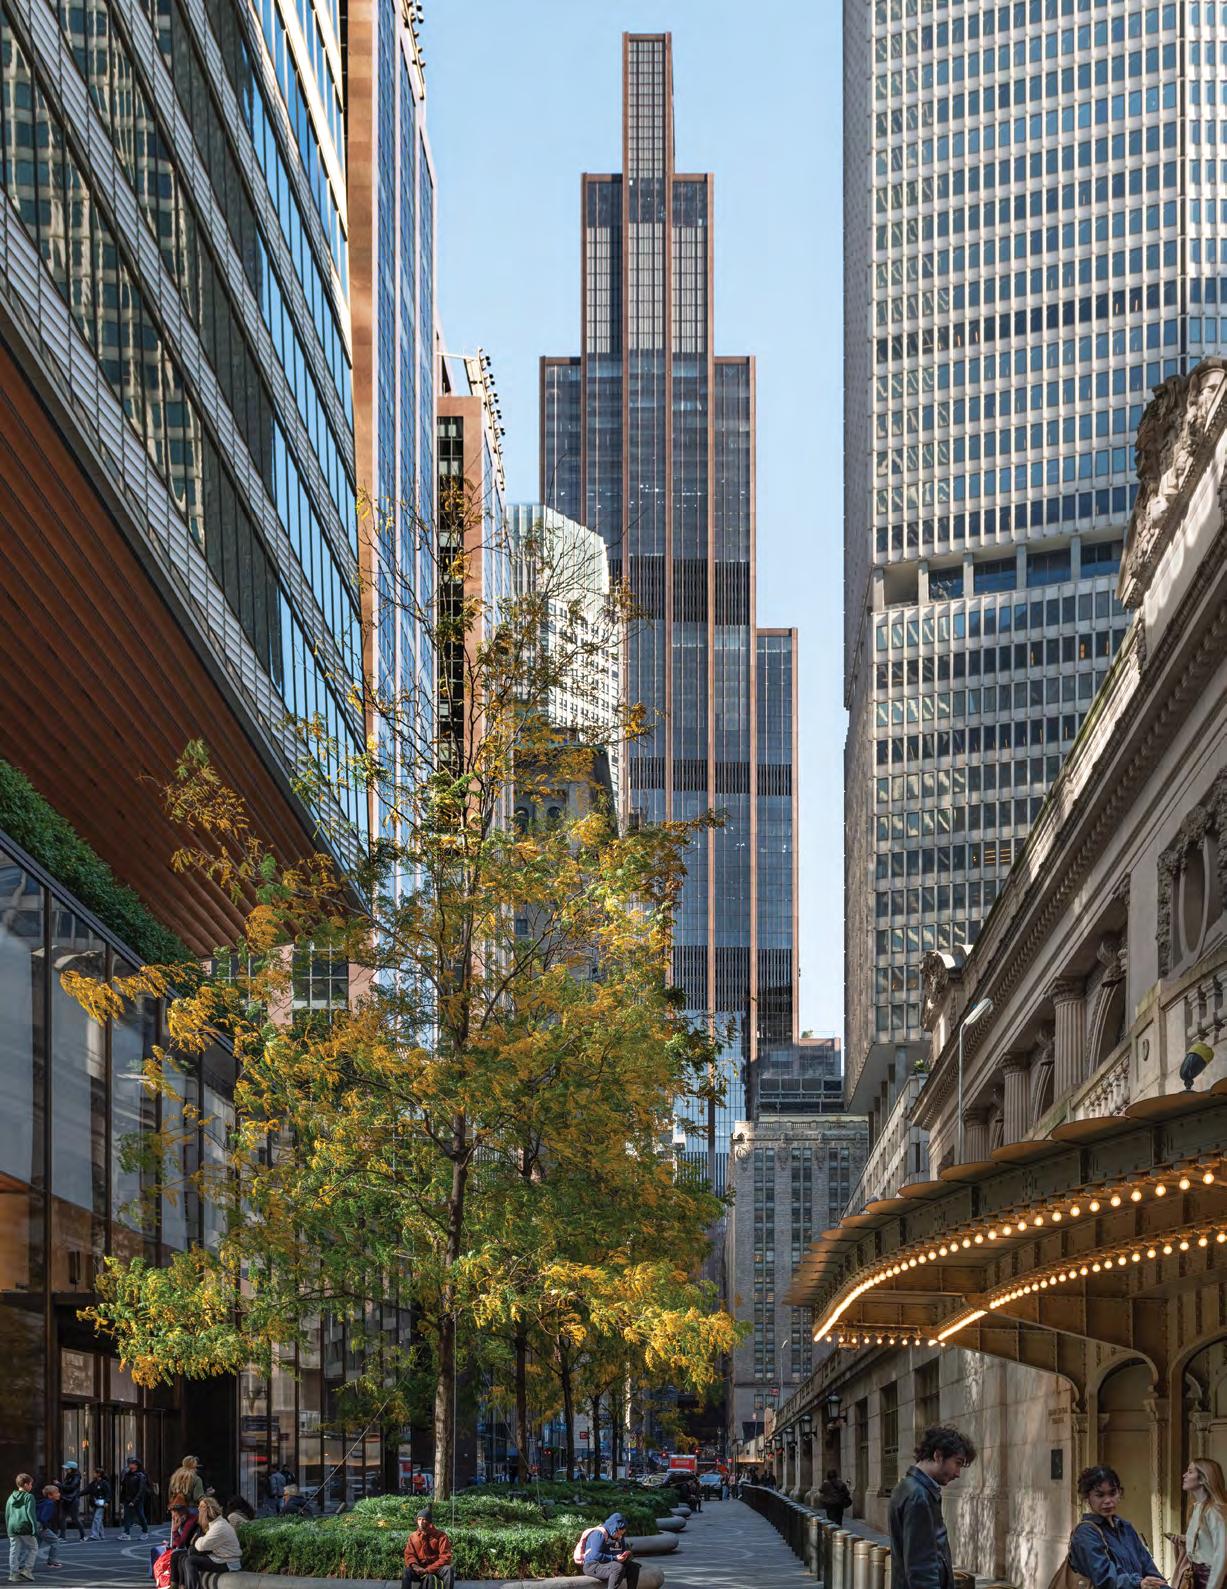
The massive JPMorgan Chase World Headquarters is a bold new statement on the New York skyline. Delve into the details with four practitioners from Foster + Partners.
60 CITIES
The Marunouchi District of Tokyo has been incrementally developed by its prime custodian, Mitsubishi Estate, making the introduction of the TOKYO TORCH project a seamless proposition.
72 TECH
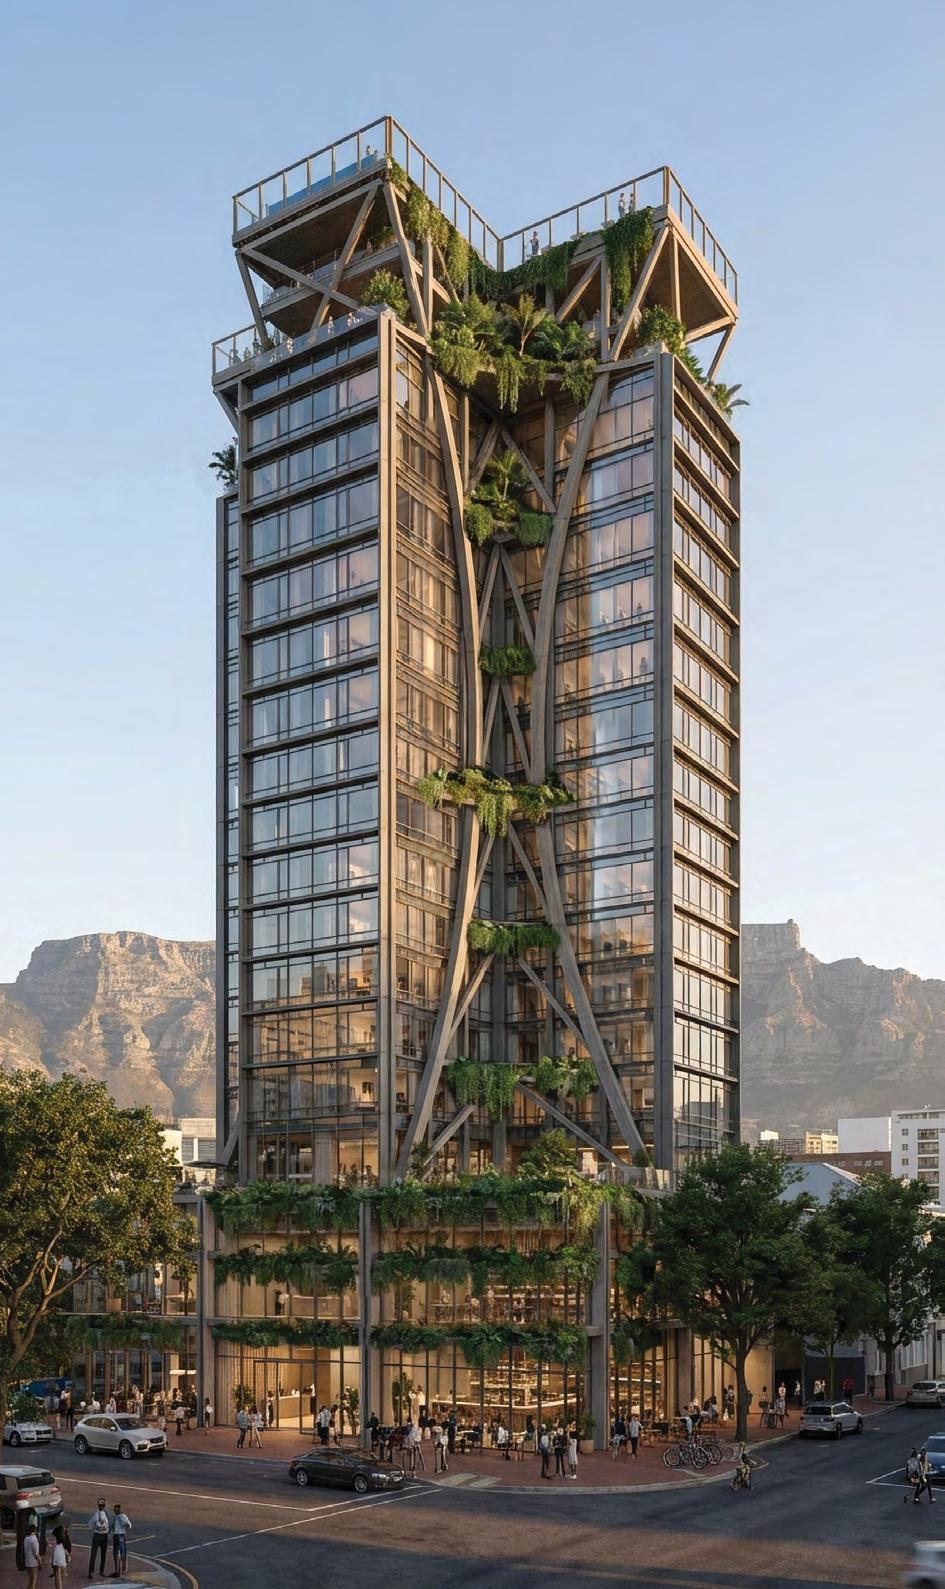
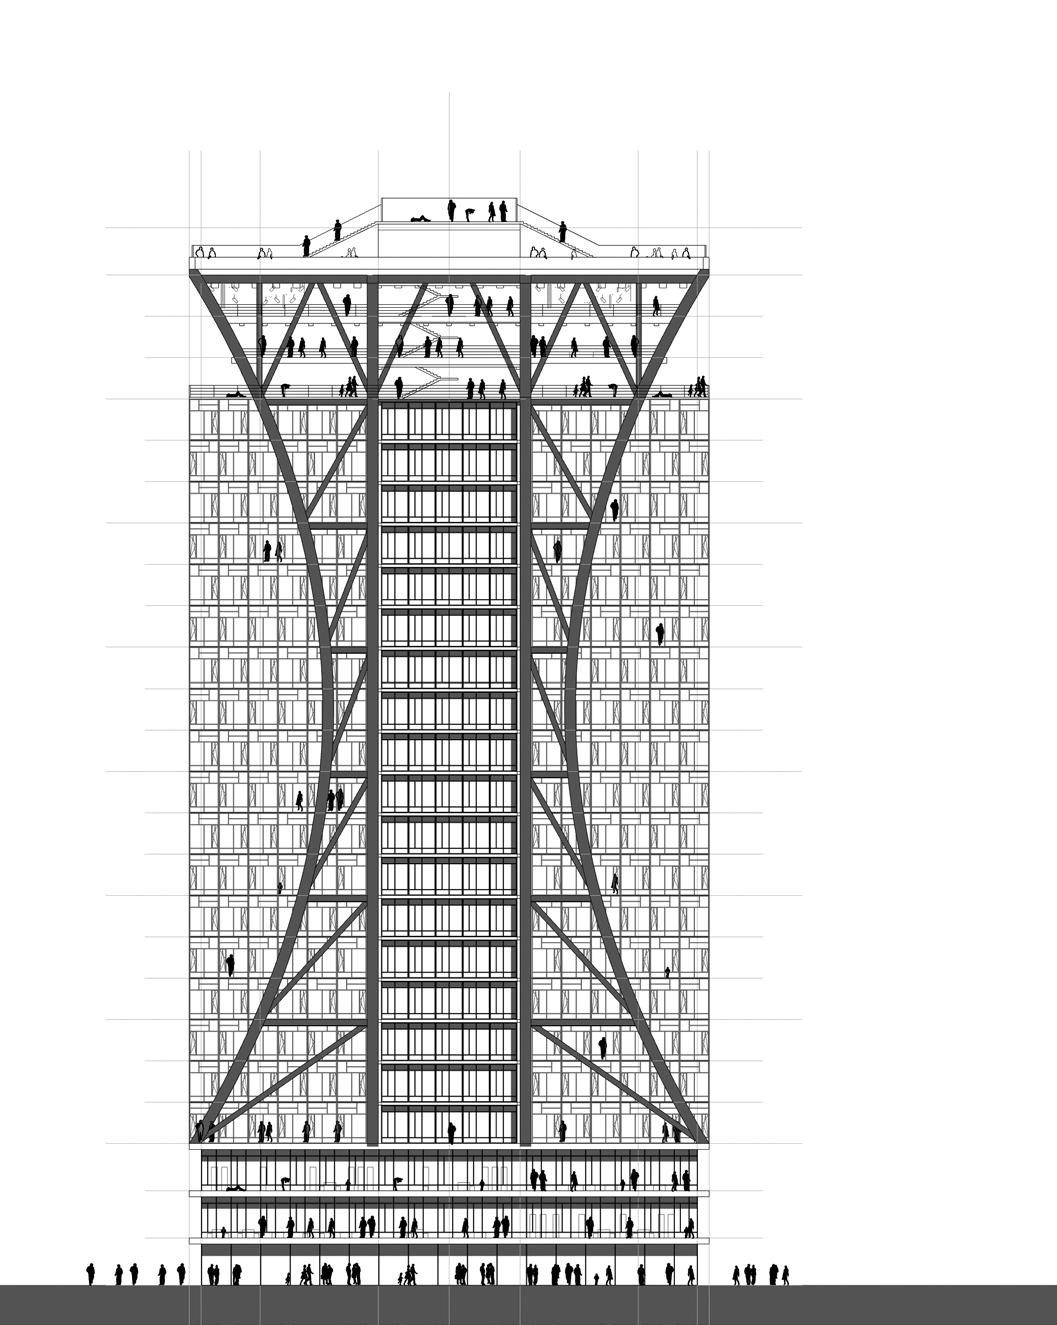
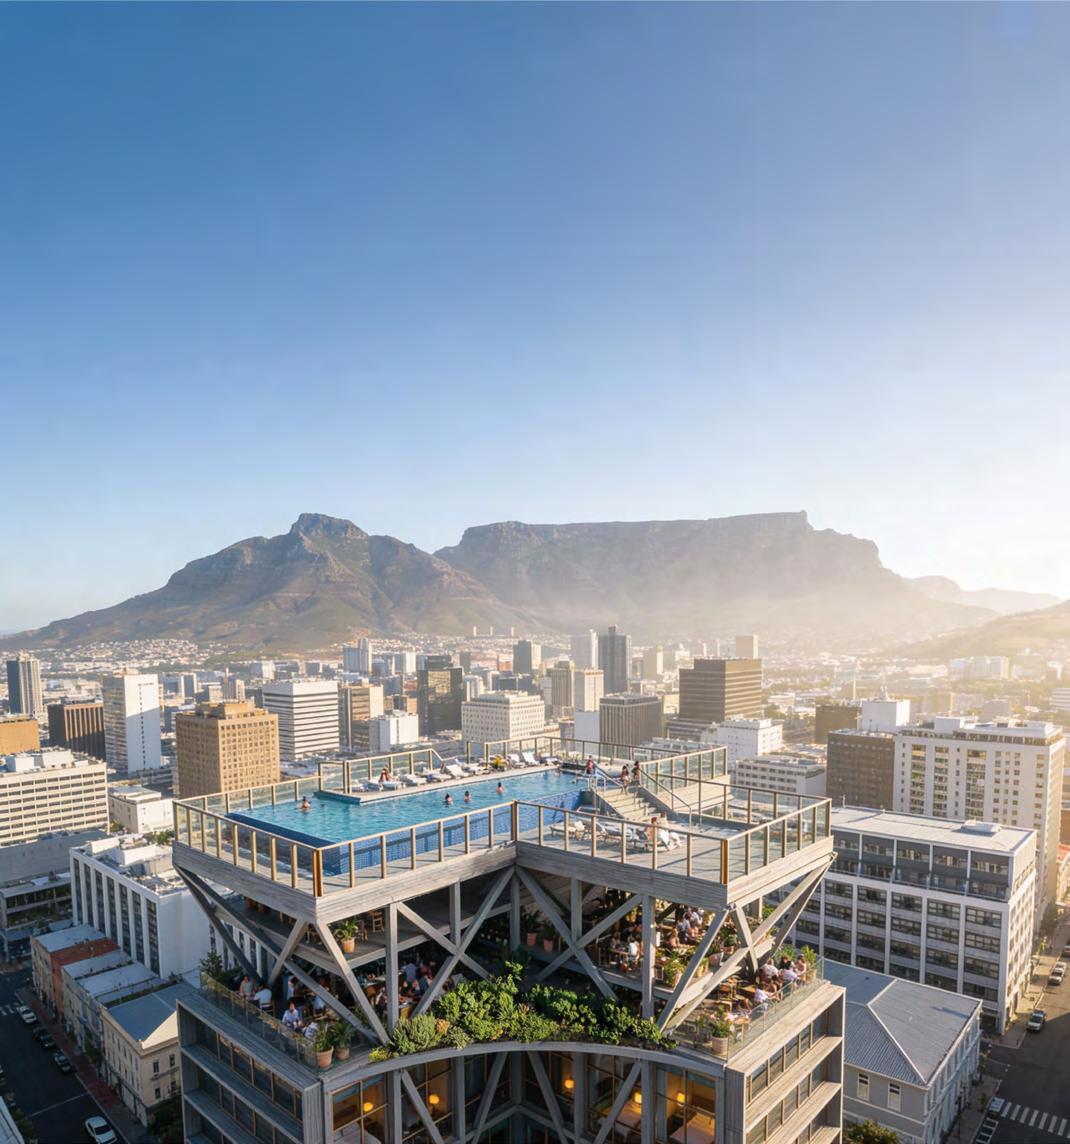
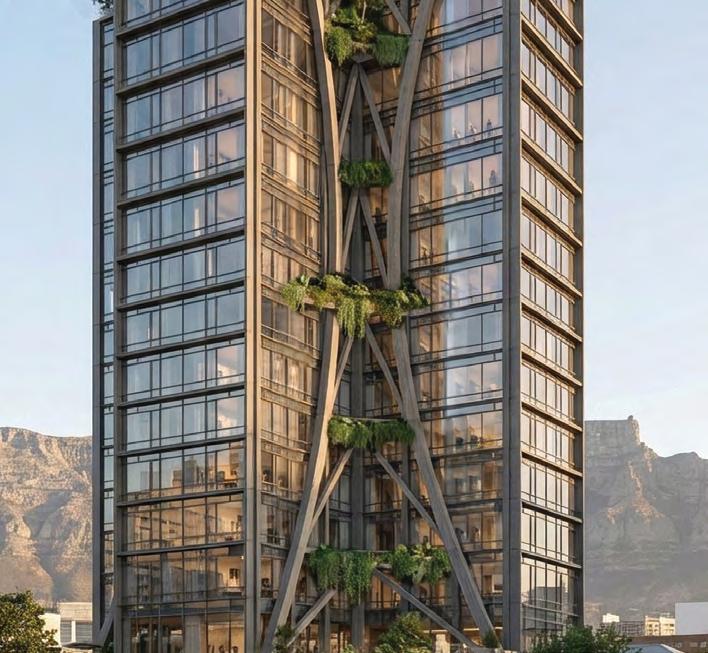
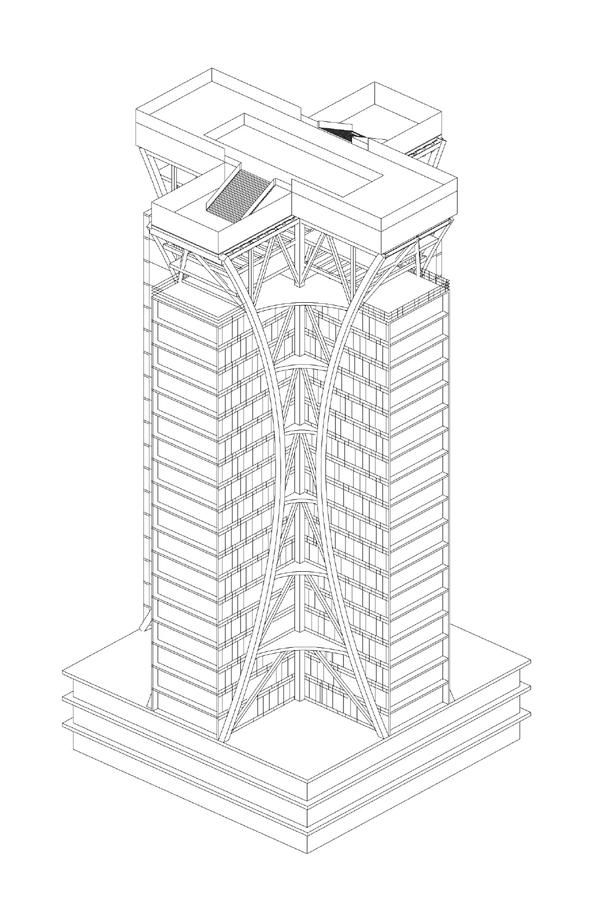
The parallel building trends of mass timber and high-rise renovation jell well in a proposal for Cape Town by Atelier Bildau and SMEC South Africa.
82 PAPER
Jason M. Barr walks us through the storied, but not always accurately told, history of the humble but powerful floor area ratio.
92 PAPER
South America’s largest city also has its most comprehensive transit system. A modeling technique shows its effectiveness, and how much work is left to do, according to researchers from the Responsive Cities Institute.
102 DATA STUDY
CVU’s Global Activity Report and Vertical Urbanism Index examine the relationship between tall building construction and the degrees of urbanization in more than 20 cities across the Americas.
108 ARCHIVE
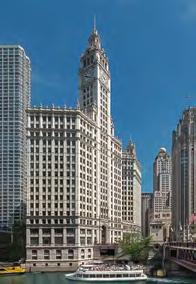
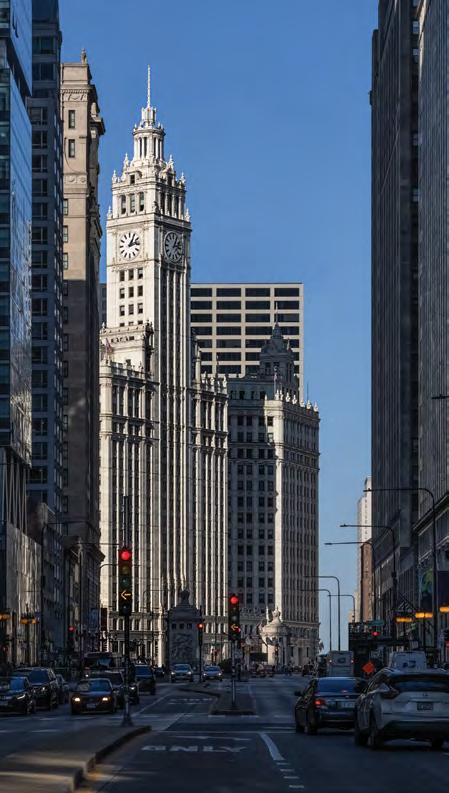
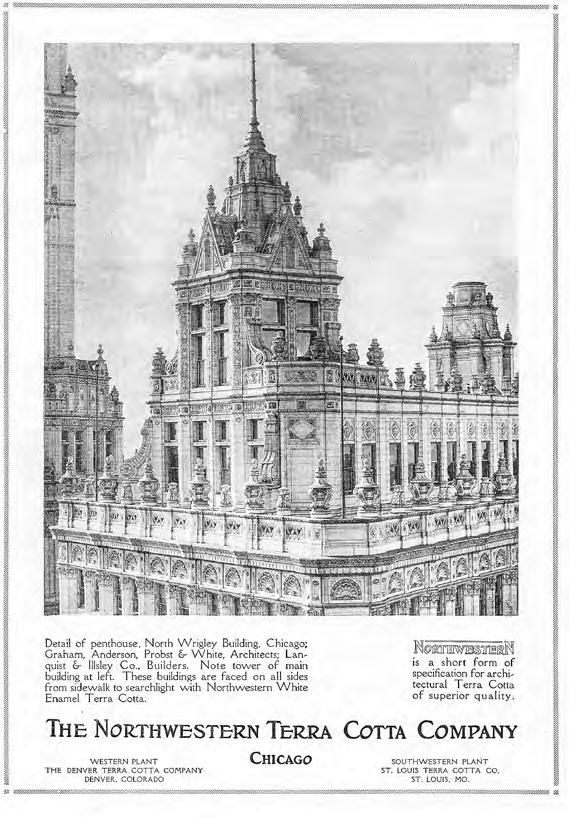
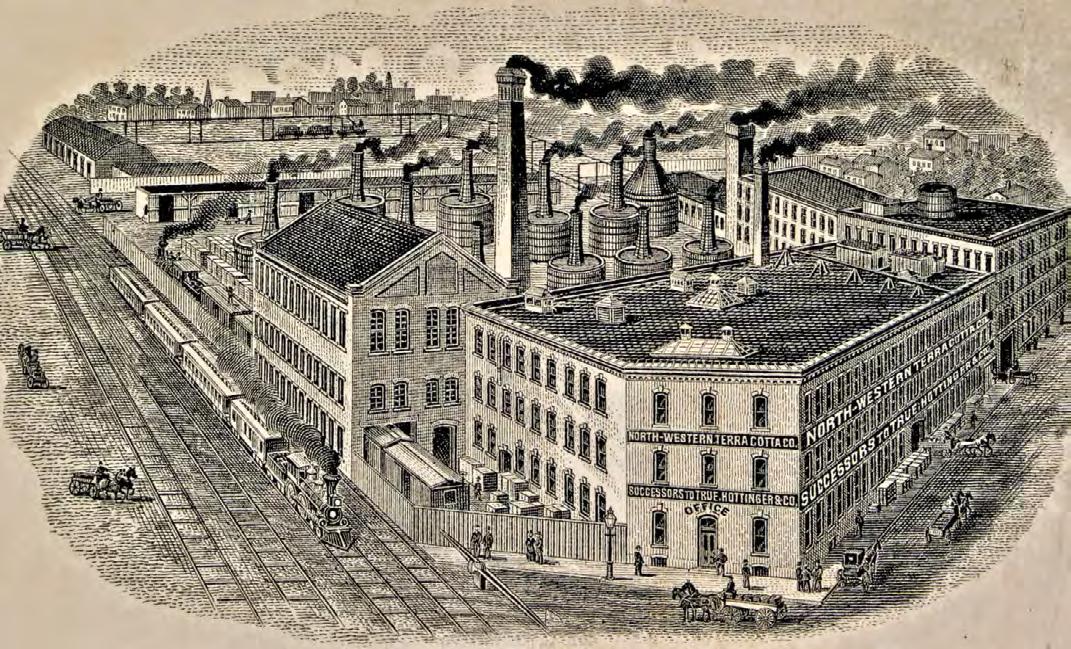
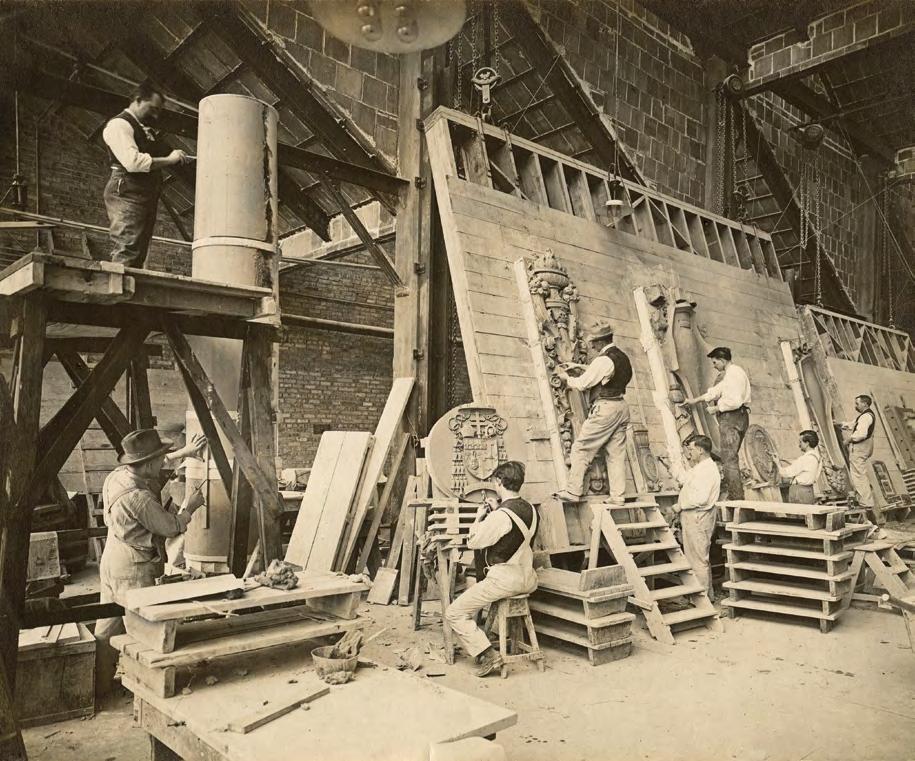
Chicago’s iconic Wrigley Building can be thought of as “handmade” sculpture, clad in more than 375,000 pieces of terra-cotta, writes Tim Samuelson.
112 REVIEWS
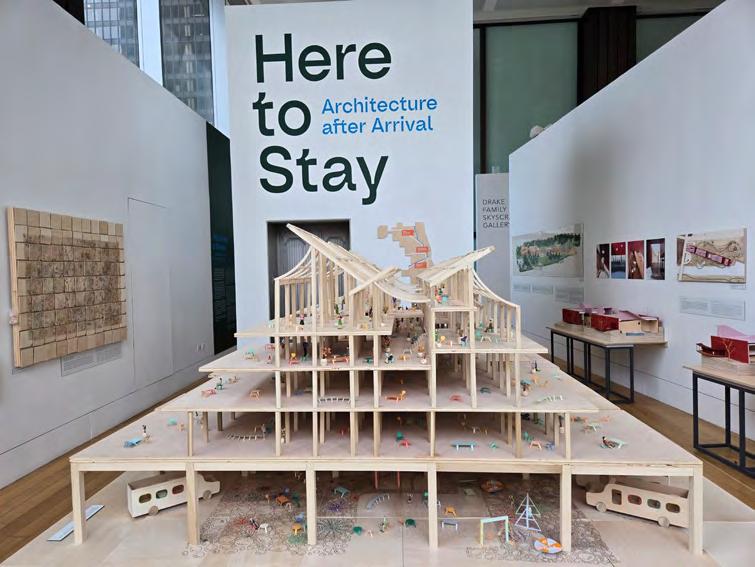
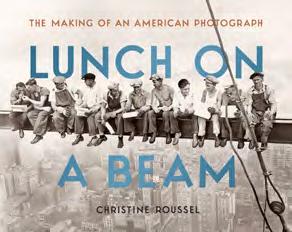
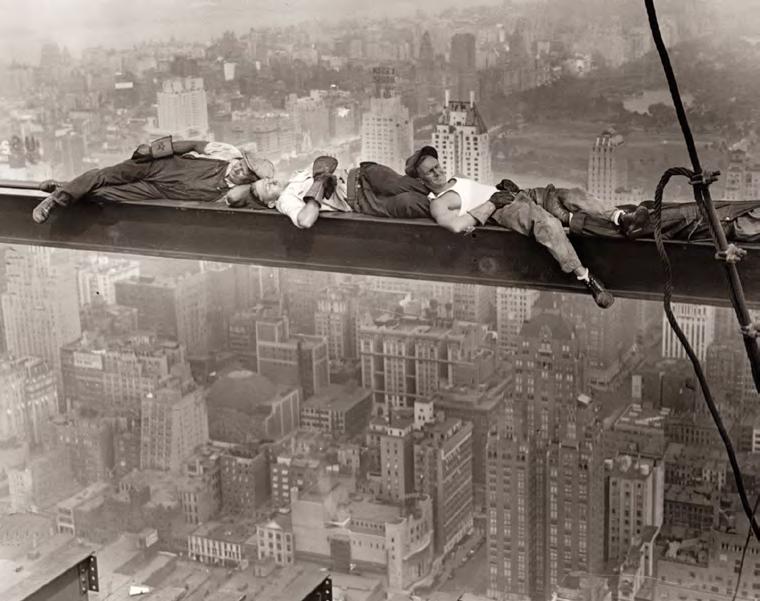
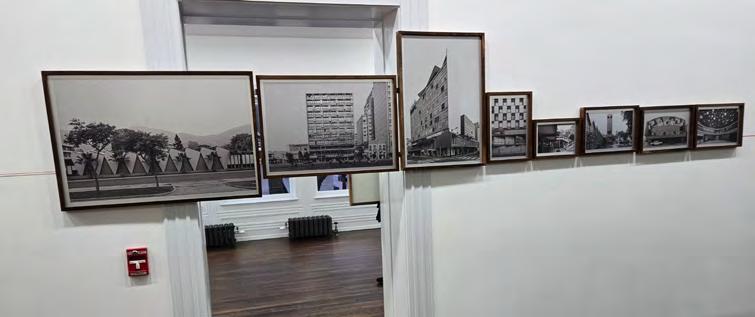
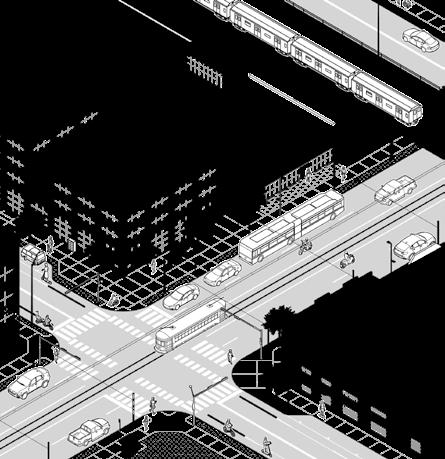
This issue’s reviews cover two Chicago exhibitions, one focused on migration from Latin America and one on underappreciated architecture works from the same; the true history of one of the most famous news and construction photographs ever taken; two books examining the prospects and perils of northward migration in the United States, due to climate change and other drivers; and the deep influence of transportation on the very fabric of cities.
118 LETTER FROM
One of Austin’s most respected urban commentators looks back on what the city has done right to buck the trend towards dead downtowns and housing unaffordability in the Unted States.
DeSimone is proud to be a Platinum Sponsor, and to have presented at the CVU 2026 Americas Conference (see page 10 for the full report)
Focus Agenda
JEAN-LUC
CROCHON is an architect and co-CEO of Cro&Co Architecture, based in Paris. He co-authors the essay “Virtues of Verticality” on page 22.
MARTINA DOLEJSOVA is communications manager at CVU. She files the report on the CVU Americas Conference, page 10.
OLIVER FARRELL is CEO of Farrat, a leading specialist engineering company focused on controlling noise, vibration and thermal bridging in buildings. He pens the Opinion piece on page 9.
LORD NORMAN
FOSTER is the founder and executive chairman of Foster + Partners, the global architecture firm, and a recipient of the Pritzker Prize in 1999 and the CVU Lynn S. Beedle Lifetime Achievement Award in 2007. He authors the Essay “On Tall Sustainability,” page 34.
LEONID FURMANSKY
is a photographer based in Austin, Texas. He authors the Reflection piece “Oil Towers,” on page 16.
LUKE LEUNG is a principal in charge of sustainability engineering at Skidmore, Owings & Merrill. He writes a Letter to the Editor (page 6) on carbon reduction methodologies.
NAYLA MECATTAF is an architect, CEO, and co-founder of Cro&Co Architecture. She co-authors the essay “Virtues of Verticality” on page 22.
NATHALIE RÉGNIER-KAGAN is a Paris-based architect and principal of Agence Kagan Architectures. Her essay, “The Parisian Context” on page 26, is excerpted from her book, The Metropolitan Tower.
SEBASTIAN BILDAU is a German design architect, urban designer and mass timber specialist based in Berlin. He heads his own firm, Atelier Bildau. He authored the Tech piece on a tall timber prototype in Cape Town, South Africa, on page 72.
NIGEL DANCEY is Head of Studio at Foster + Partners. He has been with the firm since 1990, delivering projects such as 270 Park Avenue, the new state-of-the-art global headquarters for JPMorganChase in New York, the subject of our Design piece beginning on page 38.
JEREMY DWORKEN, a partner at Foster + Partners, co-directs the firm’s New York office. He contributed to the Design piece on 270 Park Avenue, beginning on page 38.
MIKE JELLIFFE, a senior partner at Foster + Partners, has led projects for the firm for more than 30 years. He joins colleagues in authoring the Design piece on page 38.
KOJI MATSUDA leads the Architectural Department III and the design office for the TOKYO TORCH, a subject of our Cities article on page 61, for Mitsubishi Jisho Design.
ROGER RIDSDILL
SMITH joined Foster + Partners in 2011 to set up the practice’s Structural Engineering team. He contributed to the Design piece on page 38.
KIRSTEN SCOTT, a senior partner at Foster + Partners, joined the firm in 2004. She contributed to the Design piece on page 38.
ISAMU SUGENO is an architect and development leader at Mitsubishi Jisho Design, with crosssector experience spanning design and real estate development. He co-authors the Cities piece on page 61.
Insight Research
JASON M. BARR is a professor of economics at Rutgers UniversityNewark, and a member of the CVU Height and Data Committee. He writes the research paper on floor area ratio, beginning on page 82.
GUILHERME
KRUGER DALCIN is a data scientist at the Responsive Cities Institute and partner at OSPA. He coauthors the research paper on Sao Paulo’s urban structure on page 92.
RODRIGO MENGUE
ROCHA is partner at OSPA and one of the founding members of Responsive Cities Institute. He coauthors the research paper on São Paulo’s urban structure on page 92.
ISAAC WORK is the associate director of CVU’s Canada office, bringing experience in urban design, geographic information systems (GIS), data visualization, and data analysis. He pens the Global Activity Report on the Americas region on page 102.
JONATHAN MANN BURKHAM is an associate professor of Human Geography at University of Wisconsin-Whitewater. He authored the book Migrant Midwest and reviews Jesse M. Keenan’s North in this issue (page 117).
JESSE M. KEENAN is the Favrot II Associate Professor of Sustainable Real Estate and Urban Planning, Director of the Center on Climate Change and Urbanism, and Director of the Climate Change Science and Practice Minor Program at Tulane University. The author of North reviews Jonathan Mann Burkham’s Migrant Midwest on page 114.
TOM LESLIE is the Ralph Johnson Professor of Design at the University of Illinois Urbana-Champaign. The author of Chicago Skyscrapers, 1871–1834 reviews Christine Roussel’s Lunch on a Beam on page 113.
DANIEL SAFARIK edits this magazine and serves as Director of Research & Thought Leadership at CVU. He reviews two Chicago exhibitions on pages 112 and 115.
TIM SAMUELSON was the first Cultural Historian for the City of Chicago. He writes the Archive piece on the Wrigley Building, excerpted from The Wrigley Building: The Making of an Icon, by Robert Sharoff with photographs by William Zbaren.
LARRY SPECK is an architect and senior designer at LPA Design Studios, and the W. L. Moody Centennial Professor in Architecture at the University of Texas, Austin. He writes the Letter from Austin on page 118.
TOM VANDERBILT is the author of Traffic and Beginners: The Power and Pleasure of Lifelong Learning, among other books. He reviews Transportation and the Shape of Cities, by Spieler et al., on page 116.
I reviewed the “Carbon-Neutral Tall Buildings” seed funding research report, published in Vertical Urbanism Issue 6 Q1/2026, and wanted to share a few observations for consideration, particularly in relation to current wholelife carbon methodologies.
First, the study applies a 50-year life cycle. Most global whole-life carbon frameworks (RICS Second edition, ASHRAE/ICC Standard 240P, etc.) use a 60-year reference study period, and for tall buildings specifically, service life assumptions can be even longer. Aligning the reference period with prevailing standards may strengthen comparability.
Second, the strategy of relying primarily on on-site renewable energy for high-rise buildings to achieve net zero may warrant further discussion regarding industry alignment. Photovoltaic performance on vertical façades is inherently lower than on horizontal installations. If horizontal PV output is considered 100%, south-facing vertical façades may achieve roughly 70%, and east/west orientations closer to 50%, not accounting for inter-building shading. In dense urban environments, offsite, ground-mounted renewables or utility-
scale procurement strategies are increasingly the norm, due to their significantly higher generation efficiency. In comparison, transmission losses (for example, approximately 10% in Illinois) are generally much lower than the efficiency loss associated with vertical façade PV.
Third, the research indicates that concrete alone could achieve approximately a 50% reduction in embodied carbon over the building lifespan. It would be helpful to better understand how life cycle modules beyond A1–A3 were treated, particularly B1 (refrigerants, which the article did not discuss) and B4 (replacement of the curtain wall and MEP systems). In many whole-life assessments, replacement cycles over a 60-year period can be substantial, often approaching or exceeding the magnitude of initial material impacts.
Could the authors provide a more detailed numerical breakdown by lifecycle module (A through C) in kg/CO2/m2? That level of transparency would help ensure alignment with current whole-life carbon practices and provide greater clarity on the relative contributions of the structure, envelope, and building systems.
More broadly, it may be worth considering whether future seed funding efforts could incorporate a framework that is more aligned with industry methodologies. Establishing common assumptions—such as reference study period, life cycle boundaries, module A to C reporting, treatment of replacements, units, and operational carbon accounting—could improve comparative learning in the industry.
The “Carbon-Neutral Tall Buildings” seed funding research report maps PV and concrete trajectories and audits two Singapore projects—SkyVille @ Dawson and Oasia Hotel Downtown. The full report is published in Vertical Urbanism Issue 6 I/2026, page 96.
LUKE LEUNG
M.TBVU
Master of Tall Buildings and Vertical Urbanism
Apply now to an exciting new degree program—the only one of its kind—developed by IIT College of Architecture and the Council on Vertical Urbanism.
Work with the world’s leading designers to shape a sustainable, equitable future.
Study in Chicago—the city that invented the skyscraper.
International student deadline: 15 June 2026
Domestic student deadline: 15 August 2026
Ready for some next-level competition?
International Student Research Competition
Designed for students working collaboratively under the guidance of a professor, this competition proposes an annual theme and relies on participants to develop a relevant research question/challenge and de ne the solution, including how funds will support the outcome.
Submission deadline: 22 June 2026
Kindly sponsored by
THE NONSILENT KILLER
It is increasingly clear that while architects and planners celebrate density, connectivity and efficiency, noise remains an invisible externality of vertical urbanism.
The evidence is unequivocal. Environmental noise is now recognized by the World Health Organization and the European Environment Agency as one of the most significant environmental health risks, second only to air pollution. Across Europe, the health and societal costs associated with noise exposure are measured in the tens of billions of euros each year, driven by sleep disturbance, cardiovascular disease, reduced cognitive performance and lost productivity. In England, the Department for Environment, Food & Rural Affairs (DEFRA) has estimated that the annual social and health costs of environmental noise are between £7 and £10 billion (US$9.3 to US$13.4 billion), driven primarily by sleep disturbance, annoyance and cardiovascular disease. Beyond these macro economic figures sits a quieter but equally corrosive impact: growing dissatisfaction with homes, neighborhoods and cities themselves, as residents struggle with disturbed sleep, chronic fatigue and a sense that their living environment is simply not fit for rest, recovery or long term well-being. This gap becomes acute as cities grow vertically.
Vertical urbanism places homes, workplaces, transport infrastructure and HVAC into unprecedented proximity. Developments are built above and alongside railways, metros and logistics corridors. Mixed use buildings stack residential floors over
retail, offices, leisure, energy centers and now, last-mile logistics. At the same time, the drive toward net zero accelerates the use of lighter, resourceefficient structures and highly serviced buildings. These trends are laudable— but acoustically consequential.
Tall buildings are susceptible to wind-induced creaking, and lighter, more efficient structures are more susceptible to airborne, vibration and structure borne noise. Unlike airborne noise, structure borne noise does not respect façades or glazing specifications. It travels invisibly through slabs, columns and cores, emerging as low frequency rumble, intermittent thuds or barely audible but physiologically disruptive sounds. Crucially, this type of noise often occurs without a visible source, a factor shown to increase annoyance and stress responses.
Sleep science tells us why this matters. Our ears work 24/7, and even when noise does not fully wake us, it fragments sleep architecture, increasing micro arousals and elevating heart rate. Studies on rail induced ground borne noise show measurable physiological responses at levels many would assume to be “acceptable.” Over time, this erosion of sleep quality carries a social cost: reduced productivity, poorer mental health, increased inequality and disproportionate impacts on vulnerable groups—children, the elderly, and neurodivergent individuals.
And yet, flick through most architectural discourse on vertical cities and you will find detailed discussion of form, energy, density and carbon—but almost nothing about how buildings actually feel at 2 a.m.
This is where the CVU has a vital role to play. If vertical urbanism is to be genuinely human-centric, sonic well-being must be elevated to the same level as thermal comfort, daylight and energy performance. Noise should not be mitigated after planning consent; it should inform massing, structural strategy and spatial zoning from the outset.
Encouragingly, this shift is beginning. In the United Kingdom, the Engineering and Physical Sciences Research Council (EPSRC)-funded NoiseNetworkPlus sets out to re-engineer the discipline of engineering, making noise a consideration at all stages of the design process, create a mission-oriented inter-organizational research and innovation network as a catalyst to bring together diverse, dynamic teams from across disciplines and build unprecedented noise research capabilities to deliver a healthier, quieter, society and environment. Internationally, research networks are now treating noise as a complex, systemic challenge—one that demands multidisciplinary collaboration between engineers, architects, planners, health experts and policymakers.
At Farrat, we specialize in controlling structure borne noise and vibration from railways, plant rooms, complex mixed use developments and manufacturing.
As buildings become more resource efficient, acoustic resilience must be engineered deliberately. The question is no longer whether we can build higher, denser and lighter—but whether we can do so without sacrificing sleep and health. If the quality of urban life is truly the goal of vertical urbanism, then noise can no longer remain its non silent killer.
OLIVER FARRELL
CVU 2026 AMERICAS CONFERENCE
The regional gathering brought together vastly different presenters and attendees from across two continents to build on the theme of “Change: Shaping Urban Growth through Density, Livability and Technology,” writes Martina
Dolejsova
The CVU 2026 Americas Conference, “Change: Shaping Urban Growth through Density, Livability and Technology,” was held at the Austin Central Library on 26 March, followed by a day of off-site tours on 27 March. The conference emphasized the growth and development of downtowns in the Americas, looking at key examples of new office and mixed-use projects, and city policies in multiple regions including New York City, Chicago, Miami, São Paulo, Dallas, and Austin. Presenters also shared how structural technologies and an emphasis on accessibility and inclusion are supporting growth and success in dense cities.
With an incredible turnout of over 200 attendees from across North and South America, as well as Europe and Asia, delegates joined CVU for thoughtprovoking presentations, stimulating conversation, astounding off-site tours, and multiple networking opportunities. The conference convened thought leaders, experts, policymakers, and industry representatives representing various sectors and interests across the Americas region.
Transformation of an American Downtown
Opening the day’s event, CVU Americas Region Co-Director Shelley Finnigan gave brief welcome remarks on behalf of the local CVU steering committee, welcoming attendees to the 2026 Americas regional conference and thanking the conference sponsors. Finnigan then announced the exciting news that Laura Jiménez, Senior Associate Principal at Krueck Sexton Partners, will be joining her as Codirector of the Americas region.
Next, CVU Board Chair Shonn Mills took to the stage in true Texas fashion, giving a big welcome to the crowd and presenting an overview of current tall building trends and the latest initiatives that the Council is leading. Following him, Davon Barbour, President and CEO at Downtown Austin Alliance, welcomed everyone to Austin and gave a presentation on the strategic plan priorities that the alliance is focusing on, including economic development. He stated that while downtown Austin is only 0.5% of the landmass of the urban area, it accounts for 10% of the assessed value,
making it a big player in the metro area’s growth and success.
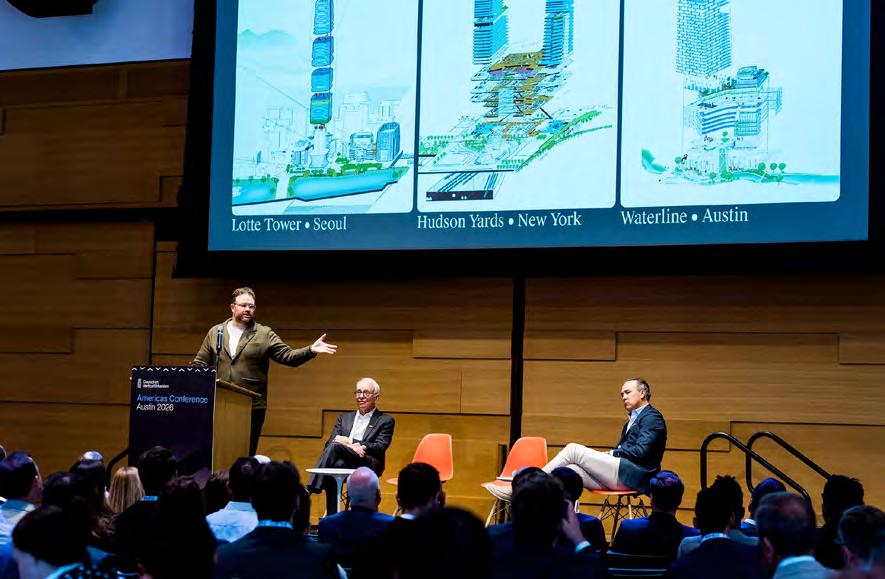
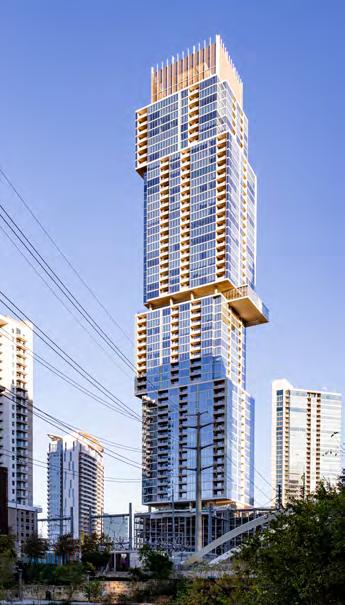
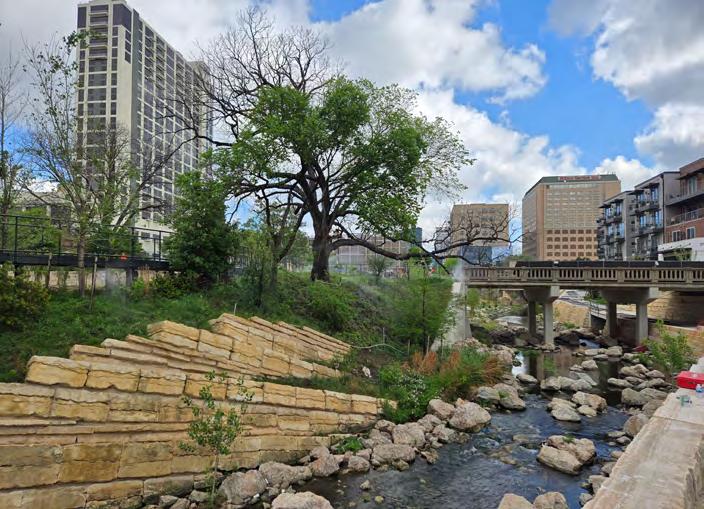
It was a great introduction, leading into the opening plenary centered on one of Austin’s most ambitious projects, the 74-story Waterline. Moderated by Franz Prinsloo, Senior Associate Principal at KPF, the plenary explored how the project reflects Austin’s rapid evolution. Lawrence (Larry) Speck, Architect and Senior Designer at LPA Design Studios, grounded the discussion with a historical perspective on the city’s development. Andrew Klare, Design Director, joined by a cameo appearance by James van Klemperer, Partner at KPF, via video, shared the design ambition behind Waterline. Explaining how the design opens up the ground plane, Klare illustrated how Waterline responds to Austin’s unique urban context, and how KPF creatively found inspiration from the strata lines of the neighboring Waller Creek. Designed as a vertical urban district, the project integrates residential, hospitality, office, and retail uses within a single structure.
Adding a developer’s lens, Seth Johnston, Executive Vice President at
Right—
Andrew Klare, Design Director, KPF, presents the Waterline project, as co-panelists
Larry Speck, Architect and Senior Design, LPA Design Studios, and Seth Johnston, Executive Vice President, Lincoln Property Co., look on.
Lincoln Property Company, shared that his company didn’t set out to be the tallest building in the city, but evaluated what was financially feasible, while considering what the public wanted. He shared how the project came to life, from early vision to the strategic decision to prioritize an office-led mixed-use program, connecting the reimagined greenbelt of the Waterloo Greenway with the revitalized Lady Bird Lake waterfront.
In total, the conversation demonstrated how density, connectivity, and the public realm can come together to define a more integrated urban future. The presentation was also a precursor to the highly anticipated off-site tours the following day of both Waterline and Waterloo Greenway.
Austin Rising
Attendees got a deeper look into the many developments that are transforming the city and supporting the exponential growth it is currently witnessing.
Presentations by Brett Rhode, Director at Rhode Partners, alongside Kris Swanson, Principal at DCI Engineers, gave unique insights into the development and design
of residential building The Independent. Gullivar Shepard, Partner and Landscape Architect at Michael Van Valkenburgh Associates, shared the process for the under-construction Waterloo Greenway. Both projects were also featured in off-site tours later in the week.
Other presentations showcasing the growth and development in Austin were given by Riley Triggs, Capital Delivery Consultant at Capital Delivery Services and Leonardo da Costa, Principal at LMN Architects, on the Austin Convention Center reconstruction, designed to be the first net-zero convention center in the world. Additionally, Andrew Kao, Architect and Associate at Gensler presented on the recently completed mixed-use Sixth & Guadalupe project, Austin’s tallest building until Waterline completes; Kevin Conway, Senior Associate Principal at Skidmore, Owings & Merrill on Verde Square; and Talmadge Smith, Principal, Design Director at Page, now Stantec, who gave insights into challenging and creatively addressing current city codes for design
success in the presentation Transforming North Austin with a Transit-Oriented Vertically Mixed-Use Neighborhood.
Technology and Innovation Driving Change
Moderator Shelley Finnigan guided the audience through a discussion that ranged from data-driven design decisions to structural engineering considerations for seismic and wind conditions, to adaptive reuse and envelope technologies.
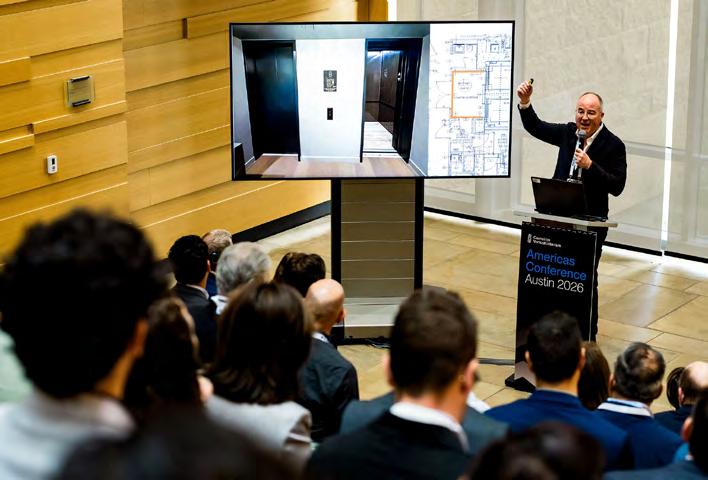
In this session, Stephen DeSimone, chairman and CEO at DeSimone Consulting Engineering, gave a presentation, “Managing Wind-Induced Effects on Tall Buildings,” addressing how
wind shapes every tall building, from subtle sway to acoustics, affecting structural designs and deeper considerations. Drawing on decades of experience, DeSimone explored how structural engineers often need to solve and understand factors, like wind, that go beyond the typical assumptions and how wind remains one of the most critical forces shaping tall building design. His presentation gave an inside look at the strategies and innovations engineers use, giving multiple project examples, such as 41 West 57th Street and The Greenwich in New York City, to address and mitigate these effects and push the boundaries of what’s possible in high-rise construction.
In particular, the prevalence of higher aspect ratios, particularly in the high-end luxury “pencil towers” that now dominate several corridors in New York City, has increasingly meant that the standard guidelines on peak acceleration may no longer be sufficient to assure the desired performance, necessitating wind-tunnel or digital validation during design, and if possible, monitoring post-construction.
“We’ve gathered a tremendous amount of information from continuous structural monitoring programs across the city,” DeSimone said. “We look at all of our projects to see where we are in reality, relative to the prediction. That
gives us the opportunity to calibrate our model and to improve.” Often this practice was undertaken on DeSimone’s own initiative, he added.
Joe Gulden, Associate Principal and Project Executive at IMEG, delivered an insightful presentation on The Evolution of a Structure: Modernizing Seismic Performance. Exploring the evolution of seismic design from the early 1980s to the Northridge earthquake event that changed design considerations in 1994, he evaluated how structural systems can be adapted and upgraded to meet evolving seismic demands, highlighting the importance of resilience, performance, and longevity in today’s built environment. Using the example of 651 Gateway in South San Francisco, his session underscored that modernization is not just about compliance—it’s about extending the life and value of our buildings while preparing them for future risks.
Highlighting the changing nature of data-driven decisions were Rodrigo Rocha, Partner at OSPA Group in Digital Twins for Vertical Urbanism: Mapping Tall-Building Data and Frans van Vuure, Director at UNS with Experience Design Tool: Assessing Cognitive Behavior. Van Vuure also shared that UNS recently opened an office in Austin, further
Left—
Laura Jiménez, Senior Associate Principal at Krueck Sexton Partners, moderates a panel of urban planning experts, including, from left to right, Sarah Kellerman, Senior Associate at Perkins + Will, Emily Liu, Director of the Planning and Development Department for the City of Dallas and David Snow, Planning Director for the City of Miami.
Opposite—
Stephen DeSimone, Chairman and CEO, DeSimone Consulting Engineering, explains the many interlocking factors that determine comfort and performance criteria for highaspect-ratio tall buildings.
demonstrating the global nature of the work being developed in the city. Other speakers in the session included Philip Castillo, Executive Vice President and Managing Director at Jahn/, talking about the transformation of the James R. Thompson Center for Google in Chicago; and Steven Pantazis, High-Rise and Technical Design Leader at RATIO, highlighting the process of designing for envelope design excellence in a climate changing world.
Planning for Change in the Americas
Leaders from across the public and private sectors examined how cities can create frameworks for growth that are equitable, sustainable, and accessible to all. Moderated by new CVU codirector for the Americas region Laura Jiménez, the panel brought together Emily Liu, Director of the Planning and Development Department for the City of Dallas; David Snow, Planning Director for the City of Miami; and Sarah Kellerman, Senior Associate at Perkins + Will.
Drawing from perspectives in municipal leadership and design practice, the discussion explored how planning communities across the Americas are adapting to shifting
—Stephen DeSimone, Chairman and CEO, DeSimone Consulting Engineering
economic pressures, climate-related challenges, and changing urban demands. Panelists shared insights on how cities and institutions are responding to forces both within and beyond their control, highlighting strategies that support resilient growth, inclusive development, and long-term urban accessibility.
New Paradigms of Sustainability, Attainability and Accessibility
One of the most fundamental, if underexamined dimensions of urban livability is attainability. In a session chaired by Mide Akinsade, Design Director and Principal at atelierMIDE and framed around the question of how cities can ensure safe, affordable, and accessible environments for people of all ages, backgrounds, and abilities, the presentations and discussion highlighted both the challenges facing the built environment and the innovative solutions emerging across the sector.
Christy Vanek, Director, Global Disability Accommodations & Accessibility at Otis Elevator Company, gave an inspiring presentation on the future of accessible mobility in vertical environments. Renée Strand, Owner/ Principal of Holst Architecture, shared how using mass timber as the structure
in the Julia West House in Portland, Oregon, delivered huge benefits, both in the construction schedule and in overall well-being for this permanent supportive housing project for low-income residents.
Dr. Alric (Ric) Andersen, Product Line Manager at Gerdau and member of constructsteel, addressed the decarbonization of the steel industry, focusing on near-term strategies and immediate opportunities for reducing carbon impacts within the construction sector. He shared case studies of projects that included the 56-story Torre Reforma in Mexico City, the 57-story Salesforce Tower in Chicago, as well as global lowto mid-rise projects in London, Tokyo, and South Korea.
Together, the speakers underscored how thoughtful design, material innovation, and inclusive infrastructure are central to creating more humane and sustainable cities for all.
Transformative Developments in the Americas
The agenda then turned to the forces reshaping cities in urban, environmental, and economic dimensions across the Americas. Chaired by CVU Director of Research and Thought Leadership Daniel Safarik, the presentations brought together leading practitioners whose
work is redefining how growth and resilience are approached in rapidly changing contexts.
From the presentation of Alberto Vidal, CEO at Vidal Arquitectos, who explored urban resilience through the Libertad HO Mons Civitas project in Monterrey, Mexico, to the focus on placemaking as a driver of urban vitality by Juan Rodriguez, Associate Principal at MHS Architecture, the session overall emphasized the evolving relationship between design and city-making, particularly amidst the rising skylines of New Jersey cities. Speaker Daniel Villafranca, Director of Sustainability and Innovation at Portafolio Immobiliario additionally examined how performance measurement can actively inform design decisions rooted in nature-based strategies, citing examples from San José, Costa Rica.
Stephane Domeneghini, Executive Director at Tall Solutions | Grupo FG, FG Empreendimentos and Luis Villanova, Head of Urbanism and Vertical Architecture at Talls Solutions expanded the conversation beyond major metropolitan centers, presenting the Brazilian case for tall buildings as catalysts for regional development that creates value. Having worked on some of the tallest existing and under-
Top—
City of Austin
Mayor Pro Tem
Jose “Chito” Vela III delivered the proclamation that 26 March would officially be “Vertical Urbanism Day.”
Bottom— Attendees relax after sessions on the amenity deck at The Republic.
construction buildings in Brazil, such as the completed One Tower (290 meters) and the in-the-works Senna Tower (544 meters) both located in Balneário Camboriú, Domeneghini shared insights of working with multiple stakeholders to achieve the best outcome in design and quality of life for tenants and the neighborhood. Villanova added to the presentation by giving a history of planning for tall buildings in Brazil and the relationship between density, zoning codes and city centers.
The Office of the Future | The Future of the Office
The closing plenary brought the question of “How has the workplace been redefined in today’s downtown cities?” into sharp focus, through two landmark projects that are helping shape the next generation of urban office environments.
James Shea, Managing Director at JPMorganChase, presented the new JPMorgan Chase World Headquarters in New York City (see page 38), offering insight into how one of the world’s leading financial institutions is reimagining the workplace for a new era of talent, flexibility, and urban presence.
Joining him, William (Bill) Butler, Partner at Pelli Clarke & Partners, shared the story behind Block 185 in Austin, also known as the “sail tower” and newly occupied by Google. He presented how this project is contributing to the continued transformation of Austin’s downtown core and redefining office culture.
Afterwards, CVU CEO Javier Quintana de Uña furthered the conversation with a series of questions for further insights and inspiration.
The dialogue underscored a key theme emerging across global cities, in that the definition of “Class A” space is evolving. It is moving toward environments that prioritize quality, connectivity, experience, and long-term urban vitality.
Celebrating “Vertical Urbanism Day” at The Republic
The networking reception held at The Republic, one of the city’s most prominent new office high-rises redefining the downtown skyline, kindly hosted by Lincoln Property Company, offered delegates a chance to continue the conversations from the day.
As one of the city’s boldest new additions to the skyline and a remarkable setting for connection and conversation, this 46-story office high-rise, completed in 2025, is across from the historic Republic Square Park, where Austin’s
first city lots were sold in 1839. The Republic symbolizes the city’s continuing evolution of entrepreneurial energy, progressive design culture, and dynamic urban lifestyle.
During the reception, Mayor Pro Tem Jose “Chito” Vela III joined attendees and shared the official proclamation of Kirk Watson, Mayor of the City of Austin, that 26 March 2026, will be recognized as Vertical Urbanism Day. It was a meaningful recognition, reflecting the growing understanding that thoughtful vertical development is essential to addressing the challenges of urban growth worldwide, and recognizing its role in shaping more sustainable, resilient, connected, and livable cities.
With sweeping views of downtown, state-of-the-art workplace amenities, and a setting that embodies innovation and architectural ambition, the evening was the perfect opportunity to build new relationships and reflect on the day.
Tying it Together
At the culmination of the conference, delegates went to attend off-site tours on the morning of Friday, 27 March. This included 44 East Avenue, The Independent, Waterline and the Waterloo Greenway.
The CVU 2026 Americas Conference ultimately reinforced that the future of urban growth across the region will not be defined by singular solutions, but by the integration of density, technology, and human-centered design. Across presentations, discussions, and site visits, a consistent narrative emerged: cities are evolving through collaboration between public and private sectors, through innovation in materials and systems, and through a renewed commitment to inclusivity, accessibility, and environmental performance.
From Austin’s rapidly transforming skyline to broader examples across the Americas, the conference demonstrated that successful urban development hinges on creating places that are not only efficient and economically viable, but also connected to their communities and responsive to long-term challenges.
Unless otherwise
all
Image credits—
indicated,
images are courtesy of Council on Vertical Urbanism.
Top Left— The Independent (Rhode Partners, 2019).
Top RIght— Waterline (Kohn Pedersen Fox Associates, 2026).
Above— Waterloo Greenway Project, Austin.
AJAY SURESH (CC BY-SA)
DANIEL SAFARIK
QUINTIN
SOLOVIEV (CC BY-SA)
OIL TOWERS
Photographer Leonid Furmansky recounts the inspiration for, and experience of, photographing empty towers related to the oil industry in downtown Houston during the COVID-19 lockdown.
In 2019, while I was deep into my commercial architectural photography career, I felt an itch to create something that was entirely mine—my own language, not a collaboration with architects or clients. Commercial work is rewarding, but you’re ultimately a messenger for someone else’s vision. I wanted a body of work where I had full control, where every image was my music. When the pandemic hit in 2020, I saw a strange silver lining. I’d always dreamed of photographing an empty city—like the abandoned worlds I grew up watching in movies. Houston, with its incredible 1970s–1980s oil boom towers, became my focus. I lived in Austin, but Houston’s scale and its architectural history drew me in. Those towers were monuments to a moment when design was bold, materials were pushed to their limits, and firms like
SOM were experimenting in ways that would be prohibitively expensive today.
I spent two years photographing Houston—mostly at night, sunrise, and twilight—when the light was perfect and the buildings were transparent. I wanted to isolate the towers, to remove the city around them, so viewers could project their own imagined place onto the images. Like Fight Club, where you only understand the twist at the end, I wanted people to move through the work without knowing the city until the final reveal.
I snuck into countless parking garages sometimes, and occasionally got caught; other times I paid absurd fees for access. But Houston was unusually accessible compared to places like New York, where rooftops are locked down and security is tight. Over time, the city opened up to me. Developers saw my work; Hines
invited me to photograph Pennzoil Place; I gained access to 800 Bell Street, one of the most beautiful towers I’ve ever seen, which is still empty after COVID-19, awaiting retrofitting.
The project, Oil Towers, kept evolving. Portfolio reviewers pushed me to refine the concept. The book I had planned to go with it was nearly printed before I realized it needed major changes—adding architects, developers, dates, budgets—so readers could understand how oil money shaped these structures. It felt like a breakup when the original book deal fell apart, but in hindsight, it was the best thing that could have happened. The work is stronger now.
The project ended in 2021, when I stood atop 800 Bell Street at sunrise and watched the parking lots fill again. Houston was back. That moment told me
Opposite left— 800 Bell Street, Houston (Welton Becket, 1963).
Right— TC Energy Center, Houston (Johnson/ Burgee Architects, 1983)
Club Quarters, Houston (Joseph Finger, 1929).
Bob Lanier Public Works Building, Houston (Wilson, Morris, Crain & Anderson, 1968).
800 Bell Street, Houston (Welton Becket, 1963).
Image credits— Unless otherwise indicated, all images are courtesy of Leonid Furmansky.
the window had closed; the desolation I’d captured was unrepeatable unless another pandemic happened, which I hope never does.
Since then, I’ve continued photographing other places—especially Oklahoma, where I’ve spent nine years documenting rare buildings by Bruce Goff, Frank Lloyd Wright, and others. I’m currently printing an exhibition in Tulsa, processing years of work in a matter of days. It’s exhausting, but worth it.
My love for towers goes back to my early days in Austin, photographing them with borrowed school equipment. Towers are like a city’s family portrait—you see
them from the air, from the street, from every neighborhood. They shape how people live and work. And I’ve always been drawn to the challenge of capturing them from unusual vantage points.
Before photography, I was a BMX rider. Moving from Brooklyn to rural Texas was a shock, and BMX became my escape—my way to reach the bus, reach the city, reach something that felt like home. A girlfriend snuck me into a darkroom once, and seeing film develop felt magical. I picked up a camera to photograph my friends riding, and that’s where everything began.
Today I still live in Austin—its economy is booming, and opportunities
are everywhere. Houston is slower, but it’s become a second home.
Chicago is another city I dream of documenting someday; Michael Wolf’s The Transparent City was a huge influence on me, and Chicago’s architectural soul is unmatched.
Oil Towers is finished, but the work continues. Cities reveal themselves over time, and I keep returning—because every trip opens another door.
The Oil Towers series was exhibited as Beautiful City, Empty City at Architecture Center Houston 2 October 2023 – 19 January 2024. Select prints from the exhibition remain on private display in the offices of Stantec, Indeed Tower, Austin.
Amid France’s construction pause, driven by regulation and a weak office market, we should rethink how verticality, paired with thoughtful planning, can foster sustainable, human-centered urbanism for future cities, write Nayla Mecattaf and Jean-Luc Crochon in their new book, The Virtues of Verticality.
The ball is in the court of the urban planners who shape the future of our regions. As we have seen, carbon emissions from the construction sector will soon cease to be the primary concern, thanks to research carried out, but global warming is already a reality. This understanding is fundamental in guiding our development. Density constitutes a tool, and verticality is a possible response to certain situations. Numerous examples around the world illustrate this approach.
Despite the fact that 80% of the world’s buildings exceeding 200 meters were built in the last 20 years, the subject of the high-rise is not currently on the agenda in France. The challenging global environment and a sluggish officebuilding market complicate the task. However, it is during these times of crisis that projects are conceived and opportunities created, and regulatory measures must enable revival. Let us encourage initiatives and capitalize on our strengths in Paris and beyond, in those places where planning regulations authorize vertical development as a solution to meet market demands.
High-rise buildings have an amplifying effect. So, the question is not how much, but how this building
typology can help us to shape urban development by embracing its virtues. Verticality is not an obligation; it is discretionary. The introduction into regulatory tests of contextualized assessment elements that highlight the value of verticality presents no major risk. The real-estate market itself will moderate. It is an opportunity rather than a demand. As towers undergo their carbon transformation, a new kind of urbanism must be written. Let common sense prevail.
Challenge Preconceptions
Let’s take advantage of this period of observation to address the issue and propose constructive solutions to preserve the spirit of these regulations while improving them. Without rewriting the existing texts, shouldn’t we consider the relevance of regulations without context? Shouldn’t we consider adding assessment criteria that could have a positive effect on the carbon footprint of construction?
Location
Is it right that the carbon footprint for a building should be considered the same throughout France and its overseas territories? And that it should be the same in urban and rural areas?
It is surprising that these regulations are completely delocalized, or unrelated to the site of construction. A surplus of office space has followed the current crisis, resulting in high vacancy rates, but these are unevenly distributed, as they don’t take into account the broader context and existing availability nearby.
Integrating this concept into the regulations would seem feasible and logical, and would allow densification only when relevant.
Right— Buildings subject to the “code du travail,” office high-rise and residential high-rise regulations (fourth category of the French Building and Housing Code).
Right— Trinity’s 3,500 m2 of landscaped space covers the roads, greening and reconnecting two formerly separated neighborhoods.
Proximity of Public Transport
It has been demonstrated time and again that the carbon footprint of the building users’ transport is much greater than that of the building’s construction. We should therefore introduce a carbon criterion based on the proximity of public transport. This would enable the development of a new form of urbanism which, logically, should enable local planning regulations to provide height exemptions around transport hubs. At the time of writing, cities such as London and Rotterdam appear to have already incorporated this into their urban regulations.
Introduce Use Intensity and Chronotopia
Because the concept of single-use buildings has had its day, briefs are evolving towards mixed-use.
Let’s incorporate into the calculation of the building’s carbon footprint an indication of the intensity of use on land that is already sealed, taking into account the capacity authorized by local planning regulations.
Let’s incorporate into the calculation of the building’s carbon footprint an indication of the intensity of use, relating the built area to the number of users.
Let’s incorporate into the calculation of the building’s carbon footprint an indication of occupancy times, relating the built area to time used.
Let’s incorporate into the calculation of the building’s carbon footprint an indication of space made available for external use.
Introduce Re-use
Let’s incorporate into the calculation of the building’s carbon footprint an indication of levels of re-use, considering the regulations specific to each refurbishment project, promoting and encouraging this approach while addressing questions of guarantees and responsibility.
But above all...
Left and right—
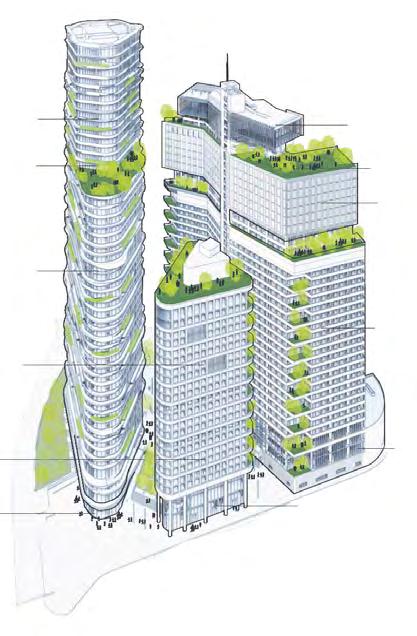
1 O 2)
2 Café
3 Gym/ Restaurant/ Business center
4 Co-working 2)
5 Co-living 2)
6 Retail units 2)
7 Public amenities / Roof terrace 2 )
8 Hanging gardens
9 Hotel / Gyms 2)
10 O 2)
11 Retail units / Restaurant 2)
12 Retail units 2)
Humanize
In France, the benchmark environmental rating is the high environmental quality (HQE). In 2010, we registered the trademark “HQhE” with the National Industrial Property Institute (INPI). This rating incorporates the notion of use and user at the heart of the project, with a second “h” introducing the human factor (high human and environmental quality). The aim of this was as a reminder that the construction of a building should not be an end in itself, but rather a means of meeting the needs of its users and their well-being. In the words of Mies van der Rohe, “Form follows function.” While the idea is not new, it is important to remember that certification for the sake of certification is meaningless. Our greatest reward is
to see our buildings come to life thanks to their occupants, to observe their satisfaction and remember that a building that is 100% occupied is the highest certification, because its carbon is 100% useful. To be desirable and widely acclaimed, you must put “human” at the heart of the project.
Make it Desirable
We are convinced that a return to office is underway, as it is both advisable and necessary to the recreation of a balanced society. As a place to come together, the workplace plays a crucial role in creating or recreating social links between individuals. When you’ve finished school, what better place to meet new people? Architecture has a responsibility to design places and atmospheres that contribute to the
well-being of those who frequent them. We are therefore committed to designing desirable workplaces that encourage social interaction and collective intelligence.
We put the idea of serendipity at the heart of our designs, incorporating spaces that allow users to cross paths with each other by chance and spontaneously. This takes shape with the creation of spaces that are welcoming and have a strong sense of identity, and with the desire to get together and chat, particularly for the hyperconnected and well-informed younger generations. A true gift from above, natural light is enhanced by the virtues of verticality, which offer their benefits to a wide public. Finally, by sharing breath-taking views over the city, this urban form amplifies feelings of well-being and connection with the city. The virtues of verticality encompass the joys of verticality.
Trust
The carbon footprint of 100%-leased building is 100% useful, and cooling islands, which help to mitigate the effects of global warming, are the key to urbanism of the future. The question is not to understand the regulatory framework, but rather to understand whether a project is appropriate for its context. Verticality is an urban solution that, when appropriate, also makes sense from an environmental point of view. Of course, it is not suitable everywhere, and we have fully understood its inextricable link with transport hubs. It remains a tool available in policies to densify areas and preserve the planet from the continuous nibbling away of its fertile land. Rebuilding the city on the city will ensure this evolution.
When design is led by common sense, doesn’t it produce architecture that is harmonious and elegant? Might this be an implicit response to the question of what constitutes beautiful architecture?
Nayla Mecattaf and Jean-Luc Crochon are principals of Cro&Co Architecture and CroMe Studio. This essay is excerpted from their new book, The Virtues of Verticality.
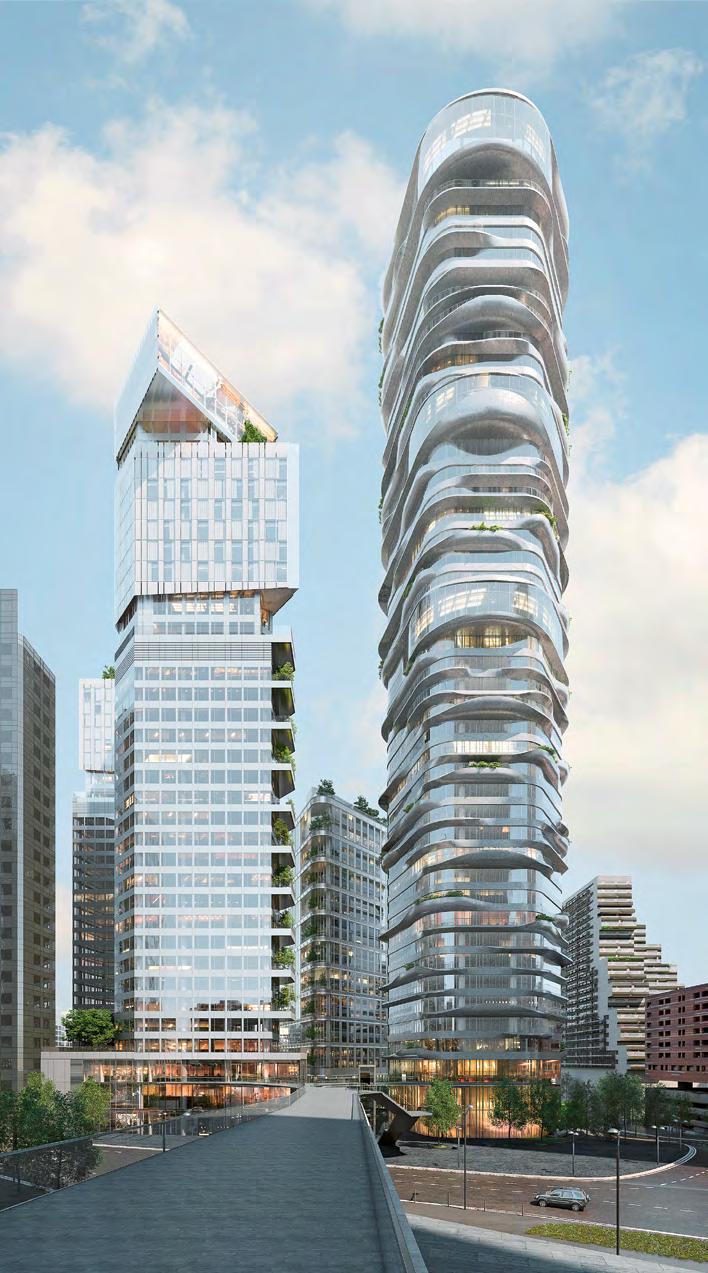
Odyssey, Courbevoie, France, elevates the principles outlined in this article to the next level.
THE PARISIAN CONTEXT
The French capital tackles the challenge of how to combine density, heritage, natural spaces, and the joy of living in the city, writes Nathalie Régnier-Kagan.
The evolution of Paris in the early 21st century raises important questions about the future of the city and its metropolitan development. Historically shaped by strict urban regulations and architectural traditions, Paris now faces the challenge of adapting to contemporary needs such as increased density, environmental sustainability, and the integration of new architectural scales. In particular, the re-emergence of high-rise buildings—once rejected in the city—has become a key topic of debate. Through historical reflection and a series of urban case studies, the book from which this essay is excerpted explores how vertical architecture might contribute to the transformation of Paris while maintaining a balance between urban development, architectural quality, and environmental concerns, with an in-depth consideration of a measured approach to verticality. It is in this spirit that the architect Michel Kagan initiated his research, which was continued for several years after his passing by a group of architects at Ecole Nationale Supérieure d’Architecture de Paris Val de Seine, as well as in other schools in France, Italy, Canada, and South Korea.
Historical Layers of the Parisian City Historian and architect Jacques Lucan characterizes contemporary Paris as
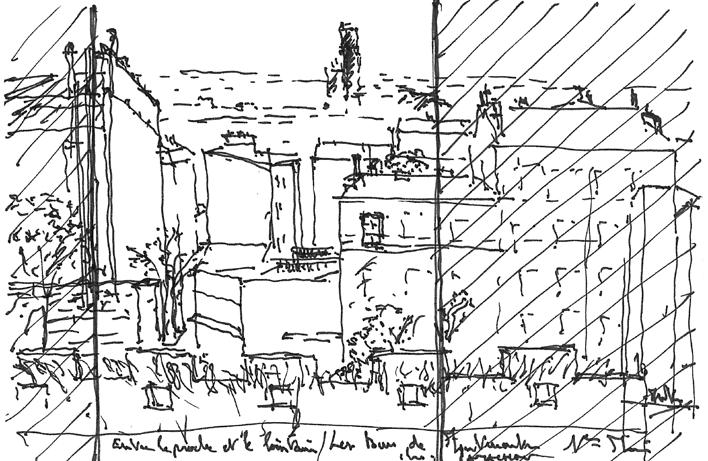
composed of three “sedimented worlds.” The first is the homogeneous Haussmannian city, shaped by 19thcentury regulations and urban planning principles that produced the iconic Parisian boulevards and uniform building typologies. The second is the heterogeneous city, formed by villages and suburbs that were gradually absorbed into the metropolitan fabric. The third layer is the modernist city, created through postwar urban renewal, particularly during the economic boom of the “Thirty Glorious Years” after World War II. During this period of rapid economic expansion, numerous high-rise developments appeared across Paris, reflecting modernist urban ideals. Areas such as Jussieu, Montparnasse (see Figure 1), Porte Maillot, the Olympiades, Front de Seine, Place des Fêtes, and the Orgues de Flandre saw the construction of tall buildings intended to represent progress and modernity. However, this wave of modernist architecture came to an abrupt halt in 1977 when a presidential decree effectively banned the construction of towers in Paris.
In the decades that followed, Paris adopted a form of neoHaussmannian urbanism. Urban planning policies emphasized the continuity of the traditional city fabric: streets, building alignments, parcels,
and uniform building heights. This approach dominated Parisian architecture for approximately three decades, even as major global cities embraced ambitious skyscraper projects. During this time, renowned architects such as Norman Foster and I.M. Pei designed groundbreaking towers elsewhere in the world, highlighting the contrast between Paris’s restrictive policies and international architectural experimentation.
The Gradual Return of High-Rise Architecture
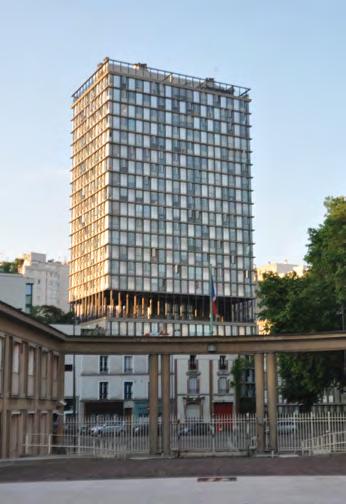
Signs of a change in perspective began to emerge in the 1990s. A notable example was the recognition of the Croulebarbe Tower, designed by Edouard Albert in 1961 (see Figure 2). Standing at 67 meters, it was the first residential “skyscraper” in Paris, and was listed as a historic monument in 1994. Beyond its innovative construction techniques, the tower demonstrated how a tall building could integrate successfully into the surrounding urban environment.
By the early 2000s, the Paris municipal government reopened discussions about building height in the city. High-rise structures gradually returned to the architectural agenda. Several major projects illustrated this shift and seem to mark the city’s boundaries like a “new
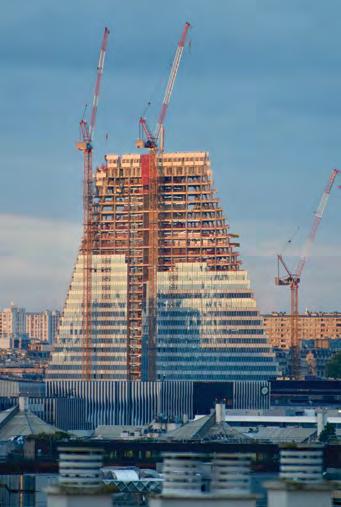
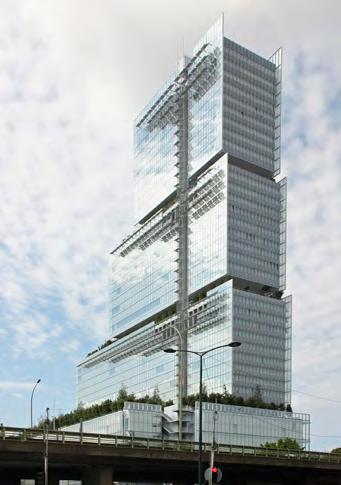
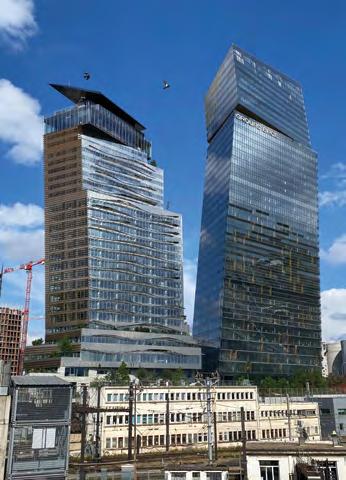
Propylaea.” Swiss architects Herzog and de Meuron proposed Tour Triangle, a 200-meter triangular building near Porte de Versailles in 2008, currently being completed following numerous legal appeals (see Figure 3). Renzo Piano was commissioned in 2010 to design the 160-meter tower for the Tribunal de Grande Instance at Porte de Clichy, completed in 2017 (see Figure 4). In 2011, Jean Nouvel’s Tours DUO project—two towers measuring 122 and 180 meters— won the competition for development in the Masséna-Bruneseau district inaugurated in 2022 (see Figure 5). Several policy and economic factors supported this renewed interest in vertical development. The 2014 ALUR law removed the COS (Coefficient d’Occupation des Sols), a regulatory mechanism that limited building density
Figure 1— View of the Montparnasse Tower from Montmartre, sketch by Michel Kagan, 1998.
Figure 2 (left)— Croulebarbe Tower, Paris (Edouard Albert, 1961).
Figure 3 (right)— Tour Triangle (Herzog & de Meuron Architekten, 2026).
ROBERTO CASATI (CC BY-SA)
VINCEVINSS (CC BY-SA) MICHEL
through floor-area ratios. By eliminating this restriction, the law opened new possibilities for construction and densification, partly as a strategy to combat urban sprawl. At the same time, Paris sought to maintain its position among Europe’s major capitals, strengthen its global attractiveness as a tourist destination, and expand housing supply—particularly social housing, with the goal of reaching 30% by 2030.
Concerns About Densification and Urban Quality
Despite these ambitions, critics warn that increased density may negatively affect the urban environment if not carefully planned. Sociologist Dominique Lorrain notes that densification often reduces green spaces and fails to adequately address infrastructure needs such as roads, parking, and public facilities. Within the broader context of the “Greater Paris” project, the metropolitan region is increasingly viewed as a competitive asset in the global hierarchy of megacities.
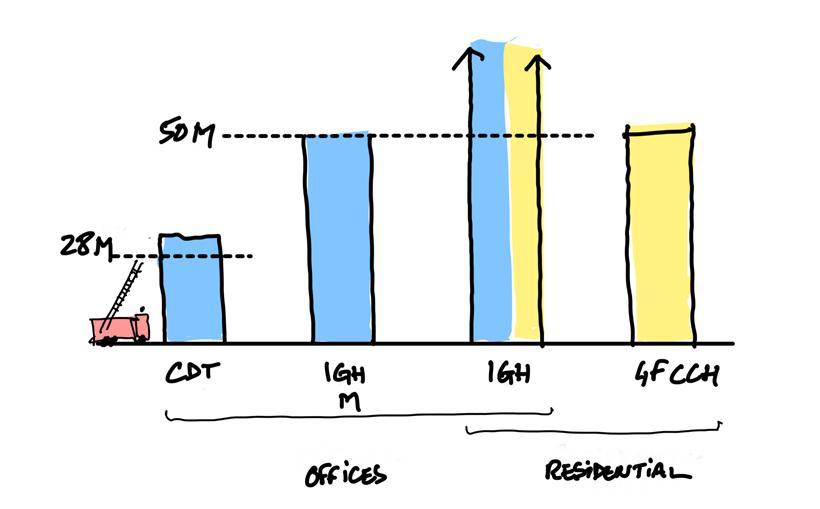
However, without a clear vision for sustainable urban development, the risk remains that environmental quality and living conditions may deteriorate. In some cases, local residents have successfully challenged large-scale development projects. For example, in the Bercy-Charenton district’s proposed high-rise constructions were reconsidered following opposition from residents. As a result, building heights were limited to 50 meters for housing and 37 meters for offices, while additional green spaces were incorporated into the planning.
These debates highlight the need for an approach that balances densification with architectural quality, integration into existing urban contexts, and the preservation—or even “creation”— of new natural spaces. The goal is not simply to increase density, but to create a harmonious urban landscape where different scales of development coexist with nature.
In a context of economic and climate crisis, at a time when monofunctional business districts are being called into
question, the reinvention of the office, programmatic mix, and the renaturation and greening of land are on the agenda.
Vertical Expansion and the “Metropolitan Tower” Concept
In response to these challenges, the concept of the “metropolitan tower” is proposed as a strategic tool for urban intervention. Rather than promoting high-rise construction everywhere, the idea is to identify specific locations where vertical architecture can resolve complex urban situations, provide symbolic landmarks, and contribute to controlled densification. The goal is to design towers with distinctive features that are sensitive to the urban scale, capable of accommodating mixed-use developments and public spaces accessible to residents, that consume less energy or are even self-sufficient.
This concept is presented alongside another idea: the “green grid,” which explores the horizontal expansion of the city and the integration of natural systems into the metropolitan territory. Together, these two strategies—
Figure 5— Tours DUO (Ateliers Jean Nouvel, 2021).
Figure 4— Tribunal de Paris (Renzo Piano Building Workshop, 2017).
vertical densification and horizontal ecological planning—seek to balance urban growth with environmental sustainability.
The concept of the metropolitan tower was explored for several years by project groups at School of Architecture at the University of Paris – Val de Seine through a series of architectural experiments conducted on five sites: four within Paris, and one in the nearby suburb of Ivry-sur-Seine. Each site represents a distinct urban condition and demonstrates how strategically placed towers might improve urban organization and spatial relationships while creating new living space.
Case Study 1: Bastille – Avenue Daumesnil
The Avenue Daumesnil site is located near the Place de la Bastille in a historically structured Haussmannian district. The site contains a residual urban space behind the Opéra Bastille, bounded by a blank façade, the Viaduc des Arts (a converted railway viaduct) and the Quinze-Vingts Hospital.
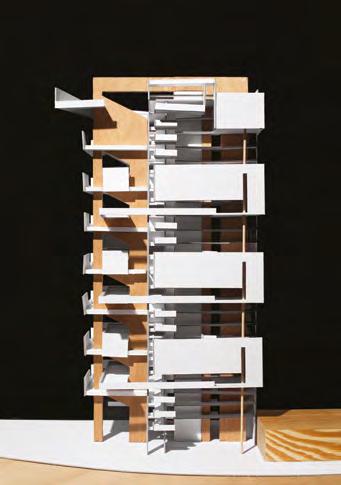
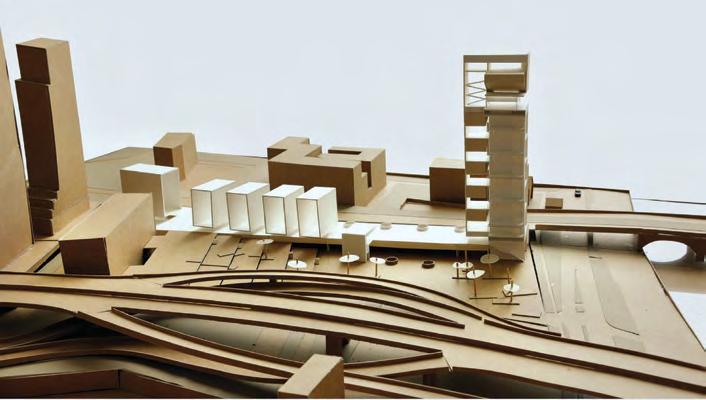
This neglected space offers an opportunity for urban densification and spatial reorganization. The proposed metropolitan tower serves as an urban landmark that visually terminates the horizontal line of the viaduct with a vertical element. The tower contains a unique program: seven stacked cinemas designed to intensify cultural and social activity in the area.
Inspired by the towers of medieval towns that marked important urban corners, the building extends public space vertically while maintaining strong connections to the surrounding neighborhood. By activating the underused area behind the opera house, the project aims to create a lively urban environment acting as a “social catalyst” and strengthen the relationship between existing urban elements (see Figure 6).
Case Study 2: Front de SeineBeaugrenelle
The Front de Seine district, located in the 15th arrondissement, represents the modernist urban planning of the 1960s. Inspired by the Athens Charter,
the area features high-rise residential and office buildings arranged around a large elevated pedestrian slab. This design separated pedestrian circulation from automobile traffic, reflecting the utopian urban ideals of the time. However, the resulting environment has often been criticized for its lack of integration with the surrounding city, and its absence of a connection between street level and the pedestrian deck.
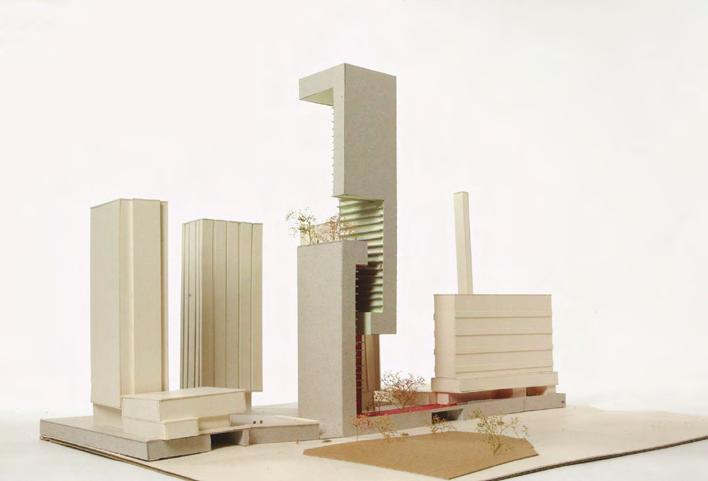
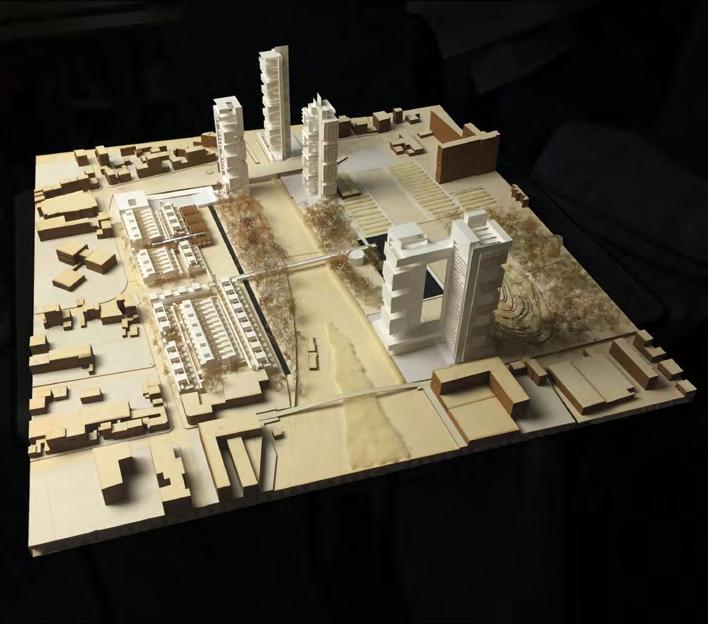
Designing “metropolitan towers” in this neighborhood is not intended to challenge existing urban planning, but to improve it. By introducing a limited number of new towers at strategic points, the project aims to address the spatial disconnect between the slab and street level while enhancing the overall urban environment (see Figure 7) These would accommodate mixed uses, including housing, offices, and public facilities, while respecting the existing infrastructure. In 2017, the Front de Seine plaza was completely renovated, with 50% of its surface covered in greenery, and the buildings received the Remarkable Contemporary Architecture award.
Figure 7 (right)— Front de Seine, model (C. Wawrzyniak, 2005).
Case Study 3: Porte Maillot
The Porte Maillot site represents a major gateway to Paris along the historic axis that connects the Louvre to the La Défense business district. Over the decades, many architects— including Robert Mallet-Stevens, Henri Sauvage, Auguste Perret, and Le Corbusier—proposed ambitious tower projects for this location, but none were realized.
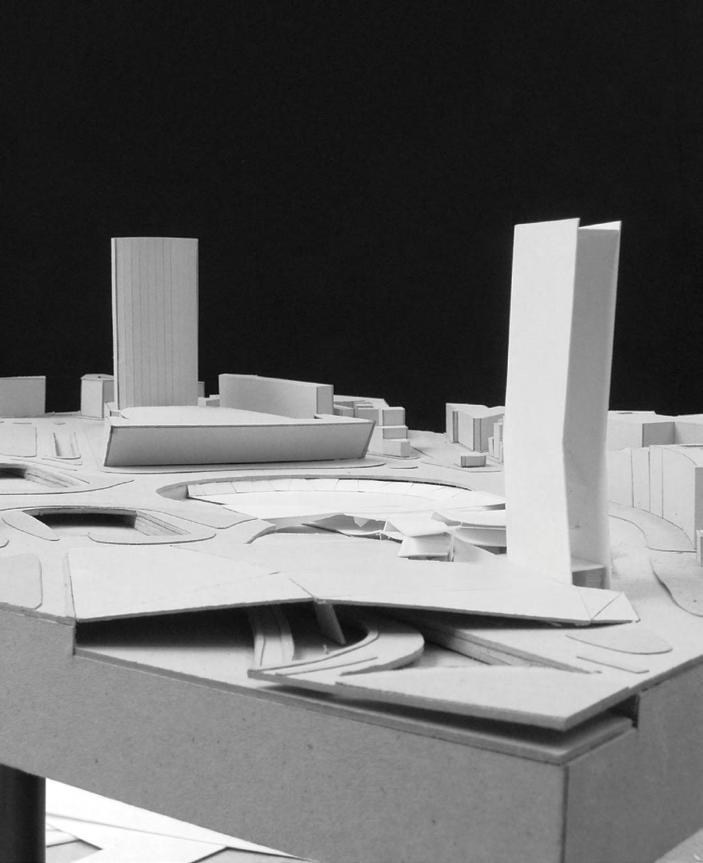
Instead, the area evolved primarily as a transportation hub dominated by road infrastructure, including a large roundabout above the buried ring road. The nearby 134-meter Hotel Concorde Lafayette tower by architect Guillaume Gillet provides a vertical landmark. The proposal for metropolitan towers at Porte Maillot seeks to reinforce the architectural identity of this important entrance to the city. Rather than focusing solely on infrastructure, the project aims to create a strong urban composition that integrates architecture, public space, and landscape (see Figure 8).
Recent developments in the area include plans to transform the roundabout into a new urban axis with a landscaped central median and improved connections to the Bois de Boulogne. Underground, a major multimodal transportation hub is being developed to link metro, tramway, motorway, and airport connections.
Figure 8 (top)— Porte Maillot, model (Fung Tat Wai, 2008).
Figure 10— A version of New York’s High Line is proposed for Ivry-sur-Seine (E. Dufour, S. Filali, P. Rodriguez, 2022).
ENSAPVS
ENSAPVS
Case Study 4: Masséna-Bruneseau
The Masséna-Bruneseau district in the 13th Arrondissement represents a large-scale redevelopment zone along the Seine. Built partly over railway infrastructure associated with Austerlitz station and former industrial brownfields, the area consists of large open spaces with relatively autonomous buildings.
Architect Yves Lion proposed an “urbanism of towers” for this district, combining height, mixed-use development, and environmental considerations to create a new urban center. The goal was to form a distinctive skyline for Paris while treating towers as elements of a broader urban landscape rather than isolated objects. Our projects positioned the vertical element as a landmark, at the junction of the Seine and the Boulevard Périphérique (see Figure 9).
Today, the development of the Bruneseau Nord project slowed, following the completion of Jean Nouvel’s Duo Towers and the reevaluation of this congestion-inducing urban planning caused by the COVID-19 pandemic. Current plans limit residential buildings to approximately 50 meters along Boulevard du Général Jean Simon. Large portions of land near the ring road remain undeveloped: they are expected to be converted into green spaces and pedestrian walkways in the short term, for the benefit of new residents.
Case Study 5: Ivry-sur-Seine –Parc des Cormailles
The final case study shifts to Ivry-surSeine, a suburb south of Paris characterized by industrial heritage and experimental housing projects. The site surrounds the Parc des Cormailles, a large green space built on former industrial land and integrated with complex underground infrastructure designed to manage rainwater and prevent flooding.
The area is surrounded by significant postwar housing projects, including the Cité Maurice Thorez (1953), the Lénine and Raspail towers by architect Renée Gailhoustet, and the distinctive “Les Étoiles” complex designed by Jean Renaudie. The project is particularly notable for its pyramid-like structure of triangular terraces and planted gardens, offering diverse apartment layouts and mixed uses. Despite their architectural significance, many of these buildings are in poor condition and require renovation. The surrounding urban fabric also lacks coherence.
The proposed intervention focuses on completing the urbanization of the area while preserving the central park. New housing developments—both horizontal and vertical—would be introduced along with shops and public facilities. Strategically placed towers could help connect neighborhoods separated by railway infrastructure while
reinforcing the urban structure around the park (see Figure 10).
The Vertical Garden City
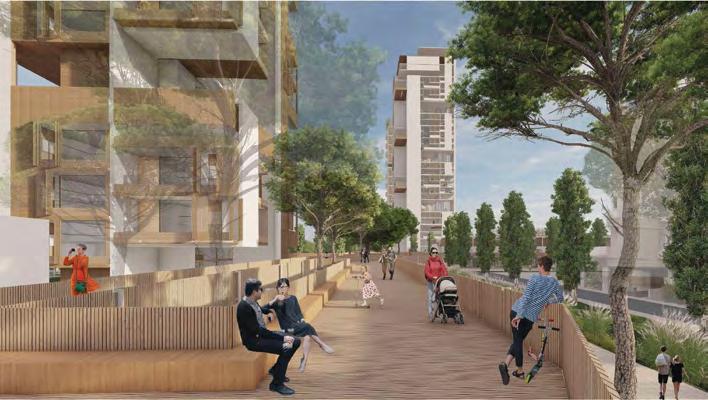
The 21st-century metropolis will inevitably feature vast urban parks, designed to reduce soil sealing and increase greenery, boost water retention, and reintroduce biodiversity into the city, all while meeting the ever-growing demand for housing. The concept of the “metropolitan tower” has evolved into a “territorial” vision, proposing a shared complex of towers multiplied and juxtaposed with horizontal urban developments, on sites already undergoing major contemporary metropolitan transformations (see Figure 11).
Following the “Yellow Vests” protests, it became clear that the city needed to be rethought, finally taking decentralization, proximity, social diversity, and its various uses into account. The city of tomorrow is the “15-minute city,” a polycentric urban model with its own facilities and services, designed to prioritize sustainable mobility, relieve congestion on public transit, and escape the “endless city.”
We considered the tower as an extension of the existing city—not as an additional source of “congestion” or a “bigness” in the city lacking any particular quality or identity, but rather as a structure with a very strong connection to its site. By developing an architectural design method that identifies the relationship to the ground, the relationship to the sky, and the references to the context and surrounding building heights—while also allowing careful consideration of materials, structure, quality of interior spaces, and their natural light—we established a learning tool that enables us to address the complexity of contemporary situations without creating a rupture with the historic city.
The idea of incorporating greenery into buildings originated in Southeast Asia as a way to compensate for the loss of connection to nature and the lack of outdoor spaces in dense urban areas, as well as to facilitate natural ventilation and cooling in tropical climates. Examples of
11— The “garden city” model represents work at ENSA PVS to transform from a ‘typological’ to a ‘territorial’ vision.
(C. Benoit, et al. 2019).
towers built in the 1970s, such as Charles Correa’s Kanchanjunga Apartments in Mumbai, or Paul Rudolph’s Colonnade Condominiums in Singapore, as well as more recent projects by WOHA in that city-state, have demonstrated the potential for creating genuine green outdoor spaces in high-rise buildings. In the context of the climate transition, vertical urbanism must offer hanging gardens, to create places where life is good at height.
Figure
Figure 12— Paris – Ivry-surSeine feasibility sketch by Nathalie R. Kagan (2016).
Conclusion
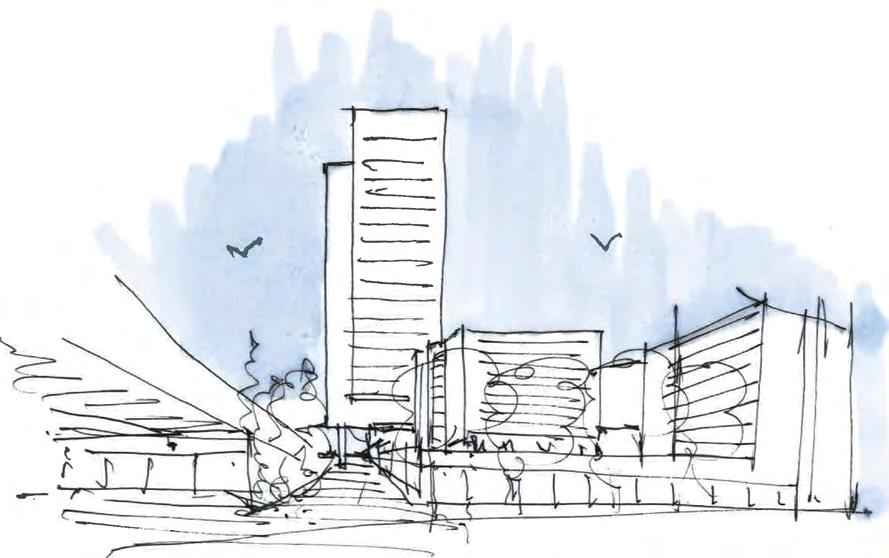
The future development of Paris requires careful consideration of how density, architecture, and environmental sustainability can coexist. The “metropolitan tower” concept does not advocate the widespread construction of skyscrapers, nor a race to the greatest height, but rather the strategic placement of vertical structures in specific urban contexts across the Greater Paris area. When carefully integrated, such “minitowers” can resolve spatial problems, create symbolic landmarks, and contribute to balanced urban growth (see Figure 12).
As sociologist Jean-Louis Violeau points out: “There’s something absurd about being for or against high-rise buildings.” Indeed, it’s a topical issue: learning how to transform this energyguzzling existing heritage into environmentally friendly buildings is becoming a matter of urgency. The renovation of the Tour Bois Leprêtre in 2010 by architects Frederic Druot,
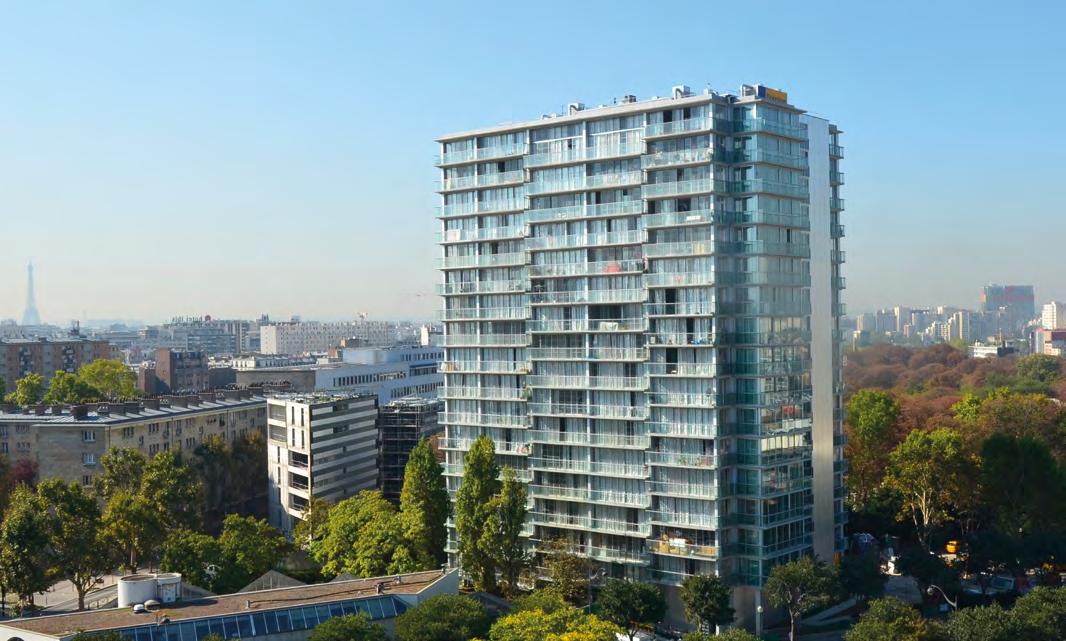
Anne Lacaton and Jean-Philippe Vassal is a remarkable example of this (see Figure 13). Choosing renovation over destruction, this transformation, focusing on housing quality and resident comfort, demonstrates how to intelligently transform an ordinary social housing building located along the Paris ring road by bringing in more daylight and improving thermal and acoustic performance.
Ultimately, the challenge for Paris lies in reconciling its historic identity with contemporary metropolitan pressures. By combining vertical architecture with thoughtful ecological and urban planning, along with vast natural spaces on the scale of Greater Paris, the European metropolis could be able to adapt to the demands of the 21st century while preserving the qualities that make it unique.
The text in this essay was excerpted from The Metropolitan Tower, edited by Nathalie Régnier-Kagan, published by Park Books, 2025.
NOTES
1 Régnier-Kagan, Nathalie (ed.) (2025). The Metropolitan Tower. Park Books.
2 Chaslin, François. (2018). “Hauteurs de Paris.” In Surélévations Conversations Urbaines, edited by Bruno Marchand and Christophe Joud. In Folio.
3 Mignot, Claude. (2005). Grammaire des Immeubles Parisiens Parigramme.
4 Lorrain, Dominique. (2018). “L’urbanisme 1.0, Enquête sur une commune du Grand Paris.” Raison d’agir. https://doi.org/10.4000/ lectures.31411.
5 Koolhaas, Rem. (1995), “Bigness or the Problem of Large.” In S, M, L, XL, edited by Rem Koolhaas and Bruce Mau. The Monacelli Press.
6 Violeau, Jean-Louis. (2009). “Les tours, nouveaux villages. In L’invention de la tour européenne, edited by Ingrid Taillandier and Olivier Namias. Picard.
Figure 13— Bois Leprêtre Tower, (Lacaton & Vassal and Frederic Druot Architects, 2010).
Image credits— Unless otherwise indicated, all images are courtesy of the author.
ON TALL SUSTAINABILITY
The new JPMorgan Chase World Headquarters, our Design feature in this issue, has been criticized for the embodied carbon released while replacing the bank’s former headquarters (originally Union Carbide) building that preceded it on the site. The new tower’s lead architect, Lord Norman Foster, responds.
I started to write this from a hotel bedroom on top of a skyscraper in Tokyo, a city bursting with tall buildings of every shape, description, and age. Coincidentally, it was until recently the largest city in the world by population, and it is also one of the densest.
I often hear journalists criticizing the carbon footprint of the steel and glass that goes into the tall buildings that make such cities possible. I urge them to put prejudice and emotion aside for a moment and, instead, to look at the big picture and consider the data before jumping to conclusions.
Because, in cities like Tokyo and New York, it is those very tall buildings that enable us to create the most sustainable communities. New York was placed second in top-ranked cities1 and Tokyo was, in recent surveys, the top city in Asia and the third overall2—a ranking that has since been overtaken by high-density medium-rise cities such as Amsterdam, Copenhagen and London.3 That is because all of them are compact, highdensity (thanks to those skyscrapers in the high rise cities), walkable, well-served by public transport and with centralized utilities. Taken together, it is these qualities that create cities with the lowest carbon footprint. Incidentally, these more
Left—
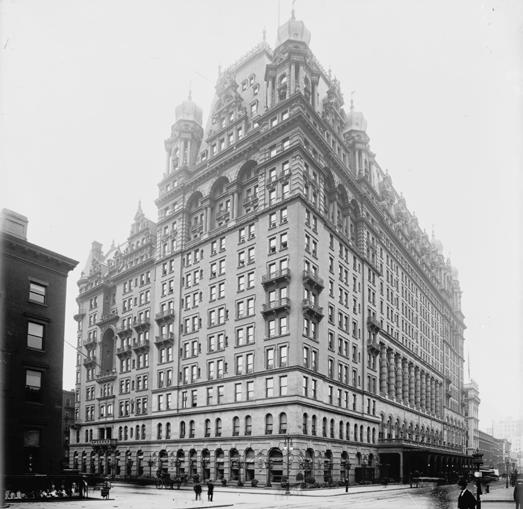
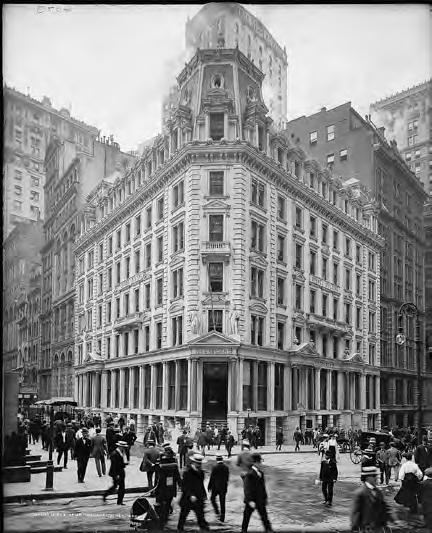
Waldorf-Astoria Hotel, built 1893, demolished 1929.
Right—
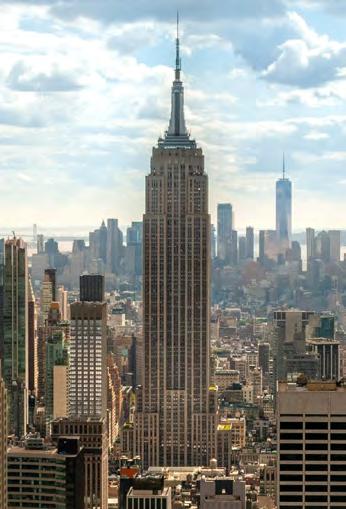
The Empire State Building, constructed 1931 on the site of the former WaldorfAstoria Hotel.
Opposite left—
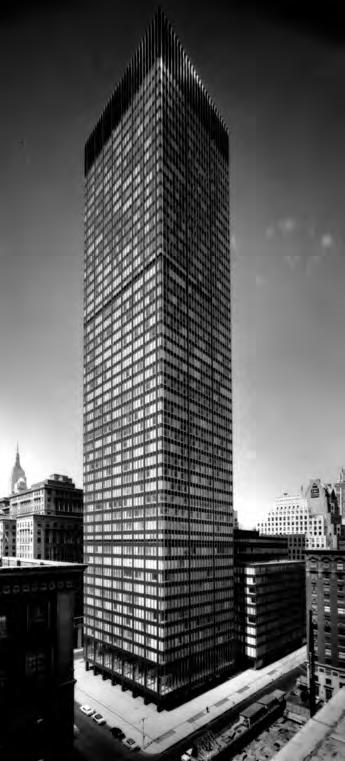
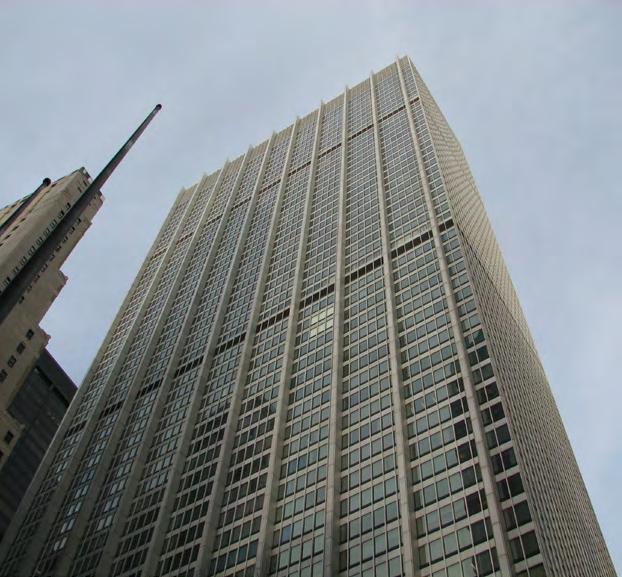
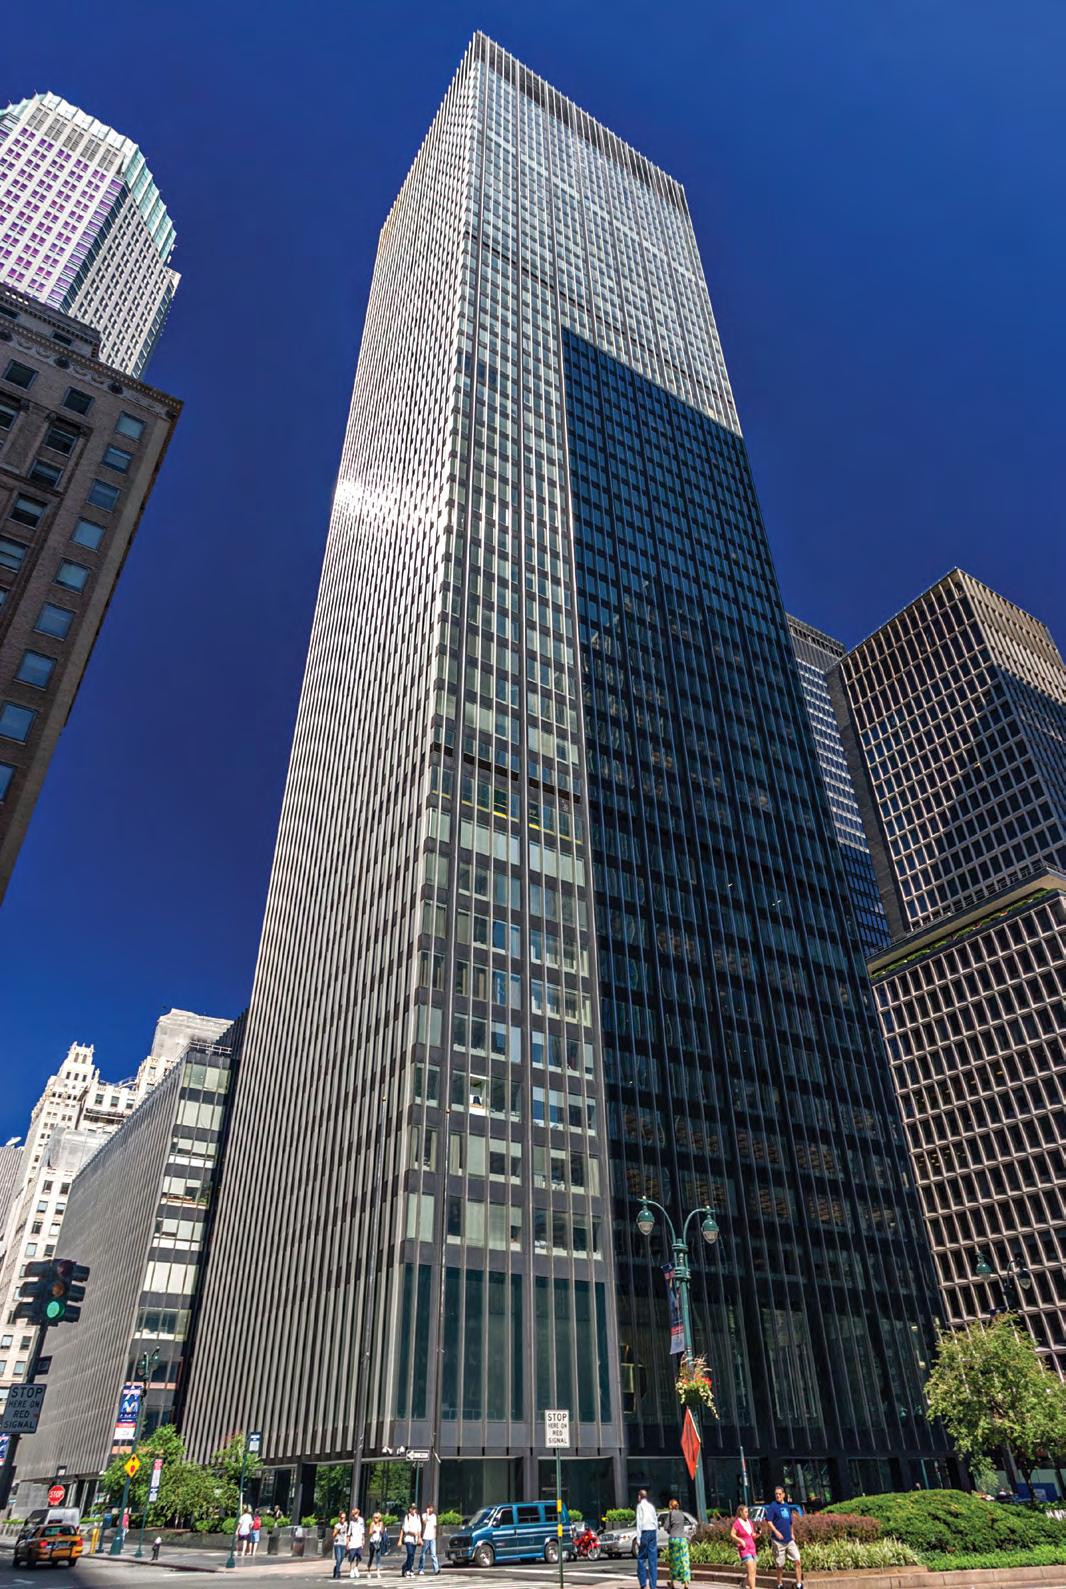
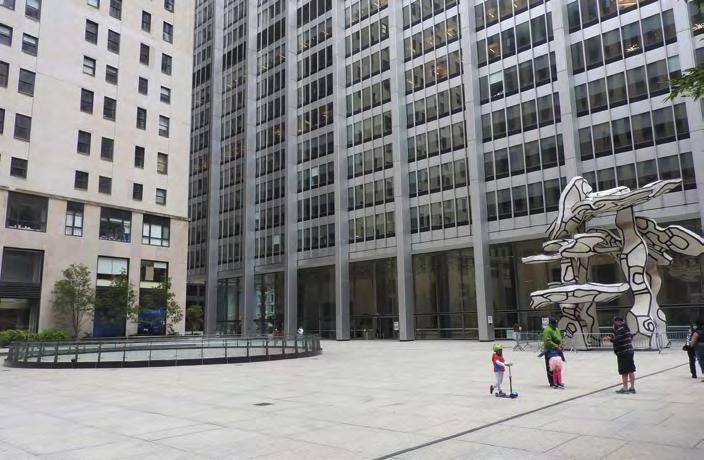
The preceding building at 270 Park Avenue, originally Union Carbide, then JPMorgan Chase Headquarters, constructed 1960, demolished 2020.
Opposite right—
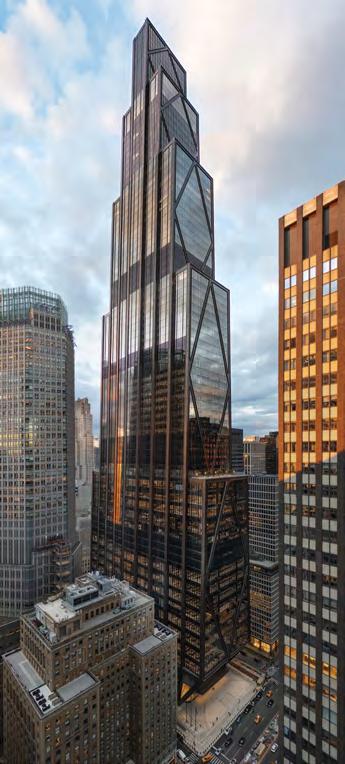
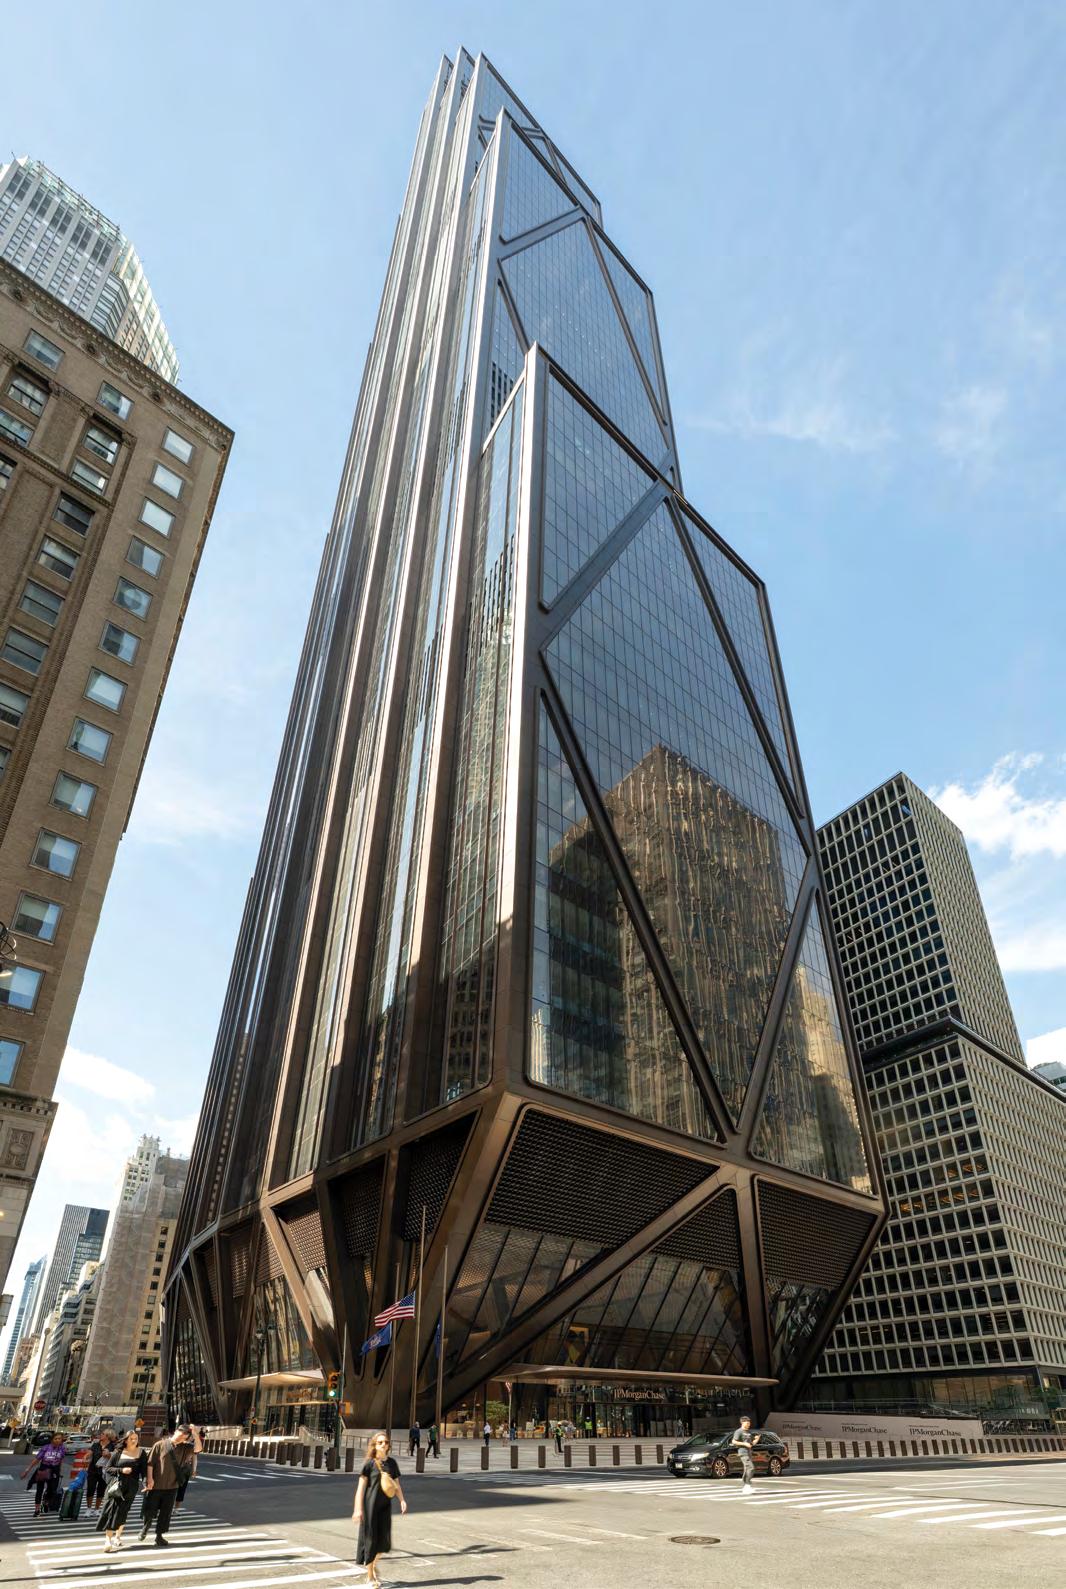
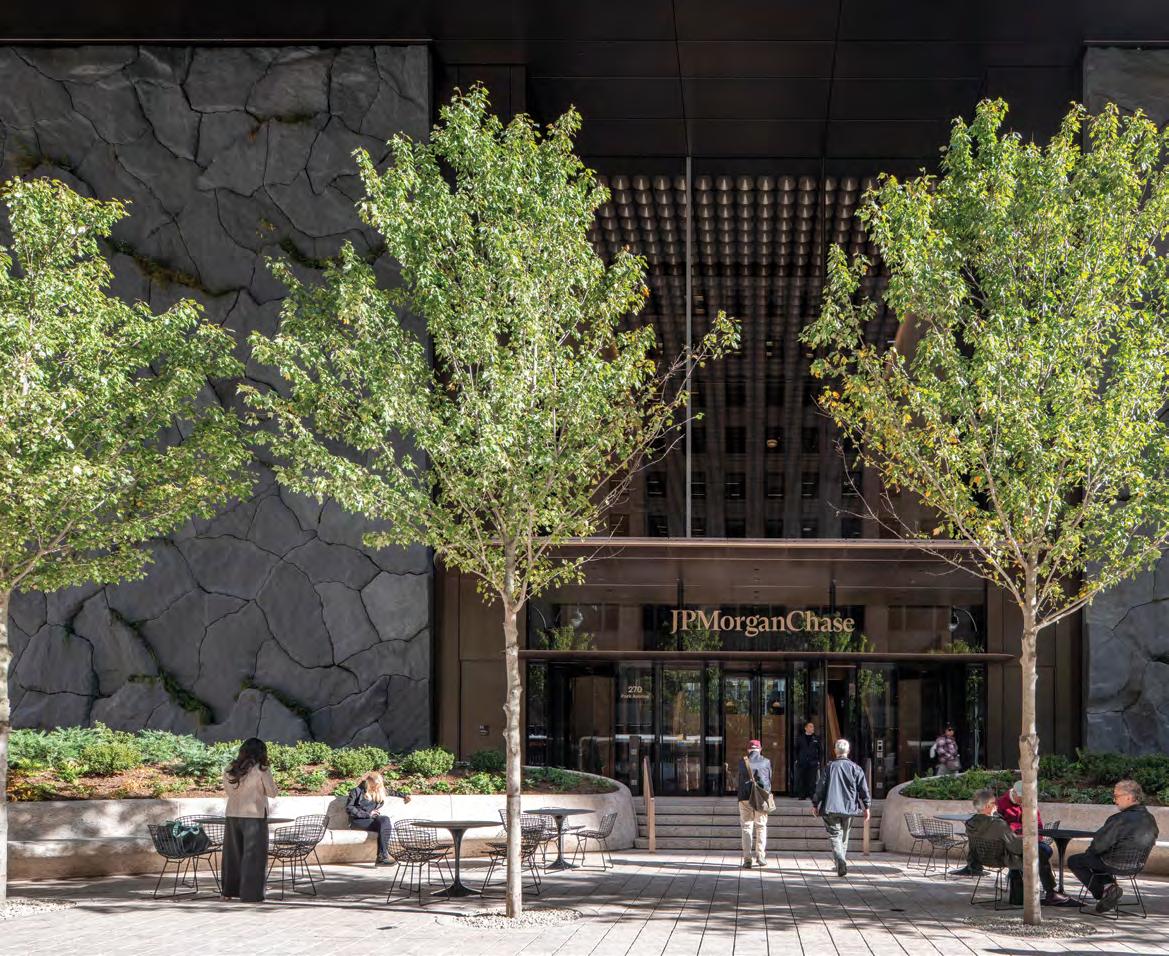
The new JPMorgan Chase World Headquarters.
dense and sustainable cities are consistently voted by the public in surveys as the most desirable ones in which to live, work, and visit.
When criticizing steel and glass skyscrapers, it could be inferred that we would be more sustainable if our cities were low-rise structures sprawling into the distance. This is a myth—such suburban communities have almost twice the carbon footprint of high- and medium-rise cities. That is aside from the rampant destruction of nature and biodiversity caused by the sprawling city. In addition, the dense, walkable city has proven to be better for our health and well-being than the carborne suburban model.
The statistical evidence in support of the virtues of a dense, walkable city abounds, but it has recently been illustrated graphically in a map of the east coast of America, prepared by two Berkeley researchers, based on household carbon emissions.4
The map that they have produced is almost entirely red, orange, and yellow— colors that signify high carbon footprints. However, look carefully and you can see a dark green area—the lowest carbon footprint—which is centered on Manhattan. This good news is made
possible in large part by those steel and glass skyscrapers, which are so often reviled by critics.
By homing in on a specific site for the new 270 Park Avenue in Manhattan (see page 38), we can show how, while increasing the vitally beneficial statistic of density, we can at the same time improve the public domain and the health of those working in the building.
This site was previously occupied by a much-celebrated office tower, originally for Union Carbide, to a design conceived in the 1950s and attributed to Natalie de Blois of SOM. However, some 70 years later, its spaces were no longer able to accommodate the bank’s contemporary needs.
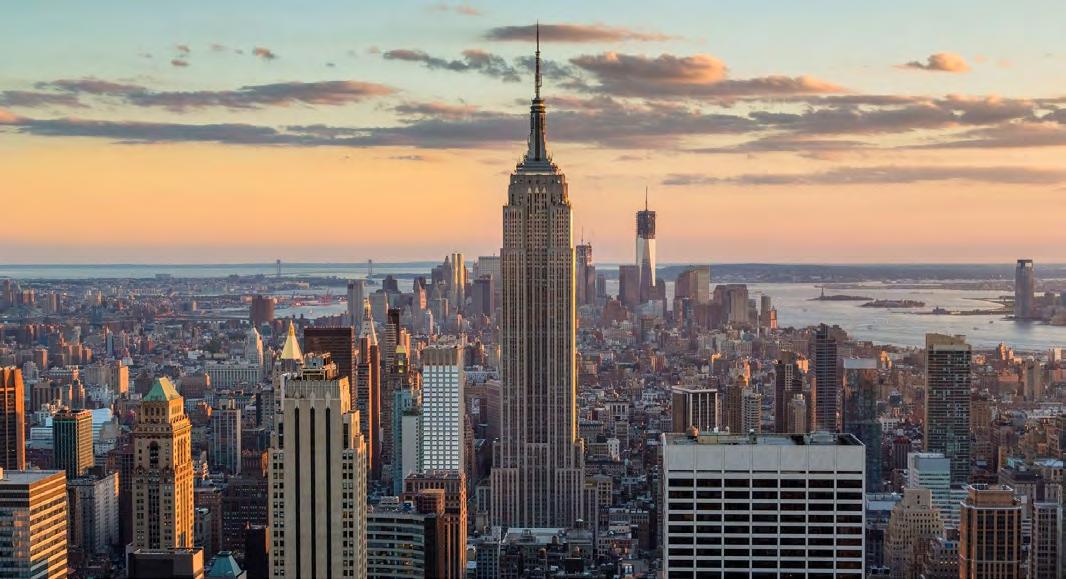
It is easy to forget that some of the most revered buildings of our times were only achieved by demolishing classics of the past. The Empire State Building, for example, replaced the historic Waldorf Astoria (1929) designed by Henry Janeway Hardenbergh, which, when demolished, was the world’s largest hotel and socially emblematic of the city’s Gilded Age before it fell from fashion.
If we compare 270 Park Avenue with the building that it replaced, then there are almost the same number of stories (60 versus 56), yet, because of the increase in
volume of space per floor, it is twice the height. It also houses two-and-a-half times the number of occupants. In the public domain, its unique structure cantilevers out to deliver a two-and-ahalf-fold increase in sidewalk area, including gardens, water, and a major work of civic art by Maya Lin. There are, as well, significant advances in health and wellness (including 20 internal venues such as cafes, restaurants, a gym and spa) offering an abundance of natural light and views combined with large quantities of fresh filtered air (twice that required by
“It is easy to forget that some of the most revered buildings of our times wereonly achieved by demolishing classics of the past.”
codes). These attributes were validated by the research of Harvard University’s T.H. Chan School of Public Health, which was a consultant to the project.
The Empire State Building provides a similar usable floor area to 270 Park Avenue (208,879 and 224,882 square meters, respectively) and misleading comparisons have been made between the two buildings. Spaces for the workplace in the 1930s were tight and cramped by modern standards. Floor-toceiling heights at the Empire State (like Union Carbide) were around 2.4 meters, unlike the 3.2-meter standard of today. There was no need for the long-span trading floors that we have today, which at 4.6 meters high, providing line-of-sight views uninterrupted by central cores of circulation and services, nor for social gathering spaces across an entire floor plate, with heights between 6 and 18 meters.
In addition to the floors that span more than twice those of the Empire State Building, 270 Park Avenue sits on top of railway tracks and cantilevers out to deliver community benefits at the pedestrian level. Finally, today’s building codes, with their emphasis on structural robustness, also led to a higher steel content.
Despite these functional differences, the total weight of steel divided by the total volume for each building is almost identical. In other words, a modern building that provides higher, brighter, and longer-span spaces, built over a grid of railway lines, and designed to modern standards of robustness, achieves the same density of structural steel (metric tons per cubic meter) as its famous Midtown neighbor.
In terms of sustainability, 97% of the Union Carbide tower was reused, recycled, or upcycled. The structural steel frame of 270 Park Avenue is more than 90% recycled, and the design of the diamond-shaped bracing saves some 12% of tonnage compared to a conventional structural system—far removed from a decorative gesture, although it does give a unique sense of identity. The steel reinforcement in the concrete is almost
100% recycled, and in the concrete of the superstructure, 40% of the cement was replaced by ground glass. This saved 5,000 metric tons of embodied carbon and diverted more that 28 million bottles from landfill. The basement needed high-strength concrete, and 60% of the normal Portland cement was replaced by granulated blast furnace slag and fly ash—both waste products from the iron and electricity industries, respectively. Here, the recycling of waste and carbon reduction go hand-inhand. The aluminum of the glazing system is recycled. Globally, threequarters of all the aluminum that has ever been produced is still in circulation, making it one of the most recycled products on the planet.
The 270 Park Avenue occupies an entire Manhattan block, and it is these
blocks of the New York grid that, together with the infrastructure that supports them, have created an example of one of our greatest inventions—the city. And cities are the future of our global society. They generate 90% of global wealth (for example, the GDP of New York is slightly greater than that of Russia). Because of the mostly carbon-intensive energy that powers their buildings and mobility, cities are also responsible for 70% of greenhouse gas emissions. Clean energy and electrified mobility will eventually address most of this downside. The 270 Park example anticipates such a future by being all-electric and meanwhile benefitting from a hydro-powered source of energy.
To achieve the densities that equate with sustainability in high-rise cities
like New York and Tokyo, among others, steel and concrete will still dominate. Meanwhile, as a practice, we continue to pioneer alternatives such as timber in its many different forms. I have lived with my family for more than two decades in a residence that combines high-tech prefabrication of timber with traditional larch shingle cladding. My visit to Tokyo was, in part, provoked by our nine-story timber-structured department store for Marui, now under construction in Shibuya. This is well within the height limit for timber structures in Japan, which is currently 20 stories with a three-hour fire rating. However, it is far short of the kind of high-rise towers that, notwithstanding their individual carbon footprints, continue to make possible our most sustainable kinds of cities.
NOTES
1 IESE Cities in Motion Index 2025. 2 Arcadis. (2022). The Arcadis Sustainable Cities Index 2022: Prosperity Beyond Profit. https://www.arcadis.com/en/insights/ perspectives/global/sustainable-citiesindex.
3 Arcadis. (2024). The Arcadis Sustainable Cities Index 2024. https://www.arcadis.com/ en/insights/perspectives/global/ sustainable-cities-index-2024.
4 Jones, Christopher and Daniel M. Kammen. (2014). “Spatial Distribution of US Household Carbon Footprints Reveals Suburbanization Undermines Greenhouse Gas Benefits of Urban Density.”
Opposite top— Typical floor plan, Empire State Building.
Opposite bottom— Typical floor plan, 270 Park Avenue (scale is approximate).
Top— Marui department store, original building, Tokyo.
Bottom— Marui department store, new masstimber version.
Unless
Image credits—
otherwise indicated, all images are courtesy of Foster + Partners.
At 270 Park Avenue, JPMorgan Chase’s new headquarters embodies vertical urbanism, transforming a constrained Midtown block into a multi-level district that merges civic space, structural innovation, and a future-focused workplace, write Nigel Dancey, Kirsten Scott, Mike Jelliffe, Roger Ridsdill Smith, and Jeremy Dworken.
Right— 270 Park Avenue defines the modern workplace with 21st century infrastructure, smart technology and 2.5 million sq ft (232,258 m2) of flexible and collaborative space.
“Vertical urbanism” largely does what it says on the tin. It takes the principles and aims of urbanism—connectivity, community, diversity of use, sustainability, adaptability, flexibility, the need for zones, and the need for transition—and applies them not only horizontally and topographically, but vertically and technologically.
As ground space in cities becomes increasingly scarce, tall buildings have responded to the need to accommodate growing urban populations and the increasingly complex routines of urban living. Across “tall” cities, including Hong Kong, Singapore, and Toronto, the concept of vertical urbanism has been explored to varying degrees through buildings that integrate green spaces, leisure areas, parks, and residential units within one tall structure, with other cities such as Milan and Mumbai experimenting with independent vertical urban projects.
What differentiates a straightforward tall building from a building that employs vertical urbanism, then, is that the latter is designed to fulfil multiple uses at once; it can function, in some ways, as an integrated urban space—or in other
words, a multi-level ”district.” This multiuse format is present in the awareness of planners, designers, and, hopefully, its later occupants.
Perhaps one of the most renowned tall cities, and a growing testbed for the principle of vertical urbanism, is New York City. A progenitor in tall buildings design, alongside Chicago, and still a leader in ambitious high-rise structures to this day, New York is an ideal candidate for vertical urbanism. It should also be stated that a vertical approach to urbanism—though the topic of this particular article—is not a solitary endeavor; it sits alongside other planning incentives in the city, including restoring parkland and waterfront management in Hudson River Park, the creation of pedestrian access in projects such as the “Broadway Vision,: and the manifold examples of adaptive reuse of existing buildings across New York’s five boroughs. Planners must think outward, as well as upward.
In fact, through a variety of projects such as the High Line, which blends vertical and horizontal design, adaptation and fresh construction, New York planners have often
experimented with how the principles of more traditional, ground-level urbanism can be transformed and applied in different multi-level and multi-directional scenarios that, in turn, reflect the varying trajectories of our own lives and patterns of living.
These various design explorations for a multi-level, integrated urbanism are underpinned by an urgent, municipal need to reimagine the relationship between population and the ground. With a density 74,000–75,000 people per square mile (approximately 28,900 people per square kilometer) in Manhattan (2020 Census), the need for efficient and well-considered tall buildings in New York—that interact effectively with the surrounding urban fabric–is not only encouraged, but imperative.
Vertical urbanism explores how tall buildings can provide a multidimensional solution to the most pressing challenges confronting cities today—limited groundlevel space, the need for a city to provide multiple amenities and resources close together, access to mobility, the continued need for public space, and an increasing awareness of the impacts of our cities on our health and our
Opposite— Lower Manhattan,
Left— William Robinson Leigh, Visionary City, 1908.
Right— Harry M. Pettit’s rendering for Moses King’s guidebook, Views of New York, 1908.
1931.
—Norman Foster, Founder and Executive Chairman
New York and the Vertical Imagination
New York City has been a wellspring for the vertical imagination; it is a city where life is lived, in extremis, up high. In 1889 New York City’s first skyscraper, the Tower Building at 50 Broadway, was a steel-framed structure that stood 11 stories high. In the late-19th and early-20th century, and with the emergence of iconic architecture including the Manhattan Life Building (1894) and the Flatiron Building (1902), the idea that life at its most aspirational could be lived at not only one or two stories—but 10, 20, or 30—became a tangible possibility. New York artists imagined a future city of crowded towers where life unfolded vertically; guidebooks and visionary imaginations of the city pictured the metropolis populated with bridges and railways, connecting the city in the sky as well as on the ground. This attitude rippled through the imagination not only of city planners and architects, but also of artists, filmmakers, and commercial enterprises.
Alongside these vertical fantasies, the reality of tall buildings in New York
City was driven by three linked developments throughout the 20th century: the construction of strong, steel structures, which could surpass the height of equivalent designs completed in stone or brick; an exponential increase in wealth, immigration, and productivity; and increasing competition for the limited ground space that resulted from rapid construction. These developments were linked with and reflected by changes in zoning laws that shaped the New York skyline throughout the 20th century and into the 21st.
JPMorgan Chase has been part of this history of building design in New York since the advent of the Industrial Revolution. With a history dating back to 1799—when the Manhattan Company was founded (an early iteration of the bank)—the firm has been installed at the heart of New York City. Renamed JP Morgan & Co in 1895 (Chase Bank, which would later merge with the enterprise, was founded in 1877), the firm established itself in the Drexel Building at 23 Wall Street, a steel-framed multi-story structure from the 1870s. By 1914, the Drexel Building was demolished and replaced by a
Top Left— Drexel Building (J.P. Morgan’s headquarters, 1895–1914; demolished 1914).
Top Right— 23 Wall Street (J.P. Morgan’s headquarters, 1914–1988; replaced Drexel Building, now an event space).
Bottom Left— 60 Wall Street (center of image) (J.P. Morgan’s headquarters, 1989–2000).
Bottom Right— 28 Liberty Street, New York (Chase Bank, 1961–2017/8).
—Jamie Dimon, Chairman and CEO of JPMorgan Chase
MICHAEL (CC BY-SA)
neoclassical-style “House of Morgan Headquarters.” In a deliberate act of restraint and discretion, the Morgan name was left off the building’s facade, with the entrance doors bearing only the address “23.”
By the 1980s, however, the bank’s international presence—not to mention the global economy—had drastically altered, and the need for increased and highly efficient office space was apparent. In 1988, JP Morgan & Co. moved its operations to 60 Wall Street, a 55-story, 745-foot (227-meter-) office building in the Financial District on Lower Manhattan that blended a postmodern style with references to neoclassicism. Meanwhile, also in the Financial District, Chase Bank had located itself in a 60-story, 813-foot (248-meter) skyscraper at 28 Liberty Street. This International Style skyscraper was purpose-built for the bank by Skidmore, Owings & Merrill (SOM) and completed in 1961. Both banks resided in these office towers for much of the second half of the 20th century. As well as being a unique architectural commission for one of the biggest banks in the world, a significant portion of the Foster + Partners’ design process was inextricably municipal and urban-facing – firstly in the way that the tower interfaced with New York City, and secondly in the ways that the tower aspired to function as a “city within a city.” These different directions of concern—the interactions of the tower with the wider urban fabric, and then the interactions within the tower that constitute a version of “vertical urbanism”—were so closely related throughout the design process that they warrant a side-by-side discussion here.
Sustainable Transitions and Energy Considerations
The Union Carbide Building, designed by SOM and built in 1960, served as the JPMorgan Chase Headquarters at 270 Park Avenue for nearly two decades, between 2000 and 2018. Though a successful office building that represented a distillation of modernist principles, the tower soon became unable to meet the various and complex needs of the firm. Changes in city zoning laws unlocked the potential for a larger building that could match JPMorgan Chase’s growing workforce,
Above—
28 Liberty Street Headquarters under construction, c. 1959.
View of the completed headquarters building from the southeast.
By lifting the building approx. 80 feet (24 meters) off the ground, the view is extended from the Park Avenue entrance through to Madison Avenue.
Ground floor plan –the split core is introduced to better reflect how people move through and around the building.
leading reputation, and international presence. In 2018, Foster + Partners won the competition to design JPMorgan Chase’s new home for 10,000 employees and thousands of daily guests—a home which would replace this 1960 structure.
The brief was highly ambitious: JPMorgan Chase wanted to push the envelope of what an office building could be, while also delivering a “timeless” and identifiably “New York” style of architecture. The tower needed to offer a diversity of scales of spaces, all above an active railway station, built in the heart of Manhattan.
Delivering this new, state-of-the-art project was an exceptionally complex task that required the collaboration of numerous design and engineering groups. The principal architect of the new tower was Foster + Partners, led by Norman Foster. The volumetric architecture of the internal spaces was an integrated part of the original Foster + Partners design. The practice was responsible for the interiors of the entrance lobby, and the client reception spaces at the summit of the tower. The practice also worked with Studios Architecture on the Exchange
Floors. Gensler was responsible for the office levels and SOM for the Trading Floors. Design collaboration was by Vishaan Chakrabarti. Structural engineering was delivered in a joint effort between the Foster + Partners Structural Engineering team at concept/ competition stage and Severud Associates, who were the Engineer of Record; geotechnical engineering was delivered by Mueser Rutledge; sustainability planning was delivered by Socotec; MEP (mechanical, electrical, and plumbing) engineering was supplied by JB&B; and landscape planning was by Ken Smith Workshop.
As part of the competition, Foster + Partners proposed that all materials from the old Union Carbide Building be recycled, reused, or upcycled. Since the completion of the new 270 Park Avenue tower, Foster + Partners has recorded that 97% of the former structure (including steel, a particularly carbon-intensive material) has been successfully rerouted, thus significantly reducing the volume of demolition waste entering landfill. Additionally, the new tower will be the city’s largest
all-electric tower, with net-zero operational emissions.
Structural Design as Urban Intervention
Foster + Partners’ new design—through two times taller than the Union Carbide building at 1,388 feet (420 meters), and with 2.5 million gross square feet (232,258 square meters) of floor space— contributes 2.5 times more public space on the ground between Park and Madison avenues than its predecessor. This was due to a reduction in the tower’s footprint, enabled by a fan-column structure that allows the building to touch the ground lightly across the entire block.
The tower structure is a direct response to the structural constraints of the site, located above the railway lines that lead to Grand Central Terminal.
Prior to the competition, Severud Engineers carried out preparatory work to set out and define the site constraints, and particularly the railway lines, underground services and spaces in the basement, including working closely with the Metropolitan Transportation Authority (MTA). During the
competition, over the summer of 2018, the Foster + Partners architectural and structural engineering team developed the specific project structural solution based on this preparatory work. Two structural interventions were introduced. Firstly, the tower superstructure columns were designed to gather into “fans” on the north and south elevations, and a combination of vertical and “V” columns on the internal grids at the base of the building. Secondly, structural cross-bracing was located on the east and west façades to supplement the internal core and outrigger system for stability in the north-south direction. Severud worked collaboratively and closely with the Foster + Partners architectural and structural teams during the competition to review and develop the feasibility of the solution on behalf of the client, going on to deliver the project as the Structural Engineer of Record.
The fan bracing at the base of the tower “lifted” the building approximately 80 feet (24 meters) off the ground, opening public space at the ground level between Park and Madison Avenues. Entrances into the building were also rationalized in both the north-south and the east-west directions, to better reflect how people move through and around the building. This was structurally achieved by offsetting the core to the west of the building footprint— rather than in the center—over the first 14 levels. This arrangement not only enabled unobstructed views through the lobby; it provided clear views across the entire floor space for the eight trading levels located above, allowing for better team integration and improved functionality for trading operations. The offset core transitions to a central core at around the “exchange” point of the building, between levels 13 and 17. The top levels, serviced by this central core, feature an executive and client facility with 360-degree views of Manhattan.
New York City approved the new tower’s construction, which significantly increased the height of the previous Union Carbide building, on the condition that certain mandates for public well-being and privately owned public space (POPS) were met. Understanding the irreducible value of, and vital need for public space, especially in a densely populated district such as Manhattan, Foster + Partners met and surpassed these baseline mandates by opening ground space not only through the structural innovation of the tower, but also
Left—
Section – note location of transition zone from offset to central core at the “exchange” levels, 13–17.
through a mixed offering of urban greening, outdoor seating, and public art.
The urban design and landscape team designed wider sidewalks and a large public plaza on Madison Avenue, with natural green space and other amenities geared towards the residents, workers, and visitors who frequent the neighborhood. The ground floor lobby serves as the main entrance to the building and includes a monumental staircase and mezzanine level, with ramps and lifts to ensure inclusive access for all.
Artwork as Civic Contribution
Alongside its architectural and urban presence in New York, JPMorgan Chase has a long history of collecting and displaying artwork in the city. Founder John Pierpont Morgan (1837–1913), was
an avid and prolific art collector, amassing over 20,000 items in 23 years. Many of these items are now housed in the Metropolitan Museum of Art, and have significantly shaped the spirit and scope of the collection. Morgan gifted and bequeathed over 7,000 works of art to the Museum, alongside a new wing which housed an expansive collection of European sculpture and decorative arts which included works from the twelfth to nineteenth centuries. These objects were purchased “primarily for the benefit of the craftsmen and designers of our country” and arranged chronologically; the wing was planned with a “definite knowledge of, and with direct reference to, the collections it was to contain,” the museum’s Bulletin reported in 1910.
Below— Park Avenue entrance.
The ground floor lobby serves as the main entrance to the building and includes a monumental staircase and mezzanine level, with ramps and lifts to ensure inclusive access for all.
Left— Plaza of 28 Liberty Street, former Chase Bank headquarters, with Isamu Noguchi’s Sunken Garden at left and Jean Dubuffet’s Group of Four Trees at right.
Nearly half a century later, president of Chase Manhattan Bank, David Rockefeller founded Art at Work in 1959. Rockefeller’s emphasis on using art to enhance corporate settings and communities led to two high-profile public art commissions: Isamu Noguchi’s Sunken Garden at the plaza outside of SOM’s design in 1961, and Jean Dubuffet’s Group of Four Trees, nearby, in 1972. Alongside this public art program, today, the JPMorgan Chase Art Collection focuses on emerging artists globally, and oversees more than 30,000 objects in 450 corporate offices around the globe.
In keeping with the collecting, and collective spirit of both Morgan and Rockefeller, the artworks at 270 Park Avenue are closely stitched into the
building and the urban realm. One of its most striking commissions, A Parallel Nature by Maya Lin, acts as the centerpiece of the new public plaza on Madison Avenue. This large-scale artwork is inspired by the natural bedrock of the city and the rock faces of Central Park.
Lin’s sculptural granite walls are comprised of a series of rock fragments, cut and hand-worked, according to scans of actual rock faces taken by Lin in Central Park. The installation incorporates the growth of mosses, grasses, ferns and plants, making “ambiguous the line between the natural and the man-made.”
At the crown of the tower, Leo Villareal’s Celestial Passage is a distinct light-based artwork that transforms the
city’s skyline, illuminating the building’s crown nightly with gently shifting waves of monochromatic light. Transforming the building into a “unified light sculpture,” Villareal’s installation aspired to use light to “create a point of recognition within the city’s skyline.”
Inside, the lobby of 270 Park Avenue features two large-scale, painted works by Gerard Richter. Color Chase One and Color Chase Two feature interlocking, hard-angled aluminum shapes that are visible to visitors and pedestrians from both Madison and Park avenues.
Similarly, Wind Dance by Norman Foster is a 3D-printed column in bronze at the center of the lobby. It replicates outdoor airflow to ensure the flag inside moves in harmony with those outside. Refik Anadol
Left—
The Madison Avenue street level façade features Maya Lin’s A Parallel Nature artwork, consisting of a rock wall inspired by local geology.
Above—
The walls have water trickling down certain parts of the faces, and each wall has a small stream bed at its base.
has also created an AI data-driven art installation Living Building, located in the elevator banks of the lobby, transforming them into dynamic light displays.
Each artwork responds to and connects with the wider context of the building—whether through the geology of Central Park, the iconic New York skyline, or the city’s invisible patterns of movement. These commissioned artworks are experienced by an office population of some 10,000 employees and thousands of daily visitors.
Like the artworks, the materiality of the tower was a considered response to its coveted site and tenant’s legacy within New York City. Moving away from a 21st-century vogue for stainless-steel and glass cladding, Foster + Partners, in close consultation with JPMorgan Chase, developed a bronze cladding system that calls back to the early industrialization of the city, with a contemporary eye. A bespoke lacquer on this bronze cladding prevents the color-changing patina process, while also protecting the metal from future corrosion.
Vertical Urbanism within the Tower
The first half of this article considered how 270 Park Avenue interfaces with New York City: at a civic level with the surrounding urban realm of Park and Madison Avenues, at an engineering and structure level with the Grand Central Subway system below ground, and materially and sculpturally as a new addition to the skyline of the city.
Alongside these outward-facing considerations, the new tower for JPMorgan Chase needed to fulfil and perform many functions at once: it needed to be a ‘city within a city’ that reflected the global status and ambitions of the banking firm. How, then, do the
Below— An AI data-driven art installation called Living Building by Refik Anadol in the elevator banks of the lobby,
Below— The triple-height “Exchange” space is located at the center of the tower.
The “Exchange” acts as a community hub, with 16 venues, as well as spaces for town hall meetings and other large gatherings.
lessons of urbanism find their way into the design of the tower itself? And how was this designed with JPMorgan Chase’s specific needs in mind?
The multifaceted company culture of JPMorgan Chase has been foundational to its long-term success, by driving innovation and teamwork across financial sectors. This polyculture was therefore a leading design consideration for Foster + Partners. The building needed to cater to a range of interrelated requirements; it needed to support structured workflows as well as more organic opportunities for encounter and exchange. Furthermore, JPMorgan Chase’s emphasis on client-facing work was a key consideration beyond typical workplace design: what could design do to ensure that visitors and company members interface effectively?
As touched upon, the design of 270 Park Avenue incorporates, at its lower portion, a split elevator core that creates permeability of space and a generous entrance lobby. Shuttle elevators take employees and visitors directly from the lobby to the “Exchange” at the heart of the building, which acts as a transfer level to the upper floors (supported with the more suitable central core). The Exchange is designed not only for the New York workforce of JPMorgan Chase, but is also oriented as a destination for staff from external offices, spaces for discussion, debate, and announcements, and as a welcoming landing space for clients and visitors alike.
The Exchange between levels 13 and 17 could be compared with a typical New York district. It offers a diverse mix of café, restaurant, and bar options, as well as civic space for “town hall”style meetings of up to 1,000 people and other large gatherings, and places for training and discussion in the style of a “community hub.” Meeting rooms were designed to be divided or connected, and to respond to the different technological needs of a meeting. Many of the principles of urban planning and movement were carefully applied in the Exchange, treating the architecture plan as a miniature city. Working closely with Arup, Lerch Bates, and Space Syntax, the design team were able to plan out the travel and transportation routes that up to 10,000 employees (with projections reaching up
—Norman Foster, Founder and Executive Chairman
to 16,000) would take each day. Rather than the subways and roads of a typical urban plan, this transportation system deploys 60 elevators that serve the base, middle, and top levels of the tower. Urban planning principles of transportation and movement were also applied to the floor plan of the Exchange, which offers a mix of primary routes and secondary routes through which to move quickly—or perhaps more leisurely. Not only was this urbanism approach essential to maximize efficiency, improve wayfinding, and reduce confusion; it was also key in creating spaces for reflection, encounter, and a change of pace.
Exceeding baseline expectations of what an office should provide for its employees, JPMorgan Chase’s headquarters offers a state-of-the-art health and wellness center, alongside the wide variety of bars, restaurants, and coffee options in the Exchange. The well-being-focused design also responds to Harvard University Dr. Joseph Allen’s research into the effects of fresh air on cognitive function by providing an outdoor air ventilation rate of 40 cubic feet per minute (18.9 L/s), per person. This is double the standard-specified minimum outdoor air ventilation rate. Terraces offer views across the city and provide outdoor spaces for employees and their guests. The building also features 30 percent more daylight than a standard baseline building with lower ceiling heights and circadian lighting for a healthier indoor environment.
Like any city—or, at that, company— which evolves over time, 270 Park Avenue has also been designed with a change of use in mind. Large floor plates and
generous floor-to-floor heights throughout the building, as well as adaptable elevator capacity, MEP systems, and stair capacity, will enable future adaptation and ensure flexibility. This flexibility is also vital for creating resilient workspaces that can accommodate blended, hybrid working patterns as the changing needs of the company call for altered spatial layouts.
Lateral and Vertical Urbanism
It is in the interface between architect and client that 270 Park Avenue has emerged. By applying the principles of architecture, urbanism, data science, material research, and sustainability planning to the spatial and commercial needs of at JPMorgan Chase, Foster + Partners was not only able to provide an elegant solution to the constraints of the Park Avenue site, but a newly iconic design that reflects the ambitions and values of its tenants.
At a municipal level, 270 Park Avenue negotiates a series of concerns— from the sustainable demolition of a previous building to renewed engagement with the urban surroundings of Park Avenue and Madison Avenue, to the engineering and construction of foundations above an active rail line. In the tower itself, the promises and potential of a verticalurbanism approach are explored through a complex multidisciplinary tall building structure that reflects the nature of both the designers of the building and the occupants within. The final tower, now an occupied workspace since its opening in 2025, reflects the culmination of these aims—to move, to work, to connect.
Structural Engineer: Foster + Partners (design); Severud Associates Consulting Engineers (design); Robert Bird Group (engineer of record)
Contractors: AECOM, Tishman
Construction (main contractor); New York City Constructors (steel)
Other CVU Member Consultants: Motioneering (building monitoring, damping); Gensler (interior)
Image credits—
Unless otherwise indicated, all images are courtesy of Foster + Parners
The 60-story skyscraper is a bold new addition to New York’s architectural history.
The Marunouchi District in central Tokyo demonstrates how density can be intensified urban coherence and public legitimacy, smoothing the way for new interventions
intensified incrementally over more than 130 years, while still maintaining interventions like the TOKYO TORCH, write Isamu Sugeno and Koji Matsuda.
An 1900s view of Marunouchi – the first generation of its modern urban layout. Mitsubishi Estate has led the development of Marunouchi from the 1890s to the present day.
Left— The second generation of Marunouchi, 1960s.
Above—
High-density regeneration in mature city centers requires more than individual tall buildings; it depends on coordinated governance, spatial rules, infrastructure investment, and long-term stewardship. The Marunouchi district in central Tokyo demonstrates how density can be intensified incrementally over more than a century while maintaining urban coherence and public legitimacy. Through area-wide planning frameworks, transferable development rights, public–private governance structures, and sustained investment in ground-level public realm and districtscale infrastructure, Marunouchi has aligned private development with shared urban objectives. This paper analyzes the institutional, spatial, and infrastructural mechanisms that have enabled this continuity and identifies transferable principles for cities seeking to accommodate vertical growth without sacrificing livability or trust.
Introduction:
The Limits of Building-Led Density
Across many global cities, pressure for densification is frequently addressed
through individual development projects negotiated on a site-by-site basis. While this approach can deliver additional floor area and skyline impact, it rarely produces coherent urban environments or durable public value. Fragmented density often results in disconnected public spaces, strained infrastructure, and growing social resistance to further growth. In many cases, incremental tower-by-tower growth produces vertical accumulation without corresponding improvements to horizontal urban structure, leaving circulation, open space networks, and infrastructure capacity misaligned with built form.
The challenge is particularly acute in mature central business districts, where land ownership is fragmented, infrastructure systems are interdependent, and public expectations regarding urban quality are high. In such contexts, tall buildings cannot be treated as isolated objects; they must be understood as components within a larger urban system. Without district-scale coordination, redevelopment risks
Left—
The third generation of Marunouchi’s urban layout, in the 2000s. After spinning off as an independent company in 2001, Mitsubishi Jisho Design Inc. has designed most of the buildings in Marunouchi up to the present day.
generating spatial discontinuity, congestion at transport nodes, and declining public acceptance of further intensification.
The Marunouchi district in Tokyo illustrates an alternative trajectory. Rather than pursuing episodic redevelopment, Marunouchi has been shaped through a long-term integrated framework in which ground-level public realm, district infrastructure, spatial rules, and skyline form are coordinated across multiple development cycles. Instead of a single redevelopment phase, the district has undergone successive generations of revitalization, each responding to evolving economic, social, and spatial conditions while reinforcing a shared long-term vision. The district’s transformation can be traced from its establishment in the 1890s as Japan’s first modern central business district, through postwar reconstruction and parcel consolidation in the 1960s, to regulatory reform and qualitative repositioning in the 1990s, and into the 2020s where diversification, amenity, and sustainability define its direction. Density has accumulated gradually, with
tall buildings emerging as outcomes of negotiated urban rules, rather than singular drivers of change.
Marunouchi as an Integrated Urban System
Located between Tokyo Station and the Imperial Palace, Marunouchi occupies one of the most symbolically and functionally significant sites in Japan. Since the late 19th century, it has served as a national business center, evolving alongside Japan’s economic and institutional development. The axial alignment between Gyoko-dori and the Imperial Palace establishes a civic and symbolic structure that frames the district’s skyline and public realm, reinforcing its role as both gateway and national frontage.
The 120-hectare district’s economic concentration is substantial. Companies headquartered in Marunouchi account for approximately one quarter of Japan’s GDP. Approximately 350,000 office workers are active within the district,
supported by 18 rail lines and 28 stations, creating one of the most transit-intensive employment clusters in the country. This reinforces the need for regeneration strategies that preserve continuity while enabling growth. What distinguishes Marunouchi is not simply its scale or concentration of corporate headquarters, but the method in which it has been treated as a continuous urban system. The unit of design extends beyond individual plots to encompass streets, open spaces, infrastructure networks, and governance mechanisms operating at district scale.
This systems-based approach recognizes that urban quality emerges through relationships—between buildings and streets, public and private spaces, infrastructure and architecture, and short-term development decisions and long-term urban vision. In Marunouchi, these relationships are formalized through shared guidelines and collective agreements that provide predictability for both public authorities and private landowners. The district’s transition from
a conventional Central Business District toward an “Amenity Business Core” reflects this systemic thinking: office concentration remains central, but retail, hospitality, culture, and programmed public events have been deliberately layered to expand temporal and social diversity. Maintaining alignment between governance, infrastructure, and built form over multiple redevelopment cycles depends on institutions capable of operating across temporal, spatial, and disciplinary boundaries.
Governance and Consensus as Design Instruments
A critical foundation of Marunouchi’s long-term regeneration has been the establishment of governance structures that enable sustained public–private collaboration. Area-wide councils comprising landowners, public agencies, and transport operators play a central role in shaping shared objectives, coordinating investment, and maintaining continuity across development cycles. This structure
Located between Tokyo Station and the Imperial Palace, Marunouchi occupies one of the most symbolically and functionally significant sites in Japan.
Left—
reduces uncertainty in a district characterized by multiple owners and high land value.
The Council for Area Development and Management of Otemachi, Marunouchi, and Yurakucho (OMY), established in 1996, serves as the primary coordination platform. It includes landowners, transport operators, financial institutions, and public agencies, and agrees upon district-wide master plans and City Planning Guidelines that are subsequently reflected in statutory district planning frameworks. Supporting this structure is the Advisory Committee on Otemachi–Marunouchi–Yurakucho Area Development, established to build consensus among major landowners prior to formal regulatory submission. Sensitive issues—including height controls, floor area ratio (FAR) allocation, and infrastructure burden-sharing—are resolved internally before entering the public approval process, allowing regulatory approval to proceed with reduced friction.
Implementation is sustained through the OMY Area Management Association, established in 2002, along with subsequent sustainability-focused bodies. These organizations coordinate programming, public space activation, environmental performance, and longterm stewardship. The district’s governance model can be understood through five interlinked components: future vision, rule formation, development method, physical realization, and area management. In this structure, stakeholder alignment occurs prior to statutory approval, transport operators such as East Japan Railway Company are integrated into development strategy, guidelines are periodically updated without undermining district trust, and stewardship continues beyond individual project completion.
Planning, therefore, functions not as a reactive approval mechanism but as a proactive design instrument. By aligning expectations at district scale, the
The Advisory Committee on Otemachi-Marunouchi-Yurakucho Area Development
Below— Structure of the advisory committee for the Otemachi, Marunouchi, and Yurakucho areas.
Chiyoda Cit y
(DISTRICT SCALE)
Council for Area Development & Management of Otemachi, Marunouchi & Yurakucho PRIVATE
Left— Planning policies and incentives that inform the development of Marunouchi.
Below— Nakadori Avenue, Marunouchi, Tokyo retains historical and functional identities, primary axes structure pedestrian movement, as shown here during an event.
framework reduces uncertainty, shortens negotiation timelines, and encourages reinvestment. Private development gains are directly linked to contributions toward public realm enhancement, infrastructure upgrades, and cultural programming. Lessons from earlier phases are retained rather than reset, enabling cumulative improvement in urban performance.
Spatial Rules That Enable Density and Sensitivity
One of the most distinctive features of Marunouchi’s regeneration is the use of spatial rules that balance intensification with contextual sensitivity. Height control mechanisms, including a graduated skyline responding to proximity to the Imperial Palace, establish a clear spatial logic that preserves symbolic sightlines while permitting taller buildings where appropriate. A conical height gradient limits structures along the Imperial Palace, with permissible heights increasing progressively with distance, creating a coherent skyline composition rather than a fragmented vertical field.
The strategic use of FAR transfer allows development rights to be redistributed across the district, concentrating density on sites capable of accommodating height while supporting conservation or enhancement of heritage assets and public spaces elsewhere. Density becomes a shared resource rather than a zero-sum competition between parcels.
The Marunouchi District Special Planning Framework raised the baseline FAR from 1000% (FAR 10) to 1300% (FAR 13) contingent upon compliance with Area Development Guidelines that include provision of 30% open space, façade alignment, skyline adherence, and heritage consideration. The Urban Regeneration Special District Planning Framework permits additional FAR beyond 1300% in exchange for contributions extending beyond site boundaries, including underground pedestrian connections, station enlargement, public plazas and atriums, disaster-prevention facilities, museums, cultural functions, and environmental infrastructure. The Floor Area Ratio (FAR) Transfer framework has enabled unused development rights from preserved assets, such as Tokyo Station, to be reallocated within the district,
allowing heritage conservation without compromising economic feasibility. A required portion of additional FAR must be dedicated to non-office uses, ensuring functional diversity and preventing mono-functional office concentration.
FAR thus becomes a negotiated urban instrument rather than a fixed entitlement. Project feasibility for landowners is aligned with districtwide public benefit and continued reinvestment.
At street level, podium height controls and continuous eave lines reinforce human-scale proportions along key pedestrian corridors. The 31-meter podium expression line along streets such as Marunouchi Naka-dori maintains a consistent height-to-width ratio, preserving pedestrian comfort while allowing vertical variation above. By maintaining consistent street-level proportions while allowing variation above, the district avoids abrupt visual or spatial discontinuities as buildings are replaced over time. Continuity reduces conflict between adjacent developments and reinforces public cognition and confidence in ongoing change.
Public Realm as Foundational Urban Infrastructure
In Marunouchi, the public realm is treated as essential infrastructure rather than residual space. Hierarchical streets, plazas, and intermediate spaces form continuous pedestrian networks connecting transport hubs, workplaces, retail, and cultural destinations. The district’s spatial organization can be understood through a Zone–Axis–Hub framework, in which distinct zones retain historical and functional identities, primary axes structure pedestrian movement, and hubs concentrate activity around transport nodes. Layered circulation provides multiple route options, allowing movement to be intuitive and adaptive.
Choices between covered and open paths, underground and above-ground routes, and quieter or more active streets enable pedestrians to respond to weather, congestion, and seasonal conditions. This multiplicity reduces cognitive load and enhances comfort in a district experiencing substantial daily footfall. Seasonal light installations, art programming, and curated events extend activity beyond office hours,
Torch Tower, a supertall mixed-use centerpiece of the TOKYO TORCH, developed by Mitsubishi Estate and designed by Mitsubishi Jisho Design, scheduled for completion in 2028.
reinforcing the shift toward an Amenity Business Core.
These spaces are planned and managed at district scale. Large development parcels introduced in the mid-20th century are required to incorporate publicly accessible passageways, preventing monolithic ground planes and ensuring permeability. Major streets have been transformed into pedestrian-oriented environments through coordinated materials, landscaping, and curated programming.
Continuous and aggregated open spaces create a legible and connected urban experience. Seasonal events and art installations reinforce both economic vitality and social cohesion.
Infrastructure Enables Density
High-density environments depend on infrastructure operating beyond individual buildings. District-scale energy networks, including centralized heating and cooling systems, support efficiency and adaptability as buildings are renewed. Shared energy infrastructure reduces redundancy, improves performance, and facilitates long-term sustainability targets.
Resilience is reinforced through coordinated business continuity frameworks integrating seismic upgrades, redundant energy supply, underground service networks, and emergency preparedness systems. Buildings support one another during
disruptions, enabling continuity of essential functions.
Transport integration is fundamental. Multiple rail lines serve the district, accommodating approximately 2.3 million daily footfalls. An extensive underground pedestrian network links towers, retail concourses, and transport nodes, expanding the functional ground plane across multiple levels and improving transfer efficiency.
Concentrated access to public transportation enables high employment density while reducing reliance on private vehicles. Parking provision is managed at district scale, minimizing redundant supply and limiting vehicular intrusion at street level.
Infrastructure planning is aligned with development phasing, allowing incremental intensification while maintaining daily operations.
Vertical, Mixed-Use, and Public
Recent developments illustrate how district principles extend vertically. Large-scale mixed-use projects integrate offices, retail, hospitality, cultural facilities, and publicly accessible spaces within single developments.
TOKYO TORCH exemplifies this approach through phased infrastructure upgrading and district reconnection. The development acts as a connective hinge between Otemachi,
Marunouchi, Yaesu, and Nihonbashi, consolidating pedestrian movement and public space across previously fragmented areas. Phased construction enabled underground works and public space creation without disrupting critical infrastructure.
The project introduces horizontal public open spaces reconnecting districts, vertical publicly accessible terraces, expanded underground pedestrian networks, and cultural programming. By combining horizontal and vertical public spaces, TOKYO TORCH extends the public city across multiple levels. Its significance lies not in height alone, but in its contribution to district-scale infrastructure renewal.
Transferable Lessons for Global Cities
While Tokyo’s institutional context is specific, key principles are transferable. Density is most effectively managed at district scale. Spatial rules can function as economic instruments when aligned with public objectives. Governance structures that foster long-term trust are essential for sustained reinvestment. Integrated rules must translate into consistent investment in shared public realm and infrastructure. Infrastructure should precede or accompany vertical growth, and area management must extend beyond project completion.
Cities facing redevelopment pressure can adapt these principles to their own regulatory and cultural environments.
Designing for Time and Space
Marunouchi demonstrates that successful high-density regeneration emerges through systems designed to operate over decades. By aligning governance, spatial rules, infrastructure, and public realm investment, the district has evolved continuously while maintaining coherence from ground to skyline.
Area management sustains these systems beyond individual projects, ensuring density functions as a shared urban asset rather than a one-time development outcome. Tall buildings must be understood not as isolated icons, but as components within integrated urban systems designed to endure, adapt, and maintain social legitimacy over time.
Image credits— Unless otherwise indicated, all images are courtesy of Mitsubishi Jisho Design Inc.
Left— Torch Tower (left) at the ground plane, interacting with the plaza via the Tokiwabashi Tower (right) podium.
Left—
The 1970s Cresta Grande Hotel in Cape Town, South Africa, is the subject of a design intervention proposal using mass timber structural elements.
Among mass timber’s many advantages are its light weight and rapid constructability, making it particularly appropriate for the revitalization of aging properties, writes Sebastian Bildau, whose firm collaborated on a hotel regeneration proposal in Cape Town.
Mass Timber’s Advantage
Imagine our cities growing like forests— vibrant, diverse and regenerative. Today, building extensions, densification, timber high-rises and innovative urban development projects show how sustainable urban development can be achieved. By using timber as a material, we are not only create new spaces, but also functioning cycles that combine ecological and social aspects. Let us discover together how sustainable urban landscapes are created, in which buildings, like trees, shape a lively and resilient cityscape.
The practical example of the Cresta Grande Hotel in Cape Town, a joint research, planning and feasibility project by Atelier Bildau and SMEC South Africa, demonstrates how these concepts can be implemented, by focusing on sustainable, large-scale timber construction, showing how existing buildings can be densified in a resource-efficient way.
The present feasibility study was initiated and conducted by Atelier Bildau (Sebastian Bildau) and SMEC South Africa (Damien Mocke and William Ruijsch van Dugteren). The Cresta Grande Hotel in the city center of Cape Town serves as a case study. A similar concept can also be applied to other existing properties. A further study on
#1
EXISTING BUILDING
• Area: Approx. 14,000 m² GFA
• Height: Approx. 60 m
• Base: Approx. 45 × 45 m
• Tower: 32 × 32 m
economic viability and a differentiated investigation into the timber types to be used (spruce, South African pine, eucalyptus or bamboo) is currently being prepared in consultation with the owner.
Design Principles
These design principles are at the heart of the transformation of the Cresta Grande Hotel. Through adaptive reuse, existing structures can be revitalized, assigned new purposes and their lifecycle extended, while at the same time minimizing waste. By densifying the existing building, the project makes efficient use of the limited urban space in Cape Town, responding to the need for more sustainable and space-conscious cities. The previously monofunctional (mainly office) city center is also diversified and enlivened.
At the center of this approach is the use of mass timber construction. Mass timber is not only lightweight and robust, but also significantly reduces the carbon footprint of the building process. This material enables the addition of new stories with minimal structural reinforcement, thus opening new opportunities for vertical growth in ageing urban environments.
Prefabrication further enhances the sustainability and efficiency of the
#2
ADD VOLUME HORIZONTALLY
• Maximize usable floor area
• Approx. 240 m² GFA per floor
• Supported by an independent timber structure
project. The components can be manufactured off-site and assembled quickly and quietly on-site, minimizing disruption for the urban neighborhood and ensuring high quality and precision. In addition, fewer construction workers are required on site, leading to savings in personnel and insurance costs.
The design includes green towers that integrate vegetation and natural elements, contributing to improved air quality, greater biodiversity and a healthier urban environment. Dust particles around the building are reduced and the urban heat island effect in dense city centers is mitigated. The footprint of the existing building (approximately 1,760 square meters GFA) has not been enlarged, but instead has been supplemented with green terraces and roof areas (approximately 3,590 square meters GFA).
The mixed-use character of the complex fosters a vibrant community by integrating various functions— such as residential, hotel, commercial and leisure spaces—at a single location. Public facilities on the roof create inclusive spaces, offering panoramic views and opportunities for social interaction, turning the building
#3
ADD VOLUME VERTICALLY
• Extension of four new floors
• Approx. 900 m² GFA per floor
• Existing concrete core extended
into a meeting place for guests and the wider public.
The construction process is fast, dry and clean, reducing water consumption and minimizing dust and noise pollution—benefits that are especially important in densely built urban areas. The speedy construction allows for a short conversion process and quicker re-letting/sale of the property.
Building Site
The project is located in Cape Town’s Central Business District (CBD). At the corner of Strand and Loop streets stands a podium building (approximately 45 x 45 meters) with a centrally positioned tower (approx. 35 x 35 meters). The height of the existing structure is about 60 meters, with a gross floor area (GFA) of approx. 14,000 square meters. It is used as a hotel and was built in the 1970s.
Concept
The existing building was stripped back to its reinforced concrete structure, with all fittings and façade removed. This made it possible to mount the additional areas for hotel rooms, horizontal extensions and the addition of four extra stories (7,000 square meters GFA = 50% increase) directly onto the existing building, without the need to
ADD TIMBER SUPER TRUSSES
• The new program at the top of the building is supported by an external timber super truss
• Ties back to the existing structure
• Cladding where necessary
ADDITIONAL AMENITY PROGRAM
• Three new floors for shared amenities, including a restaurant, bar and rooftop pool with sundeck
• Spectacular views across the surrounding city
NEW SKIN AND GREEN BALCONIES
• Building will be clad with a new timber and glass skin
• Unitized timber curtain wall
• Building-Integrated Photovoltaic Panels applied to opaque surfaces
#4
#5
#6
Above— Aerial view of project site. Below— Diagramming the mass timber design intervention.
reinforce the original structure and foundations. Only the timber crown on top (glulam and cross-laminated timber elements) was built with its own external supporting structure. The vertical loads are transferred through new columns and foundations via the podium. The timber structure is connected to the reinforced concrete with steel fittings. The rooftop swimming pool acts as a mass damper.
Structural System
The load-bearing structure of the Cresta Grande Hotel consists of three parts: the existing reinforced concrete building, the horizontal and vertical extensions, and the external timber structure, made up of the super truss and crown.
The timber extensions are a skeleton structure with columns and beams made from glulam (glued laminated timber) using local South African pine and, in part, eucalyptus. The floors are made from crosslaminated timber (CLT), also locally produced. All components are prefabricated and assembled only on site. If required, the elements can also be dismantled. Most connections are timber-to-timber joints, while highly loaded parts and nodes are reinforced with steel components.
The eight super-trusses and the crown, which forms the building’s top, are made from glulam using South African pine (SAP). A single truss spans 15 meters in width and 75 meters in height. Horizontal loads are partly transferred into the existing reinforced concrete structure. Vertical loads are directed downwards via additional columns through the podium into the ground. By coupling the rigid original structure with the “flexible” timber frame, a resilient overall structure is created, optimally performing even in high winds and earthquakes.
Façade
The original façade of precast concrete elements and windows is dismantled and replaced with an energy-optimized timber panel façade. The suspended façade is modular, made from prefabricated panels measuring 2.5 x 3.5 meters. This ensures a rapid, dry and quiet replacement and a short
Top Right— Orthogonal and curved timber frames; axonometric view.
Middle Right— Plan view, typical floor, locating gardens atop extra space added by new timber framing.
StructuralFraming Plan
Bottom Right— Section view of timber intervention.
Structural FramingSection
Detailed elevation rendering. BIPV panels would occupy opaque spandrels in some locations.
Height: Approx. 60 m
Stories: 22
Area: Approx. 14,000 m²
Function: Hotel
Left— Elevation view.
Cresta Grande Hotel Cape Town, South Africa
Add position— The timber extension would support a pool and indoor/outdoor amenity space.
Top Left— Each alternate floor on the tower would receive a small garden shelf.
Bottom Left— The timber extension would support a pool and indoor/outdoor amenity space.
Image credits— Unless otherwise indicated, all images are courtesy of Atelier Bildau + SMEC South Africa
Sustainability Measures
Adaptive reuse and materialefficient construction using timber, hemp bricks and natural fibre systems supporting circular resource use and construction innovation (SDG 9, 12)
construction period. All opaque elements of the façade are fitted with building-integrated photovoltaic panels (BIPV). More than a third of the façade area (10,682 square meters) can thus be used for electricity generation. The façade also features ventilation flaps and decentralized heat/ cool recovery. This improves room comfort and reduces the building’s operational energy requirements. The façade concept is rounded off by passive shading elements at the ends of the building.
On-site renewable energy production through BuildingIntegrated Photovoltaic façade systems (SDG 7, 13)
Extensive greening of terraces and roof areas strengthens biodiversity, improves air quality, and reduces dust and heat islands. The green spaces, which are twice the size of the built area of the original building, also store water and buffer heavy rainfall events.
Integrated Design, Engineering and Digitalization
Blue infrastructure including rain and stormwater retention strategies to support water-sensitive urban design (SDG 6, 11)
From day one, the design and planning were carried out in collaboration with our local partner, SMEC South Africa, a global engineering firm with offices in Cape Town and Johannesburg. The collaboration took place through in-person workshops and digitally via Rhino and Grasshopper.
Green terraces enhancing biodiversity, improving microclimate and reducing urban heat island effects (SDG 11, 13)
Public rooftop amenities
The entire structural system, including all components, was created using parametric modeling and can thus be quickly and efficiently adapted to different parameters, such as different types of wood and structural grids. During the design phase and subsequent optimization phases, the digital model is adjusted directly and does not need to be remodeled at every step. This not only saves time but also reduces the error rate during data transfer. In addition, all project participants can view the current dimensions of the structural components at any time. For design purposes, the structural model can also be visualized directly or printed as a 3D model.
contributing to inclusive, mixed-use urban development and community integration (SDG 11)
renewable materials such as wood, bamboo, hemp, and clay.
Greening the building reduces particulate matter, enhances biodiversity, and mitigates the heat island effect. Naturally, it is cooler and more pleasant to spend time on green (roof) surfaces and terraces. Water is also stored beneath all green spaces and buffered during heavy rainfall events (retention and detention).
Sustainability and Circularity
Responsible and resource-efficient construction is a top priority for the team. In this regard, the Cresta Grande Hotel excels in many areas. In addition to infill development—which preserves and extends the life cycle of the existing
The building’s facade is used for energy production and recovery. More than a third of the facade is used to generate electricity.
The public communal spaces throughout the building create inclusive and diverse neighborhoods and strengthen community cohesion.
Vertical and horizontal addition:
Mass timber structure: glulam elements, potentially with rain screen
Building integrated photovoltaic panels (BIPV) on all vertical spandrel panels and horizontal shades
The existing building, which we affectionately call the “ugly duckling,” is being transformed by this renovation project into a “swan”: a contemporary eco-hotel. The project stands out for its beautiful wooden interiors (ceilings, structural framework, and façade) and its vastly improved energy performance (new thermal envelope, on-site energy production, efficient building services, window ventilation, and decentralized heat/cooling recovery). The combination of energy efficiency, an increase in floor space (more than 50%), the use of biogenic building materials (wood, hemp, bamboo, clay), and a mixed-use property in the city center that is open to the public makes this project a top investment and asset on every level.
Left— Axonometric line-drawing view of original tower and timber invervention.
The Birth and Spread of the Floor Area Ratio: A Global History
The global origins, diffusion, and consequences of the floor area ratio (FAR) are multi-dimensional. Although widely associated with New York’s 1961 zoning plan, the concept emerged earlier from Garden City ideals, Depression era reformers, and New York planners in the 1930s. The use of FAR spread across North America, Britain, Hong Kong, China, and India, becoming a universal density control tool. The practice had both intended and unintended impacts; stringent FAR caps are associated with both higher housing costs and sprawl. Understanding FAR’s history is therefore essential for rethinking contemporary urban growth.
Author: Jason M. Barr
Keywords: Agglomeration economies
Floor area ratio (FAR)
Garden City Movement
Land-use regulation
Zoning history
Introduction
The floor area ratio (FAR) is one of the most important urban planning tools worldwide. The FAR is used in two ways. First, it serves as a measure of a building’s bulk, calculated as the total floor area divided by the lot size.1 For example, the Empire State Building (see Figure 1) has a floor area of 2.8 million square feet (260,000 square meters) and sits on a lot of about 91,000 square feet (8,500 square meters), giving it a FAR of 31. More broadly, the built FAR of Manhattan is 4.4, and New York City is 1.1.2
Second, the FAR is used as a planning or zoning device. Municipalities set caps on the FAR for new construction. Say the rules restrict a parcel to an FAR of 10, the lot owner can construct a building with 10 floors covering the entire lot, 20 floors covering half the lot, or 40 floors covering a quarter of the lot. Limiting the FAR thus achieves two goals at once: Taller builders are surrounded by more open space and sunlight, and the building’s density is fixed, restricting population in (and around) the structure (see Figure 2).
Today, hundreds, if not thousands, of cities use FAR limits as part of their zoning and planning regimes. Even though the FAR is ubiquitous, its origins and history have largely been forgotten. Ask a random planner, for example, when and where the FAR was first used, the most likely answer is “New York City in 1961,” when FAR caps were adopted citywide. However, this belief is simply untrue. New York’s role in the history of the FAR is key. FAR was “invented” there, but it was a product of the Great Depression, and it took New York a quarter-century to fully implement it (see Figure 3), whereas during the 1940s and 1950s, the FAR traveled far and wide.
The FAR originated among utopians and visionaries. Its use was not value-free, and its implementation was not done in a manner that best balanced the costs of limiting building bulk against the benefits. Rather, the FAR was imposed by reformers with a specific agenda—they opposed large cities and high urban densities and sought to eliminate them. The FAR was created to decentralize the metropolis and restrict population density. Ironically, the FAR is one of the few remaining elements of the 20th century’s Modernist agenda. Gone are slum clearance programs and Corbusian isolated towers-in-the-park, along with the unquestioning embrace of highways and automobiles to depopulate central cities.
But the FAR remains—supported by planners and residents alike—because it gives them control over what can be built, for both socially beneficial and individually “selfish” reasons. The FAR also remains because it can be readily accommodated by various planning and land-use regimes, ranging from as-ofright zoning in the United States to the discretionary planning model in the United Kingdom to government land-lease systems in Asia.
The Pre-History of the Far: the Garden City Movement
Although the FAR is a mid-20th-century American concept, its roots can be traced to the Garden City Movement initiated by Ebenezer Howard in the United Kingdom at the end of the 19th century. Howard (1850–1928) was born into a middle-class family and earned a modest living in London as a stenographer. Like many of his contemporaries, he was concerned about urban problems and poverty. The rural poor were forced off their farmlands and packed like cattle
Figure 1—
The Empire State Building, New York. FAR = 31.
SAM VALADI (CC BY-SA)
into overcrowded tenements. Workers had neither the benefits of cultural life nor the invigorating engagement with nature.
Influenced by earlier utopian thinkers, Howard set out to create his own version of the Good Place, which he called the Garden City. As documented in his book Garden Cities of To-morrow (1898), his idea was to build highly planned, communally owned, low-density cities in the agricultural hinterland. Once built out, Garden City holds exactly 32,000 residents, along with their homes, shops, community centers, and the factories where they work, all arranged in a precise order for maximum efficiency and quality of life.
When Garden City reaches its limit, a sister city is established on the other side of the greenbelt. In this way, over time, Garden City replicates itself in a fractal formation of a circle of circular cities. As the number of Garden Cities multiplies, metropolises such as London would naturally depopulate and deconcentrate (see Figure 4).
Howard’s book inspired the construction of several Garden Cities in the United Kingdom. The first was Letchworth Garden City, about 35 miles (56 kilometers) north of London, which began in 1903. The Letchworth development corporation hired a young Scot, Thomas Adams (1871–1940), as the project’s first secretary-manager. Although he worked diligently to make it a success, Letchworth did not turn a profit in its early years, and he was relieved of his duties. However, by the time he left Britain for Canada in 1914, he was a widely respected planning expert.
Just as important was that the Garden City Movement—inspired by the eventual success of
Letchworth—gave rise to the new professions of Town and Regional Planning. The idea that planners could create ideal communities (or “new towns”) from the drawing board, and that regions could be organized to achieve an equal balance between city and country, was very appealing to many who were dissatisfied with laissez-faire capitalism and the seemingly chaotic land-use patterns and poor health that it engendered. Town and regional planners sought to reconstitute modern life using scientifically based principles, summarized by the phrase “measure, forecast, implement.”3
The Garden City and Town and Regional Planning movements in the United Kingdom inspired American reformers. Two organizations emerged in New York in the 1920s that would later lead to the birth of the floor area ratio.
Regional Plan Association (RPA)
In 1923, Thomas Adams moved to New York after being hired as General Director of Plans and Surveys for the Regional Plan of New York and its Environs (now Regional Plan Association (RPA)). This project, initiated in 1921 and funded by the Russell Sage Foundation, aimed to develop a regional plan for the New York City metropolitan area, encompassing 5,528 square miles (14,317 square kilometers) across three states and centered on Lower Manhattan. Though Adams’s Garden City bona fides were impeccable, the Regional Plan was more practical, focusing on the best ways to rationalize the metropolis rather than depopulate it. Illustrations of
Figure 2— FAR illustration by The American Society of Planning Officials (1958).
Under Adams’s leadership, RPA created two sets of volumes released between 1927 and 1931. The first was the eight-volume Regional Survey, which reviewed the region’s economy, demographics, transportation, and land uses. The survey was followed by a two-volume Regional Plan which provided a roadmap for future growth, including the expansion of highways and railroads. The plan was written by Adams.
Adams did not work in a vacuum, however. On his team were several of New York’s early zoning reformers, including Edward M. Bassett, who spearheaded the drafting of the 1916 Zoning Resolution, the first comprehensive Zoning Ordinance in the United States. The 1916 codes limited density by establishing building setbacks that increased with height, thereby incentivizing the wedding cake style of Art Deco skyscrapers.
In fact, buried deep in a 1913 report from the New York Heights of Buildings Commission (led by Bassett), which first proposed the building setback rules, is testimony from the engineer, Reginald P. Bolton. His contention was that the skyscrapers rising in Lower Manhattan were inherently uneconomical and he advocated for limits on floor areas relative to plot areas, claiming that “Such a limitation as, for instance, to ten times the plot area would have permitted the construction of the Woolworth Building to a height of 12 stories, and its tower to 40 stories” (as opposed to its actual “base” of 30 stories and 55 stories including its tower).4
We can also see FAR-like thinking in the Regional Plan (1931), which proposes that the best way to
regulate building (and population) density is to require a specified number of feet of open space per unit of building height, which is a FAR regulation in essence. The plan states:
In residential districts the minimum open space requirement should be 50% of the lot area for buildings not over eight stories in height, and not less than one square foot for each eight square feet of the gross floor area of the building. Under this scale a 12-story building would have 60% open space. While the above should be a minimum standard for intermediate residential areas, there are large portions of such areas where the open space requirements should be one square foot for each 4 square feet (0.37 square meters) of gross floor area. This will mean 50% open space for a four-story building, 60% for six stories, and 75% for 12 stories. This will insure [sic] provision for open space on the lot roughly proportionate to the population density.5
The RPAA
In parallel with RPA’s work, a group emerged— directly inspired by Howard’s visionary thinking— to advance Garden City-ism in the United States. The Regional Planning Association of America (RPAA), established in 1923, was an informal assemblage of architects, planners, reformers, and writers whose members were more radical than those in the RPA. One of its chief members, the writer, critic, and urbanist Lewis Mumford, would lambast Adams’s Regional Plan for being too timid and hewing too closely to the status quo.6 Though
Chrysler Building FAR = 25
Archie Bunker’s house (right) FAR = 0.5
Only Murders in the Building building FAR = 8
Carrie Bradshaw’s building FAR = 2
The author’s childhood home on Long Island FAR = 0.34
New York tenement FAR = 3.6
Figure
of buildings in greater New York City.
the RPAA was a small group, its members had an outsized influence, as they were prolific writers and lecturers and were frequently employed in important government positions.
Birth of the FAR: NYC 1935
The direct impetus for the creation of the FAR was dissatisfaction with the 1916 zoning codes. In 1934, RPAA member Frederick Ackerman, the first Technical Director of the New York City Housing Authority (NYCHA), wrote a report estimating New York’s maximum population if the city was fully built out to its maximum density under the current zoning codes. He estimated a figure of nearly 77 million people.7
Of course, that number would never be obtained (in 1934, Gotham’s population was about seven million). But his figure enabled reformers to “weaponize” the zoning codes as too liberal and to demand new ones, along with a master plan that would cap population density, decentralize workplaces, and create vast areas of open space.
During the Great Depression, planners began the “metricization” of urban density. The FAR was one formula developed, among others, such as open space ratios and rooms per acre. These metrics were used to make planning appear scientific and to determine thresholds that designated “good” versus “bad” outcomes.
However, “good” was purely a value judgement based on what felt right to the planners, who thought that population density beyond some level (usually some minimum needed to pay for infrastructure and public services) should be outlawed for the benefit of the people (though the cutoffs were made without much say by those in the lower income brackets who were most affected by them). Planners wanted to impose the singlefamily dwelling as the de jure housing standard because they deemed it the best typology.
The direct history of the FAR begins with RPAA member Robert D. Kohn, an architect and planner who served in the Roosevelt Administration, leading the Housing Division of the Public Works Administration (PWA). In 1935, Kohn headed a housing committee of the City Club, a New York City organization founded in 1892 that promoted good governance and reform-minded policies. Kohn’s report (written with help from Ackerman)
4— Ebenezer Howard’s Garden City Plan and Regional Garden Cities. From Tomorrow: A Peaceful Path to Real Reform (1898).
Figure
recommended, for the first time in print, changing the zoning codes to limit the floor area ratio. The report used Ackerman’s hypothetical future population estimate of 77 million as propaganda to advocate for the downzoning.8
The City Club report led Mayor Fiorello La Guardia to form the Mayor’s Committee on City Planning, whose work was funded by the Works Progress Administration (WPA). This 1938 report, entitled “Zoning for the City of New York,” was the first formal statement by the New York City government that the FAR (called the “bulk ratio”) should be included in future zoning reforms.9
Rex the Red
In 1938, New York City also established the City Planning Commission (CPC) and the Department of City Planning (DCP) to oversee planning and zoning. Mayor La Guardia chose Rexford Tugwell, a former member of FDR’s “Braintrust” of New Deal advisors and head of the Resettlement Administration (RA), as the first head of the CPC.
Tugwell was disparagingly nicknamed “Rex the Red” by his enemies for his firm belief in the benefits of economic and urban planning. Though not a member of the RPAA, he was a tried-and-true Garden City-ite, having overseen the Federal Government’s creation of a handful of “Greenbelt Towns”—government-built new towns designed along Garden City principles (and with architectural and planning input from RPAA members).10
Tugwell arrived in New York with a very ambitious agenda—to reform its zoning codes and create a master plan that would organize the city in accordance with RPAA ideals. Inspired by the 1938 report, Tugwell initiated a revision of the 1916 zoning codes, proposed in 1939 and enacted in 1940. Though they retained the basic structure of the 1916 codes, the revision included two new provisions. One was the specific creation of single-family-home-only districts. The second was to include FAR caps in certain low-density neighborhoods. Thus, the 1940 codes were the first in the nation to apply FAR restrictions on a limited basis.11
Rexford Tugwell’s time in New York, however, was short and marked by defeat. His proposed master plan (aimed at converting one-third of New York into a greenbelt) and the desire for a new citywide zoning regime were more than the city’s Master Builder and Power Broker, Robert Moses, could endure. He led the charge to defeat Tugwell’s proposals, as he saw Tugwell as being too far to the left and too utopian for New York’s more laissez-faire orientation.12
When Harold Ikes, FDR’s Secretary of the Interior, offered Tugwell the position of Governor of Puerto Rico, he jumped at the chance.
Far and Wide: North America
In the 1940s, New York City planners spread the FAR gospels. One such planner was William Ludlow, who
had worked with Tugwell at the RA and then moved to New York. He was representative of urban planners of the day. In 1945, for example, he published papers on urban density metrics. One, entitled “Measurement and Control of Population Densities,” in the Journal of the American Institute of Planners, defined the floor area ratio (and other density formulas) and its application in New York to restrict bulk (including for site planning of public housing projects).13
Tugwell brought Ludlow to Puerto Rico as a planning consultant, and by 1946, FAR caps were incorporated into San Juan’s Zoning codes by Puerto Rico’s Planning Board. In the central business district, FARs were capped at 4.5 to limit population growth.14
Thanks to the work of Ludlow and other New York planners, the FAR was common knowledge by the end of the 1940s. A 1948 report by the American Public Health Association entitled “Planning the Neighborhood” confirms this to be true, stating:
The measurement of building bulk in term of “floor area ratios” has been found so useful as a density control that it being applied increasingly by planners both in the United States and Britain.15
By the 1950s, the FAR began to spread exponentially. Initial discussions showed up in Chicago in 1951 (with the city adopting FAR caps in 1957), in Boston in 1953, and in San Francisco in 1954.16 By 1958, FAR caps were so widely employed across the country that no one seemed to remember its origins. In a report, the American Society of Planning Officials confessed, "Just when the floor area ratio bulk control first appeared in a zoning ordinance is not certain."17
Across the Pond
If the British inspired American Garden City-ism and Town and Regional planning, the Americans gave the British the idea of the FAR. In 1945, the Corporation of the City of London engaged architect Charles Holden and William Holford, Director of Research at the Ministry of Town and Country Planning, to develop a plan for the City’s reconstruction following the devastating Nazi bombings. In March 1946, they submitted their interim report, and their final plan went into effect in 1947 (and was published in book form in 1951).18
The plan recommended that the City strive to remain a center of finance and business but also recognized the need to address traffic congestion. They suggested that the total daytime population should be set slightly below the 1931 level, while allowing ample floor space per person. Several metrics for bulk and open space were included in the plan, but, most importantly, it set limits on the Plot Ratio (the British term for the FAR). In their report, they declare:
[Prior] studies, and our knowledge of past and present indices of floor space for the City as a whole, lead us to the following recommendation: That for the standard office block a maximum ratio of 5 to 1 should be established, between the amount of floor space in a particular building or group of buildings and the area of the plot which the building owner is developing.19
But it's important to note here that the plot ratio was incorporated into Britain's discretionary planning system. Unlike New York, there was a no as-of-right construction, in which developers could build without planning permission if the FAR was at or below the applicable cap. When a developer submitted plans to the local planning authority, they had to demonstrate that their structures were within the FAR limits.
Spread to Asia
Hong Kong’s colonial leaders took note of planning developments in the Unityed Sates and United Kingdom. Following New York’s 1961 Zoning Resolution, Hong Kong adopted FAR (plot ratio) caps. Unlike in New York or London, these caps were used within Hong Kong’s land-lease system. Because the Hong Kong Government owns all the city’s land, new developments emerge from the sale of ground leases. However, Hong Kong had one department that oversaw its land markets and another its planning, zoning, and building codes. This dual system led to rules that were often contradictory and difficult to enforce.
In 1960, the Hong Kong colonial government created the Land Development Planning Committee (LDPC) to address interdepartmental conflicts. The Public Works Department, which was responsible for determining whether building proposals complied with the building ordinances, established a coordinating committee to work with the LDPC. In January 1961, the committee held a meeting related to density regulation, concluding that there was a need for Hong Kong to embrace the plot ratio, based on prior implementation abroad. The report states:
Building legislation in Great Britain and in America is tending towards a form of control based on the ratio between the total area of the floors contained within a building and the area of the plot on which it stands. This ratio, known as the Plot Ratio, is fixed for various zones and various types of buildings, and providing there are no infringements of light or air regulations, the developer has the choice of building high with a low site coverage or building low with a higher site coverage.20
Mainland China
In 1978, the Chinese government initiated its economic reforms. Since the 1949 Communist Revolution, private property had been abolished.
In 1980, Deng Xiaoping initiated a Special Economic Zone (SEZ) in Shenzhen, where party officials could experiment with market reforms. However, they soon realized that without private property, there was no way to efficiently allocate land for different uses. As a result, officials visited Hong Kong to gather ideas and there they learned about its land-lease system and zoning and planning regimes.21
By the early 1990s, all municipalities in China had the authority to sell ground leases that stipulated FAR caps as part of the lease requirements. Given China’s cultural preference for tower-in-park estates, local officials have used the FAR to make it so by capping FARs at around 2.5, on average (see Figure 5).22
India
Finally, India provides another interesting case study. Indian cities adopted FAR caps (known as the Floor Space Index, or FSI) because officials were unable to provide infrastructure in the central cities and sought to disperse population to the suburbs.23 In 1962, Delhi adopted FAR controls in its Master Plan, whose creation was led by Modernist architect, planner, and former RPAA member Albert Mayer (1897–1981) (and financed by the Ford Foundation). As his obituary in the New York Times recounts, “Mr. Mayer was a strong believer in the ability of city planners to bring order to the urban landscape.”24
To bring this “order,” FAR controls were made extremely stringent, ranging from 0.75 to 1.75 for residential zones, and 1.5 (or less) for industrial and commercial areas. And unlike New York and other cities, where the highest allowable central-city FARs were quite generous (usually nine or above) and then fell off moving outward, FARs in India were relatively uniform, thereby attempting to turn the built environment into a “pancake” rather than a “cone.” Bangalore, for example, had FAR caps that increased with distance from the center to encourage suburbanization (see Figure 6).25
The FAR Future
The FAR became ubiquitous in the second half of the 20th century because it offered planners a relatively easy way to limit urban density and ensure open space around buildings. They were made stringent on the belief that cities needed to be reined in and surgically and scientifically managed (an idea that would receive forceful pushback from Jane Jacobs in her 1961 book The Death and Life of Great American Cities). But today, it’s clear that stringent FAR caps have generated unintended consequences (see Figure 7).
Economists have documented the downsides of low FAR limits. They increase housing prices by making housing scarcer; they promote sprawl (and increase carbon emissions) by pushing construction to the urban fringes; and they
reduce the ability of people and companies to benefit from so-called agglomeration economies, i.e., the benefits of clustering.26
Several cities worldwide have experimented with upzoning (including in India). The evidence indicates that when increases in FAR are generous (above 30%) and citywide, housing prices fall (or grow much more slowly).27 New York recently upzoned many of its neighborhoods. Nonetheless, the plan—referred to as the "City of Yes Housing Opportunity"—was relatively limited to avoid alienating NIMBY-oriented residents (see Figure 8).28
More broadly, when a city seeks to raise its FAR caps, it often generates protest and resentment. Since no one recalls the history of the FAR, it is widely believed that the original, highly restrictive FAR caps were “God-given.”29 Perhaps a deeper understanding of the history of the floor area ratio can lead us to rethink its application. Cities are our common future, and they need the capacity to grow in order to improve our lives.
Figure 5— Housing estates in China—towers in the park with low FARs.
Figure 6—
Estimated average actual FARs vs. allowed or permitted FARs for Bengaluru, India, ca. 2005 relative to the city center (in km).
Figure 7—
Maximum permissible free FAR for 20 cities around the world. Note that “Free” here means the base FAR as listed in the zoning codes. In many cases, additional FAR can be purchased or gained through the provision of public amenities. Red bars are Indian cities.
Figure 8—
Average allowable residential FARs vs. distance to the Empire State Building (km) before and after “City of Yes” was enacted (December 2024).
NOTES & REFERENCES
1 The phrase “floor area ratio” is most common in the United States, but it is called the “Plot Ratio” or “Floor Space Index” (FSI) in other countries. Furthermore, there are variations across in what constitutes “floor area,” such as whether garages, basements, and spaces used for plant and equipment are included.
2 New York FARs were calculated by the author from the NYC Primary Land Use Tax Output (PLUTO) File, 2025-v2.1.
3 Buder, Stanley. (1990). Visionaries and Planners: The Garden City Movement and the Modern Community. Oxford University Press.
4 Bassett, Edward M., Herbert S. Swan, and Frank B. Williams. (1913). Report of the Heights of Buildings Commission to the Committee on the Height, Size and Arrangement of Buildings of the Board of Estimate and Apportionment of the City of New York. MB Brown printing and Binding Company.
5 Adams, Thomas. (1931). Regional Plan of New York and its Environs: The Building of the City. (Volume II). Regional Plan Association. Emphasis added.
6 Mumford, Lewis. (1932). “The Plan of New York.” The New Republic 71 (915): 121–126. On the history of the RPAA see Spann, Edward. K. (1996). Designing Modern America: The Regional Planning Association of America and its Members. The Ohio State University Press.
7 Ackerman, Frederick L. and Ballard, William F. R. (1934). The Population of New York City as Permitted by the Zoning and Multiple Dwelling Laws. NYC Housing Authority.
8 From City Club archived records housed at The New York Historical. https://findingaids.library.nyu.edu/nyhs/ ms116_city_club/.
9 McCrosky, Theodore T. (1938). Zoning for the City of New York. New York (N.Y.). Mayor's Committee on City Planning.
10 Gelfand, Mark I. (1985). “Rexford G. Tugwell and the Frustration of Planning in New York City.” Journal of the American Planning Association 51 (2): 151–60. https://doi. org/10.1080/01944368508976206.
11 Zoning Resolution of the City of New York, As Amended by the City Planning Commission and Modified by the Board of Estimate, effective 28 June 1940, City of New York.
12 After Tugwell left New York, Moses joined the City Planning Commission and convinced the rest of the commissioners to reject Tugwell’s master plan. After the Commission voted to reject it, Moses gleefully told the press that “green belts are dead.” In: The New York Times (1942). “Tugwell Planning for City is Junked,” 12 Feb. 2025.
13 Ludlow, William H. (1945). “Measurement and Control of Population Densities.” Journal of the American Institute of Planners 11 (2): 17–25.
14 Ludlow, William H. (1947). “Realistic Density and Bulk Zoning: As Recently Instituted in Puerto Rico.” Journal of the American Planning Association 13 (1): 22–6.
15 American Public Health Association. Committee on the Hygiene of Housing. (1948). Planning the Neighborhood Public Administration Service.
16 Chicago Plan Commission. (1951). A Study of Residential Densities in Chicago. Chicago. Boston City Planning Board (1953). Zoning Policies for Boston. Department of City Planning, San Francisco (1954). Comprehensive Zoning Ordinance: City and County of San Francisco.
17 American Society of Planning Officials. (1958). Floor Area Ratio. Chicago.
18 Marmaras, Emmanuel V. (2015). Planning London for the Post-War Era 1945-1960. Springer. Note that in the 1980s, the City of London dropped using strict Plot Ratio caps in its planning process.
19 Holden, Charles Henry and William. G. Holf. (1951). The City of London: a Record of Destruction and Survival. Architectural Press. Emphasis is in the original text.
20 Junwei Li and Kar Him Mo (2025). “Exploring the Transatlantic Origins of the Plot Ratio from New York to Colonial Hong Kong.” Planning Perspectives. https://doi.org/1 0.1080/02665433.2025.2582588
21 Chengri Ding. (2003). “Land Policy Reform in China: Assessment and Prospects.” Land Use Policy 20(2): 109–20. https://doi.org/10.1016/S0264-8377(02)00073-X. Wei, Liu. (1997). “Hong Kong’s Impact on Shenzhen Real Property Law.” Hong Kong Law Journal 27 (3): 356–73.
22 Brueckner, Jan K., Shihe Fu, Yizhen Gu, and Junfu Zhang (2017). “Measuring the Stringency of Land Use Regulation: The Case of China’s Building Height Limits.” Review of Economics and Statistics 99 (4): 663–77. https://doi. org/10.1162/REST_a_00650. Ironically, unlike many cities around the world, one could argue that urban residential FARs across China were too generous. Because municipal officials issue ground leases and earn revenue from them, they are incentivized to sell as many ground leases as possible. As a result, China experienced a housing bubble that burst in 2020. The country is still suffering from its effects.
23 In India, the FSI is usually calculated by multiplying the FAR by 100. So, an FAR of 1 would be written as an FSI of 100.
24 Goldberger, Paul. (1981). “Albert Mayer, 83, Architect and Housing Planner, Dies, The New York Times. https://www. nytimes.com/1981/10/16/obituaries/albert-mayer-83architect-and-housing-planner-dies.html. Delhi Development Authority (DDA). (1962). Master Plan for 1962. https://dda.gov.in/master-plan-1962.
25 Bertaud, Alain. (2004). “Mumbai FSI Conundrum: The Perfect Storm: The Four Factors Restricting the Construction of New Floor Space in Mumbai.” Working Paper. Brueckner, Jan K. and Kala Seetharam Sridhar. (2012). “Measuring Welfare Gains from Relaxation of Land-Use Restrictions: The Case of India’s Building-Height Limits.” Regional Science and Urban Economics 42 (6): 1061–67. https://doi.org/10.1016/j.regsciurbeco.2012.08.003.
26 Been, Vicky, Ingrid Gould Ellen, and Katherine O’Regan. (2019). “Supply Skepticism: Housing Supply and Affordability.” Housing Policy Debate 29 (1): 25–40. https:// doi.org/10.1080/10511482.2018.1476899. Bertaud, Alain and Jan K. Brueckner. (2004). “Analyzing Building-Height Restrictions: Predicted Impacts and Welfare Costs.” Regional Science and Urban Economics 35 (2): 109-25. https:// doi.org/10.1016/j.regsciurbeco.2004.02.004. Sridhar, Kala Seetharam. (2010). “Impact of Land Use Regulations: Evidence from India’s Cities.” Urban Studies 47 (7): 1541–69. https://doi.org/10.1177/0042098009353813. Barr, Jason, Shaojie Wang, and Ujjaini Desirazu. (2022). “High-rises versus Sprawl: The Impacts of Building Sizes and Land Uses on CO2 emissions.” In Sustainable High-Rise Buildings: Design, Technology, and Innovation, edited by Kheir AlKodmany, Peng Du, and Mir M. Ali.
27 Barr, Jason. (2023). “Does Up Zoning Work?” Skynomics Blog, 14 August 2023. https://buildingtheskyline. org/upzoning-1/. Nagpal, Geetika and Sahil Gandhi. (2026). “Relaxing Floor Area Ratio: Housing Supply & Affordability in India.”
28 City of Yes Housing Opportunity is expected to produce an additional 82,000 units over the next 15 years, which is 5,467 units per year, on average. The current number of housing units in the city is about 3.7 million.
29 I thank the planner Vidyadhar Phatak for his help on understanding India’s FSI history; it was he who used the phrase, “God-given,” when discussing recent changes in FSI regulations in India.
The Urban Structure of Opportunity: Residential Density, Building Height, and Employment Accessibility in São Paulo
This study analyzes how residential density, building height, and distance from São Paulo’s center shape employment accessibility using a Mobility and Employment Indicator. By aggregating building, census, and traveltime data onto an H3 grid, the analysis shows that taller, denser, centrally located areas exhibit significantly higher accessibility— especially for public transit users. Regression results confirm centrality as the strongest predictor, with density and height reinforcing accessibility advantages. The findings highlight how restrictive zoning in wellconnected areas limits access to opportunity and disproportionately affects residents dependent on public transit.
Spatial distribution of the Mobility and Employment Indicator for public transit trips across the city of São Paulo, as calculated by Responsive Cities Institute. Higher values indicate greater access to employment opportunities relative to the residential population within a 45-minute commute.
Introduction
As argued by Alain Bertaud, 1 cities are essentially labor and consumer markets that function best when the potential for interaction among workers, firms, consumers, and amenities is maximized. A common framework for assessing the quality of these connections is urban accessibility—a concept that captures how well city residents can reach the opportunities available to them, given the spatial organization of the city and the characteristics of its transportation system.2,3 Urban accessibility thus serves as a lens through which the combined effects of transport policy and land use decisions on people’s daily mobility can be evaluated.4
A growing body of literature has examined urban dynamics through this lens, and the topic is particularly relevant in the Brazilian context, where major cities are marked by deep socioeconomic inequality and where a substantial share of the population depends on public transit for daily travel.5 Against this backdrop, researchers at IPEA— the Brazilian Institute for Applied Economic Research—have produced influential work on the subject, including the development of a platform called Access to Opportunities, 6 which offers interactive maps displaying the number of jobs reachable within various travel-time thresholds—by both car and public transit—for cities across Brazil.
From an urban planning perspective, however, the transportation system alone cannot be held solely responsible for the patterns these maps reveal. Mobility policies often attempt to compensate for a
Indicator
of Mobility and Employment
Public Transit
Indicator of Mobility and Employment
Indicator of Mobility and Employment:
Public Transit
Public Transit
Higher values
Higher values
Access to a greater number of jobs relative to the number of residents in the area
Access to a greater number of jobs relative to the number of residents in the area
Lower values
Lower values
Access to a smaller number of jobs relative to the number of residents in the area
Access to a smaller number of jobs relative to the number of residents in the area
spatial mismatch between housing and employment that originates from factors unrelated to transportation. One such factor is the regulatory framework established by city plans and other urban legislation, which, through building parameters and zoning rules, restricts the residential densities permitted in areas with the strongest demand for housing.7 As a result, a significant share of the population is pushed toward more distant, peripheral locations.
In an effort to quantify this mismatch between housing locations and employment opportunities, Instituto Cidades Responsivas (Responsive Cities Institute) developed a Mobility and Employment Indicator—which is presented in the Institute’s Urban Indicators Observatory8—that combines two dimensions: the number of jobs accessible within a 45-minute commute and the degree of competition for those jobs among residents within the same catchment area. The indicator thus simultaneously captures whether residents are well-connected to available employment and whether the volume of accessible jobs is proportionate to the surrounding residential population. The resulting metric is designed to reflect the joint performance of two urban systems: the effectiveness of the Master Plan in aligning residential densities with employment and services centers, and the capacity of the transportation network to overcome the remaining spatial distance within an acceptable travel time.
Figure 1 maps the spatial distribution of the Mobility and Employment Indicator across São Paulo for public transit trips, revealing a clear and striking
pattern: the highest indicator values are concentrated in and around the city center, fading progressively— and apparently non-linearly—toward the urban periphery. Notably, this central dominance persists even though the city center already concentrates some of the highest residential densities in the municipality, suggesting that the volume of employment opportunities accessible from that area is sufficiently large to remain advantageous even under intense residential competition. In other words, centrality appears to generate an employment accessibility surplus that density alone cannot erode.
Beyond this, the non-linear spatial decay of the indicator values with increasing distance from the center warrants further attention. A plausible explanation lies in the relationship between residential density and the viability of high-capacity transit infrastructure: modes such as metro rail, BRT, and light rail require a sufficiently large ridership base— and thus higher surrounding residential densities—to be financially and operationally sustainable. As a result, denser areas near the city center benefit not only from geographic proximity to employment, but also from access to the very transit infrastructure that their densities help sustain—generating compounding accessibility advantages that lower-density peripheral areas are structurally unable to replicate.
The extent to which these compounding advantages can be realized, however, is not solely a function of market demand or geographic position— it is also a product of regulatory constraints. In the Brazilian context, the number of people who can legally reside near the city center is directly limited by the instruments embedded in municipal Master Plans and Building Codes. The most consequential of these is the Floor Area Ratio (Coeficiente de Aproveitamento – CA), which caps the maximum
Figure 3—
The Copan Building (Oscar Niemeyer, 1966), could not be built to the same height under today’s zoning.
SILVIO TANAKA (CC BY-SA)
Figure 2—
The Copan Building in São Paulo (height: 115 m; floor-tolot ratio: ~20:1) and a simulation of the maximum buildable envelope permitted on the same lot under current zoning regulations (maximum height: 48 m). A building of Copan’s scale could not be legally constructed under today’s density restrictions.
buildable floor area as a multiple of the lot area. In São Paulo, while developers may acquire additional building rights to reach a CA of up to 4.0 along designated transit corridors, this ceiling still falls well short of the densities historically achieved under less restrictive regimes. Figure 2 illustrates this gap concretely: the Copan Building, designed by Oscar Niemeyer with a floor-to-lot ratio exceeding 20:1 and standing 115 meters tall (see Figure 3), could not be legally built under today’s regulations— current zoning would limit the same lot to a maximum height of 48 meters, reducing the buildable envelope by more than half. Beyond the CA, setback requirements and Building Code ventilation shaft provisions impose additional volumetric constraints that, when superimposed, produce effective buildable envelopes substantially more restrictive than either rule alone would suggest.9
The result is a regulatory framework that artificially limits the residential population of precisely the areas where the accessibility benefits of urban life are greatest—and, if those benefits decay non-linearly with distance from the center, where marginal gains from densification would also be highest. Understanding the shape and magnitude of this decay therefore becomes not merely an academic exercise, but a necessary foundation for evaluating the cost of current density restrictions and for building the empirical case for their revision. As Glaeser and Gyourko have argued, 7 building restrictions function as a tax on housing supply, and their cost is ultimately borne by the households least able to absorb it—in this case, those for whom proximity to employment is not a lifestyle preference, but an economic necessity. Building on the empirical patterns described above and on the regulatory constraints that shape them, this article presents an initial quantitative analysis of the relationship between the Mobility and Employment Indicator and the spatial distribution of residential densities across the city— with the aim of determining whether the non-linear decay of accessibility advantages with distance from the center, and the role of density and built form in mediating that decay, can be confirmed through formal statistical analysis. The city of São Paulo is used as the study area, given that it exhibits one of the sharpest contrasts in residential density between its central and peripheral areas in Brazil, a characteristic that is expected to amplify the differences in Mobility and Employment Indicator values across the city. For each spatial unit within the city, four variables are examined: (i) the value of the Mobility and Employment Indicator; (ii) the number of dwelling units, as a proxy for residential density; (iii) the average building height, included as a proxy for the influence of non-residential land uses on urban form, given that data on commercial and service establishments in Brazilian cities are not publicly available at the required spatial resolution; and (iv) the distance from the city center.
The remainder of the article is structured as follows. The next section presents the methodology employed in the analysis. The results section opens with a graphical examination of the relationships among the four variables, followed by a Pearson correlation analysis and a multiple linear regression for each version of the indicator, with the aim of quantifying the strength and direction of these relationships. The article concludes with a summary of findings and directions for future research.
Methodology
To investigate these relationships empirically, this study examines four variables across different parts of the city of São Paulo: average building height, residential unit density (expressed as dwelling units per square kilometer, used here as a proxy for population density), distance from the city center, and employment accessibility, as measured by the mobility and employment indicator developed by Responsive Cities Institute.
All four variables were aggregated onto a regular hexagonal grid derived from Uber’s H3 spatial indexing system at resolution Level 9. This choice was driven by the fact that the mobility and employment indicator is natively computed at this spatial resolution. Since the other datasets used in this study offered greater flexibility in terms of spatial aggregation, the most coherent approach was to re-aggregate them to match the H3 hexagonal grid, enabling direct comparisons with the indicator values assigned to each hexagon.
Building height data were sourced from the built environment dataset made available through GeoSampa, the open geospatial data portal managed by the City of São Paulo, based on information collected in 2023. Average building height was calculated as a weighted mean, using each building’s footprint area as the weighting factor. This approach reduces the distorting influence of small structures—such as garages and storage sheds—which, while numerically abundant in certain areas of the city, contribute minimally to residential capacity.
Residential unit data were obtained from the National Address Registry for Statistical Purposes (Cadastro Nacional de Endereços para Fins Estatísticos—CNEFE), published by the Brazilian Institute of Geography and Statistics (IBGE) based on information collected during the 2022 Demographic Census. This dataset was selected for its high spatial resolution: each dwelling unit is represented as a georeferenced point, enabling precise aggregation across spatial units of varying sizes.
The distance from the city center was calculated as the straight-line distance from the centroid of each H3 hexagon to the coordinates of Praça da Sé—a landmark located in the Historic Center of São Paulo, adopted
Figure 5— Schematic illustration of the Mobility and Employment Indicator: the ratio of job positions to dwelling units reachable within a 45-minute isochrone from a given point, calculated separately for public transit and private car travel.
ISABELLA T (CC BY-SA)
Figure 4—
Marco Zero, in Praça da Sé, is considered the official central point of São Paulo.
here as the reference point for this measurement (see Figure 4).
The Mobility and Employment Indicator, developed by Responsive Cities Institute, measures the number of jobs reachable within a 45-minute commute divided by the number of dwelling units reachable within that same travel-time threshold—a ratio that simultaneously captures employment accessibility and the degree of labor market competition faced by residents of a given area, as illustrated in Figure 5. For its computation, employment locations were georeferenced using data from the 2023 Annual Social Information Report (Relatório Anual de Informações Sociais –RAIS), published by Brazil’s Ministry of Labor. Given known limitations in RAIS coverage for certain sectors, educational establishments were supplemented with data from the School Census and the Higher Education Census—both published by INEP, the Brazilian National Institute for Educational Studies and Research—while healthcare facilities were drawn from the National Registry of Health Establishments (Cadastro Nacional de Estabelecimentos de Saúde – CNES).
Employment data were then spatially aggregated at H3 resolution Level 9—a grid that has been widely adopted in spatial analysis literature due to its ease of use and shareability. Travel times by private car were calculated using the Mapbox API, while public transit travel times were obtained through the Google Routes API, both computed from the centroids of each hexagon. For each hexagon, the indicator counts the number of registered employment links (from RAIS) and the number of dwelling units (from CNEFE) reachable within 45 minutes of travel during peak hours. The final indicator value represents the weighted average of the jobs-to-dwellings ratio across hexagons, weighted by the number of dwelling units located in each hexagon.
The inclusion of the dwellings-reachable term in the denominator is intended to account for labor market competition, following the methodological framework proposed by Barboza et al.10 The underlying premise is that proximity to a given number of job opportunities is more advantageous when fewer people share access to those same opportunities. For example, access to 1,000 jobs in a city of 1,000 residents implies one job per person, whereas the same 1,000 jobs in a city of 100,000 residents yields only 0.01 jobs per person—a substantially less favorable competitive position. The 45-minute travel-time threshold was adopted based on the concept of labor market catchment areas discussed by Alain Bertaud, 1 where the relevant labor market for any given location is defined as the set of firms and workers reachable within approximately one hour of travel. However, an examination of the traveltime estimates produced by the APIs used in this study suggested that these estimates tend to be optimistic relative to real-world conditions, particularly during
morning and evening peak hours. The threshold was therefore reduced to 45 minutes to partially offset this upward bias and bring the estimates closer to observed travel experiences.
The analysis proceeded in three stages. First, scatter plots were constructed to allow graphical inspection of the relationships among the four variables, with each hexagon represented as a marker whose size encodes residential density, and whose color encodes distance from the city center. Second, Pearson correlation coefficients were computed for all pairs of variables to quantify the strength and direction of their bivariate relationships. Third, a multiple linear regression was estimated for each version of the indicator—public transit and private car—using distance from the city center, number of dwelling units, and average building height as predictor variables, with the aim of identifying the independent contribution of each predictor and comparing the overall explanatory power of the two models.
Results
Figures 6 and 7 display the relationships among the four variables for public transit and private car travel, respectively. In both charts, the horizontal axis represents average building height within each hexagon, the vertical axis shows the corresponding mobility indicator value, marker size reflects the number of dwelling units per square kilometer, and marker color encodes distance from the city center— with darker points representing locations closer to the center.
A positive correlation is apparent in both figures: the mobility indicator tends to increase as average building height and residential density increase. This relationship is visually more pronounced for public transit than for private car travel. In Figure 6, the hexagons achieving the highest indicator values are almost exclusively those combining high density, taller built form, and proximity to the city center. In Figure 7, the pattern is more dispersed, with lower-density hexagons located farther from the center also appearing among the top-performing areas—consistent with the notion that car travel can partially compensate for spatial disadvantages that public transit cannot overcome.
These visual patterns also suggest that the three spatial characteristics tend to co-occur: central areas appear to be simultaneously denser, taller, and better connected to employment opportunities, while peripheral areas exhibit the opposite pattern across all three dimensions. This raises the question of whether it is density and built form per se—or simply centrality—that drives accessibility performance, a point that the quantitative analysis addresses below.
Table 1 presents the Pearson correlation coefficients for all pairs of variables. The results confirm and sharpen the patterns observed in the scatter plots. All correlations involving the public transit indicator are substantially stronger than their
Figure 6— Mobility and Employment Indicator for public transit trips, correlated with average building height, residential density, and distance from the center of São Paulo.
Figure 7— Mobility and Employment Indicator for private car trips, correlated with average building height, residential density, and distance from the center of São Paulo.
counterparts involving the car indicator, suggesting that public transit accessibility is more tightly coupled with the spatial structure of the city. The strongest association in the matrix is between the public transit indicator and distance from the city center (r = -0.726), followed by average building height (r = 0.664) and residential density (r = 0.488). For the car indicator, the corresponding values are considerably weaker (r = -0.436, r = 0.380, and r = 0.340, respectively). The co-occurrence pattern suggested by the scatter plots is also confirmed: distance from the city center is moderately to strongly correlated with both average building height (r = -0.629) and residential density (r = -0.419), reflecting the well-documented tendency of central areas in Brazilian cities to concentrate denser and taller built environments. Finally, the two versions of the indicator are themselves moderately correlated (r = 0.602), indicating that while areas with strong car-based accessibility tend to also perform better on public transit accessibility, the relationship is far from perfect.
Table 2 presents the multiple linear regression results for each version of the indicator. Prior to interpretation, Variance Inflation Factors were computed to assess multicollinearity; all values fell below the accepted threshold of 10 (Distance from City Center: 3.56; Residential Density: 3.31; Average Building Height: 5.96), indicating that the estimates are reliable despite the intercorrelations documented above. For the public transit indicator, the model explains 61.6% of the variance (R2 = 0.616; adjusted R2 = 0.612; p < 0.001), with all three predictors statistically significant: distance from the city center is the strongest predictor (β = -0.474), followed by average building height (β = 0.293) and residential density (β = 0.156). For the private car indicator, the model is considerably weaker (R2 = 0.229; adjusted R2 = 0.220; p < 0.001): distance from
center and residential density remain significant (β = -0.289 and β = 0.162, respectively), but average building height does not reach conventional significance levels (β = 0.124, p = 0.083), suggesting that this variable has limited independent explanatory power over car-based accessibility once the other predictors are accounted for.
Taken together, these results indicate that the positive effects of density and built form on accessibility are, to a significant degree, inseparable from the locational advantage of centrality—and that this entanglement is far more consequential for public transit users than for car users. The marked difference in explanatory power between the two models—R2 = 0.616 for public transit versus R2 = 0.229 for private car—provides the clearest quantitative evidence that the spatial distribution of residential densities matters far more for those who depend on public transit than for those who travel by car. While car travel partially compensates for spatial disadvantages, public transit accessibility is much more tightly bound to the urban structure in which it operates, with the benefits of densification policies accruing disproportionately to those who depend on it.
Conclusion and Final Remarks
This study investigated the relationships among residential density, average building height, distance from the city center, and employment accessibility—as measured by the Mobility and Employment Indicator —across the city of São Paulo, using data aggregated onto Uber’s H3 hexagonal grid at resolution Level 9. Through graphical analysis, Pearson correlation coefficients, and multiple linear regression models estimated separately for public transit and private car travel, the analysis reveals a consistent positive correlation among these variables: areas with higher residential densities and taller buildings located closer to the city center tend to exhibit significantly better
accessibility to employment opportunities, a pattern that is substantially more pronounced for public transit than for private car travel. The marked difference in explanatory power between the two regression models—R2 = 0.616 for public transit versus R2 = 0.229 for private car—provides the clearest quantitative expression of this asymmetry: while car travel partially compensates for spatial disadvantages such as distance from the center and lower density, public transit accessibility is far more tightly bound to the urban structure in which it operates.
The practical significance of this asymmetry becomes clear when one considers who bears its consequences. According to IPEA, 11 approximately 65% of workers in the São Paulo metropolitan area rely on public transit or walking as their primary mode of transportation, and their average household income is less than half that of car commuters. These workers spend, on average, 48 minutes longer per day commuting—roughly 200 hours per year of productive time lost. For this majority of the workforce, the spatial distribution of residential densities is not an abstract planning variable; it is a determinant of daily quality of life and long-term social mobility.
These findings carry meaningful implications for urban planning practice. They suggest that land use
regulations—particularly those governing maximum residential densities—can have a significant and measurable impact on employment accessibility, above and beyond the effects of transportation infrastructure investment alone. When zoning rules restrict residential densities in well-connected, centrally located areas, they effectively displace a share of the population to peripheral locations where employment accessibility is systematically lower—an outcome that falls disproportionately on lower-income residents who are more dependent on public transit.
Conversely, policies that promote residential densification in and around the city center—through upzoning, transit-oriented development, or the revision of restrictive building parameters—have the potential to improve employment accessibility for a substantial share of the urban population, while simultaneously strengthening the ridership base that makes high-capacity transit modes financially viable. The results thus point to a virtuous cycle: higher densities near transit corridors improve accessibility, which in turn justifies further investment in transit infrastructure, which further amplifies the accessibility advantages of those locations. In the Brazilian context, three regulatory reforms merit particular attention. First, municipalities should revisit maximum Floor
Image credits— Unless otherwise indicated, all images are courtesy of the authors.
Area Ratios along established transit corridors: São Paulo’s 2014 Master Plan revision, which increased the maximum CA to 4.0 in areas served by rail transit, offers a precedent—yet even this ceiling falls well short of the densities that characterize the most accessible hexagons identified in this analysis. Second, the interaction between Master Plan volumetric parameters and Building Code requirements deserves systematic review, as the superposition of setback rules and ventilation shaft provisions frequently produces effective buildable envelopes that are more restrictive than either regulation alone intends.9 Third, fiscal incentives for residential conversion in central commercial districts—particularly in post-pandemic office markets with elevated vacancy rates—could increase residential density in precisely the areas where the accessibility gains documented here are greatest, without requiring new construction.
The relationship between employment accessibility and residential property values adds a further dimension to this picture. Available evidence from São Paulo’s housing market suggests that the accessibility advantages documented in this study are at least partially capitalized into land prices: FIPEZAP data consistently show that per-square-meter
REFERENCES
1 Bertaud, Alain. (2018). Order without Design: How Markets Shape Cities. The MIT Press
2 Geurs, Karst T. and Bert van Wee. (2004). “Accessibility Evaluation of Land-Use and Transport Strategies: Review and Research Directions.” Journal of Transport Geography 12 (2): 127–40. https://doi.org/10.1016/j. jtrangeo.2003.10.005.
3 Hansen, Walter G. (2007). “How Accessibility Shapes Land Use.” Journal of the American Institute of Planners 25 (2): 73–6. https://doi.org/10.1080/01944365908978307.
4 Levine, Jonathan, Joe Grengs, and Louis A. Merlin. (2019). From Mobility to Accessibility. Cornell University Press.
5 Pereira, Rafael H. M., Tim Schwanen, and David Banister. (2017). “Distributive Justice and Equity in Transportation. Transport Reviews 37 (2): 170–91. https:// doi.org/10.1080/01441647.2016.1257660.
6 Instituto de Pesquisa Econômica Aplicada (IPEA). (n.d.) “Access to Opportunities.” https://www.ipea.gov.br/ acessooportunidades/en/.
7 Glaeser, Edward L. and Joseph Gyourko. (2003). “The Impact of Building Restrictions on Housing Affordability.” Economic Policy Review 9 (2): 21–39.
8 Instituto Cidades Responsivas. (n.d.) “Responsive Cities Institute. Urban Indicators Observatory.” https:// observatorio.responsivecities.com/.
residential prices in the highest-accessibility central districts exceed those in peripheral areas by a factor of three to five.12 This price premium confirms that the market recognizes the value of proximity and connectivity—but it also means that, under current regulatory constraints on supply, the benefits of central accessibility are captured primarily by existing property owners, rather than made available to incoming residents. Restrictive zoning thus does not merely limit where people live; it functions as a mechanism that inflates asset values for incumbents while pricing out precisely the population segments for whom central-area employment accessibility would be most transformative.13
A promising direction for future research would be to investigate, with granular data, how the spatial patterns identified here relate to residential property values across income quantiles—and, more broadly, to extend the analysis to other Brazilian cities to assess the generalizability of the findings. Understanding how employment accessibility is capitalized into housing prices across different parts of the city could provide valuable evidence on the distributional implications of densification policies for housing affordability, helping to build the empirical foundation that urban policy reform in Brazil urgently requires.
9 Rocha, Rodrigo (2022). “A Ineficácia das Normas sobre Adensamento e suas Sobreposições Indesejáveis.” Caos Planejado. https://caosplanejado. com/a-ineficacia-das-normas-sobre-adensamento/. 10 Barboza, Matheus H. C., Mariana S. Carneiro, Claudio Falavigna, Gregório Luz, and Romulo Orrico. (2021). “Balancing Time: Using A New Accessibility Measure in Rio de Janeiro.” Journal of Transport Geography 90. https://doi.org/10.1016/j. jtrangeo.2020.102924.
11 Instituto de Pesquisa Econômica Aplicada (IPEA). (2023). “Nota Técnica: Tempo de Deslocamento Casa-Trabalho no Brasil Metropolitano. Texto para Discussão.”
12 Fundação Instituto de Pesquisas Econômicas (FIPE). (n.d.) “Índice FipeZAP de Preços de Imóveis Anunciados.” https://www.fipe.org.br/pt-br/indices/fipezap/.
13 Glaeser, Edward L., Joseph Gyourko, and Raven E. Saks. (2005). “Why Have Housing Prices Gone Up?” American Economic Review 95 (2): 329–33. http://dx. doi. org/10.1257/000282805774669961.
Data Study 2026 Global Activity Report: The Americas
For years, megacities in Asia have dominated the conversation on tall building activity and rapid intensification. From Jakarta, now declared the world’s most populous city, to China’s Tier 1 cities of Beijing, Shanghai, Guangzhou, and Shenzhen, the tall and urban landscape of the 21st century has been defined by Asian urbanization patterns applied at scale. But the Americas are catching up—and in some cities, overtaking.
In the background, across the Americas region, a resurgence in urban growth is happening. Legacy markets in the US and Canada are experiencing population inflows while sudden vertical expansion occurs simultaneously with densification across Latin America. Many of these cities are responding to similar problems—housing shortages, environmental concerns, and gridlocked traffic.
This data study—prepared by CVU’s Research and Thought Leadership team—examines recent developments in tall buildings and urban space across the Americas region. Access the interactive version of this study by scanning the QR code or visiting council. vu/global-activity-2026Q1
In this region, previous studies solely on tall building growth focus on familiar cities: New York City, Chicago, Los Angeles, Toronto, Miami, and others. These cities are still the locus of tall building activity in the Americas, but this view of the data sometimes obscures the rapid densification and vertical expansion of other regional cities, especially in Latin America.
Bogotá—the leading city in the Americas in CVU’s 2025 Vertical Urbanism Index report—has risen to become the region’s densest city and its seventh-largest by population, but it does not appear in any ranking of the tallest cities.
São Paulo—whose tallest building is just 171.7 meters—has been the largest city in the region by population for 20 years, and is
the 19th-densest as of 2025. Despite height restrictions limiting the extent of its vertical growth, the city has now skyrocketed to fourth place amongst the tallest cities in the Americas. The city also has its first building over 200 meters under construction, so we anticipate the densification and vertical intensification patterns to continue.
Recife—an emerging metropolis in the far eastern Brazilian state of Pernambuco—has grown faster than almost any other regional city across all of CVU’s urban metrics. In terms of population, the city ranks 19th in the region; by 100 m+ buildings, it ranks seventh; by density, it ranks eighth. Recife is the only city to appear in the Top 20 for all three of these metrics.
Opposite, top— Ranking of the top 20 urban areas in the Americas by population, 1975 to 2025.
Opposite, middle— Ranking of the top 20 urban areas in the Americas by number of 100 m+ buildings, 1975 to 2025.
Opposite, bottom— Ranking of the top 20 urban areas in the Americas by real density, 1975 to 2025.
By
Population
By
Tall Buildings
By Real Density
San
HOW CITIES BUILD UP: BUILDING STOCK VS. RESIDENTIAL VOLUME
For maximum comparability between cities, CVU has leveraged the Urban Centre Database (UCDB)1 to establish a common definition of urbanized area and to benchmark other metrics used in this study. These charts break down each city’s built environment by building height using data from the Global Human Settlement Layer (GHSL),2 a satellitederived dataset published by the European Commission. CVU adopts these definitions from the dataset:
Built-up Surface: footprint of the built environment within the urban extent (square kilometers)
Built-up Volume: total volume of the built environment extruded from the built-up surface (cubic kilometers)
Tall Buildings: nominal count of completed buildings over 100 meters
Population: estimates provided by census agencies and other authoritative sources, compiled in the UCDB
Real Density: ratio of population to built-up surface
Urbanized Area: contiguous urbanization extending from an anchor city (i.e., an agglomeration), using the Degrees of Urbanisation (DEGURBA) methodology3
Opposite top—
This chart shows the proportion of built volume vs. population in each building height category: low-rise (1–2 floors), mid-rise (3–7 floors), and high-rise (8+ floors). The comparison between the two columns reveals whether people actually live in the buildings that dominate each city’s skyline. A city might have a large share of its built volume in mid-rise structures, but concentrate its population in low-rise neighborhoods (or vice versa).
Below—
A side-by-side comparison of growth in built-up volume and real density reveals which cities are growing the most vertically and which are densifying the fastest. In cases like New York City, Miami, Toronto, and Houston, we observe both growth patterns happening in tandem. Some cities have experienced bidirectional change over time—densification increasing and decreasing as the city grows from informal settlements into modern housing solutions that consume more physical space.
As of mid-March 2026, 150 buildings over 100 meters have been completed across the Americas. This reflects a consistent growth rate since 2020, with the focus of new construction in the Americas being in the residential sector. While the majority of cities in the Americas are focusing tall building construction on new housing, a select few—Austin, Boston, and Monterrey—are still completing buildings
with a diverse mix of functions, including many all-office and office-inclusive mixeduse projects.
The charts in this section look at how tall building function has evolved in the Americas since 2020, and how growing construction timelines mean many projects are being delivered years after they were originally conceptualized.
Among cities in the Americas with at least 10 complete 100 m+ buildings, construction times are increasing. In 2000, each 100 meters of building height took approximately 17.8 months to complete. This figure has since ballooned by 59% to 28.3 months per 100 meters of height, an indicator of the time it takes to implement more advanced technologies and deal with evermore complicated urban sites. This timeline is geographically sensitive, as some cities deal with higher seismic risk, a high water table, or other challenges related to the construction process. Generally, US cities have had the fastest construction timelines.
Per CVU’s Tall Building Criteria, construction time starts when foundation works begin and ends when the building is topped out, fully clad, and partially occupiable.
1 Melchiorri, Michele, Ines Mari Rivero, Pietro Florio, et al. (2026).
“GHS-UCDB R2024A - GHS Urban Centre Database 2025.” European Commission. https://doi.org/10.2905/JRC.05RDPR0
2 Pesaresi, Martino, Marcello Schiavina, Panagiotis Politis, et al. (2024). “Advances on the Global Human Settlement Layer by Joint Assessment of Earth Observation and Population Survey Data.”
International Journal of Digital Earth 17 (1). https://doi.org/10.1080/175 38947.2024.2390454.
3 Melchiorri, Michele, Marcello Schiavina, Carneiro Freire, et al. (2021). Applying the Degree of Urbanisation method to National Population and Housing Census with GHSL Tools. Publications Office of the European Union. https://dx.doi.org/10.2760/939289.
Above—
This height distribution chart illustrates that while residential towers cluster tightly between 100 and 200 meters, office and mixed-use buildings show a wider spread, with a handful of outliers pushing past 400 meters. Hotels, by contrast, are few in number and tend to stay closer to a narrower 100-to-150-meter height range.
Below—
These pie charts, showing all cities in the Americas with ten or more 100 m+ completions since 2020, tell a consistent story in nearly every city. All-residential buildings account for the majority of the inventory, with mixed-use and office development playing a secondary role. Toronto and New York City lead the hemisphere in sheer count, but the pattern holds in mid-sized markets like Calgary, Goiânia, Fortaleza, and Recife, where residential towers dominate a smaller but still growing skyline.
Towering Terra-Cotta
The term “handmade” seems a strange descriptor for an urban skyscraper, but it applies to the Wrigley Building. The building was created like a giant handformed sculpture, writes Tim Samuelson.
Seen from the street or in the skyline, the gleaming white exterior of the Wrigley Building (Chicago, Graham, Anderson Probst & White, 1922) appears impressively monolithic (see Figure 1). But a closer look reveals that it is a complex assembly of terra-cotta pieces ranging from highly ornamental shapes to prosaic rectangular blocks. There are about 375,000 individual pieces in all.
No matter whether ornamentally sculpted or plain, each of these pieces required multiple manufacturing steps that involved a significant degree of hand labor. The labor ranged from sculpting finesse to brute strength for the strenuous work of pressing raw clay into elaborately shaped molds.
Terra-cotta is a material that goes far back into antiquity. The name is Latin for “cooked earth,” which essentially describes what terra-cotta is: pliable clay that is fired into solid form by the intense heat of a kiln. The outward-facing surfaces of the Wrigley Building’s terra-cotta were coated with a ceramic glaze that after firing formed a thin protective and washable surface, similar to that found on a dinner plate.
Also like a dinner plate, the Wrigley Building has required periodic handwashing throughout its existence. The sight of cleaning crews on hanging scaffolds held by ropes has been part of the building’s invaluable publicity mystique. Over time, the cleanings have become less frequent as air quality and pollution have improved, but public awareness of the building’s baths remains strong.
Just as a dinner plate can be glazed in almost any color imaginable, the Wrigley Building was finished in six shades of white. Although the shift is barely perceptible to the eye,
the building’s terra-cotta starts with the purest white on the lower floors, subtly transitioning into more yellowish tints with height. The overall effect has been described as looking as if the sun were always shining on the building.
Although the terra-cotta pieces appear strong and substantial, they have no role in structurally supporting the building. They are essentially a protective skin attached to a building’s supporting steel frame by way of concealed metal tiebacks and hangers. The pieces are hollow, making them light and therefore easy to handle, while at the same time creating a uniform
WILLIAM ZBAREN
Figure 1— Wrigley Building, Chicago (Chicago, Graham, Anderson Probst & White, 1922)
Of all the human hands and skills that went into the Wrigley Building’s terra-cotta, the work of the architectural sculptor Fritz Albert was the most important (see Figure 3). Born in Germany’s Alsace region in 1865, Albert began his career in Berlin before moving to Chicago in 1893 at the behest of the German government to work on the German pavilion at the World’s Columbian Exposition. He was a master in his field and a gifted artist in his own right, and his work quickly found favor in Chicago’s art circles.
One of Albert’s early attentiongetting projects was a sculptedfrom-life family of lions for the Lincoln Park Zoo. The warmth and realism of the grouping made it a popular favorite. Another muchpraised work was a sculpture representing electricity that included a classically inspired female figure hoisting an actual electrically-illuminated light fixture. Albert’s display of skill with these subtle, whimsical nuances later proved a great asset for interpreting drawings for the Wrigley Building.
clay thickness to ensure even firing in the kilns.
All of this was accomplished at the Northwestern Terra Cotta Company’s 18-acre (7.3-hectare) industrial complex located five miles northwest of downtown Chicago (see Figure 4). Northwestern was one of the largest and most technologically advanced terra-cotta plants in the country. But even in an era of mechanized mass production, manufacturing architectural terra-cotta remained dependent on hand labor by a team of pattern makers, mold makers, clay pressers, glaze appliers, kiln attendants, and others working in unison (see Figure 2).
In the late 1890s, Albert relocated to the American Terra Cotta and Ceramic Company in Crystal Lake, Illinois, where among other assignments he was given creative independence in originating designs for the company’s much-admired Teco pottery line. His designs for vases and other decorative items that incorporated fluidly abstracted forms of foliage and other botanically inspired themes reflected his lifelong passion for plants and gardening. The resulting pieces remain highly collectible.
Albert returned to Chicago in 1906 to become chief sculptor for the Northwestern Terra Cotta Company. At Northwestern, he supervised a large staff of modelers who worked side-by-side in a
Figure 2— Northwestern Terra Cotta Company advertisement, with pencil drawing of north tower of the Wrigley Building.
Figure 3— Fritz Albert, chief sculptor for Northwestern Terra Cotta Company.
commodious skylit studio equipped with giant wooden easels that could be raised or lowered as needed.
Albert was valued not only for his sculptural talents, but also for his broad experience with historical periods of architecture. His personal favorite was the ancient Egyptian period, which he studied to the point of teaching himself to read and write hieroglyphs. In 1922, Albert played an important role in the design and execution of architect George S. Kingsley’s Egyptian-inspired W. C. Reebie & Brothers storage warehouse in Chicago. The façade included historically correct hieroglyphs provided by Albert that attested to the safety of storing goods at the facility.
The Wrigley Building was one of Albert’s largest and most complex projects. All of the building’s ornamental details originated with architects Graham, Anderson, Probst & White under the direction of project lead Charles Gerhard Beersman. Beersman’s expansive knowledge of historical periods of design and ornamentation
Figure 4— Northwestern’s 18-acre (7.3-hectare) plant on the north side of Chicago.
Figure 5— Blueprint of the Wrigley Building’s terra-cotta clock faces, 1919.
resulted in a precisely-drawn composition (see Figure 4) that includes a profusion of human figures and faces and an endless variety of real and imagined creatures and botanical forms.
Using Beersman’s detailed drawings, Albert assigned different details to the modelers in the sculpture studio (see Figure 5). He most likely undertook the largest and most challenging pieces on his own, while at the same time actively inspecting and critiquing the work of his assistants as it progressed.
As Albert and his staff developed the ornamental details, they also had to take into consideration perspective angles and proportions to allow elements to flow harmoniously together for people looking up from the street, as well as nearby building tenants looking out their windows.
Once a pattern was completed, it was photographed by an in-
house photographer and sent to the architect’s office for approval. The architect marked up these photographs to indicate areas to be refined or corrected. The photographs were then sent back to the company for the requested changes.
The hundreds of patterns required for the Wrigley Building had to be executed with speed and efficiency to meet construction schedules. In addition to the Wrigley, Northwestern had numerous other major projects under construction.
Although Albert and Northwestern’s sculptors worked in anonymity, and no records exist to identify the creators of individual pieces, their talents were a major factor in making people stop and look when passing the Wrigley Building.
The work of the Wrigley Building’s terra-cotta artists and laborers was unsigned, but the
products of their hands and skills are likely experienced by more people in any single day than even the most famous artworks in the world’s museums.
The preceding essay was excerpted from The Wrigley Building: The Making of an Icon. Robert Sharoff, William Zbaren, Tim Samuelson and John Vinci, Rizzoli (New York) 2025.
Image credits— Unless otherwise indicated, all images are courtesy of The Wrigley Building and Chicago History Museum.
Figure 6— Northwestern sculptors at work in the early 1900s.
EXHIBITION Here to Stay: Architecture After Arrival, Chicago Architecture Center, 30 March–25 May 2026
Daniel Safarik
Chicago has long been a lodestar of northward migration for displaced people from around the world, and Latin America in particular. Like everything else in the current climate, the general notion of the city as a sanctuary has been rattled by the Federal government’s mass deportation campaign. It was therefore timely and welcome to see one of its prime cultural institutions, the Chicago Architecture Center (CAC), in partnership with the Princeton Urban Imagination Center, stage an exhibition, Here to Stay: Architecture After Arrival, devoted to innovation solutions for integrating diverse immigrant populations.
The partnership between PUIC and CAC yielded the inaugural Princeton | Chicago Architecture Center Fellowship, which supports new design projects by early-career architects. The fellows were asked to develop speculative interventions based on the theme “Re:Settlement,” with the objective of advancing the discussion beyond questions of immediate shelter and on to permanent, integrative development.
The three fellows were T.K. Justin Ng, founder of New York’s Spaced Agency; Yotam Oron, co-founder of CO53, a New York-based practice; and Leslie Ponce-Diaz, a recent MArch II graduate from Harvard Graduate School of Design. PUIC’s director Marshall Brown introduced the program by saying, “This fellowship began with a conviction that Chicago’s identity
as a sanctuary city is not just a policy position for us; it’s a design brief, and that brief deserves serious architectural response. This work is not abstract. We are living through a period in which the question of who belongs and who gets to stay is being asked with force and with hostility.”
Yotam Oron’s This is Not a Shelter proposed a departure from the typical top-down approach to public housing, instead offering a long-term ground lease for a site in Bridgeport, on which a co-op would build the base infrastructure, and residents would finish the partially constructed units upstairs as they became more integrated and financially stable. “Rather than delivering the finished solution,” Oron descried the model, “It establishes a condition for ongoing change, where arrival is not treated as temporary, but as the beginning of long process of staying, shaping and belonging.” The result was something not unlike Alejandro Aravena and ELEMENTAL’s
“half-a-house” models at Quinta Monroy, Chile; where the “house above the shop” entrepôt of previous generations of immigrants is modified to meet the typological and financial challenges of constructing affordable residential and mixed-use buildings today. Ponce-Diaz’s effervescent and engaging presence, enhanced by her traditional china poblana dress and the presence of her own immigrant parents from Mexico via Kansas in the audience, drew in the audience as she described her project, Mariposario de Esperanza. The concept literally builds upon a place of arrival, the woebegone Greyhound bus station southwest of the city’s Loop downtown. Ponce-Diaz imagined a timberframed, multi-story community center featuring a butterfly sanctuary, providing services for those fresh off the bus, so to speak, with echoes of Chicago’s historical Garfield and Lincoln Park conservatories. The model was accompanied by dozens of one-
DANIEL SAFARIK
Below— Here to Stay, at the Chicago Architecture Center.
page postcards sewn onto a hanging tapestry, sent from recent arrivals, expressing hopes for their future selves.
Ng, who had previously designed a multipurpose center in New York’s Chinatown, proposed River Commons, a long, multistory structure along the banks of Chicago’s North Shore Channel, a man-made waterway that is currently in the process of “rewilding.” His proposal, a series of two-story buildings along the river’s edge that would offer a more naturalized edge while filtering river water, offering a recreation and hydrological education center. A placard claims this would create spaces for “swimming and other forms of recreation that reconnect people to the river and to one another.”
Of the three, only Oron’s scheme displayed any acknowledgement of the realities of getting things built in the United States, particularly in a climate that seems allergic to building affordable housing. In addition to detailed architectural drawings, the exhibition displayed cost estimates, a sample resident’s contract, and a plausible financial model for cooperative living that would absorb migrants and facilitate progressively larger stakes in the development as their situations improved. In this proposal, the city would maintain ownership of the land through a long-term ground lease while a cooperative would finance, build and manage the building, operating outside the typical speculative framework that would normally see such a plot unbuilt or gentrified beyond the reach of this population.
That This is Not a Shelter is the humblest architectural proposal of the three, but the most wellconsidered as a practical solution, shouldn’t be seen as a necessary trade-off. But it does perhaps
Above— Here to Stay designers (from left to right, on stage) Justin T.K. Ng, Leslie Ponce-Diaz, and Yotam Oron. At podium: Eve Fineman, Senior Director, Exhibitions, Chicago Architecture Center.
reinforce the “it takes a village” adage—the professional training of architects rarely crosses into the financial realities of construction, zoning, or politics. It is only by actively cooperating with other formal and informal expertise that seemingly fanciful designs can come to fruition.
BOOK Lunch on a Beam, Christine Roussel, Brandeis University Press, 2026
Tom Leslie
Lunch on a Beam, or, more accurately, “Builders of the City Enjoy Luncheon,” is an iconic image: a group of construction workers sitting on a beam high above Manhattan, eating sandwiches with their legs casually dangling in mid-air, seemingly caught mid-bite and extraordinarily indifferent to the vast airspace between them and the ground.
As Christine Roussel’s beautifully produced and impeccably researched new book shows, the photograph invites deeper reading, not only for the moment it captures in the construction of New York’s Rockefeller Center, but also for the stories of the men themselves. Roussel, an accomplished art restorer and historian who has also written on the complex’s artwork, uses the photograph as a framework to tell the story of the Center’s design, construction and—critically—its publicity, led by the irrepressible Merle Crowell. His efforts to convince the public of the project’s scale, quality, and transformational potential led to the moment a photographer— maybe more than one—ventured to the rising steelwork to record the lunchtime break. Comparing alternative versions of the photograph, Roussel concludes that the image was staged, and that, contrary to myth, noted photographer Lewis Hine “did not photograph Rockefeller Center.”
Lunch on a Beam takes a long path to this moment, providing a more traditional historical narrative of Rockefeller’s conception, architects Hood & Howell’s design, and the construction itself in the book’s first half. This is well done, and Roussel’s research reveals much that has not been fully covered elsewhere. But the book’s greatest contribution lies in her analysis of the photograph and in her surprisingly successful efforts to name previously anonymous subjects. Actual construction workers are typically lost to history, but through archival research into union records, new oral histories, and Rockefeller Center records, Roussel has been able to suggest identities for all 11 workers— none entirely certain, but each one evocative. Alternative
DANIEL
identities suggested for each one allow her to broaden the narrative further, documenting how immigrant and indigenous communities (notably Nova Scotians and Mohawks) provided much of the labor that assembled Rockefeller Center’s steel, and much of the rest of Manhattan.
The human stories behind this and other high-rises of the era that Roussel uncovers are compelling— and often shocking. Interviews from Works Progress Administration oral history projects document the perilous conditions endemic to pre-war construction sites, with deaths and injuries a daily commonplace, and little job security for those who made it home at the end of the day. Roussel also points out that, despite the diverse backgrounds represented by the 11 men, none of them—and, indeed, due to discriminatory union membership and the tacit agreement of contractors and clients alike, none of the workers on Rockefeller Center’s construction—were Black.
Roussel’s book is a valuable addition to the literature on pre-war high-rise construction and an important argument for a
broader understanding of skyscrapers’ histories. We are good at remembering these buildings’ designers, builders, and owners, but rarely do we get a glimpse of the lives and human stories that lived, worked, and occasionally died on these job sites. Lunch on a Beam sets a high bar for future histories, showing how even a single image can tell—literally— thousands of stories.
BOOK Migrant Midwest, Jonathan Mann Burkham, Bloomsbury Academic, 2026
Jesse M. Keenan
With the 250th anniversary of the United States happening in 2026, Migrant Midwest: The Case for Immigration and Economic Growth in the American Heartland by Jonathan Mann Burkham is— perhaps accidently—one of the most prescient books on the future of the country. Immigration, birth rates, ethnonationalism, labor market displacement, and population collapse—these are not extremists’ talking points. These are the empirical frames of a
bold book that argues that immigration is critical for the future of not only the Midwest but also the rest of the country. Meticulously researched and largely written prior to the current administration, this book has circumstantially found itself at the center of a conversation about what comes next for America.
Migrant Midwest is a history of immigration policies, cultural experiences, and economic contributions, and a carefully crafted outline for a renewed commitment to comprehensive immigration policy reform. There is no need to over-intellectualize today’s challenge. The Midwest is facing a “demographic winter” largely shaped by an aging population and a sharp drop-off in international immigration. As the book argues, immigration was central to the economic history of the Midwest, and it is still key to the country’s future economic prosperity. Countries from across the world wished that they could attract the types of educated and skilled immigrants that the United States attracts.
The book moves well beyond the policy implications to explore the trade-offs of competing immigration trajectories. It acknowledges the civic downsides to increased immigration in the context of greater economic inequality and spatial segregation, including declining measures of social trust. Indeed, population decline might not be a bad thing. Burkham notes that the economy of the Midwest may very well continue to grow. But everyone from high school students to seniors will need to enter and stay in the workforce for longer periods of time to make up for the shortfalls. There are also a variety of social and environmental benefits to population decline, including reduced environmental footprint. However, the ultimate conclusion of the book is that future economic prosperity is centered on growth and not degrowth. The book constructs a
Above— From left to right, Joseph Eckner, William Birgir, Joe Curtis and John Portla “nap” on a beam.
model for policies that are centered on place-based “residential integration,” where the selective matching of immigrant skills and localized labor demand maximizes the capacity of immigrants to drive the revival of long-abandoned communities. The book envisions not only a kind of urban renaissance within the Midwest, but it also argues for the repopulation of “low-cost” rural and exurban communities that are the fertile landscape for cheap housing, entrepreneurial opportunity, and more affordable places to raise children.
The future of American urbanism might very well be built on the foundations of Rust Belt cities and the long-overlooked communities of the heartland. Existing challenges associated with housing accessibility and the ongoing contraction of commercial real estate must be positioned within long-term manifestations of global change, including a rapidly changing population. Housing cost burdens shape reproduction decisions. On the supply side of the equation, housing production is deeply connected to labor shortages for everyone from skilled and semi-skilled workers to an aging cohort of building inspectors. Advances made to programmatically diversify the housing stock, promote sustainable urbanization, and manage utility cost burdens all have long-term implications for population growth. The housing affordability crisis is not just about the quality of life—it is also about the quantity of life.
EXHIBITION Latinitudes: A Collection of Latin American Modern Architecture, Graham Foundation, Chicago, 2 April–18 July 2026
Daniel Safarik
Lines of latitude and longitude are limned throughout Leonardo Finotti and Michelle Jean de Castro’s exhibition Latinitudes: A Collection of Latin American Modern Architecture, running at the Graham Foundation, Chicago, 2 April–18 July 2026. The photographer Finotti has arranged silver prints on aluminum composite panels, each framed in imbuia (Brazilian walnut), and arranged to a datum line made of Peruvian wool thread, which runs continuously across the galleries of the Madlener House, including across door frames and around corners. The juxtaposition—one might say imposition—of monochrome photos of Latin American modernist works, against the milky plaster and bleached mahogany wainscoting of a 1902-built home of a GermanAmerican brewery owner in a fusion of German Neoclassical and Prairie School styles, is commentary enough on the hegemonic balance of the two continents of the Americas.
The commentary is enhanced by the prominence of the quote from Joaquin Torres-García, “our south is the north,” an assertion that the architecture of Latin America, and by extension the millions of people who occupy that architecture, is due equal weighting
Below— Latinitudes crosses boundaries, and sometimes doorways.
to that of its northern counterparts. Finotti arranges his photos in order of southernmost latitude to northernmost, proceeding from Buenos Aires to Havana. As one might expect, Milton Barragán, Lina bo Bardi, Paulo Mendes da Rocha, Oscar Niemeyer, and Roberto Burle Marx make numerous appearances, but most images are of work with which many in the “Global North” architecture community might not be familiar. Many of these are notable high-rises, such as Bolsa de Comercio, Buenos Aires (1977, Mario Robero Álvarez y Associados); Conjuto Bavaria, Bogota (1965, ObregÓn & Valenzuela and Pizano Pradilla & Caro) and Banco de Guatemala, Guatemala City (1964, Jorge Montes, Raúl Minondo, and Carlos Haeussler).
Despite the literal presence of a connecting thread, there is not a discernible allegorical agenda to the selection of the projects themselves, other than that they are generally from the second half of the 20th century. Sometimes they are moody “hero shots” where the protagonist is shown in brooding isolation against a silver-grey sky; other times urban life is slipping through the cracks and breaking the plane of whatever the modernist’s original intent might have been—orderly and expressive singular projects are sometimes upstaged, and consumed by the surrounding barrios and favelas.
At the opening of the exhibition, Finotti’s preoccupation with lines, typography, and the physicality of publications was on full display, as he feverishly tore through two decades’ worth of prior exhibitions onscreen, while simultaneously literally tearing apart a string-bound exhibition catalogue, handing it off in pieces to audience members. The rough textures and exposed ductwork of Brutalist and modernist buildings in South America have previously served as backdrops to Finotti’s photographs of the same, presenting different challenges
DANIEL
than seen in the Madlener House. Some exhibitions resulted in the remodeling of administrative space within the museums and galleries themselves, to better display the work and make its connection with the architecture of the space more visceral.
For a practitioner of a twodimensional medium, Finotti goes the extra mile to bring dimensionality to his work—be it the addition of context, depth of field, or the tactile quality of type and image on paper— opening up new dimensions of understanding for the viewer wherever lines intersect.
BOOK Transportation and the Shape of Cities, Christof Spieler, David CopelandLaredo, and Mandi Chapa, Island Press, 2026
Tom Vanderbilt
Not long ago, I found myself aboard the First Lady, the boat that takes tourists on a 90-minute architectural tour, courtesy of the Chicago Architecture Center, down that city’s eponymous river. It is one of those rare tourist experiences that is at once quite popular and deeply revelatory. At one point, as we sailed past banks brimming with billiondollar casino projects and 19thcentury storehouses converted into the offices of digital startups, the volunteer guide—a Jeanne Gang fan with a deep knowledge of the city skyline—asked: “What shapes a city?” Some answers— zoning, capital, people—were bandied about.
But there was one answer that went curiously unsaid: Transportation. Chicago, after all, only exists at the scale it does because the river we were on was part of a vital water network that ultimately joined Lake Michigan to the Mississippi River; and, relatedly, the fact that it became a central rail hub. The commercial might enabled by those two vital ways of moving goods built the city, which otherwise might
Top—
A wellintegrated transportation scenario.
simply have been a pleasant lakeshore town. But the idea of transportation, in the cities and places we live, is often considered as a sort of dreary afterthought in the “built environment,” almost occluded from our consciousness, like the Chicago rail tracks that now lie hidden beneath riverside skyscrapers. Transportation, note the authors of Transportation and the Shape of Cities—a trio of scholars and planners—often tends to fall between two stools, academically and in the professions, and they view their project as an attempt to bridge this gap. “In an engineering school, this book represents a radically different approach than the highway-centric information common in introductory transportation classes,” they write. “In an architecture school, it is a class that is missing from many curricula.”
One of their central themes is how much raw space is consumed by transportation (and often wasted, like in the winter photos that reveal car tracks in snow taking up only a portion of the available street). The book, they note, “makes the case that the most significant limitation on transportation in cities is space, and that each mode of urban transportation—pedestrians, bicycles and other micromobility
devices, cars, trains, and transit— has inherent geometric properties that no amount of policy or design can change.”
Using handy, dimensionally scaled illustrations, and concise, “just the facts, ma’am” text that is not far in tone from a planning codebook like the Manual on Uniform Traffic Control Devices (MUTCD)—that bible known to practitioners as the “mut-sid” hey lay out these spatial implications: How many urban blocks it takes to build a belowgrade rail crossing, or the turning radii required by trucks, or how much sidewalk space people need to walk comfortably. It is replete with the sort of information you might relay to your partner in bed (if they happen to be a transport wonk). I, for one, did not know about the complex taxonomy of parking garage layouts (e.g., “doublehelix” and “split ramp”); or that a four-way, two-lane intersection has 48 possible conflict points; or that the state ranked second to New York in terms of people walking to work is Alaska? (think fishermen trudging to boats in their small villages).
The fundamental spatial nature and implications of transportation is often surprisingly underrecognized. All the talk of new transportation forms like vertical take-off and landing vehicles (VTOLS) or delivery drones salivates over the instrumentality of the technology without considering how these devices would actually fit in crowded urban space (air and ground); indeed, simply trying to squeeze an old technology like the bike into old cities is hard enough, spatially and socially. Finding a place for new transportation is much harder than inventing technology, and history is littered with ways it went wrong. “The airship mooring mast on the Empire State Building seemed ahead of its time in 1931,” note the authors, “but nobody has ever arrived in Manhattan by airship.”
Jonathan Mann Burkham
In the final chapter of North, Jesse Keenan, Professor and Director of the Center on Climate Change and Urbanism at Tulane University, imagines America in 2079 as a totalitarian state of Climate Credit Scores, exclusive new urbanist enclaves in the north, nativist resentment towards climate migrants, and disaster, division, and exodus from the once desirable Sun Belt. There are climate scolds everywhere. It’s a scary bit of fiction, a warning for what could lie ahead if we don’t start planning and adapting for the future.
The rest of the book is not fiction, nor is it alarmist; it’s a thoroughly researched, scholarly exploration of the exceedingly complex geography of risk and opportunity in the United States. This uneven geography is likely to yield millions of climate migrants—“climigrants”—in the decades ahead, and these migrants will increasingly head inland and north, pushed out by sea level rise, inundation, tropical cyclones, extreme heat, droughts, and wildfires.
Climate migration in the United States has already begun, as is well-documented in journalistic accounts such as Jake Bittle’s The Great Displacement and Abrahm Lustgarten’s On the Move. Keenan, who gained notoriety for his work in Duluth, Minnesota, where he partnered with the local university to study how the city can plan and promote its future as a climate destination, brings an authoritative voice to the phenomenon. The slogan “Climate-Proof Duluth” may be catchy—there has since been a spike in migration to the onceindustrial city on the shores of Lake Superior—but Keenan is at pains to point out in North that there are no real climate havens, and there are always complex tradeoffs when it comes to climate migration.
North goes well beyond accounts of forced displacement from natural disasters, to focus instead on the market signals that are beginning to reflect the geography of climate risk. Coastal property values are coming down in areas affected by sea level rise, commercial and residential mortgage rates are up in some high-risk zones, and municipal bond markets are driving up the cost of borrowing for public works in risky locales. Insurance companies are on the front lines of pricing risk, battling states for the right to use state-of-the-art risk assessment maps. While state officials try to mute these market signals, especially through statesubsidized property insurance schemes, the signals are starting to break through. Domestic migration to Florida has plummeted from its pandemicera peak.
While a more risk-sensitive economic landscape is likely to favor non-coastal northern locales, spurring climate migration, Keenan does not overlook the differential impacts this can have within both migrant sending and receiving zones. For example, when banks and insurance companies raise costs in environmentally hazardous but still desirable areas, they can drive out lower-income residents. Conversely, when banks circumscribe areas as too risky— “bluelining”—disinvestment can trap poorer residents while “electively mobile” residents flee to more favorable locales, much like redlining worked in many inner cities. Similarly, migrant receiving zones can experience rising property values and costs that price out low-income residents in a kind of climate gentrification. According to Keenan, these differential outcomes are just another reason why cities and states need to engage in inclusive planning for a changing climate.
For those who want to know more about the state of climate adaptation science, policy, and
planning, Keenan has you covered. From the US perspective, the upshot is that the federal government has pretty much failed to put together a comprehensive, whole-ofgovernment National Adaptation Plan. With Donald Trump at the helm, and climate change a “hoax” again, you can forget about it for now. While limited in capacity and resources, states and municipalities will be left to craft adaptation plans and, most importantly, communicate risk to constituents. Ever ready to throw shade at state officials in the Sun Belt, Keenan notes that planning for climate change is especially difficult in places where even acknowledging the consequences of climate change is taboo or outright banned by state statute, as in Florida.
There is much else to be found in this densely packed book. Keenan reviews the literature on climate migration models while acknowledging the extreme difficulty of predicting the timing, pattern, and size of future migration. Migration is always a complex socio-economic process where decisions are made at a variety of scales, from the individual to the family to the community. Still, he points to signs that the Era of the Sunbelt may be coming to a close. He follows this with an exhaustive accounting of how climate change is wreaking havoc on the built environment, forcing residents and public officials alike to make difficult decisions about adaptation. Do they hunker down and focus on resilience, or adapt in other ways, including through abandonment?
In the end, North is a call for informed adaptation and planning, lest we end up in Keenan’s fictional 2079 America. This process must prioritize a “strong sustainability,” from building design to site location to the differential impacts on residents, both established and newcomers. For all its scholarly heft, against a backdrop of impending destruction, Keenan’s vision is a hopeful one.
BOOK North, Jesse M. Keenan, Oxford University Press, 2025
Austin, United States Larry Speck
When I look at Austin today, I’m struck by how deliberately we chose not to become a typical Texas or Sunbelt city. That wasn’t inevitable. It was a decision— made decades ago—to build an alternative urban future rooted in ecology, culture, and design. And the Austin we see now is the cumulative result of that long, stubborn commitment.
Austin began in 1839 as a river city, oriented toward the Colorado and shaped by the gentle rise up to the Capitol. Nature was the generator of the city’s form. But by the late 19th century, Central Texas had been overgrazed into ecological collapse. Downtown’s lower reaches flooded constantly; everything below Fifth Street was essentially unusable. The riverbanks were industrial backyards—sewage plant, pole yard, public works depot—hardly the makings of a civic heart.
The turning point came with the Longhorn Dam in the 1960s, which stabilized the river through downtown. It took nearly twenty years to rebuild the banks, replant tens of thousands of trees, and undo the ecological damage. But by the early 1980s, Austin was ready to imagine something radically new: a city that would turn back toward the river instead of away from it.
The 1984 Town Lake Comprehensive Plan reenvisioned a 7-mile (11-kilometer) stretch of the river as a continuous public realm—urban parks, trails, and a cultural spine. The idea was transformative: the river would become Austin’s living room.
The boldest move, though, was the proposal for a residential mixed-use downtown. In the early 1980s, the notion of people living downtown—walking to work, walking to the river, walking to dinner—was almost unthinkable in Texas. Yet the city owned six blocks near the river and used them to test a new model: the Second Street District—mixed-use, walkable, dense, and human scaled. When the first residential mixed-use building was completed the mayor at the time moved in and noted that only 400 people lived downtown—100 of them in the county jail. Today there are 15,000.
That shift happened because Austin chose an alternative to sprawl, car dependency, and wasteful land and energy use. We had the political will to make it real.
Four principles guided the transformation: Nature. The lush riverbanks, shaded trails, wildlife, and swimming holes were constructed. Trees were planted, wetlands
Incorporated: 1839
Area: 846 km2
Population: 1,002,632
Urban density: 1,185/km2
restored, and the river became habitat again. Buildings merged with this environment, making vertical living feel like living in a nature preserve.
Activity. Austin thrives on public life—festivals, marathons, music events, football weekends. The built environment had to support that energy.
Community. Downtown is a tapestry of communities: state government, the University of Texas, a longstanding Latine population, and growing South and East Asian communities. Food, music, and the arts connect them.
Architecture. Ambitious design reinterprets density, livability, and nature. Towers give back green space, weave historic fabric into new construction, and create vertical neighborhoods.
This morning I walked from my home at 44 East Avenue, across Rainey Street, beside the Waterline site and along the river to the Central Library. Everything is close, connected, and walkable— exactly what we intended. Austin didn’t stop sprawl. But we built something better alongside it. And that has made all the difference.
Above— Austin, seen here from Lady Bird Lake, has seen tremendous growth in the past two decades.
Join us in London!
Density and Identity: Shaping
Skylines, Elevating Culture
Early rate ends 18 June, register now!
Interested in becoming a sponsor? Explore a wide range of sponsorship opportunities here.
is extremely grateful for the generous support of its membership
PLATINUM
AECOM
AGC Glass Europe
Arup
AtkinsRealis
Buro Happold
DeSimone Consulting Engineering
Dow
Illinois Institute of Technology
IUAV University of Venice
Jeddah Economic Company
Kohn Pedersen Fox Associates
KONE Corporation
Langan
Moshe Zur Architects and Town Planners
Multiplex Construction Europe Ltd.
Otis Elevator Company
RFR Asia Limited
RWDI
Schindler
Shanghai SIIC North Bund New Landmark
Construction and Development Co., Ltd.
Shanghai Tower
Construction & Development
Shenzhen Parkland Real Estate Development Co., Ltd.
Siderise
Skidmore, Owings & Merrill
Sun Hung Kai Properties Limited
Taipei Financial Center
Corporation
Thornton Tomasetti, Inc.
TK Elevator GmbH
Tongji University
Toronto Metropolitan University
Turner Construction Company
WSP
GOLD + Dar
KLCC (Holdings) Sdn.
Bhd.
GOLD
Adrian Smith + Gordon
Gill Architecture
Aedas
Aptus
Aqualand
Arcadis
Beca
Brandston Partnership, Inc.
chapmanbdsp
Charles Russell
Speechlys
Corgan
DCI Engineers
East China Architectural Design & Research Institute (ECADI)
Emaar Properties, PJSC
Focchi
Frasers Property
Fujitec
FXCollaborative
Architects
gad GCL Builds
Gensler
Goettsch Partners
HKS
Hongkong Land
IMEG Corp
KEO International Consultants
Magnusson Klemencic Associates
Maze Fire Consulting
McNamara • Salvia
Motioneering, Inc.
Mott MacDonald
Nucor Corporation
PDW Architects
Permasteelisa Group
PNB Merdeka Ventures
Sdn. Berhad (PMVSB)
Populous
Ramboll
Rise Global LLC
Severud Associates
Consulting Engineers, PC
Suffolk
Windtech Consultants
Zaha Hadid Architects
There are an additional 377 members of the Council at the Silver and Non-Profit/Governmental levels. Please see online for the full member list: members.CVU.org.