



Educational Opportunity in Massachusetts is a research-practice partnership between researchers at the Annenberg Institute at Brown and the Massachusetts Departments of Elementary and Secondary Education (DESE) and Higher Education (DHE). The partnership was formed in 2019 as a result of the state’s appetite for actionable research and data-informed policy.
We study student pathways from the K-12 system into the state’s higher education system and into the labor force. We are interested in the impacts of schools and educational policies on this progress, particularly related to students from historically marginalized backgrounds. Our work has been used to inform decision-making and debate in key policy areas, including the Massachusetts Comprehensive Assessment System (MCAS) testing as a graduation requirement, high-school course-taking and the MassCore course of study, community college transfer pathways, and understudied populations such as students classified as English learners, including newcomers.
This report was developed as part of a research-practice partnership with the Massachusetts Department of Elementary and Secondary Education. The authors thank our partners, including but not limited to Matt Deninger, Allison Balter, Nyal Fuentes, Kinnon Foley, Kate Sandel, Kendra Winner, and Victoria Puglia. We also thank Commissioner Pedro Martinez for his input and support.
We are very grateful to administrators, educators, and student support professionals in the following districts who generously shared their experiences and perspectives on high-school newcomers with us: Chelsea, Framingham, Lynn, Waltham, Woburn, and Boston. We are also indebted to many colleagues who read and commented on drafts of this report: Jill Norton, Gabrielle Oliveira, Carola Suarez-Orozco, Paola Uccelli, and Javier Vazquez. Their insights helped strengthen the report tremendously; any remaining errors and omissions are our own.

We are particularly grateful for other members of our team, James LoPresti, Aubrey McDonough, and Emma Zorfass, whose work as part of our broader efforts made this report possible and whose comments on the report helped improve it. At Brown University, we thank Macy Brammer, Yilu Bian, Mallory Bedford, Jessica Saenz Gomez, and Annenberg Institute seminar participants for their many contributions to this work.
The research reported here was supported by the Institute of Education Sciences, U.S. Department of Education, through Grant R305H190035 to Brown University. The opinions expressed are those of the authors and do not represent views of the Institute or the U.S. Department of Education.
The Annenberg Institute strives to equalize and improve educational opportunities. By bringing together diverse thinkers to tackle difficult problems, the Institute advances the broader field: harnessing the power of Brown’s community to develop education leaders, building actionable knowledge through systematic research, and partnering with educators and policy-makers for local impact.
Mantil, A., Papay, J.P., Ferguson, I.M., Quintero, D. & Murnane, R.J. (2026). Land of Opportunity? Immigrant Newcomers in Massachusetts High Schools. Educational Opportunity in MA, Annenberg Institute at Brown University.

While high-school immigrant newcomers remain concentrated in urban areas, about half of Massachusetts districts enroll more than five of these students.
FIGURE 1
Number of High-School Immigrant Newcomers in Massachusetts
Secondary-School Districts, 2023-24 School Year
NOTES Many municipal elementary school districts in Massachusetts are part of regional secondary districts or pay tuition to send their students to other districts for high school. The boundaries shown here are for high school and are based on data from https://www.mass.gov/info-details/massgis-data-public-school-districts Richmond and Acushnet send to multiple districts for high school.
In our 2023 report, Rising Numbers, Unmet Needs, we described the rapid growth in the number of immigrant newcomers to Massachusetts high schools and the heterogeneity within this population, both in terms of demographic characteristics like home language and country of origin and in their educational outcomes.
Since then, sweeping changes continue to affect these newcomers — here defined as English learners (ELs) in their first 12 months of schooling in the United States — and the districts that serve them. Newcomers remain largely concentrated in urban areas like Boston, Lynn, and Lawrence (Figure 1). However, a growing number of Massachusetts districts serve more than five high-school newcomers; 102 did so by the spring of 2024. Starting in 2025, travel bans, increased entry restrictions, and other measures designed to curtail immigration again shifted the landscape; 1,000 fewer newcomers arriving in Massachusetts public high schools that year, a decrease driven entirely by a decline in students arriving in the spring.
High-school newcomers differ from other vulnerable student groups in key respects. More than half are not present when the school year begins. Some arrive without their parents, scarred by exposure to trauma and violence and perilous journeys to the U.S. Half are 16 years or older when they first set foot in a Massachusetts high school; for many, financial insecurity and debt result in work obligations that make school attendance and engagement even more challenging.
In this report, we focus on districts and how they serve this group of students. Across the state, districts are struggling to accomplish the dual goals of helping newcomers make progress towards English language proficiency and master the academic content in the state’s curriculum frameworks. Particularly for those newcomers who arrive in high school with very limited English language skills and/or gaps in their prior learning, the path to high-school graduation is extremely demanding, and many do not complete it. Furthermore, uncertainty about their futures in the U.S. may lower newcomers’ academic expectations and aspirations.

If you ask them to explain their journey of how they got here, you would be mesmerized, if you knew what it took for them to be sitting in this chair right now. I think just remembering all the things they can do and all the things they had [to do] to be where they are right now — you know, no 14-, 15-,
16-year-old should have to experience or go through what a lot of them have had to go through to be here.
CHLOE ARDON Former ESL Teacher, Woburn High School

Until very recently, many Massachusetts districts have experienced large growth in their newcomer populations and rapid changes in newcomers’ backgrounds and needs.
Most urban areas (and many suburbs and towns) saw big increases in the number of new arrivals after the pandemic. Moreover, the home languages and countries of origin of newcomers continue to shift rapidly from one year to the next. Critically, on average, newcomers’ level of English proficiency upon arrival in the U.S. has fallen since before the pandemic. The number of newcomers was substantially lower in the 2024-25 school year, a result stemming from the federal government’s changes in immigration policies and enforcement.
Half of high-school newcomers are 16 years or older when they arrive, and districts vary widely in how they serve these older newcomers.
Massachusetts high schools have substantially different practices to determine the grade in which newcomers should start. For example, even after adjusting for demographic differences, older newcomers in Springfield are a startling 38 percentage points more likely to be placed in 9th grade when they arrive than are similar newcomers in Boston. Some districts have developed specialized programming to accommodate the work obligations and family responsibilities of older newcomers, including year-round schedules, flexible attendance policies, and credits awarded for students’ onthe-job knowledge and skills.
District differences in policies and practices for newcomers reflect the state’s long tradition of local control and differences in newcomer populations — but also the degree to which educators are adapting programs and structures in response to newcomers’ needs.
Once high-school newcomers enroll in a Massachusetts school district, staff make a series of decisions about how to educate them. For example, transitional bilingual education programs in Framingham and Brockton ground content instruction for ELs in their home languages, with the goal of effectively transitioning to English over time. In many high schools, newcomers are enrolled primarily in core courses with fellow ELs, while in others, their peer group is more heterogeneous. Districts differ in their capacity and commitment to innovate in meeting the unique needs of their newcomer students.
Allowing newcomers to access rigorous courses and specialized programs, such as Career and Technical Education (CTE), is necessary but not sufficient for equity.
Newcomers appear to have less access than their peers to the rigorous coursework in the state’s recommended MassCore program of study. Similarly, in nearly all districts, newcomers’ rate of participation in CTE programs lags well behind that of other students. While access to these opportunities is critical, an equally important question is how to enable newcomers to be successful in these courses and programs, given their emerging English proficiency and the lack of experience many content-area teachers and CTE instructors have with this population.
Across districts, newcomers’ graduation rates remain low, and many who do graduate have not attained English language proficiency.
Only 15% of newcomers in the cohort expected to graduate in 2024 reached English proficiency by the time they left high school. Indeed, among newcomers who arrived with low English skills, just 6% of graduates were proficient by the time they received their diplomas. Interestingly, we find that districts where newcomers are making the most progress in English language acquisition are generally not those where high-school graduation rates are above the state average for observationally similar newcomers, with Boston as an important exception.

Immigrant youth contribute important linguistic and multicultural diversity to Massachusetts public schools. Many have risked and suffered a great deal to access educational opportunities in the U.S. Their arrival in the Commonwealth offers great potential for enriching the education of their peers and for building a strong labor force for the decades ahead. However, whether these potential benefits are realized will depend to a large extent on the success of the state’s public schools in welcoming and educating these newcomers well.
Massachusetts high schools face the challenge of helping newcomers build both English language proficiency and content-area academic skills. Many newcomers attend school with the primary goal of learning English, which is important for their future economic success. However, English proficiency is not enough — if newcomers do not build strong skills in core academic content areas, opportunities in post-secondary education and the labor market are foreclosed. We find that very few districts are currently succeeding at both of these objectives. While we lack the evidence necessary to make specific practice-based recommendations, a commitment to academic rigor married with instructional and socio-emotional supports seems critical to serve newcomers in the state’s high schools effectively.
A second and related challenge is how best to support newcomers’ educational attainments. Many employers and colleges require applicants to have a high-school diploma. Current debates over new graduation requirements center on the argument that all students deserve a rigorous education. However, the state’s graduation requirements have been a disproportionate barrier in the past for newcomers, and the equity implications of any new policy warrant concerted attention.

Recently arrived immigrant students, commonly referred to as newcomers, comprise an important and ever-evolving group of students in Massachusetts’ public high schools. Our November 2023 report, Rising Numbers, Unmet Needs, established that between 2008 and 2022, more than 50,000 newcomers from all parts of the world enrolled in the state’s public high schools. Since then, tremendous changes have swept the state and the nation.
First, following the COVID-19 pandemic, the state experienced a large increase in the number of high-school newcomers. Beginning in the spring of 2025, however, this pattern changed. Under the Trump administration, new entry restrictions to the United States and a surge in immigration enforcement activity have substantially reduced the number of newcomers enrolling in public schools and added to the challenges they face when they arrive. Data on these most recent trends are still being collected. However, research from other states suggests that this type of heightened enforcement is associated with lower outcomes for English Learners (ELs) and immigrants attending public schools.1
Next, there have been rapid changes in the countries of origin and academic needs of newcomers to Massachusetts schools. These changes pose challenges for districts constantly struggling to adapt their instructional programming, hire qualified staff, and support newcomers’ learning and socioemotional needs.
Finally, the state policy context has shifted in dramatic ways. The requirements that all students, including newcomers, must meet in order to earn a high-school diploma in Massachusetts were upended in a November 2024 ballot referendum. The state’s voters ended the long-standing requirement to achieve a minimum score on the three Massachusetts highschool standardized tests (see sidebar), which functioned both as a disproportionate barrier for newcomers and an indicator that public education was not serving them effectively. The state is currently debating a new slate of potential requirements, including end-of course tests, mandatory course-taking, and portfolio/capstone projects, which are likely to impact newcomers in important ways.
These massive changes are affecting a group of students that was already uniquely vulnerable and facing quite different circumstances from most of their high-school peers. Newcomers arrive at different points throughout the school year, bringing with them varied prior educational experiences and different levels of English language proficiency. Many enter high schools at older ages and must support themselves and their families financially. An additional challenge is the trauma histories of many newcomers — violence, gang involvement, and sexual assault experienced in their native countries and/or during an arduous overland journey to the U.S. border that many undertake without a parent. Once they reach Massachusetts, some newcomers experience the insecurity of living with distant relatives whom they have never previously met.
Many newcomers have little time to meet local and state graduation requirements to earn a diploma. They face substantial hurdles in accomplishing the dual goals of acquiring English proficiency and mastering high-school academic content. Particularly for those who begin from a baseline of very little English and/or gaps in their prior learning (often due to interrupted or limited formal education), the path to high-school graduation is demanding, and many do not complete it. Furthermore, uncertainty about their futures may lower their academic expectations and aspirations.
In this report, we present a more nuanced exploration of newcomer demographics, policies and practices, and outcomes, with a particular focus at the district level. Serving newcomers involves a complex set of actions and decisions, including registering students and assessing their linguistic and academic skills, obtaining prior transcripts and awarding appropriate credits, placing students in classes, recruiting and training staff, and communicating with families. Each district approaches the task of educating newcomers with a different combination of inputs, some within their control (e.g., which instructional model to use, which grade to place entering newcomers in) and others outside it (e.g., how many newcomers they enroll, what needs newcomers have upon arrival). Understanding district differences in newcomers’ characteristics and outcomes can inform planning efforts, resource allocation, and the development of instructional capacity.
Our prior report reviewed the history of Massachusetts policies on the language of instruction and statewide graduation requirements, both of which are salient to the education of high-school newcomers. Since that report was published, the use of minimum score thresholds on the Massachusetts Comprehensive Assessment System (MCAS) standardized tests as a graduation requirement was discontinued via a statewide ballot initiative in November 2024. For the graduating classes of 2025 to 2027, students who had not already achieved those minimum scores must demonstrate academic mastery via the satisfactory completion of certain coursework, as verified by their districts. Our prior work has demonstrated both that the previous MCAS requirement was a disproportionate barrier to graduation for high-school newcomers, and that MCAS performance is predictive of students’ longer-term outcomes. It follows that this change is an extremely consequential one.
Another development since our last report concerned a consequence of the state’s emergency assistance law. This legislation (G. L. c. 23B § 30), passed in 1983 and the only one of its kind in the country, granted a right to shelter for eligible pregnant people and families with dependent children. As the number of housing-insecure individuals swelled due to an increase in immigration beginning in the summer of 2023, existing shelters overflowed, and many families were temporarily placed in one of 100 hotels spread throughout the state.2 This meant that many school districts in areas with little prior history of immigration were suddenly enrolling newcomers. Subsequently, caps were placed on the length of stay and total number of families in the system, and eligibility criteria were tightened. By April 2025, numbers in the emergency assistance system had fallen back to spring 2023 levels, though many families remained in the communities in which they were originally placed.

One central theme is that the characteristics of newcomers remain quite dynamic, changing rapidly over time and within districts. In the first section, we present updated statewide results for newcomers using additional cohorts of students, up through entrants during the 2023-24 school year. In a few instances, we report on the 2024-25 school year as well; however, the dramatic changes that began in early 2025 with the Trump administration’s immigration policies constitute a sharp break from what had gone before.3 In a follow-up policy brief, we will explore enrollment, exit rates, and attendance for newcomers after the surge in immigration enforcement began in early 2025.
They work so hard, and we can’t even begin to understand the challenges that they face…I would say our kids are resilient. They’re hopeful, they’re hardworking, and many are essential workers. During the pandemic, I saw that more than ever.
DR. ALMUDENA G. ABEYTA Superintendent,
Chelsea Public Schools
In the two and a half years since our initial report, important shifts have occurred. We find steep decreases in the number of newcomers arriving from Brazil and from the Northern Triangle region of Central America (Honduras, Guatemala and El Salvador) and rapid growth in the number coming from Haiti. Arriving newcomers continue to be markedly less proficient in English than before the pandemic, and their attendance during their first year of high school also remains lower, as it also does for other students.
A second key theme is that not only do districts serve vastly different types of newcomers, but they do so in quite different ways. We look at the important differences in districts’ policies and practices regarding newcomers in Section 3. Districts can purposefully cluster newcomers to concentrate services and programs or instead place
newcomers in mainstream high-school classes.4 They can use different models of instruction (e.g., transitional bilingual education, sheltered English immersion), and they can make different decisions about grade placement. These decisions involve tradeoffs and implementation constraints that individual districts may navigate differently. While we are unable to estimate the causal impact of any one of these decisions on newcomers’ later outcomes, we report descriptively on variation across the state.
A final key theme is that the combination of the high needs of many newcomers and the practices that districts use yield slow progress towards English language proficiency (ELP) and low high-school graduation rates. We report on these two outcomes in Section 4, examining how they differ across Massachusetts school districts. We also include evidence collected through interviews with educators in five Massachusetts districts who work with newcomers to shed light on potential explanations for these outcomes.
We conclude with a discussion of our findings and their implications for policy and practice in Massachusetts. At the time of this report’s publication, it is impossible to predict how the future of immigration in the state will unfold. Regardless, recent history suggests that the newcomer population will continue to shift and evolve, with important implications for district policies and practices.
The state continues to serve many thousands of newcomers who have entered Massachusetts public high schools over the past several years. These newcomers bring a wealth of knowledge and cultural assets with them that enrich classrooms,5 and a set of instructional needs that produce important challenges for districts across the Commonwealth. Districts need support and guidance to meet those challenges. Today’s high-school newcomers will be a significant part of the state’s workforce in the decades ahead. Ensuring their educational success — acquiring English and the academic and social skills to succeed in college or career — is critical to the state’s educational and economic future.

We begin by updating many of the statewide results for newcomers from our original report. First, we examine their demographic characteristics: their overall numbers and arrival timing, distribution in the state, language and country of origin, and initial ELP. Then we report their progress through high school using such metrics as attendance, persistence to a second year, progress towards ELP, and high-school graduation rates. Our analyses document important trends over time and focus on heterogeneity within the overall population of newcomers.
Our first report documented striking changes in the number and country of origin in the state’s arriving newcomers from 2008 through the 2021-22 school year. Compared to before the pandemic, 2021-22 saw a huge increase in the overall number of high-school newcomers, but also major changes in their demographics. That year’s newcomers were much more likely to speak Spanish or Portuguese, hail from the Northern Triangle region of Central America (El Salvador, Guatemala and Honduras) or Brazil, and know little English on arrival.6
At the time of publication, an important question was whether that year represented a pandemic-induced anomaly or the first year of a more permanent shift in the newcomer population. Since then, additional cohorts of newcomers have entered Massachusetts high schools. Where newcomers arrive from and which languages they speak have continued to change rapidly from year to year, posing ongoing challenges to district educators and state policymakers.7
To conduct the analyses presented here, we use data from the state’s integrated longitudinal data system, specifically the Student Information Management System (SIMS), Massachusetts Comprehensive Assessment System (MCAS), and Student Course Schedule (SCS) datasets, merged on unique state-assigned student identifiers. Schools and districts report SIMS data in three collections during each academic year: early October, March, and June. All SIMS collections occurred as scheduled throughout the COVID-19 pandemic; the MCAS was not administered in spring 2020.
Because newcomers arrive throughout the school year, we generally use demographic data from each student’s first highschool SIMS appearance. Students’ first language is recorded from the Home Language Survey distributed by school districts to parents; it asks what language the student first understood and spoke. For students for whom different first languages other than English are listed in different years, we use the modal language.
We do not include the family income of newcomers in any of the analyses in this report. Our evidence suggests that family income variables in SIMS may not be accurate for many newcomers; please refer to our first report for details.
To identify high-school newcomers using SIMS enrollment data, we employ the same definition as in our prior report: recent immigrants who are English Learners (ELs) and whose first enrollment is in grades 9-12 (or the latter part of grade 8). We focus attention on students who are age 18 or younger in September of their entry year.
We categorize students as newcomers to Massachusetts public high schools if they meet at least one of the following conditions: 1) they are flagged at entry as a student in their first year in a U.S. school, or
2) they are flagged as an immigrant and as an EL at some point during their high-school careers (as school/district reporting can change over time as more information is gathered and initial errors are corrected).
Note that the first condition is used for students arriving from Puerto Rico and other U.S. territories. They are not considered immigrants under the federal definition but meet our criteria for identification as a newcomer. (While SIMS includes a data element for Students with Limited or Interrupted Formal Education, or SLIFE, we do not use it in our analyses due to widely reported inconsistencies in how districts identify these students. If SLIFE definitions and data collection become standardized, future research on newcomers could analyze this important group separately.)
The number of new arrivals statewide stayed at a very high level through the 2023-24 school year, when the number of high-school newcomers exceeded 6,000 for the first time (FIGURE 2). In spring 2024, a staff member at Lynn Classical High School described the spatial challenges of accommodating this surge of newcomers: “Every single room, every single period, is full. Students have to do study halls in the cafeteria. Classes have to be in the library, in offices, in meeting rooms, conference rooms.”
However, in 2024-25, over 1,000 fewer students arrived than in the prior year. This decrease was driven entirely by a decline in the number of newcomers enrolling after the school year started, from October through the end of the school year. This span includes several months under the new presidential administration, when travel bans and increased entry restrictions were instituted to curtail immigration. Early indications are that the number of newcomers will be substantially lower in 2025-26.
Newcomers are enrolling in districts across the state, not just in urban centers. The proportion of newcomers
enrolling outside urban districts remains higher (23%) than before the pandemic (19% in 2018-19). Some of this shift may be due to the state’s emergency shelter program, which has placed immigrant families in locations all over the state (see the Policy Context sidebar). Districts like Woburn, Taunton, Randolph and Haverhill saw large increases in the number of newcomers over the five years from 2018-19 to 2023-24.
High-school newcomers arrive throughout the course of a school year, as reflected in the three different SIMS data collections. This poses important instructional challenges for districts. One long-standing pattern is that the number of newcomers who enroll at any point after the early October data collection is greater than the number who are present at the beginning of the school year. In 2023-24, for example, 46% of newcomers arrived by early October, another 38% enrolled by early March, and the remaining 16% entered between mid-March and the end of the school year. However, this pattern shifted in 2024-25, when only 40% of newcomers arrived after early October.
The number of newcomers in Massachusetts continued to increase until spring 2025.
NOTES 2025 refers to the 2024-25 school year. Urban districts are current and former members of the DESE Urban Superintendents Network.
Sweeping changes have also continued to take place in the language and country of origin of arriving newcomers. As illustrated in FIGURE 3, large spikes of newcomers from the Northern Triangle region of Central America and from Brazil occurred in 2021-22, as the pandemic was easing. Subsequently, numbers from both regions fell sharply. In fact, due to the large decrease in Brazilian newcomers, the share of new arrivals speaking Portuguese dropped from 31% in 2021-22 to only 14% two years later.
The share speaking Spanish has remained relatively constant at about half of newcomers, despite the drop in the number from the Northern Triangle.8 This consistency arose through increases from every other Spanish-speaking region, including the Dominican Republic, the Andean countries in South America, and other parts of the world (e.g., Puerto Rico, Mexico).9
Meanwhile, as arrivals from the Northern Triangle and Brazil fell off, a surge occurred in the number of newcomers from Haiti. This group jumped from 330 in 2022-23 to 1,244 a year later; by then, Haitians made up the second-largest newcomer country group. While just over one-third of Haitian newcomers enroll in Brockton & Boston, which have well-established Haitian communities, the rest are increasingly spread out across the state. In 2021-22, only nine districts had five or more Haitian newcomers at the high school level; two years later, 51 districts did. This total includes districts in southeastern Massachusetts like Taunton, Bridgewater-Raynham, Holbrook, and Foxborough, which had served very few newcomers prior to 2023-24.
FIGURE 3 Total Newcomers by Country Group Over Time NOTES Northern Triangle = El Salvador, Guatemala, Honduras; Andean = Colombia, Ecuador, Peru, Venezuela. 2025 refers to the 2024-25 school year.
In our original report, we explored differences across these country/regional groups by gender and initial ELP. FIGURE 4 updates these numbers for newcomers arriving in 2022-23 and 2023-24 combined. We see clear differences between groups — for example, the Northern Triangle and Haiti, which are the two largest. While the timing of high-school entry is similar, newcomers from the Northern Triangle are more likely to be male, and nearly all of them score in the lowest range on their first ACCESS test (Level 1 or 2; see sidebar for more information on ACCESS). In contrast, the Haiti group has the second-lowest percentage of students at the lowest levels of initial ELP (72%).
That said, reflecting changes across the newcomer population, the share of newcomers from Haiti who arrive with low English skills jumped from 58% in 2021-22 to 74% two years later. This suggests a potential shift happening within the Haiti group, with the most recent arrivals having higher needs in terms of learning English. We explore these differences in initial ELP by country group next.
[F]rom this [Haiti] group, you have the whole spectrum. You have students who have strong academic backgrounds and are planning on continuing their education. The ones that are graduating, they’re planning on looking at colleges, trying to figure out what to do next. And then you also have students who have very limited education…In my book, they would be SLIFE students. And so you have the whole spectrum of students and [we’re] trying to figure out, how do we best support them as a group, but also individually?
EDUCATOR
Framingham
Arriving students are formally classified as ELs by their district on the basis of a language screener administered during the registration process. However, the state collects English proficiency data only from the ACCESS for ELLs (“Assessing Comprehension and Communication in English State-to-State for English Language Learners”) standardized test, given annually during a window in January and February. This test includes sections on reading, writing, listening and speaking; we primarily use students’ overall (composite) level, which ranges from 1.0 to 6.0, and the Literacy level (Reading and Writing combined), which has the same range. In Massachusetts, an overall level of 4.2 is part of the EL exit criteria. Students who attain or exceed this level and score at least 3.9 on the Literacy component are considered able to handle grade-level coursework in English and are therefore eligible to exit EL services.
In addition to our analysis of state data, we also conducted semi-structured interviews in the spring of 2024 with 27 district and school administrators from five districts: Chelsea, Framingham, Lynn, Waltham, and Woburn. Districts were primarily selected based on the number and demographic profile of newcomers in their jurisdiction. Within each district, we identified interviewees through snowball sampling to reach key personnel who set policy for and engaged with newcomers. Using this method, we reached a range of district and school employees, including superintendents, directors of multilingual learners, principals, core content teachers (Biology, English, etc.), instructional coaches, CTE teachers, and social workers.
These interviews provided important context for our findings and are the source of quotations featured in the report. Prior to publication, we reached out to interviewees to review quotes selected for inclusion. Many interviewees approved the use of their name and role; others chose to remain anonymous or could not be reached to obtain their consent.
4
Newcomer Country Groups and Their Characteristics among Entrants in 2022-23 and 2023-24
NOTES Levels 1 and 2 are the lowest overall levels on the ACCESS test of English proficiency; only newcomers who take the ACCESS in their arrival year are included in the middle panel. Late arrivals are newcomers enrolling after the state’s first data collection in early October.
In FIGURE 5, we see a sustained drop in initial ELP among arriving newcomers. The figure includes the share of each country group’s newcomers scoring at an overall level of 1 (hereafter, L1) or L2 on their first ACCESS test. Because we restrict the figure to those students who took the test in the year they arrived, ACCESS scores here reflect newcomers’ English proficiency after five months or less in a Massachusetts high school. In 2023-24, just under half of all entering newcomers were L1s and another 28% were L2s. These shares are much higher than before the pandemic. The figure also reveals that within each country group, the share of L1s and L2s has increased, in some cases dramatically. For example, 25% of 2017-18 newcomers from the Andean region of South America initially scored at L1; the share increased by 30 percentage points over the next six years. By 2023-24, more than 80% of newcomers from the
Northern Triangle, the Dominican Republic, the Andean region, as well as Spanish speakers from other regions, scored at low levels of initial ELP (L1 or L2). This finding may relate to learning loss during the pandemic, since Latin America and the Caribbean experienced extensive school closures and online learning was difficult to implement in many areas.10
In summary, the state’s more recent newcomers reinforce two realities confronting Massachusetts high schools: 1) the native languages and backgrounds of newcomers differ markedly from one year to the next, complicating forward planning; and 2) the academic and linguistic needs of newcomers on average are steadily increasing. From the end of the pandemic through 2023-24, surging numbers of newcomers overall, combined with lower average ELP, resulted in very large increases of new arrivals at Levels 1 and 2.
FIGURE 5
Change in Initial English Language Proficiency by Country Group from 2017-18 (N=2,761) to 2023-24 (N=4,455)
NOTES 2018 and 2024 refer to the 2017-18 and 2023-24 school years, respectively. Sample includes only those newcomers who took the ACCESS test in the year they arrived (68% of newcomers in 2018, 70% in 2024).
Next, we examine patterns in metrics reflecting newcomers’ high-school experiences, including first-year attendance, persistence, progress towards ELP, and graduation.
Attendance and Persistence
First, as shown in the top panel of FIGURE 6, the attendance rate for newcomers in their first year of high school has closely mirrored that of nonnewcomers from low-income households since 2014-15. Attendance for both groups fell sharply during the pandemic, but newcomers’ attendance has shown more recovery in the time since. However, the attendance rate for newcomers, now about 91% (corresponding to about 16 days of missed school in a 180-day year), remains lower than at any point prior to the pandemic. About a quarter of newcomers arriving in 2024-25 were chronically absent, meaning their attendance rate was below 90%.
Looking within country group, newcomers from Haiti, the group that has shown the fastest growth in recent years, have a 95% attendance rate during their first year of high school. This translates to about 11 more days in school on average than newcomers from the Northern Triangle, whose attendance rate is 89%. Every country group’s firstyear attendance has declined from one to three percentage points since before the pandemic. The bottom panel of Figure 6 shows the trend in persistence to a second year of high school, which has fluctuated between 80-85% for newcomers. The gap in persistence between newcomers and other high-school students has stayed around 12-15 percentage points.
Newcomers’ attendance is similar to that of nonnewcomers from low-income families, but their persistence to a second year of high school is lower.
AVERAGE FIRST-YEAR ATTENDANCE
FIGURE 6
First-Year Attendance (Top Panel) and Persistence to a Second Year (Bottom Panel) Among Newcomers, Non-Newcomers From Low-Income Households, and Non-Newcomers From Higher-Income Households
NOTES 2025 refers to the 2024-25 school year. Sample for the bottom panel is limited to newcomers who entered high school in grades 9-11. Vertical dashed lines indicate a minor change in the state’s definition of low-income, which expanded to include all homeless students and those who were under 185% of the Federal Poverty Line but not previously identified through its match to state public assistance programs.
We examine newcomers’ progress towards ELP in their first full year of high school and how this differs by their level of initial proficiency. When we compare newcomers who first took the ACCESS in their entry year and again the following year, we see that the average gains of newcomers at L1 have consistently been about 0.2 levels lower than those who arrived at L2.11 This is quite surprising in light of research showing that the most rapid progress is typically achieved by students at the lowest levels of initial proficiency.12
A partial explanation might be that newcomers entering at L1 attend school at lower rates than those who score higher on their first ACCESS test. While this is true, the difference corresponds to three to four more days of missed school per year, on average, than for those at L2, a distinct but not dramatic difference. We discuss other factors that might contribute to this finding later in the report.
Also, average gains for both groups of newcomers dropped from 2017 (the first year of ACCESS 2.0) through 2020 and remain about 0.21 levels lower. In summary, then, recent years have seen increasing numbers of newcomers with very low levels of English proficiency on arrival, and these students are making less progress than their counterparts seven years earlier.
Finally, we turn to trends in newcomers’ rate of high-school graduation, which we define as receiving a diploma within a year of the student’s expected graduation date. Because of the many recent changes in the state’s graduation requirements that have applied to different graduating classes, we report high-school graduation rates by cohort (year of expected graduation) rather than arrival year. For instance, our original report highlighted an increase in newcomers’ graduation rate for the pandemicaffected cohorts of 2020 and 2021, which we speculated was partly due to modification of the MCAS testing requirement. Of course, any given cohort includes newcomers who arrived over the previous several years and were placed in a grade that put them on the same expected timeline for graduation (e.g., 9th graders who arrived in 2021-22 and 11th graders who arrived in 2023-24 would be in the same cohort of 2025).
These students and families are in survival mode. They haven’t attended school on a regular basis... All of the Maslow’s hierarchy of needs have not been met. So now you’re putting them in at 15, 16, 17 years old in high school and saying, ‘You
need
to pass Algebra
I,
Geometry, Algebra II, Biology, Chemistry, Physics, or any of the other two sciences...’ It’s the language of that content plus the language of English, plus your language of Spanish, and [they’re] all colliding. So I think that it’s a total challenge.
Former Principal, Chelsea High School

As shown in FIGURE 7, our new data reveal that the graduation rate for newcomers declined for the cohorts of 2022 and 2023 but rebounded somewhat for newcomers expected to graduate in spring 2024. Again, the policy context is essential to the interpretation of this time trend. The MCAS minimum-score requirements in math and ELA, though not science, were binding for the graduating class of 2023. Prospective 2024 graduates had to fulfill all three testing requirements, but for members of that cohort who took an additional year to graduate, they had to fulfill none of them (the requirements ended in January 2025).
In fact, 13% of newcomers in the 2024 cohort who graduated did so a year “late,” compared to just under 8%
of those in the 2023 cohort. It appears that the end of the MCAS requirements did make it possible for additional newcomers — those who had satisfied local requirements but had not achieved the minimum score on all three MCAS tests — to graduate.
Importantly, these changes in graduation rates for newcomers are not reflected in the trends for the two other groups shown in Figure 7. For non-newcomers, regardless of family income, graduation rates remained remarkably stable during and after the pandemic. We take this as additional evidence that state-level graduation requirements have historically affected newcomers more than other students.
State-level graduation requirements appear to have affected newcomers more than other students.
NOTES Graduation defined as receiving a high-school diploma within one year after the student’s expected graduation year, including over the following summer. Trend line reported for low-income non-newcomers begins with the 2018 cohort due to a major change in the state’s definition of low-income that occurred in 2015. For the graduating classes of 2020-22, the requirement to exceed a minimum score on all three high-school MCAS tests was waived; students could instead graduate by completing a minimum set of high-school courses. MCAS requirements were reinstated in math and ELA for the class of 2023 and in all three subjects for the class of 2024; the requirements were permanently eliminated in January 2025.
Of course, the trends in Figure 7 reflect the graduation rate for all newcomers statewide. However, the composition of the newcomer population has changed dramatically over time, and those shifts make patterns harder to interpret. In TABLE 1, we look within newcomer country groups and see substantial improvement over time in high-school graduation rates for all Spanish-speaking groups. While newcomers from the Northern Triangle graduate at the lowest rate (46%), that rate has increased by 11 percentage points since 2017-18. Moreover, the graduation rate is highest for the Haiti group (79%), which grew dramatically in size in 202223 and 2023-24. As more of those students reach 12th grade and graduate, we can expect the statewide trendline for newcomers to move up.
The differences in high-school graduation rates by country group remain quite large. While some of the variation by country group displayed in Table 1 is due to differences in initial English proficiency, even after adjusting for first ACCESS score, newcomers from the Northern Triangle are 21 percentage points less likely to graduate than those from Haiti.
Newcomers’ graduation rates improved since 2018, with the largest gains among Spanish-speaking newcomers.
TABLE 1
High-School Completion among Newcomers in 2023 and 2024 Graduating Cohorts (N=7,208)
NOTES Graduates are those newcomers who completed high school within a year of their expected graduation year. Rows do not sum to 100% because of students who were still enrolled (2% of newcomers statewide) or who received a Certificate of Attainment, meaning they had met local but not state graduation requirements (6%). We recode as dropouts those students reported in the data as “in-state public transfers” who do not subsequently enroll in any other Massachusetts public schools.
I think the correlation is kids who have had a longer stretch of formal schooling know how to ‘do school’ better, and are able to navigate a place that’s as traditional as Woburn High School…get along better than, you know, we’ve got a handful of kids who have literally walked here from Venezuela and have missed a lot of school in their lives and are just getting acclimated.
EDUCATOR
Woburn

While statewide trends are important to understand, each newcomer’s engagement with the Massachusetts public education system happens at the local level. In this section, we explore the variation in newcomers’ profiles across districts in four key respects: growth over time, share of the district’s total high-school enrollment, language heterogeneity, and country/region of origin.
The statewide trend of rapid growth in newcomer enrollments through 2024, which we reported in the previous section, does not hold in every district. Indeed, we see two broad patterns, as illustrated in FIGURE 8: a) a post-pandemic spike followed by an immediate drop, as in Lynn, and b) continuing growth over time up until spring 2025, as in Brockton. Not every district follows one of these trends, but most do.
In Lynn, much of the pattern closely mimics what happened statewide. The number of newcomers grew fairly steadily until a precipitous drop during the pandemic. Then, very large spikes occurred in many locales in 202122, as the pandemic eased and immigration began to pick up. However, in the following two years, Lynn experienced another fairly sharp drop, though newcomer enrollments remained well above pre-pandemic levels. Given that Lynn serves so many students from the Northern Triangle, its enrollment trend closely mirrors that of this group in Figure 3, including yet another steep decline in the spring of 2025.
This pattern contrasts to that in Brockton. There, enrollment increased more slowly in the years before
and after the pandemic. The particularly dramatic jump in 2023-24 was primarily driven by the large increase in newcomers from Haiti that year. In Brockton, as well as in districts like Boston and Fall River, the number of recent newcomers was much higher in 2023-24 than at any point over the prior 15 years. Even after accounting for the decline in spring 2025, Brockton’s newcomer population remained well above pre-pandemic levels.
The differing trends across districts have significant implications for class sizes, staffing, and EL programming. Critically, district administrators have little idea what their district’s number of newcomers will be from one year to the next. They must plan for a future that can change precipitously from one year to the next, and that no one can forecast reliably. While enrollment fluctuations are a fact of life for public school districts, the unpredictability in the number of newcomer arrivals is much greater than for most other student groups. As one district administrator noted in the spring of 2024: “So we are just expecting always the increase. Every summer is different. Every enrollment season here is different…So we don’t know what’s going to happen in September.”
Districts have experienced different newcomer enrollment trends, both before and after the pandemic.
FIGURE 8
NOTES In district-level tables and figures throughout the report, we usually include the largest destination districts for newcomers down to a particular threshold. This threshold varies because of the different samples included in each exhibit (e.g., newcomers from different arrival years, those with initially low levels of English proficiency or all newcomers). When we have selected a given set of districts instead of including all districts above a key threshold, we indicate this in the caption.
In addition to large differences in enrollment trends over time, districts also differ in their newcomer enrollments at any single point in time. In FIGURE 9, we compare districts in 2023-24 based on the share of their high-school population that had ever been a high-school newcomer. Here, we include not just new arrivals, but all students who were newcomers at some point in high school. We refer to this larger group as “ever-newcomers.” Boston enrolls by far the largest number of such students, with 2,023 in 2023-24. However, as illustrated in Figure 9, Boston is in the middle of the pack when it comes to ever-newcomers as a share of district high-school enrollment.13 In the immigration hubs of Lynn, Lawrence, and Chelsea, nearly one-quarter of all high-school students enrolled at any point in 202324 either were currently or had recently been newcomers. Springfield, Lowell, Everett, and Chelsea all serve similar
numbers of newcomers, but newcomers make up vastly different shares of their high-school populations. These differences carry implications for how newcomers factor into a high school’s instructional program and school community. Both dimensions are important. Where newcomers represent a larger share of the student body, more of the school’s teachers are likely engaged in instructing them. Their needs may be more in the forefront than in schools where they make up a smaller share of the population. At the same time, numbers matter, too — serving a larger number of newcomers may facilitate the development of specific instructional programs for newcomers. But in high schools where newcomers are a relatively small group, staff may be able to adopt a more personalized approach and target resources more effectively.
Districts’ total number of newcomers and newcomers’ share of total high-school enrollment are both important.
NOTES Ever-newcomers are students enrolled in 2023-24 who were ever classified as newcomers during their entire high-school careers, not just those who arrived that year.
Another dimension of variation across districts is in the native languages spoken by their newcomers. If nearly all newcomers speak the same language, as is the case in districts like Lawrence and Lynn, it may simplify challenges like recruitment of bilingual staff, selection and implementation of English as a Second Language (ESL) curricula, and communication with families. In districts where different languages are spoken by substantial numbers of students, these tasks are more complex.
To explore this, we array the 50 districts with the most newcomers in the state in 2023-24 in four quadrants in FIGURE 10, based on their number of newcomers and the percentage of newcomers speaking the modal language. We categorize a district as “large” if it enrolled 100 or more newcomers in 2023-24 and as “homogeneous” if 70% or more of its newcomers spoke the same native language. These quadrants provide some sense of the size and linguistic heterogeneity of the district’s newcomer population.
Large
Large &
NOTES For fully labeled version of Quadrants C and D, see Figure
Small & homogeneous 6 districts
Small & heterogeneous 29 districts
The five districts with large and linguistically homogenous newcomer populations in Quadrant A (Lynn, Lawrence, Revere, Chelsea and Waltham) serve one-fifth of the state’s newcomers (20%). These districts all have the same modal language, Spanish. However, three of their profiles show that these Spanish-speaking newcomers have arrived from many different countries. In Lynn, the largest of these districts by total enrollment, about two-thirds of newcomers are from the Northern Triangle. Students from the Dominican Republic make up over three-quarters of newcomers in Lawrence, while about half of Revere’s newcomers come from the Andean region of South America.
From evidence presented in the previous section, we know that these country groups are very different on average in terms of initial ELP and progress through high school. Many newcomers from the Northern Triangle, for example, have experienced limited prior schooling or interruptions in their education; they may also have acute socioemotional needs due to the factors that led them to flee their home countries, the dangerous journeys that brought them to the U.S., and anxiety related to their immigration status (e.g., court dates, Temporary Protected Status, deportations of family and community members). A district like Lynn, which absorbed over 300 of these students in 2023-24 alone, faces a different, more challenging task in serving its newcomers effectively than other districts serving newcomers who have, on average, more years of formal schooling and less trauma in their recent past.
There are notable differences in country of origin for Spanish-speaking newcomers.
10A
2023-24 Newcomers by Country Group in Selected Quadrant A Districts
Ten other districts enroll more than 100 newcomers but are more heterogeneous in terms of languages spoken. About 43% of the state’s newcomers enroll in one of these districts, including 900 newcomers in Boston. In seven of the 10 districts, the modal language is Spanish, but the percentage of Spanishspeaking newcomers ranges from 63% in Springfield to only 36% in Everett, where there is a great deal of linguistic diversity. In Malden and Brockton, the modal language is Haitian Creole, while in Fall River, it is Portuguese.
As above, we highlight three of these districts to show the diversity of the newcomer populations in this category, including the country/region of origin for Spanish speakers. In Boston, Framingham, and Fall River, no single country group accounts for even half of newcomers.
Moreover, when we look at trends in newcomer profiles over time, we see that some districts have experienced tremendous shifts in just a couple of years, while the situation in other places has been less dynamic. In Boston, for example, the relative sizes of each newcomer group have changed quite a bit over time, with a 2021-22 uptick from the Northern Triangle and a 2023-24 increase from Haiti. In Lynn, the modal group has been consistent, though the share of newcomers from the Northern Triangle has varied from 75% to 84% to 64% over six years.
When the composition of a district’s newcomer population changes rapidly, it can be especially difficult for districts to adjust, given that their budgets and staffing levels are set in advance. The fluidity in newcomer demographics, particularly at the level of individual school districts, is a reality that should be taken into account in efforts to improve services for this vulnerable group of students.
In many districts, no country group accounts for even half of newcomers.
FIGURE 10B
2023-24 Newcomers by Country Group in Selected Quadrant B Districts
The remaining third of newcomers attend school in districts with fewer than 100 newcomers. While six of these districts have newcomers who mostly speak the same language (see Quadrant C), there are 29 smaller districts with more linguistic diversity. Many are inner suburbs of Boston — Cambridge, Somerville, Medford, Brookline — while others are scattered around the state.
In districts like West Springfield, Westborough, and Medford, there are fewer than 60 newcomers arriving each year, and not even one-third of them speak the same language. When lower newcomer counts are combined with this degree of language heterogeneity, districts may struggle to fund the staffing and programs necessary to serve their populations effectively.
Of the top 50 districts, most have small and heterogeneous newcomer populations.
FIGURE 10C Smaller
The majority of the state’s high-school newcomers are not present at the start of a school year but instead arrive at some point after early October, due to factors such as the intense summer heat at the southern U.S. border and the timing of when the school year ends in their country of origin. This pattern is especially pronounced in Chelsea and Waltham, two districts with very large numbers of newcomers from Central America, where fewer than 30% of newcomers enroll at the beginning of the school year. In many other districts, the majority of newcomers have arrived by early October, in time to participate in opening rituals like new student orientation and begin courses alongside their new classmates.
To illustrate, in FIGURE 11 we compare cumulative arrival patterns in the 2023-24 school year for Waltham (117 newcomers) and Woburn (57 newcomers). About 70% of Woburn’s newcomers enrolled at the beginning of
the school year; again, less than 30% did so in Waltham. Instead, newcomers entered Waltham High School at a steady pace from September to May, with a large number of newcomers enrolling after the winter recess. Importantly, all newcomers in a particular entry grade are placed in the same graduation cohort regardless of when they arrive, meaning their timeline for completing high school is the same.
About 25% of Waltham’s newcomers arrived in March or later, giving the district little time to work with them before school closed for the summer. Missing so much of the school year may exacerbate feelings of disorientation among newly arrived immigrant teenagers who possess little prior knowledge of how American schooling works. This type of arrival profile imposes distinct challenges for both educators and for newcomers themselves.
In some districts, more than half of newcomers arrive after the start of the school year.
You have a kid who comes in January, and they missed all that [initial ESL] instruction. They’re lost, and they’re constantly skipping, and they’re like, ‘But I don’t understand anything. I can’t talk…I have no idea what’s happening in the class.’
CARMELA PUCCI Social Worker, Framingham High School
FIGURE 11
Approximate Arrival Timing for 2023-24 Newcomers in Waltham (N=117) and Woburn (N=57) MONTH OF ENTRY
Newcomers’ country of origin is correlated with their initial level of English proficiency, a key metric to gauge the level of supports that districts need to provide them. Since the ACCESS test is administered in January or February, we restrict our analysis here to 2022-23 and 2023-24 newcomers who entered a Massachusetts high school in time to take the test. In FIGURE 12, we show the distribution of newcomers by initial overall ACCESS level for selected districts. The final category (white) is for newcomers who met the ACCESS exit criteria on their very first test.
At the top of the figure, we see that in most districts with more than 100 newcomers across these two years, 75% or more initially scored in the L1 & L2 ranges. In Massachusetts, this score range is considered Foundational, and districts must provide “at least two to three periods (a period is not less than 45 minutes) per day of direct ESL instruction, delivered by a licensed ESL teacher” to each student in this range.14 This intensive support requires qualified staff, classroom space, and considerable time in students’ schedules.
In the largest destination districts for newcomers, 75% or more arrive with low levels of English proficiency.
LYNN (688)
FRAMINGHAM (238)
WORCESTER (308)
BOSTON (1,075)
LOWELL (209)
LAWRENCE (512)
EVERETT (228)
BROCKTON (419)
FALL RIVER (185)
SOMERVILLE (72)
MALDEN (156)
QUINCY (98)
WOBURN (75)
ACTON-BOXBOROUGH (28)
CAMBRIDGE (68)
NATICK (21)
NEWTON (79)
LEXINGTON (48)
BELMONT (24)
BROOKLINE (33)
FIGURE 12
NOTES Figure includes 2022-23 and 2023-24 newcomers who first took the ACCESS test the same year they arrived. The total number of each district’s tested newcomers in this sample is in parentheses. The Massachusetts exit criteria are a 4.2 overall level and a 3.9 level on the literacy composite.
At the other end of the spectrum are newcomers initially classified as ELs by their districts, but who scored above the exit criteria (4.2 overall level and 3.9 for literacy) on their first ACCESS test just a few months later. These students likely began from a very strong base of English proficiency when they arrived, and either their initial classification was incorrect or they made rapid progress in their first months in a Massachusetts high school.
As illustrated in FIGURE 13, there is a very clear association between a district’s share of newcomers who score above the EL exit criteria on their first ACCESS test and median family income. In relatively affluent communities including Lexington, Belmont, and Brookline, at least half of their newcomers are in this category. Many are speakers of Chinese, Russian, French and Korean — languages spoken by very small minorities of the state’s newcomers.
While these students are considered newcomers for
our analysis, their language development needs are quite different from the students initially at L1 and L2 described above. Many of these newcomers likely have an easier adjustment to mainstream high-school classes and require much less ESL support from their districts in order to be successful.
In Section 2 of this report, we have documented striking differences in newcomer demographics in the state, both across districts and over time. Newcomers are a heterogeneous and dynamic population along several key dimensions — growth in their numbers over time, their share of a district’s total enrollment, the heterogeneity in their home language and country/region of origin, the timing of when they enroll during the school year, and their initial ELP. Considering all of these dimensions, including how they have changed in recent years, is essential to fully understand the newcomer profile of any individual district — the first step in meeting newcomers’ needs.
FIGURE 13
NOTES Median household income taken from ACS-ED District Demographic Dashboard 2019-23. Sample includes newcomers in 2022-23 and 2023-24 who took the ACCESS in the year they arrived. The Massachusetts exit criteria are a 4.2 overall level and a 3.9 level on the literacy composite.

The number of newcomers arriving each year, their region of origin, their initial ELP, and the timing of their initial enrollment are all factors over which district educators have no control. They must register and serve the newcomer students who arrive at their high schools each month, regardless of how many arrive and from where.
However, once newcomers have enrolled in a Massachusetts high school, staff make a series of decisions about how to educate them: their grade placement, the English Learner instructional program they will be part of, their initial set of high-school courses, and their access to special programs like career and technical education (CTE) and alternative pathways. In Massachusetts, as in many other states, districts have a fair amount of discretion in making these decisions, either directly or in combination with families.
A key question is the extent to which districts treat newcomers differently than other entering high-school students, including those who are ELs. Are newcomers absorbed into a high school using general policies and protocols that apply to all new students, or have local practices developed to facilitate their entry in a more targeted way? We examine district variation in these policies and practices by examining quantitative data and evidence from interviews with district educators who work with newcomers.
One of the first decisions districts make when newcomers first enroll is their initial grade-level placement.15 Our interviews revealed many different understandings of how grade placement works, even within the same district. Some staff members reported that the student’s age is the main factor, with older newcomers placed in 10th or even 11th grade, regardless of whether they arrive with transcripts from a previous high school. Others talked about making the initial placement decision jointly with the family, after discussing the student’s goals and the possibility of earning college credits through early college programs if they stayed in high school longer.
I think that we’re having a very difficult time knowing what’s what, where students should start. They’re coming in with such... interruptions in learning... We’re enrolling quickly. And I think that what we’re realizing is...their credits aren’t exactly what we thought their credits
were. And there’s four years, and we’re trying to make sure to maximize and have students graduate [so] every grade and semester matters, but we also don’t want to have a 21-year-old
freshman, right? I think that’s really the balancing act of the correct placement of grades.
COURTNEY YOUNG
Assistant Superintendent of Curriculum & Instruction, Woburn Public Schools
Still others described placement as a more rigid process, with the sole determinant being the transcripts newcomers bring with them; those who enroll without a previous high-
school transcript are automatically placed in 9th grade. In some districts, particularly those with larger numbers of newcomers, staff members work with families and contact students’ previous schools to secure missing transcripts; this is a taxing process for bilingual staff members with many other demands on their time. Even once a transcript is procured, DESE offers some resources but no formal guidance on how to evaluate these documents and assign credits for coursework completed outside the U.S.
The question of grade placement is particularly thorny for older newcomers. We focus here on the group who are ages 16 to 18 in September of their entry year. Statewide, most students this old are placed in grades 10-12, with 30% starting in grade 9. However, placement practices differ markedly among districts. For example, 16% of older newcomers enrolling in a Boston high school are placed in ninth grade, while the comparable percentage in Springfield high schools is 64%. This can be true within a district as well. In Boston, 54% of older newcomers at the Boston International Newcomers Academy (BINcA) begin in ninth grade, compared to 2% at Charlestown High School.
Of course, one reason that districts might differ in their placement patterns is that newcomers arrive with different levels of English proficiency and prior educational experiences. To explore this, we adjust for differences among newcomers in initial ELP, country group, age and timing of entry, and gender. In FIGURE 14, we show variation in the 9th grade placement rates for older newcomers in the 12 districts with the largest newcomer enrollments, relative to the state average. The light green bars show the raw differences from the state average, while the dark green bars correspond to the adjusted differences. Even when we compare students who are the same age, from the same region, and who enter at the same point in the year with the same English language proficiency, there remain large differences across districts. For example, an older newcomer in Springfield is 38 percentage points more likely to be placed in 9th grade than a similar newcomer in Boston.
This finding bears out a pattern in the evidence from the interviews we conducted: There is substantial variation in how districts are handling this initial, consequential
decision for their newcomers. Difficult tradeoffs are inherent in placing older newcomers in a high-school grade. Those placed in upper grades have less time to acquire English proficiency and to satisfy state and district requirements before their expected year of graduation. However, older newcomers who are placed in 9th grade may feel socially alienated in classrooms with much younger peers and discouraged by the longer time horizon to graduation that they face.
In short, where districts place newcomers certainly matters, but there are no clear answers about best practice. Our data reveal that older newcomers placed in grade 9 are about six percentage points less likely to persist into a second year of high school than those who are placed in a higher grade. It is important to keep in mind that this evidence is not causal; many other factors might contribute to this relationship, including differences in supports across districts or even within schools.
There are strikingly large differences by district in the initial grade placement of older newcomers.
Springfield
Lynn
New Bedford
Chelsea
Worcester
Framingham
Everett
Lawrence
Brockton
Lowell
Revere
Boston
FIGURE 14
Ninth-Grade Placement Rates for Older Newcomers Entering in 2022-23 and 2023-24, Relative to the State Newcomer Average (34%)
NOTES Solid bars indicate differences from the mean that are statistically significant. Older newcomers are those at least 16 years of age on September 1 of their entry year. Sample excludes newcomers arriving later than March and those in districts with fewer than 10 older newcomers in these combined entry years. Adjusted rates control for gender, language/country group, age and timing of entry, and initial ELP; the sample for those models is limited to older newcomers who took the ACCESS in the year they arrived.
Because newcomers are by definition ELs, another initial decision districts face is which EL program model they will participate in. Under the Language Opportunities for Our Kids (LOOK) Act, districts in Massachusetts have been permitted since 2017 to offer a variety of educational programs for English learners. Prior to that, bilingual education programs had been severely curtailed via a ballot referendum passed in 2002. This history has no doubt contributed to the continuing dearth of such programs at the high-school level, despite compelling research on their effectiveness.16
In Sheltered English Immersion (SEI) programs, ELs receive instruction and curricular materials in English, while in bilingual education, students’ native language is used for some instruction. There are different types of bilingual education. For example, Transitional Bilingual Education (TBE) is defined as “a program designed to allow English learners to achieve long-term academic success through English-medium instruction in general education classrooms; provided, however, that the native language of the English learner is used to support the student’s development of English and content learning and is then gradually phased out of instruction as a student’s English proficiency increases.”17 Other models, such as dual language immersion, are designed to develop fluency in both languages and serve native English speakers and ELs together.
In a seminal study on elementary and middle-school students, Valentino & Reardon (2015) show that ELs’ scores in ELA grow faster for students in all bilingual programs compared to students in SEI. Students in TBE and two-way bilingual programs also show faster growth in math achievement than students in SEI.18 However, building effective bilingual education programs requires support from school leadership, educators who are linguistically and culturally competent in both languages, and curriculum, instruction, and assessments that are aligned in both languages.19 These challenges may be easier in districts with large numbers of newcomers who speak the same language than in those with more substantial linguistic diversity or smaller numbers of ELs.
In most Massachusetts districts, the EL placement for high-school newcomers is automatic because only one program exists. Nearly all newcomers in the state were enrolled in SEI in 2023-24. Only three of the districts
serving high-school newcomers had additional EL program offerings, according to state data. Two enrolled large shares of their newcomers in transitional bilingual education (TBE) — Framingham (71%) and Brockton (84%). In Boston, one percent of newcomers were enrolled in the dual language program at Margarita Muñiz High School.
Brockton offers TBE programs in three languages: Spanish, Haitian Creole, and Cape Verdean. However, according to district staff, these programs are not all “true TBE” because instructional materials are not available in Haitian Creole or Cape Verdean. Instead, teachers use these languages to help students access instructional materials in English. Moreover, for many of the students enrolled in these programs, English is their third language (e.g., speakers of a Mayan language who learned Spanish in Guatemalan schools, Haitian Creole speakers who attended Frenchmedium schools in Haiti).
In Framingham High School, 71% of newcomers in 2023-24 were initially enrolled in a TBE program in Spanish or Portuguese (see case study). Historically, students who arrived speaking one of these languages but very little English were placed in TBE more or less automatically. According to district staff, in recent years many families (particularly Brazilian families) have opted for English-only SEI instruction instead. To be eligible for TBE, students must have arrived in the U.S. within the last 12 months, score below a certain level on their initial English screening, and be in 9th or 10th grade. Staff we interviewed explained that older students are excluded because they have so little time to build their English skills before graduating.
The obstacles to the creation of more TBE programs at the high-school level are formidable. Such programs require a critical mass of newcomers speaking the same language, a cadre of qualified bilingual staff, and highquality instructional materials in the students’ home language. For many districts, especially those with small numbers of newcomers, offering an in-house TBE program is unrealistic. Even for those with a larger newcomer pool, overcoming the resource challenges may require additional district coordination and state assistance. But diversifying EL program offerings is one research-based strategy for traditional high schools to adapt and serve newcomers in a more targeted way.
Transitional bilingual education (TBE) is a research-based program offered at the high-school level in only two Massachusetts districts. Lynn Rosedale, Framingham’s former assistant director of multilingual education at the secondary level, described the intent behind the district’s TBE program: “If that is a program your family opts into, then you will receive your science, math, social studies in a Portuguese or Spanish class in that target language with bridging opportunities into English.”
The idea is that you will have that one soft landing year, where you can still stay up with your grade-level content material, but you’ll be bridging and making connections into English, so that next year, when all of your classes are in English, you will be better prepared.
LYNN ROSEDALE
Former Assistant Director of Multilingual Education, Framingham Public Schools
The program has been modified in response to concerns that TBE students were not acquiring English quickly enough to successfully transition to mainstream classes, as evidenced by their slow progress on the ACCESS test. Now students take only one year of TBE science and math, with more emphasis on “bridging” to English over the course of that year.
Veronica deSouza, who went through the program herself as a student and now serves as the ESL/Bilingual Department Head at Framingham High School, explained:
“The T in TBE stands for ‘transitional,’ so we added more English to it. In term 1, we teach mostly in Portuguese or Spanish (depending on the program the student is in) and then we start to transition throughout the year to fully English with scaffolding in term 4…the kids get to adapt little by little, instead of…everything in Portuguese and [then] sophomore year, boom, here is English, which is what happened to me as a student, and I saw happening to my students.”

A potential barrier to the implementation of district TBE programs is recruiting qualified bilingual staff. In spring 2024, Framingham staff described two partnerships to help address this need. One was the Framingham Teacher Residency, a partnership with Framingham State University funded through an Americorps grant. Through this residency, 10-15 student teachers were placed in the district each year with mentor teachers; around 80% of them completed the program, obtained their licensure, and took permanent jobs with the district. Another 10 teachers a year came from Spain, with the district providing assistance with H-1B visa applications. According to Lynn Rosedale: “We just have a wealth of talent, and it is also something that’s been really prioritized as we’re hiring. Framingham has a reputation, if you are a multilingual educator, of being a place [where] we always have a job available.”
Once high-school newcomers are placed in a grade and an EL program, their first course schedule is constructed. Because of differences across districts in how high-school courses are recorded in state data, it is difficult to draw comparisons of course titles and content across districts. Instead, we focus here on the peer composition of newcomers’ initial high-school courses in core academic areas (math, science, and social studies). When a newcomer arrives in a Massachusetts high school, are they enrolling primarily in heterogeneous classes with a mix of students from different backgrounds, or are they largely in settings with other newcomers?
Not surprisingly, the answer depends partially on their initial ELP level. Newcomers who score at L3 or higher on their first ACCESS test are more likely to be in courses with fewer fellow newcomers and ELs. Many of these students arrive with enough English proficiency to successfully navigate mainstream courses.
For those arriving at L1 or L2, however, there is much more variation across districts. In FIGURE 15, the most variation in newcomers’ core courses occurs in districts with less than 50 new arrivals in the L1 & L2 categories per year (highlighted at the far left of the figure). We might expect that these students would be in more heterogeneous courses, simply because their high schools have far fewer ELs to cluster together in separate classes, and this is the case in many jurisdictions. But the range is startling: The peers of the average L1 or L2 newcomer in 2023-24 included only 15% L1s and L2s in Bridgewater-Raynham and Weymouth, but 95% in Gloucester.
Even among districts with more newcomers, the student composition of their core courses can be quite different. Worcester had over 150 L1 & L2 newcomers in 202324, yet in their core academic classes, about one-third of their peers were not at L1 or L2. In New Bedford, with a fairly similar count of newcomers, the average L1 or L2 newcomer was in core classes where 93% of students were also at emerging levels of English proficiency.
Again, there are tradeoffs inherent in the decision to group newcomers with each other or start them in mainstream classes. When newcomers are widely distributed across the school, the imperative to adapt instruction to meet their needs becomes shared by educators more broadly. Professional development aimed at building staff capacity, especially in high schools without much of a history with this population, is extremely important, according
We kind of go back and forth on whether those kids should be in more of a mixed SEI class…when they’re Level 2. And I think there are pluses and minuses. The kids in that room, where all the kids are English learners, we find are way more likely to take those risks in speaking…whereas if we put them into a general ed class, they often sit in the back quiet, and the teacher, who is well-meaning, doesn’t ever call
on them, because they don’t want to put them on the spot.
DEIDRE COLLINS
Former Coordinator, Multilingual Learner Education, Bridge Academy, Chelsea High School
to many educators with whom we spoke. If teachers do not consistently provide instructional scaffolds and supports, newcomers will likely struggle to acquire English proficiency and fill in any gaps in their prior learning.
In districts with more than 50 newcomers at L1 & L2 each year, however, these students are generally in core classes where two-thirds or more of their peers are also at L1 or L2. This strategy means that a smaller number of educators, likely with more expertise in working with multilingual students, are responsible for their education in core academics. It may also provide a learning environment that feels safer for students to participate and practice their English. Yet these newcomers may miss important opportunities to interact with native speakers, learn about high-school rituals and traditions, and build their social networks. As one Woburn staff member said in 2024: “We basically segregate these kids for the entire school day. And so… kids will go from ESL class to ML [multilingual] math to
ML U.S. history to ML science. So they’re just together all day. They’re not really able to be enmeshed in the school community. So opportunities to interact with native English speakers are extremely limited, aside from their classroom teachers. There hasn’t been a lot of exposure to the student body as a whole, which is unfortunate.”
These tradeoffs make it unclear which option is preferable, either for the schools or for the students themselves. Some existing research suggests that “separating immigrant students from their non-immigrant peers in classes or schools can have adverse effects on all students.”20 A hybrid option could involve mainstreaming newcomers but ensuring that quality supports are in place, such that instruction is adapted beyond the use of Google Translate.
In many districts, particularly larger districts, most newcomers are in core academic classes with other ELs at low levels of English proficiency.
FIGURE 15
Composition of the Initial Core High-School Courses of Newcomers Arriving in 2023-24 at Levels 1 & 2
NOTES Sample includes those newcomers who took the ACCESS test the year they arrived; districts with fewer than 10 L1s and L2s in 2023-24 are excluded. For classmates, we categorize based on their 2023 ACCESS score when available, since this score would be used for placements in fall 2023; we use 2024 ACCESS scores if 2023 scores are missing. “Core courses” include math, social studies and science (we exclude ELA because of differences in how districts code their ESL classes).
Most Massachusetts public high schools offer some type of Career and Technical Education (CTE) option for students. Given that many newcomers plan to enter the workforce as soon as possible, CTE pathways would seem to be an obvious fit for this population. The opportunity to build marketable skills and even earn valuable professional certifications and credentials, all while working towards a high-school diploma, is important for many newcomers.
In Massachusetts, there are two types of high-school CTE programs — those in standalone vocational & technical high schools and those housed within comprehensive high schools. Less than one percent of the state’s 2021-22 newcomers ever enrolled in one of the 31 standalone vocational & technical schools. One likely explanation is that the admissions process for these schools typically features an application deadline in the middle of the prior school year, before most high-school newcomers have even arrived in the country. Also, transfer opportunities may be rare or unclear. Given that 6% of nonnewcomer ELs and 11% of never and former ELs attended these schools, the near-total lack of access for newcomers raises serious equity concerns.
Next, we turn to participation in CTE programs within comprehensive high schools, which enrolled about 24,000 students in the 2023-24 school year.21 About 5% of newcomers arriving in 2021-22 were ever enrolled in a non-exploratory CTE program, compared to 13% of other ELs and 12% of non-ELs.
Newcomers’ CTE participation varies tremendously by district, however. The share of 2021-22 entrants who ever participated in a Chapter 74 CTE class or program ranged from 0% to 55% in districts with at least 10 newcomers. Of course, much of this variation likely stems from differences in the number and enrollment capacity of CTE program offerings.
I feel like there’s a mismatch between what [newcomers] think a U.S. high school does and what they need from their high school, what their goals are, compared to what we offer. So we offer standards-based education — MCAS, a very academic education...and that’s why we feel the CTE program would be so great for them, because if there is more immediate relevancy to a lot of them, they can get a job right away.”
DEBORAH SMITH
ELL Teacher and Instructional Coach, Waltham High School
A second useful metric, then, is the difference in participation rates between newcomers and all other high-school students in the same district. In most districts, newcomers participate at a rate 10 or more percentage points lower than their peers. One explanation may relate to newcomers’ unfamiliarity with existing CTE options and application procedures.
In Waltham, about a quarter of newcomers participate in CTE, which is similar to the rate for other students. Our conversations with ESL and CTE educators at Waltham High School, detailed in the case study, highlight the important distinction between access and equity. This is a larger theme that districts can struggle to address for many different student groups, not just newcomers. Opening up access to programs like CTE goes hand-in-hand with the imperative to provide instructional supports, modified content, and additional time for content and skill mastery so that all students can be successful. For newcomers in particular, there is a tension between the acquisition of vocational skills and credentials, on the one hand, and ELP on the other. Waltham’s experience illuminates the challenges in meeting both sets of goals.
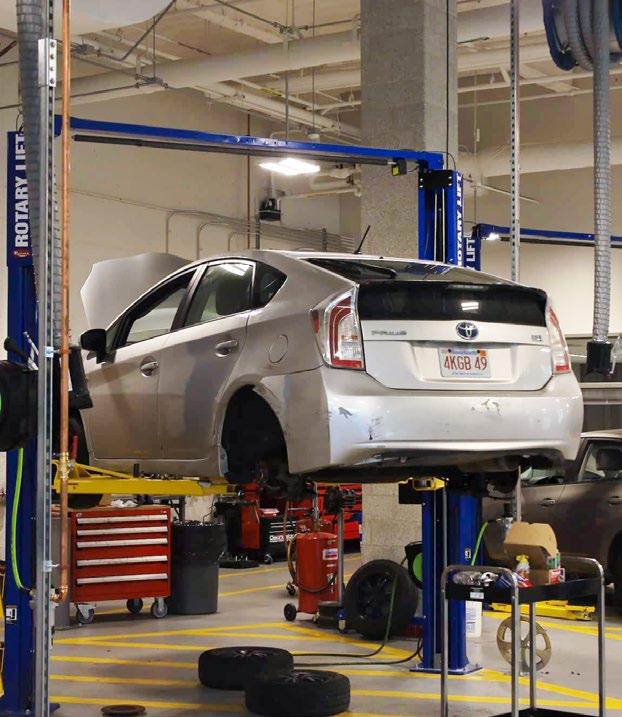
It’s hard to hand back a test that they failed when I know…they have a job outside of school, and they’re probably working three times as hard as their classmates and getting no results. And that’s just demoralizing to them, and it’s hard for us to watch as teachers.
ELLEN DARCY CTE Health Assisting Instructor, Waltham
High School
One-quarter of the newcomers at Waltham High School participate in CTE, which is one of the higher rates in the state. Several educators there spoke with us about the opportunities and challenges that the school, its staff, and its students have experienced. While newcomers are accessing existing CTE programs, our interviews revealed a shared sense that adapting those programs to better match newcomers’ interests and circumstances would promote their success.
The CTE admissions process in Waltham is based mostly on course grades; there is no language prerequisite. Application materials are translated and all of them, including the student’s written statement of interest, can be completed in other languages. CTE instructors report that even for very popular programs, students who complete all the application steps are generally accepted, even if their English language proficiency is in the foundational stage.
Admitted students spend up to half of their school day in CTE courses beginning in their 10th grade year, with instructors who are typically not highly experienced or trained in working with ELs. The specialized vocabulary involved can pose particular challenges, as described by one educator: “The teacher is doing a lot of Google Translate and handing out Google-translated slides of whatever she’s talking about that day. The CTE program is incredibly technical…I think the trend is a lot of people are translating these Tier 3 words into Spanish, expecting the kids to understand them.”
While some newcomers are able to navigate the CTE program effectively, others struggle, particularly with the written assessments required for certification. In some fields, that certification is vital in order to embark on a career: “They need to be competent in these frameworks in order to get the certificate from us at the end. And…if you don’t get that certificate at the end, it’s kind of like, what have you been doing the last two or three years? Has any of this really counted for you?”
CTE staff we interviewed offered several ideas for program modifications. The first is to admit newcomers to CTE only after they have acquired enough English to access the content, which would mean a longer timeline to program completion. Another possibility is to offer CTE courses that are co-taught by a technical instructor and a licensed ESL teacher. Finally, the state could modify its CTE frameworks to require less vocabulary and content, or to develop an alternate set of frameworks specifically for ELs. The idea of a different standard for newcomers is something CTE instructors already believe exists in terms of expectations: “That’s the worst part. Our administration has told us that the goal is not for these students to be certified, that we should soften our goals and they’re just there to get exposure.”
In addition to career/technical education, some districts offer newcomers access to alternative programs or stand-alone high schools. In Massachusetts, alternative education is defined as initiatives “to serve at-risk students whose needs are not being met in the traditional school setting.”22 The design of these programs varies widely, as does the target population. A few, such as the New Citizens Center in Worcester, are geared specifically toward newcomers, while others target older students who are working and need more flexible schedules.
Because so many newcomers are older when they arrive and face the obligation to work, alternative programs like these are a critical way for districts to adapt their existing offerings and accommodate this population’s unique challenges. Alternative programs or schools can offer academic credit for newcomers’ professional learning, smaller class sizes, and more personalized support (see case study for one example). Generally, their more flexible schedules and attendance requirements are likely a better fit for those who are working outside school and/or who are very far behind academically.
Unfortunately, the state’s data on these alternative programs are not comprehensive, so newcomers’ participation rate is unknown. In interviews, the issue of district resources came up repeatedly in relation to this topic. For example, in Framingham, the district began an Evening Academy in 2021 as an option for students who worked during the day. The program grew rapidly, according to administrators, and quickly became oversubscribed. A staff member shared in spring 2024: “The Evening Academy is now full. We have a long wait list for students who want to even participate, so we’re not even allowing them to come and do that…It’s horrible.”
There are many possible models, but this type of program innovation seems particularly well-matched to the needs and circumstances of many newcomers. Any efforts that can alleviate the burden of working and attending school at the same time carry promise for boosting newcomers’ school persistence and success. While administrative data are not currently of much utility in assessing the extent of alternative programs and newcomers’ access to them, examples from individual districts illuminate the potential value of these programs and underline the need for their expansion.
If they’re supporting themselves, they’re much more likely to not graduate because life gets in the way at a certain point. If you’re paying your own rent, paying your own utilities, and you have to work, the second you get out of school, you work ‘til midnight. Then every morning, you have to wake up and you have to go to school, and your teachers are asking you why you didn’t do your homework, or why you’re falling behind.
TRAVIS HARRIS Multilingual Learner Department Chair, Lynn Classical High School
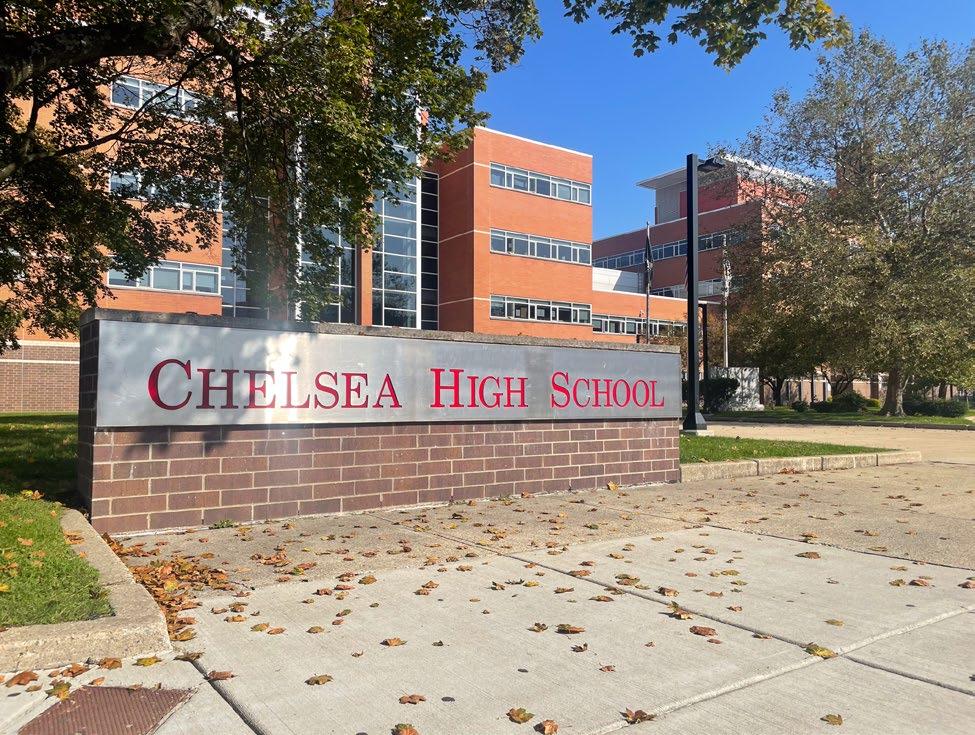
Our goal was: Give me a reason. Give me a reason you can’t come to school, and we’ll give you a solution to how we can make school happen for you.
RON SCHMIDT Founding Principal, Chelsea Opportunity Academy
Chelsea Opportunity Academy (COA) is a separate school for overage, under-credited students housed within the Chelsea High School building. Over 60% of the school’s students in 2023-24 were classified as English Learners, and 91% had a primary language other than English. Newcomers are not able to enroll in COA when they first arrive; the school recruits only those students who have dropped out already or who are failing out of Chelsea High School. Its minimum age for entering students is 17 years.
COA has altered the traditional high-school schedule and curriculum in almost every respect, in order to accommodate the needs of its students. According to the school’s founding director, Ron Schmidt, the vast majority of COA students are very behind in their academic skills, have a history of trauma (often associated with migration from Central America), and work many hours outside of school. COA is open year-round with flexible student schedules and no “seat time” requirements. Rather, the school designs courses that can be completed in six to eight weeks, based on six core competencies that encompass academic knowledge but stress skill development. ELs begin with English courses for multilingual learners and courses in science, math and history designed to promote language acquisition.

COA also offers work-to-credit opportunities, in which students complete work-based performance assessments to demonstrate the skills and knowledge they have learned through jobs outside of school. As a school leader explained:
“Anyone who’s working can take a course that is designed to leverage genuine learning in the workplace. So, I don’t care if you’re washing dishes or sweeping floors or a sous chef or landscaper…we find a space to really recognize learning and giving credit for that learning that has taken place outside of the school environment. And I’m not talking about sympathy credits here: ‘Oh, you poor thing, you have to work — write an essay about it.’ Not at all. It actually dives into depth, into our competencies and how those are used on the job.”
Finally, the school’s teaching staff work to engage individual students and support them as they process the trauma they’ve experienced and cope with the joint demands of working and attending school. One ELA teacher explained: “Everyone has a crew. So every morning we’re texting our crews, so kids are getting personalized text messages every morning: ‘Where are you? How are you doing? Are you coming in?’”
In this section, we have provided a broad survey of district policies and practices that affect newcomers. There are important differences across districts. One guiding question is the extent to which districts treat newcomers differently than other entering high-school students, including those who are ELs. In many respects, differences among districts stem in part from the degree to which educators are adapting their existing practices to reflect the unique circumstances and needs of newcomers.
For example, districts that invest in tracking down missing high-school transcripts, translating them where necessary, and awarding credit for prior coursework abroad may end up placing far fewer of their older newcomers in ninth grade. Other districts may elect to direct resources into TBE programs or stand-alone academies designed especially for newcomers. They may alter their CTE admissions timelines and requirements to open up access for newcomers, and/or they may design alternative programs and pathways that offer flexible schedules and competencybased curricula. The findings in this section demonstrate the breadth of possibilities for how districts can innovate and rework their existing policies and practices to better serve high-school newcomers.
When you get an influx of [Multilingual Learners], it really starts to illuminate gaps in your systems—whether that’s registration practices, instructional practices, family engagement, etc. The students themselves are not creating those gaps. It’s that the systems were never designed to fully support those students, and their arrival makes those gaps more visible and urgent to address, which can feel overwhelming for the system.
RANIA CALDWELL Director of Multilingual Learners, Woburn Public Schools


We now turn to newcomers’ educational outcomes and how they differ across districts. We focus primarily on two key outcomes: progress towards ELP and high-school graduation. Both of these are critical to newcomers’ prospects for higher education, economic advancement, and civic engagement.
Progress towards ELP is a critical measure for this population. Indeed, many interviewees identified learning English as the immediate goal of most newcomers and their families. As one staff member in Waltham shared, “I feel like the older students come in with an intense need to learn something that they can do now, like they want to learn English yesterday. Like, ‘give me it all right now [and] accelerate my English learning as fast as possible, because I just need to get out of here and go get a job.’”
Similarly, graduating from high school is perhaps the clearest indicator of newcomer “success.” One complicating factor is that the state-level requirements for graduation have changed frequently beginning with the graduating class of 2020 (see Policy Context sidebar and Figure 7), including in the aftermath of the 2024 ballot referendum on the MCAS. As a result, comparisons across school years in the high-school graduation rates of newcomers are difficult to interpret.
A question with potent implications for policy and practice is whether there are Massachusetts districts that are consistently more successful than other districts across both outcomes. These “pockets of success” could hold valuable lessons for other educators and administrators looking to better serve newcomers.
However, we find that districts in which newcomers make the most progress towards ELP are not necessarily those where newcomers graduate at the highest rates, even when we adjust for demographic differences in districts’ newcomer populations.23 Moreover, our estimates of the effectiveness of individual districts can change dramatically depending on which cohorts of newcomers are included. In assessing any district’s “success” with newcomers, then, in most cases the answer depends on the cohorts and outcomes selected.
An important exception to this is Boston, where newcomers have both higher graduation rates and make more progress towards ELP than the average for observationally similar newcomers. Boston is the largest school district in the state, with by far the largest number of newcomers. For that reason, we have more statistical power to evaluate its performance than we do for other districts in the state. For many other districts, estimates are not very precise, making it hard to tell whether they
appear to be particularly successful (or unsuccessful) just by chance.24
With this as context, we turn now to patterns in each of these two outcomes, which on average are quite low for newcomers across the state. Most strikingly, few newcomers ever reach proficiency in English during their time in a Massachusetts public high school, and graduation rates are much lower than those of peers in the same school.
While differences between districts are difficult to interpret, we can draw the broad conclusion that newcomers’ rate of English language acquisition as they progress through high school is slow on average, particularly for students who start at L1 and L2. This slower-than-expected progress is in line with research showing more rapid growth towards English language proficiency for those who arrive in early grades rather than in high school.25
In Massachusetts, the annual measure of that progress is whether students achieve their individual performance targets on the ACCESS assessment. In the school accountability system, high schools that serve ELs have 10% of their total points awarded based on these targets. The ultimate goal for individual newcomers, of course, is to meet the EL exit criteria by the time they graduate from
How high-school “success” is defined and measured for newcomers might differ in key respects from the rest of their peers. For example, attendance is a metric frequently used as a proxy for school engagement and for exposure to curriculum; in Massachusetts, the chronic absenteeism rate (defined as the percentage of students who miss 10 percent or more of their days in membership) factors into the school accountability system. However, for newcomers, and for some students in lower-income households more broadly, lower attendance may also reflect the necessity to care for family members or work outside of school, often for long hours and/or in jobs that overlap with the school day.
Another commonly used measure of high-school success is MCAS performance. However, many newcomers’ first attempt at the MCAS happens very early in their high-school careers, in some cases only days or weeks after they first arrive in the United States. As they adjust to their new schools, acquire more English, and take content-area classes, their academic knowledge and skills may show rapid growth that outpaces that of other student groups. Their initial MCAS scores, then, constitute a less accurate signal of their current performance and especially of their future potential.
Even college enrollment, clearly an important outcome for all high-school students, can be interpreted differently for some newcomers. According to many teachers working with them, newcomers’ stated goals are often to learn enough English and acquire the other skills to access higher-paying jobs as rapidly as possible. Particularly for those who are undocumented, the uncertainty of their futures in the U.S. may preclude college from being a viable pathway. We do not analyze college enrollment for newcomers due to a data issue we were unable to resolve in time for this report.
high school. Since the average newcomer spends about two and a half years in high school, their timeframe for attaining ELP is extremely short. Research has shown that the timeline to academic proficiency is generally four to seven years.26
Unfortunately, newcomers’ progress towards English proficiency is consistently low across districts. Very few newcomers attain full proficiency in English during their time in Massachusetts high schools; for example, only 15% of newcomers in the cohort expected to graduate in 2024 reached the exit criteria by the time they left high school.
Most of those who did (82%) had initially scored at a 3.0 or above, meaning they already possessed some knowledge of English when they arrived.
In other words, just 4% of newcomers who arrived at Level 1 or 2 ever reached English proficiency while in high school. This includes students who graduated — only 6% of high-school graduates who came as L1 or L2 newcomers achieved proficiency in English while in school, according
to the state’s exit criteria.27
Most newcomers miss their individual performance targets in their first full year of high school. In FIGURE 16, we present ACCESS growth for newcomers initially at L1 and L2 who tested in the three consecutive years from 2022-24. In all of these districts, the average first growth target for newcomers was a gain of more than one level, as shown by the dotted bars in each figure.28 But in no district did newcomers achieve that much growth in their first two years.
While progress is uniformly lower than the state’s expectation, Figure 16 does reveal that newcomers initially at L2 (right panel) make more progress on average than do those at L1. Statewide, we see that the former group grows almost half a level on average in their first full year of high school, while the latter group demonstrates only 0.30 levels of average growth. As noted earlier, this finding conflicts with prior research showing the largest gains for students at the lowest levels of initial ELP.
Newcomers at Level 2 make more progress on average than those at Level 1, but both groups improve much more slowly than the state’s expected rate.
FIGURE 16
Average Improvement in English Proficiency Among L1 (Left Panel) and L2 (Right Panel) Newcomers Who Took the ACCESS in 2022-2024 for Selected Large Districts
NOTES Sample includes only those newcomers who tested in three consecutive years. First growth target is the average amount of expected growth for newcomers at L1 or L2 in each district. Targets are calculated annually for each student, based on their current score and the number of years remaining until their expected graduation. Prior to the 2024 test, all entering newcomers (regardless of their highschool grade placement) were assumed to be in 8th grade for the purposes of the calculation.
Of course, English language acquisition is not the only goal for newcomers as they progress through high school. Building their content knowledge and skills, as outlined in the state’s curriculum frameworks, is critical as well — even more so for newcomers who arrive with large gaps in their prior education. However, measuring districts’ success in this endeavor using MCAS scores is problematic, given that the MCAS tests are administered so early in most newcomers’ high-school careers. As mentioned above, newcomers would be expected to make most of their progress after they first take these tests
One alternative is to look at newcomers’ course-taking as a proxy for their developing skills. Massachusetts currently has a recommended program of study, known as MassCore, that includes the following requirements: four units (each equivalent to a full year of study) of both ELA and math through Algebra II, three units each of lab-based science and history/social science, two units of the same world language, one unit of art, and five additional units.29
In TABLE 2, we present MassCore completion rates for newcomer high-school graduates in the cohorts of 2023 and 2024. Our main measure of MassCore completion relies on an indicator in the state’s administrative data, which is reported by districts for each graduating student. Our analysis of these data suggests that this indicator overstates completion (and probably does so substantially in some districts).30
We see MassCore completion rates in many, but not all, districts that are lower for newcomers than for other students. For example, about a third of newcomers in Waltham completed MassCore, compared to nearly 92% of non-newcomers. This suggests that newcomers in some districts are not accessing and completing the same breadth and depth of coursework, on average, as their non-newcomer peers. One potential explanation is the requirement for ELs to take 1-2 periods of ESL instruction, depending on their ACCESS level, which likely limits their ability to fit other courses into their schedules.
TABLE 2
MassCore Completion Rates Among Graduates in the Cohorts of 2023 and 2024
NOTES District-reported MassCore completion percentages are derived from SIMS data.
The introduction of a minimum statewide course-taking requirement, which has been proposed by the Statewide Graduation Council, could incentivize districts to accelerate newcomers’ access to rigorous gradelevel content. Such a development, if combined with the targeted supports necessary to support newcomers’ learning, could be a net positive for this group. However, if requirements do not allow sufficient time for ESL coursework to facilitate newcomers’ English language acquisition, or if newcomers are quickly pushed into mainstream courses without the supports they need, the impact could be more mixed or even negative.
Finally, the high-school graduation rate captures the percentage of newcomers who have satisfied state and local graduation requirements and received their diplomas. In TABLE 3, we show graduation rates by district and level of initial ELP for newcomers in the pooled cohorts of 2023 and 2024. (Note that MCAS graduation requirements changed across these cohorts; students in the 2023 cohort could demonstrate mastery in science via course completion rather than the MCAS, while their peers in the 2024 cohort who graduated in January 2025 or later had to fulfill no MCAS requirements.) The final column, which displays the graduation rate for non-newcomers in these districts, reveals a great deal of variation (from 66% in New Bedford to 91% in Quincy) across these urban areas.
Reading across the rows, we can compare graduation rates for newcomers at different initial levels of ELP within a given district and across the state. The relationship is as expected: newcomers entering at L1 are much less likely to graduate than their peers who arrive knowing more English. In districts like Framingham, Malden and Quincy, newcomers at L1 are over 40 percentage points less likely to graduate than their peers who arrive with marginally higher English proficiency. This difference is much smaller in districts like New Bedford and Springfield.
Reading down a single column of Table 3 enables the comparison of graduation rates for newcomers with the same initial level of ELP. For example, the graduation rate for L1s ranges from a low of 28% in Framingham to a high of 64% in Fall River, a difference of 36 percentage points. We see similar variation even when adjusting for newcomers’ demographic characteristics. For newcomers initially scoring at L2, the range is from 53% in Somerville to 88% in Fall River.
One potential explanation for this variation is differences in newcomers’ attendance. In districts with low attendance rates, we might expect newcomers to make less progress towards ELP and high-school graduation. However, we find that district-level attendance generally does not predict which districts have higher-than-average newcomer
So looking at why kids aren’t coming to school, is it because they don’t feel welcome and included in the school community? Is it because they’re working?...Is it because there are mental health challenges that are going on?...You know, kids need to work and send money back home. We just don’t have an answer for that. But a lot of times, there are things that we can do better.
EDUCATOR Woburn
outcomes. For example, in Boston, which does stand out strongly for both progress towards ELP and high-school graduation, newcomers have a lower-than-average adjusted attendance rate during their first year.
A couple of factors may explain why we do not see a clear relationship between attendance and later outcomes at the district level. First, while students need to be in school in order to learn, they also need to be fully engaged and paying attention — which is challenging for those who are working long hours in demanding jobs. Second, attendance may be measured inconsistently across districts in terms of how tardiness, leaving before the end of the school day, and absences for each class period are recorded. It may also be that the timing of absences matter, where a string of consecutive days missed might be more detrimental than a day missed every two weeks. For all of these reasons, it is difficult to evaluate the relationship between newcomers’ attendance and their later outcomes.
widely across districts, even for newcomers with the same level of initial English proficiency.
TABLE 3
High-School Graduation Rates for Newcomers in the 2023 and 2024 Cohorts, by District and Level of Initial English Proficiency
NOTES Graduates are those students who completed high school within a year of their expected graduation year. Newcomers sample includes only those who took the ACCESS test the year they arrived. Non-newcomers are all students in these cohorts who were not identified as newcomers in high school. * Cell size is 10 students or fewer.
The findings on newcomers’ outcomes raise many questions that are beyond the scope of our analyses. Why are these outcomes so low on average, and what might explain the differences that we see across districts? In interviews, many educators shared with us that work and family obligations contribute to the lack of progress towards ELP and academic skills mastery. According to Miguel Angelo Hernando Cupido, a biology teacher at Chelsea High School: “I teach them the year when they arrive, and some of them I teach the second year…they’re full of hope. They want to learn English, [they see] so many possibilities for this country. And then they discover they have to work 40 hours and come to school. And I don’t know how they do it.”
I think for a lot of the kids, if they are older, they’re coming to us…living these grown-up lives, these adult lives. Then they come here and we’re like, ‘Sit down, be quiet. No, you can’t go to the bathroom, you have three minutes to get to class.’
DEIDRE COLLINS
Former Coordinator, Multilingual Learner Education/Bridge Academy, Chelsea High School
Work obligations can conflict with the schedule and the rules on student tardiness and absences in most traditional high schools. Newcomers who shoulder enormous responsibilities outside of school may struggle to attend consistently, particularly the first and last classes of the day. When they do attend, they may be too exhausted to engage with course content or even stay awake. According to one educator in Waltham, “One of the kids…works constantly. She’s working at night. She’ll come in, and the Health Assisting teacher reports that she sleeps through her entire class, and it’s like, how do we deal with that? How do we help her?”
Moreover, they “are not necessarily treated as adults” when they do come to school, with restrictions on their movements and even where they sit in classrooms and the cafeteria. For newcomers who are responsible for supporting themselves and their families, the rules in a typical high school may feel infantilizing and disrespectful.
In addition to work pressures, another important barrier to high-school completion is that some newcomers have been exposed to trauma in their home countries, during their journeys to the U.S., and in their experiences with the immigration system. Once they arrive, some newcomers experience housing and food insecurity as they live alone or with distant relatives who can provide little in the way of welcome or support. Those who are unauthorized entrants to the U.S. may lower their educational expectations and prioritize work over pursuing high-school and college credentials they perceive as unattainable.31
Students who are grappling with mental health challenges can easily conclude that school is not worth the struggle and begin missing classes, a pattern that often culminates in dropping out. A staff member in Framingham talked about how this manifests: “So a lot of discouragement, a lot of low self-esteem. You know, these kids, obviously, a lot of them have trauma histories, and it’s just school math classes are like the last thing they want to do.”
One critical aspect of serving newcomers well, then, is providing socioemotional supports for them and their families. According to a social worker at Chelsea High School: “[O]ur teachers are very good about communicating with us when they’re seeing that something is off in the classroom, and that can look like attendance, that can look like avoidance, that can look like disruptive behavior…[W]e are very comfortable making, setting up meetings with students, other teachers, students, parents, outside agencies — whatever it takes for the student to be successful, we’re pretty much willing to do.”
Given the imperative to work for many newcomers, it seems rational for them to persist in school only if the benefits are clear. But, as we documented above, progress towards ELP is slow for newcomers on average, and in some districts, those entering at L1 gain less than 0.2 levels on the ACCESS test in a year. In conversations with school and district educators, three potential points related to instructional challenges emerged: teacher recruitment, teacher capacity, and access to grade-level content.
First, district administrators recognize the benefits of hiring bilingual staff from a variety of backgrounds to work with newcomers and other ELs. According to an administrator in Waltham, “We do try to hire bilingual staff because not only do they have the language support, but they have empathy and understanding of how to teach the content and the language. We try to hire BIPOC staff members because students are on our hiring committees, and they have a voice in who they want to hire.”
However, some districts struggle to fill open jobs, particularly as the number of newcomers has risen so steeply. Dr. Almudena G. Abeyta, Chelsea Public Schools Superintendent, said, “But the problem is, I post for ESL teachers and supports, and we have no applicants. I have jobs that have not been filled. We can’t find people to fill them.”
Second, teacher capacity and knowledge of how to provide appropriate instructional supports may be lacking, particularly for content-area teachers without much experience with this population. These educators must possess an SEI endorsement, which can be earned in one of three ways: through their initial licensure program, by passing an SEI Massachusetts Test for Educator Licensure (MTEL), or by completing a stand-alone SEI course. The latter consists of at least 45 hours of direct instruction on
required teaching strategies and topics, plus a field-based component in which the educator practices the strategies with students in a K-12 classroom.32 However, this training seemed insufficient to one educator working with two L1 newcomers in a mainstream class: “A word wall, graphic organizers, all of the things that we learned in our SEI courses…all of those things that we have been taught to do is not enough for these students.”
If you rewind only two years ago, not all of our courses for our emergent bilinguals were grade-level courses, and now they are. That had to be step one of making sure that the educational pathways were more equitable and more supported for success.
LYNN ROSEDALE
Former Assistant Director of Multilingual Education, Framingham Public Schools
A staff member in Waltham described, “Our teachers in content areas are…either overestimating or underestimating our students. So what I find is I’ll go into a lot of classes, and either they’ll have the New York Times out with beginners, and they’ll say, like, ‘You read this article,’ and they’re like, ‘I don’t know any words in this article.’ ‘Oh, just underline all the words you know.’ Or I’ll go in, and it’s too simple. They only have a photo. There’s no text. And they’re trying to teach about the French Revolution from one photo, and there’s no text to accompany it.”
Finally, research shows that many newcomers may not have access to rigorous high-school coursework.33 For instance, students arriving with large gaps in their prior education may not be enrolled in grade-level courses like Algebra I right away, or even for years. For example, in a spring 2024 conversation, a Waltham staff member said, “In our school, when newcomers come in, they do testing for the math placement. We have something called Newcomers Math…which is basically numeracy. Then we have a transitional math class... They don’t take Algebra I…if you’re a newcomer coming in and you need to take Foundations, you don’t get [Algebra I] ‘til your junior year.”
Similarly, in Woburn, course-taking in English Language Arts used to be restricted for many newcomers, although this is no longer the case. In spring 2024, an administrator shared: “The tricky part is that they’re not enrolled in ELA unless they meet a Level 3 on the ACCESS assessment. So there are kids here who are graduating high school who have never had access to an English Language Arts course.”
More broadly, leaders in certain districts discussed the need for newcomers to access grade-level content and feel like they are making progress in meeting high-school standards. According to one administrator in Chelsea: “How do we raise the rigor in classrooms and make
learning relevant so that the kids will want to come to school? Because that makes a difference, too. Kids at this age, newcomers or not, they want to learn and desire to learn. And if we’re not teaching at high levels, then they will check out.”
Newcomers face substantial challenges in making progress towards ELP and graduating from high school. While there is variation in these two key outcomes across districts, newcomers consistently show average annual growth on the ACCESS test that is far below the state’s expectations. Moreover, in the majority of large destination districts for newcomers, less than 50% of L1s go on to graduate. Even after adjusting for demographic differences in district newcomer populations, we see little relationship between these two outcomes — a district with higher-than-average performance on one outcome frequently has lower-thanaverage performance on the other, and these patterns change sharply from year to year for individual districts. In gauging how well a particular district is serving newcomers, then, it is important to consider both outcomes and look across multiple school years.


But education... is failing this population in the state, in the country. We don’t have an education that fits. We haven’t changed anything — we are expecting that they can learn in the same way that students learned 25 years ago, when they need a different schedule, they need different resources... We need to become more creative if we want to make changes in our community, because our communities are newcomers — that’s what it is becoming now. We are hoping that [newcomers] change, that they look for resources instead of education being changed for them.
EDUCATOR
Newcomers are a heterogeneous and ever-changing group of students in Massachusetts public high schools. In the aftermath of the pandemic, there were huge increases in newcomer enrollments and notable changes in where newcomers came from. Now, immigration restrictions and enforcement are driving further changes. Newcomers constitute an important group in Massachusetts public schools; one in 12 new students in the state’s high schools (one in six in urban high schools) in 2023-24 was a newcomer. Yet many newcomers struggle to complete graduation requirements, and few attain English proficiency during their time in the state’s public education system.
Here, we identify several main themes from our analyses of high-school newcomers and explore the implications for state policies and district practices.
For high-school newcomers in Massachusetts, the landscape is characterized by both geographic concentration and dispersion.
While districts like Boston, Lynn, Lawrence, and Brockton serve the largest populations, the vast majority of Massachusetts districts now serve some high-school newcomers. This pattern, which is similar to that identified in a few other states,34 underscores two important roles for the state. One is to provide guidance on enrolling and instructing newcomers, including the awarding of credits based on foreign transcripts and on work-based learning. Districts that only recently began to serve newcomers are in particular need of such guidance. The other is to develop and strengthen district networks that facilitate opportunities for district leaders and educators to share experiences and best practices for the newcomer population.
Many districts in Massachusetts are serving growing numbers of newcomers (at least until early 2025), often with rapid changes in newcomer profiles.
These shifts create serious instructional challenges. Districts must respond immediately to their students, but fixed budget cycles and facilities constraints make it difficult to do so effectively. In our conversations, educators identified staffing as the most important factor inhibiting the necessary rapid response. The recruitment of qualified staff also affects districts’ ability to roll out or expand research-based programs like TBE and dual-language programs at the high-school level. Targeted funding streams and staffing pipelines for high-school bilingual and ESL teachers in the main newcomer languages could help to address these resource challenges.
We identified substantial variation in how districts work with older newcomers.
For example, even after adjusting for demographic differences, newcomers who were at least 16 years of age when they arrived are much more likely to be placed in 9th grade in some districts than in others. Given that older students make up half of all newcomers in Massachusetts high schools, districts must consider the needs of this subgroup. Opportunities for virtual learning and evening classes in some districts are helping newcomers make academic progress while fulfilling demanding work obligations. Alternative schools or programs with more flexible class schedules and competency-based curricula, increased access to and support with CTE pathways, and credits awarded based on these students’ learning and skills developed through paying jobs are all potentially
promising innovations. One role for the state could be to support evaluations of these initiatives and disseminate information about those that proved effective in supporting newcomers’ English language development and academic skills.
District educators described a key tension concerning priorities in serving newcomers.
Many newcomers and their families place the most emphasis on learning English, and English proficiency confers enormous benefits in terms of college and career opportunities. However, many educators contend that comprehensive high schools are organized around a different goal, that of mastering the content set out in the Massachusetts curriculum frameworks. Both objectives are clearly critical, and both deserve sustained focus from all educators within a high school. But ESL instruction is often the purview of a single department, while other teachers focus on content areas like American history, geometry, and chemistry. The limited training provided to SEI-endorsed teachers means that the scaffolding and instructional supports necessary for newcomers to develop their English skills and master course content may be missing.
Sometimes I’ll hear it, you know, ‘Why am I even here? I could be working double hours, working the morning shift and then the night shift at the restaurant. I can do it 80 hours a week. I could send more money home, I could be making more money. What’s the point?’ I feel like we can do a better job on that and helping show the students, like, ‘Here’s the point, here’s why you’re in school.’
CHLOE ARDON
Former ESL Teacher, Woburn High School
In line with federal requirements, the state’s school accountability system weights students’ proficiency on the standardized MCAS tests more heavily than English language growth. So in this respect, state policy implicitly incentivizes content knowledge over developing English language skills.35 Additionally, the state’s current practice is to calculate gains in English proficiency by averaging across all ELs, which may mask the progress rate of newcomers specifically. Instead, Massachusetts could report progress towards ELP by EL subgroups (e.g., long-term ELs, high-school newcomers) to capture differences within this heterogeneous group of students.
Massachusetts and other states confront a range of suboptimal policy options relating to graduation requirements for high-school newcomers, given that many arrive academically behind but older than most entering high-schoolers and do not speak English proficiently.
The first, and probably least realistic, option is the acceleration of newcomers to meet the same standard as other students, but in less time. While there are certainly older newcomers who accumulate credits quickly enough to graduate “on time,” learning English and high-school academic content on a compressed timeline is very challenging. Such rapid acceleration is particularly infeasible for those struggling with work obligations, learning gaps from interruptions in their schooling, and unprocessed trauma.
A second option is to grant newcomers more time to achieve the same standard as other students. This idea was embraced by CTE teachers in Waltham. One of them shared, “The Level 1s — I just don’t see it as possible. It’s not because I don’t want to teach them. It’s not because they can’t do it.
You’re asking them to do it in a timeline that’s not even realistic.” Another CTE teacher said: “I would say, if there was one thing that we could get from the state to support these students, it would be two or three more years.” However, this additional time may not be attractive to most newcomers, many of whom need to enter the workforce to support themselves and their families. This is particularly true for newcomers who are older when they arrive. For a great many newcomers who are at least 16 years of age when they enter a Massachusetts high school, spending even four to five years in high school is an unreasonable expectation.
A final possibility is to adopt a different standard for newcomers. An example of this is the competency-based curricula of alternative schools like the Chelsea Opportunity Academy, where course credits can be earned through demonstrations of professional learning and skill and graduation requirements look very different than in most traditional high schools. Returning to the example of Waltham, where newcomers arriving at L1 have struggled with the current content and structure of the CTE program, teachers mentioned the idea of modified CTE frameworks for ELs, perhaps with less complex vocabulary. The problem with this approach is that newcomers may graduate without the knowledge and skills required to access promising career pathways and/or succeed in higher education.
Given the challenges with any of these options, the state should closely examine how graduation requirements for students and accountability policies for districts affect newcomers and the educators who serve them. It is important to design graduation requirements that encourage newcomers to stay in school and learn critical skills, as well as accountability policies that attract skilled educators to districts serving large numbers of newcomers and incentivize districts to increase both the English language proficiency and academic knowledge and skills of newcomers.
Massachusetts school districts have been struggling with various challenges in the aftermath of the pandemic — persistent learning deficits, flagging attendance, and cuts in federal aid, to name a few. Many districts with large populations of newcomers are now experiencing enrollment declines driven in part by new restrictions on immigration. While we are living through a time of rapid change and growing uncertainty for Massachusetts school districts, one thing is likely to remain true: Thousands of current and former newcomers are now and will continue to be a structurally important part of the state’s educational and economic future. They bring with them valuable language skills that are often in high demand and can eventually help fill labor-market shortages in fields requiring bilingual staff, such as education, health care, and social services.
Focusing on newcomers’ assets and histories, rather than their educational learning deficits, is important to welcoming them into school communities, fostering connections with teachers, and supporting their educational aspirations and sense of belonging. For example, in Chelsea, many educators spoke of knowing every student by their “name, strength and story.” Serving newcomers well, to their benefit and to the Commonwealth’s, requires widespread recognition that newcomers are critical members of the student population and that in the future, they will be an important part of the state’s workforce and its civic life.
1 For a recent summary of this research, see https://www.brookings.edu/articles/how-immigrationenforcement-is-harming-us-schools-and-students/; also Camp, A., Acosta, J., Haire, J., & Tesfa, E. (2026). Immigration Enforcement Actions and Empty Desks: Persistent and Acute Attendance Effects. (EdWorkingPaper: 26-1453). https://doi.org/10.26300/bz9z-w627
2 Ouellette, J. (n.d.). Administration plans to close all remaining hotel shelters this summer. Massachusetts Municipal Association. https://www.mma.org/administration-plans-to-close-all-remaining-hotel-sheltersthis-summer/
3 See https://www.migrationpolicy.org/article/trump-2-immigration-1st-year and https://seis.ucla.edu/news/ the-fear-is-everywhere/ for recent changes to immigration policies.
4 Thompson, K.D., Umansky, I.M., & Porter, L. (2020). Examining contexts of reception for newcomer students. Leadership and Policy in Schools, 19:1, 10-35. https://doi.org/10.1080/15700763.2020.1712732
5 Doan, S., Morales, S. E., Ozek, U., & Schwartz, H. (2024). Educational spillover effects of new English learners in a new destination state. Educational Evaluation and Policy Analysis, 47(4), 1163-1178. https://doi.org/10.3102/01623737241282412; Morales, C. (2022). Do refugee students affect the academic achievement of peers? Evidence from a large urban school district. Economics of Education Review, 89, 102283. https://doi.org/10.1016/j.econedurev.2022.102283
6 For more on these patterns during and after the pandemic, see Oliveira, G. (2025). Now we are here: Family migration, children’s education, and dreams for a better life. Stanford University Press.
7 Given recent changes in federal immigration policy and enforcement, patterns in overall newcomer numbers and demographics are likely undergoing further transformative shifts that are not yet apparent in the state data available at the time of publication.
8 As noted in our first report, many newcomers reported as Spanish speakers in state data may have a different home language, including the indigenous Mayan languages spoken in parts of Central America. The code for “Mayan” was assigned to 24 newcomers in 2024-25, including 22 in New Bedford; there are no SIMS codes for particular Mayan languages like K’iche’, Kaqchikel, or Mam.
9 Many students in this group are Spanish speakers classified as newcomers under the SIMS “arrival” data element (the indicator for students in their first year of U.S. schooling) but not as immigrants, so their country of origin appears in the data as the United States. Newcomers from Puerto Rico are in this category, since U.S. territories are excluded from the federal definition of “immigrant.” Other students included in this group are those born in the U.S. who then moved and attended school in another country.
10 The World Bank, UNICEF, UNESCO. (2022). Two years after: Saving a generation. https://www.unicef.org/ lac/en/reports/two-years-after-saving-a-generation
11 Scale scores on the ACCESS test are typically used to measure growth because proficiency levels are gradespecific. A student scoring at exactly the same ACCESS level from one grade to the next has demonstrated more command of English language knowledge and skills. However, as in prior work, our focus here is on whether newcomers are making progress towards the exit criteria by meeting the state’s annual performance targets, so we report overall levels.
12 See, for example, Slama, R. B. (2012). A longitudinal analysis of academic English proficiency outcomes for adolescent English language learners in the United States. Journal of Educational Psychology, 104(2), 265. https://doi.org/10.1037/a0025861; Sahakyan, N., & Cook, H. G. (2014). Examining district-level growth using ACCESS for ELLs. Wisconsin Center for Education Research. https://wida.wisc.edu/sites/default/files/ resource/Research-Report-Examining-District-Level-Growth-Using-ACCESS.pdf
13 We calculate each district’s total number of students who were enrolled in high school in any of the three data collections in 2024; this number is the denominator for the percentage reported on the X-axis of the figure.
14 Massachusetts Department of Elementary and Secondary Education. (2026, January). Guidance on English learner education services and programming, p. 20. https://www.doe.mass.edu/ele/guidance/
15 Only 2% of newcomers entering by early March experienced a change in grade placement during their first year of high school, according to SIMS enrollment data.
16 Collier, V. P., & Thomas, W. P. (2017). Validating the power of bilingual schooling: Thirty-two years of largescale, longitudinal research. Annual Review of Applied Linguistics, 37, 203-217. https://doi.org/10.1017/ S0267190517000034
17 Massachusetts Department of Elementary and Secondary Education. (2026, June 12). Transitional bilingual education programs https://www.doe.mass.edu/ele/programs/tbe.html
18 Valentino, R.A., & Reardon, S.F. (2015). Effectiveness of four instructional programs designed to serve English learners: Variation by ethnicity and initial English proficiency. Educational Evaluation and Policy Analysis, 37(4), 612-637. https://doi.org/10.3102/0162373715573310; see also Mavrogordato, M., Barlett, C., Callahan, R., DeMatthews, D. & Izquierdo, E. (2024). Supports for multilingual students who are classified as English learners. EdResearch for Action, Annenberg Institute. https://edresearchforaction.org/wp-content/uploads/55010-Supportsfor-Students-Classified-as-EL-15-R39-1.pdf
19 What Works Clearinghouse. (2022). Dual language programs intervention report | English language arts topic area. National Center for Education Evaluation and Regional Assistance, Institute of Education Sciences, U.S. Department of Education. https://ies.ed.gov/ncee/WWC/Docs/InterventionReports/WWC_DLP_IR-Report.pdf
20 See p. 8 of Sattin-Bajaj, C., & Strom, A. (2024). Promoting school success for immigrant-origin students. EdResearch for Action, Annenberg Institute. https://edresearchforaction.org/wp-content/uploads/Promoting-School-Success-1.pdf
21 From https://profiles.doe.mass.edu/statereport/PathwaysProgramsEnrollmentbyGrade.aspx. This enrollment figure includes students enrolled in Chapter-74 CTE pathways, not those in After Dark or Non-Chapter 74 pathways or programs.
22 Massachusetts Department of Elementary and Secondary Education. (2018, March 26). About alternative education https://www.doe.mass.edu/alted/about.html?section=definition
23 Of course, we are able to adjust only for the limited set of attributes for which we have data. For example, our data lack an accurate measure of newcomers’ family income (see Data We Use). It could well be that newcomers from higher-income households have better outcomes because they are under less pressure to work and supplement the family’s resources. To the extent that these newcomers are more concentrated in some districts than others, we would expect to see differences in outcomes that have little to do with district effectiveness. Other variables for which we cannot adjust are students’ SLIFE status and prior education, as well as their immigration status.
24 One strategy to increase statistical power is to pool additional years of newcomers for a larger sample. We elected not to do that, given that earlier cohorts were so strongly impacted by the pandemic.
25 Umansky, I., Thompson, K., Soland, J., & Kibler, A. (2022). Understanding newcomer students’ English language proficiency development: Comparisons and predictors. Bilingual Research Journal, 45(2), 180-204. https://doi.org/10.1080/15235882.2022.2111618
26 Hakuta, K., Butler, Y.G., & Witt, D. (2000). How long does it take English Learners to attain proficiency? The University of California Linguistic Minority Research Institute Policy Report 2000-1. https://escholarship.org/ uc/item/13w7m06g; Thompson, K. D. (2017). English Learners’ Time to Reclassification: An Analysis. Educational Policy, 31(3): 330–63. https://doi.org/10.1177/0895904815598394
27 A major part of the story about L1 progress towards ELP relates to their persistence in school. In some districts, for example, half of these newcomers exit before reaching 12th grade. -
28 Beginning with the 2024 ACCESS test, DESE changed its method for calculating growth targets, resulting in major changes to the average amount of expected growth. For example, the average first-year growth target for an L1 newcomer first testing in 2022 was 1.23 levels of improvement; for similar students initially testing in 2024, the average target was 0.63 levels of growth.
29 Massachusetts Department of Elementary and Secondary Education. (2026, February 2). MassCore https://www.doe.mass.edu/ccte/courses-learning/masscore/default.html
30 An alternative measure of MassCore completion is based on calculations of each student’s course history in the state’s Student Course Schedule (SCS) data. Because this dataset does not include summer school coursework or credits earned via most credit recovery programs, this measure should also be interpreted with caution. As we have reported elsewhere, the divergence between these two measures of MassCore completion is very wide in many districts. But using either measure, we see the same general pattern of newcomers completing MassCore at lower rates than non-newcomers.
31 Perreira, K.M. & Spees, L. (2015). Foiled aspirations: The influence of unauthorized status on the educational expectations of Latino immigrant youth. Population Research and Policy Review, 34, 641–664. https://doi.org/10.1007/s11113-015-9356-y
32 Massachusetts Department of Elementary and Secondary Education. (2024, August). Stand-alone SEI endorsement course requirements. https://www.doe.mass.edu/edprep/resources/guidelines-advisories/sei-standalone-requirement.pdf
33 Sattin-Bajaj, C. & Strom, A. (2024). Promoting school success for immigrant-origin students. EdResearch for Action, Annenberg Institute. https://edresearchforaction.org/wp-content/uploads/Promoting-School-Success-1.pdf
34 Thompson, K.D., Umansky, I.M. & Porter, L. (2020). Examining contexts of reception for newcomer students. Leadership and Policy in Schools, 19:1, 10-35. https://doi.org/10.1080/15700763.2020.1712732
35 Heilig, J. V. (2011). Understanding the interaction between high-stakes graduation tests and English learners. Teachers College Record, 113(12), 2633-2669. https://doi.org/10.1177/016146811111301209; Menken, K. (2006). Teaching to the test: How No Child Left Behind impacts language policy, curriculum, and instruction for English language learners. Bilingual Research Journal, 30(2), 521-546. https://doi.org/10.1080/15235882.2006.10162888