The Cape Peninsula University of Technology (CPUT) is the largest higher education institution in the Western Cape. This vibrant, multi-campus entity is the academic partner of choice for more than 35,000 culturally diverse students across its six faculties focused on Applied Sciences, Business and Management Sciences, Education, Informatics and Design, Engineering and the Built Environment, and Health and Wellness Sciences.
The second largest university of technology in South Africa, CPUT positions itself as a smart university, shaping the future of higher education on the African continent and beyond. Our Strategic Plan, Vision 2030, was influenced by 4IR, AI, and a proliferation of education technological developments and opportunities, as well as the National Development Plan and the United Nations’ adopted Sustainable Development Goals. It is geared towards building One Smart CPUT – with the focus on “oneness” and “smartness”.
CPUT Vision 2030: Seven focus areas:
• Smart ITC environment and ITC workforce;
• Smart Teaching and Learning and Learning Environments;
• Smart RTIP that is relevant and excellent in its knowledge production;
• Smart Human Capital and Talent;
• Smart Internationalisation;
• Smart engagement and strong links with quintuple helix partners; and
• Smart student engagement and learning experiences.
General Information
Registered address
Cape Peninsula University of Technology
PO Box 1906
Bellville, 7535
Tel. +27 (0)21 959 6911
Physical address
Cape Peninsula University of Technology
Administration Building, Symphony Way Bellville South, 7530
Website address www.cput.ac.za
Bankers ABSA
Auditors
External auditors
Deloitte & Touche
The Ridge, 6 Marina Road
Portswood District, V&A Waterfront
Cape Town, 8000
Tel. +27 (0)21 427 5300
Internal auditors
BDO Advisory Services (Pty) Ltd
6th Floor, 119–123 Hertzog Boulevard, Foreshore
Cape Town, 8001
PO Box 2275
Cape Town, 8000
Tel. +27 (0)21 417 8800
www.bdo.co.za
Attorneys
Adriaans Attorneys
17th Floor, 2 Long Street
Cape Town, 8001
Tel. +27 (0)21 801 5240
Bisset Boehmke McBlain
4th Floor, 45 Buitengracht Street
Cape Town, 8001
Tel. +27 (0)21 441 9800
Cheadle Thompson & Haysom Incorporated
Ground Floor, Kildare House,
The Oval 1 Oakdale Road
Newlands, 7700
Tel: +27 (0)21 418 2278
Fairbridges Wertheim Becker
22nd Floor, Portside Building
5 Buitengracht Street
Cape Town, 8001
Tel. +27 (0)21 405 7300
GSR Law
155 Campground Road
Newlands, 7700
Tel. +27 (0)21 702 7763
Mcaciso Stansfield Attorneys (MS Inc)
26 Rocklands Ave, Vredehoek, Cape Town, 8001
Tel: +27 (0)62 732 1339
Mlambo and Associates
152 Bryanston Drive Bryanston Johannesburg, 2191
Tel: 010 502 0626
Norton Rose Fulbright Incorporated
9th Floor, 117 on Strand 117 Strand Street
Cape Town, 8001
Tel. +27 (0)21 405 1200
List of Figures
Figure 5. At the graduation ceremony held on 9 April 2025, Prof Anthony
Figure
Figure 7.
Figure 8.
Figure 10. FAS total student headcount enrolments by department, 2023–2025
Figure 11. FAS UG pass rates, 2021–2025
Figure 12. FAS UG pass rates by department, 2021–2025
Figure 13. FAS throughput rates in minimum time, 2021–2025
Figure
Figure
Figure 17. FAS total number of permanent academic staff with doctoral qualification, 2021–2025
Figure 18.
Figure 19.
Figure 21. FBMS UG pass
Figure
Figure
Figure
Figure
Figure
Figure
Figure
Figure 53. FHWS total number of permanent academic staff with doctoral qualification, 2021–2025
Figure 54. FID total student headcount enrolments, 2023–2025
Figure 55. FID total student headcount enrolments by department, 2023–2025 ......................................................................
Figure
Figure
Figure 60. FID total number of graduates, 2021–2025
Figure 61. FID total number of graduates by department, 2021–2025
Figure 62. FID total number of permanent academic staff with doctoral qualification, 2021–2025
Figure
Figure 64.
Figure 65.
Figure
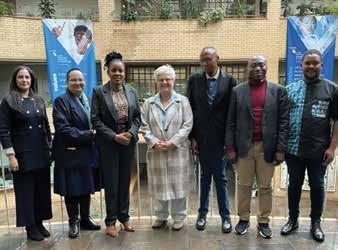
Figure 67. Visiting Delegation from the Open University of Tanzania
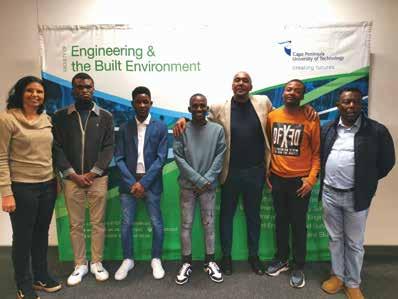
Figure 68. CPUT participation at the 2025 Innovation Bootcamp
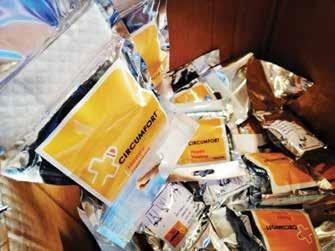
Figure 69. Institutional Innovation: Circumfort medical device
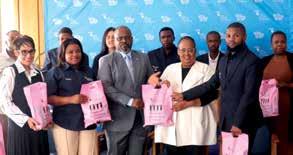
Figure 70. CPUT student co-winners in the Youth Entrepreneurship Programme
Figure
Figure 72.
Figure 73.
Figure
Figure 75. Labour relations costs Q4, 2024 to Q4, 2025
Figure 76. The Objectives of the Audit and Risk Oversight Committee
Figure 77. Internal audits 2025
Figure 78. Pillars of the CPUT Vision 2030 Sustainable Development Strategy
Figure
Figure 80.
List of Tables
Table
Table
Table
Table
Table
Table
Table
Table
Section One: Institutuional Governance
1.1 Institutional Governance
1.1.1 Report of the Chairperson of Council
The 2025 academic year at the Cape Peninsula University of Technology (CPUT) demonstrated continued progress in good governance, as well as in learning, teaching, and research, guided by the Vision 2030 Strategic Plan. Central to this progress was a strong focus on student success, digital transformation, and equitable access to quality higher education.
A total of 219,637 first-year undergraduate (UG) applications were received, with overall enrolments reaching 38,228 students. This comprised 35,063 undergraduates (91,7%), 3,113 postgraduates (PG) (8,1%), and 52 occasional students (0,1%). Postgraduate enrolments consisted of 1,858 of Advanced Diplomas, PG Diplomas and Honours (i.e. PG < Master’s) (59,7%), 856 Master’s (27,5%) and 399 Doctoral (12,8%) student enrolments. The recorded growth in enrolments aligns with the University’s strategy to strengthen participation in science, engineering, and technology (SET).
To meet the rising demand for teaching, learning, and research spaces, CPUT continued to expand its infrastructure. In 2025, student accommodation capacity was recorded at 16,200 beds.
Programme renewal and development remained a priority, ensuring alignment with the Higher Education Qualifications Sub-framework (HEQSF). In 2025, five new qualifications were accredited by the Council on Higher Education (CHE), while four qualifications were registered on the National Qualifications Framework (NQF) with the South African Qualifications Authority (SAQA).
CPUT produced a total of 9,857 graduates in 2025, representing a 17,7% increase compared to 2024. Of these graduates, 8,623 were UG (87,5%) and 1,234 PG (12,5%). At PG level, the PG Diplomas and Honours qualifications accounted for the majority (1,076) of PG graduates, followed by Master’s (102), and Doctoral graduates (56). This growth reflects the University’s commitment to contributing to South Africa’s critical skills base.
Several graduate placement and employment initiatives were undertaken in 2025, resulting in 8,868 student placements, with an additional 631 students completing project-based Work-Integrated Learning (WIL), bringing the total to 9,499. Employment outcomes for graduates conferred in December 2023 and April 2024 recorded an employment rate of 41,7%. While many graduates achieved positive outcomes, 35,2% pursued further studies, and 23,0% faced challenges in entering the labour market.
CPUT continued to play a vital role in supporting student development, adjustment, mental health, and wellness. In 2025, individual counselling and therapeutic support was provided to students, which addressed a wide range of psychological, psychiatric, and psychosocial challenges faced by students.
Staff well-being remained a priority, supported through a range of initiatives. A comprehensive action plan was rolled out in 2025, which included targeted campaigns designed to enhance employees’ physical, emotional, and mental health.
On the research front, CPUT achieved notable progress in 2025. The University recorded 22 postdoctoral research fellows, while provisional research output data reflected improved performance, at 400.4 research output units. Moreover, the number of nGAP staff recorded in 2025 was 29, which is in line with our strategy of developing our own future academics.
The number of National Research Foundation (NRF)-rated researchers rose to 70, and the Institution secured more than R28 million in competitive external funding from the NRF and other funding agencies.
National and international partnerships continued to mature, strategically advancing Vision 2030, strengthening research focus areas, and supporting the sustainability of key research chairs. The international portfolio expanded collaborations across Africa, BRICS, and the Global North, with a deliberate focus on equitable, mutually beneficial partnerships aligned with Vision 2030’s global engagement priorities.
In conclusion, the 2025 Annual Report underscores the significant progress achieved in advancing the Vision 2030 strategic priorities, reflecting the University’s commitment to transformation, excellence, and sustainable growth.
Chairperson of Council
Dr LF Platzky
1.2 Council Statement on Governance
1.2.1
Statement on Governance
The Council of the Cape Peninsula University of Technology (CPUT) (herein after referred to as “the Council”) is regulated in terms of the provisions in the Higher Education Act, 1997 (Act No. 101 of 1997) and the CPUT Statute (Government Gazette No. 46382, Notice No. 1039 of 20 May 2022).
“The Council governs the University subject to the Higher Education Act and the Statute and has general control of its affairs and functions and has fiduciary responsibilities to the University and must promote and act in the best interest of the University.”
The Council subscribes to good governance practices and principles that are imperative to the success of the University, and to protect and advance the interests of the staff and students (Fig. 1). Through the exercise of ethical and effective leadership, it aims to achieve the following governance outcomes, as contemplated in the King IV report.
Figure 1: The governance outcomes to which Council subscribes
The Higher Education Act, the CPUT Statute, and the regulations made in terms thereof, set out the objects and powers of the Council, and contain specific provisions relating to the composition, powers and functioning of the Council, Senate, committees, faculty boards, Institutional Forum, Student Representative Council, and Convocation.
1.2.2 Council and Committees of Council
1.2.2.1 Council
The Council shall assume ultimate accountability for the performance and affairs of the University and shall in so doing effectively represent and promote the interests of the stakeholders. Council shall refrain from becoming involved with operational matters of the University, which matters are dealt with by Management, led by the Vice-Chancellor and Principal, who retains the responsibility of the day-to-day operational running of the University, for which s/he will account fully to the Council.
The Council must exercise control and remain accountable through effective leadership, enterprise, integrity, and good judgment in directing the University to achieve continuing sustainability and prosperity.
Composition of the Council
The University shall have a unitary Council, which is the highest decision-making authority in the University
Only candidates who are in good standing, and who have sufficient time to effectively fulfill the role of a Council member will be considered for appointment to the Council.
A member of Council must:
• Be a person with knowledge and experience relevant to the objectives and governance of the University;
• Participate in the deliberations in the best interest of the University; and
• Have no conflict of interest with the University.
At least 60% of the members of Council must be external/ non-executive members. The demographics of South Africa, including gender, race, youth, and disability, shall be considered in relation to the composition of the Council.
The offices of the Chairperson of the Council and the Vice-Chancellor and Principal shall be separate. There shall at all times be a clearly defined division of responsibilities in both offices to ensure a balance of authority and power.
Figure 2: The composition of the CPUT Council
The members of the Council shall be expected to:
• Act in good faith and in the best interest of the University;
• Take reasonably diligent steps to become informed about matters for decision;
• Acquire a working knowledge and understanding of the University’s business, and the laws, regulations, and customs (if any) that govern the activities of the business;
• Have the ability to make sound business decisions and recommendations;
• Continuously develop their competence to lead effectively;
• Exercise judgment independently; and
• Exercise stewardship at all times, and uphold the highest degree of ethics in all forms of conduct.
The appointment procedure adopted by the Council for appointments to Council shall be formal and transparent.
Council members shall monitor the social responsibilities of the Council, and promulgate policies consistent with the University’s legitimate interests and good business practices, and in so doing shall:
Promote fair and equitable employment practices
Be sensitive and conscious to gender interests and concerns
Promote and be sensitive to the preservation and protection of the natural environment
Promote and protect the rights of vulnerable groups; enhance and promote the rights and participation of communities they serve
Promote quality student educational life
The Chairperson, in consultation with the Secretary of Council, will draw up an annual calendar of meetings, with an outline of the cyclical business to be considered at each meeting, and to present this for approval by the full Council. The list of Council and Council committee meetings, including the composition of each committee, length of service of each member, as well as their respective attendance at those meetings, is included on the subsequent sections.
Clause 34 of the CPUT Statute provides that:
(3) The Council may delegate or assign certain of its powers and functions to:
(a) a committee;
(b) a member of Council; or
(c) any office bearer of CPUT – except those functions specified in sub-paragraph (5).
(5) The Council may not delegate or assign any of the following powers and functions:
(a ) The appointment of the vice-chancellor or of any deputy vice-chancellor;
(b) The approval of the annual operating and capital expenditure budgets;
(c) The adoption of the annual financial statements and annual report;
(d) The determination of the fees to be paid by students;
(e) The making, approval, or amendment of the Statute;
(f) The approval of a loan or an overdraft, as contemplated in Clause 34.6.1.2 of the Statute;
(g) The decision to embark on the construction of a permanent building or other immovable infrastructural development, as contemplated in Clause 34.6.1.2 of the Statute;
(h) The purchase of immovable property, or entering into a long-term lease of immovable property, as contemplated in Clause 34.6.1.3 of the Statute; or
(i) The establishment or disestablishment of faculties or departments.
In addition, the Council may not delegate:
i) The appointment of the internal and external auditors;
ii) The approval of the annual audited, consolidated financial statements of the University on the recommendation of the Finance Committee and the Audit and Risk Oversight Committee of Council;
iii) The adoption of the Institutional Operating Plan, and the consolidated annual budget;
iv) The remuneration of any member of the Executive Management;
v) The adoption of any mechanism and/or process to monitor the performance of any member of the Executive Management;
vi) The conclusion of contracts involving real rights in immovable property;
vii) Any variation in borrowing powers of CPUT; and
viii) Approval of all financial policies.
1.2.2.2 Council Committees
The Council is authorised to establish committees (Fig. 3), in which Council members shall play an important role to assist it in the execution of its duties, powers, and authorities. The Council may appoint persons who are not members of Council to those committees. Council shall delegate to each of the committees established, such authority as is required to enable those committees the ability to fulfil their respective functions.
Each committee shall have formal terms of reference, which shall be approved by the Council.
Figure 3: Committees of Council
Executive Committee of Council (EXCO) Governance and Ethics Committee (GEC) Audit and Risk Oversight Committee (AROC) of Council Finance Committee (FinCom) of Council Human Resources Committee of Council (HRCC) Physical Planning Committee (PPC) of Council Student Services Committee (SSC)
Technology Governance Committee (ITGC) of Council Remuneration Committee (RemCo) Council
Responsibilities of the Committees of Council
The information below provides an outline of the roles and responsibilities of each of the committees of Council, as well as the matters dealt with and discharged by such committee, during the year under review:
Executive Committee of Council (EXCO)
EXCO is established in terms of Clause 46, read with Clause 47 of the CPUT Statute.
Composition
Chairperson of Council (Chair of the Committee)
Deputy Chairperson of Council Chairpersons of Council committees Vice-Chancellor (ex officio)
Key focus areas
• Support the Council in the governance of the University;
• Conduct matters, generally deemed to be of an urgent nature, as is necessary between meetings of Council;
• Conduct specific matters, and with such authority, as is delegated to it by the Council;
• Consider the Council Committee reports to integrate, aggregate, and streamline the Committee reports for the benefit of Council;
• Prepare overall short- to long-term planning, policy, and direction of the University; and
• Monitor the overall performance of the University
Governance and Ethics Committee (GEC)
The GEC is a standing committee of Council, and as such, reports to Council on all matters relating to governance and ethics policies, practices, processes, and guidelines.
Composition
3 External members of Council
2 External committee members
1 Internal member of Council Vice-Chancellor (ex officio)
Key focus areas
• Governance;
• Council and Council committee membership;
• Council Code of Conduct and Conflict of Interest;
• Training and development;
• Social and ethics;
• Advancement, marketing and communication; and
• Compliance.
Audit and Risk Oversight Committee (AROC) of Council
AROC is responsible for matters relating to audit and risk oversight, and makes recommendations to Council on these matters.
Composition
2 External members of Council
2 External committee members
Key focus areas
• Internal and External Audit;
• Risk management oversight and internal controls;
• IT governance;
• Fraud and litigation; and
• Compliance with laws and regulations.
Finance Committee (FinCom) of Council
The Committee ensures acceptable financial accounting systems, financial and investment performance, strategic commercial activities, long-term infrastructure development, and financial sustainability.
Composition
3 External members of Council
2 External committee members
1 Internal member of Council Vice-Chancellor (ex officio)
Key focus areas
• Financial systems and procedures;
• Investment management;
• Remuneration Strategy;
• Asset management;
• Financial analytical skills; and
• Procurement and supply chain.
Human Resources Committee of Council
The Committee advises Council on human resource and related matters; monitors and evaluates the implementation of the HR Strategy, policies and practices; and ensures the University adopts a strategic human resource management approach, that is aligned to its business strategy.
Composition
3 External members of Council
2 External committee members
1 Internal member of Council Vice-Chancellor (ex officio)
Physical Planning Committee (PPC) of Council
Key focus areas
• Human Capital administration;
• Organisational strategy;
• Talent management;
• Leadership development; and
• Employment relations (labour).
The PPC advises Council on the matching of its physical assets and associated service delivery objectives in support of the goals and priorities of the University’s strategic and operational plans in the areas of research, learning and teaching, international collaboration, and community engagement.
Composition
External members of Council
2 External committee members
1 Internal member of Council Vice-Chancellor (ex officio)
Student Services Committee
Key focus areas
• Property and infrastructure investment;
• Project planning;
• Risk management/ protection services;
• Property and infrastructure development; and
• Resource management and planning.
The Student Services Committee advises Council on policy in respect of student services, monitors and oversees the provision of non-academic services to students, and monitors the promotion of a safe, conducive, and academically stimulating life and learning environment.
Composition
3 External members of Council
2 External committee members
2 Internal members of Council Vice-Chancellor (ex officio)
Key focus areas
• Student governance;
• Project planning;
• Sports management; and
• Student wellness.
Information Technology Governance Committee (ITGC) of Council
The ITGC ensures governance of the University strategic asset of IT and its related risks. It ensures IT sustains and extends the University’s strategies and objectives. ITGC also ensures an effective IT governance framework to enable the organisation to deliver value from IT, whilst optimising value for money, and managing risk.
Composition
3 External members of Council
2 External committee members
1 Internal member of Council Vice-Chancellor (ex officio)
1 External IT specialist
Remuneration Committee (RemCo)
Key focus areas
• IT governance;
• IT technology;
• IT compliance and IT risk;
• Project management; and
• IT legal framework.
RemCo ensures fair and responsible remuneration of senior managers, payment of honoraria and other incidental expenses to Council members, and monitors and evaluates the implementation of the remuneration policies and practices.
Composition
3 External members of Council
2 External committee members
Key focus areas
• Remuneration and Benefits Strategy;
• Financial systems and procedures;
• General human resources and project management;
• Financial analytical skills; and
• Business environment knowledge.
1.2.2.3 Statement of Conflict Management
Council has not mandated any specific Committee to deal with conflict management and resolution within the University. Council previously decided to source external independent mediators or arbitrators, through a Council-approved process, whenever there was a need to resolve any dispute, or manage conflict that threatens the governance, management, and operations of the University; as well as to manage and resolve disputes arising within the University in a constructive, transparent, fair, and effective way for all involved. All matters referred to the Council for consideration must go through the internal due processes and channels first, and should be group-specific matters, i.e., not individual cases. The decision or resolutions of the Committee would be final, and would be tabled at Council for information in a summary form.
Code of Conduct for Council and Members of Council
The Code of Conduct for Council and Members of Council guides Council in its workings, as well as the conduct of individual Council members as they carry out their duties.
The purpose of the Code is not intended to inhibit the actions of a member of Council, but to ensure that where there is a conflict between any such actions and the best interests of the University, the interests of the University will take precedence. It furthermore provides a member of Council with a set of principles as to what is regarded as appropriate conduct by a Council member in performing their functions and duties.
This Code should be seen as a means of ensuring self-regulation by a member of Council, and as an instrument for taking action with regard to inappropriate conduct on the part of a member of Council.
In exercising their powers and performing their functions, Council members must at all times:
i. Serve the interests of the University and its staff, students and the public at large with the highest degree of integrity, objectivity, equity, fairness and ethics, as befitting persons appointed to such office;
ii. Enhance the public image of the University, as well as interpret the community to the University; and
iii. Support the Vice-Chancellor in his or her fulfillment of objectives and policies of the Council.
The following are some of the fundamental principles covered in the Code:
• Democratic governance;
• Accountability;
• Transparency;
• Respect for the rights of others;
• Objectivity;
• Cooperative governance;
• Collective responsibility;
• Fiduciary responsibility;
• Confidentiality;
• Independence and integrity; and
• Respect for the privacy of the personal affairs of members of Council.
Conflict of interest: Policy, principles, and rules application to Council members
Council approved a Conflict of Interest Policy that applies to all Council and Council committee members, that regulates the declaration of conflict of interest by Council members, concerning potential and real conflicts of interest, in the conduct of University affairs.
List of Council Members including Meeting Attendance: 2025
Members of Council
Ministerial Appointees
Convocation Representatives
Council Appointees
Platzky, Laurine Falconer (Dr)* Ministerial Appointee 1 October 2022 – 30 September 2026
Gumbi, Dumisani (Mr)* Council Appointee 1 October 2022 – 30 September 2026
Dondashe, Nomveliso (Ms)* 1 October 2022 – 30 September 2026
Mapena, William Lekgoa (Dr) 1 October 2022 – 30 September 2026
Maharaj, Suren (Mr) 1 October 2022 – 30 September 2026
Faku, Sindile (Mr)* 1 October 2022 – 30 September 2026
Socikwa, Lwandile (Mr) 20 February 2023 – 20 September 2025 (term expired)
Mapukata, Issa (Mr) With effect from 22 September 2025 –30 September 2026
Groenewald, Liezl Marie (Dr)* 1 October 2022 – 30 September 2026
Vabaza-Mvandaba, Ayanda (Ms) 1 October 2022 – 30 September 2026
Matiwane, Saziso (Mr)* 1 October 2022 – 30 September 2026
Organised Labour Representative Fisa, Sonwabile (Mr) 1 December 2023 – 30 September 2026
Western Cape Premier Appointee
City of Cape Town Appointee
Schreuder, Brian Kenneth (Mr) 1 October 2022 – 30 September 2026
McMahon, Ian Patrick (Cllr) 27 September 2024 – 30 September 2026
Business Representative Cullinan, Patrick Matthew (Mr) 1 October 2022 – 30 September 2026
Ngqondi, Tembisa (Prof) 11 December 2024 – 30 September 2026
Raji, Atanda Kamoru (Prof) 1 October 2022 – 30 September 2026
Krishnamurthy, Senthil (Dr) 30 October 2023 – 30 September 2026
Non-Academic Employee Representatives Mashwanyela, Chumani (Mr) 1 October 2022 – 30 September 2026
Student Representative Committee Representatives
Saki, Pelo (Mr)
Masonganye, Thato (Mr)
Gela, Liyabulela (Mr)
Bangiso, Ababalwe (Mr)
Related to term as SRC President
Related to term as SRC Secretary
Related to term as SRC President
Related to term as SRC Secretary
Executive Management in Attendance Prof M Sheldon (Deputy Vice-Chancellor: Research, Technology Innovation and Partnerships)
Dr PP Masala (Registrar & Secretary of Council)
Mr M Daca (Executive Director: Finance)
Ms N Tyolwana (Dean of Students)
Prof HR Hay-Swemmer (Executive Director: Office of the Vice-Chancellor & Deputy Vice-Chancellor: Operations – Acting)
* The Council member is serving a second term of office
1.2.2.5 Executive Management Team
Council Chairperson Dr LF Platzky
Registrar Dr PP Masala
Executive Director: Office of the VC Prof H Hay-Swemmer
Vice-Chancellor (VC) Prof NS Nhlapo
Executive Director: Finance Mr M Daca
Chairperson of Council Registrar Dr LF Platzky Dr PP Masala
DVC: Operations Vacant DVC: Learning & Teaching Prof R Balkaran DVC: RTIP Prof M Sheldon
Figure 4. Executive Management Team
1.3 Institutional Forum Report
The Institutional Forum (IF) remains a vital statutory pillar of cooperative governance at the Cape Peninsula University of Technology (CPUT). Throughout 2025, the Forum successfully fulfilled its mandate to deliberate on and advise the Council regarding governance, transformation, and inclusive stakeholder engagement. In accordance with the Higher Education Act No. 101 of 1997, the IF provided oversight and advice to the University Council on issues, ranging from senior appointments to the implementation of the University’s transformation agenda.
The four key advisory areas to the Council are focused on the following pillars:
Governance
The CPUT Statute –Proposed amendments
Senior Appointments
On 8 December 2025, the IF witnessed the installation of the 3rd Chancellor, Prof Brian Figaji. The role of IF is to advise the Council and foster transparency, which remains essential. The Chancellor’s leadership will enable greater aspirations for CPUT, particularly in embodying our value system and ethical leadership.
During a Special IF Meeting, held online on 5 November 2025, the IF, through the presentation by the Registrar, Dr Phumzile Masala, made amendments to several clauses of the CPUT Statute to ensure that the purpose or objective of the Statute and governance of the University are clearly articulated. The IF made comments, including the recommendations that were reported by the Registrar to the Council.
A Special IF Meeting was held online on 5 November 2025, for the consideration of the Human Capital (HC) submission for the recommendations of senior appointments for the Deputy Vice-Chancellor: Operations.
The report on the outcome of the recommendations was submitted to HC. The IF applauds HC for providing a comprehensive and insightful presentation based on the interview process conducted for senior appointments.
Transformation Through the Office of the Registrar and Director: Centre for Diversity, Inclusivity and Social Change, the IF held a hybrid (physical and online) Workshop on 9 October 2025. Two guest speakers were invited to present on transformation, including Dr Ruby-Ann Levendal from Nelson Mandela University (NMU). She has worked in the Higher Education sector for nearly 30 years, first as an academic, and since 2007, as Director of Transformation. The second speaker was Dr Sianne Alves from the University of Cape Town (UCT). Alves is currently the Chair of the Universities South Africa (USAf) Transformation Forum, and the Director of the Office for Inclusivity & Change, which provides disability services, survivor support, restorative justice programmes, capacity-building, and culture-change approaches that seek to reduce oppression and inequality. The two speakers provided insight into how the IF is formed and managed, and into its role within higher education, as well as its responsibilities. They provided a deep understanding, fostering an inspiring and encouraging atmosphere, as participants exchanged ideas and engaged in meaningful dialogue. They generously shared their knowledge and lived experiences in an IF capacity, with the goal of future collaborations to enhance the programme.
Discussion of the formation of the South African Universities
Chairs
Institutional Forum (SAUCIF)
On 8 October 2025, the CPUT IF Chair participated in an online IF Chairs meeting with the Central University of Technology (CUT), Durban University of Technology (DUT), Nelson Mandela University (NMU), and Walter Sisulu University (WSU). The purpose of the meeting was the establishment of a national institutional forums structure. The Chairs agreed to write a formal request to the Department of Higher Education and Training (DHET) and Universities South Africa (USAf) for formal status, given the lack of a centralised platform, and the inability to engage effectively on critical institutional matters. The IF is a statutory body essential to the sector's governance and transformation.
• The meeting was to identify the Correct Authority: Who is the designated official responsible for the IF within the national higher education framework?
• Formal Requirements: What are the specific criteria required to move from an ad-hoc task team to a recognised national structure, like the established Registrars’ Forum?
• Administrative Support: How can the task team (i.e., IF Chairpersons from the mentioned/ copied institutions) be empowered with the necessary information/data to initiate the formal process?
To build on this momentum and address identified operational gaps, the IF has committed to the following strategic priorities for the 2026 academic year:
• Governance and Leadership: The IF will formalise the election of a Deputy Chairperson. This appointment is intended to streamline leadership, ensure continuity, and facilitate more proactive engagement with both the University Council and Executive Management regarding strategic planning.
• Capacity Building and Induction: A primary focus will be placed on deepening the transformation discourse through comprehensive stakeholder workshops. This includes a dedicated induction programme for all new members to ensure full mastery of the Higher Education Act, the University Statute, and the Terms of Reference.
• Operational Efficiency: To mitigate previous challenges regarding quorum and meeting attendance, the Forum will implement a more robust scheduling framework, and member-empowerment workshops designed to emphasise the statutory importance of consistent participation.
• Strengthening its Internal Capacity and Advisory Functions: The IF reaffirms its commitment to fostering a transparent, transformed, and well-governed institutional climate.
Chairperson: Institutional Forum
Dr C Matasane
1.4 Convocation Report
Convocation is a statutory body that exists in terms of Clauses 68 to 74 of the University Statute, as amended. Convocation is the largest constituency that plays a vital role in the life of a university, and is accountable to its own members, as well as to the university Council.
At its annual general meeting on 20 September 2025, the Convocation elected its leadership for a period of three years, which runs from 20 September 2025 to 20 September 2028. On 13 October 2025, the newly elected Convocation delivered words of support/ condolences, and participated in wreath laying during the CPUT Remembrance Day 2025. On 16 October 2025, Convocation honoured the invitation to attend the CPUT Corporate Golf Day 2025, at Kuilsriver Golf Club.
Convocation held its induction session of the newly elected Convocation Executive Committee members on 8 November 2025. The former President of Convocation was present for handover purposes; and the Advancement & Alumni Unit were in attendance to explain the role of the Unit and its relationship with Convocation. The Chairperson of Council shared the expectation of Council, and its relationship with Convocation. The induction was also honoured by the Vice-Chancellor, who shared the CPUT Vision 2030 Strategic Plan. The Convocation Executive also received a presentation from the Deputy Registrar on university structures, governance, and administration.
Our first ordinary Convocation Executive Committee meeting followed after the induction was concluded. It focused on identifying five focus areas that the Convocation Executive will focus on during this three-year term. Focus areas included Student Development and Community Engagement; Convocation Branding; Fundraising; Partnerships Collaboration and Engagement; Governance and Leadership; as well as the Transformation Agenda.
On 3 December 2025, Convocation was invited to participate in the Student Representative Council (SRC) induction process as a way of student development and leadership capacitation of the newly elected SRC.
On 10 December 2025, Convocation participated in the installation of the Chancellor of the Cape Peninsula University of Technology, Prof Brian Figaji. The President of Convocation delivered a speech on behalf of Convocation during the installation process. The following day, Convocation participated at the Summer Graduation 2025. The President of Convocation recorded a video congratulating all 2025 graduates, which was played before the graduation session started.
Governance
Convocation is represented in Council and other university structures, such as the Institutional Forum (IF), Naming Committee, Dome of Remembrance Committee, and Council Committee on Senior Appointments (CCSA). Convocation is also invited as an observer in the Honorary Degree Award Committee (HDAC).
Convocation President
Mr I Mapukata
1.5 Student Representative Council (SRC) Report
SRC Membership for 2024/25 Term of Office
The SRC members who were in office in 2025 (i.e. 2024/25 term of office) are presented in Table 1.
Office
CENTRAL SRC Pelo Saki
Ayabulela Mbiza
Candidate
Bogosi Thato Masonganye
Aphiwe Mbele
Luvuyo Ricky Ngwenya
Anathi Pamana
Lungelo Mnguni
Ntembeko Petse
BELLVILLE LSRC Monwabisi Kula
Afika Manjati
Sinoyolo Nkilani
Onela Ndaliso
Siyabonga Emmanuel Gumede
Onke Theo Lengisi
Asonge Maqu
Inga Mnciva
DISTRICT SIX LSRC Ayanda Mtyekwana
Anganathi Mxhegwana
Indiphile Jack
Siphesihle Vellem
Enoch Wongalethu Koli
Siphiwe Chauque
Yanga Mlata
Sinelizwi Monica Ncamazana
WELLINGTON LSRC Aphiwe Qashani
Olwethu Macheba
Nothando Buthelezi
Ayanda Xozwa
Koketso Mohubedu
Kwanda Nxumalo
Onele Mashukuca
Lingelihle Macanyana
MOWBRAY LSRC Ntanda Mrhasi
Khanya Dabula
Zimasa Euginia Dumbisa
Athenkosi Lukuko
Lwazi Mbuku
Nasiphi Waki
Sikelela Balsio
Asiphe Vilo
Table 1. SRC membership for 2024/25 term of office
Portfolio
President
Deputy President
Secretary-General
Treasurer-General
Education and Transformation Officer
International Relations Officer
Student Support Services Officer
Central Housing Committee Officer
Chairperson
Deputy Chairperson
Secretary
Treasurer
LHC and Welfare Officer
Sports, Arts and Culture Officer
Local International Relations Officer
Gender and Diversity Officer
Chairperson
Deputy Chairperson
Secretary
Treasurer
LHC and Welfare Officer
Sports, Arts and Culture Officer
Local International Relations Officer
Gender and Diversity Officer
Chairperson
Deputy Chairperson
Secretary
Treasurer
LHC and Welfare Officer
Sports, Arts and Culture Officer
Local International Relations Officer
Gender and Diversity Officer
Chairperson
Deputy Chairperson
Secretary
Treasurer
LHC and Welfare Officer
Sports, Arts and Culture Officer
Local International Relations Officer
Gender and Diversity Officer
SRC engagements with Executive and Management Committees in 2025
The SRC EXCO (Central SRC members and Chairpersons of Local SRCs) had standing meetings with Management, as follows:
• Quarterly meetings with Executive and Management Committee; and
• Quarterly meetings with the Division of Student Affairs (DSA) Management.
Key Achievements in 2025
Below is a detailed reflection of achievements accomplished collectively and individually within the Secretariat:
• Strengthening Governance Representation: Ensured consistent participation at all Council and Council Committee meetings; improved preparation by circulating agendas and briefing CSRC representatives prior to meetings; influenced key discussions on student fees, funding delays, and residence allocations; administrative improvements; standardised minute-taking and recordkeeping; established clearer communication processes with the Dean of Students Office; archived CSRC resolutions and meeting records for continuity.
• Enhancing Communication: Issued well-structured statements on major institutional developments; coordinated unified messaging during high-pressure periods; improved turnaround times for internal communication.
• Student Advocacy and Engagement: Amplified issues related to NSFAS, academic concessions, registration delays, and residence shortages; ensured these issues were submitted to Council and Student Services Committee for oversight.
• Transformation and Inclusion: Actively participated in Institutional Forum discussions on employment equity and representation; contributed to debates on the institutional culture, and inclusivity standards.
• Strengthening Team Functionality: Advocated for stronger discipline, attendance, and accountability within the CSRC; mediated conflicts, and maintained internal stability during difficult periods.
Key Strategic Deliverables Achieved in 2025
Below is a detailed reflection of achievements accomplished collectively and individually within the Secretariat:
Key strategic deliverables included the following:
• Finalisation and Council-approved Student Governance Finance Policy, which is aimed at regularising student levies;
• Amendment of the SRC Constitution to include Student Parliament;
• Promotion of sexual reproductive rights through the distribution of sanitary dignity packs to students; and
• Participation in the finalisation of the Sexual and Gender-Based Violence (SGBV) and Guidelines and Protocols for SGBV.
Challenges Faced During the Term 2024/25
• Inconsistent engagement from some student structures: Coordination across multiple campuses proved difficult due to inconsistent availability or responsiveness from some leaders.
o Impact: Delayed decision-making, and strained communication channels.
• Institutional delays in responses: Urgent student matters, such as accommodation, funding, and registration sometimes lacked timely responses.
o Impact: Frustration among students, and increased pressure on CSRC communication.
• High student expectations vs limited resources: Students often expect immediate solutions, while many issues involve complex administrative processes beyond CSRC control.
• Secretariat workload: The SG portfolio requires extensive drafting, administration, and coordination, often beyond normal working hours.
o Impact: High workload and personal pressure.
• Internal CSRC dynamics: As with any leadership collective, political differences and personality clashes sometimes affected cohesion.
o Impact: Meetings occasionally became contentious, requiring mediation and neutrality from the SG.
• Reflections on working with Management: Interactions with Management were generally professional and constructive.
Key reflections on Management
• Management listens, but sometimes with caution; firm but respectful engagement is necessary.
• Formalising communication through written documentation strengthens accountability.
• Students’ concerns are taken seriously when presented with clarity, evidence, and unity; stronger collaboration between DSA and the CSRC is needed.
• Overall, maintaining composure, clarity, and preparation significantly improves the relationship.
SRC Elections
KDBS Consulting (Pty) Ltd was appointed as the Independent Electoral Agency (IEA) for the 2025/26 SRC elections, operating under the leadership of the Chief Electoral Officer (CEO), and in line with the Service Level Agreement executed on 23 September 2025. The appointment followed several years of partnership between CPUT and KDBS, with each cycle contributing lessons intended to strengthen institutional electoral governance.
Outcome of 2025/26 Election Results
Table 2 presents the 2025/26 SRC election results.
Office
CENTRAL SRC
Candidate
Liyabulela Gela
Membathisi Tumelo Ndzimande
Ababalwe Bangiso
Ayola Ntlabeni
Noxolo Khupe Jele
Enathi Mbonjwe
Siphelele Ntuli
Lutho Mphithi
BELLVILLE LSRC Tshepisho Sebego
Snenhlanhla Thandeka Dube
Elizabeth Motlhatlhana
Kungako Msuthu
Lungelo Mosia
Sakhele Lakhithika
Tsumbedzo Ramagadana
Rethabile Thabitha Ramaila
DISTRICT SIX LSRC Ulibo Tshomela
Aluta Petse
Nontuthuko Noluthando Mathe
Thimna Lamati
Ayabonga Gwambi
Buhle Sizwe Mbutuma
Zimvo Damane
Simamkele Milla Booi
WELLINGTON LSRC Aphiwe Qashani
Mihle Tololo
Nontando Buthelezi
Phindile Nkumane
Lingelihle Macanyana
Thabisa Mazwi
Ntando Feleka
Tsepiso Majola
MOWBRAY LSRC Selekane Monaone
Khutjo Khoza
Lilitha Shumane
Ongeziwe Dlula
Siyahluma Npengesi
Mvuzo Maki
Chumani Ndeleni
Nosiphiwo Sodinga
Table 2. CPUT 2025/26 SRC elections – Final constituted results
Portfolio
President
Deputy President
Secretary-General
Treasurer-General
Education and Transformation Officer
International Relations Officer
Student Support Services Officer
CHC & Welfare Officer
Chairperson
Deputy Chairperson
Secretary
Treasurer
LHC and Welfare Officer
Sports, Arts and Culture Officer
Local International Relations Officer
Gender and Diversity Officer
Chairperson
Deputy Chairperson
Secretary
Treasurer
LHC and Welfare Officer
Sports, Arts and Culture Officer
Local International Relations Officer
Gender and Diversity Officer
Chairperson
Deputy Chairperson
Secretary
Treasurer
LHC and Welfare Officer
Sports, Arts and Culture Officer
Local International Relations Officer
Gender and Diversity Officer
Chairperson
Deputy Chairperson
Secretary
Treasurer
LHC and Welfare Officer
Sports, Arts and Culture Officer
Local International Relations Officer
Gender and Diversity Officer
Conclusion
Serving as the Secretary-General of the CSRC for the 2024/25 term has been an honour and a responsibility that demanded dedication, resilience, and strategic clarity. It has shaped my leadership, broadened my understanding of governance, and deepened my commitment to student development. I trust this report will guide the next SG toward a stronger, more efficient, and more accountable Secretariat. May the incoming leadership continue to advance student interests with integrity and courage.
Secretary-General, CSRC
Mr T Masonganye
Approved by the Dean of Students:
Ms N Tyolwana
Section Two: Registrar’s Report
The Registrar’s Division is pivotal in providing essential strategic support services at the Cape Peninsula University of Technology (CPUT), in line with the CPUT Vision 2030 strategic objectives. Its core functions ensure the efficient administration of academic processes, institutional governance, legal advisory services, and records management, all of which contribute to the University's overall success.
2.1 Institutional Governance and Legal Services
As Secretary to the Council and other governance structures, the Registrar continued to provide guidance and advisory support in 2025, to promote adherence to sound governance principles, such as accountability, transparency, participation, responsiveness, and efficiency, while advancing ethical conduct and integrity within the University community and beyond.
The Legal Services Department, within the Registrar’s Division, provided legal advisory services to University Management, academic, and support departments, and, where required, to the Council and its committees. The Department also delivered litigation support, and conducted contract vetting, thereby ensuring legal compliance and effective institutional risk management.
2.2 Academic Administration
Academic Administration serves as a key enabler in managing the student’s academic life cycle, from admission to graduation. The Division successfully implemented an online application system, achieving nearly 100% electronic submissions. The total number of applications received from first-year undergraduate applicants has grown significantly from 166,794 in 2023 to 219,637 in 2025 (Table 3).
Table 3. Total number of first-year undergraduate applications received, 2023–2025
In 2025, graduation ceremonies were held in both summer and autumn, with a total of 8,083 qualifications conferred, alongside 294 higher certificates, bringing the overall total to 8,377 qualifications awarded (cohort which completed in 2024).
In addition, Prof Anthony Staak was awarded an Honorary Doctorate in Electrical Engineering during the ceremony held on 9 April 2025 (Fig. 5). The degree, conferred by the Faculty of Engineering and the Built Environment (FEBE), recognised Prof Staak’s long-standing service to the University, and his significant contributions to higher education. This honour acknowledges his leadership, commitment to learning, and lasting impact within the field of engineering education.
5. At the graduation ceremony held on 9 April 2025, Prof Anthony Staak was awarded an Honorary Doctorate
Registrar
Dr PP Masala
Figure
Section Three: Senate Report to Council
3.1 Learning and Teaching Achievements
The 2025 academic year reflected sustained strengthening of learning and teaching at CPUT, guided by the Vision 2030 Strategic Plan, and an explicit emphasis on student success, digital transformation, and equitable access to quality higher education. Throughout the year, faculties demonstrated academic stability, steadily improving pass rates, and an enhanced culture of evidence-informed academic decision-making.
3.1.1 Significant Developments in Teaching and Learning
Modes of Delivery and Curriculum Delivery Stability
Throughout 2025, teaching and assessment were delivered primarily face-to-face, with blended practices used strategically to support continuity, engagement, and flexible learning pathways. Faculty approaches reflected disciplinary requirements and professional practice contexts; clinical and laboratory-based programmes largely remained campus- and site-based, while blended modalities were used to strengthen transitions, supplement contact teaching, and support students during disruption recovery.
Some of the examples under this theme included the hybrid and delayed orientation responses in the first half of the year, with faculties adapting onboarding processes using a mix of online and face-toface engagements and updated guides. Secondly, the targeted catch-up plans and additional contact sessions following campus closures, prioritising high-impact modules, ensured curriculum coverage and readiness for assessment. Finally, the blended support for teaching practice programmes, including structured placements and support mechanisms for student teachers, aided transitioning back to campus-based learning.
Technology-Enhanced Learning and Assessment Integrity
Technology-enhanced learning expanded in depth and sophistication. Capacity development focused on the effective use of the Learning Management System (LMS), including Blackboard Ultra, secure online assessment design, and practical instructional-design support. Enhanced digital support aligned to academic quality imperatives incorporating meaningful feedback, assessment literacy, and tools that protect academic integrity in blended and remote contexts.
Examples of capability-building and tool-supported practice included:
• Multi-level Blackboard Ultra training (basic to advanced) supporting subject customisation, content management, group work, assignments, and grade-centre management;
• Online assessment security workshops introducing tools and approaches for secure assessment delivery, including similarity interpretation and academic integrity protocols;
• Specialised test design and publishing workflows using Respondus and Blackboard assessment tools, strengthening quality and efficiency; and
• Workshops on generative AI as an instructional design assistant and AI design assistant tools that can accelerate the generation of learning modules, rubrics, and question banks, with emphasis on customisation and alignment to learning outcomes.
AI Literacy, Ethical Use and Emerging Academic Practice
Generative AI was addressed as both a pedagogical opportunity and an academic integrity risk. Throughout the year, staff development increasingly focused on ethical and responsible AI use in teaching, learning and assessment, supported by institutional dialogue, guidelines development, and faculty-level initiatives. This approach recognised AI’s growing influence on curriculum design, assessment practices, pedagogical judgment, and student support.
Some of the examples under this theme included:
• Faculty-level projects to integrate AI tools within Blackboard, and plan for AI-informed teaching and assessment practices;
• Institution-wide dialogues and forums featuring sector expertise on cultivating critical AI capabilities in higher education;
• Structured AI certification and skills pathways (including Microsoft-endorsed AI programmes) to build staff capacity and confidence; and
• Workshop-based approaches positioning generative AI as an instructional design assistant (prompting techniques, coursedesign scaffolding, and learning-material generation).
3.1.2 Access and Limitations on Course Participation
While institutional enrolment remained strong, the year was shaped by constraints that affected access and participation for specific cohorts and courses. These constraints were addressed through mitigation strategies to protect curriculum coverage, learning continuity, and progression.
Key constraints and responses included:
• Early-year disruptions and student protests led to delayed or adapted orientation, and required rapid recovery measures, and communication via digital platforms;
• Financial barriers continued to affect student participation, particularly in postgraduate enrolments and work-integrated learning placements;
• Work-integrated learning constraints linked to reduced stipends and hybrid workplace supervision required alternative approaches, such as simulated WIL projects in some programmes; and
• Accreditation and professional-body process timelines affected the sequencing and readiness of new qualifications for future rollout.
3.1.3 Student Success and Innovation Achievements
Student success work increasingly functioned as an integrated ecosystem across faculties and centres. Common elements included:
i. Risk identification through dashboards and academic performance monitoring;
ii. Academic advising expansion;
iii. Tutor/mentor/teaching-assistant capacity development; and
iv. Structured feedback processes to strengthen teaching quality.
Illustrative examples of the student success ecosystem included:
• Piloting of PowerBI-enabled dashboards to strengthen data visualisation and departmental engagement with student feedback data;
• Expansion of academic advising capacity, including the appointment of additional advisors and collaborative work on an advising framework;
• Bootcamps, study buddy programmes, and targeted academic support for underprepared students in gateway disciplines (e.g., Mathematics, Physics, and Chemistry); and
• Faculty-wide class representative forums and student success dialogues to strengthen student voice and engagement.
3.1.4 Curriculum Renewal and Programme Development
In 2025, programme renewal and development continued with the aim of aligning all our qualifications with the new Higher Education Qualifications Sub-framework (HEQSF). A revised and updated Programme and Qualification Mix (PQM) was approved in April 2025, following a thorough analysis and extensive consultation with the Department of Higher Education and Training (DHET). The Bachelor of Applied Industrial Physics qualification was approved by DHET for inclusion in the PQM. Twelve (12) minor amendments to existing qualifications were approved by the Qualifications Evaluation Committee (QEC) and the Senate Academic Planning Committee (S-APC).
New Qualifications
Several new qualifications were either accredited with the Council on Higher Education (CHE) or registered on the National Qualification Framework (NQF) with the South African Qualifications Authority (SAQA) in 2025. These are presented in the table below (Table 4):
1. Master of Biotechnology 1. Master of Health Sciences in Transdisciplinary Health
2. Master of Health Sciences in Transdisciplinary Health
3. Doctor of Emergency Medical Care
4. Doctor of Philosophy in Nursing Science
5. Postgraduate Diploma in Mathematical Sciences
2. Master of Clothing & Textile Technology
3. Doctor of Emergency Medical Care
4. Doctor of Philosophy in Nursing Science
Table 4. New qualifications approved in 2025
3.1.5 Academic Staff Development
The following key staff development and capacity-building achievements were realised:
• Structured staff development time was protected (e.g., faculty-designated development afternoons) with a focus on teaching quality, research, innovation, and transformation;
• Forty (40) staff members enrolled in a Microsoft-endorsed AI engineering certificate programme;
• Engineering Council of South Africa (ECSA) mentorship initiatives supported professional registration pathways for engineering academics; and
• Staff qualification completions included doctoral and master’s graduations reported within the year, contributing to strengthened scholarly capacity.
3.1.6 Awards and Recognition
Academic year 2025 was marked by notable teaching excellence and academic leadership recognition, which included:
• National University Teaching Award (NUTA): A CPUT academic, Dr Vusi Mshayisa – Faculty of Applied Sciences, was recognised as a 2025 NUTA winner; continued institutional visibility was reinforced through formal recognition of prior commendations at the 2025 NUTA Gala.
• Teaching Advancement at Universities (TAU): Two colleagues, Prof Bronwyn Swartz – Faculty of Engineering and the Built Environment and Dr Sanet Cox – Faculty of Education, successfully completed the TAU Fellowship Programme (2024/2025), increasing the institutional cohort of TAU Fellows to ten, with further staff participating in Cohort 6 (2025/2026).
• Faculty-level Teaching Excellence Awards: Recognition mechanisms continued in faculties to celebrate and promote teaching innovation.
3.1.7 Faculty Achievements
The subsequent sections provide a summary of faculty-level progress and academic development initiatives. Academic progress was evident in both longitudinal performance trends, and faculty interventions.
Overall Student Enrolments
In 2025, CPUT enrolled a total of 38,228 students, comprising 35,063 UG students (91,7%); 3,113 PG students (8,1%); and 52 Occasional students (0,1%). Figure 6 presents the student enrolments distributed across the six faculties, namely: the Faculty of Applied Sciences (FAS) (4,344; 11,4%); Faculty of Business and Management Sciences (FBMS) (12,754; 33,4%); Faculty of Education (FEd) (4,929; 12,9%); Faculty of Engineering and the Built Environment (FEBE) (9,854; 25,8%); Faculty of Health and Wellness Sciences (FHWS) (2,356; 6,2%); and Faculty of Informatics and Design (FID) (3,991; 10,4%).
Faculty of Applied Sciences (FAS)
Faculty of Business and Management Sciences (FBMS)
Faculty of Education (FEd)
Faculty of Engineering and the Built Environment (FEBE)
Faculty of Health and Wellness Sciences (FHWS)
Faculty of Informatics and Design (FID)
Overall Number of Graduates
The total number of graduates produced by CPUT has increased significantly by 1,971 from 7,885 in 2023 to 9,857 in 2025, comprising of 8,623 UG graduates (87,5%) and 1,234 PG graduates (12,5%) (Table 5). When comparing academic year 2024 to 2025, the total number of graduates produced by CPUT increased by 1,480, which is a 17,7% year on year increase. The recorded increase in the number of graduates is in line with the University’s strategy of contributing to the country’s critical skills.
Figure 6. Total student headcount enrolments by faculty, 2025
Table 5. Total number of graduates by faculty, 2023–2025
Overall UG Pass Rates
Figure 7 shows that CPUT has recorded an impressive 87,4% UG pass rate in 2025, which is an improvement of 1,9 percentage points compared to the previous year (2024).
Figure 7. CPUT overall UG pass rates, 2021–2025
Overall Throughput Rates
At an institutional level, the proportion of students completing their studies in minimum time was highest in 2021, when the throughput rate was recorded at 39,1% compared to 17,4% in 2025 (Fig. 8).
8. CPUT overall throughput rates in minimum time, 2021–2025
Overall Academic Staff with Doctoral Qualifications
The proportion of CPUT staff with doctoral qualifications was recorded at 41,2% in 2025, which is an improvement of 1,3 percentage points compared to the previous years (Table 6).
Table 6. CPUT total number of permanent academic staff with doctoral qualification, 2024–2025
Figure
3.1.7.1 Faculty of Applied Sciences (FAS) Student Enrolments
The FAS student headcount enrolments increased from 3,803 in 2023, to 4,344 in 2025 (Fig. 9). The recorded increase in student enrolments is in line with the University’s strategy of strengthening enrolments in the fields of science, engineering, and technology (SET).
As shown in Figure 10, the Faculty is made up of eight departments, with the Department of Agriculture (779) recording the highest student headcount enrolments in 2025, and the Department of Mathematics and Physics (391) recording the lowest student headcount enrolments.
10. FAS total student headcount enrolments by department, 2023–2025
Rates
The Faculty has recorded a steady increase in UG pass rates from 80,8% in 2021, to 90,2% in 2025, which is a 9,4 percentage point increase (Fig. 11).
rates, 2021–2025
Figure 9. FAS total student headcount enrolments, 2023–2025
Figure
Figure 11. FAS UG
Figure 12 shows that the Department of Agriculture recorded the most improvement in student UG pass rates in the faculty, from 68,5% in 2021, to 92,4% in 2025, which is a 23,9 percentage point increase. In 2025, the Department of Food Sciences and Technology recorded the highest UG pass rate in the faculty, at 95,8%.
Throughput Rates
In FAS, the proportion of students completing their studies in minimum time was highest in 2022, when the throughput rate was recorded at 46,7% compared to 16,5% in 2025 (Fig. 13).
As shown in Figure 14, the Department of Horticultural Sciences and the Department of Environmental and Occupational Studies recorded the highest proportion of students completing their studies in minimum time at 25,5% and 20,0%, respectively, in 2025.
Figure 12. FAS UG pass rates by department, 2021–2025
Figure 13. FAS throughput rates in minimum time, 2021–2025
Figure 14. FAS throughput rates in minimum time by department, 2021–2025
Number of Graduates
The number of graduates produced by FAS has increased by 330, from 808 in 2021, to 1,138 in 2025 (Fig. 15).
Figure 15. FAS total number of graduates, 2021–2025
Figure 16 shows that the Department of Agriculture recorded the highest number of graduates in 2025, at 258. In addition, the same department recorded the most improvement in the number of graduates in the Faculty by 175, from 83 in 2021, to 258 in 2025.
Figure 16. FAS total number of graduates by department, 2021–2025
Academic Staff with Doctoral Qualifications
The number of permanent academic staff with doctoral degrees in FAS increased from 58 (55% of the total faculty academic staff) in 2021, to 69 (59% of the total faculty academic staff) (Fig. 17). The Faculty has exceeded the 2030 institutional target of 50% of academic staff with doctoral degrees.
Figure 17. FAS total number of permanent academic staff with doctoral qualification, 2021–2025
Table 7 shows that the Department of Chemistry and the Department of Environmental and Occupational Studies recorded the highest number of academic staff with doctoral degrees at 16 and 12, respectively, in 2025.
Table 7. FAS total number of permanent academic staff with doctoral qualification by department, 2021–2025
3.1.7.2 Faculty of Business and Management Sciences (FBMS) Student Enrolments
The FBMS student headcount enrolments increased from 11,750 in 2023, to 12,754 in 2025. See (Fig. 18).
As shown in Figure 19, the Faculty is made up of 16 departments, with the Department of Accounting Sciences (1,939) recording the highest student headcount enrolments in 2025, and the Department of Business Administration (29) recording the lowest student headcount enrolments. The three departments, namely Financial Accounting and Taxation; Internal Auditing and Information System; and Management Accounting, were merged into the Department of Accounting Sciences.
Figure 18. FBMS total student headcount enrolments, 2023–2025
Figure 19. FBMS total student headcount enrolments by department, 2023–2025
Acc Sci: Accounting Sciences; Buss & Info Admin: Business & Information Admin; Buss Admin: Business Admin; CT Hotel Sch: Cape Town Hotel School; App Legal Stud: Applied Legal Studies; Entrp & Buss Mgnt: Entrepreneurship & Business Management; Fin Acc & Tax: Financial Accounting & Taxation; Grad Centre for Mgnt: Graduate Centre for Management; HR Mgnt: Human Resource Management; Int Audit & Info Sys: Internal Auditing & Information Systems; Mgnt & Project Mgnt: Management & Project Management; Ops Mgnt: Operations Management; Public Admin & Gov: Public Admin & Governance; Retail Buss Mgnt: Retail Business Management; Sport Mgnt: Sport Management; Tour Mgnt: Tourism Management; App Econ: Applied Economics.
Pass Rates
FBMS has recorded an increase in UG pass rates from 77,7% in 2021, to 84,2% in 2025, which is 6,5 percentage point increase (Fig. 20).
Figure 21 shows that the Department of Public Administration and Governance recorded the highest UG
department, 2021–2025
Throughput Rates
In FBMS, the proportion of students completing their studies in minimum time was highest in 2021, when the throughput rate was recorded at 42,5%, compared to 17,7% in 2025 (Fig. 22).
time, 2021–2025
Figure 20. FBMS UG pass rates, 2021–2025
Figure 21. FBMS UG pass rates by
Figure 22. FBMS throughput rates in minimum
As shown in Figure 23, the Department of Public Administration and Governance recorded the highest proportion of students completing their studies in minimum time at 32,7% in 2025.
23. FBMS throughput rates in minimum time by department, 2021–2025
Number of Graduates
The number of graduates produced by FBMS has decreased by 74 from 3,246 in 2021, to 3,172 in 2025 (Fig. 24).
3,200 3,000 2,800 2,600 2,400
Figure 24. FBMS total number of graduates, 2021–2025
Figure 25 shows that the Department of Accounting Sciences recorded the highest number of graduates in 2025 at 568.
25. FBMS total number of graduates by department, 2021–2025
Figure
Figure
Academic Staff with Doctoral Qualifications
The number of permanent academic staff with doctoral degrees in FBMS increased from 37 (22% of the total faculty academic staff) in 2021, to 45 (26% of the total faculty academic staff) (Fig. 26).
Figure 26. FBMS total number of permanent academic staff with doctoral qualification, 2021–2025
Table 8 shows that the Department of Business and Information Administration and the Department of Tourism Management recorded the highest number of academic staff with doctoral degrees at 5, per each department, in 2025.
Table 8. FBMS total number of permanent academic staff with doctoral qualification by department, 2021–2025
3.1.7.3 Faculty of Education (FEd) Student Enrolments
The FEd student headcount enrolments decreased from 5,504 in 2023 to 4,929 in 2025 (Fig. 27). The observed decline in education enrolments is in line with the institutional strategy of managing down the enrolments in this field, given that there were significant over-enrolments recorded in the past years.
As shown in Figure 28, the faculty is made up of seven departments, with the Department of Senior Phase and FET Studies (1,625) recording the highest student headcount enrolments in 2025.
by department, 2023–2025
Pass Rates
FEd has recorded a steady increase in UG pass rates from 88,7% in 2021, to 94,2% in 2025, which
(Fig. 29).
rates, 2021–2025
Figure 27. FEd total student headcount enrolments, 2023–2025
Figure 28. FEd total student headcount enrolments
Figure 29. FEd UG pass
Figure 30 shows that the Department of Foundation Phase Studies recorded the highest UG pass rate, at 95,3%.
30. FEd UG pass rates by department, 2021–2025
Throughput Rates
In FEd, the proportion of students completing their studies in minimum time was highest in 2021, when the throughput rate was recorded at 51,9%, compared to 18,3% in 2025 (Fig. 31).
31. FEd throughput rates in minimum time, 2021–2025
As shown in Figure 32, the Department of Teacher Professional Development recorded the highest proportion of students completing their studies in minimum time, at 60,0% in 2025. The Department of General Education and Training was linked to phased out qualifications, hence the zero throughput rates.
32. FEd throughput rates in minimum time by department, 2021–2022
Figure
Figure
Figure
Number of Graduates
The number of graduates produced by FEd has increased by 203, from 1,042 in 2021, to 1,245 in 2025 (Fig. 33).
Figure 33. FEd total number of graduates, 2021–2025
Figure 34 shows that the Department of Senior Phase and FET Studies recorded the highest number of graduates in 2025, at 375. In addition, the Department of Foundation Phase Studies recorded the most improvement in the number of graduates in the faculty by 80, from 202 in 2021, to 282 in 2025.
Figure 34. FEd total number of graduates by department, 2021–2025
Academic Staff with Doctoral Qualifications
The number of permanent academic staff with doctoral degrees in FEd increased from 40 (40% of the total faculty academic staff) in 2021, to 56 (57% of the total faculty academic staff) (Fig. 35). The faculty has exceeded the 2030 institutional target of 50% of academic staff with doctoral degrees.
Figure 35. FEd total number of permanent academic staff with doctoral qualification, 2021–2025
Table 9 shows that the Department of Senior Phase and FET Studies recorded the highest number of academic staff with doctoral degrees, at 21 in 2025.
Table 9. FEd total number of permanent academic staff with doctoral qualification by department, 2021–2025
3.1.7.4 Faculty of Engineering and the Built Environment (FEBE) Student Enrolments
The FEBE student headcount enrolments increased from 8,217 in 2023, to 9,854 in 2025 (Fig. 36). The recorded increase in student enrolments is in line with the University’s strategic objective of strengthening enrolments in the fields of science, engineering, and technology (SET).
As shown in Figure 37, the faculty is made up of eight departments, with the Department of Electric, Electronic, and Computer Engineering (2,714) recording the highest student headcount enrolments in 2025, and the Department of Clothing and Textile Technology (315) recording the lowest student headcount enrolments.
Figure 36. FEBE total student headcount enrolments, 2023–2025
Figure 37. FEBE total student headcount enrolments by department, 2023–2025
Pass Rates
FEBE has recorded a steady increase in UG pass rates, from 74,0% in 2021, to 83,6% in 2025, which is a 9,6 percentage point increase (Fig. 38).
38. FEBE pass rates, 2021–2025
Figure 39 shows that the Department of Civil Engineering and Geomatics and the Department of Chemical Engineering recorded the highest UG pass rate at 86,8% and 86,6%, respectively, in 2025.
39. FEBE UG pass rates by department, 2021–2025
Throughput Rates
In FEBE, the proportion of students completing their studies in minimum time was highest in 2023, when the throughput rate was recorded at 24,6%, compared to 8,5% in 2025 (Fig. 40).
Figure
Figure
Figure 40. FEBE throughput rates in minimum time, 2021–2025
As shown in Figure 41, the highest throughput was recorded at 19,8% for the Department of Chemical Engineering in 2025.
Number of Graduates
The number of graduates produced by FEBE has increased by 659, from 1,506 in 2021, to 2,165 in 2025 (Fig. 42). The recorded increase in the number of FEBE graduates is in line with the University’s strategic objective of contributing significantly to the number of scarce skills graduates in the country.
Figure 43 shows that the Department of Electric, Electronic and Computer Engineering recorded the highest number of graduates in 2025, at 592. In addition, the same department recorded the most improvement in the number of graduates in the faculty by 347, from 245 in 2021, to 592 in 2025.
Figure 41. FEBE throughput rates in minimum time, 2021–2025
Figure 42. FEBE total number of graduates, 2021–2025
Figure 43. FEBE total number of graduates by department, 2021–2025
Academic Staff with Doctoral Qualifications
The number of permanent academic staff with doctoral degrees in FEBE increased from 56 (31% of the total faculty academic staff) in 2021, to 79 (42% of the total faculty academic staff) (Fig. 44).
Table 10 shows that the Department of Electric, Electronic and Computer Engineering and Department of Mechanical and Mechatronic Engineering recorded the highest number of academic staff with doctoral degrees at 19 and 17 in 2025.
10. FEBE total number of permanent academic staff with doctoral qualification by department, 2021–2025
3.1.7.5 Faculty of Health and Wellness Sciences (FHWS) Student Enrolments
The FHWS student headcount enrolments increased from 2,343 in 2023, to 2,356 in 2025 (Fig. 45).
Figure 44. FEBE total number of permanent academic staff with doctoral qualification, 2021–2025
Table
Figure 45. FHWS total student headcount enrolments, 2023–2025
As shown in Figure 46, the faculty is made up of seven departments, with the Department of Medical Imaging and Therapeutic Sciences (MITS) (459) recording the highest student headcount enrolments in 2025, and the Department of Dental Sciences (144) recording the lowest student headcount enrolments.
Pass Rates
FHWS has recorded a steady increase in UG pass rates, from 90,1% in 2021, to 91,9% in 2025, which is a 1,8 percentage point increase (Fig. 47).
Figure 48 shows that the Department of MITS recorded the highest pass rate, at 97,9%.
Figure 46. FHWS total student headcount enrolments by department, 2023–2025
Figure 47. FHWS UG pass rates, 2021–2025
Figure 48. FHWS UG pass rates by department, 2021–2025
Throughput Rates
The proportion of FHWS students completing their studies in minimum time was highest in 2021, when the throughput rate was recorded at 56,1%, compared to 35,6% in 2025 (Fig. 49).
Figure 49. FHWS throughput rates in minimum time, 2021–2025
As shown in Figure 50, the Department of Dental Sciences and the Department of Nursing Sciences recorded the highest proportion of students completing their studies in minimum time at 88,4% and 59,9%, respectively, in 2025.
50. FHWS throughput rates in minimum time by faculty, 2021–2025
Number of Graduates
The number of FHWS graduates has increased by 152, from 644 in 2021, to 796 in 2025 (Fig. 51).
51. FHWS total number of graduates, 2021–2025
Figure
Figure
Figure 52 shows that the Department of Nursing Sciences recorded the highest number of graduates in 2025, at 300. In addition, the same department recorded the most improvement in the number of graduates in the faculty, by 101 from 199 in 2021, to 300 in 2025.
graduates by department,
Academic Staff with Doctoral Qualifications
The number of permanent academic staff with doctoral degrees in FHWS increased from 19 (22% of the total faculty academic staff) in 2021, to 32 (37% of the total faculty academic staff) in 2025 (Fig. 53).
Table 11 shows that the Department of Biomedical Sciences and the Department of Medical Imaging and Therapeutic Sciences recorded the highest number of academic staff with doctoral degrees, at 10 and 8, respectively, in 2025.
11. FHWS
Figure 52. FHWS total number of
2021–2025
Figure 53. FHWS total number of permanent academic staff with doctoral qualification, 2021–2025
Table
3.1.7.6 Faculty of Informatics and Design (FID)
Student Enrolments
The FID student headcount enrolments increased from 3,865 in 2023, to 3,991 in 2025 (Fig. 54).
In 2025, the Faculty restructured its departments into the following five departments:
1) Department of Applied Design – constituted by the Fashion and Surface Design, Jewellery Design and Manufacture, Industrial Design, Information Design: Admin departments; 2) Department of Architectural Technology and Interior Design (ID) – constituted by Architectural Technology and Interior Design departments, 3) Department of Information Technology, and 4) Department of Media and Communication – constituted by Film and Video, Journalism, Photography, and Public Relations departments, 5) Department of Urban and Regional Planning – constituted by the Department of Town and Regional Planning.
As shown in Figure 55, the faculty is made up of five departments, with the Department of Information Technology (1,764) recording the highest student headcount enrolments in 2025, and the Department of Urban and Regional Planning (213) recording the lowest student headcount enrolments.
Pass Rates
FID has recorded a steady increase in UG pass rates, from 79,6% in 2021, to 89,8% in 2025, which is a 10,2 percentage point increase (Fig. 56).
Figure 54. FID total student headcount enrolments, 2023–2025
Figure 55. FID total student headcount enrolments by department, 2023–2025
Figure 56. FID UG pass rates, 2021–2025
In 2025, the Department of Media and Communication and Department of Information Technology recorded the highest UG pass rates at 90,3% and 90,0%, respectively (Fig. 57).
57. FID UG pass rates by department, 2021–2025
Throughput Rates
The proportion of FID students completing their studies in minimum time was highest in 2023, when the throughput rate was recorded at 46,9%, compared to 30,3% in 2025 (Fig. 58).
58. FID throughput rates in minimum time, 2021–2025
As shown in Figure 59, the Department of Information Technology and the Department of Urban and Regional Planning recorded the highest proportion of students completing their studies in minimum time, at 38,5% and 30,1%, respectively, in 2025.
59. FID departmental throughput rates in minimum time, 2021–2025
Figure
Figure
Figure
Number of Graduates
The number of graduates produced by FID f has increased by 653, from 689 in 2021, to 1,342 in 2025 (Fig. 60).
60. FID total number of graduates, 2021–2025
Figure 61 shows that the Department of Information Technology recorded the highest number of graduates in 2025, at 687. In addition, the same department recorded the most improvement in the number of graduates in the faculty by 454, from 233 in 2021, to 687 in 2025.
61. FID total number of graduates by department, 2021–2025
The number of permanent academic staff with doctoral degrees in FID has increased from 18 (16% of the total faculty academic staff) in 2021, to 28 (26% of the total faculty academic staff) (Fig. 62).
62. FID total number of permanent academic staff with doctoral qualification, 2021–2025
Figure
Figure
Figure
Table 12 shows that the Department of Information Technology recorded the highest number of academic staff with doctoral degrees at 8 in 2025.
Table 12. FID total number of permanent academic staff with doctoral qualification by department, 2021–2025
3.1.8 CPUT Libraries’ Impact on Learning and Teaching
CPUT Libraries remains committed to innovation and excellence in academic support. Our initiatives demonstrate dedication to enhancing the University's learning and teaching environment. CPUT Libraries is strengthening Information Literacy (IL) by harnessing AI's transformative potential to enhance teaching, learning, and research. We've embedded AI-driven tools into IL programmes, equipping students with critical competencies to evaluate online information, understand data ethics, and engage responsibly with generative technologies. AI-enhanced IL instruction enables personalised learning pathways, intelligent search support, and interactive learning objects, empowering students and staff to navigate complex information ecosystems confidently. Additionally, we introduced AI Primo research assistants on our main search platform, and developed training programmes to promote efficient and innovative research practices, aligning with CPUT AI guidelines.
Our community outreach initiatives position CPUT Libraries as accessible knowledge hubs, promoting digital literacy, research skills, and socio-economic development in surrounding communities. We continue to support learning and teaching by providing welldesigned physical spaces that foster collaboration, creativity, and peer engagement. In response to increased student demand, we added eight new cubicles in Bellville and four seminar rooms on the Bellville and District Six campuses. We also established a modern library at the Newlands Cricket Ground, offering Sport Management students a cutting-edge learning environment with smart technology, preparing them for a global environment.
3.2 Research Achievements
In 2025, ongoing interventions were formulated through the Research, Technology Innovation and Partnerships (RTIP) Blueprint 3.0 to strengthen the University’s research performance. Research and Innovation is a cornerstone of the Institution’s strategic focus on developing “Smart RTIP that is relevant and has impact”. This commitment seeks to enhance CPUT’s emphasis on transdisciplinary, multidisciplinary, and interdisciplinary knowledge production (Mode 2 and Mode 3) through strategic research initiatives, driving smart, technology-led solutions to societal challenges.
3.2.1 Postgraduate Studies
Postgraduate Student Enrolments by Faculty
In 2025, CPUT enrolled a total of 3,113 postgraduate (PG) students, consisting of 1,858 PG < Master’s (59,7%), 856 Master’s (27,5%), and 399 Doctoral (12,8%) student enrolments. The PG total student headcounts were distributed across all six faculties, as follows – FAS: 10,4% (325), FBMS: 34,9% (1,087), FEd: 11,6% (362), FEBE: 20,1% (626), FHWS: 13,5% (420), and FID; 9,4% (293) (Fig. 63).
Faculty of Applied Sciences (FAS)
Faculty of Business and Management Sciences (FBMS)
Faculty of Education (FEd)
Faculty of Engineering and the Built Environment (FEBE)
Faculty of Health and Wellness Sciences (FHWS)
Faculty of Informatics and Design (FID)
As shown in Figure 64, the total PG student enrolments have recorded an increase of 470, from 2,643 in 2023, to 3,113 in 2025. In addition, all faculties, except for FEd, recorded an increase in PG student enrolments in the past three years. The recorded improvement is in line with the University’s strategic objective of increasing PG student enrolments.
Figure 63. Total PG student enrolments by faculty, 2025
Figure 64. Total PG student enrolments by faculty, 2023–2025
In 2025, the PG enrolments were constituted primarily by the qualification type: PG < Master’s at 1,858 (59,7%), followed by Master’s at 856 (27,5%), and Doctoral enrolments at 399 (12,8%) (Fig. 65).
Figure 65. Total PG student enrolments by qualification type, 2025
Postgraduate Student Demographic Profile by Faculty
In 2025, females constituted more than half of the PG student enrolments, at 60,9% (1,894), while males constituted
(1,218) (Table 13). All faculty PG student enrolments, except for FEBE and FID, constituted more females than males.
Note: Figures exclude occasional students and unknowns.
Table 13. Postgraduate student enrolments by gender, per faculty, 2025
PG student enrolments, disaggregated by race (Table 14), shows that African students (79,8%; 2,485) constituted most of the
enrolments in 2025, followed by Coloured (15,7%; 488), White (3,2%; 101), and Indian (1,1%; 35). The same racial enrolment pattern was observed across all faculties.
Note: Figures exclude unknowns.
Table 14. Postgraduate student enrolments by race per faculty, 2025
PG student enrolments, disaggregated by nationality (Table 15), shows that South African students (94,0%; 2,926) constituted most of the PG enrolments in 2025, while international students constituted 6,0% (187). FEBE (82) recorded the highest number of PG international students, at 15,1% in 2025.
Table 15. Postgraduate student enrolments by nationality, per faculty, 2025
Postgraduate Student Success (Graduates)
Table 16 shows that the total number of PG graduates produced in 2025 was 1,234, with PG < M (PG Diplomas and Honours) qualification type recording the highest number of graduates (1,076), followed by masters (102), and doctoral (56) qualifications. FEBE recorded the highest number of master’s and doctoral graduates in 2025, at 29 and 16, respectively. The recorded improvement is in line with the University’s strategic objective of increasing the number of graduates in scarce skills fields, such as engineering.
Table 16. Total number of PG graduates per faculty, 2025
Postgraduate Funding Support
The total amount received from the National Research Foundation (NRF) for supporting PG studies was R4,29 million in 2025 (Table 17). The external NRF funding was awarded to a total of 27 master’s and doctoral PG study initiatives. FAS was awarded the highest amount of NRF funding for PG study initiatives (R1,90 million).
Table 17. External NRF funding and scholarships for PG studies, 2025
The total amount received from CPUT for supporting PG studies was R1,89 million in 2025 (Table 18). The internal CPUT funding was awarded to a total of 36 master’s and doctoral PG study initiatives. FEBE was awarded the highest amount of CPUT funding for PG study initiatives (R758,685).
Table 18. Internal CPUT funding and scholarships for PG studies, 2025
Postgraduate Development and Support
The Centre for Postgraduate Studies (CPGS) implemented several initiatives in 2025 to support PG development, research capacity, and the effective management of postgraduate academic processes. A total of 74 training workshops were presented, reaching 4,633 PG participants. These activities included support for proposal development, academic writing, research methods, and the use of research software. In addition, 206 mentoring sessions were conducted with 554 PG students.
CPGS also provided specialised support in research software tools used by PG students. A total of 405 students received assistance in SPSS, ATLAS.ti, and Turnitin. In addition, 41 theses, dissertations, and journal articles received professional editing support coordinated through the Centre.
The Centre also hosted intensive proposal development and writing programmes that assisted PG students in preparing research proposals, and converting their research into publishable manuscripts. These initiatives contributed to 20 publication-ready manuscripts, and 7 published articles during the reporting period.
3.2.2 Postdoctoral Research Fellows
Postdoctoral fellows form an important part of the research environment at CPUT. They contribute to research output, strengthen postgraduate supervision capacity, and support the development of emerging research areas within faculties. During the reporting period, CPUT hosted a cohort of 22 postdoctoral fellows across the six faculties and non-faculty entities. These fellows were supported through a combination of internal funding mechanisms and externally funded research programmes, including National Research Foundation (NRF) initiatives.
Of the 22 postdoctoral research fellows (postdocs) recorded in 2025, FEBE and non-faculty entities (AMHBI and SIP) recorded the highest numbers of postdocs, at 5 (22,7%), respectively (Table 19).
Table 19. Total number of postdoctoral research fellows per faculty, 2025
Postdoctoral Funding Support
Table 20 shows that the postdoc fellows were supported through a combination of internal funding mechanisms and externally funded research programmes, including NRF initiatives.
Funding Source
GITES
CPUT – DRD
Water Research Commission (WRC)
External (NRF SARChI)
Faculty of Informatics & Design (FID)
NRF
South African Medical Research Council (SAMRC)
Table 20. Funding sources for postdoctoral research fellows, 2025
3.2.3 Research Output
DHET finalised and communicated the final 2024 CPUT Research Outputs in December 2025. Based on the final audited DHET figures, CPUT attained a total of 340.8 research output units in 2024 (Table 21). The provisional 2025 research output data, which is still subject to internal and external DHET audits, shows an improvement in research performance by 59.6 units, to 400.4 units.
Table 21. CPUT total number of research output units, 2024–2025
Table 22 provides the provisional 2025 research output data by faculty. The highest research output units were recorded for the FEBE faculty at 114.4 units.
Table 22. Total number of research output units by faculty, 2025
In January 2026, DHET communicated the final CPUT Creative and Innovative output for the period 2020–2024 (Table 23). During this period, CPUT was awarded a total of 6 creative units and 4 innovation units. This area has been identified as a priority for improvement going forward.
Table 23. CPUT total number of awarded creative and innovation units, 2020–2024 3.2.4
Research Funding Initiatives
Substantial funding was secured from various external funding agencies, including the NRF, to support CPUT’s research projects during the year under review.
External Research Funding from the NRF
In 2025, the Institution successfully secured competitive external research funding of more than R28 million from the NRF and the South African Medical Research Council (SAMRC) to support research projects. The total number of CPUT applicants funded by the NRF in 2025 was 80. The total number of applicants funded by the SAMRC in 2025 was two. Table 24 provides an overview of the awards allocated by the NRF from January to December 2025. These awards include both new and ongoing grants awarded to grant holders. The 2025 NRF funding included two National Equipment Programme awards of R5,85 million for a laser direct infrared (LDIR) (Dr Sparks in the Centre for Sustainable Oceans, FAS), and R4,17 million for a Scanning Electrochemical Microscope (Prof Chowdhury, FEBE), respectively.
Table 24. Total NRF competitive research funding, 2025
Industry and Other External Research Funding
Table 25 depicts the total research income of more than R10 million received from other external and Industry funders from January to December 2025. These funds are from existing and new funders.
Microbial and
Faculty of Applied Sciences (FAS)
of Business and Management Sciences (FBMS) WR SETA R909,000.00
Faculty of Engineering and the Built Environment (FEBE) DSI R3,098,260.00 Metson Manufacturing R28,539.00 Hubei Shonge Institute R10,976.27
R1,671,991.96 Faculty of Health and Wellness Sciences (FHWS)
Table 25. Total industry and external funding, 2025 3.2.5 NRF-Rated Researchers
The total number of NRF-rated researchers in 2025 was 70, and disaggregated according to the following categories:
(1,4%); C1=4 (5,7%); C2=34 (48,6%); C3=13 (18,6%); Y2=18 (25,7%). The detailed breakdown of the NRF rated researchers is presented in Table 26.
12 C2 Prof R Duffett FBMS
13 C2 Prof P Engel-Hills FHWS
14 C2 Prof VG Fester FEBE
15 C2 Prof JW Garraway PERI
16 C2 Prof S Geerts FAS
17 C2 Prof T Iyamu FID
18 C2 Prof A Jacobs FAS
19 C2 Prof K Jooste FHWS
20 C2 Prof L Kambizi FAS
21 C2 Prof B Knott FBMS
22 C2 Prof S Krishnamurthy FEBE
23 C2 Prof CP Laubscher FAS
24 C2 Prof M Le Roes-Hill AMHBI
25 C2 Prof MC Matoetoe FAS
26 C2 Dr S Meyer FHWS
27 C2 Prof AAH Mohammed FAS
28 C2 Prof F Nchu FAS
29 C2 Dr N Norodien-Fataar Fundani
30 C2 Prof TV Ojumu FEBE
31 C2 Prof OO Oyekolo FEBE
32 C2 Prof A Patnaik FEBE
33 C2 Dr Nike Romano FID
34 C2 Dr N Shaik FEd
35 C2 Prof M Sheldon FEBE/DVC: RTIP
36 C2 Prof VS Somerset FAS
37 C2 Prof J Van Wyk FAS
38 C2 Prof IJ Van Zyl CPGS
39 C2 Dr P Welz AMHBI
40 C3 Prof P Clark-Farr FHWS
41 C3 Prof L De Sousa FEd
42 C3 Prof FB Lewu FAS
43 C3 Prof C Livingston FEd
44 C3 Prof V Naicker FBMS
45 C3 Prof B Ncube FEBE
46 C3 Prof VI Okudoh FAS
47 C3 Prof ZC Sosibo FEd
48 C3 Prof LJ Theo FID
49 C3 Prof M Twum-Darko FBMS
50 C3 Dr F Waghid CIET
51 C3 Prof Z Waghid FEd
52 C3 Dr SJ West FBMS
53 Y2
54 Y2
55 Y2
56 Y2
57 Y2
Dr OP Babalola FEBE
Prof PH Boer FEd
Dr BS Chidi FAS
Prof MR Chowdhury FEBE
Dr TF Docrat AMHBI
58 Y2 Dr JD Hemmonsbey-Lodewyk FBMS
59 Y2 Dr EL Ismail FAS
60 Y2 Dr LG Lategan FID
61 Y2
Dr VV Mshayisa FAS
62 Y2 Dr T Mthethwa AMHBI
63 Y2 Dr M Mutize FBMS
64 Y2 Dr K Naidoo FHWS
65 Y2 Dr N Ndube-Tsolekile FAS
66 Y2 Dr AB Oyenihi FAS
67 Y2 Dr S Patnaik FEBE
68 Y2 Dr AA Periola FEBE
69 Y2 Dr S Raghubeer FHWS
70 Y2 Dr S Sobuwa FHWS
Table 26. CPUT NRF-rated researchers per faculty or entity
3.2.7 Research Entities
In 2025, a total of 30 active research entities were recorded across the six faculties (Table 27).
Professional Education Research Institute (PERI)
Faculty of Applied Sciences (FAS)
AgriFood Technology Station (ATS)
Prof C Winberg
Mr N Mshicileli TIA
Centre for Sustainable Oceans (CSO) Dr C Sparks Centre
Crystal Engineering Unit
Functional Food Research Unit (FFRU)
Environmental Chemistry, Toxicology and Remediation
Natural Products Chemistry Research Group
Bio-resource Engineering Research Group
BioEngineering Research Group (BioERG) (combined with FEBE ChemEng)
Faculty of Business and Management Sciences (FBMS)
Prof M Wicht Unit
Prof M Opperman/ Prof Van Heerden Unit
Prof J Odendaal Group
Prof AA Hussein Mohammed Group
Prof VI Okudoh Group
Prof VI Okudoh Group
Centre for Sport Business and Technology Research (CSBTR) Prof B Knott Centre
Centre for Tourism Research in Africa (CETRA)
Faculty of Education (FEd)
Global Institute for Teacher Education and Society (GITES)
Dr C Dube Centre
Prof A Chigona
Entity Head
Faculty of Engineering and the Built Environment (FEBE)
French–South African Institute of Technology (F’SATI)
Energy Institute
Africa Space Innovation Centre (ASIC)
Centre for Water and Sanitation Research (CWSR)
Centre for Distributed Power and Electronic Systems (CDPES)
Centre for Research in Power Systems
Centre for Substation Automation and Energy Management Systems (CSAEMS)
Centre for Intelligence Systems and Emerging Technologies (CISET)
Flow Process & Rheology Centre (FPRC)
BioEngineering Research Group (BioERG)
Friction Stir Welding and Processing Research Unit (FSW&PRU)
Functional Material Research Unit (FMRU)
Sustainable Heritage Research Unit (SHRU)
Research Unit for Education in Engineering and the Built Environment (RUEEBE)
Technology Station in Clothing and Textiles
Advanced Manufacturing Technology Laboratory
Faculty of Health and Wellness Sciences (FHWS)
MRC Cardiometabolic Health Research Centre
Faculty of Informatics and Design (FID)
Centre for Communication Studies
Table 27. Total number of active CPUT research entities, 2025
3.2.8 Strategic Initiatives
and Partnerships
Category
Prof I Davidson Institute
Prof MT Kahn Institute
Prof I Davidson Centre
Prof B Ncube Centre
Prof M Adonis Centre
Dr A Almaktoof Centre
Dr K Kriger/ Prof S Krishnamurthy Centre
Prof S Krishnamurthy Centre
Prof V Fester Centre
Dr D De Jager Group
To be appointed Unit
Prof M Chowdhury Unit
Prof K Pallav Unit
Dr M Pourbehi/ Prof B Swartz Unit
Mr S Isaacs TIA TechStation
To be appointed TIA TechStation
Prof G Davison/ Prof TE Matsha/ Dr S Raghubeer Centre
Prof M Mokhele Centre
In 2025, the Strategic Initiatives and Partnerships (SIP) Directorate consolidated CPUT’s position as a smart, globally connected university by aligning internationalisation, research uptake, and strategic funding with Vision 2030 and the six Research Focus Areas:
• Bioeconomy and Biotechnology;
• Space Science and Technology;
• Smart Energy;
• The Environment, Climate Change, and Sustainability;
• Human, Health and Social Dynamics; and
• The Digital Society.
The Directorate delivered a coherent set of research uptake and support initiatives in 2025 that focused on strengthening pathways from research to use, developing researcher capability, and building external stakeholder relationships.
Through the Research Incoko platform, SIP hosted two trans-disciplinary research dialogues on 7 May and 18 September 2025, creating internal spaces for researchers to share work, address common challenges, and seed cross-faculty collaboration. This quarterly model is explicitly framed as a mechanism to grow research capacity “from within”, and to normalise research uptake thinking across CPUT’s scholarly community.
CPUT’s national and international partnerships in 2025 reflect a maturing, strategically aligned footprint that advances Vision 2030, strengthens the Research Focus Areas, and supports the sustainability of key research chairs.
In 2025, the SIP Directorate advanced a comprehensive internationalisation agenda that integrates research, learning and teaching, and community engagement, positioning CPUT as a globally connected African university of technology. As shown in Table 28 below, the institutional footprint now spans partners across Africa, Europe, Asia, North America, and Latin America, with more than 100 active international agreements and a robust network of national collaborations with government, science councils, industry, NGOs, and higher education institutions. This footprint directly supports Vision 2030 by enhancing CPUT’s reputation, graduate competitiveness, and role as an innovation anchor in the region.
The international partnerships portfolio consolidated and expanded relationships across Africa, BRICS, and the Global North, with a deliberate emphasis on equitable, mutually beneficial collaboration that underpins Vision 2030’s global engagement priorities. New and deepened agreements with institutions such as North Carolina Agricultural and Technical State University, Esslingen University of Applied Sciences, Montana State University, the University of South Alabama, Karel de Grote University of Applied Sciences and Arts, University of Exeter, and Campus France created platforms for staff and student mobility, joint curriculum development, Collaborative Online International Learning (COIL), collaborative research, and third-party funded projects across all faculties (Table 29).
Table
Table 30. Types of international MoU’s, 2025
A key 2025 milestone was the North Carolina Agricultural and Technical State University (NCAT) delegation visit on 21 July, which culminated in a formal MoU signing between the two Vice- Chancellors, and activation of themed networking groups (Fig. 66). This visit consolidated prior virtual engagements into a long - term alliance spanning entrepreneurship, micro - credentialing, student affairs, and joint academic initiatives, illustrating Smart internationalisation as a strategic, multi- dimensional partnership, rather than ad hoc mobility. The SIP-led programme ensured that deans, researchers, and professional staff were directly involved, aligning the partnership with CPUT’s Vision 2030 priorities of curriculum renewal, student success, and innovation-driven research.
Figure 66. MoU Signing between CPUT and the North Carolina Agricultural and Technical State University
Networks and Alliances
Participation in national and global conferences and networks enabled CPUT to broker new collaborations, open additional mobility pipelines, and position itself as a partner of choice for high-impact, transdisciplinary projects.
• Asia-Pacific Association for International Education (APAIE)
• African Network for Internationalization of Education (ANIE)
• International Education Association of South Africa (IEASA)
• Southern African Regional Universities Association (SARUA)
• South Africa–Sweden University Forum (SASUF)
• Southern African-Nordic Centre (SANORD)
• Technological Higher Education Network South Africa (THENSA)
• UN Sustainable Development Solutions Network (SDSN)
• Universities South Africa (USAf)
The Directorate also hosted and managed multiple incoming delegations (e.g., Open University of Tanzania, Canada–South Africa Education Delegation, NCAT, Montana State University, HS Pforzheim, SANDA University) to activate partnerships, explore new project opportunities, and enhance CPUT’s international visibility (Fig. 67).
2025 Student Mobility
In 2025, the SIP Directorate supported a significant expansion of student mobility, with a total of 68 inbound and 5 outbound exchanges recorded across the two main semesters (Table 31). Semester 1 saw 15 inbound and 4 outbound students, primarily between the Faculty of Business and Management Sciences (FBMS) and partner institutions in Germany, alongside exchanges involving the Faculty of Health and Wellness Sciences (FHWS) and the Faculty of Applied Sciences (FAS), and an incoming placement from Norway. In Semester 2, inbound mobility increased sharply to 53 students, driven by strong Erasmus-linked flows from Germany, France, Belgium, the Netherlands, and the Democratic Republic of Congo into the Faculties of Business and Management Sciences, Engineering and the Built Environment (FEBE), and Applied Sciences, while outbound mobility comprised one Engineering student to France. The 2025 mobility profile reflects a predominantly inbound pattern, consolidating CPUT's partnerships in Europe and Africa, and contributing to the internationalisation of the student experience across multiple faculties.
Table 31. Student mobility by faculty and country, 2025
Figure 67. Visiting Delegation from the Open University of Tanzania
Staff Mobility
The 2025 staff mobility is shown in Table 32, with a total of 10 outbound exchanges recorded for staff across the various faculties.
Table 32. Staff mobility by faculty and country, 2025
3.2.9 Technology Transfer and Industrial Linkages
The Technology Transfer and Industry Linkages (TT&IL) Directorate continued to strengthen CPUT’s role as a leading university of technology that delivers innovation with societal impact. Aligned with Vision 2030, and in compliance with the Intellectual Property Rights from Publicly Financed Research and Development Act (IPR Act), during 2025, the Directorate focused on reinforcing the integration of intellectual property management, commercialisation, and entrepreneurship within the research ecosystem, ensuring that innovation outcomes translate into meaningful value for industry, communities, and the broader economy.
Strengthening the Innovation Ecosystem
The TT&IL Directorate continued to deepen partnerships across academia, government and industry during 2025. International engagement during Cape Town Tech Transfer Week enabled CPUT to host approximately 20 international delegates from the global technology transfer community, who engaged with CPUT Technology Stations, and explored opportunities for collaboration centred on technology skills transfer and innovation system strengthening. This engagement enhanced the international visibility of CPUT’s technology portfolio, and positioned the Institution as a contributor to global innovation networks.
Collaboration with the Department of Water and Sanitation further strengthened interdisciplinary innovation through the Innovative Sanitation Resource Recovery and Recycling Challenge, aligned with Sustainable Development Goal
6.2 (Fig. 68). The initiative attracted 131 student applications, with 40 candidates participating in an intensive innovation bootcamp, and nine competing in a formal pitching event, judged by national innovation stakeholders. The initiative demonstrated the potential of student-led innovation to address pressing national challenges, while contributing to the technology transfer pipeline.
Figure 68. CPUT participation at the 2025 Innovation Bootcamp (Innovative Sanitation Resource Recovery and Recycling Challenge)
Intellectual Property Portfolio
CPUT maintains a substantial Intellectual Property (IP) portfolio, with a total of 95 in 2025, spanning patents, know-how, and designs across all faculties, reflecting more than a decade of IP activity (Table 33). The portfolio continues to grow through new disclosures assessed and approved by the ICE Committee, and is being migrated onto the Inteum platform.
Single Sensor CMM; food supplements; SlowRedT; Aloesin purification
Licensed/ Seeking leads S-band transmitter suite (AAC/NSS); Coastal Observer Buoy suite; RPAS Avionics Design FAS Seeking leads Fish drying frame
New Disclosures 2025 All faculties Assessed by ICE Committee 12 new disclosures received in 2025
Invention Disclosures
Twelve invention disclosures were assessed by the ICE Committee during 2025, spanning health and wellness sciences, environmental sustainability, inclusive design, energy, and food security (Table 34). Nine were classified as actionable, and three as conditional upon resolution of specific commercial, technical, or supply chain requirements.
1 Preparation of pure Aspalathin and D-pinitol from Rooibos
2 Large-scale purification of Aloesin and metabolites from Aloe sap by-products
3 Prototype cosmetic from Protea sp. waste for skin conditions
4 Rooibos phenolipid (phytosome) for enhanced polyphenol bioavailability
5 Protein-encapsulated rooibos nutraceutical as ergogenic aid
6 Inclusive Graduation Gown for wheelchair users
7 Smart monitoring of low-voltage networks to combat illegal electricity connections
8 Winery Waste & Wastewater Valorisation via Anaerobic Digestion
9 Rural E-Waste Collection App
10 Floating Backpack to prevent drowning in school children
11 Compact Modular Vertical-Axis Wind Turbine (VAWT) for Urban Deployment
12 Adaptive Carrier Bag for Enhanced Accessibility for Wheelchair Users
Table 34. Total number of invention disclosures received in 2025
Showcasing Innovation and National Impact
CPUT research continued to gain national recognition for its societal contribution during 2025. Two institutional innovations were selected for inclusion in the Universities South Africa (USAf) 2025 Societal Impact Case Study initiative, demonstrating measurable improvements in public health and community well-being:
• The Circumfort medical device, supporting improved postcircumcision healing outcomes (Fig. 69); and
• Rooibos health research led by Prof Jeanine Marnewick, contributing to global understanding of rooibos’ health-promoting properties.
These case studies demonstrate tangible socio-economic impact arising from publicly funded research, and reinforce the effectiveness of CPUT’s technology transfer ecosystem.
Actionable
Actionable
Actionable
Actionable
Actionable
Actionable
Table 33. Summary of CPUT intellectual property (IP) portfolio by faculty, 2025
Figure 69. Institutional Innovation: Circumfort medical device
Entrepreneurship and Economic Activation
Entrepreneurship development remains a key pillar of TT&IL’s work. The Economic Activation Office (EAO), hosted within the Directorate, continued to support student innovation and entrepreneurial capacity building. During 2025, approximately 153 students were engaged through competitions, entrepreneurship programmes and activation initiatives, with the EAO having supported more than 1,100 students since its establishment in 2023.
a) National Entrepreneurship Development in Higher Education (EDHE) Entrepreneurship Activities
Seven CPUT students participated in national Entrepreneurship Development in Higher Education (EDHE) activities, including the first CPUT student cohort to attend the EDHE Lekgotla and Studentpreneurs Indaba. Two CPUT students (Mr Vuyo Mguce – Department of Mechanical Engineering, and Ms Nolungelo Siwela – Department of Electrical Engineering), mentored by the EAO, won prizes at the ABSA x YAEI Youth Entrepreneurship Programme, from a national cohort of 150 participants (Fig. 70). In addition, CPUT received the following awards and recognition:
• Ms Jayde Barends — EDHE Recognition Award as Chair of the Community of Practice for Economic Activation
3.3 Student Support and Development Initiatives
The Division of Student Affairs (DSA) plays a pivotal role in providing a range of comprehensive services to CPUT students and the CPUT community, to support and promote healthy student development, adjustment, mental health, and wellness in both academic and personal domains.
3.3.1 Student Success and Development Programmes
Peer-Support Programme
The Residence Peer Helper Programme specifically supports emotional and social well-being by training senior residence students to guide peers who may be struggling with academic or personal challenges. Peer Educators, Residence Peer Helpers, and Diversity and Inclusivity Ambassadors work collaboratively, alongside Higher Health, to equip students with the knowledge and skills needed to make safer, healthier life choices. These initiatives provide proactive support in residences by ensuring that trained peers are available, connecting students to counselling services when necessary.
Access to Health and Wellness Services
In 2025, DSA carried out quarterly health - screening campaigns during Semesters 1 and 2, which included more than 40 mobile wellness visits to student residences. These initiatives offered comprehensive health and wellness assessments aligned with the Well - Being Framework, ensuring students have access to integrated healthcare services.
From January to November 2025, a total of 25,421 students, representing 66,5% of the student population, participated in the preventative health and screening programmes. Within this period, 1,967 students received HIV testing and counselling, while 7,537 students were screened for tuberculosis. Of these, 1,960 symptomatic students were referred for further testing.
Individual Counselling and Therapy
The DSA’s Student Counselling Unit provided individual counselling and therapy support to registered students, focusing on the diagnosis and treatment of a wide variety of psychological and psychiatric conditions, and psychosocial support for students on a variety of life challenges. In 2025, a total of 823 students were supported through 3,049 facilitated sessions. Additionally, 73 support group sessions were conducted, and 502 individual student contacts were recorded for the year.
Main concerns encountered by students who were supported include:
• Anxiety, depression;
• Relationship challenges;
• Bereavement;
• Adjustment challenges; and
• Academic challenges.
Wellness Programme
The Wellness Programme promotes holistic student well-being, adjustment, and mental health through targeted psychoeducational initiatives. A total of 1,160 student engagements were recorded across 10 interventions, complemented by 10 campaigns, exhibitions, and events focusing on mental health, gender-based violence, substance use, and other key well-being themes.
Final-Year Experience Programme (FYEP)
The DSA initiative, delivered in collaboration with CPUT faculties, consolidates activities and resources for final-year students into a single, curriculum-integrated programme. In 2025, four faculties participated in the FYEP, enrolling 2,207 students across 21 academic programmes. A total of 44 workshops, offered through both face -to-face and online modalities, were facilitated, resulting in 3,255 recorded student engagements.
Sanitary Dignity Awareness and Advocacy Campaign
Despite the positive step taken by the South African government to remove tax on sanitary products, many poor and working-class women and girls who menstruate still struggle to afford these essential items. In response, DSA, in collaboration with the Office of the Vice-Chancellor, continues to lead a sanitary dignity awareness and advocacy campaign.
Through the Vice-Chancellor’s “Her Dignity Matters” Female Dignity Programme, CPUT supported female students by providing comprehensive dignity packs that include sanitary pads, toiletries, and other hygiene essentials (Fig. 71). With support from donors like the Mauerberger Foundation, this initiative aims to ensure that students can pursue their studies without the added stress of hygiene-related barriers.
Food Security Campaign
In 2025, DSA, working with the Faculty of Applied Sciences (FAS), Convocation, and Nautilus, implemented a food-drive campaign aimed at addressing student hunger. This initiative, known as the “One Residence, One Garden” project, was launched at Catsville Residence. As part of strengthening food security, the DSA also entered into a memorandum of understanding with Nurture Brands, which provided gardening tools and vegetable seeds to support the programme.
In addition, during July, DSA coordinated a food and sanitary dignity drive, encouraging both students and staff to contribute towards the Mandela Month initiative. Through this campaign, 123 food hampers were prepared, and 300 sanitary pads were donated (Fig. 72). Complementing these efforts, the Department of Biotechnology and Consumer Sciences partnered with the DSA to host a soup drive, offering meals to students, and contributing all collected donations to the Mandela Day activities.
Figure 72. CPUT Mandela Month initiative: soup drive (Left); and handing out of food hampers and sanitary pads (Right)
Figure 71. Vice-Chancellor, Prof Chris Nhlapo, handing over sanitary dignity packs
3.3.2 Experiential Learning, Employability, and Community Engagement
Workplace-Based Learning
In 2025, the Co-operative Education Unit supported the placement of a total of 8,868 students. In addition, 631 students completed their work-integrated learning (WIL) in the form of Project-based Learning, bringing the total of WIL students to 9,499.
Service-Learning
By the end of Quarter 4 in 2025, 66 Service-Learning projects were supported. These projects enabled 2,401 students to apply academic knowledge to real-world challenges aligned with the Sustainable Development Goals (SDGs). Through the DAAD CESAR project, the Service-Learning Unit continued to partner with the Namibia University of Science and Technology (NUST). On 12–13 November 2025, Service-Learning staff facilitated a workshop on “The institutionalisation of Service-Learning at NUST”. Through a partnership with Dubai Holding Group Services, three Hospitality students were placed for WIL with the Jumeirah Hotels and Resorts in Dubai. The students are scheduled to complete their WIL in January 2026.
SETA Partnerships
Through SETA WIL partnerships, valuable work placement opportunities were created for students. By the close of Quarter 4 in 2025, the Co-operative Education Unit, working in collaboration with the Advancement Directorate, began implementing WIL projects with Services SETA, merSETA, HWSETA, and BankSETA. These strategic partnerships opened doors for 504 students who gained placement opportunities in the 2026 academic year.
Graduate Employability and Destination
The Career Fair initiative undertaken in 2025 connected about 1,400 students with 25 employers during a one-day on-campus event, strengthening employability pipelines and industry visibility. A high-level report, which presents findings on the employability and primary activity of CPUT’s graduates who were conferred on their degrees in December 2023 and April 2024, was finalised in 2025. The final response rate was 22,1% (1,736 out of a targeted population of 7,855). The reported employment rate for this cohort is 41,7% (Fig. 73). These findings suggest that the employment outcomes of CPUT are generally positive for many graduates, and there is clear evidence of a strong drive towards further academic development (35,2%). However, a notable proportion of graduates (23,0%) still face challenges in entering the labour market.
Community Engagement
Through the Community Engagement Student Academy (CESA), a Health and Wellness Educational programme (UCDG project) took place on 31 October to 2 November 2025 in Langebaan on the West Coast. During this programme, the following activities were undertaken:
• Training and induction of students by experts;
• Community swimming gala run by students; and
• Beach clean-up, and health and wellness education activities for the community.
A partnership with Gift of the Givers, Department of Social Development, TRANSNET, and Camissa Solutions resulted in a Health, Wellness and Environmental Sustainability programme in Mossel Bay from 26 November to 1 December 2025.
3.3.3 Enhancing Accountability Through Quality Reviews
Quality at CPUT is not merely an aspirational concept, it is an institutional value embedded in everyday systems, practices, and shared accountability. Quality reviews are central to safeguarding the integrity, relevance, and excellence of academic offerings, while reinforcing institutional responsibility. These reviews follow a structured, cyclical, and reflective schedule that is developed collaboratively with faculties and departments, and approved annually by the Quality Assurance and Risk Management (QARM) Committee. This intentional and systematic process ensures consistency, transparency, and alignment with the University’s strategic priorities.
In 2025, CPUT successfully completed 17 quality reviews, including 11 internal qualification reviews, 4 external professional-body reviews, and 2 national reviews conducted by the Council on Higher Education (CHE). Highlights from the external reviews include:
• An interim ECSA visit to Mechanical and Mechatronics Engineering in March 2025;
• A successful four-day qualification review by the South African Nursing Council (SANC);
• A postponed site visit from the South African Dental Technicians Council (SADTC), pending building occupation certification, and CHE approval for the new delivery site;
• A review by the South African Council for the Quantity Surveying Profession (SACQSP) on 27 October 2025; and
• CHE’s Initial Teacher Education Review and Themed Review on Modes of Learning and Teaching Provision.
Key Enablers of Success
A major enhancement during this review cycle was the integration of independent student reflections into departmental Self - Evaluation Reports (SERs). This strengthened the authenticity and depth of reviews by ensuring the meaningful inclusion of student perspectives. Students also received preparatory briefings ahead of hybrid site visits to support informed participation.
Timely acceptance of invitations by academic peers ensured thorough preparation for review panel engagements. Clear communication channels and ongoing collaboration with Heads of Department (HoDs) resulted in consistent, rigorous, and professional review processes. Strengthened relationships with Professional Bodies further contributed to the success of the cycle.
Quality Improvement
CPUT continues to embed continuous quality improvement as a core pillar of its quality management system, extending beyond compliance to drive institutional enhancement. Quality Improvement Plans (QIPs), developed collaboratively with HoDs, ensure context-specific responses to review findings. These plans undergo regular approval, validation, and monitoring to ensure accountability.
In 2025, significant progress was achieved in refining and validating Departmental Quality Improvement Plans (DQIPs). The effective closure of DQIP items reflects strengthened systems, increasing maturity, and improved service delivery.
CHE Institutional Audit Quality Improvement Plan
CHE commended CPUT’s structured, thematic approach to its Institutional Audit Improvement Plan, and acknowledged the University’s extensive stakeholder engagement. It recommended further refinement of the plan to enhance the measurability and detail of improvement actions. A revised version was submitted to CHE in December 2025.
Departmental Quality Improvement Plans (DQIPs)
Between October 2024 and October 2025, three DQIP cycles were completed, supported by dedicated feedback sessions
and workshops for HoDs. These engagements improved understanding of DQIP processes, and strengthened institutional coherence.
Blue-Flag and Red-Flag Outcomes
CPUT continues to celebrate excellence through its quality culture. After validation, 37 departments achieved Blue -Flag Status for closing all DQIP matters. No departments received Red-Flag Status, demonstrating strong institutional progress, and improved accountability.
Doctoral Review QIP
Following CHE’s Progress Report on the Doctoral Degrees National Review (17 April 2025), all outstanding recommendations were addressed collaboratively by QMD, CPGS, and faculties. The validated progress report was endorsed by the Higher Degrees Committee (HDC) on 29 May 2025, and submitted to CHE, marking a major step in strengthening doctoral quality assurance.
Institutional Engagement and Quality Culture
Quality Roundtable Sessions created scholarly spaces for dialogue, data sharing, and reflective engagement, encouraging learning, and strengthening academic discourse.
Student Engagement in Quality Assurance expanded significantly in 2025. Over 12 student critical reflection sessions informed SER development across multiple departments. The Student Quality Desk contributed to the CHE Themed Review through faculty-wide focus groups and SER drafting. Quarterly engagements enhanced student participation in faculty quality forums.
Staff Participation increased through the Academic Staff Quality Desk (ASQD), which engaged over 150 academic staff across faculties. This marked the first time that academic staff across all ranks contributed directly to an institutional SER.
Capacity Building and National Collaboration: CPUT delivered targeted capacity-building workshops on review processes and quality standards, and advanced the rollout of Quality Management Practice Standards across key support units.
CPUT also co-hosted the 2nd Higher Education Quality Assurance Forum (HEQAF) with Unisa from 30 September to 2 October 2025, under the theme “Creating Adaptive Learning Environments.” The event brought together national stakeholders to reimagine quality assurance in a rapidly evolving higher education landscape.
Vice-Chancellor Prof NS Nhlapo
Section Four: Vice-Chancellor’s Report on Management and Administration
4.1 Executive Summary by the Vice-Chancellor
The 2025 academic year marked institutional consolidation, strengthened governance discipline, and measurable administrative progress at the University. As we continue advancing the ambitions of Vision 2030, the year under review demonstrates the University’s sustained commitment to effective management, operational efficiency, regulatory compliance, and institutional stability.
Throughout 2025, Management, and Administration were guided by a deliberate focus on strategic alignment, performance monitoring, and accountable implementation. Executive decision-making was anchored in the approved Terms of Reference, and aligned with the work plans of our governance structures, ensuring oversight remained structured, disciplined, and outcome-driven.
The Executive Management Team met regularly during the year, maintaining a clear strategic focus. These engagements prioritised the monitoring of institutional performance, financial sustainability, risk management, and progress against Vision 2030 objectives. Executive deliberations were characterised by evidence-based reporting, forward planning, and corrective action, where required. Importantly, these forums did not function as operational reporting sessions alone, but as strategic accountability platforms designed to ensure coherence between institutional planning and implementation.
The Management Committee (ManCom)
The Management Committee (ManCom), comprising members of Executive Management, Deans, and Senior Directors, continued to serve as a vital integrative body linking academic leadership and administrative divisions.
Through regular meetings, ManCom strengthened cross-functional coordination, and reinforced collective accountability for institutional performance. This collaborative approach significantly reduced silo-based practices, and enhanced operational coherence across faculties and support services.
The year was further marked by disciplined oversight of major institutional projects, including digital modernisation initiatives, infrastructure upgrades, academic programme enhancements, and transformation-related interventions. Executive monitoring ensured projects progressed within approved timelines and budget parameters, with risks identified and mitigated through structured review processes. This oversight strengthened the credibility of implementation, and reinforced the Council’s confidence in Management’s stewardship.
Financial governance in 2025 reflects the University’s continued commitment to accountability and transparency. The outcome affirms the integrity of our financial management systems, and reinforces stakeholder confidence in the University’s management of public resources.
In retrospect, 2025 stands as a year of strengthened governance maturity and administrative coherence. The alignment among executive oversight, cross-functional collaboration, and disciplined financial stewardship has placed CPUT on a stable trajectory towards the realisation of Vision 2030. With sustained Council oversight, accountable leadership, and a shared institutional commitment to excellence, CPUT remains firmly positioned to realise its strategic aspirations, and to serve as a responsive, ethical, and innovative university of technology.
4.2 Human Capital and Talent Management
The Human Capital (HC) division plays a central role in advancing institutional priorities, particularly under Vision 2030’s Focus Area 4, Goal 4: “Smart Human Capital and Talent”. CPUT’s staff establishment totalled 6,853 employees as of December 2025 (Table 35). Of these, 2,671 were permanently employed, while the remainder consisted of staff on fixed-term or part-time contracts. This composition, shaped in part by historical workforce patterns, reflects an ongoing instability that poses challenges for continuity and long-term sustainability within the University’s human capital environment.
Table 35. CPUT total number of staff in 2025
Over the five -year period leading up to 2025, the University made notable progress in recruiting and appointing skilled technical, academic, and professional support staff from designated groups. However, the termination trends illustrated in Figure 74 highlight the need to strengthen Human Capital management practices that support the retention of these employees. A similar emphasis will be placed on improving the recruitment, appointment, and retention of designated-group staff within the professionally qualified employment category.
Figure 74. Staff appointments versus terminations 2024 to 2025
Leadership Development Programme
In 2025, the Human Capital Learning and Development team, in partnership with Fundani (Centre for Teaching and Learning) and the Centre for Personal and Professional Development (CPDD), jointly developed a Leadership and Management Development Programme. The initiative responds to a common challenge experienced by both new and seasoned managers, who are often not formally equipped for the shift from subject-matter specialists, to leading teams and achieving results through others.
Designed to be inclusive, the programme targets emerging and aspiring leaders, team leaders, and coordinators. As CPUT continues to place greater emphasis on staff development, career growth, and retention, this initiative is expected to strengthen the University’s leadership pipeline, and support effective succession planning. Approved in 2025, the programme’s inaugural cohorts comprised 29 established managers, and 33 staff members preparing for or newly transitioning into leadership roles.
Employee Well-Being
The Lifestyle and Wellness Programme, now in its fourth year, continued to demonstrate strong uptake during 2025, indicating that staff value and make effective use of the service. During the year, the Lifestyle and Wellness Unit implemented a comprehensive action plan that included a series of campaigns focused on supporting employees’ physical, emotional, and mental well-being.
Employment Relations
The Employment Relations environment remained stable in 2025, supported by the Unit reaching full staffing capacity. This stability is reflected in the ongoing trend of cost containment, as illustrated in Figure 75, which demonstrates increased reliance on internal resources to manage and resolve matters. A total of 38 Labour Relations disputes and challenges were referred to the Commission for Conciliation, Mediation, and Arbitration (CCMA) during the year. Among these was the Organisational Rights dispute lodged by the Recognised Trade Unions (RTU) in the first quarter of 2025, concerning the interpretation of the Recognition Agreement finalised and signed by all parties in January 2023. Due to reduced CCMA capacity, the matter remained unresolved throughout the year, an outcome that is concerning, as it poses risks to labour relations stability and the preservation of institutional trust.
Figure 75. Labour relations costs Q4, 2024 to Q4, 2025
4.3 Physical Infrastructure, Including Student Accommodation
CPUT’s property and infrastructure portfolio is substantial, covering approximately 77 hectares (ha), and consisting of the following multiple campuses and sites, each with defined land areas and building counts:
i. Bellville Campus – 61,039 ha, consisting of 47 buildings
ii. Granger Bay Campus – 1,076 ha, consisting of 2 buildings
iii. Barkley Davies (Mowbray) – 0,589 ha, consisting of 2 buildings
iv. Mowbray Campus – 2,003 ha, consisting of 4 buildings
v. Petro SA (Tygervalley) – 0,317 ha, consisting of 1 building
vi. District Six Campus – 9,434 ha, consisting of 14 buildings
vii. Wellington Campus – 3,028 ha, consisting of 11 buildings
viii.Newlands Site – CPUT occupies a portion of one building on the site
Student Accommodation
In 2025, CPUT prioritised strengthening its strategies and interventions aimed at enhancing student accommodation and placement. The significant expansion of higher education in recent years has driven a growing demand for additional student housing, placing increased pressure on already limited institutional resources. As a result, universities are required to plan proactively, and ensure that students have access to safe, supportive, and conducive living environments, including off- campus accommodation that institutions do not directly manage.
In 2025, the total student accommodation capacity was approximately 16,200 beds. Of these, 6,080 were provided through CPUTowned residences, 6,772 through leased residences, and 3,419 through accredited accommodation providers.
Infrastructure Expansion
In line with meeting the growing demand of additional physical spaces for teaching and learning, as well as research endeavours, CPUT continued to invest in expanding its current buildings, and adding new buildings. In 2025, the following strategic infrastructure projects were undertaken:
i. Extension and alteration of Old Education (Health & Wellness) Bellville Campus (Phase 1): The main goal of this project is to consolidate the Faculty of Health and Wellness Sciences on the Bellville Campus, as part of CPUT’s strategic objectives. This project will assist in catering for the large growing number of students at the University. Progress update – project is ongoing.
ii. Extension of Food Technology Building (New Applied Sciences) on Bellville Campus: The main goal of this project is to construct a new Applied Sciences Building on the Bellville Campus that will cater for the large growing number of students at the University by consolidating the Faculty of Applied Sciences on the Bellville Campus. Progress update – project is ongoing.
iii. New Student Residences: The Institution received funding from DHET to build two new student residences, one on Bellville Campus and one on Mowbray Campus. The main goal of this project is to build a cost-effective residence, which meets DHET Student Accommodation Standards norms and standards, building regulations, and SANS standards. This project will assist in catering for the large growing number of students on the CPUT campuses. Progress update – project is ongoing.
iv. PetroSA – Tygervalley Campus facility fit-out: The Department of Dental Sciences was instructed by the landlord to vacate its existing premises, necessitating the development of an urgent and accelerated decanting plan. As a result, the department was required to relocate from the Tygerberg Hospital building by December 2023. Progress update – project is ongoing and almost completed.
4.4 Information and Communication Technology (ICT) Infrastructure
Aligned with CPUT’s Vision 2030, the Information and Communication Technology Services (ICTS) department plays a vital role in advancing institutional priorities, particularly under Focus Area 1, Goal 1: “Smart ICT environment and Smart ICT workforce”. In 2025, ICTS oversaw a portfolio of 13 projects – six strategic, and seven operational. Three projects were successfully completed, one was discontinued, and the remainder continued to advance, reflecting strong governance, consistent monitoring, and disciplined project execution. Highlights from the ICTS projects include:
• The Enterprise Resource Planning (ERP) Review Project completed its Request for Information (RFI) phase, with evaluations submitted to governance committees. Following approval, an open tender process was initiated.
• The E-Recruitment Project was realigned with Human Capital priorities, and a roadmap was developed to deliver priority modules by the end of Quarter 1, 2026, with full implementation expected in Quarter 2, 2026.
• The Academic Exclusions Project was completed and signed off. Phase 1 of the Auto-Promotions Project was finalised, with Phase 2 scheduled for early 2026.
• The Virtual Desktop Infrastructure (VDI) Project moved forward to procurement and infrastructure implementation stages.
Network Infrastructure Upgrade
The LAN and Wi- Fi Upgrade Programme, initiated in 2019, continued to deliver significant progress throughout 2025. By the end of the year, approximately 80% of outdated network infrastructure had been replaced with modern systems. Major upgrades were completed across the Wellington, Granger Bay, Mowbray, Catsville, EWR, Tygerberg Hospital sites, as well as portions of the Bellville and District Six campuses. These improvements have enhanced the scalability, stability, and security of the University’s network, enabling it to better support increased user volumes, device connectivity, and cloud-based services. This modernisation represents a key milestone in strengthening CPUT’s digital resilience, and overall service reliability.
Information Technology Service Management (ITSM) System
In October 2025, ICTS introduced its new IT Service Management (ITSM) platform, enhancing incident reporting, service request tracking, and overall operational visibility. This implementation has strengthened service continuity, and improved efficiency across the University.
Cybersecurity Awareness Programme
In 2025, ICTS rolled out a structured, faculty-aligned Cybersecurity Awareness Programme aimed at reducing cyber risk across the Institution. The programme engaged both academic and professional staff, and formed a key component of CPUT’s broader cybersecurity framework, which also incorporates vulnerability management, MDR services, and formal incident-response processes. Early participation was strong, with the faculties of Engineering and the Built Environment (FEBE) and Applied Sciences (FAS) achieving completion and accuracy rates above 90% in April and May 2025, respectively. These results demonstrate meaningful engagement, effective knowledge transfer, and a growing institutional commitment to cybersecurity best practice.
To further advance CPUT’s cybersecurity maturity, specialised executive -level and technical training was conducted, in partnership with Mimecast, in November 2025. Senior leadership participated in focused awareness sessions, while ICTS personnel and IT Coordinators undertook advanced technical training later in the month. This targeted, role -specific approach ensured that both strategic decision-makers and operational ICT practitioners are equipped with up -to - date competencies to anticipate, manage, and respond to evolving cyber threats.
4.5 Safety, Health and Environment (SHE)
The Safety, Health and Environment Unit, which is part of the Protection and Risk Services (PRS) Directorate, continued to play a vital role in ensuring that CPUT sustained a safe, healthy, and legally compliant working and learning environment throughout the 2025 academic year. Its key areas of focus included strengthening SHE governance structures, delivering safety training programmes, conducting workplace inspections, managing incidents, and promoting adherence to the Occupational Health and Safety (OHS) Act (Act No. 85 of 1993), as well as other relevant regulations. Across the reporting period, the SHE Unit collaborated closely with faculties, support departments, and campus stakeholders to identify potential hazards, reduce risks, and foster a proactive institutional safety culture.
Compliance with the Occupational Health and Safety Act No. 85 of 1993 and its Regulations
The University continued to strengthen its compliance with the OHS Act (Act No. 85 of 1993) through a range of measures, including:
• Appointing SHE Representatives;
• Delivering ongoing SHE training;
• Conducting formal risk assessments;
• Investigating incidents, and implementing corrective action; and
• Promoting safe and healthy working environments across all campuses.
SHE Governance
SHE governance structures continued to function across faculties and support departments to ensure compliance with statutory health and safety requirements. Key governance activities included:
• Functioning SHE Committees within faculties and support units;
• Appointment and participation of SHE Representatives;
• Engagement with departmental leadership on SHE compliance matters; and
• Reporting of safety concerns and recommendations through committee structures.
SHE Training and Awareness
Training remains a key strategy in strengthening institutional health and safety compliance. Table 36 highlights some of the SHE training provided in 2025. These training programmes assist the Institution in meeting legislative requirements, while empowering staff members to contribute actively to workplace safety.
First Aid Training (Level 1)
Representative Training
medical response and immediate treatment of workplace injuries until professional medical assistance arrives.
and safety monitoring, workplace inspections, hazard reporting, and supporting compliance with the OHS Act.
Legal Liability Training To equip Heads of Department (HoDs) with an understanding of their legal responsibilities and accountability in terms of OHS legislation.
Hazard Identification and Risk Assessment To enable staff to identify workplace hazards, assess risks, and implement appropriate control measures to prevent incidents and injuries.
Table 36. SHE training provided in 2025
Health and Safety Inspections and Risk Assessments
In 2025, the SHE Unit carried out inspections and risk assessments across all campuses to identify potential hazards, and recommend appropriate corrective actions. These inspections play a vital role in detecting risks early, and assisting departments in implementing preventative safety measures. Key focus areas included:
• Laboratories and research facilities;
• Kitchens and food preparation areas;
• Workshops and technical training environments;
• Offices and administrative areas; and
• Construction and maintenance projects.
Fire Safety and Emergency Preparedness
Fire safety remains a critical component of campus safety management. During 2025, the SHE Unit supported the Institution through:
• Fire safety inspections in various buildings;
• Appointment of Fire Marshals;
• Monitoring of fire safety compliance;
• Engagement with Facilities Management regarding fire safety systems; and
• Several buildings held emergency evacuation drills.
Incident Statistics
During the 2025 reporting period, a total of 38 incidents were recorded across the Institution’s campuses and departments (Table 37). All incidents were documented, investigated where required, and appropriate corrective actions were recommended to prevent future occurrences. Most reported cases were disabling injuries that required medical treatment, and resulted in employees taking time off work. Importantly, no fatalities were reported during this period. Overall, workplace incidents in 2025 led to a combined total of 204 lost workdays due to employees recovering from injuries sustained while performing their duties.
Table 37. Total number of incidents reported in 2025
4.6 Protection and Risk Services (PRS)
The Protection and Risk Services (PRS) Directorate plays a central role in safeguarding CPUT’s community, assets, and operations through integrated security, safety, and risk-management services. In 2025, the Directorate further strengthened campus safety, improved operational effectiveness, and advanced the University’s strategic goals by enhancing security management systems, deploying technology- driven solutions aligned with Vision 2030, and reinforcing regulatory compliance.
Campus Protection Services
Campus Protection Services maintained a strong security presence across university campuses, and played a central role in ensuring a safe environment for teaching, learning, and administrative operations. Key achievements in 2025 included:
• Strengthened 24-hour security operations – improving incident response times across multiple campuses;
• Enhanced access control procedures – resulting in improved management of visitor and contractor access;
• Increased proactive patrol operations – contributing to a reduction in security incidents, and improved visibility of security personnel;
• Successfully supported major university events – such as graduations, student activities, and examinations, ensuring safe and orderly operations; and
• Improved collaboration with law enforcement and emergency response services – strengthening coordinated incident management.
Security Technology Services
The Security Technology Unit continued to modernise and maintain the University’s electronic security infrastructure, ensuring technology effectively supports operational security. Key achievements in 2025 included:
• Expansion and optimisation of the CCTV surveillance network – improving monitoring capabilities across campuses;
• Upgrades to access control systems – strengthening security at critical facilities and restricted areas;
• Implementation of enhanced system monitoring and maintenance protocols – ensuring reliability and operational continuity;
• Improved integration between electronic security systems and operational security teams – enabling quicker response to incidents; and
• Ongoing technical support and system improvements – to enhance situational awareness for Campus Protection Services personnel.
Investigations Services
The Investigations Unit played a critical role in supporting institutional governance through the professional investigation of security incidents and policy violations. Key achievements in 2025 included the following:
• Conducted investigations into security incidents, misconduct, and Student Rules violations within the university environment;
• Strengthened case documentation and evidence management processes to support internal disciplinary processes;
• Improved collaboration with internal stakeholders and external law enforcement agencies where criminal matters were involved;
• Contributed to the identification of risk patterns and preventative measures to reduce recurring incidents; and
• Supported institutional integrity by ensuring accountability through thorough investigative processes.
Transport Services
The Transport Unit ensured the efficient and safe management of university transport, students and staff shuttle services and fleet operations. Key achievements in 2025 included the following:
• Improved fleet management processes – ensuring effective allocation and utilisation of university vehicles;
• Through the contracted Staff and Students Shuttle services – supported academic and administrative departments through reliable transport services for operational activities;
• Strengthened vehicle maintenance and safety procedures – contributing to safe and reliable transport operations;
• Improved coordination of transport logistics for university events and institutional programmes; and
• Ensured compliance with transport safety regulations and operational standards.
Vice-Chancellor
Prof NS Nhlapo
Section Five: Strategic Plan Achievements –Vision 2030
5.1
Strategic
Focus Areas, Goals and Objectives
Over the past five years, CPUT has been guided by its long-term Strategic Plan 2021–2030, One Smart CPUT Vision 2030, in advancing its aspiration to become a Smart University of Technology (UoT) that is globally recognised for innovation, and for producing graduates who contribute meaningfully to a better world. The seven strategic focus areas and associated goals outlined below are directed at enabling the achievement of Vision 2030, One Smart CPUT:
Smart teaching and learning environments
Smart RTIP that is relevant and has impact
Executing the Mission11:
2. Becoming the leading UoT in smart teaching and learning and being on the forefront of creating smart learning environments that will provide excellent and relevant content and learning experiences for all CPUT students.
3. To increase CPUT's trans/ multi and interdisciplinary focus on Mode 2 and 3 knowledge production through strategic research initiatives to develop smart technology-driven solutions.
Objectives
2.1 Develop programmes that will prepare students for the future.
2.2 Review and adjust teaching methodologies and delivery modes in line with CPUT's graduate attritbutes.
2.3 Student readiness for the world of work.
3.1 Develop the research capacity of a future generation of researchers/scholars and innovators, putting CPUT at the forefront of innovation in its broadest sense.
3.2 Develop relevant research focus areas and strengths with continuing empasis on research in Mode 2 and 3, and some Mode 1 where relevant.
3.3 Strengthen the link between research focus areas, programme development of future-looking qualifications in postgraduate programme offerings.
In Support of the Mission:
Smart CTS environments and CTS Workforce
1. Ensure that CTS will support CPUT's core functions through a highly effective and secured technology platform
Smart human capital and talent
4. Promote a culture of humancentricity and smart people of integrity, mutual respect, and excellence, who nurture collaboration, and are innovative in support of One Smart CPUT
5. To develop a unique CPUT multi/ global cultural community by building capacity and awareness in teaching and learning, research, innovation, and egagement, that will ensure students and staff can act as global scholars, employees, and employers
1.1 Providing CTS services that will support and enhance smooth student administration and recruitment, student placements (also in residence), and key academic support programmes for students and staff, including for postgrduate students and research.
1.2 Playing a leading role in creating awareness of technoligical advancements and how they can enhance/ enrich the total student experiences of CPUT's students, and assist all staff in working smarter and more productively.
1.3 Ensure CTS support the enhancement of research outputs, scholarship, and community engagement activities/projects.
1.4 Support, upgrade, and enhace current administrative/ business and governance processes tools.
1.5 Ensure CPUT is secured from cybersecurity threats.
1.6 Recruit and retain high-performing CTS staff that will contribute to establishing One Smart CPUT.
4.1 Re-imagine the CPUT workforce performing in a technology-driven and inspired environment, having the appropriate skill sets, attitudes, and ability to adjust to the notion of One Smart CPUT.
4.2 Create a smart CPUT community that will contribute to a unified CPUT collective and unified identity – known for mutual respect and a deep appreciation for diversity and issues of transformation.
5.1 Create a multi/global cultural environment at CPUT for staff and students to recognise and undersatnd their place in Africa and the world.
5.2 Strengthen CPUT's international profile and visibility.
5.3 Attracting smart international students and staff.
In Support of the Mission:
Focus Area Goal
Smart engagement and strong links with Quintuple Helix partners
Smart student engagement and learning experiences
6. Ensure the relevance and excellence of CPUT's academic and research programmes through the development of linkages within a quintuple helix environment
7. A smart holistic CPUT sutdent experience
Objectives
6.1 Develop a 4x4 engagement strategy with our four primary communities (civil society, industry, government, and academia).
6.2 Champion social, cultural, and economic growth in CPUT's region.
7.1 Build a capacity of students to engage in a CPUT student experience in ways that are both individually transformative, and that build the social capital of CPUT and its broader community.
7.2 Embed a suite of comprehensive and quality services for students that are integrated, responsive, and focused on supporting students' holistic well-being, academic success, and supported by smart technologies.
7.3 Support a dynamic sudent community through the provision of quality learning and social environments and experiences.
7.4 Facilitate opportunities for students that will provide them with leadership development opportunities and provide interantional exposure through smart technologies, work-based learning, and community outreach programmes – developing caring and socially responsible citizens.
7.5 Engage in constructive conversations and difficult dialogues.
As the University continues to advance strategically in education, research, and community engagement, aligned with national and global priorities articulated in frameworks such as the National Development Plan (NDP) 2030, White Paper 3 of 1997, Africa’s Agenda 2063, and the United Nations’ Sustainable Development Goals (SDGs) 2030, it remains cognizant of the diverse local, national, and global factors that influence CPUT’s operations. In an increasingly complex and dynamic environment, the University’s strategic planning processes must therefore demonstrate resilience, flexibility, adaptability, and innovation to ensure institutional sustainability amid ongoing uncertainty.
Strategy Implementation and Monitoring
Since the implementation of Vision 2030 in 2021, the University has made substantial progress towards the realisation of its strategic priorities. On an annual basis, faculties and support divisions assess their performance against the Strategic Plan’s goals and objectives by reflecting on institutional achievements and challenges. Informed by these reflections, each entity develops performance plans and targeted intervention strategies for the subsequent academic year. This cyclical process ensures that operational planning remains closely aligned with the University’s strategic direction.
At the institutional level, the Institutional Strategic Planning Committee (ISPC) provides oversight of the operationalisation of Vision 2030 across faculties and support divisions. The Committee is furthermore responsible for monitoring the implementation of the Strategic Plan, including ensuring that Vision 2030 is reviewed regularly, and updated as required, to remain responsive and relevant.
5.2 Report on the Annual Performance Plan 2025: SMART Key Performance Indicators
This report presents an analysis of CPUT’s performance regarding the targets set in its Annual Performance Plan (APP) for 2025, as submitted to the Department of Higher Education and Training (DHET) in December 2024. According to DHET’s Implementation Manual for Reporting by Public Higher Education Institutions, the University’s performance assessment report should reference the “key performance indicators and targets as stated in the Annual Performance Plan” (Government Gazette, No. 37726, 9 June 2014).
Most targets outlined in the APP can also be found in the University’s Student Enrolment Plan for 2020–2025, submitted in 2019. The approved Mid-term Review of the Enrolment Plan was used to develop the 2024 APP. As a result, compared to previous years, some targets have changed for the remainder of the Enrolment Plan 2023–2025.
The numbers for 2025, presented in the subsequent tables, are based on the second Higher Education Management Information System (HEMIS) submission, and provisional unaudited HEMIS data as of March 2026. The final HEMIS submission to DHET, to be concluded at the end of July 2026, will be the official record of the University’s data.
The layout of the tables, as presented below, is based on the templates provided by DHET. The tables provide the 2025 targets and actuals, with comparative data for 2023 and 2024. The tables also offer a three-year trend analysis of access and success in enrolment planning.
5.2.1 Access: Key Performance Indicators
The key performance indicators (KPI's) listed for Access are aligned with Strategic Goal 2: “Becoming the leading UoT in smart teaching and learning and being on the forefront of creating smart learning environments that will provide excellent and relevant content and learning experiences for all CPUT students”.
Analysis and notes for A1–A6: Access category
Based on the data presented in Table 38, on the following page, CPUT has recorded an increase in overall student headcount enrolments from 35,482 in 2023, to 38,228 in 2025 (based on the provisional unaudited data). The recorded increase in student enrolments is in line with the University’s strategic objective of increasing access to higher education.
A1: According to the data, the overall student headcount enrolment target for CPUT in 2025 was 38,430, and the Institution was below the target by 0,5%, with an actual student headcount enrolment of 38,228. Based on the provisional data, the overall student headcount enrolments were within the enrolment threshold of ±2% in 2025, even though they were slightly below the target by 202 headcounts. This represents a 7,7% improvement, compared to 2023 actuals, and suggests a significant improvement in actual enrolments over the three years under analysis.
A2: The data indicates that CPUT has met its 2025 target for the First-Time Entering (FTEN) UG sub-category (9,279). The target for this sub-category was 9,295, and the Institution was below the target by 16 headcounts, but still within the enrolment threshold.
A3: Based on the data, the Foundation FTEN UG sub-category at CPUT was below the target by 16,1% in 2025.
A4: According to the data, the Headcount Enrolments Total UG category met and exceeded the target by 2,7% (928) in 2025, while the Headcount Enrolments Total PG category was below target by 26,9% (1,146). The data also shows a decline in enrolment of occasional students, from 125 in 2023 to 52 in 2025.
A5: In terms of Enrolments by Major Field of Study, within the Science, Engineering, Technology (SET) sub-category, the University met and exceeded its target in 2025 by 6,7% (1,217); with actual enrolments of 19,322 against a target of 18,105. This is an improvement compared to previous years.
For the Business/Management sub-category, the second-largest major field of study, contributing 28,3% of the overall headcount enrolment, the University was below target by 16,3% (2,102), with actual enrolments of 10,813 against a target of 12,915.
The Education sub-category met and exceeded the target by 19,8% (801) in 2025, with actual enrolments of 4,850 against a target of 4,049.
The Other Humanities sub-category was below the overall enrolment target by 3,5% (118).
Lastly, the Distance Education enrolment was below target by 33,7% (131), with actual enrolments of 258 against a target of 389.
A6: The final category for access pertains to the demographic profile of enrolled students. According to the data, there was an increase in the percentage of African students, from 77,7% in 2023 to 81,9% in 2025, the latter was above target by 7,3 percentage points. Conversely, the percentage of Coloured, Indian, and White students was below target by 5,2; 0,1 and 2,3 percentage points, respectively, in 2025. The enrolment of female students increased from 58,7% in 2023, to 59,1% in 2025; the latter was above target by 3,6 percentage points.
A. Access
A. Access
Performance Indicator
Demographic Profile
* Provisional unaudited data
ACCESS KPIs:
Reasons:
This under achievement could be attributed to:
• The high proportion of students who drop out for various reasons;
• The fact that during the registration period, the enrolment target was met in certain instances. However, cancellations (about 6% of the initial enrolments) were recorded before the CENSUS date, and subsequently not included in the final audited HEMIS data; and
• Unrealistic targets were set for some of the KPI’s, which was not reflective of the changing context.
Interventions:
• As part of the CPUT student success strategy, numerous data-driven student support interventions are being implemented to mitigate the high drop out rates, thus improving completion rates. Examples include the Siyaphumelela initiatives.
• Realistic targets have now been set for the new enrolment planning cycle (2026–2030).
• CPUT has put in place systems to monitor enrolments, especially during the registration period. This will help in identifying areas where there are over-enrolments.
The KPI's listed for Success are aligned with Strategic Goal 2: “Becoming the leading UoT in smart teaching and learning and being on the forefront of creating smart learning environments that will provide excellent and relevant content and learning experiences for all CPUT students”.
Analysis and notes for B1–B7: Success category
Table 39, on the following page, shows that CPUT's success rate has improved over the past three years (2023–2025).
B1: The number of UG Graduates has increased from 6,997 in 2023, to 8,623 in 2025 (provisional data). The University exceeded its target by 2,4% (199) in 2025.
B2: The UG Degree Credit Success Rate indicator measures the percentage of credits that UG students have completed towards their degree programmes. The University recorded an improvement from 78,6% in 2023, to 86,4% in 2025. The University exceeded the target by 1,4 percentage points in 2025.
B3: The number of PG Graduates has increased from 888 in 2023, to 1,234 in 2025 (provisional data). However, the University was below target by 29,6% (518) in 2025.
B4: The University recorded an improvement in the PG Degree Credit Success Rate from 77,6% in 2023, to 123,0% in 2025. It should be noted that, in calculating PG success rates, the HEMIS factor is used as the enrolled factor, while the research factor is used as the completed factor (FTE degree credits). Therefore, a PG success rate of more than 100% in some instances is possible, as the HEMIS factor depends on how long the students take to complete their degrees.
B5: In the Overall Degree Credit Success Rate category, the Institution recorded an improvement from 78,6% in 2023, to 88,4% in 2025. The University met and exceeded the target in 2025 by 3,8 percentage points.
B6: Overall, the Success Rate by the major fields of study recorded an improvement between 2023 and 2025.
The SET sub-category improved its success rate from 77,8% in 2023 to 88,2% in 2025. The University met and exceeded the target by 5,2 percentage points in 2025.
On the other hand, the Business/Management sub-category improved its success rate from 73,8% in 2023, to 84,7% in 2025. The University exceeded the target by 1,7 percentage points in 2025.
The highest success rate among all faculties was in Education, at 97,1%, which exceeded the target set by 1,1 percentage points in 2025.
Lastly, the Other Humanities sub-category improved its success rate from 81,0% in 2023, to 89,8% in 2025. The University exceeded the target by 2,8 percentage points in 2025.
B7: Overall, the Undergraduate Output by Scare Skills category recorded an improvement between 2023 and 2025.
The Engineering sub-category improved its number of graduates from 1,202 in 2023, to 1,656 in 2025. The University was below the target by 10,7% (199) in 2025.
The Life and Physical Sciences sub-category improved its number of graduates from 364 in 2023, to 431 in 2025. The University was below the target by 33,3% (215) in 2025.
The Animal Science sub-category improved its number of graduates from 1 in 2023, to 4 in 2025.
The Human Health sub-category recorded an improvement in its number of graduates from 464 in 2023, to 556 in 2025. The University was above the target by 24,7% (110) in 2025.
The Teacher Education sub-category improved its number of graduates from 897 in 2023, to 1,003 in 2025. The University exceeded the target by 15,4% (134) in 2025.
B. Success
* Provisional unaudited data
SUCCESS KPIs:
Reasons:
This under achievement could be attributed to:
• The high proportion of students who drop out for various reasons;
• The phasing out of non-aligned Engineering qualifications; and
• Unrealistic targets were set for some of the KPI’s, which was not reflective of the changing context.
Interventions:
• A number of new qualifications have been developed and submitted for approval by DHET, accreditation by CHE, and registration by SAQA. Once these have been implemented fully, it is anticipated that the number of graduates will gradually increase in the coming years.
• As part of the CPUT student success strategy, numerous data-driven student support interventions are being implemented to mitigate the low completion rates.
The KPI's listed for Efficiency are aligned with Strategic Goal 3: “To increase CPUT’s trans/multi and interdisciplinary focus on Mode 2 and 3 knowledge production through strategic research initiatives to develop smart technology-driven solutions.”
Analysis and notes for C1–C6: Efficiency category
This category evaluates the performance of professional staff in terms of efficiency in instruction and research (Table 40). It is divided into four sub-categories:
• Headcount of Permanent I/R Staff;
• Percentage of Staff with Doctoral and Master’s degrees;
• Number of New Generation of Academics Programme (nGAP) Staff; and
• Ratio of Full-Time Equivalent (FTE) Students to FTE I/R Staff.
C1: The permanent I/R staff complement decreased to 793 in 2025, down from 813 in 2024, and remained significantly below the set target by 17,4% (167 posts).
C2: The FTE Instruction/Research Staff sub-category was recorded at 768,1 in 2025, which is a decline from 785,6 in 2024, and below the target by 38,8% (485,9 FTEs).
C3: The Percentage of Staff with Doctoral Degrees sub-category recorded an improvement from 34,5% in 2023, to 41,2% in 2025. However, the University was below the target by 0,8 percentage points in 2025.
C4: The Percentage of Staff with Master’s Degrees sub-category was recorded at 46,8%, which was above the 2025 target by 10,8 percentage points.
C5: The number of nGAP Staff sub-category recorded an improvement from 27 in 2023 to 29 in 2025. However, the University was below the target by 29,3% in 2025.
C6: The Ratio of FTE Students to FTE I/R Staff sub-category was recorded at 39,8 in 2025, which deviates from the target by 16,6 points. This could be attributed to the decline in the permanent I/R staff in 2025.
C. Efficiency
* Provisional unaudited data
EFFICIENCY KPI:
Reasons:
This under achievement could be attributed to:
• Various factors, including staff retirements and resignations, especially of academic staff with PhDs; and
• Unrealistic targets were set for some of the KPI’s, which was not reflective of the changing context.
Interventions:
• CPUT has put in place a strategy aimed at increasing the number of academic staff with PhDs to 50% by 2030.
• A talent management strategy will be implemented to try to retain staff with potential.
The KPI's listed for Efficiency are aligned with Strategic Goal 3: “To increase CPUT’s trans/multi- and interdisciplinary focus on Mode 2 and 3 knowledge production through strategic research initiatives to develop smart technology-driven solutions.”
Analysis and notes for D1–D3: Research category
The category of research output encompasses various aspects of academic performance, namely, research output, Master’s graduates achievement, and unweighted Doctoral graduates performance (Table 41).
D1: The Publication Units increased by 74.7, from 325.7 in 2023, to 400.4 in 2025. However, the University was below the target by 22,4% (115.6 units) in 2025.
D2: The Publication Units per Permanent I/R Staff recorded an increase from 0.38 in 2023, to 0.50 in 2025.
D3: The Master’s graduates achievement and unweighted Doctoral graduates performance was recorded at 102 and 56, respectively, for 2025. Despite this performance, both the Master’s (-58,0%; -141) and Doctoral graduate (25,3%; -19) output were below the set targets for 2025.
D. Research Output
* Provisional unaudited data
RESEARCH KPIs:
Reasons:
This under achievement could be attributed to:
• Various factors, including staff retirements and resignations, especially of academic staff with PhDs;
• The phasing out of several DTech qualifications, thus leading to low graduate outputs;
• The challenges associated with in-time allocation of doctoral students to suitable supervisors and moderators; and
• Unrealistic targets were set for some of the KPI’s, which was not reflective of the changing context.
Interventions:
• CPUT aims to increase the number of academics with PhDs to improve the provision of supervisory capacity to postgraduates, including doctoral students.
• CPUT has put in place a strategy aimed at increasing the number of academic staff with PhDs to 50% by 2030.
• A number of new qualifications have been developed and submitted for approval by DHET, accreditation by CHE, and registration by SAQA. Once these have been implemented fully, it is anticipated that the number of graduates will gradually increase in the coming years.
Chairperson of Council Vice-Chancellor
Dr LF Platzky
Prof NS Nhlapo
Table 41. Research key performance indicators, 2023–2025
Section 6: Transformation Report
The Centre for Diversity, Inclusivity and Social Change (CDISC) is mandated to steer institutional transformation. Two governance structures play a key role in the realisation of transformation, namely, the Institutional Transformation Forum (ITF), and the Institutional Gender-Based Violence Committee (IGBVC). The purpose of the ITF is to ensure that the University complies and performs in accordance with the government and institutional legislations, policies and laws on transformation and social cohesion in higher education. The IGBVC aims to ensure accountability, and to respond adequately to the scourge of GBV.
2025 marked a defining milestone as CPUT commemorated its 20th anniversary. This occasion provided a transformative moment for the University community to critically reflect on its journey, to acknowledge both achievements and persistent challenges, and to envision a future rooted in systemic change.
Equity and Redress
In 2025, faculties advanced equity and redress through curricula transformation, inclusive pedagogies, and supporting students with disabilities. Guided by the Constitutional mandate and the Department of Higher Education and Training (DHET) Language Policy, CPUT operationalised multilingualism through English, isiXhosa, and Afrikaans, offering conversational courses and renaming projects to affirm cultural identity. The Advancement Department secured funding for students with disabilities, covering tuition, accommodation, and assistive devices.
CDISC, in collaboration with Human Capital (HC), Advancement Department, and Fundani, hosted a Women’s Day Celebration, also launching the commemorative book, Women Leaders: Journey of Growth to Greatness, with Prof Vuyisa Mazwi-Tanga, CPUT’s first female Vice-Chancellor, as a keynote speaker, inspiring reflection on women’s transformative roles. Included were panel discussions and speakers on different topics affecting women.
Diversity
Diversity is visible through demographic shifts and cultural recognition. In 2025, there was a notable increase in female students (59,1%), including those entering STEM programmes; and an increase in students with disabilities, culminating in the graduation of one disabled student.
Employment Equity data shows African and Coloured staff forming the majority across the employment equity occupational levels. Women and persons with disabilities were increasingly represented in technical and semi-skilled roles. However, gender and disability parity in senior management remains limited, requiring targeted interventions.
Diversity was also celebrated through vibrant commemorative events. Africa Month and Heritage Month foregrounded African identity, cultural diversity, and indigenous knowledge systems. Faculties hosted colloquia, exhibitions, music and dance performances, and dialogues on Afrocentric epistemologies. The Faculty of Applied Sciences (FAS) held a Heritage Day event focused on indigenous languages, while Library Services, the Marketing and Communication Department (MCD), CDISC, and the Faculty of Informatics and Design (FID) commemorated Heritage Month with cultural displays, drumming, and poetry readings. DSA hosted the 1st Annual Afrocentric Student Affairs
International Conference, and the Afrocentric International Student Affairs Pre-Conference Division of Student Affairs, presented by EmpowHer-SA-CPUT.
Inclusion and Human Rights
In 2025, inclusion and human rights were strengthened and institutionalised through sustained dialogues, webinars, conferences, and awareness initiatives across departments and faculties. The DHET GBV Policy Framework (2019) explicitly recognises GBV as a violation of the right to dignity, freedom, and security of the person, and the right to equality, as enshrined in the Constitution. It requires universities to create safe, inclusive environments. The IGBVC is chaired by the Vice-Chancellor. The faculties and departments hosted awareness campaigns to advance a zero-GBV campus. Human Capital played a key role in capacitating staff collaboratively with other divisions, and “GVB train-the-trainer” training was offered in collaboration with the National Prosecuting Authority.
The development of the Sexual and Gender-Based Violence Policy is aligned with national protocols. Language inclusivity reinforced human rights by ensuring that students and staff could access institutional resources in multiple languages, affirming dignity and belonging. The University affirms the right to human dignity by safeguarding the inherent worth of every student and staff member against exclusionary practices. Collectively, these interventions embedded justice, safety, and inclusivity into institutional culture.
Social Cohesion
Inclusion and s ocial cohesion were cultivated through community dialogues, restorative practices, and community engagement initiatives. A social inclusion workshop conducted by CDISC, in collaboration with DHET and the Commission for Gender Equality (CGE), foregrounded shared accountability and solidarity. Heritage Day celebrations, Human Rights Day commemorations, and LGBTQIA+ advocacy campaigns reinforced cohesion by affirming diverse identities and cultural expressions. The Centre for Community Engagement and Work Integrated Learning (CE & WIL) held Ubuntu Philosophy workshops, embedding values of humanity and social responsibility into student development. The SRC’s inclusive sports tournaments and residence inspections further strengthened cohesion, by ensuring safe, affirming spaces. These initiatives positioned cohesion as both a social and epistemic imperative.
Digital Transformation
Digital transformation was advanced through faculty-specific innovations. The Advancement Department implemented a Digital Literacy Project for high school learners, addressing gaps in basic computer skills. It partnered with the Huawei ICT Academy to prepare students for global tech competitions. Faculties integrated digital tools into teaching and research, while the SRC collaborated with the Learning and Teaching Committee to establish guidelines on AI usage, embedding ethical digital practices. Multilingual digital platforms reinforced inclusivity, ensuring that language diversity was embedded into digital transformation. These interventions reframed digital transformation as a vehicle for equity, inclusion, and innovation.
At faculty level, FAS installed new PCs, and activated digitalready laboratories; FEBE expanded SMART lecture theatres and labs; FBMS integrated AI literacy, coding, and analytics into curricula; and FHWS deployed digital interview platforms to strengthen employability. DSA leveraged Blackboard for counselling surveys, introduced assistive technologies for students with disabilities, and digitised workflows to enhance service delivery. The IGBVC developed digital systems and app-based solutions for GBV reporting and survivor support, rooting safety into the digital agenda. Curriculum transformation embedded digital innovation into pedagogy and assessment, ensuring future readiness and equitable access.
Employment Equity
A critical dimension of CPUT’s staffing landscape is the transformation of employee demographics, an area the University continues to prioritise through initiatives coordinated and monitored by the University Employment Equity Forum (UEEF). With the revisions to the Employment Equity (EE) Act and the introduction of Sectoral Targets, CPUT played a significant role in the Department of Employment and Labour’s (DoEL) consultations with the higher education sector.
Development of the EE Plan and its targets for the 2025–2030 cycle was informed by key lessons and insights gained during the preceding period. A comprehensive review of barriers to affirmative action was undertaken, supported by the network of EE representatives, resulting in the identification of policy, language, and practice changes required to strengthen inclusion. These insights have shaped the action plans that will guide implementation over the next phase of the EE Plan.
Chairperson of Council Vice-Chancellor Dr LF Platzky Prof NS Nhlapo
Section Seven: Management of Risk
7.1 Audit and Risk Oversight Committee Report
The Audit and Risk Oversight Committee (AROC) of Council has an independent role, with accountability to Council. The Committee does not assume the functions of Management, which remain the responsibility of the Vice-Chancellor, Deputy Vice-Chancellors, Executive Directors, and other members of Senior Management. As such, members of AROC should not be involved in any business or other relationships that may have a material bearing on their independent judgment as members of the Committee. The objectives of AROC are tabled in Figure 76.
Ensure that the interests of all stakeholders are properly protected in relation to financial reporting and internal control;
Ensure that CPUT’s disclosure regarding risk is comprehensive, timely, and relevant. 1 3 4 5 2
Provide Council with an independent assessment of the University’s financial position and accounting affairs, with the objective of providing further assurance of the quality and reliability of the financial information used by Council and contained in the documents approved by Council for issue on behalf of CPUT;
Keep under review, the effectiveness of CPUT’s internal control policies and procedures for the identification, assessment, and reporting of risks;
Ensure that CPUT has implemented an effective policy and plan for risk management that will enhance the University’s ability to achieve its strategic objectives; and
The Committee fulfils its role in line with the approved Terms of Reference, and may call on the Chairpersons of the other committees of Council, the Vice-Chancellor, Deputy ViceChancellors, and any of the Executive Directors, Officers, Secretariat, or other Assurance Providers to provide information, subject to a Council-approved process.
7.1.1 Composition and Attendance
The reconstituted Council, at its meeting of 22 October 2022, reconstituted all its committees, and elected chairpersons for a period of four years. At the end of 2025, AROC had four members, comprising two external members who serve on Council, and two external members, all of whom are independent of the University.
Figure 76. The Objectives of the Audit and Risk Oversight Committee (AROC Terms of Reference, reviewed May 2025)
The members of AROC have a variety of skills, ranging from business, auditing, legal, governance, information technology, risk management, and financial services.
Meetings are held at least four times a year, and are attended by the External and Internal Auditors, and relevant members of the Executive Management of CPUT. The auditors have unhindered access to the Committee. During 2025, the Committee held quarterly meetings, of which all were quorate (Table 42 below), and carried out its oversight duties as set out in the Terms of Reference.
Meeting Dates and Attendance
*Member of Council; **External member; CH: Chairperson; PR: Present; A: Apology; AW: Absent without apology
7.1.2 Summary of Main Activities
The Audit and Risk Oversight Committee complied with key aspects of its mandate in 2025. In executing its duties, the Committee attended to the following key matters:
Internal Audit
The Committee is responsible for overseeing Internal Audit, and during the year under review, it performed the following:
• Reviewed and approved the annual Internal Audit plan and budget;
• Monitored and reported on the independence of the Internal Auditors;
• Monitored implementation of the Internal Audit Strategy, which is aligned with CPUT’s Vision 2030;
• Obtained feedback on the outcomes of internal audits completed as part of the approved Internal Audit Plan;
• Obtained feedback on the risk management and corporate governance practices as assessed by Internal Audit; and
• Ensured that there is a process of follow-up on significant findings, and that Internal Audit reports on the progress of implementing agreed management actions.
External Audit
The Committee is responsible for recommending the appointment of the External Auditor, and for overseeing the external audit process, and in this regard, the Committee:
• Approved the terms of engagement and remuneration of the external audit engagement for the 2025 financial year;
• Monitored and reported on the independence of the External Auditors in the annual financial statements;
• Reviewed the contracts for non-audit services (if any) to be rendered by the External Auditors; and
• Followed up on any possible reportable irregularities identified and reported by the External Auditors.
7.1.3 Risk Management and Internal Controls
The Committee is an integral component of the risk management process, and during the year under review, the Committee:
• Ensured that continuous risk monitoring by Management takes place;
• Ensured that appropriate risk responses are implemented;
• Liaised with the Internal Auditors and Management to exchange information relevant to risk;
• Ensured the effectiveness of the system and process of risk management is formally communicated to Council;
• Reviewed and approved the CPUT Risk Management Policy and Framework;
• Reviewed and approved the Enterprise Risk Management Strategy, which is aligned with CPUT’s Vision 2030;
• Reviewed reporting concerning risk management that is to be included in the Annual Report for it being timely, comprehensive, and relevant; and
• Provided oversight over the financial reporting risks, internal financial controls, and fraud risks, as these relate to financial reporting and general IT risks.
Table 42. AROC meeting attendance, 2025
7.1.4 Combined Assurance
AROC ensured that a combined assurance model was applied, to provide a coordinated approach to all assurance activities, and to address all the significant risks that CPUT is facing. It also monitored the relationship between the various internal and external assurance providers. The combined assurance model is articulated in a documented framework approved by the Committee and Council in 2021.
7.1.5 Information Technology (IT) Governance
AROC ensured that IT risks are adequately addressed. It received appropriate assurance on controls, and considered the impact of IT in relation to financial reporting, and on significant operational activities.
The Committee has increased its scrutiny of the University’s IT systems and related IT risks. During 2025, the Director: Information and Communication Technology Services (ICTS) presented quarterly reports to the Committee, which focused on:
• Progress in addressing external and internal audit findings;
• IT strategic and operational risks, including cybersecurity risk; and
• IT resilience and disaster recovery.
7.1.6 Fraud and Litigation
The Committee received reports on matters of fraud, and the results of forensic investigations into cases of fraud. It considered Management’s actions in dealing with these cases of fraud, and received assurance from Management regarding their compliance with relevant legislation regarding the incidents of fraud, and actions to recover monies and assets.
Management provided feedback on areas of litigation that posed a risk to CPUT in terms of financial impact and/or reputational consequences.
7.1.7 Compliance with Laws and Regulations
Various laws and regulations are applicable to CPUT. Management regularly reported to AROC on CPUT’s compliance with laws and regulations. Independent assurance was provided by the Internal and External Auditors based on their annual audit coverage plans.
Conclusion
Arising from each AROC meeting is a Chairperson’s Report to Council, indicating matters requiring Council attention for notice, approval, or action.
AROC complied with its Terms of Reference, and is satisfied that CPUT has continued to maintain and manage internal control systems effectively, in a manner that ensures the achievement of institutional objectives and operational goals. This was obtained by means of a risk management process, combined assurance approach, as well as the identification of corrective actions and enhancements to internal processes and controls.
The Committee reviewed and recommended the following reports in this Annual Report to Council for approval:
• Report on Internal Administrative/ Operational Structures and Financial Controls (7.2); and
• Report on Integrated Enterprise Risk Management Report (7.4).
The Audit and Risk Oversight Committee therefore recommended the 2025 Annual Report to the Council for approval.
Chairperson of the Audit and Risk Oversight Committee
Ms A Vabaza-Mvandaba
7.2 Report on Internal Administrative/Operational Structures and Financial Controls
7.2.1 Systems of Internal Controls and Processes
Smart systems, including automated internal control systems, are considered a key enabler of CPUT’s Vision 2030. The University maintains a system of internal control to provide reasonable assurance regarding achieving its objectives. The internal control system is designed to enable effective and efficient operations, ensure the reliability of financial reporting, and support overall compliance with relevant laws and regulations to prevent loss of resources and assets, and to reduce legal liability. Effective financial management and internal control systems ensure that the University’s information systems provide a reliable basis for its academic administration, and the preparation of financial statements and related institutional reports.
Management is responsible for establishing and maintaining adequate internal control systems. The internal control system is designed to provide an operational environment that promotes safeguarding of the University’s assets, and presenting reliable financial and other relevant information. Internal control objectives include measures to ensure completeness, accuracy, and proper authorisation enabled by documented organisational structures that set out the segregation of responsibilities, established policies and procedures, and a code of ethics.
There are inherent limitations to the effectiveness of any internal control system, including the possibility of human error, and the circumvention of controls. Accordingly, even an effective internal control system can only provide reasonable assurance concerning reporting financial information and safeguarding assets.
7.2.2 Computer and Telecommunications Services
The University applies modern technology solutions such as cloud computing, virtualisation, storage redundancy, and managed backup applications in its data centres. These solutions are developed and implemented by defined and documented standards to achieve efficiency, effectiveness, reliability, and security. In utilising technology to transact with staff, students, and third parties, controls are designed to minimise the risk of fraud and error. During 2025, CPUT continued to upgrade its IT infrastructure and software suite to meet the demands of multimodal learning. Simultaneously, IT security is reviewed and upgraded continuously to mitigate the increased cybersecurity risk. The Council's Information Technology Governance Committee (ITGC) oversees the IT control environment, including implementation of the IT Strategy.
7.2.3 Internal Audit
Internal control systems are assessed on a continuous basis by the University’s Internal Auditors, which are independent of management and operate in terms of the mandate outlined in the Internal Audit Charter. Internal Audit monitored the adequacy and effectiveness of the internal control systems through the approved 2025 Internal Audit Plan. The Plan is developed annually, following a risk-based approach. The initial 2025 Internal Audit Plan was approved by the Audit and Risk Oversight Committee (AROC) and amended, with the approval of AROC, in response to emerging risks. Audit findings and recommendations are reported to Management and Council via AROC.
Management understands and supports the role of Internal Audit. Management is responsible for ensuring that audit findings and recommendations are addressed appropriately. Followup reviews are performed continuously using an online Audit Management System to verify the implementation of agreed action plans in response to Internal Audit findings. Progress is reported quarterly to Executive Management, AROC and Council to ensure that actions are implemented timeously.
Internal Audit completed 25 assignments in 2025, with the central themes depicted in the figure on the right. The most significant themes for 2025 included Student Journey (35%) and Finance and Reporting (18%). A notable portion of the Internal Audit Plan has been assigned to IT governance, information security, and IT resilience since 2020 (Fig. 77).
7.2.4 Combined Assurance
CPUT adopted a combined assurance model to provide a coordinated approach to all university assurance activities. The model is designed to address the significant risks faced by CPUT, and to monitor the relationship between internal and external assurance providers. Combined assurance is the process of internal and external assurance providers working together and incorporating activities to reach the goal of integrating and aligning assurance processes so that Executive Management and governance bodies (Council and AROC) obtain a holistic view of the effectiveness of the University’s governance processes, risks, and controls, to enable them to set priorities and take action.
CPUT has adopted a principles-based approach to combined assurance to provide flexibility. As such, Council, Executive Management, and assurance providers are not slotted into rigid lines or roles. The areas of responsibility for these role players are generally described as:
• Accountability by Council to stakeholders for oversight;
• Actions (including managing risk) by Management to achieve CPUT’s objectives; and
• Assurance and advice by an independent Internal Audit Function to provide insight, confidence, and encouragement for continuous improvement.
7.2.5 Statement of Assessment of Internal Controls
Reports to AROC by both Internal and External Auditors indicate that there are some areas of control that are deemed to be partially adequate or ineffective. These matters are reported to Line Management for action, and implementation of corrective actions are monitored by Executive Management and AROC.
7.2.6 Statement by Audit and Risk Oversight Committee
The Audit and Risk Oversight Committee reviewed the Report on Internal Administrative/ Operational Structures and Financial Controls in the year under review at its meeting on 8 May 2026, which was quorate. The documentation for approval by the Committee was also circulated with the meeting agenda in advance, with due notice.
7.3 Ethics and Compliance Management
7.3.1 Ethics and Compliance Management
The Compliance Management Function (CMF) advances a university-wide ethics and compliance programme that prevents, detects, and responds to regulatory and conduct risks. In 2025, we strengthened core foundations initiated in 2023–2024. We digitised declarations, a consolidated Legislative Universe, targeted training, policy governance via the Policy Library, and dataprotection practices; so they are easier for staff and students to use, and easier for the University to evidence publicly.
7.3.2 Governance and Mandate
The CMF’s mandate is to coordinate, facilitate, and advocate for a university-wide ethics and compliance programme, assuring the Vice-Chancellor, Executive Management, Governance and Ethics Committee (GEC), Audit and Risk Oversight Committee (AROC), and Council that controls exist to prevent, detect, and mitigate compliance risks. The Function’s scope currently centres on compliance coordination, with a planned evolution to an integrated Ethics & Compliance capability, in partnership with other CPUT functions such as HR (ethics culture and conduct), Legal Services, Risk, Internal Audit, and ICT Security.
7.3.3 Key Activities and Achievements
Online Declaration Functionality
Chairperson of the Audit and Risk Oversight Committee
Ms A Vabaza-Mvandaba
CPUT advanced a single, policy-linked digital process for declarations of conflicts of interest, gifts/ benefits/ hospitality (GBH), and related-party interests, designed to make ethical disclosure intuitive for staff, while creating auditable, comparable data for institutional transparency. The approach combined policy alignment, user-tested forms, automated routing to line managers/Compliance, and a common data model to support public reporting from 2026 onward.
Outputs:
• Unified online forms with embedded policy guidance and examples for frequent scenarios (e.g., outside work, procurement-adjacent relationships);
• Automated routing and tracking configuration for line manager stewardship and compliance oversight;
• Standardised data fields, validation rules, and sign-off paths to enable consistent analytics; and
• Staff-portal help content and FAQs.
Compliance Risk Assessment, and Compliance Obligation Register (Legislative Universe)
To provide a single source of truth for CPUT’s statutory and policy duties, the Function conducted a university-wide compliance risk assessment, and built a Legislative Universe that maps obligations to owners, controls, and monitoring indicators. The work blended bottom-up obligation capture with Executive validation workshops, and aligned outputs with ERM, so that risks and mitigations can be monitored consistently.
Outputs:
• Legislative Universe matrix linking obligations to accountable owners, core controls, and evidence;
• Compliance Risk Register integrated with ERM (risk descriptions, inherent/residual ratings, and response plans); and
• Defined Key Risk Indicators (KRIs)/monitoring indicators for priority statutes and processes.
Contract Management Benchmarking
CPUT benchmarked its contract lifecycle against South African public-sector practice and university comparators to close historic audit findings, and strengthen intake, review, approval, storage, performance management, and renewal discipline. The approach combined document analysis, process mapping, and role-clarity (RACI) review to propose pragmatic improvements that fit current capacity.
Outputs:
• Executive benchmarking brief with comparative gaps, and a phased implementation roadmap;
• Draft RACI and Standard Operating Procedure (SOP) set for intake-to-close-out, including version control and performance/renewal checkpoints; and
• Specification for a central contract register, and renewal-alert mechanism.
Whistleblowing Root-Cause
Analysis
A structured review of hotline and ethics-case patterns focused on where and why risks emerge, distinguishing control-design gaps from adherence and culture issues, so that remedies address underlying causes, rather than symptoms. The analysis combined case-type trends, processing lead-times, and outcome themes with targeted interviews in high-signal areas.
Outputs:
• Thematic map of root causes across policy clarity, supervision, maker–checker discipline and awareness;
• Agreed corrective actions (e.g., threshold clarifications for Gifts, Benefits and Hospitality (GBH); outside-work approvals; manager coaching packs);
• Standard feedback-loop guidance to reporters to build trust and closure quality; and
• Metrics definitions for volume, outcome, and time-to-closure reporting (for OVC publication).
Data Protection and Information Governance Enhancement (POPIA)
To embed privacy-by-design, and strengthen information-governance practice, CPUT expanded staff awareness, refreshed artefacts, and prepared assurance routines that will make 2026 privacy reporting visible and comparable. The approach emphasised lightweight training for managers, templated agreements, and Data Protection Impact Assessment (DPIA) triggers for new systems and vendors.
Outputs:
• Updated privacy notices and incident-response guidance aligned to POPIA practice;
Beyond the flagship projects, the Function maintained essential enablement so that policies, training, and combined-assurance routines remain coherent and accessible to the CPUT community.
• Continued ethics and compliance learning (use of video modules; induction refresh); and
• Combined Assurance participation with Internal Audit, Risk, Legal, and ICT Security on cross-cutting themes.
7.4 Integrated Enterprise Risk Management Report
The enterprise risk management (ERM) report highlights strategic, tactical, and operational initiatives that were planned and completed during financial year 2025. The initiatives are categorised into risk governance, risk assessment, risk quantification and aggregation, risk monitoring and reporting, risk culture and awareness, risk and control optimisation, and continuous improvement.
7.4.1. Institutional Risk Profile
The University performed its annual institutional risk assessment workshop on 31 October 2025. The updated institutional risk profile is depicted below. Despite commendable existing controls, high residual risk remains in the operating environment. The summarised University Key Risk Profile 2025 is shown in Table 43 below.
Table 43. Institutional risk profile, 2025
7.4.2. Summary of the Institutional Key Risk Register
Opportunity: Disruptive Technologies
ICT 16 9 20
• The Information and Communication Technology Services (ICTS) Function monitors general technological developments and their impact on university-wide initiatives, such as teaching and learning, thus informing the University’s risk response.
• The CPUT-approved Business Continuity Management (BCM) Strategy includes a Cluster on Technology.
• Directorate Internal Audit conducts consulting and assurance IT Audit engagements/projects.
• ERM Function flags emerging risks via the agile, dynamic, continuous risk review and monitoring protocols.
• CPUT Artificial Intelligence (AI) Guideline.
• CPUT Information Security Strategy and Policy.
• CPUT Cloud Management Strategy.
• Action plan: Development of the CPUT Generative Artificial Intelligence Policy.
• Cyber Security Strategy and Programme, including the implementation of preventative, detective, corrective, and recovery controls.
• Information Security Strategy.
• Cyber Security Management Team, and a Cyber Security Operations Team/ Centre (SOT/SOC).
• Information Security related policies, i.e., Information Security Policy, Access Control Policy, and IT Acceptable Use Policy.
• Annual Cyber Security Awareness Programme.
• Vulnerability Management Programme has been established that involves regular vulnerability scanning of critical assets, review of vulnerabilities, as well as remedial action.
• Directorate Internal Audit conducts consulting and assurance IT Audit engagements/projects.
• External IT Audits.
• Cyber risk budgeting (part of the annual IT budget and planning process).
• Cyber insurance.
DVC: Operations (Acting); Senior Director: Information and Communication Technology Services (ICTS)
DVC: Operations (Acting); Senior Director: ICTS
Alignment of ICT systems and infrastructure with CPUT's future-focused teaching and learning requirements of the Vision 2030 Strategic Plan
• Institutional Vision 2030 Finance Strategy.
• Governance oversight by the Finance, and Investments, and Audit and Risk Oversight Committees of Council.
• Strategic financial scenarios developed and revised (continuous assessment of financial sustainability).
• Financial risk measurement and management.
• Financial and Management Accounting Functions in the Finance Function,
• Funds invested in the short-term to generate interest income.
• Insurance Guidelines and Coverage Plan.
• CPUT Student Debt Management Plan, including the assessment of students with debt pursuing second degrees.
• Strict management of recurring income across all levels of funding.
• Strict management of operating expenditure across the University.
• CPUT Financial and Procurement policies, regulations, guidelines, and standard operating procedures.
• CPUT Budget Guidelines.
• Approved Delegation of Authority (DOA) limits.
• Drive for third stream funding in place.
• Internal and External Audits.
• Revised Vision 2030 ICTS Strategic Plan.
• Annual IT budget.
• Digital Learning facilities/Platforms.
• High performance Network.
• CPUT Cloud Strategy.
• Providing Digital/E-Learning facilities that are accessible to the CPUT community.
• Procurement and installation of new Network equipment.
• Procurement and installation of Network Monitoring and Management Tool.
• Renewal of all 3rd party/Vendor license/ SLA agreements.
Executive Director: Finance
DVC: Operations (Acting); Senior Director: ICTS
Institutional Resilience: Integrated Business Continuity and Disaster Recovery Business Continuity/ Disaster Recovery
20 15 13
• Directorate: Business Continuity and Disaster Recovery in place.
• Approved CPUT Business Continuity Management (BCM) Strategy.
• Institutional Business Continuity and Sustainability Forum (IBCSF) in place.
• Approved Business Continuity and Sustainability Management Policy.
• Approved Business Continuity and Sustainability Management Procedure.
• Approved 3-year BCM Project Implementation Plan 2025–2027.
• Appointment of BCM and Sustainability Champions.
• Integrated Business Impact Analyses (BIA) Outcomes, including BCM performance parameters/metrics: recovery time objectives (RTOs), recovery point objectives (RPOs), and maximum tolerable period of disruption (MTPDs).
• CPUT Institutional Business Continuity Plan (IBCP).
• CPUT Crisis and Emergency Management Plan (CEMP).
• Support Service and Faculty Incident Response Plans (IRPs).
• Annual scenario analysis and stress testing of the IBCP.
• Approved and continuously, independently tested IT Disaster Recovery Plan (IT DRP).
• Backup and fail-over solutions are in place that are tested periodically.
• Review, update and approval of the IT Disaster Recovery Plan by the different Governance Committee Structures.
• Regular reviewing, updating, and approval of backup and restore procedures.
• Evaluation of documented processes and procedures for Disaster Preparedness, to ensure the continuance of key business functions in the event of a disruption.
• Testing and reviewing offsite storage procedures to ensure data can be effectively recovered during a disaster.
• Internal and External Audits on BCM, including Disaster Recovery Planning.
Executive Director: Office of the ViceChancellor (OVC); Director: Enterprise Resilience and Sustainability Services (Business Continuity and Disaster Recovery); DVC: Operations (Acting); Senior Director: ICTS
Enrolment Plan and Targets, especially postgraduate numbers
Teaching and Learning 20 16 13
• Approved Enrolment Plan in place.
• Directorate: Institutional Planning.
• The Academic Planning Unit within the Directorate: Institutional Planning has been capacitated.
• Optimisation and leveraging on the online registration process.
• HEMIS Office to highlight underenrolled programmes at various platforms i.e., APC, ISPC, and Dean's Forum.
• Use of Data Analytics (PowerHEDA).
• Late application and registration dates adjusted to accommodate late approval of programmes.
• Focus on retention and recruitment of postgraduate students.
• Increase supervision capacity and quality.
DVC: Learning and Teaching; Executive Director: OVC
Research Productivity (Research and Innovation Optimisation)
Research and Innovation Optimisation
20 16 13
• Division: Research, Technology Innovation, and Partnerships (RTIP) with dedicated Directorates responsible for facilitating Research Development. Centre for Postgraduate Studies, Technology Transfer Office, Library Management Services, and Internationalisation initiatives in place.
• Monitoring of research productivity by Executive Management, Management Committee, and the Senate.
• PowerHEDA Data Analytics platform for research productivity monitoring.
• Research productivity and optimisation is a strategic agenda item at Faculty Board meetings and Faculty Executive Committee meetings.
DVC: RTIP
20 16 5
Stakeholder Relations and potential threat to the CPUT brand (Reputational risk management) Brand and Reputation 16 9 5
• Stakeholder Coordinator appointed in the Office of the Vice-Chancellor.
• Condition assessments done at residences in relation to Health and Safety measures.
• Maintenance Strategy in place (prioritised and condition-based).
• Preventative and planned maintenance.
• Structures in place to address student matters, i.e., management and stakeholder forums.
• E-learning Strategy to promote an increase in the use of E-learning platforms that could be used in the event of business/class disruptions. (Recorded lectures available online).
• Needs Survey to understand, from a student perspective, the residential needs required to have a conducive postgraduate (student) residential experience.
• Division of Student Affairs in place, with various functions responsible for student counselling, sports, arts, and culture, student governance, leadership and development, student training and development, residential life, and services.
• External Stakeholder Engagement Strategy.
• Stakeholder Engagement Coordinator appointed in the OVC.
• Formal engagement with staff/ students: Management and Unions Forum, Management and SRC Forum, EE Consultative Forum, ER Forum, Faculty Boards, ManCom, Senate, sub-Committees.
• Employee Relations Function in place.
• Legal Services Function.
• University Code of Conduct for staff.
• Code of Conduct for Council members.
• Structures in place to address student matters: Management and Committees.
• SRC Constitution and Code of Conduct.
• Marketing and Communication Directorate in place.
• CPUT spokesperson responsible for institutional communications and public relations.
DVC: Operations (Acting); DVC: RTIP
Vice-Chancellor and Principal; Executive Director: OVC; DVC: Operations (Acting)
Property Services’ ability to meet the current needs for V2030 strategic, tactical, and operational requirements may be compromised
16 13
• Human Capital (HC) Strategy.
• Capacitation of the HC Function.
• Human Capital policies, strategies, structure, and organisational design arrangements.
• Continuous review of Human Capital strategies, policies, and procedures.
• Governance structures and oversight.
• CPUT Competency Framework.
• Performance leadership and engagement interventions.
• Internal and External Audits on HC.
DVC: Operations (Acting); Senior Director: Human Capital
20 13
• Condition assessments and prioritise the Refurbishment, New Build and sustainability. Following maintenance Philosophy of ISO 55000 and life cycle maintenance. Ongoing, now part of existing controls.
• Compliance in Construction Regulations, SANS 104000 and OSH Act.
• Comply with DHET Norms and Standards, and the Heritage Building Act.
• Municipal By Laws and Environmental Law.
• Repetitive repairs due to vandalism, must be controlled by End User.
• Submission to DHET of quarterly reports in terms of expenditure.
• Submissions to Infrastructure Efficiency Grant visits by DHET and CPUT budget, manage very tightly.
• Annual maintenance budget and link high priority areas.
7.5 Institutional Resilience: Business Continuity and Disaster Recovery Report
7.5.1 CPUT Business Continuity Management (BCM) Methodology
The University approved for implementation, during January 2025, an emerging, leading practice Business Continuity Management (BCM) methodology that is aligned with industry standards, the Good Practice Guidelines (GPG) 7,0 Edition (2023) designed by the Business Continuity Institute, United Kingdom, and guidance from the International Organisation for Standardisation (ISO) 22301: 2019 BCM Standard.
7.5.2 Summary of the Business Continuity and Disaster Recovery Project Plan
Establish a Business Continuity Management System (BCMS)
Development, consultation, and approval of the BCM Policy and Procedure
Determine Business Continuity (BC) roles and responsibilities
Formalise BC governance structures (Executive Committee/ Management Committee)
The BCM Policy and Procedure documents were approved by Council on 22 November 2025.
The finalisation of the appointment of BCM and Sustainability Champions in progress.
The Director Business Continuity and Disaster Recovery functionally reports quarterly to Quality Assurance and Risk Management Committee (QARM), Physical Planning Committee of Council (PPCC), Information Technology Governance Committee (ITGC), and Audit and Risk Oversight Committee of Council (AROC), and administratively (operationally) to the Executive Director: Office of the Vice-Chancellor.
Socialisation in progress
In progress, on track
Quarterly risk governance meeting minutes in place
Establish BC working/steering committees/forums
Embracing Business Continuity
Business Impact Analysis (BIA) and Risk Assessments (RAs)
Solution Design
Create organisationwide BC awareness, and influence behavioural change
Conduct detailed deep dive Business Impact Analysis and Risk Assessments for faculties and support service functions
Develop a detailed integrated CPUT Solution Design (Strategy) Report that encapsulates faculties and support service functions.
The Institutional Business Continuity and Sustainability Forum (IBCSF) was established during Q4 2024.
Ongoing awareness commenced, with rollout of the faculty and support service business impact analyses during Q4 2025.
All planned faculty and support service BIAs and RAs were completed during Q4 2025. A fully socialised, leading practice BIA and RA template is in place.
The detailed CPUT Solution Design (Strategy) Report was completed during December 2025.
Quarterly meeting minutes in place. A total of four (4) planned meetings were held in financial year 2025.
An ongoing process throughout 2025.
Ongoing process.
An ongoing review/ update process continues each financial year.
BCM
Enabling Solutions Develop BCM and RA strategies in conjunction with Senior Management across the University.
Recovery teams/ clusters confirmation: Develop Incident Response Plans (IRPs) for faculties and support service functions.
Develop an integrated CPUT Institutional Business Continuity Plan (IBCP).
Develop a leading practice CPUT Crisis and Emergency Management Plan (CEMP).
Embracing Business Continuity
Recovery teams training
Validation Develop a scheduled plan for the testing/ validation of components of the integrated CPUT Institutional Business Continuity Plan (IBCP)
All appropriate response strategies (solutions) were developed with direction and guidance from the respective Management Committee (ManCom) members.
The respective Faculty and Support Service IRPs have been developed, consulted, and communicated across CPUT.
The development of a leading practice IBCP was completed during December 2025.
The development of a leading practice CEMP was completed during December 2025.
This phase of the BCM cycle is planned for the Q2–Q3 2026 period.
The BCP validation component of the BCM cycle is planned for each financial year.
A scenario analysis and stress testing exercise was conducted on 9 December 2025 to test for universitywide operational readiness for AY/FY 2026.
Type of exercise conducted: Tabletop
Director: Enterprise Resilience and Sustainability Services: Business Continuity and Disaster Recovery
Ongoing testing and maintenance process of the plan is continuous, ongoing.
Planning has commenced.
Ongoing, planned for every year
Section Eight: Statement on Sustainability
8.1 Vision 2030 Sustainable Development Strategy
The University continued to implement the approved Vision 2030 Sustainable Development Strategy. This report provides highlights of the various sustainability initiatives attained in financial year 2025. An infographic below shows the six pillars of CPUT’s approved Vision 2030 Sustainable Development Strategy (Fig. 78).
The BCM Function reports to the Executive Director: Office of the Vice-Chancellor, who provides executive oversight and sponsorship of the Institutional Business Continuity and Sustainability Forum (IBCSF). BCM continues to be a component of institutional combined assurance services. The appointment of BCM and Sustainability Champions, and the confirmation of the composition of BCM clusters, initiated during 2025, is nearing completion, and will be finalised during the first quarter of 2026.
The University’s sustainable development journey was augmented during 2025. A Dynamic Double Materiality Assessment (DDMA) was completed during the fourth quarter of the year. The following schematic graphic representation, Figure 79, shows a brief infographic overview of the DDMA process taken, and the key outcomes of the most important sustainability initiatives that form part of CPUT’s environmental, social, and governance (ESG) Implementation Plan 2025–2030, and beyond to 2050.
Figure 78. Pillars of the CPUT Vision 2030 Sustainable Development Strategy
Context
Identify material topics for your organisation based on sector specific research, Standards and market trend analysis
Use the relevant Standards and Regulatory Guidelines to understand the context
Engage with relevant stakeholders and experts
Identification
Identify your organisations' current and potential impacts (negative and positive) based on the list of topics identified in the research
Assessment
Assess the significance of the impacts through quantitative and qualitative analysis
Consider the topics and impacts described in the Standards and Regulatory Guidelines
Test the material topics with experts and information users
Prioritisation
Prioritise material topics based on their strategic importance to the organisation and its importance to stakeholders
Test the material topics against the topics in the Sector Standards
Key CPUT DDMA Outcomes: Material Sustainability Focus Areas (2025–2030 and beyond – Fig. 80)
8.2 Energy Management Report
During Quarter 1 of 2025, the CPUT Energy Management Champion was confirmed as the Deputy Head of the CPUT Energy Management Institute, Prof Atanda Raji. The baseline year for energy management data was confirmed as 2023.
CPUT commenced initiatives to invest in advanced energy metering infrastructure (AMI), including data collection, analytics, and visualisation to create a CPUT Energy dashboard. The Property Services Function has commenced a process to procure and install smart energy meters. The University buildings have Energy Performance Certificates (EPCs) to align with Energy Management Systems, EnMS (ISO 50 001). A process is underway to implement the CPUT Campus Hydrogen Project, facilitated by the Department of Electrical, Electronic, and Computer Engineering, specifically, the Green Hydrogen Production System on the Mitchell’s Plain Hospital. Hydrogen is compressed and stored in transportable hydrogen cylinder bundles.
Figure
Figure 80. CPUT Material Sustainability Focus Areas
8.3 Water Management Report
Prof Bongani Ncube is the University’s Sustainable Water Management Champion, confirmed during 2025. Prof Ncube is the SARChI Research Chair in Water Governance and Economics for Water and Sanitation Sector Institutions, which is hosted at the Centre for Water and Sanitation Research (CWSR) within the Faculty of Engineering and the Built Environment. In 2025, the Research Chair was invited to participate in the Institutional Business Continuity and Sustainability Forum (IBCSF) as a Team Leader for water, and asked to contribute to quarterly reporting on sustainable water management. The focus of the initiatives and reporting were on water conservation and reuse, rainwater harvesting, wastewater reuse, stormwater management, and the monitoring and reporting of water at the University. The smart water meter installation project is an ongoing initiative that commenced during financial year 2025, under the guidance of the Property Services Department.
8.3.1 Postgraduate Water Management Projects
In 2025, three Honours student projects were commissioned to continue collecting data on water use and understanding at CPUT. Their topics were as follows:
• “Current understanding of water conservation at Cape Peninsula University of Technology (CPUT)”;
• “Assessment of tap water quality concerns across CPUT residences in Bellville and the District Six Campuses”; and
• “Water use practices at the Cape Peninsula University of Technology Bellville Campus, South Africa”.
Unfortunately, the student working on water-use practices dropped out of the study after finding employment. The other students completed their studies, and the results will be presented in 2026 when they graduate.
8.4 Waste Management Report
Dr Vincent Zungu was confirmed as the Sustainable Waste Management Champion for 2025, and reports on the same at the quarterly meetings of the Institutional Business Continuity and Sustainability Forum. The University currently recycles less than 5% of its total waste every year, with the remaining waste finding its way to the landfill. CPUT has already implemented various measures to improve its shift towards sustainable green, clean, sustainable options, such as the three-bin system in order to limit the total waste sent to landfills. The University focused on recycling and upcycling initiatives. It also conducted a Waste Education Week from 11–14 June 2025, as part of the ViceChancellor’s Green Zero Waste Campus Project. The “Name the Bin” competition for creative minds had volunteers sign up to become part of the solution to create wasteless campuses, and bolster a culture of green thinking and paperlessness.
8.5 Food Security Report
The Food Security Sustainability Champion is Dr Vanessa Jackson, from the Faculty of Applied Sciences.
Horticulture
The “One Residence, One Garden” project, a partnership between the Division of Students Affairs (DSA), Convocation, and the Faculty of Applied Sciences, continues to make significant strides in advancing food security, promoting sustainable practices, and fostering community engagement across CPUT residences. A generous donation of R11,000 was received from the Dean of Applied Sciences towards procuring essential tools to strengthen the initiative. Furthermore, a formal memorandum of understanding (MoU) was signed between CPUT and Nature Brands Labs, strengthening collaboration and support. As part of this partnership, Nature Brands Labs donated over 400 vegetable seedlings, including spinach, beetroot, cabbage, peppers, and tomatoes, which have been distributed across participating residences. In addition, the project has benefited from the donation of 45 work suits and pairs of safety boots, ensuring that participating students are well-equipped for garden activities.
Consumer Science
A food vegetable garden, as well as a soup kitchen, were conducted on the District Six Campus during 2025. Assistance was given by Gardens and Grounds and the Advancement Department at CPUT. The departments of Biotechnology and Consumer Science worked with Social Services on Mandela Day 2025. A staff member, and first-, second-, and third-year Consumer Science students volunteered to make soup and steamed bread, and distributed this at lunchtime on Mandela Day, in the spirit of giving and sharing with those less fortunate on 16 and 18 July 2025. The initiative worked so well that the students were called on again to prepare soup with some donated ingredients, and another soup session was held on 30 July 2025. The Consumer Science students created the Consumer Science Giving Kitchen and Vegetable Garden. Consumer Science students also volunteered to plant a vegetable garden on the District Six Campus, and the produce will be used for making meals for vulnerable students. The Food Security Cluster is one of the business continuity management (BCM) clusters at the University.
Food Science and Technology
Food Science and Technology ongoing initiatives include research on edible food waste reuse opportunities, and community engagement with the Environmental Health Department on food safety.
Chairperson of Council Dr LF Platzky
Section Nine: Finance
9.1 Annual Financial Review
The 2025 financial year was characterised by a constrained public funding environment, escalating structural costs, and sustained pressure on institutional liquidity. Notwithstanding these challenges, the University remained financially stable, met all contractual obligations, and continued to support its core academic mandate through disciplined and prudent financial management.
The Financial Statements for the year ended 31 December 2025 were prepared in accordance with International Financial Reporting Standards (IFRS), as issued by the International Accounting Standards Board (IASB), and the reporting requirements of the Department of Higher Education and Training (DHET), and Higher Education Act, 1997 (Act No.101 of 1997, as amended). These statements were approved by Council on 20 June 2026.
Own-generated income remained the primary driver of revenue growth during the year. Gross tuition fee income increased by 10,6%, supported by approved fee increases, changes in programme mix, and stable enrolment levels. Residence income also improved following the expansion of bed capacity from 15,300 to 16,200, reinforcing the strategic importance of student accommodation as an enabler of access and student success.
In contrast, state subsidy income declined by 2%, reflecting a reduction in the DHET subsidy factor, and the continued erosion of funding in real terms across the higher education sector. This trend confirms the University’s increasing reliance on own-generated revenue streams, and investment performance to sustain operations.
Student debt attributable to unfunded students continues to grow. Payment patterns within this category did not improve during 2025, resulting in a significant increase in the year-end balance. While several interventions are under consideration, there is no immediate solution, given prevailing economic conditions and the rising indebtedness of families and communities. The debt settlement offer has gained further traction during the year, and, together with the application of financial debt clearance measures, is expected to provide some relief. However, recognising the complexity of the challenge, the settlement offer has been extended for a further year, and additional options are being explored, including earlier utilisation of collection service providers within the debt recovery cycle.
The growth in student debt necessitated an increase of R3 million in the year-on-year provision for bad debts, calculated in line with the three-year provisioning cycle and assessed recoverability rates.
The University continues to benefit from the regular payment of fees for NSFAS-funded students. While these payments support cash flow, the uncertain timing of disbursements, reversals of funding decisions, and delays in confirmation of funding contribute to ongoing cash flow uncertainty, which must be actively managed on a monthly basis.
Backlog maintenance remains a strategic priority, and saw numerous projects implemented across all campuses during the year, funded from the DHET Infrastructure and Efficiency Grant (IEG) and recurrent income budget. This progress was achieved despite the marginal decline in subsidy funding, and the discontinuation of the regular IEG.
The leased student residence portfolio was maintained in 2025, supplemented by accredited residences. The provision of student accommodation requires a careful balance, and a three-year accommodation strategy has been developed, linking annual enrolment targets to projected bed requirements. Achievement of the 2025 enrolment target has provided greater clarity in planning for the appropriate mix of owned, leased, accredited, and private student accommodation.
Management continues to set annual budget directives for the forthcoming financial year. This process has become increasingly challenging, as subsidy increases remain well below the consumer price index due to prevailing economic constraints. Nevertheless, the University remains committed to delivering on the Vision 2030 priority projects and the broader institutional strategy. The high salary cost ratio, which remained at 55% of total expenditure during the year, continues to be a concern, as it exceeds DHET norms, and limits operating flexibility.
Key highlights
• University investments performed strongly in 2025, growing from R2,109 billion to R2,676 billion.
• The Investment Sub-committee continued to operate effectively, achieving targeted investment outcomes despite a challenging financial environment.
• Staffing appointments and the renewal of staff contracts remain challenging. While a moratorium on new appointments was implemented, Human Capital will continue to monitor staffing levels to reduce costs and achieve a more appropriate balance between academic and support staff.
• All contractual expenditure was met during the year.
• Robust cash flow management practices ensured continued financial stability; however, reserves of R100 million were utilised to fund cash flow deficit in the first quarter that was reinvested in June 2025
Surplus/(Deficit) Position in 2025
In 2025 the University generated a net surplus of R135,3m. The following table highlights the financial results of the University over the prior five years:
The main reason for the overall operational surplus was as follows:
• Tuition and residence fee increase based on an inflationary increase and teaching input mix. Residence fee income has increased because of the 2025 residence capacity.
• Increase in the market value of investments of 90,8% contributed significantly to the surplus.
• Increase in personnel overheads of 3,1% (R64,3m). Inflationary salary increase of 4,5%, and a reduction in staff headcount accounts for the overall increase.
• A 1% increase in other operating expenditure as a result of tighter cost measures contributed to the surplus.
• A marginal year-on-year increase in the expected credit loss due to the growth in the number of unfunded students, which directly affects the student debt recoverability position.
The table below compares the annual surplus and deficit from recurrent operations over the prior five years:
The reasons for the deficit on recurrent operations were mainly due to the following:
• Recurrent expenditure increased at 3,5% on higher base than recurrent income; and
• An increase in the finance costs of 21,5% due to lease liabilities.
Investment Portfolio
The market value of the University’s investment portfolio has increased from R2,109m as at 31 December 2024, to R2,676m as at 31 December 2025. The portfolio balance held over the last five years is summarised in the following table:
Student Debt
In 2025, an additional provision of R273m was raised. This is an increase of R3m from the prior year. It should be noted that a vast majority of the unfunded student debt is still covered by the provision (61,4%).
The following table highlights the debt position, as follows:
The increase in student debt from 2022 to 2025 still highlights the impact of the loss of funding experienced by students and their families. The number of students who are recipients of donor or bursary funding has not enabled the University to contain its level of student debt. The debt owed by self-funded students is the fastest growing portion of the debt.
CPUT’s analysis of its student debtors book has highlighted where interventions can be taken to collect and manage debt. This process will be necessary to focus specifically on returning students with historic debt. Various interventions will be considered to address the debt levels of self-funded students, e.g., stricter application of financial clearance rules for students who have not settled prior year fees.
The Institution’s Management extends its sincere appreciation to Council’s Finance Committee and the Audit and Risk Oversight Committee for their continued guidance, oversight, and commitment. Their contributions remain invaluable in steering the Institution through a complex financial landscape.
A special word of thanks is also extended to the staff of the Finance Department for their dedication, professionalism, and continued commitment in serving the University.
A selected list of financial ratios and extracts from the financials for the past years follows below:
Sustainability ratio (Council-controlled reserves only) (Council-controlled reserves/ annual recurrent expenditure on Council-controlled expenditure)
Sustainability ratio (total CPUT reserves) total CPUT reserves/ annual recurrent expenditure
Mr M Daca
Mr B Schreuder Executive Director: Finance Chairperson: Finance Committee
9.2 Financial Statements for the year ended 31 December 2025
Statement of Responsibility for the Financial Statements
The Council is accountable for the integrity and fair presentation of the financial statements of the Cape Peninsula University of Technology.
The financial statements, presented on pages 134 to 171 of this Annual Report, have been prepared in accordance with International Financial Reporting Standards (IFRS) and the requirements of the Minister of Higher Education and Training as prescribed by the Higher Education Act, 1997 (Act No.101 of 1997, as amended), and include amounts based on judgments and estimates made by Management. The Council is also responsible for the University’s system of internal financial control. These are designed to provide reasonable, but not absolute, assurance as to the reliability of the financial statements. The Council also prepared other information as required to be included in this Annual Report, and is responsible for both its accuracy and consistency with the financial statements.
The “going concern” basis has been adopted in preparing the financial statements. Nothing has come to the attention of Council to indicate that any material breakdown in the functioning of the system, procedures and controls has occurred during the year under review. The Council also has no reason to believe that the Cape Peninsula University of Technology is not a “going concern” in the foreseeable future, based on forecasts and available cash resources. The viability of the Cape Peninsula University of Technology is supported by the content of the financial statements.
The financial statements have been audited by the independent accounting firm, Deloitte & Touche, which was given unrestricted access to all financial records and related data, including minutes of meetings of the Council and all its committees. The Council believes that all representations made to the independent auditors during their audit were valid and appropriate.
Approval of the Financial Statements
The financial statements on pages 134 to 171 were approved by the Council of the Cape Peninsula University of Technology on 20 June 2026, and are signed on its behalf by:
Dr LF Platzky Chairperson of Council
Prof NC Nhlapo
Vice-Chancellor
Mr M Daca
Executive Director: Finance
STATEMENT OF COMPREHENSIVE INCOME for the year ended 31 December 2025
STATEMENT OF COMPREHENSIVE INCOME for the year ended 31 December 2025
STATEMENT OF CHANGES IN FUNDS for the year ended 31 December 2025
STATEMENT OF CASH FLOWS for the year ended 31 December 2025
Notes to the Financial Statements for the year ended 31 December 2025
1. Basis of preparation of material accounting policies
1.1
General information and basis of preparation
The University is autonomous and is a legal persona with full juristic capacity by its incorporation as a university (originally by an Act of the Union Parliament of 1916 when Parliament incorporated the South African College, and now in terms of the Higher Education Act, 1997 (the Act) and the Institutional Statute of the University published under that Act). This legislation places the governance of the University in the hands of a Council, provides for the Council’s composition and powers, and provides for the role and powers of the Senate and the role and functions of the Institutional Forum.
Higher Education Act, 1997
“Higher education institution” means any institution that provides higher education on a fulltime, part-time or distance basis and which is:
(a) Merged, established or deemed to be established as a public higher education institution under this Act;
(b) (Declared as a public higher education institution under this Act; or
(c) Registered or provisionally registered as a private higher education institution under this Act.
The Cape Peninsula University of Technology (CPUT) was established on 1 January 2005 with the merger of the former Peninsula and Cape Technikons, and is domiciled in South Africa. The University's registered office is at the Administration Building, Symphony Way, Bellville South, 7530.
The financial statements of the University for the year ended 31 December 2025 were authorised for issue in accordance with a resolution of Council on 20 June 2026.
The principal activities of the University relate to teaching, research, and the providing of residential accommodation to students.
Statement of compliance
The financial statements of the Cape Peninsula University of Technology have been prepared in accordance with, and comply with, International Financial Reporting Standards (IFRS) as issued by the International Accounting Standards Board (IASB) and, in the manner required by the Minister of Higher Education and Training in terms of S41 of the Higher Education Act 101, of 1997 (as amended).
Basis of preparation
The accounting policies set out below are consistent with those applied in the previous year, except as stated below. The financial statements have been prepared on a going concern and historical cost basis, except where stated otherwise (refer
to accounting policies). The financial statements are presented in rands, and all amounts rounded to the nearest rand.
IFRS update of Standards and Interpretations in issue at 31 December 2025
Effective for annual periods beginning on or after 1 January 2026
IFRS 7 – Financial Instruments: Disclosure
IFRS requires certain disclosure to be presented by category of instrument based on IAS 39 measurement categories. Certain other disclosures are required by class of financial instrument. For those disclosures an entity must group its financial instruments into classes on similar instruments as appropriate to the nature of the information presented.
The two main categories of disclosure required by IFRS 7 are:
• Information about the significance of financial instruments
• Information about the nature and extent of risks arising from financial instruments
Management has performed a high-level impact assessment, and are not expecting any material changes.
IFRS 9 – Financial Instruments
The International Accounting Standards Board (IASB) issued Amendments to IFRS 9 Financial Instruments and IFRS 7 Financial Instruments: Disclosures in May 2024, effective for annual reporting periods beginning on 1 January 2026. The amendments arise from the post-implementation review of IFRS 9, and primarily aim to improve clarity, consistency, and disclosures, rather than introduce fundamental changes.
The IASB published amendments to IFRS 9 that address the following topics:
• Derecognition of financial liability settled through electronic transfer;
• Classification of financial assets – contractual terms that are consistent with a basic lending arrangement;
• Classification of financial assets – financial assets with nonrecourse features; and
• Classification of financial assets – contractually linked instruments.
Management has performed a high-level impact assessment, and are not expecting any material changes
IFRS 18 – Presentation and Disclosures in Financial Statements
Effective for periods beginning on or after, 1 January 2027.
The objective of IFRS 18 is to set out requirements for the presentation and disclosure of information in general purpose financial statements (financial statements) to help ensure they provide relevant information that faithfully represents an entity’s assets, liabilities, equity, income and expenses.
Management has performed a high-level impact assessment and expects a change in the presentation of the Statement of Comprehensive Income due to the classification of items.
1.2 Significant accounting judgments and estimates
Judgments
In the process of applying the University’s accounting policies, Management has made certain judgments, apart from those involving estimations, which have the most significant effect on the amounts recognised in the financial statements, as discussed below. Management assesses the University's assets and liabilities based on the criteria at the reporting date to reach the appropriate conclusions in this regard.
Estimation uncertainty
The key assumptions concerning the future and other key sources of estimation uncertainty at the reporting date, that have a significant risk of causing a material adjustment to the carrying amounts of assets and liabilities, as well as the release of income with respect to these assets, within the next financial year, are set out below.
Student fees receivable – Expected credit loss allowance
Management estimates the amounts that it expects to recover from outstanding balances based upon the age profile of the debts outstanding, payment trends experienced in both the current and prior years, and the levels of student registration and payments received from outstanding students post yearend, as well as events potentially impacting the recoverability of fees receivable. A provision for impairment is raised based on these estimates. The carrying value of student fees receivable at 31 December 2025 was R827 852 553 (2024: R623 772 391). Refer to Note 6.
The University applies the IFRS 9 simplified approach to measuring expected credit losses, which uses a lifetime expected loss allowance for all trade receivables. To measure the expected credit losses, trade receivables have been grouped together on shared risk characteristics and the days past due. The expected loss rates are based on the underlying composition of the receivable, payment trends and history of the market, political and social conditions for each category.
Depreciation
At each reporting date, Management reviews the assets within property, plant and equipment to assess whether the useful lives and residual values applied to each asset category are appropriate. With the exception of motor vehicles, residual values have generally been assumed to be nil, as it is the University’s intention to fully consume assets through use. In determining the expected useful lives of individual assets, Management has considered the University’s historical patterns of usage, as well as future expected usage. The estimates for the expected useful lives of buildings have been based upon the nature and use of the buildings concerned, and the type of construction and materials used in construction. The carrying value of property, plant and equipment at 31 December 2025 was R2 189 662 001 (2024: R2 152 287 478). Refer to Note 2.1 for further details.
Right-of-use assets are depreciated on a straight-line basis over the shorter of the lease period and the useful life. The carrying value at 31 December 2025 was R1 611 822 293 (2024: R1 421 093 488).
Post-retirement medical aid benefit obligation
The University’s future obligation in respect of post-retirement medical aid contributions is actuarially valued, based on the projected unit credit method. For the purpose of the valuation at 31 December 2025, key assumptions were made in respect of the discount rate, expected inflation on medical aid contributions, actual return on plan assets, expected age of retirements, and mortality rates. More details on these assumptions are provided in Note 10.2.
The carrying value of the post-retirement medical aid obligations at 31 December 2025 is a liability of R1 068 606 005 (2024: R878 028 296).
Pension fund obligation
The University provides for its obligations relating to conditional benefits in respect of certain employees who are members of the National Tertiary Retirement Fund. The University’s future obligation in respect of this pension fund obligation is actuarially valued based on the projected unit credit method. For the purpose of the valuation at 31 December 2025, key assumptions were made in respect of the discount rate, expected salary and pension fund increases, expected return on plan assets, expected age of retirements, and mortality rates. More details on these assumptions are provided in Note 10.3.
The carrying value of the obligation as at 31 December 2025 was R258 000 (2024: R206 000).
Lease liabilities
The University's leases have renewal clauses. The University generally takes up renewal options, and thus all options have been taken into account in determining the lease term. The model of working with lessors is something that the University will continue to use into the future.
1.3 Segment information
Segmentation provided in the Statement of Comprehensive Income of these financial statements is in terms of the guidelines prescribed by the Department of Higher Education and Training (DHET), and is not required in terms of IFRS 8.
A segment is a recognised component of the University that is engaged in providing products or services that are subject to risks and returns different from those of other segments.
The operating businesses are managed separately, but fall under the oversight of the Cape Peninsula University of Technology (CPUT) Executive leadership.
Council-controlled
The Council-controlled segment predominantly represents the teaching component of CPUT. Decision-making rights relating to income earned in this segment rests with Council.
Specifically-funded activities restricted
The specifically-funded activities restricted consist mainly of research activity and bursary donations. Here decisionmaking rights over income earned and related expenses rest with researchers. Council retains an oversight role with regard to ensuring that expenditure is in accordance with the mandate received from funders.
Student and staff housing
Student and staff housing relates to the provision of accommodation to students. The availability of this accommodation is a strategic initiative aimed at ensuring that students adopt CPUT as their preferred place of study.
Statement of Changes in Funds
The total comprehensive income generated in the Statement of Comprehensive Income segments is further allocated into additional funds within the Statement of Changes in Funds. Council-controlled funds are allocated between unrestricted funds and designated funds, whereby the Council sets aside specific funds for designated purposes. Transfers between these funds are an internal allocation by the University, and have no effect on income and expenses.
1.3.1 Accumulated funds
Council-controlled unrestricted funds reserve
This reserve predominantly represents the cumulative net surplus of the teaching component of CPUT. The net (loss)/surplus for the year for the student and staff accommodation is included here.
Specifically-restricted funds reserve
This reserve comprises the cumulative net surplus of specificallyfunded activities.
1.4 Foreign currency translation
The financial statements are presented in rands, which is the University’s functional and presentation currency.
Transactions in foreign currencies are initially recorded in the exchange currency rate ruling at the date of the transaction.
Monetary assets and liabilities denominated in foreign currencies are retranslated at the rate of exchange ruling at the reporting date. All differences are taken to net surplus or loss in the year in which they arise.
Non-monetary items carried at cost are translated using the exchange rate at the date of the transaction, whilst assets carried at fair value are translated at the exchange rate when the fair value was determined. When a gain or loss on a non-monetary item is recognised directly in other comprehensive income, any exchange component of that gain or loss shall be recognised directly in other comprehensive income. Conversely, when a gain or loss on a non-monetary item is recognised directly in net surplus or loss, any exchange component of that gain or loss shall be recognised directly in net surplus or loss.
1.5 Revenue recognition
Revenue is measured at the fair value of the consideration received, or receivable, excluding discounts, rebates, and VAT. Revenue is recognised to the extent that it is probable that the economic benefits will flow to the University, and the revenue can be reliably measured. The following specific recognition criteria must be met before revenue is recognised:
State appropriations – Subsidies and grants: State subsidies and grants for general purposes are recognised in surplus or loss as revenue in the financial year in which they become
receivable. Subsidies and grants for specific research purposes are recognised in surplus or loss as revenue in the financial period in which they become receivable to the University, in accordance with the relevant conditions of such grants and agreements. Such subsidies and grants are presented separately as revenue in surplus or loss. Subsidies and grants relating to specific expenses incurred by the University are not offset from the related expenses, but are presented separately as revenue in surplus or loss.
Government grants relating to assets
When a grant relates to an asset, under IAS 20, the fair value is credited to a deferred income account, and is released to income over the expected useful life of the relevant asset on a systematic basis.
Interest received
Revenue is recognised as interest accrues (using the effective interest method, that is the rate that discounts estimated future cash receipts through the expected life of the financial instrument to the net carrying amount of the financial asset).
Dividends
Dividends are recognised when the right to receive payment is established.
Private gifts and donations
Private gifts and donations, whether of cash or assets, are recognised as revenue in the period they are received or receivable only when the University obtains control of these funds, the right to receive it, or it is probable that the economic benefits comprising these funds will flow to the University, and the amount of the private gifts and donations can be measured reliably.
Private gifts and grants with restrictions or conditions attached are recognised as income if the restrictions and conditions are under the entity's purview, and it is probable that these restrictions and conditions would be met. Alternatively, these funds are recognised as deferred income until the above criteria are fulfilled, or when the restrictions or conditions expire.
Income is recognised at the fair value of the private gifts and donations received or receivable. Private gifts and donations in the form of services are measured at the fair value of the services received, or the fair value of the asset enhancement resulting from the services. Fair value is the price that would be received to sell an asset, or paid to transfer a liability in an orderly transaction between market participants at the measurement date.
IFRS 15 revenue from contract with customers
IFRS 15 establishes a comprehensive framework for determining whether, how much, and when revenue is recognised. Revenue from contracts with customers is recognised when control of the goods or services are transferred to the customer at an amount that reflects the consideration to which the University expects to be entitled in exchange for those goods or services.
Tuition and residence fees
Tuition and residence fees charged are applicable to one academic and financial year, and are recognised in that year. The University has assessed that the students simultaneously
receive and consume the benefits provided within the year; as such, revenue is recognised over time. Scholarships, bursaries, and other financial aid provided by the University to students for tuition and residence fees, are recognised as a reduction of fees. The University has to fulfil its performance obligation by way of providing lecturers, study material, online videos, or consultations for students, as well as assessments and examinations.
Income from research contracts
Income from contracts for research activity is recognised over the duration of the associated research activity, as determined with reference to the stage of completion. Stage of completion is determined on a cost or time-apportionment basis. Revenue from contracts for other activities is recognised when such activities occur.
Income from research contracts is recognised in accordance with IFRS 15. It is based on the principle that revenue is recognised when control of goods or services transfers to a customer.
A contract liability is recognised if a payment is received, or payment is due from the customer before the University has transferred the related goods or services. Contract liabilities are then only recognised as revenue once the University has performed under the contract.
Rendering of services
Various academic departments render a range of services to industry. Revenue from rendering of these services is recognised by reference to the stage of completion, determined on a cost or time-apportionment basis, as appropriate for the services involved.
1.6 Retirement benefits
Defined contribution retirement plan
Employer contributions to the Cape Peninsula University of Technology Retirement Fund (previously known as the Cape Technikon Retirement Fund) are recognised as expenses, as the related service is provided.
Defined contribution and defined benefit retirement plan
Employer contributions to the National Tertiary Retirement Fund (NTRF) are recognised as expenses, as the related service is provided.
The NTRF is a defined contribution fund, and members were transferred from the AIFPF (previous State Pension Fund) with conditional benefits that materialise once these conditions are met. In terms of the conditional retirement benefits, members’ benefits are equal to the actual value at date of retirement, provided that they are 60 years or older, and the Employer is obliged to ensure that the conditional retirement benefit is effected, as referred in those members’ conditions of employment, and the contract between the Fund and the respective participating employers to fund any shortfall (difference between the Member Share account and actuarial value of the benefit) at retirement.
The costs incurred in respect of these pension fund obligations are charged as an expense, as the employee renders the service.
The present value of the pension fund obligation is actuarially determined annually, using the projected unit credit method, in accordance with IAS 19 Employee Benefits. The liability is recognised at the reporting date.
When the calculation results in a potential asset, the recognised asset is limited to the present value of economic benefits available in the form of any future refunds from the plan, or reductions in future contributions to the plan. To calculate the present value of the economic benefits, consideration is given to any applicable minimum funding requirements.
Remeasurements of the net defined benefit liability, which comprise actuarial gains and losses, the return on plan assets (excluding interest), and the effect of the asset ceiling (if any, excluding interest), are immediately recognised in Other Comprehensive Income (OCI). The Institution determines the net interest expense/(income) on the net defined benefit liability/ (asset) for the period by applying the discount rate used to measure the conditional benefit obligation at the beginning of the annual period to the then net conditional benefit liability/ (asset) during the period as a result of contributions and benefit payments. Net interest expense and other expenses related to defined benefit plans are recognised in surplus or loss.
When the benefits of a plan are changed, or when a plan is curtailed, the resulting change in benefit that relates to past service or the gain or loss on curtailment is recognised immediately in surplus or loss. The Institution recognises gains or losses on the settlement of a conditional benefit plan when the settlement occurs.
Post-retirement medical aid obligations
The Cape Peninsula University of Technology has an obligation to provide certain post-retirement medical aid benefits to its eligible employees and pensioners. The University is required to provide a defined amount of the medical aid contribution due. One of the University's plans is funded with a plan asset.
Other staff members elected to take out individual retirement annuities, which will be used to fund their medical aid obligation upon retirement. The Institution provides these staff members with a monthly allowance to enable them to fund these individual retirement annuities.
The costs of providing post-retirement medical aid benefits are determined using the projected unit credit method.
When the calculation results in a potential asset, the recognised asset is limited to the present value of economic benefits available, in the form of any future refunds from the plan, or reductions in future contributions to the plan. To calculate the present value of the economic benefits, consideration is given to any applicable minimum funding requirements. The net obligation is calculated separately for each plan, by estimating the amount of the future benefit that the employees have earned in the current and prior periods, discounting that amount, and deducting the fair value of any plan assets.
Remeasurements of the net defined benefit liability, which comprise actuarial gains and losses, the return on plan assets (excluding interest), and the effect of the asset ceiling (if any, excluding interest), are immediately recognised in OCI.
The Institution determines the net interest expense/(income) on the net defined benefit liability/(asset) for the period by applying the discount rate used to measure the defined benefit obligation at the beginning of the annual period to the then net defined benefit liability/(asset) during the period as a result of contributions and benefit payments. Net interest expense and other expenses related to defined benefit plans are recognised in surplus or loss.
When the benefits of a plan are changed, or when a plan is curtailed, the resulting change in benefit that relates to past service or the gain or loss on curtailment is recognised immediately in surplus or loss. The Institution recognises gains or losses on the settlement of a defined benefit plan when the settlement occurs.
1.7 Borrowing costs
Borrowing costs are accrued based on the effective interest rate. Borrowing costs that are directly attributable to the acquisition, construction, or production of an asset that necessarily takes a substantial period of time to get ready for its intended use or sale, are capitalised as part of the cost of that asset. All other borrowing costs are recognised as an expense.
1.8 Research costs
Research costs are expensed as incurred, and are included in other operating expenses.
1.9 Property, plant and equipment and right-of-use assets
Property, plant and equipment is initially recognised when it is probable that future economic benefits will flow to the University, and the cost of the item can be measured reliably. Property, plant and equipment is initially measured at cost. The cost of an asset comprises the purchase price and any costs directly attributable to bringing the asset to the location and condition necessary for it to operate as intended by Management.
Subsequently, property plant and equipment is measured at cost less accumulated depreciation, and net of any accumulated impairment losses. Subsequent costs are included in the asset’s carrying amount, or are recognised as a separate asset, as appropriate, only when it is probable that future economic benefits will flow to the University, and the cost of the item can be measured reliably. Maintenance and repairs, which do not meet these criteria, are recognised in surplus or loss, as incurred. Donated items of property, plant and equipment are initially recognised at fair value of the asset received. Land is not depreciated, as it is deemed to have an indefinite life.
Property, plant and equipment is depreciated on a straightline basis estimated to write each asset down to its estimated residual value over the estimated useful lives of the assets, which range as follows:
Buildings 5 to 200 years
Leasehold improvements Lease period
Motor vehicles 5 to 12 years
Furniture and equipment 1 to 15 years
Computer equipment 3 to 12 years
Right-of-use assets Lease period
The assets’ residual values and useful lives are reviewed, and adjusted if appropriate, at each reporting date.
If significant parts of an item of property, plant and equipment have different useful lives, then they are accounted for as separate items of property, plant and equipment.
Depreciation commences when an asset is available for use, i.e., when it is in the location and condition necessary for it to be capable of operating in the manner intended by Management. Depreciation ceases at the earlier date that the asset is either classified as held for sale, or the asset is derecognised.
An item of property, plant and equipment is derecognised upon disposal, or when no future economic benefits are expected from its use. Any gain or loss arising on derecognition of the asset (calculated as the difference between the net disposal proceeds, and the carrying amount of the asset) is included in surplus or loss in the year that the asset is derecognised.
1.10 Impairment of non-financial assets
The University assesses, at each reporting date, whether there is an indication that an asset may be impaired. If any such indication exists, the University makes an estimate of the asset's recoverable amount.
An asset’s recoverable amount is the higher of an asset’s fair value, less costs to sell and its value in use. Value in use is the present value of future cash flows expected to be derived from an asset or cash generating unit. Where the carrying amount of an asset exceeds its recoverable amount, the asset is considered impaired, and is written down to its recoverable amount, and impairment losses recognised in surplus or loss.
An assessment is made at each reporting date as to whether there is any indication that previously recognised impairment losses may no longer exist, or may have decreased. If such indication exists, the recoverable amount is estimated. A previously recognised impairment loss is reversed only if there has been a change in the estimates used to determine the asset’s recoverable amount since the last impairment loss was recognised. If that is the case, the carrying amount of the asset is increased to its recoverable amount. That increased amount cannot exceed the carrying amount that would have been determined, net of depreciation, had no impairment loss been recognised for the asset in prior years. Such reversal is recognised in net surplus.
After such a reversal, the depreciation charge is adjusted in future periods to allocate the asset’s revised carrying amount, less any residual value, on a systematic basis over its remaining useful life.
1.11 Financial assets
Classification and measurement
The classification of financial assets at initial recognition depends on the financial asset’s contractual cash flow characteristics, and the University’s business model for managing them. The University’s business model is to hold investments for capital appreciation, and therefore manages its investment portfolio on a fair value basis. The University initially measures financial assets at fair value, plus, in the case of a financial asset not at fair value through profit or loss (FVTPL), transaction costs. Trade receivables that do not contain a significant financing component, or for which the University has applied the practical expedient, are measured at the transaction price determined under IFRS 15.
For a financial asset to be classified and measured at amortised cost or fair value through other comprehensive income (FVOCI), it needs to give rise to cash flows that are ‘solely payments of principal and interest (SPPI)’ on the principal amount outstanding. This assessment is referred to as the SPPI test, and is performed at an instrument level.
The University’s model for managing financial assets refers to how it manages its financial assets to generate cash flows. The model determines whether cash flows will result from collecting contractual cash flows, selling the financial assets, or both.
Purchases or sales of financial assets that require delivery of assets within a time frame established by regulation or convention in the market place (regular way trades) are recognised on the trade date.
Financial assets at FVTPL
Financial assets at FVTPL include financial assets designated upon initial recognition at fair value through profit or loss, or financial assets mandatorily required to be measured at fair value. Financial assets with cash flows that are not SPPI, are classified and measured at FVTPL, irrespective of the business model.
Financial assets at FVTPL are carried in the Statement of Financial Position at fair value, with net changes in fair value recognised in the income statement.
The University’s business model is to measure and assess performance of its investments on fair value basis, and therefore has classified it as investments at fair value through profit or loss.
Financial assets at amortised costs (debt instruments)
The University measures financial assets at amortised costs if both the following conditions are met:
• The financial asset is held with the objective to hold the financial assets to collect contractual cash flows; and
• The contractual terms of the financial assets give rise on specified dates to cash flows that are solely payments of principal and interest on the principal amount outstanding.
Student receivables, trade receivables, and loans are held to collect contractual cash flows, and are expected to give rise to cash flows representing solely payments of principal and interest.
The University analysed the contractual cash flow characteristics of those instruments, and concluded that they meet the criteria for amortised cost measurement under IFRS 9.
Financial assets at amortised cost are subsequently measured using the effective interest rate (EIR) method, and are subject to impairment. The University recognised an expected credit loss (ECL) on all financial assets measured at amortised cost. The University has applied the simplified approach when calculating the ECL for trade and other receivables and student fees receivable. Changes in economic factors, such as Consumer Price Index are taken into account when determining an ECL. The University makes use of a provision matrix to determine the expected credit losses on all receivables. The provision matrix is based on historic credit loss experience, adjusted for factors that are specific to the debtors, general economic conditions, and assessment of both the current and forecast direction of the conditions at the reporting date, including the time value of money, where appropriate. The ECL model takes the following details into account:
i. Is the student funded by a bursor, or self-funded?
ii. If self-funded, is there a payment plan currently in place to settle the outstanding debt?
iii. Has the student defaulted on the payment arrangement, i.e., missed a monthly payment?
If points (ii) and (iii) apply, the student is considered to be of a higher credit risk, and the full outstanding balance at as yearend has been impaired.
Gains and losses are recognised in profit or loss when the asset is derecognised, modified, or impaired. The University’s financial assets at amortised cost include trade receivables and student fees receivable.
1.12 Financial liabilities
Initial recognition and measurement: All financial liabilities are initially recognised at fair value, and subsequently measured at amortised cost, in the case of trade and other payables, loans and borrowings, net of directly attributive transaction costs.
Financial liabilities at amortised cost (loans and borrowings, and trade and other payables): This is the category most relevant to the University. After initial recognition, interest-bearing loans and borrowings are subsequently measured at amortised cost using the EIR method. Gains and losses are recognised in profit or loss when the liabilities are derecognised, as well as through the EIR amortisation process.
Trade and other payables are subsequently measured at amortised cost.
Amortised cost is calculated by taking into account any discount or premium on acquisition and fees, or costs that are an integral part of the EIR. The EIR amortisation is included as finance costs on the Statement of Profit and Loss.
Derecognition: A financial liability is derecognised when the obligation under the liability is cancelled or expires. When an existing financial liability is replaced by another from the same lender on substantially different terms, or the terms of an
existing liability are substantially modified, such an exchange or modification is treated as the derecognition of the original liability and the recognition of a new liability. The difference in respect to carrying amounts is recognised in Statement of Profit and Loss.
Financial assets and financial liabilities are offset, and the net amount is reported in the consolidated Statement of Financial Position if there is a currently enforceable legal right to offset the recognised amounts, and there is an intention to settle on a net basis, to realise the assets and settle the liabilities simultaneously. In 2021, the University offset a trade payable with a trade receivable to the value of RNil (2024: RNil).
1.13 Inventories
Inventories are measured at the lower of cost and net realisable value. Net realisable value is the estimated selling price in the ordinary course of business, less the estimated costs necessary to make the sale. Cost is determined on the weighted average method. The cost of inventories comprises of all costs of purchase, costs of conversion, and other costs incurred in bringing the inventories to their present location and condition.
1.14 Leases
The University assesses at contract inception whether a contract is, or contains, a lease; that is, if the contract conveys the right to control the use of an identified asset for a period of time in exchange for consideration.
The University as a lessee: The University applies a single recognition and measurement approach for all leases, except for short-term leases and leases with low-value assets. The University recognises lease liabilities to make lease payments, and right-of-use assets representing the right to use the underlying assets.
i) Right-of-use assets
The University recognises right-of-use assets at the commencement date of the lease (i.e., the date the underlying asset is available for use). Right-of-use assets are measured at cost, less any accumulated depreciation and impairment losses, and adjusted for any remeasurement of lease liabilities. The cost of the right-of-use assets includes the amount of lease liabilities recognised, initial direct costs incurred, and lease payments made at or before the commencement date, less any lease incentives received. Refer to Note 2.2 for details.
Right-of-use assets are depreciated on a straight-line basis over the shorter of the lease period and the useful life of the asset, as follows:
Furniture and equipment
Motor vehicles
Land and buildings
3 to 4 years
3 to 4 years
2 to 14.5 years
If ownership of the lease asset transfers to the University at the end of the lease term, or the cost reflects the exercise of a purchase option, depreciation is calculated using the estimated useful life of the asset.
The right-of-use asset is subject to impairment.
ii) Lease liabilities
At the commencement date of the lease, the University recognises lease liabilities measured at the present value of the lease payments to be made over the lease term. The lease payments include fixed payments (including in-substance fixed payments), less any lease incentives receivables, variable lease payments that depend on an index or rate, and amounts expected to be paid under residual value guarantees. The lease payments also include the exercise price of a purchase option reasonably certain to be exercised by the University, and payments of penalties for terminating a lease, if the lease term reflects the University exercising the option to terminate. Variable lease payments that do not depend on an index or rate are recognised as expenses in the period in which the event or condition that triggers the payment occurs.
When calculating the present value of lease payments, the University uses its incremental borrowing rate at the lease commencement date, because the interest rate implicit in the lease is not readily determinable. After the commencement date, the amount of lease liabilities is increased to reflect the accretion on interest, and reduced for the lease payments made. In addition, the carrying amount of lease liabilities is remeasured if there are any modifications, a change in lease term, a change in lease payments, or change in the assessment of an option to purchase the underlying asset.
The University's lease liabilities are included in the interestbearing loans and borrowings.
iii) Short-term leases and low-value assets
The University applies the short-term lease recognition exemption to its short-term leases (i.e., those leases that have a lease term of 12 months or less from the commencement date, and do not contain a purchase option). It also applies the lease low-value assets recognition exemption to leases of office equipment that are considered to be low value. Lease payments on short-term lease and low-value assets are recognised as an expense on a straight-line basis over the lease term.
1.15 Other employee related liabilities
Short-term employee benefits
University staff members, in the case of death, qualify for different categories of benefits, depending on whether they were a member of the Pension or Provident Fund.
Other long-term employee benefits
Certain staff members of the two heritage institutions (Cape and Peninsula Technikons) qualify for certain post-retirement medical aid benefits (refer to Note 10.2) and pension fund benefits (refer to Note 10.3). In some cases, the Institution will contribute either 50%, 66,67%, or 100% of the medical aid contributions to an approved scheme upon retirement, whilst in the case of other qualifying members, the University is paying a monthly allowance to those staff members to enable them to purchase a retirement annuity which they could utilise towards their medical aid contributions upon retirement. The cost pertaining to these benefits is expensed during the period. With regards to staff members of the NTRF who qualify for defined benefits upon retirement, the University pays the shortfall as calculated by the
actuaries, into the members' fund during the year of retirement. The related cost is expensed during that period.
Post-employment benefits
Accumulated leave
Qualifying staff members who were employed at the University prior to 1 January 2005, accrued leave at a rate of 12 days per annum, up to 31 December 2016. The accumulative leave was limited to 120 days. Upon termination of employment, the unutilised portion of this accumulative leave is paid to the staff member at the rate of pay prevailing on 31 December 2016.
Annual leave
Employees are allowed to utilise the balance of the annual leave entitlement that has accrued to them at the date of the Statement of Financial Position 31 December 2025 for 6 months after the reporting date. This benefit only vests with the employee in year in which they accrue. A liability has been recognised, and provides for the additional amount that the University is expected to pay as a result of the unused entitlement that has accumulated as at 31 December 2025. The University has made the assumption that all staff will utilise the entitlement within the 6 months, and thus recognises this as a current liability.
1.16 Cash and cash equivalents
Cash and short-term deposits in the Statement of Financial Position comprise of cash at banks, cash on hand, and shortterm highly liquid deposits with a maturity of three months or less, that are held for the purpose of meeting short-term cash commitments, and are readily convertible to a known amount of cash and subject to an insignificant risk of change in value.
1.17 Provisions and contingencies
Provisions are recognised when the University has a present obligation (legal or constructive) as a result of a past event, it is probable that an outflow of resources embodying economic benefits will be required to settle the obligation, and a reliable estimate can be made of the amount of the obligation. The expense relating to a provision is presented in the Statement of Profit and Loss.
1.18 Accumulated funds
Accumulated funds is divided into the following categories:
• Council-controlled funds – Comprises of income and funds that fall under the absolute discretion or control of the Council.
• Specifically-restricted funds – Comprises of income received, the use which is legally beyond the control of Council. These funds have specific restrictions placed on them.
2. Property, plant and equipment
2.1 Property, plant and equipment (continued)
A register of land and buildings is available for inspection at the business address. The University is not permitted to dispose of, or otherwise alienate, its land and buildings without the pre-approval of the Minister of Higher Education and Training.
The balance for land and buildings includes R67 437 428 (2024: R56 687 428) in respect of land. There were additions of R10 750 000 (2024: R1 900 000) to the land balances in the current year.
2.2 Right-of-use assets
Right-of-use assets are recognised at cost, and depreciated over the term of the lease. Details relating to lease liabilities are found in Note 8.
3. Financial assets measured at fair value through profit and loss (FVTPL)
Investments comprised investments in equities, interest-bearing bonds, unit trust, and money market deposits, which are all listed on recognised markets. Consequently, the only investment with fixed maturity dates is the interest-bearing bonds, disclosed in Note 18. There are no significant terms and conditions attached to the investments.
4. Inventory
No inventory was written off in the current year (2024: RNil).
5. Accounts receivable and prepayments
Accounts receivables are non-interest bearing, and are generally on 30-day terms. Other receivables consist of state subsidy and grants to the value of R138 954 647 (2014: R Nil), and other non-trade receivables.
Age analysis of accounts receivable
The age analysis below is based on the balances per Note 5, but excluding prepayments and VAT receivable. The age analysis is based on the date of invoice or the date the receivable was raised in the accounts, depending on the nature of the transaction, such as claims from Government. The impairment is based on an expected credit loss model, and takes into account all debtors that had a balance at year-end. Debtors to the value of R6 787 064 (2024: R7 968 767) were considered high credit risk, and were fully impaired.
Movements in the expected credit loss of accounts receivable were as follows:
6. Student fees receivable
Annual fees are payable in monthly instalments from February to November, at a rate of 10% of the fees. Semester fees are payable in monthly instalments, at a rate of 20% of the fees from February to June for first semester, and from July to November for second semester students, respectively.
When calculating the student debt provision, the University considers all forward-looking information available at the reporting date in respect of student debtors to be R1 315 197 812 (2024: R1 185 388 485). The remaining student balance of R827 752 553 (2024: R623 772 391) relates to student fees from currently registered and externally-funded students, which are considered a low credit risk, and have not been impaired.
Age analysis of student fees
The table below provides the age analysis of student fees receivable (before provisions), as at 31 December 2025. Due to the nature of its operations, the University only tracks outstanding fees on an academic year basis. All outstanding balances are past due.
Refer to Note 18 or the disclosure relating to the University's exposure to credit risk.
Movements in the provision for impairment of student fees receivable were as follows:
7. Cash and cash equivalents
Cash at bank earns interest at floating rates based on daily bank deposit rates, whilst short-term deposits earn interest at a fixed rate. The fair value of cash and cash equivalents is R164 130 214 (2024: R547 597 787).
The University has a credit card facility of R28 996 000 as at the financial year end.
The University held RNil (2024: R300 000 000) on short-term bank deposits at year-end. These deposits are at market related fixed rates that mature within 3 months. They are classified as cash equivalents, as they are considered readily accessible prior to maturity. The interest rate of all short-term deposits held throughout the period was between 7,55%–8,65% (2024: 8,475%–9,15%)
8. Interest-bearing borrowings
8.1 Interest-bearing borrowings
First National Bank: A property finance loan of R37 000 000 in respect of City Edge was registered at the Deeds Office on 22 July 2024. As at 31 December 2025, the balance outstanding on the facility was R3 689 789 (2024: R26 285 515). The mortgage bond is for a 20-month period, and payments of R1 995 474 (2024: R2 048 968) are due on the 1st of each month. The bond bears interest at prime rate less 0,80%, compounded monthly.
8.2 Lease liabilities
Lease liabilities: The University leases a number of buildings for student accommodation, with lease periods ranging between 2–7 years. The leases are treated as a lease liability, and the liability is valued based on the present value of future lease payments, which have been discounted using an incremental borrowing interest rate between 6,50%–10,9%.
The University leases buses for the transportation of students; as well as office equipment with lease periods of 3–4 years. The leases are treated as a lease liability, and the liability is valued based on the present value of future lease payments, which have been discounted using an incremental borrowing interest rate of 11,25% and 11,50% respectively.
The lease liability increased by R525 890 045 (2024: R749 745 063) in the current year. Per IFRS 16, the interest on the additional lease liability will accrue on the balance at an incremental interest rate varying between (9,75%–10,15%) over the life of each lease. As at 31 December 2025, the lease liability is R1 999 344 223 (2024: R1 709 684 035), and the interest charged in respect of the liability in 2025 is R198 309 503 (2024: R151 545 245).
The leased premises shall be used as student accommodation, provided that such use does not contravene any town planning conditions applicable in respect of the property, and for no other purpose without the prior consent from the landlord, which consent shall not be unreasonably withheld or delayed.
8.3 Changes in liabilities arising from financing activities
9. Finance costs
10. Other employee benefits
10.1 Employee leave liability
Accumulated leave: A provision is made for the estimated liability for accumulative leave as a result of services rendered by employees up to 31 December 2016. As the University is expecting to pay out the liability over more than one financial year, the long-term portion has been classified as non-current.
Annual leave: Employees are allowed to utilise the balance of the annual leave entitlement that has accrued to them at the date of the Statement of Financial Position at 31 December 2025 for 6 months after the reporting date. This benefit only vests with the employee in the year in which they accrue. A liability has been recognised, and provides for the additional amount that the University is expected to pay as a result of the unused entitlement that has accumulated as at 31 December 2025. The University has made the assumption that all staff will utilise the entitlement within the 6 months, and thus recognises this as a current liability.
10.2 Post-retirement medical aid obligation
The University operates defined benefit medical aid schemes for the benefit of permanent employees. Prior to the formation of the merged institution, both former Technikons had separate contractual obligations to provide post-retirement medical aid benefits to qualifying employees. The obligation in respect of the former Peninsula Technikon is funded by a plan asset; whereas the obligation in respect of the former Cape Technikon is unfunded. Both obligations are actuarially valued and accounted for separately, as the University does not have the legal right to offset the plan assets in respect of the former Peninsula Technikon scheme against the liabilities that arise on the former Cape Technikon scheme.
An explanation of each individual scheme, and a reconciliation of the movement in the obligation in the scheme, are set out separately below.
Former Peninsula Technikon Scheme: In terms of employment contracts, post-retirement medical aid benefits are provided to certain employees who commenced employment at the former Peninsula Technikon prior to 1 January 1999, by subsidising the medical aid contributions of retired employees.
The University’s future obligation in respect of these post-retirement medical aid contributions is actuarially valued annually by independent, professionally qualified actuaries, using the projected unit credit method. The last valuation was performed as at 31 December 2025, and the principal actuarial assumptions used in the valuation were as follows:
With effect 1 May 2003, a group annuity policy was created, which meets the definition of a plan asset in terms of IAS 19. The fair value of the plan asset at 31 December 2025 of R56 266 995 (2024: R52 911 704) has therefore been set off against the funding obligation.
Included in other comprehensive income (OCI)
Remeasurements loss/(gain):
Actuarial loss/(gain) arising from:
Plan assets: Assets are held in a level annuity and SIM Absolute fund held with Sanlam, which has been set aside to fund the University's post-employment health care liability.
This policy pays a level annuity until the deaths of the member and their spouse (if applicable). This annuity is increased annually, depending on the performance of a growth portfolio and the option that the member is on. Increases are not guaranteed.
The plan assets therefore meet the definition of a qualifying insurance policy, as per the accounting statement, and its fair value is deemed to be the present value of the contribution members' liability, on the IAS 19 basis.
Sensitivity analysis: Reasonably possible changes at the reporting date to one of the relevant actuarial assumptions, holding other assumptions constant, would have affected the obligation by the amounts shown below:
One
Contributions to the plan for 2026 are expected to amount to R20 141 000 (2025: R17 686 000).
Former Cape Technikon Scheme: The former Cape Technikon operated a post-retirement medical benefit scheme for retired and certain employees who joined the Institution prior to 1 January 2003.
The University’s future obligation in respect of these post-retirement medical aid contributions is actuarially valued annually by independent, professionally qualified actuaries, using the projected unit credit method. The last valuation was performed as at 31 December 2025, and the principal actuarial assumptions used in the valuations were as follows:
loss
Included in other comprehensive income (OCI)
Remeasurements gain:
Actuarial loss/(gain) arising from:
Represented by:
Sensitivity analysis: Reasonably possible changes at the reporting date to one of the relevant actuarial assumptions, holding other assumptions constant, would have affected the obligation by the amounts shown below.
Contributions to the plan for 2026 are expected to amount to R43 902 000 (2025: R38 543 000).
10.3 Pension fund obligation
10.3.1 Pension fund – Defined contribution
Staff of the former Peninsula Technikon belong to the National Tertiary Retirement Fund (NTRF). This is a defined contribution scheme, with certain conditional benefits (see Note 10.3.2).
Staff of the former Cape Technikon belong to the Cape Peninsula University of Technology Retirement Fund (previously known as the Cape Technikon Retirement Fund). This is a defined contribution scheme.
10.3.2 Pension fund obligation
The NTRF is essentially a defined contribution fund, with conditional benefits to employees transferred from the AIPF (State Pension Fund), and who have not since surrendered this benefit through an official buy-out. At retirement age (60 years or older), the employee has a choice to retire with the fund balance, or the actuarial value of the fund according to AIPF formula. During 2003, Peninsula Technikon agreed with employees to fund any shortfall on the benefit on a pay-as-you-go basis. The actuarially calculated shortfall at 31 December 2025 amounted to R258 000 (2024: R206 000).
Actuarial assumptions: The following were the principal actuarial assumptions at the reporting date:
Mortality tables – Active staff (Rated down 1 year males - 4 years females)
Mortality tables – Pensioners (Rated down 2 years)
Included in other comprehensive income (OCI)
Remeasurements loss/(gain):
arising from:
Other
Sensitivity analysis: Reasonably possible changes at reporting date to one of the relevant actuarial assumptions, holding other assumptions constant, would have affected the obligation by the amounts shown below.
11. Accounts payable and accrued liabilities
12. State appropriations – Subsidies and grants
Included in the above are the below Government grants released to income. See Note 17.2
13. Revenue from contracts with customers
13.1 Revenue from contracts with customers
For the current year, there is no income from
13.2 Contract income liability
The University received contract income of R10 472 677 (2024: R11 633 003) for various research projects. No amounts regarding research projects have been deferred, as all the performance obligations stated in the contract were satisfied at the reporting date. As the University has an obligation in terms of the contract to satisfy these performance obligations on a specific date no later than 12 months after reporting date, the liability is considered to be current.
The University has a contractual obligation to provide the students with tertiary education, for which they are being charged tuition fees. These obligations were met at year-end, except for 42 Dentistry students whose academic year was extended to 2026. Tuition fees to the value of R402 280 (2024: R Nil) was deferred for the 2025 financial year.
14. Interest received and dividends
15. Other operating expenses
In 2025, the University was defined as a Public Interest Entity and is therefore required to disclose the fees paid for the audit of the financial statements and the provision of other services by the auditors during the period ended 31 December 2025. * The IRBA Rule on Enhanced Auditor Reporting for the Audit of Financial Statements of Public Interest Entities requires disclosure of fees paid or payable to the firm; and any other fees payable to any other firms for the provision of services during the period covered by the financial statements. Accordingly, comparative amounts have been updated to reflect this.
16. Personnel costs
17. Deferred income
17.1 Government grants relating to assets
According to IAS 20, Government grants relating to assets shall be recognised as income over the period necessary to match them with the related costs which they are intended to compensate, on a systematic basis. The deferred revenue will be recognised as income on a systematic and rational basis over the useful life of the assets. Included in the deferred income below is also the Infrastructure and Efficiency Grant. The deferred revenue will be recognised as the maintenance expenditure is incurred.
Upon receipt of an earmarked grant from DHET, the University is instructed to hold the funds in an interest-bearing account. Should the University wish to utilise the interest earned on the unspent funds, it has to get permission from DHET, and the interest can only be used on the specific project for which permission is granted. The University will defer the interest until such time as permission is granted to use it.
17.2 Government Grants – Other
This relates to Government grants other than Infrastructure, and according to IAS 20, Government grants relating to projects will be recognised as income over the period necessary to match them with the related costs which they are intended to compensate, on a systematic basis. These funds are released over two financial reporting periods. The deferred revenue will be recognised as income on a systematic and rational basis over the period of the project.
18. Financial risk management objectives and policies
The University’s principal financial instruments comprise investments, accounts receivable, student fees receivable, cash and shortterm deposits, interest-bearing borrowings, accounts payable, and accrued liabilities.
The University manages a substantial portfolio of investments, with a long-term view to growing the portfolio in order to provide financial stability and support for new initiatives of the University.
The main purpose of the interest-bearing loans and borrowings is to raise finance for the University’s capital building projects. The University has various other financial assets and liabilities, such as accounts and student fees receivable, and accounts payable, which arise directly from its operations.
The main risks arising from the University’s financial instruments are market risk, credit risk, and liquidity risk. Council, through its Finance Committee, reviews, and agrees on policies for managing each of these risks. These are summarised below:
Market risk: The risk that the fair value or future cash flows of a financial instrument will fluctuate because of changes in market prices. Market risk comprises three types of risk: price, currency, and interest rate risks. The University's exposure to market risk relates primarily to its investments and loans.
The University’s investments are managed by selected portfolio managers who operate under defined mandates, which are designed to limit the exposure of the University. The investment decisions made, and performances of these managers are closely monitored by the Finance Committee. This Committee comprises members of the University’s Council and executive management members with specific expertise relating to investments.
Interest rate risk: The risk that the fair value or future cash flows of a financial instrument will fluctuate because of changes in market interest rates. The University’s interest-bearing borrowings are a combination of fixed and floating rates of interest. The University has a number of receivables where interest rates charged are linked to the prime rate.
The University did not charge any interest on student fees receivable for the current year (2024: RNil).
The University holds a substantial amount of interest-bearing investments and interest earning bank deposits. Interest risks relating to the University’s investments are managed by selected portfolio managers.
The following table demonstrates the sensitivity of the University's financial assets and liabilities that are subject to interest rate risk to a reasonable change in market values, with all other variables constant. The effect of these are considered on a net basis.
Price risk: The risk that the fair value or future cash flows of a financial instrument will fluctuate because of changes in market prices (other than those arising from interest rate and currency risks). The University is exposed to price risk in respect of its investment portfolio. The University manages this risk through investing in a wide variety of assets.
The following table demonstrates the sensitivity of the University's financial assets that are subject to price risk to a reasonable change in market values, with all other variables constant.
Foreign currency risk: The University is exposed to foreign currency risk to the extent that it has accounts receivable and payable balances denominated in foreign currencies. The amount of such balances is negligible at year-end.
Credit risk: The risk that one party to a financial instrument will cause a financial loss for the other party by failing to discharge an obligation.
The University trades only with recognised, credit worthy third parties. In addition, receivable balances are monitored on an ongoing basis, with the result that the University’s exposure to bad debts, with the exception of student fees receivable, is not significant, and there is no significant concentration of credit risk at year-end. The maximum exposure is the carrying amount reflected in Notes 5, 6 and 7 (excluding prepayments and VAT receivable).
In respect of trade and other receivables, the debtors would be considered to be a higher risk if they have defaulted, i.e., not made payment within 30 days of invoice issued, and show any economical signs of not being able to settle the debt. Trade debtor to the value of R6 787 064 (2024: R7 968 767) was fully impaired.
With regards to student debtors, both tuition and residence fees are charged in the beginning of the academic year that coincides with the financial year, and students have to settle their tuition fees within that specific financial year. Any outstanding debt at year-end has been accessed using the Expected Credit Loss model (ECL) taking the following details into account:
i. Is the student funded by a bursor, or self-funded?
ii. If self-funded, is there a payment plan currently in place to settle the outstanding debt?
iii. Has the student defaulted on the payment arrangement, i.e., missed a monthly payment?
If points (ii) and (iii) apply, the student is considered to be of a higher credit risk, and the full outstanding balance at as year-end has been impaired. Student debtors to the value of R1 315 197 812 (2024: R1 185 388 485) were fully impaired.
Student debtors that have not had any movement in the 3 preceding years, will be written off. Similarly, trade and other receivables that have not had any movement in the 12 months prior to year-end will also be written off.
All credit risk associated with student receivables is adequately provided for. The outstanding fees balance at year-end is as follows:
Provision for impairment of student debtors, illustrated as a percentage of gross student debtors’ balances outstanding at year-end:
With respect to credit risk arising from the other financial assets of the University, which comprise cash and cash equivalents, investment assets measured at FVTPL, the University’s exposure to credit risk arises from default of the counterparty, with a maximum exposure equal to the carrying amount of these instruments. The University only places cash and cash deposits with major financial institutions with good credit ratings.
The University considers financial assets which are neither past due, nor impaired, to be fully recoverable.
Fair values: Set out below is a comparison, by category, of carrying amounts and fair values of all of the University’s financial instruments.
The fair value of interest-bearing borrowings has been calculated by discounting the expected future cash flows at prevailing market interest rates. It should be noted that the fair value of fixed rate borrowings is impacted by the fact that these loans are subsidised by the State. (Refer to Note 8).
The fair value of short-term financial assets and liabilities approximates their carrying values.
The fair value of investments is based on quoted bid-market prices at the Statement of Financial Position date.
The following table reflects the fair values of financial instruments, including their levels in the fair value hierarchy. It does not include fair value information for financial instruments not measured at fair value if the carrying amount is a reasonable approximation of the fair value.
As at 31 December 2025
As at 31 December 2024
The University uses the following hierarchy for determining and disclosing the fair value of financial instruments by valuation technique:
Level 1: Quoted prices (unadjusted) in active markets for identical assets and liabilities.
Level 2: Consists of money market investments held with financial institutions. The fair value of these deposits is determined using a discounted cash flow valuation methodology based on market rates, reflecting time value of money and counterparty risk. The fair value of the quoted notes and bonds are based on price quotations at the reporting date.
Level 3: Inputs for the asset or liability that are not based on observable market data (unobservable inputs).
Liquidity risk: The risk that an entity will encounter difficulty in meeting obligations associated with financial liabilities. The timing and nature of the University’s cash inflows and outflows are such that liquidity problems are unlikely to arise. The cashflow position is monitored by Management daily, and the University has access to funds through either its holding of short-term bank deposits, or the investment portfolio, in the event that any unforeseen events occur.
Capital management: The Institution's policy is to sustain a healthy accumulated fund balance in order to maintain donor, creditor, and public confidence, as well as sustain future development of the Institution. Specifically-restricted funds are managed within the rules as agreed with the relevant funders. Management monitors the return on accumulated funds. There are no externally imposed requirements for the management of the accumulated funds.
The Institution monitors accumulated funds using a ratio of adjusted net debt to accumulated funds. For this purpose, net debt is defined as total liabilities, comprising interest-bearing loans, borrowings, and obligations under finance leases, less cash and cash equivalents.
The Institution's objective is to keep the ratio below 2.00. The Institution's adjusted net debt to accumulated funds ratio at 31 December was as follows:
The following table sets out the maturity profile of the University’s financial liabilities, based on contractual undiscounted payments.
19. Commitments
19.1 Capital commitments
Capital commitments, as listed below, relates to amounts formally designated for the acquisition, construction, and improvement of building projects.
It is intended that the University will fund these commitments from internal resources, investments, loans, and infrastructure grants.
19.2 Lease commitments
The expenses that relate to short-term leases reflected in profit and loss are as follows:
20. Remuneration of key Management
The following disclosure, as required by the Minister of Higher Education and Training, relates to compensation paid to members of the University’s Executive Management Team. Remuneration is based on cost of employment to the University. Compensation paid for other services performed within the University is reflected separately.
All of the above remuneration amounts are in respect of short-term employee benefits in terms of IAS 24, except:
1. Included in basic cost of employment is an amount of R5 552 173 (2024: R4 627 539) in respect of the employer's contribution to retirement funds and group life schemes.
2. These amounts are in respect of post-retirement medical aid.
Remuneration of Council members
Reimbursement for travelling expenses and stipends of R710 463 (2024: R541 250) were paid to external Council members for attendance at meetings of Council and its sub-committees. External Council members receive a stipend of R1 500; Chairperson of sub-committees R1 750; and Chairperson of Council R2 000 per meeting.
The following table represents the disclosure required in terms of IAS 24, in respect of compensation of key Management.
21. Related party transactions
The related party relationships of the Cape Peninsula University of Technology in terms of IAS 24 are as follows:
• Key Management personnel, which comprises members of both Council and the University Executive Management Team (refer to Note 21); and
• The Department of Higher Education and Training (DHET) (refer to Notes 12 and 17).
Due to the nature of the University’s operations and the composition of its Council (being drawn from public and private sector organisations), it is likely that transactions will take place with organisations in which a member of Council may have an interest. These are conducted in accordance with the University's procurement procedures.
During the current year, the University did not purchase any goods and services from companies in which a Council member or member of Senior Management has a major interest.
The following are significant related party balances, and transactions:
There are various terms and conditions in respect of subsidies and grants, and these are available upon request.
22. Events after the reporting date
In October 2025, the Finance Committee approved the withdrawal from our long-term investments to the value of R200 000 000 comprising of R150 000 000 as bridging finance for the first quarter of the year, and R50 000 000 as a recoupment of infrastructure project expenses. In March 2026, amounts of R150 000 000 and R50 000 000 were withdrawn from the financial assets measured at fair value.
In March of 2026, property was damaged due to a fire on Bellville Campus. An insurance claim has been submitted, but has not been finalised at date of signature.
23. Going concern
The University has adequate financial resources to continue in operation for the foreseeable future, and accordingly, the financial statements have been prepared on a going concern basis. This basis presumes that funds will be available to finance future operations, and that the realisation of assets and settlement of liabilities, contingent obligation, and commitments, will occur in the ordinary course of business.
Abbreviations
4IR Fourth Industrial Revolution
ACFE Association of Certified Fraud Examiners
AGM Annual General Meeting
AI Artificial intelligence
APP Annual Performance Plan
APS Average Point Score
AROC Audit and Risk Oversight Committee (of Council)
AY Academic year
BCM Business Continuity Management
BTech Bachelor of Technology Degree
CDISC Centre for Diversity, Inclusivity and Social Change
CDU Curriculum Development Unit
CE & WIL Community Engagement and Work Integrated Learning (Unit)
CE Community Engagement
CHE Council on Higher Education
CHEC Cape Higher Education Consortium
CIET Centre for Innovative Educational Technology
CMF Compliance Management Function
COMENSA Coaches and Mentors of South Africa
Convex Convocation Executive Committee
COVID Coronavirus
CPGS Centre for Postgraduate Studies
CPPD Centre for Professional and Personal Development
CPUT Cape Peninsula University of Technology
CTS Computer and Telecommunications Services
DHET Department of Higher Education and Training
DSA Division of Student Affairs
DU Disability Unit
DVC Deputy Vice-Chancellor
ECP Extended Curriculum Programme
EE Employment Equity
EEF Employment Equity Forum
EM Executive Management
ERM Enterprise Risk Management
ESG Environmental, social, and governance
EXCO Executive Committee (of Council)
FAS Faculty of Applied Sciences
FBMS Faculty of Business and Management Sciences
FEBE Faculty of Engineering and the Built Environment
FEd Faculty of Education
FET Further Education and Training
FHWS Faculty of Health and Wellness Sciences
FID Faculty of Informatics and Design
FinCom Finance Committee (of Council)
FRGMS Fraud Risk Governance and Management Scorecard
FTE Full-time equivalent
Fundani CHED Fundani Centre for Higher Education Development
FYE First Year Experience
GAs Graduate attributes
GBV Gender-based violence
GEC Governance and Ethics Committee
GET General Education and Training
GEWE Gender Equality and Women Empowerment
HC Human Capital
HE Higher Education
HEI Higher education institution
HEMIS Higher Education Management Information System
ISO International Organization for Standardization
ISPC Institutional Strategic Planning Committee
IT Information technology
ITF Institutional Transformation Forum
ITGC Information Technology Governance Committee of Council
JFAC Joint Finance and Audit Committee
KPI Key performance indicator
L&T Learning & Teaching
LGBTQIA+ Lesbian, gay, bisexual, transgender, queer, intersex, asexual, plus
LMS Learner Management System
LTA Learning, Teaching and Assessment
ManCom Management Committee
MCD Marketing and Communication Department
MoA Memorandum of Agreement
MoU Memorandum of Understanding
NDP National Development Plan
NESP Nurturing Emerging Scholars Programme
nGAP New Generation of Academics Programme
NQF National Qualifications Framework
NRF National Research Foundation
NSFAS National Student Financial Aid Scheme
NTRF National Tertiary Retirement Fund
OHS Occupational health and safety
PG Postgraduate
PGDip Postgraduate diploma
PhD Doctor of Philosophy
POPIA Protection of Personal Information Act
PPC Physical Planning Committee of Council
PQM Programme and Qualification Mix
QARM Quality Assurance and Risk Management
QIP Quality Improvement Plan
QMA Quality Management and Assurance
QMD Quality Management Directorate
RDG Research Development Grant
RemCo Remuneration Committee
RO Retention Officer
RPL Recognition of Prior Learning
RTI Research, Technology and Innovation
RTIP Research, Technology Innovation, and Partnerships
SADC Southern African Development Community
SADTC South African Dental Technicians Council
SAQA South African Qualifications Authority
SARChI South African Research Chair Initiative
SARETEC South African Renewable Energy
SDGs Sustainable Development Goals
SenEx Senate Executive Committee
SETA Sector Education and Training Authority
SHE Safety, Health and Environment (Department)
SIP Strategic Initiatives and Partnerships (Directorate)
SL Service-learning
SLA Student Leadership Academy
SLCE Service Learning and Community Engagement (Units)
SLU Student Learning Unit
SoTL Scholarship of Teaching and Learning
SQD Student Quality Desk
SRC Student Representative Council
SSC Student Services Council
SSCSA Search and Selection Committee for Senior Appointments
STEM Science, Technology, Engineering, and Mathematics
STEMI Science, Technology, Engineering, Mathematics, and Innovation
SU Stellenbosch University
TDP Teaching Development Programme
TIA Technology Innovation Agency
ToRs Terms of Reference
TTO Technology Transfer Office
TVET Technical and Vocational Education and Training
UCDG University Capacity Development Grant
UCDP University Capacity Development Programme
UCT University of Cape Town
UG Undergraduate
UNISA University of South Africa
UPSET Unfurling Post School Education and Training
USAf Universities South Africa
USDP University Staff Doctoral Programme
UWC University of the Western Cape
V2030 Vision 2030 (Strategic Plan)
VAT Value Added Tax
VC Vice-Chancellor
WCED Western Cape Education Department
WIL Work-integrated learning
ZAR South African Rand
The Council and Management of the Cape Peninsula University of Technology (CPUT) are guided by the Strategic Plan 2030 Vision, Mission, and Values:
Vision
CPUT is Africa’s leading Smart University of Technology, globally renowned for innovation, with graduates that shape a better world for humanity
Mission
CPUT transforms its students, through world class researchers who inspire knowledge production and innovation that are cutting edge
Values
CPUT agrees to oneness and smartness by:
• Embracing a culture of Ethics and Integrity;
• Seeking Kindness and showing compassion (human heartedness) for the well-being of all our students, staff, stakeholders and the CPUT community, as expressed in ubuntu as a way of living;
• Embracing Restoration as we deal with the legacy of our past and as we redress issues of equality, gender-based violence, and any form of discrimination;
• Being a testimony of Unity (ubunye), whilst embracing diversity (ukungafani ) in all its forms by being honest, transparent, credible and respectful;
• Showing Passion and demonstrating enthusiasm, devotion, intensity, tenacity and total commitment to everything that we undertake as a university of technology; delivering uncompromising quality service, and always searching for better ways of doing things;
• Taking Accountability and accepting responsibility for all our actions and the actions that we commit to;
• Being Technologically Astute and understanding, as staff members or students of CPUT who aspire to become technologically astute, that we will embrace and take ownership of and experiment with the possibilities technology offers. These attributes facilitate the novel application of modern technology, enabling the enhancement of productivity and efficiency, whilst always focusing on innovation that is centred on a better world.
The tree depicted in the “20 Years of Growing from Greats” campaign symbolises growth, connectedness, and oneness. It provides connections, mental sustenance, safety, and support for the CPUT community.
The branches represent the various fields of study and research, all interlinked, growing and achieving in their own fields; but at the same time, contributing to the overall growth and achievement of the tree.
The trunk supports these branches, and facilitates growth by providing what is needed, in the same way that the support services facilitate the learning, teaching, and research functions at the University.
A resilient, healthy tree needs sturdy, developed, and nourished roots. The roots of the tree symbolise the strong heritage institutions that merged to form CPUT. Without the solid base of these heritage institutions, CPUT would not be where it is today.
The circuit board/ networking overlay symbolises CPUT’s evolution by using the latest technology as a growth framework and enabler. Our development is grounded in the use of technology, and the interconnectedness that networking provides.