South Fork Market Summary
Market momentum in the Hamptons continued to build through the fourth quarter, driven more by rising prices and concentration at higher price points rather than by transaction volume. While overall sales activity moderated, total dollar volume and pricing increased sharply, reflecting sustained engagement from wellcapitalized buyers and steady demand for high-quality inventory. By late fall, the market was increasingly defined by fewer but higher-value trades, which reflected a sense of optimism heading into the new year.
The South Fork recorded 420 single-family home sales in Q4 2025, a 15.0% decline from the 494 transactions in Q4 2024, though activity improved from the third quarter modestly by 3.9%. Despite fewer closings, total dollar volume climbed 9.5% year over year to $1.69 billion, while the average sale price rose 28.8% to $4,031,044 while the median increased 33.9% to $2,500,000, continuing a trend that favors quality over quantity.
Among the major submarkets, Southampton accounted for nearly a third of transactions with 135 sales. Although transactions declined 14.6% year over year, the submarket posted a 63.3% increase in median price to $2.4M, reflecting strong demand at higher price points. East Hampton followed with 114 sales, representing a 30.9% decrease in transactions alongside a 19.7% decline in pricing, though demand at the upper end remained resilient. Sag Harbor stood out with the most notable year over year growth, with 62 sales representing a 44.2% increase, continuing its forward momentum. Bridgehampton saw a modest 20% rise in transactions but a dramatic 92.5% surge in volume, driven by two of the quarter’s most expensive sales. Shelter Island was the sole submarket to record declines in average and median pricing as well as total volume, while transactions remained flat, signaling comparatively softer demand.
The luxury and ultra-luxury segments delivered another standout quarter, with 31 sales exceeding $10 million, an increase from the prior quarter and a clear indication of resilience at the top end of the market. East Hampton led with 11 trades, followed by Bridgehampton with 8, and Southampton with 7. The quarter’s top sale was 165 Surfside Drive in Bridgehampton, closing at $58 million, marking one of the priciest transactions on the East End this year.
Overall, the fourth quarter reinforced a defining theme of 2025: Pricing power driven by luxury and ultra-luxury demand, even as transaction volume remained constrained. Looking ahead to 2026, a gradual increase in inventory would help restore greater balance to the market. Early activity suggests continued engagement from affluent buyers and a market that remains selective, resilient, and well-positioned in the months ahead.
–Joe Fuer
Managing Director
$4,031,044
$2,500,000
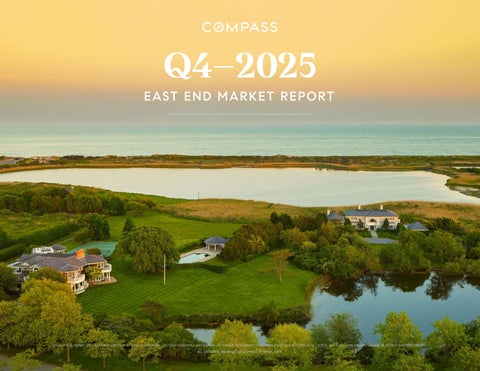
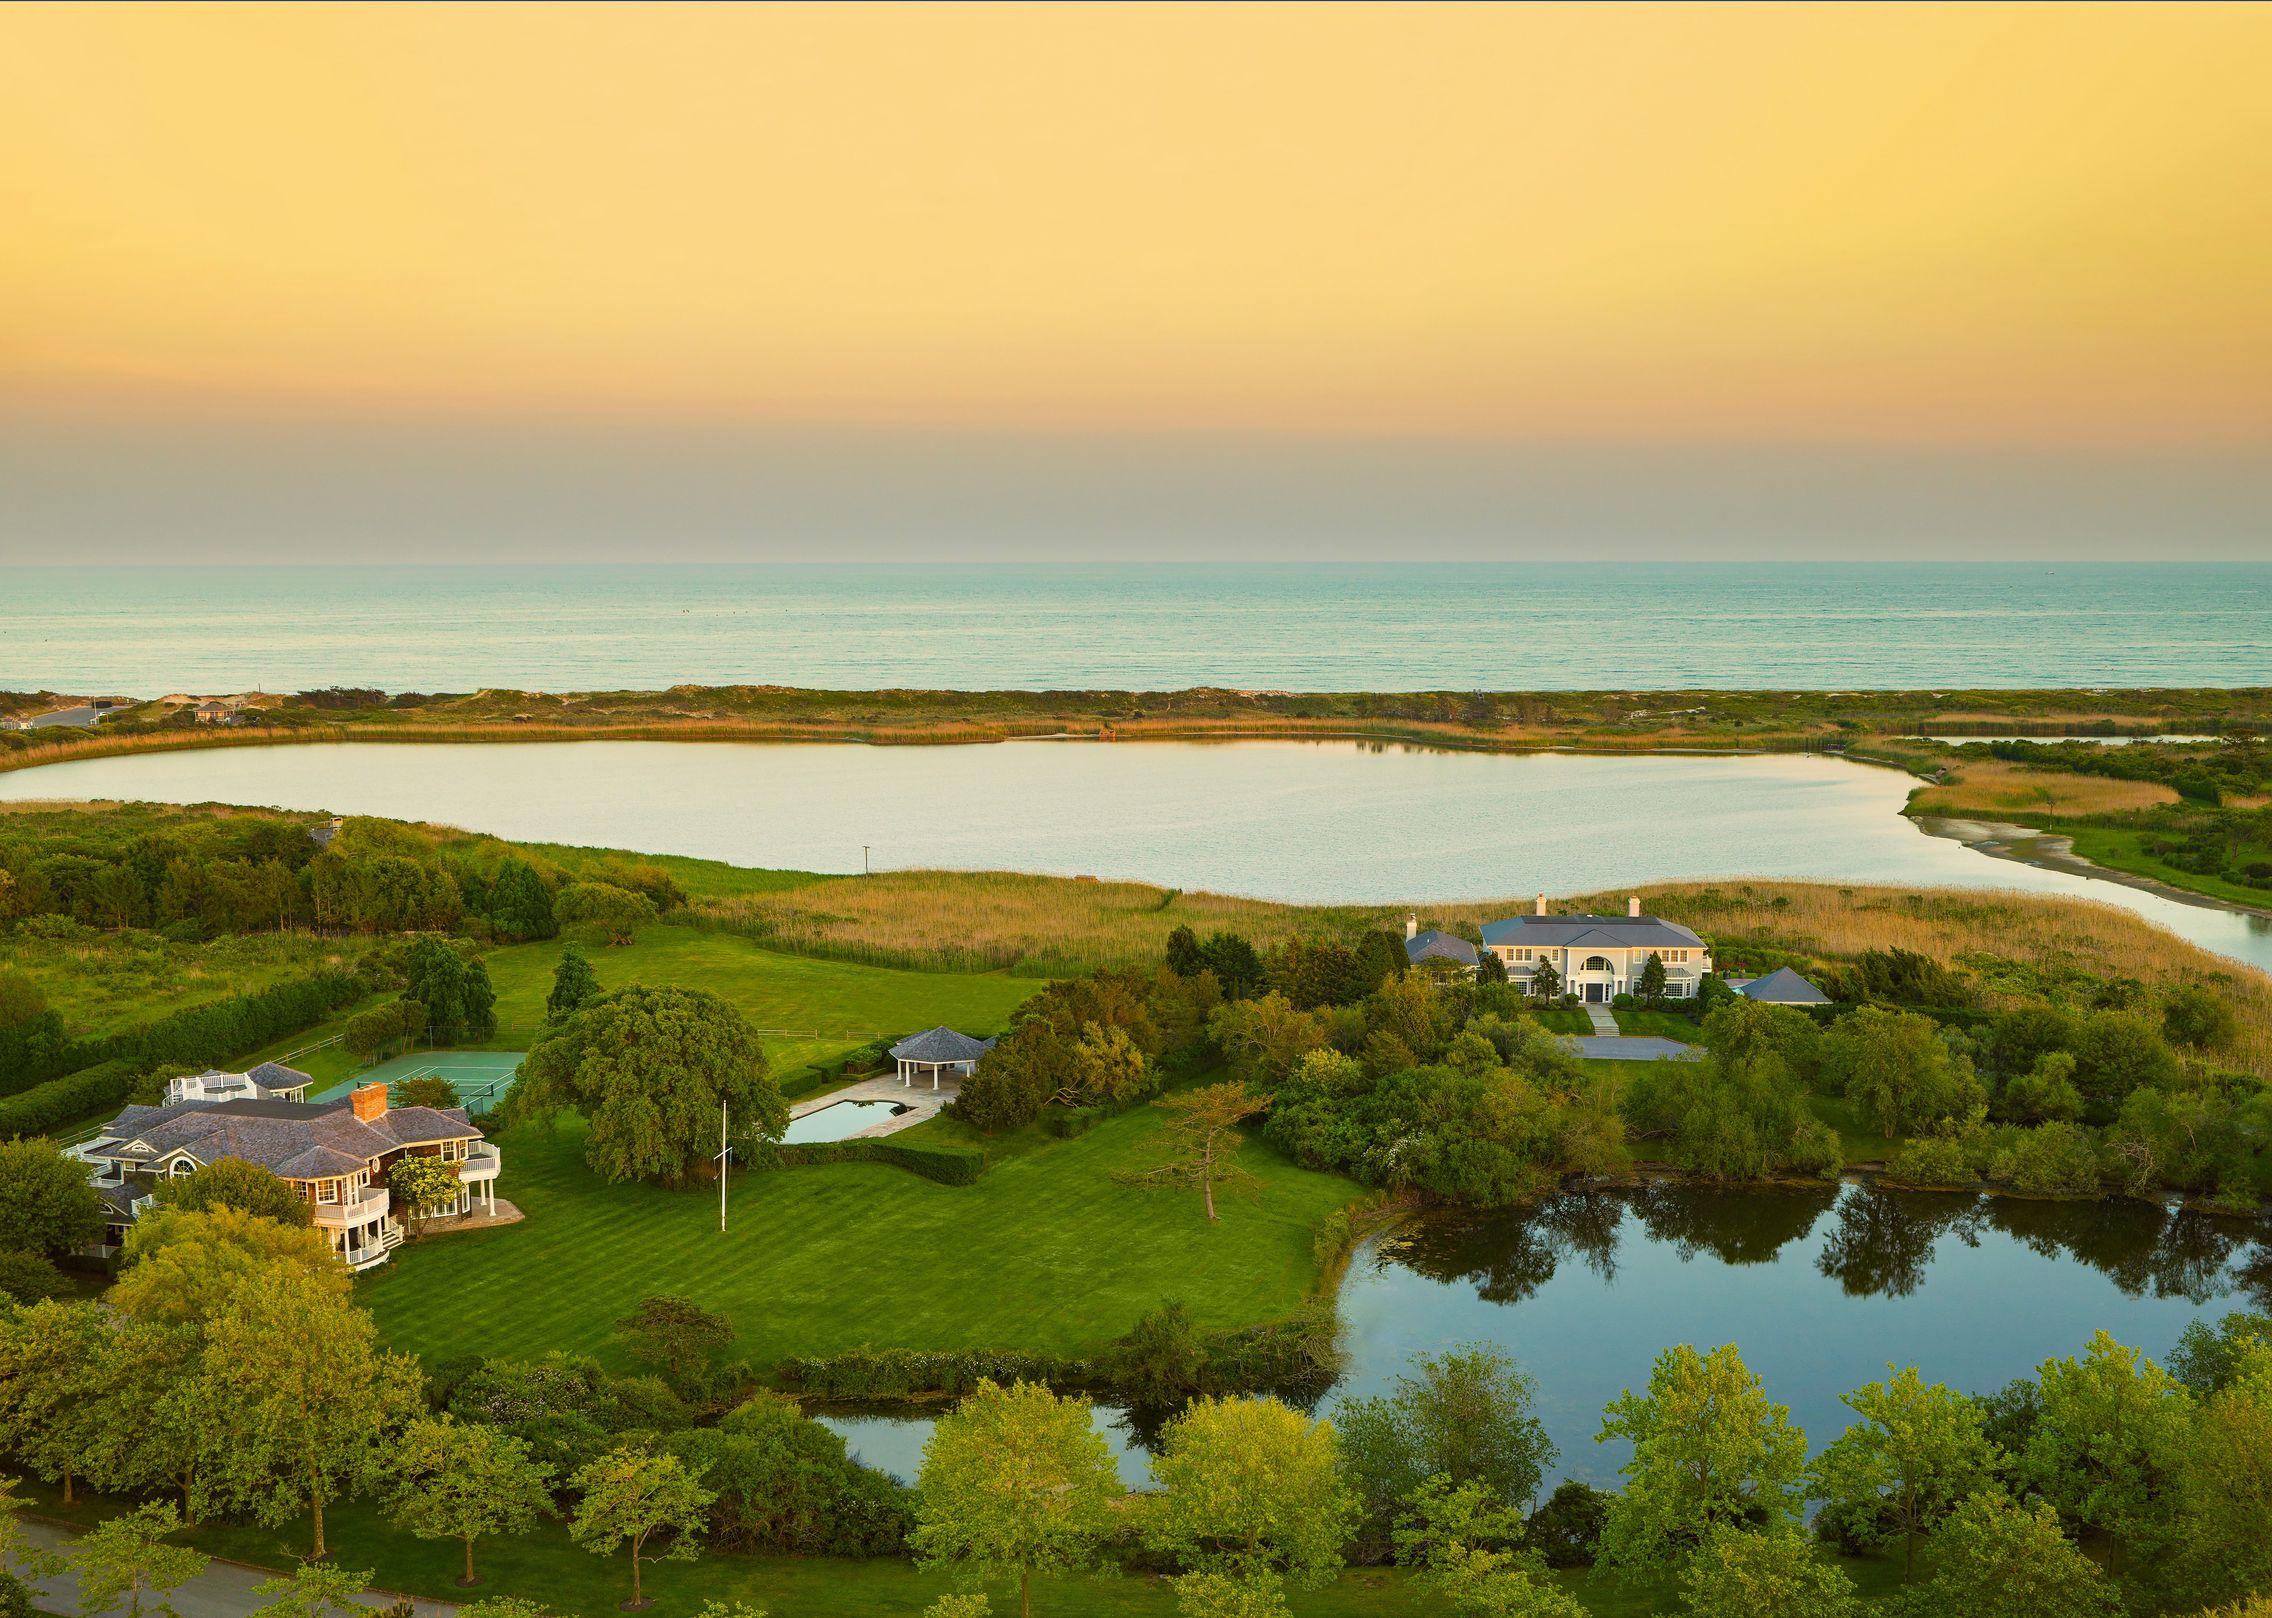
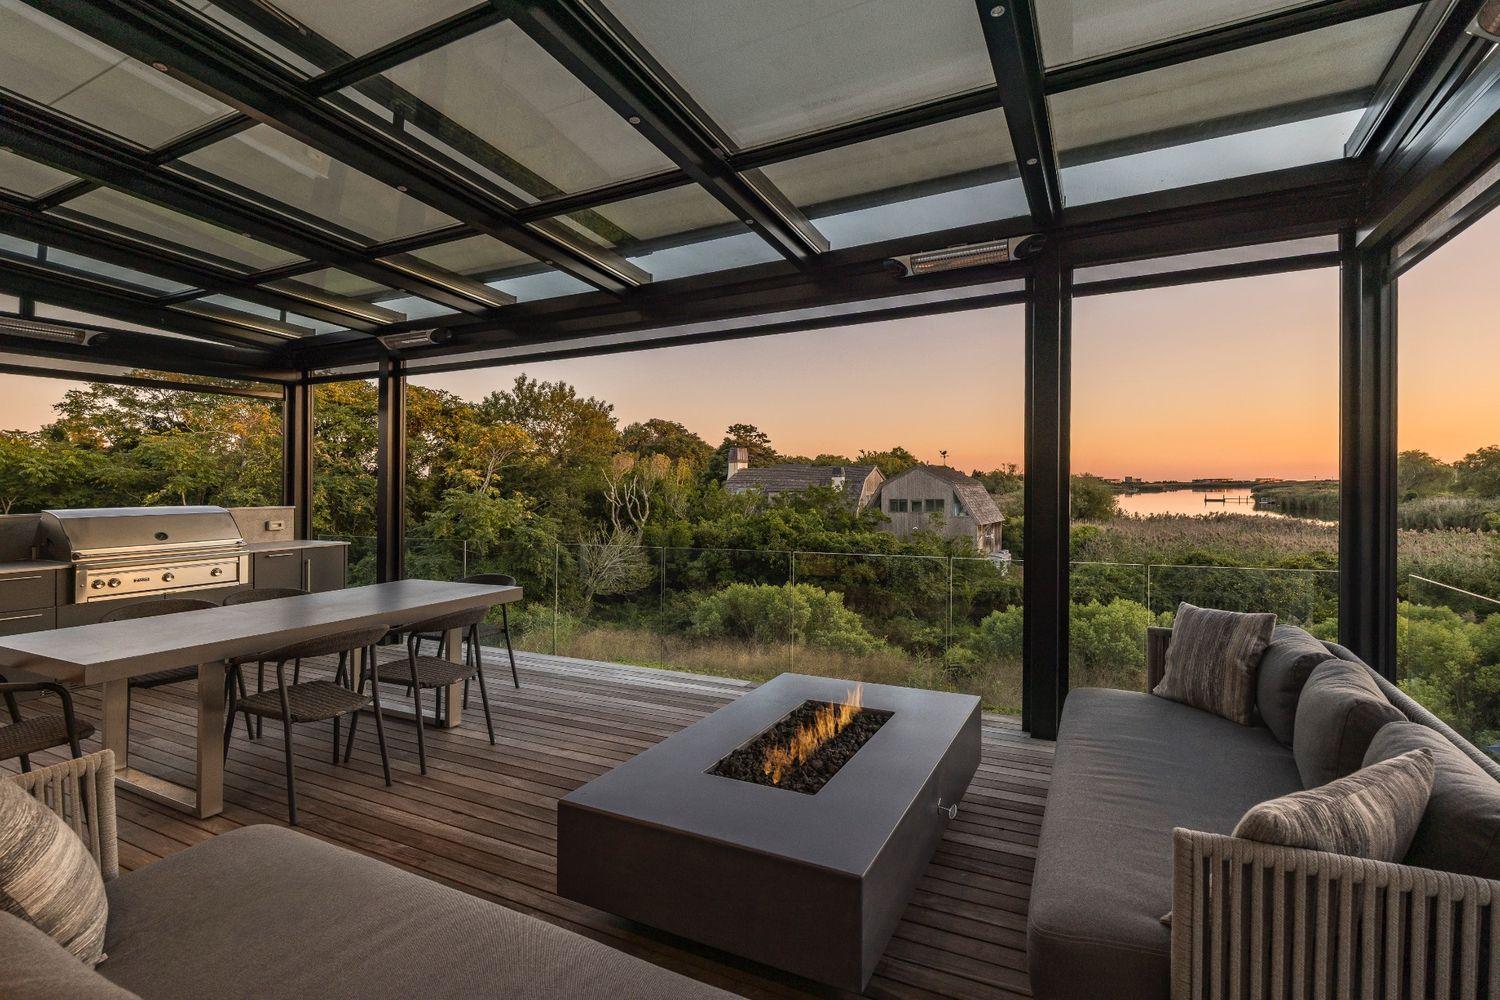
Pictured on the cover page: 54, 24, 20 Jule Pond Drive, Water Mill
Submarket
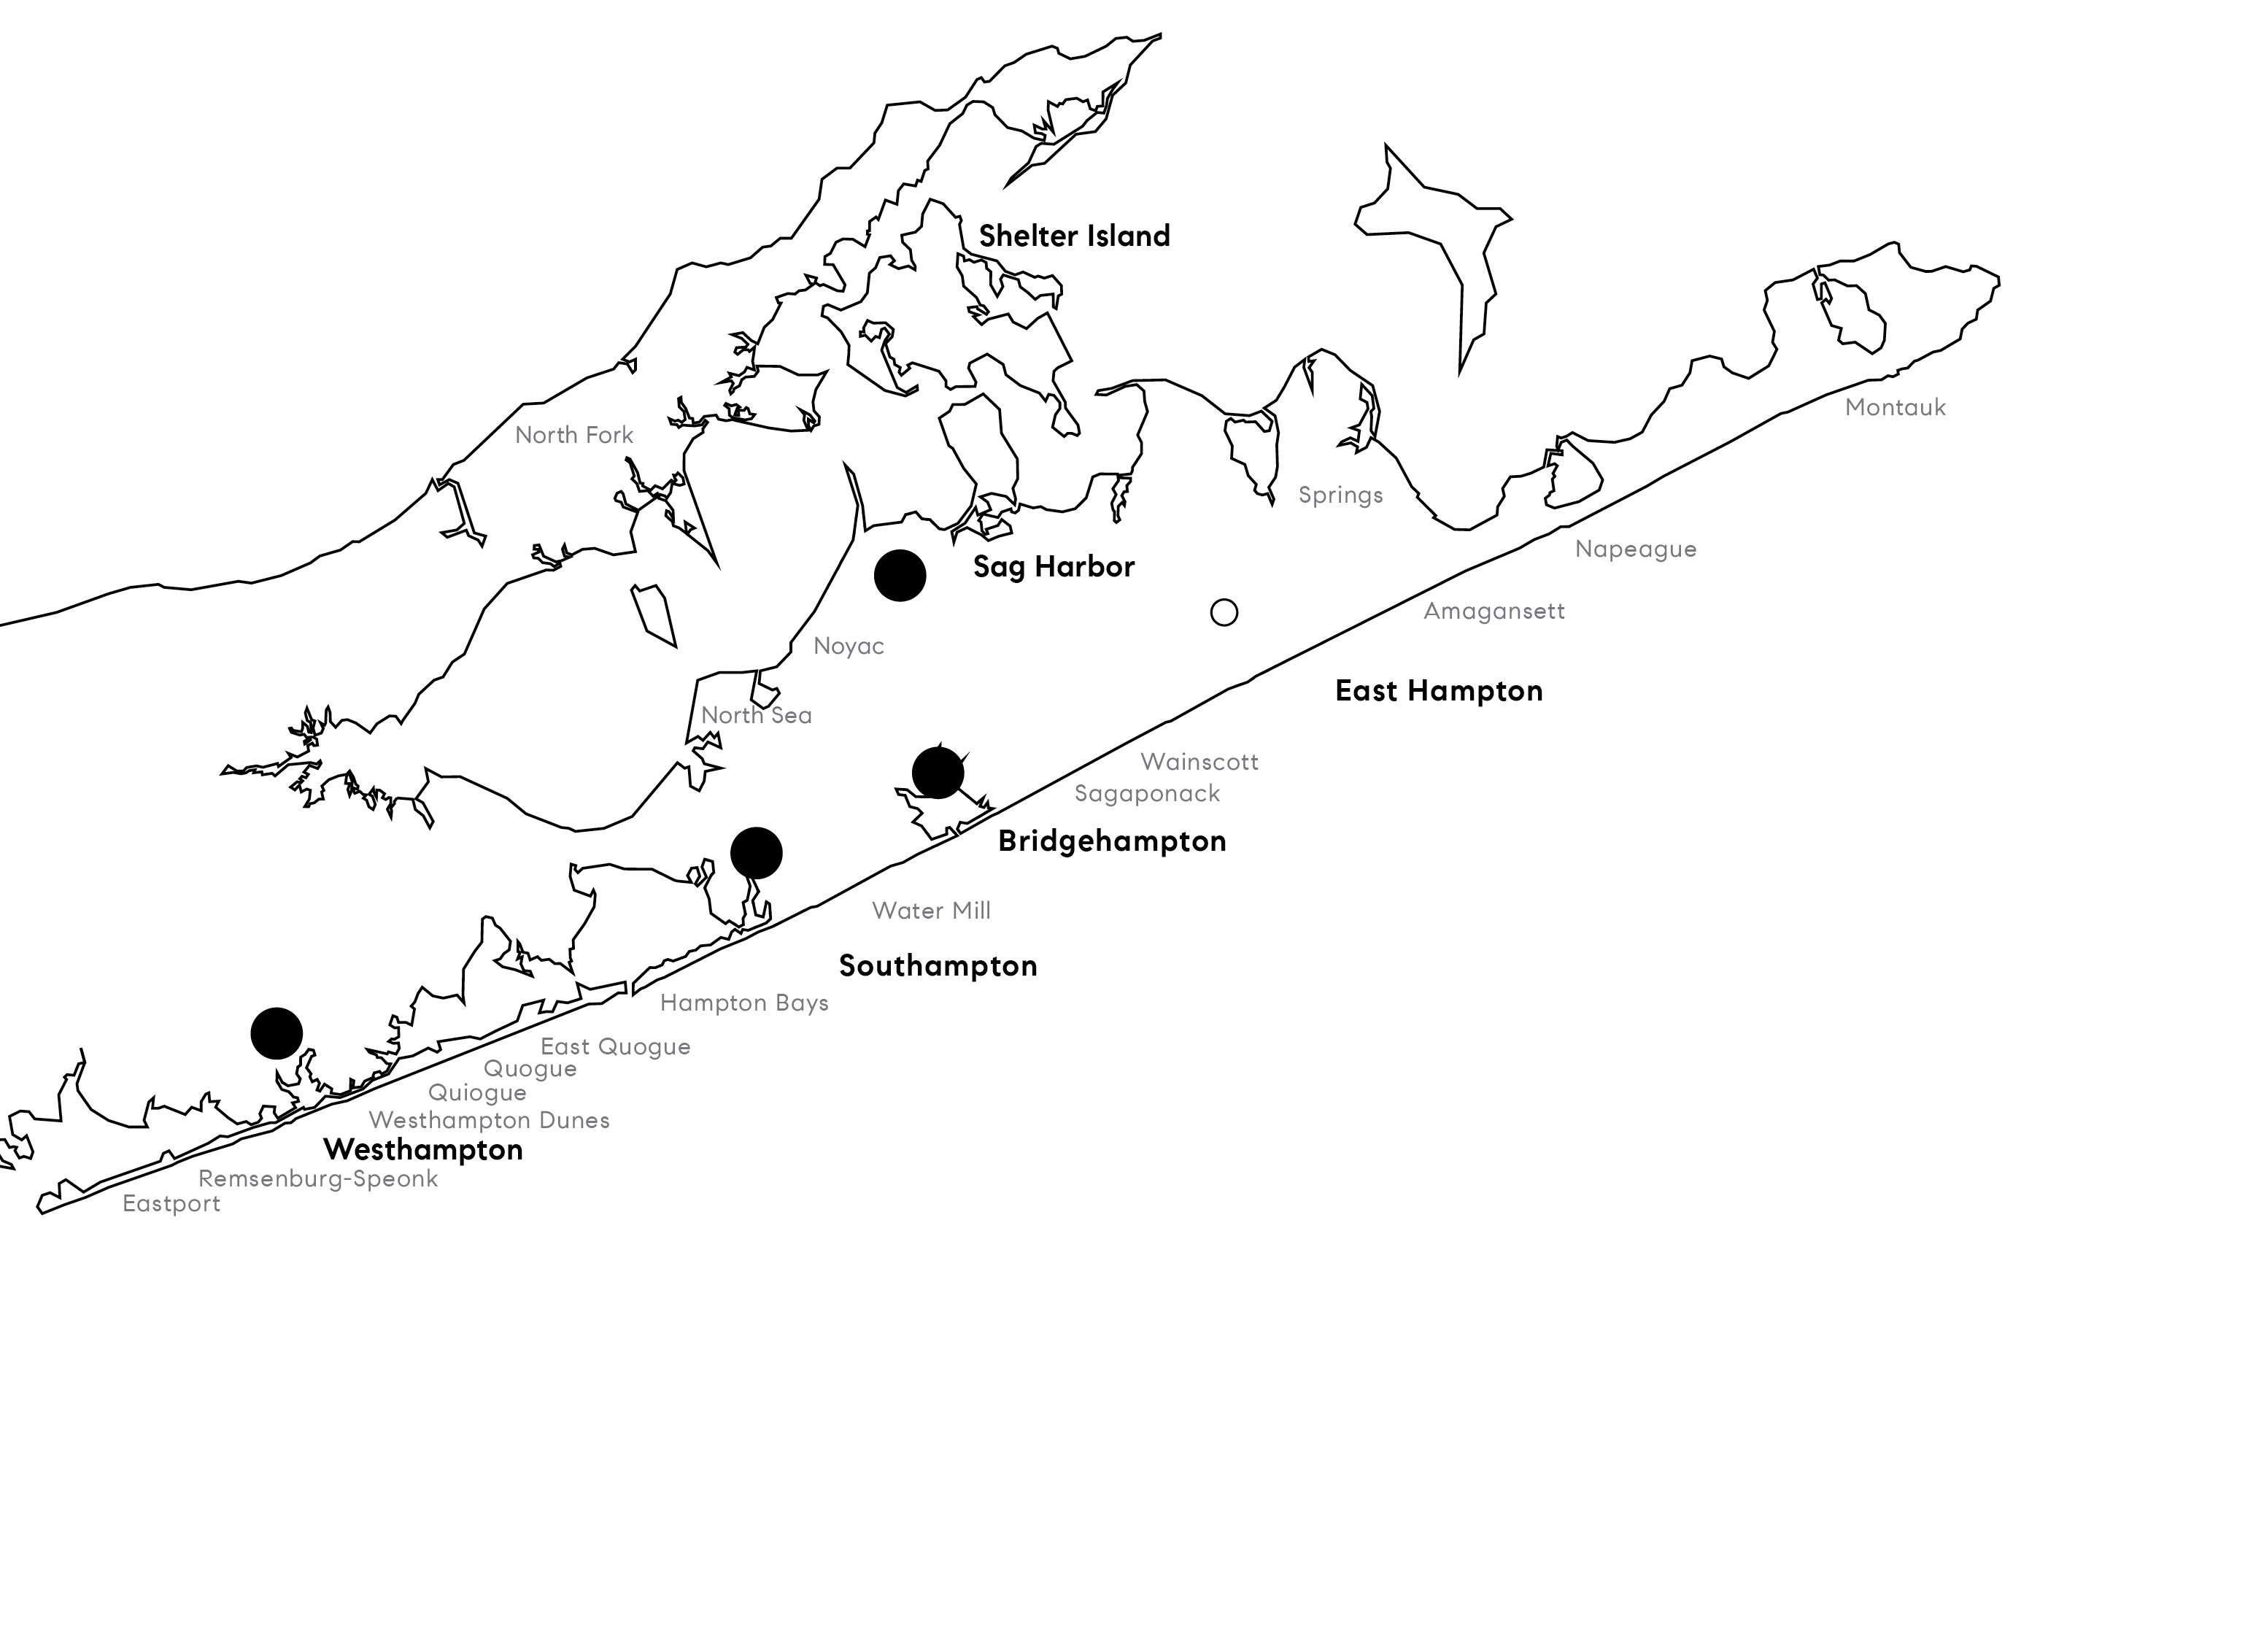
East Quogue, Hampton Bays, Quiogue, Quogue, Remsemburg, Speonk, Westhampton, Westhampton Beach, and Westhampton Dunes
Bridgehampton and Sagaponack
Amagansett, East Hampton, East Hampton Village, Montauk, Northwest Woods, Springs, and Wainscott
Southampton, Southampton Village, and Water Mill
North Haven, Noyac, Sag Harbor and, Sag Harbor Village
South Fork - Single Family
TOTALS
South Fork - Single Family
West of the Canal -
West of Canal - Single Family
PRICE POINTS
East of the Canal - Single Family
TOTALS
East of Canal - Single Family
PRICE POINTS
Your home. Your choice.
OWN THE NARRATIVE
THE 3-PHASED MARKETING STRATEGY

DEVELOP YOUR STRATEGY WITH COMPASS


South Fork - Single Family
TOTALS
Shelter Island East Hampton
Westhampton - Single Family
East Quogue
Hampton Bays
Quiogue
Quogue
Westhampton - Single Family
TOWN
Remsenburg
$13,016,250
Speonk
Westhampton
Westhampton Beach
$32,256,713
$1,697,722
$1,450,000
Westhampton Dunes
Southampton
Single Family
TOWN
North Sea
$2,277,563
$1,596,000
Southampton Village Southampton
Water Mill
$6,297,674
$6,049,000
Bridgehampton - Single Family
TOWN
Bridgehampton
Sagaponack
$111,725,000
$7,448,333
$5,595,000
Sagaponack Village
Sag Harbor - Single Family
2528 NOYACK ROAD, SAG HARBOR
North Haven
Noyac
Sag Harbor
Sag Harbor Village
Shelter Island - Single Family
TOWN
Shelter Island
East Hampton - Single Family
$3,920,692 $3,728,590
Montauk
East Hampton Village East Hampton Amagansett
East Hampton - Single Family
$2,552,937 $2,123,750
Wainscott Springs
North Fork Market Summary
In the fourth quarter, the North Fork followed a notably different trajectory than the South Fork. While the South Fork saw fewer transactions alongside sharp gains in volume and pricing, the North Fork experienced higher transaction activity, only modest growth in total dollar volume, and softer average and median sale prices. This divergence reflects a market driven more by increased deal flow and value-oriented buying than by concentration at the high end. Even amid elevated mortgage rates and cautious sentiment, demand remained steady for well-located homes, particularly where pricing aligned with buyers’ expectations.
Total unit sales increased 13.8% year over year to 140, and rose 29.6% from Q3, while sales volume increased 3.2% to $181.6 million. Pricing was more mixed. The median sale price softened 4.9% to $950,000, and the average sale price declined 9.3% to $1,297,239, suggesting fewer outsized highend trades even as overall activity increased.
Southold once again led the quarter with 33 sales, up 13.8% year over year, though volume declined 10.3% and the median fell 21.7% to $940,000, reflecting a more value-driven mix of transactions. Mattituck followed closely with 27 sales, a 125% increase, and delivered a 57.3% rise in volume, supported by a 14.5% gain in median price to $999,000. Cutchogue remained a major contributor with 21 sales, down 8.7%, while pricing held relatively steady with a median of $1.28 million. Greenport posted 14 sales, up 40%, and saw a 52.0% jump in volume, though its median slipped 10.7% to $895,500, indicating strength in activity with a slightly softer pricing mix.
Elsewhere, several smaller areas showed meaningful shifts. East Marion doubled to 9 sales and recorded a sharp increase in volume, while Orient and Orient Point rose to 6 sales with the median up 5.1% to $1.13 million. Jamesport and South Jamesport declined to 6 sales, but the median increased 15.8% to $992,000, reflecting continued demand for quality even with fewer closings.
Overall, the fourth quarter reinforced a familiar North Fork theme: more transactions, stable volume, and a market increasingly shaped by transaction mix. With limited inventory and enduring appeal as both a primary and second-home destination, the North Fork remains well-positioned heading into 2026, with buyers continuing to focus on value, condition, and location.
– Joe Fuer
Managing Director
$950,000
North Fork - Single Family
TOTALS
ONE PLACE FOR HOME
The only platform designed to connect you and your agent through every phase of your real estate journey.
STEP INSIDE COMPASS ONE
North Fork
Q4-2025
Aquebogue
Baiting Hollow
Cutchogue
East Marion
North Fork
Mattituck
Laurel
Greenport