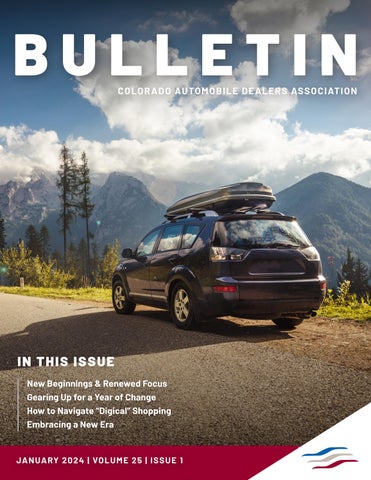
BULLETIN CO LO R ADO AU TO M O B I L E D EAL ER S ASSOC IATIO N
I N T HIS ISSU E New Beginnings & Renewed Focus Gearing Up for a Year of Change How to Navigate “Digical” Shopping Embracing a New Era
A
JA NUARY 202 4 | VO LUM E 2 5 | I SS U E 1
CONTACT US Colorado Automobile Dealers Association 290 East Speer Blvd., Denver, CO 80203 | 303.831.1722 info@colorado.auto | www.colorado.auto
OUR STAFF Matthew Groves CEO matthew.groves@colorado.auto | 303.282.1449 Beth Weir Vice President of Finance beth.weir@colorado.auto | 303.457.5120 Mark Zeigler Clear the Air Foundation Director mark.zeigler@colorado.auto | 303.457.5105 Khorrie Luther Associate Vice President of Operations khorrie.luther@colorado.auto | 303.457.5122 Dan Allison Member Services Coordinator dan.allison@colorado.auto | 303.831.1722 Devin Saunders Billow Barrow Fellow for Government Affairs devin.saunders@colorado.auto Caitlin Ming Director of Member Services caitlin.ming@colorado.auto Margo Finer Director of External Affairs & Communications margo.finer@colorado.auto
2
BULLETIN | JANUARY 2024
About Our Association Representing the franchised new car dealers of Colorado The Colorado Automobile Dealers Association (CADA) is the voice of the automotive retail industry throughout the state. As the automobile dealer trade association, CADA advocates issues of importance to the auto industry, Colorado auto dealers and Colorado’s driving public. The Denver Automobile Dealers Association started in 1914 to operate the annual Denver Auto Show which dates to back 1902. Colorado Automobile Dealers Association soon followed and both associations operated together with shared staff and a headquarters building. In 2010, after almost eight decades together, the two associations became one. The history now dates over 108 years of high level automotive and mobility impact. Today, our dealers range from small family-owned dealerships, to nationally operated, multiple franchise corporations. CADA represents a united front for over 300 new car, truck, motorcycle and RV dealers. From local, state and federal policymakers, to the public and the media, CADA is the voice for Colorado’s auto industry.
3
Matthew Groves CEO
New Beginnings and Renewed Focus: Shifting Our Political Influence from State to Local Level If you have been reading the Bulletin over the last eight months, you know much of our conversation here has been about new beginnings. At first, there were things that needed triage: our budget, superfluous events, and the Denver Auto Show. Thanks in part to the extraordinary efforts of our rebuilt team, the Big 3 items were resolved in the first eight months. But as a new year is upon us, it has always been my habit to take stock of where we are juxtaposed to where we would like to be. As we refocus on CADA’s core mission of advocacy, we are noticing a trend: policymaking is becoming a game of hot potato. Over the past four years, a slowdown at the federal level has resulted in more regulation from the state. But as the discord that plagues the U.S. Congress is quickly spreading into state legislatures and grinding governance to a halt, ideas for effective policy are essentially being delegated again to county, municipal, and appointed local control boards. It begs the question, “If this is where decisions are being made, why aren’t we turning our influence there? So, we are taking the first step this month. Each of you is familiar with the Colorado Automotive Retailers Political Action Committee (CARPAC). It is our primary vehicle to get involved in political giving. Historically, our practice has been to empty the PAC every cycle. This assumes
4
BULLETIN | JANUARY 2024
significant risk by building no reserve for unforeseen existential threats. Think of the oil & gas industry with Proposition 112 (2,000 ft. setback for new wells). This was a $30 million campaign for them, that ultimately lost. We have responded by building a modified strategy that holds some portion of our annual giving in reserve to prepare us for larger fights to come. But this is not the only way our giving philosophy has changed. We are shifting our participation from exclusively state-level giving into many of the competitive races at the city and county levels. This serves two purposes: first, many of you have seen that damaging policy tends to start at the municipal level, our shift will serve as a beta test of sorts before policy rises to the state legislature; second, it will focus on building relationships with local officials who tend to represent our interests as they evolve in statewide legislative roles. In 2023 alone, we have supported mayoral candidates in Aurora, Thorton, and Lakewood. We have gotten behind city council candidates in Centennial and Arapahoe County commissioners, and are taking an interest in many metropolitan offices on both sides of the aisle that could aid us in slowing the expanded influence of Denver that has been so unfriendly to vehicles and drivers over the past five years.
There is a common trope in policymaking that you must fix the roof before you fix the house. I look at this from the inverse perspective. If we are going to be influential as a state association, we must build from a solid foundation. Policymakers respect dealers because you are all pillars of your community. Your active engagement and relationships in the neighborhoods you help create are the core of that strength. Without it, we lose our footing when advocating at the state capitol. For 2024, and likely beyond, we are going to start turning our spotlight on this engagement to remind state lawmakers that as much noise as we can make in the Capitol, the calls will get far louder when they return home to their constituents (i.e. your customers and employees).
With this in mind, we encourage you all to reach out if there is a local politician, or aspiring politician, in whom you see great potential. As I have been traveling the state to conduct dealer visits, I am also meeting with local chambers, and business organizations, to see who in their ranks may have an interest in public service. We are happy to reach off the front range for the right candidate who has earned the attention of our dealer members.
Gearing Up for a Year of Change: The Colorado Legislature Opens Its Doors The Colorado State Capitol buzzed with anticipation earlier this month as legislators returned for the 2024 session. Convening on January 10th, the 74th General Assembly set its sights on tackling the challenges and opportunities facing the state. This annual session, running until May 8th, promises to be a dynamic one, with crucial topics on the agenda for the year. Speaker of the House, Julie McCluskie, kicked off proceedings with a call for unity and collaboration. Acknowledging the diversity of perspectives within the chamber, she urged members to “prioritize the needs of all Coloradans” and focus on “finding common ground to build a brighter future.” In her address, she highlighted key areas of focus, including affordable housing, healthcare access, and environmental protection. Senate President Steve Fenberg echoed Speaker McCluskie’s emphasis on bipartisanship, reminding
lawmakers that “democracy thrives on respectful debate and compromise.” He emphasized the need for responsible budgeting and urged the Assembly to address fiscal challenges while investing in critical infrastructure and education. President Fenberg also touched upon pressing issues like water rights, security, and cybercrime, calling for innovative solutions to safeguard the state’s well-being.
Devin Saunders
Billow Barrow Fellow for Government Affairs
5
In his address, Governor Jared Polis shared his optimistic vision for Colorado. He expressed confidence in the Legislature’s ability to tackle complex issues and praised their past achievements in areas like renewable energy and transportation. Governor Polis outlined his priorities for the session, including bolstering Colorado’s economic competitiveness, expanding access to mental health services, and ensuring equitable access to educational opportunities. Beyond the speeches, the opening week saw the introduction of the first batch of bills, setting the legislative agenda in motion. Committees have begun scheduling hearings, and public testimony is expected to ramp up in the coming weeks. While challenges and disagreements are inevitable, the opening weeks of the session have showcased a commitment to constructive dialogue and a shared pursuit of progress for Colorado. As the Legislature gears up for months of debate and deliberation, the Colorado Automobile Dealers Association will continue to monitor several bills that could impact the auto industry and consumers across the state. The association’s commitment to advocating for policies that benefit businesses and consumers alike will remain steadfast, ensuring that the auto industry plays a vital role in Colorado’s continued growth and prosperity. Here’s a snapshot of the key bills currently on CADA’s radar:
Senate Bills • SB24-023: Protects dealers who use the state’s GIS database from a subsequent municipal or county sales tax audit. • SB24-025: Streamlines the state’s enforcement of sales and use tax collection among those home rule cities that allow the state to collect on their behalf. • SB24-032: Creates a committee to determine how to best incentivize Coloradans to better utilize public transit. This bill also creates a tax credit for the purchase of a state-wide free transit pass. • SB24-036: Creates the Vulnerable Road User Protection Enterprise (read: pedestrians/cyclists) in the Department of Transportation to provide funding for infrastructure improvements that reduce the number of collisions resulting in death or serious injury to vulnerable road users. The enterprise establishes a vulnerable road user protection fee, imposed in tiered amounts based on motor vehicle weight and configuration.
House Bills • HB24-1012: Reconfigures the advisory board for Front Range Rail and tries to stabilize operations and budget. • HB24-1014: Lowers the evidentiary bar for claims under the Colorado Consumer Protection Act. The bill establishes that evidence that a person has engaged in an unfair or deceptive trade practice constitutes a significant impact on the public. CADA will continue to monitor these bills and others as they progress through the legislative process, providing updates and analysis to members and advocating for policies that ensure a thriving automotive industry in Colorado.
6
BULLETIN | JANUARY 2024
“Digical” Shopping:
How to Navigate the New Hybrid Approach to Car Buying Just like everything these days, car buying has moved online. Although customers love the convenience of shopping for and purchasing a ehicle digitally, that doesn’t mean in-person car buying has gone by the wayside. Instead, modern customers are interested in a “digical” experience — part digital and part physical. To keep up with these shopping behaviors, consider the benefits of blending technology with the personal touch of your dealership.
Build confidence
With digital tools and information online, customers are able to do a lot of research on their own. They can comparison shop, use calculators to figure out their monthly payments or how much they can afford to spend on a vehicle and decide whether they should lease or buy. But today’s customers don’t stop using the internet during the research phase. They may choose to apply for financing online. Completing these steps digitally saves time spent at the dealership and allows customers to avoid feeling pressured.
Transform the test drive
Although customers are taking advantage of digital tools, the dealership is still an important part of the car shopping process. In fact, roughly three-quarters of buyers are most comfortable purchasing a vehicle with a mix of online and in-person elements. After doing the bulk of the process online, the customer then visits the dealership to see the vehicle in person, take it for a test drive and ask staff any remaining questions.
Embrace the new model
The “digical” buying experience is here to stay, so it’s important for your business to adapt. These steps can help you succeed in the new environment:
Make sure your dealership is equipped with the latest digital tools. Two-thirds of car buyers would like more digital tools such as online finance options and live chat. Train your staff to be friendly and knowledgeable in building trust with customers. Certify that pricing online matches the price quoted in the dealership and that there are no surprise costs. Build positive online reviews and promptly respond to those that aren’t so positive to maintain trust among your potential customers.
Go “digical” with confidence
Leaning into the digital revolution is crucial for success. Balance the best of the digital and physical worlds to make a great experience for both your staff and your customers.
7
Rob Edwards
CADA Board Chair
Embracing a New Era:
A Letter from the New Board Chair of the CADA Dear Members of the Colorado Automobile Dealers Association, As we usher in a new era at the Colorado Automobile Dealers Association, I am humbled and proud to step into the role of CADA’s Board Chair for the year 2024. It is an honor to represent this association and follow in the footsteps of Carol Spradley and the many great leaders who have led this board prior to us. Under Carol’s leadership, we successfully overcame a generational change, reformed our team, and made strategic decisions to position CADA for continued success. Together, we weathered challenges, celebrated victories, and laid the groundwork for a profitable future. Our association, with its year-round commitment to excellence, is not just about events and legislative advocacy—it is about making a lasting impact on the automotive industry and the people it supports. I have always believed that the strength of any association lies in the connections between its members. It is about the conversations we have, the ideas we share, and the support we offer one another. Whether you have been part of CADA for years or you are just starting your journey with us, your voice matters, and your presence is invaluable. I extend an invitation to each of you to actively participate in committees and meetings throughout the upcoming year.
8
BULLETIN | JANUARY 2024
As we gear up for the exciting journey that is 2024, I would like to introduce a shared goal that I am deeply passionate about, elevating the customer perception of who we truly are as automotive retailers. Our commitment to supporting local communities is unwavering, and now, it’s time to shine a spotlight on the positive impact we make. Every retailer within our association is actively involved in local initiatives, embodying the spirit of empathy and hospitality. Let’s explore innovative ways to enhance how our guests perceive us every day. Together, we can shape the future of our industry, foster innovation and create an unparalleled experience— ensuring that every customer leaves our dealerships feeling better than when they arrived. Let’s emphasize the value that retail dealerships bring to the table and deliver the highest standards of service, making 2024 a year where our reputation soars and the customer experience takes center stage. Proud and privileged to work alongside each of you. Sincerely, Rob Edwards CADA Board Chair
Help Your Employees Make it Home Safe Today Federated DriveSAFESM Telematics helps your employees improve their daily driving habits and return home safe at the end of the day.
AN ASSOCIATION MEMBER BENEFIT FOR 119 YEARS DIRECT, LOCAL MARKETING REPRESENTATIVES AUTO PROPERTY AND CASUALTY SELF-INSURED RETENTION POLICYHOLDER SURPLUS LIVE VOICE CUSTOMER SERVICE MYSHIELD® TAILORED, INDUSTRY-SPECIFIC COVERAGE BUSINESS SUCCESSION AND ESTATE PLANNING STABLE FACE-TO-FACE RELATIONSHIPS FINANCIAL STRENGTH MUTUAL COMPANY DIRECT CLAIMS REPRESENTATIVES 500+ EXCLUSIVE ASSOCIATION RECOMMENDATIONS ESTATE PLANNING ATTORNEY NETWORK ANNUITIES
Please Make It Home Safe Today.
IT’S OUR BUSINESS TO PROTECT CADA ACCA MEMBERS WE’RE BETTER TOGETHER LIFE AND DISABILITY INCOME PRIVATE BONUS PLANS KEY PERSON COVERAGE WORKERS COMPENSATION HIRING PRACTICES FEDERATED DRIVESAFESMSM TELEMATICS SOLUTION FEDERATED DRIVESAFE RISK MANAGEMENT RESOURCE CENTER EMPLOYMENT RELATED PRACTICES LIABILITY EMPLOYMENT LAW ATTORNEY NETWORK BONDING EMPLOYEE SAFETY TRAINING RISK MANAGEMENT ACADEMY CLIENT CONTACT CENTER FIELD RISK CONSULTANTS CERTIFICATE CENTER SURETY SPECIALISTS MANAGED CARE CYBER
Scan to learn more about DriveSAFE TELEMATICS.
The content of this publication is for general information purposes only. Consult with a qualified professional when you have detailed questions regarding any topic in this publication.
Commercial Insurance Property & Casualty | Life & Disability Income Workers Compensation | Business Succession and Estate Planning | Bonding Federated Mutual Insurance Company and its subsidiaries** | federatedinsurance.com 23.01 Ed. 11/23 *View A.M. Best Rating Guide information at www.ambest.com. **Not licensed in all states. © 2022 Federated Mutual Insurance Company
9
Mark Ziegler
Director, Clear the Air Foundation
The Clear the Air Foundation Celebrates an Exceptional Year! The Clear the Air Foundation wrapped up the year with a phenomenal 675 donations, marking it as the third-best year in its history! A massive shoutout to each and every one of you who contributed to The Foundation in 2023. Special recognition goes to those who joined us through the exhilarating VXC program, bringing in a whopping 271 vehicles. Now, here’s where the excitement kicks in: The Foundation is committed to allocating 35% of the VXC proceeds towards scholarships. Picture this – your generosity could directly impact the lives of automotive technology students and apprentices. So, here’s my fervent request: Connect with your Fixed Operations Directors and explore the potential recipients among your employees.
Imagine the ripple effect of providing deserving individuals with life-changing scholarships! If you have employees pursuing automotive education or engaged in apprenticeships, encourage them to seize this incredible opportunity by applying for the scholarship here. With the significant increase of vehicles coming to The Foundation from the VXC program, 2024 is likely to be our best year yet! So, let’s make this year an even more remarkable year of empowerment and support.
Clear the Air Foundation 2023 Total Vehicle Donations DEALER DONOR
TOTAL
VXC
John Elway Chevrolet
4
0
The Faricy Boys
19
1
O'Meara Ford
4
0
Mike Maroone Chevrolet South
18
0
McDonald Hyundai
4
4
Dellenbach Motors
16
4
Berthod Motors
4
0
Mountain States Toyota
14
0
Western Slope Auto
4
0
Pueblo Dodge Chrysler Jeep Ram
14
0
Steamboat Motors
4
0
Boulder Nissan
13
13
4
1
Emich Volkswagen
13
11
Phil Long Honda of Glenwood Springs
Pueblo Toyota
12
0
Phil Long Ford of Chapel Hills
4
1
Alpine Buick GMC South
12
0
Morehart Murphy RAC
4
2
Tynan's Nissan
11
11
Phil Long Ford of Denver
3
0
Schomp Subaru
11
1
Fort Collins Kia
3
3
Schomp Ford
11
0
Subaru of Loveland
3
0
Pedersen Toyota
10
9
McDonald Volkswagen
3
3
Emich Chevrolet
9
8
Stevinson Chevrolet
3
3
Markley Motors
9
0
Mike Maroone Buick GMC
3
0
Summit Ford
9
0
Phil Long Ford of Motor City
3
0
AutoNation Chrysler Jeep Broadway
9
0
Arapahoe Hyundai
3
3
Schomp BMW
3
3
Stevinson Toyota East
8
0
Emich Kia
3
3
Spradley Chevrolet
8
0
Foundation Hyundai
3
3
Johnson Auto Plaza
8
0
Perkins Motors
3
0
Emich Volkswagen of Boulder
8
7
AutoNation Dodge Ram Broadway 3
0
Schomp Hyundai
8
6
Phil Long Ford of Raton
3
0
The Faricy Boys Ford
7
1
Dave Solon Nissan
2
0
O'Meara Buick GMC
7
0
Freeway Ford
2
0
Schomp Honda
7
0
Schomp Mazda
2
0
Schomp Nissan
7
2
Subaru of Pueblo
2
0
Peak Kia
7
5
Spradley Kia
2
0
Groove Toyota
5
0
Groove Mazda
2
0 11
Clear the Air Foundation 2023 Total Vehicle Donations
DEALER DONOR
TOTAL
VXC
AutoNation Toyota Arapahoe
1
1
AutoNation Dodge Ram Arapahoe
2
0
Mike Shaw Subaru
1
0
Fowler Chevrolet
2
2
LHM Volkswagen Lakewood
1
1
Hellman Motor Company
2
0
Polestar Denver
1
1
Sill-TerHar Motors
2
0
Castle Rock Ford
1
0
Rickenbaugh Cadillac Volvo
2
0
Ferrari of Denver
1
0
Grand Junction Chrysler Dodge Jeep Ram
2
1
Groove Subaru
1
0
Phil Long Ford of Chapel Hill
2
0
Mini of Loveland
1
1
Christopher's Dodge Ram
2
0
Jaguar Land Rover Flatirons
1
0
O'Meara Volkswagen
2
0
BigHorn Toyota
1
0
Groove Ford
2
0
Honda of Greeley
1
0
Phil Long Hyundai of Motor City
2
2
Mountain Chevrolet
1
1
Tynan's Volkswagen
2
2
LHM Colorado Jeep
1
1
Empire Lakewood Nissan
2
2
BMW of Loveland
1
0
Valley Mitsubishi
2
2
Greeley Nissan
1
1
Fort Collins Chrysler Dodge Jeep Ram
2
0
AutoNation Chrysler Jeep Arapahoe
1
0
Fort Collins Nissan
1
1
Red Rock Nissan
2
2
McDonald Mazda South
1
1
Phil Long Hyundai of Chapel Hills
2
0
Durango Motor Company
1
0
Turner Automotive
1
0
The Faricy Boys Automotive
1
1
Stevinson Toyota West
1
0
1
1
0
Ed Bozarth #1 Park Meadows Chevrolet
1
Peak Kia North Phil Long Subaru
1
0
TruWest
1
0
Jaguar Lakewood
1
1
Schomp MINI
1
0
Phil Long Valucar
1
0
Audi Denver
1
0
12
BULLETIN | JANUARY 2024
12
Clear the Air Foundation 2023 Total Vehicle Donations
Larry H Miller Nissan 104th
1
1
Phil Long Glenwood Springs Subaru
1
0
Larry H Miller Volkswagen Lakewood
1
1
Valley Nissan
1
1
Peak Kia Colorado Springs
1
1
Glenwood Springs Subaru
1
1
DEALER TOTAL
463
141
Tesla Aurora
85
85
Fort Carson
63
0
Tesla Loveland
25
25
Private Donation
14
0
Tesla Colorado Springs
13
13
Pikes Peak State College
9
0
SRT
4
4
Boulder Hybrids
3
3
Warren Tech
3
0
School of Mines
2
0
Urban Motors-Green
2
2
Nexstar Media Inc.
1
0
NON-DEALER TOTAL
212
130
GRAND TOTAL 2023
675
271
NON-DEALER DONOR
13
Covering Fourth Quarter 2023
Released in January, 2024
Colorado Auto Outlook
Sponsored by:
TM
Coverage of the Colorado new and used vehicle markets
FORECAST
Colorado New Vehicle Market Predicted to Improve by 3.6% in 2024 Below is a list of eight key trends and developments in the Colorado new vehicle market:
1. Replenished inventories and pent-up demand helped the state new vehicle market in 2023. New retail registrations last year increased to 208,861 units, a 7.6% improvement from 2022. The uptick was slightly higher than Auto Outlook’s 5.8% projection at the beginning of the year.
6. Tesla, Buick, Lexus, Mazda, and Audi had the largest percentage gains among the top 20 selling brands last year. Lexus, Volkswagen, BMW, Tesla, and Toyota moved higher from the Third to the Fourth Quarters of ‘23 (see page 4).
7. Based on a comparison to U.S. market share, Subaru, Toyota, Tesla, Ford, and Mazda were the top performing brands in the state market (see page 5).
2. The state market should increase for the second consecutive
8. Tesla Model Y, Ford F-Series, Toyota RAV4, Subaru Crosstrek ,
year in ‘24. Auto Outlook is projecting that registrations this year will exceed 216,000, up 3.6% from ‘23. And there is a good chance that the increase could be higher (see below).
and Ram Pickup were top sellers last year. Tesla Model Y and Kia Sportage posted big gains.
Primary Factors Driving the Colorado New Vehicle Market
3. The shaded box on the right reviews the primary forecast determinants. Pent-up demand is still significant, the state labor market is strong, and consensus is for economic growth to remain positive. Vehicle affordability is still an issue, but should improve as the year progresses. As always there are some risks (geopolitical uncertainties and the presidential election, for example), but if interest rates ease, the market could post a larger increase than expected this year.
4. BEV market share was up last year (12.5% vs 8.1% in 2022) and it also increased from the Third to the Fourth Quarter. Hybrid share reached 10.5% in the Fourth Quarter of ‘23.
5. Honda’s recovery from inventory shortages in ‘22 contributed to the 11.1% increase in Japanese brand registrations in ‘23. Domestic brand registrations were up 6.9% (see below).
» State unemployment rate was near 3% at the end of 2023, total employment increased, and household incomes have moved higher, all positive factors for the new vehicle market. » Rising interest rates and tight vehicle supplies resulting in higher prices put a squeeze on affordability in 2022 and the first half of last year, but the pendulum is swinging back. Interest rates are predicted to ease this year, transaction prices are drifting lower, and income growth has been positive. » Pent up demand is the biggest positive for the state market. Auto Outlook estimates that nearly 80,000 new vehicle purchases have been postponed since the onset of the pandemic and ensuing supply chain issues.
Forecast for State New Retail Light Vehicle Registrations 223,980 194,160
208,861
UP 22.9% vs. ‘20
DOWN 13.3% vs. ‘21
UP 7.6% vs. ‘22
UP 3.6% vs. ‘23
2021 Actual
2022 Actual
2023 Actual
2024 Forecast
BULLETIN | JANUARY 2024
2023 Annual 208,861
% Chg. '22 to '23 7.6%
Mkt. Share 2023
TOTAL
2022 Annual 194,160
Car Light Truck
25,409 168,751
25,503 183,358
0.4% 8.7%
12.2% 87.8%
Domestic European Japanese Korean
74,302 23,314 74,769 21,775
79,418 23,529 83,032 22,882
6.9% 0.9% 11.1% 5.1%
38.0% 11.3% 39.8% 11.0%
216,400
The graph above shows annual new retail light vehicle registrations from 2021 thru 2023 and Auto Outlook’s projection for 2024. Historical data sourced from Experian Automotive.
14
Market Summary
Domestics consist of vehicles sold by GM, Ford, Stellantis (excluding Alfa Romeo and FIAT), Tesla, Rivian, and Lucid. Data sourced from Experian Automotive.
Page 2
Colorado Auto Outlook
KEY TRENDS IN COLORADO NEW VEHICLE MARKET STATE MARKET VS. U.S.
% Change In New Retail Market 2023 vs 2022
Colorado
U.S.
UP 7.6%
UP 7.5%
New retail light vehicle registrations in the state increased by 7.6% from 2022 to 2023, almost identical to the 7.5% improvement in the Nation.
Data sourced from Experian Automotive.
Colorado Quarterly Registrations
Millions
QUARTERLY RESULTS
14.6
15.0
Q1 '22
Q2 '22
Seasonally Adjusted Annual Rate, Converted to Equivalent U.S. New Vehicle Market SAAR (millions of units)
13.4
13.3
Q3 '22
Q4 '22
14.1
Q1 '23
15.3
15.1
15.0
Q2 '23
Q3 '23
Q4 '23
Data sourced from Experian Automotive. SAAR estimates: Auto Outlook.
% Change in quarterly registrations vs. year earlier (4Q ‘23 vs. 4Q ‘22)
UP 13.9%
At Auto Outlook, we strive to provide sound and accurate analyses and forecasts based upon the data available to us. However, our forecasts are derived from thirdparty data and contain a number of assumptions made by Auto Outlook and its management, including, without limitation, the accuracy of the data compiled. As a result, Auto Outlook can make no representation or warranty with respect to the accuracy or completeness of the data we provide or the forecasts or projections that we make based upon such data. Auto Outlook expressly disclaims any such warranties, and undue reliance should not be placed on any such data, forecasts, projections, or predictions. Auto Outlook undertakes no obligation to update or revise any predictions or forecasts, whether as a result of any new data, the occurrence of future events, or otherwise.
% Change in registrations vs. previous quarter (4Q ‘23 vs. 3Q ‘23)
The graph on the left provides an easily recognizable way to gauge the strength of the state market. It shows quarterly registrations based on a seasonally adjusted annual rate. These figures are then indexed to SAAR sales figures for the U.S. new vehicle market. So just like in the national market, when the quarterly SAAR is above 17 million units, the state market is strong, 15 million is about average, and below 13 million is weak. Equivalent SAAR levels in the state edged down from 15.1 million in the Third Quarter of last year to 15.0 million in the Fourth Quarter.
DOWN 2.9%
Colorado Auto Outlook Published by: Auto Outlook, Inc. PO Box 390, Exton, PA 19341 Phone: 610-640-1233 EMail: jfoltz@autooutlook.com Editor: Jeffrey A. Foltz Information quoted must be attributed to Colorado Auto Outlook, published by Auto Outlook, Inc. on behalf of the Colorado Automobile Dealers Association, and must also include the statement: “Data sourced from Experian Automotive.”
15
Covering Fourth Quarter 2023
Page 3
KEY TRENDS IN COLORADO NEW VEHICLE MARKET VEHICLE AND BRAND SEGMENTS - STATE AND U.S.
Market Share by Type of Vehicle 100.0%
100.0%
12.2%
75.0%
Domestic, European, Japanese, & Korean Brand Share
20.2%
25.8%
75.0%
23.3%
50.0%
50.0% 62.0%
25.0% 0.0%
56.5%
State
Light trucks (excl. Small CUVs)
25.0% 0.0%
U.S. Small CUVs
Passenger Cars
Combining the blue and orange sections in the graph above corresponds to the standard industry definition of light trucks. Small crossovers are broken out, however, since many are more similar to compact hatchbacks than to many trucks. Light truck share (excluding small CUVs) was 62.0% last year, above the 56.6% share in the U.S.
11.0%
11.6%
11.3%
10.5%
38.0%
39.8%
39.8%
38.1%
State
U.S.
Japanese
Domestic
European
Korean
Japanese brand market share in the state was higher than U.S. levels: 39.8% vs. 38.1%. State Domestic brand share (which includes Tesla and Rivian) was 38.0% in 2023. European brands accounted for a slightly higher share of the state market last year than in the Nation. Data sourced from Experian Automotive.
Data sourced from Experian Automotive.
COMPARISON OF STATE MARKETS
Percent Change in New Retail Light Vehicle Registrations - 2023 vs. 2022
11.5% 11.2%
10.9%
9.8% 9.6% 9.3%
Observations and Key Facts • Colorado registrations increased 7.6% last year, in line with the average for other markets. The Minnesota market improved by 11.5%.
8.4% 8.1% 7.8% 7.6% 7.6% 7.1% 6.8% 6.7% 6.4% 4.6% 4.1%
2.9%
-2.5%
• BEV market share in Colorado last year was 12.5% vs. 8.2% in the Nation. BEV penetration was highest in California22.6%. • Toyota was the best-selling brand in Colorado in 2023 and was the leader in 13 of the 19 markets.
Data sourced from Experian Automotive.
16
BULLETIN | JANUARY 2024
Page 4
Colorado Auto Outlook
BRANDS AND MODELS WINNERS AND LOSERS The primary metric used to identify winning and losing brands is the annual (or year-to-date) percent change in registrations. Tesla and Buick were the biggest gainers in the state market last year among top 20 brands. BUT this snapshot picture skips over another important piece of evidence that can shed light on brand sales performance - what is the shorter term trend in sales? This matters! Registrations for a brand may have posted a big increase for all of last year (definitely a positive), but if growth stalled as the year progressed, that’s significant.
% Change in State Registrations for Top 20 Brands- 2023 (annual) vs. 2022
Brands Gaining Ground Largest % increases from 3Q '23 to 4Q '23 Lexus Up 26.5% Volkswagen Up 22.0% BMW Up 18.3% Tesla Up 13.5% Toyota Up 8.8%
Tesla, 56.3% Buick, 53.4% Lexus, 34.1% Mazda, 26.0% Audi, 22.9% Kia, 20.8% Toyota, 9.3%
Brands Losing Ground
Honda, 9.0%
Largest % declines from 3Q '23 to 4Q '23 Kia Down -25.8% Jeep Down -17.9% Volvo Down -16.5% Nissan Down -13.3% Mazda Down -9.9%
Nissan, 8.5% Subaru, 6.9% Chevrolet, 5.4% BMW, 5.3% Ford, 5.2% GMC, 0.2% Volvo, -1.4% Mercedes, -7.4%
Largest % increases in ‘23 vs. ‘22: Tesla, Buick, Lexus, Mazda, and Audi.
Volkswagen, -8.5% Hyundai, -10.3%
Largest % increases in 4Q ‘23 vs. 3Q ‘23: Lexus, Volkswagen, BMW, Tesla, and Toyota.
Ram, -15.3% Jeep, -19.1% Data sourced from Experian Automotive.
TOP SELLING BRANDS Colorado and U.S. Market Shares for Top 15 Brands in State - 2023 16.0 14.0
14.7
Red circles show state market share. U.S. market share is represented by the gray bars. Toyota, Ford, Subaru, Chevrolet, and Tesla were the top five selling brands in the state last year. Subaru state share was well above U.S. levels.
12.0 11.1
10.0
U.S.
State
9.3
8.0 6.0 4.0 2.0
6.3
6.2
5.9
5.5
4.7
4.2
3.7
3.7
3.2
3.1
2.8
2.2
0.0
Data sourced from Experian Automotive.
17
Covering Fourth Quarter 2023
Page 5
BRANDS AND MODELS BRAND SALES PERFORMANCE The graph below provides an indicator of brands that are popular in Colorado (relative to the National standard), and those that are not. Here’s how it works: For the top 30 selling brands, each brand’s share of the U.S. market is multiplied by industry retail registrations in the state during 2023. This yields a “target” for the state market. Target registrations are subtracted from actual registrations to derive the measurement of sales performance. Brands at the top of the graph (i.e., Subaru, Toyota, Tesla, Ford, and Mazda) are relatively strong sellers in the state, with actual registrations exceeding calculated targets by large margins. For instance, Subaru registrations exceeded the target by 9,796 units.
Colorado Retail Market Performance based on registrations during 2023 Actual registrations minus target (state industry registrations times U.S. market share) Subaru, 9796
Toyota, 3288 Tesla, 2488 Ford, 2127 Mazda, 1630 Rivian, 1400 Ram, 1356 Volkswagen, 1304 Audi, 1104 Jeep, 451 Kia, 365 Volvo, 327 Land Rover, 99 Porsche, 11
1. Subaru 2. Toyota 3. Tesla 4. Ford 5. Mazda
GMC, -146 Genesis, -199 Infiniti, -216 Lincoln, -232 Lexus, -352 BMW, -357 Mitsubishi, -618 Mercedes, -859 Buick, -860 Dodge, -899 Cadillac, -941 Acura, -962 Hyundai, -1512 Nissan, -2223 Honda, -6869 Chevrolet, -8154
-12,000 Data sourced from Experian Automotive.
-6,000
0
6,000
12,000
Actual registrations minus target (state industry registrations times U.S. market share)
TOP SELLING MODELS Top 20 Selling Models - 2023 Annual Market Share and % Change in Registrations vs. 2022 Rank 1 2 3 4 5 6 7 8 9 10
18
Model Tesla Model Y Ford F-Series Toyota RAV4 Subaru Crosstrek Ram Pickup Toyota Tacoma Chevrolet Silverado GMC Sierra Subaru Outback Honda CR-V
State Share % 4.6 4.2 4.0 2.8 2.8 2.5 2.5 2.4 2.3 2.2
BULLETIN | JANUARY 2024
% chg. '22 to '23 102.6 14.4 15.4 5.5 -15.4 2.6 -4.0 6.8 3.2 18.3
Rank 11 12 13 14 15 16 17 18 19 20
Model Toyota 4Runner Subaru Forester Toyota Tundra Kia Telluride Jeep Wrangler Hyundai Tucson Ford Bronco Mazda CX-5 Kia Sportage Tesla Model 3
State Share % 2.2 1.9 1.4 1.4 1.3 1.3 1.3 1.3 1.2 1.2
% chg. '22 to '23 -3.1 17.6 38.1 11.8 -19.1 -10.5 4.1 8.3 45.7 1.3
Table on the left presents the top 20 selling models in the state during 2023. Share of industry registrations and the percent change versus 2022 is also shown. Models with the five largest percentage increase are shaded blue. Data sourced from Experian Automotive.
Page 6
Colorado Auto Outlook
ALTERNATIVE POWERTRAIN MARKET FIVE BEV share from KEY 1. increased 8.1% in ‘22 to 12.5% in ‘23 TRENDS
2.
BEV share increased by 3.3 points from 3Q ‘23 to 4Q.
3.
Franchised dealer share of BEV market was 42.9% in ‘23, unchanged from ‘22.
Hybrid registrations increased 42% last year. Plug ins were up 56%.
4.
Kia hybrid regis-
5. trations were up 124% last year.
BEV, PHEV, AND HYBRID MARKET SHARE Percent Share of Industry Registrations by Powertrain Type Annual
20.0%
BEV market share was 16.3% in 4Q 2023, up from 13.0% in 3Q.
15.0% 10.0%
2022
2023
Electric (BEV)
8.1%
12.5%
Hybrid
7.2%
9.5%
Plug In Hybrid (PHEV)
2.4%
3.5%
5.0%
Quarterly 0.0%
Q1 Q2 Q3 Q4 Q1 Q2 Q3 Q4 Q1 Q2 Q3 Q4 Q1 Q2 Q3 Q4 Q1 Q2 Q3 Q4 '19 '19 '19 '19 '20 '20 '20 '20 '21 '21 '21 '21 '22 '22 '22 '22 '23 '23 '23 '23 Electric (BEV)
Hybrid
Plug In Hybrid (PHEV)
Data sourced from Experian Automotive. Hybrid registrations exclude mild hybrids.
3Q '23
4Q '23
Electric (BEV)
13.0%
16.3%
Hybrid
9.2%
10.5%
Plug In Hybrid (PHEV)
3.9%
4.1%
FRANCHISED DEALERSHIPS AND DIRECT SELLERS New Hybrid, BEV, and PHEV Registrations in Colorado by Type of Selling Dealership BEV Registrations and Market Share
30000
New vehicle registrations
25000 Franchised Direct
20000 15000 10000 5000 0
2022
2023
Hybrid
2022
2023
2022
BEV
Data sourced from Experian Automotive. Hybrid registrations exclude mild hybrids.
2023 PHEV
Franchised Dealerships 6,783 11,238 65.7%
Direct Sellers 9030 14932 65.4%
2022 market share % 2023 market share % change
42.9 42.9 0.0
57.1 57.1 0.0
3Q '23 registrations 4Q '23 registrations % change
3,145 4,021 27.9%
4,131 4,823 16.8%
3Q '23 market share % 4Q '23 market share % change
43.2 45.5 2.3
56.8 54.5 -2.3
2022 registrations 2023 registrations % change
As depicted on the graph, franchised dealerships accounted for 72% of the combined Hybrid, BEV, and PHEV market. Franchised dealer share of the BEV market increased from 43.2% in 3Q ‘23 to 45.5% in 4Q.
19
Covering Fourth Quarter 2023
Page 7
ALTERNATIVE POWERTRAIN MARKET MAKES AND MODELS Top Five Brands by type of Powertrain 2022 and 2023 Annual Registrations
% Change in Brand BEV Registrations for Top 10 Brands 2023 (annual) vs. 2022 and 4Q ‘23 vs. 3Q ‘23
Rank Brand BMW
250%
31%
Rivian
152%
42%
Audi
88%
51%
Nissan
6%
Hyundai
5%
88% 85%
Chevrolet
70% 65%
Volkswagen
67%
Tesla
P H E V
114%
56%
14%
25% 22%
Ford
B E V
-16% Kia -19%
% change - 2023 vs. 2022
% change - 4Q '23 vs. 3Q '23
Brand Share of Colorado BEV Market (%) 2023 Annual
H Y B R I D
2023 Regs.
% chg.
2023 Share
12,850
56.3%
49.1%
1
Tesla
8,223
2
Rivian
786
1,982 152.2%
7.6%
3
Volkswagen
990
1,654
67.1%
6.3%
4
Ford
1,304
1,636
25.5%
6.3%
5
Hyundai
806
1,493
85.2%
5.7%
1
Jeep
1,233
2,479 101.1%
34.1%
2
Toyota
680
1,645 141.9%
22.6%
3
BMW
752
693
-7.8%
9.5%
4
Volvo
790
555
-29.7%
7.6%
5
Kia
259
401
54.8%
5.5%
1
Toyota
7,330
9,308
27.0%
46.9%
2
Honda
1,457
3,139 115.4%
15.8%
3
Kia
965
2,161 123.9%
10.9%
4
Ford
1,669
1,912
14.6%
9.6%
5
Lexus
1,161
1,811
56.0%
9.1%
49.1%
Market Share for Top 15 Selling BEVs, PHEVs, and Hybrids - 2023 Annual Model
Type
2023 Share
1
Tesla Model Y
BEV
18.0%
2
Toyota RAV4
Hybrid
7.3%
3
Honda CR-V
Hybrid
4.8%
4
Tesla Model 3
BEV
4.6%
5
Volkswagen ID.4
BEV
3.1%
6
Jeep Wrangler
PHEV
2.8%
7
Toyota RAV4
PHEV
2.8%
8
Rivian R1S
BEV
2.5%
9
Kia Sportage
Hybrid
2.2%
Rank
7.6% 6.3% 6.3% 5.7% 5.4%
8.4% 3.3% 3.2% 2.6% 2.2%
Observations
10
Ford F-Series
Hybrid
2.1%
• BMW had the largest % increase in BEV registrations from 2022 to 2023 (up 250%).
11
Hyundai Ioniq 5
BEV
2.1%
• Tesla share of the BEV market was 49.1% in 2023.
12
Toyota Highlander
Hybrid
2.0%
13
Lexus RX
Hybrid
1.9%
14
Jeep Grand Cherokee
PHEV
1.8%
15
Ford Mustang Mach-E
BEV
1.8%
Data sourced from Experian Automotive. Hybrid registrations exclude mild hybrids.
20
2022 Regs.
BULLETIN | JANUARY 2024
Page 8
Colorado Auto Outlook B r a n d R e gi str a ti o n s R e po r t C o l o r a do Ne w R e ta i l C a r a n d L i gh t T r u ck R e gi str a ti o n s Fourth Quarter Registrations Market Share (%) 4Q '22 4Q '23 % change 4Q '22 4Q '23 Change
TOTAL
47,726
54,361
13.9
Cars
6,107
6,262
2.5
12.8
11.5
Light Trucks
41,619
48,099
15.6
87.2
88.5
Domestic Brands
17,571
20,347
15.8
36.8
European Brands
5,936
6,472
9.0
12.4
Japanese Brands
18,971
22,160
16.8
Korean Brands
5,248
5,382
Acura
260
Alfa Romeo
22
Audi
Annual Totals Registrations Market Share (%) 2022 2023 % change 2022 2023 Change 194,160
208,861
7.6
-1.3
25,409
25,503
0.4
13.1
12.2
-0.9
1.3
168,751
183,358
8.7
86.9
87.8
0.9
37.4
0.6
74,302
79,418
6.9
38.3
38.0
-0.3
11.9
-0.5
23,314
23,529
0.9
12.0
11.3
-0.7
39.7
40.8
1.1
74,769
83,032
11.1
38.5
39.8
1.3
2.6
11.0
9.9
-1.1
21,775
22,882
5.1
11.2
11.0
-0.2
245
-5.8
0.5
0.5
0.0
1,061
1,208
13.9
0.5
0.6
0.1
32
45.5
0.0
0.1
0.1
109
107
-1.8
0.1
0.1
0.0
872
1,075
23.3
1.8
2.0
0.2
3,323
4,084
22.9
1.7
2.0
0.3
BMW
1,280
1,313
2.6
2.7
2.4
-0.3
4,444
4,679
5.3
2.3
2.2
-0.1
Buick
281
359
27.8
0.6
0.7
0.1
1,042
1,598
53.4
0.5
0.8
0.3
Cadillac
283
289
2.1
0.6
0.5
-0.1
1,109
1,165
5.0
0.6
0.6
0.0
Chevrolet
3,276
3,285
0.3
6.9
6.0
-0.9
12,505
13,186
5.4
6.4
6.3
-0.1
Chrysler
86
99
15.1
0.2
0.2
0.0
359
454
26.5
0.2
0.2
0.0
Dodge
247
238
-3.6
0.5
0.4
-0.1
1,117
1,000
-10.5
0.6
0.5
-0.1
Ford
5,016
5,356
6.8
10.5
9.9
-0.6
21,942
23,088
5.2
11.3
11.1
-0.2
Genesis
159
199
25.2
0.3
0.4
0.1
637
749
17.6
0.3
0.4
0.1
GMC
2,033
1,920
-5.6
4.3
3.5
-0.8
7,787
7,806
0.2
4.0
3.7
-0.3
Honda
2,341
3,023
29.1
4.9
5.6
0.7
10,589
11,544
9.0
5.5
5.5
0.0 -0.9
Hyundai
2,307
2,394
3.8
4.8
4.4
-0.4
10,955
9,830
-10.3
5.6
4.7
Infiniti
146
153
4.8
0.3
0.3
0.0
570
690
21.1
0.3
0.3
0.0
Jaguar
35
21
-40.0
0.1
0.0
-0.1
153
104
-32.0
0.1
0.0
-0.1
Jeep
2,147
2,021
-5.9
4.5
3.7
-0.8
10,726
8,678
-19.1
5.5
4.2
-1.3
Kia
2,782
2,789
0.3
5.8
5.1
-0.7
10,183
12,303
20.8
5.2
5.9
0.7
Land Rover
259
305
17.8
0.5
0.6
0.1
864
1,182
36.8
0.4
0.6
0.2
Lexus
757
1,318
74.1
1.6
2.4
0.8
3,227
4,327
34.1
1.7
2.1
0.4
Lincoln
273
249
-8.8
0.6
0.5
-0.1
940
954
1.5
0.5
0.5
0.0
Maserati
14
18
28.6
0.0
0.0
0.0
78
86
10.3
0.0
0.0
0.0
Mazda
1,577
1,544
-2.1
3.3
2.8
-0.5
5,371
6,765
26.0
2.8
3.2
0.4
Mercedes
830
885
6.6
1.7
1.6
-0.1
3,803
3,522
-7.4
2.0
1.7
-0.3
MINI
164
178
8.5
0.3
0.3
0.0
604
608
0.7
0.3
0.3
0.0
Mitsubishi
157
146
-7.0
0.3
0.3
0.0
574
638
11.1
0.3
0.3
0.0
Nissan
1,864
1,798
-3.5
3.9
3.3
-0.6
7,187
7,800
8.5
3.7
3.7
0.0
Other
46
81
76.1
0.1
0.1
0.0
169
243
43.8
0.1
0.1
0.0
Polestar
93
32
-65.6
0.2
0.1
-0.1
362
115
-68.2
0.2
0.1
-0.1
275
230
-16.4
0.6
0.4
-0.2
1,002
1,044
4.2
0.5
0.5
0.0
1,491
1,708
14.6
3.1
3.1
0.0
7,744
6,557
-15.3
4.0
3.1
-0.9
Porsche Ram Rivian
259
691
166.8
0.5
1.3
0.8
786
1,982
152.2
0.4
0.9
0.5
Subaru
4,826
5,129
6.3
10.1
9.4
-0.7
18,153
19,412
6.9
9.3
9.3
0.0
Tesla
2,169
4,099
89.0
4.5
7.5
3.0
8,223
12,850
56.3
4.2
6.2
2.0
Toyota
7,043
8,804
25.0
14.8
16.2
1.4
28,037
30,648
9.3
14.4
14.7
0.3
Volkswagen
1,561
1,858
19.0
3.3
3.4
0.1
6,387
5,845
-8.5
3.3
2.8
-0.5
495
477
-3.6
1.0
0.9
-0.1
2,038
2,010
-1.4
1.0
1.0
0.0
Volvo
Data sourced from Experian Automotive.
The table shows new retail light vehicle (car and light truck) registrations in the Colorado market. Figures are shown for the 4th Quarters of ‘22 and ‘23, and annual totals. The top ten ranked brands in each change category are shaded yellow.
21
Covering Fourth Quarter 2023
Page 9
MODEL RANKINGS
Tesla Model Y Was Best-Seller in State Market in 2023 The table below shows the top five selling models in 2023 in 20 segments. In addition to unit registrations, it also shows each model’s market share in its respective segment.
BEST SELLERS IN PRIMARY SEGMENTS Small Cars: Honda Civic
Subcompact SUV: Subaru Crosstrek
Mid Size & Large Cars: Toyota Camry
Compact SUV: Toyota RAV4
Near Luxury Car: Tesla Model 3
2 Row Mid Size SUV: Subaru Outback
Full Size Pickup: Ford F-Series
Luxury Mid Size SUV: Lexus RX
Top Selling Models in Each Segment - New Retail Light Vehicle Registrations (2023) Small Cars Model
Mid Size and Large Cars
Regs. Share
Model
Sports/Pony Cars
Regs. Share
Model
Near Luxury Cars
Regs. Share
Model
Regs. Share
Honda Civic
1383
13.3
Toyota Camry
1473
26.2
Ford Mustang
376
28.5
Tesla Model 3
2455
40.9
Toyota Corolla
1158
11.1
Honda Accord
1035
18.4
Dodge Challenger
346
26.2
BMW 3-Series
327
5.4
Subaru Impreza
1092
10.5
Kia K5
735
13.1
Chevrolet Camaro
198
15.0
Audi A5
294
4.9
Hyundai Elantra
893
8.6
Subaru Legacy
674
12.0
Toyota 86
150
11.4
BMW 4-Series
275
4.6
Chevrolet Bolt
838
8.0
Nissan Altima
455
8.1
Mazda MX5
133
10.1
BMW i4
262
4.4
Luxury and High End Sports Cars Model
Regs. Share
Compact/Mid Size Pickup Model
Full Size Pickup
Regs. Share
Model
Mini Van
Regs. Share
Model
Regs. Share
Chevrolet Corvette
393
18.4
Toyota Tacoma
5267
43.7
Ford F-Series
8709
29.8
Toyota Sienna
736
37.6
Tesla Model S
262
12.3
Ford Maverick
1405
11.7
Ram Pickup
5754
19.7
Kia Carnival
419
21.4
Porsche 911
172
8.1
Chevrolet Colorado
1089
9.0
Chevrolet Silverado
5217
17.8
Honda Odyssey
407
20.8
BMW 5-Series
138
6.5
Nissan Frontier
1012
8.4
GMC Sierra
4991
17.1
Chrysler Pacifica
376
19.2
Mercedes E-Class
104
4.9
Jeep Gladiator
986
8.2
Toyota Tundra
2947
10.1
Chrysler Voyager
16
0.8
Large Van
Subcompact SUV Model
Compact SUV
Regs. Share
Model
2 Row Mid Size SUV
Model
Regs. Share
Regs. Share
Model
Regs. Share
Ford Transit Connect
1147
35.3
Subaru Crosstrek
5921
32.5
Toyota RAV4
8304
19.3
Subaru Outback
4871
27.6
Mercedes Sprinter
944
29.1
Mazda CX-30
1973
10.8
Honda CR-V
4675
10.9
Toyota 4Runner
4641
26.3 12.6
Ram Promaster
803
24.7
Honda HR-V
1327
7.3
Subaru Forester
4032
9.4
Jeep Grand Cherokee
2217
Chevrolet Express
175
5.4
Hyundai Kona
1208
6.6
Jeep Wrangler
2795
6.5
Hyundai Santa Fe
1378
7.8
Ford E-Series
85
2.6
Kia Seltos
1035
5.7
Hyundai Tucson
2768
6.4
Ford Mustang Mach-E
951
5.4
3 Row Mid Size SUV Model
Large SUV
Regs. Share
Model
Luxury Subcompact SUV Regs. Share
Model
Luxury Compact SUV
Regs. Share
Model
Regs. Share
Kia Telluride
2903
15.7
Ford Bronco
2737
36.1
Volvo XC40
506
26.6
Tesla Model Y
9587
57.4
Toyota Highlander
2199
11.9
Chevrolet Tahoe
1056
13.9
Audi Q3
313
16.5
Audi Q5
1454
8.7
Kia Sorento
2084
11.3
Ford Expedition
749
9.9
Audi Q4 E-Tron
306
16.1
Lexus NX
1169
7.0
Subaru Ascent
1687
9.1
Toyota Sequoia
647
8.5
BMW X1
252
13.3
BMW X3
768
4.6
Ford Explorer
1440
7.8
GMC Yukon
632
8.3
Lexus UX
141
7.4
Land Rover Defender
556
3.3
Luxury Mid Size SUV Model
Luxury Large SUV
Regs. Share
Top Selling Passenger Cars
Model
Regs. Share
Model
Top Selling Light Trucks
Regs. Share
Model
Regs. Share
Lexus RX
1886
19.3
Rivian R1S
1319
38.3
Tesla Model 3
2455
9.6
Tesla Model Y
9587
5.2
BMW X5
1299
13.3
Cadillac Escalade
491
14.3
Toyota Camry
1473
5.8
Ford F-Series
8709
4.7
Mercedes GLE-Class
659
6.7
BMW X7
374
10.9
Honda Civic
1383
5.4
Toyota RAV4
8304
4.5
Volvo XC90
581
5.9
Lincoln Navigator
255
7.4
Toyota Corolla
1158
4.5
Subaru Crosstrek
5921
3.2
Tesla Model X
546
5.6
Land Rover Range Rover 225
6.5
Subaru Impreza
1092
4.3
Ram Pickup
5754
3.1
Data sourced from Experian Automotive.
22
BULLETIN | JANUARY 2024
Page 10
Colorado Auto Outlook
REGIONAL MARKETS
Western Slope Region Had Largest Percentage Gain Last Year The graphs and tables on these two pages show specific data on each of the state’s four regional markets. The figures represent new vehicles registered to retail customers residing in each of the regions, and includes both purchase and lease transactions.
Regional New Retail Light Vehicle Registrations 2023 Annual and Percent Change vs. 2022 12.0%
140000 9. 9%
Denver Metro
10.0% 8. 6%
8. 4%
100000
8.0% 6. 7%
80000
Western Slope region was up sharply last year. Denver Metro was the largest market.
60000
6.0%
4.0% 40000
Percent change '23 vs. '22 - blue circles
2023 registrations - grey bars
120000
23.9
Southern Colorado
16.5
Western Slope
13.8
Northern Colorado
13.4
2.0%
20000
0
Luxury Brand Market Share 2023
Denver Metro
Southern Colorado Northern Colorado
Western Slope
0.0% Data sourced from Experian Automotive.
The graph above shows new vehicle registrations in 2023 (grey bars and left axis) and percent change vs. 2022 (blue circles with labels and right axis). Data sourced from Experian Automotive.
R E G I O NA L MA R K E T S R E V I E W I nd us t r y R e g is t r at io ns
B at t e r y E le c t r ic V e h ic le M ar k e t S h ar e ( % )
L uxur y B r and M ar k e t S h ar e ( % )
2022 A nnual
2023 A nnual
% c h ang e '23 vs. '22
2022 A nnual
2023 A nnual
c h ang e '23 vs . '22
2022 A nnual
2023 A nnual
c h ang e '23 vs . '22
Denver Metro
113,340
120,881
6.7%
9.9
15.6
5.7
20.3
23.9
3.6
Northern Colorado
24,822
26,946
8.6%
6.2
9.3
3.1
11.6
13.4
1.8
Southern Colorado
25,705
27,855
8.4%
6.1
9.4
3.3
14.3
16.5
2.2
Western Slope
19,782
21,749
9.9%
5.4
7.4
2.0
12.5
13.8
1.3
Top Regional Markets Biggest Market
Largest % Increase
Highest BEV Share
Denver Metro: 120,881 registrations
Western Slope: Up 9.9%
Denver Metro: 15.6%
Data sourced from Experian Automotive.
23
Covering Fourth Quarter 2023
Page 11
COUNTY MARKETS
BEV Market Share Exceeded 15% in Denver Metro Region Brand Market Share - 2023 Annual (for top 10 selling brands in Colorado market) C o unt y
T oyota
Fo rd
S ub ar u
T e s la
K ia
C h e v r o le t
H o nd a
H y und ai
Jeep
N is s an
Denver Metro
14.5
8.9
9.3
7.7
5.8
5.1
5.7
4.7
3.9
3.8
Northern Colorado
14.0
13.0
9.1
4.3
7.4
6.8
5.2
4.7
4.3
4.5
Southern Colorado
13.2
11.3
9.5
5.5
7.1
6.4
7.4
7.1
4.2
3.7
Western Slope
18.6
16.7
10.4
2.9
3.7
9.0
3.6
2.1
4.8
2.7
The table above shows brand market shares in each of the four regional markets. (Includes top ten selling brands in the area.) Highest market share for each brand is shaded grey. Data sourced from Experian Automotive.
Regional Market Shares for Japanese, Domestic, European, and Korean Brands - 2023 Japanese Brands
Denver Metro
Domestic Brands
41.0
Northern Colorado
36.9
Southern Colorado
39.8
Western Slope
37.2 0.0
30.0
European Brands
42.4
37.0
Denver Metro
8.1
12.6
Northern Colorado
8.2
14.9
Southern Colorado
10.1
46.6 0.0
11.4
13.2
34.4
60.0
Korean Brands
30.0
60.0
0.0
Western Slope
6.1
30.0
60.0
0.0
30.0
60.0
The graphs above show market shares by brand segments. Darker colors show the highest rated region for each segment. Data sourced from Experian Automotive.
BEV Market Share in Regions - 2022 and 2023 18.0
BEV share increased in all four regions and was highest in Denver Metro during 2023 (15.6%).
15.6
16.0 14.0 12.0 10.0
9.9
8.0
9.4
9.3 6.2
6.0
6.1
7.4 5.4
4.0 2.0 0.0
Denver Metro
Northern Colorado 2022
24
BULLETIN | JANUARY 2024
Southern Colorado 2023
Western Slope
Page 12
Colorado Auto Outlook
COLORADO USED VEHICLE MARKET
Used Vehicle Market Declined by Less Than 2% in 2023 Percent Change in New and Used Vehicle Registrations 2023 V. 2022
THREE KEY TRENDS IN USED VEHICLE MARKET
10.0% 7.6%
5.0%
01.
The Colorado used vehicle market fell by 1.5% from 2022 to 2023. The new vehicle market improved by 7.6% during the same period.
02.
State used light vehicle market is expected to be flat in 2024 as tight supplies continue to hold back sales.
03.
As shown on the graph, the 4 to 6 year old market declined 5.3% last year. Registrations of 7 to 10 year old vehicles were up by less than 1% and the 3 year old or newer market was up 1.7%.
1.7% 0.5% 0.0% -1.5% -5.0% -5.3%
-10.0%
New vehicles
All used vehicles 3 year old or newer used vehicles
4 to 6 year old used vehicles
7 to 10 year old used vehicles
Data sourced from Experian Automotive.
USED VEHICLE BRAND REGISTRATIONS
Ford and Toyota Are Top Sellers in Colorado Used Vehicle Market The graph below shows used light vehicle registrations by brand for two age categories: vehicles newer than four years old, and vehicles five to eight years old. Brands are positioned from left to right based on total market share. The table below shows the percent change in used registrations from 2022 to 2023 for the top 15 selling brands. Data sourced from Experian Automotive.
Brand Market Share for Top 15 Selling Brands, by Vehicle Age (2023) 16.0%
14.0% 12.0% 10.0% 8.0% 6.0% 4.0% 2.0%
0.0%
Ford was the best-selling brand among 5 to 8 year old vehicles.
4 yrs. old or newer 5 to 8 yrs. old
% Change in Registrations 2023 vs. 2022 8 yr. old or newer vehicles B r and
% c h ang e
Mazda Toyota
11.8% 5.7%
Audi
4.1%
Kia
3.4%
Honda
1.5%
Subaru
-0.1%
BMW
-1.7%
Hyundai
-1.8%
GMC
-2.9%
Volkswagen
-3.4%
Nissan
-4.1%
Ford
-4.7%
Chevrolet
-6.6%
Ram
-8.6%
Jeep
-9.3%
25
SAVE THE DATE
APRIL 4-7, 2024 26
BULLETIN | JANUARY 2024
The State of Colorado’s Vehicle Exchange Colorado (VXC) program continues to accept automobile dealer registrations on a rolling basis. The VXC program helps income-qualified Coloradans recycle and replace their old or high-emitting vehicles with electric vehicles (EVs) by providing approved applicants with a discount on the upfront cost of an EV purchased or leased at an authorized automobile dealer. Please visit the VXC website to learn more about the program (see the “Participating Automobile Dealers” section). If you are interested in preregistering your automobile dealer for this program, you may do so at this link. Following completion of your preregistration, a VXC program representative will contact you regarding next steps.