Contents CEO’s Statement of Financial Sustainability ......................................................................................................................................................................... 2 The Naracoorte Lucindale Story............................................................................................................................................................................................ 4 Strategic Plan & Context ....................................................................................................................................................................................................... 5 Legislative Requirements ...................................................................................................................................................................................................... 6 Key Assumptions .................................................................................................................................................................................................................. 6 REVENUE...................................................................................................................................................................................................................... 6 EXPENDITURE.............................................................................................................................................................................................................. 7 ASSETS......................................................................................................................................................................................................................... 7 LIABILITIES ................................................................................................................................................................................................................... 7 DISPOSAL AND REVALUATION OF ASSETS .............................................................................................................................................................. 8 EXCLUDED PROJECTS ................................................................................................................................................................................................ 8 Financial Strategy ................................................................................................................................................................................................................. 8 Operating Surplus Ratio ..................................................................................................................................................................................................... 9 Net Financial Liabilities Ratio ........................................................................................................................................................................................... 10 Asset Renewal Funding Ratio (as a % of depreciation) .................................................................................................................................................... 11 Summary of Financial Performance & Position Statement .................................................................................................................................................. 13 Conclusion .......................................................................................................................................................................................................................... 13
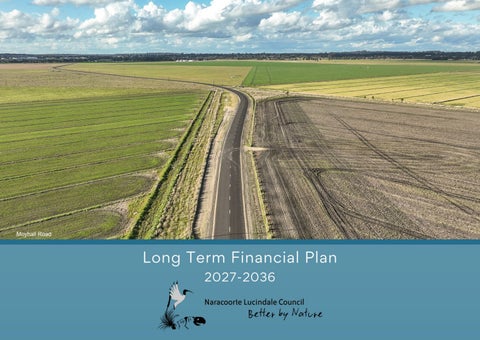
Naracoorte Lucindale Council Long Term Financial Plan 2027 – 2036
2
CEO’s Statement of Financial Sustainability Naracoorte Lucindale Council was one of 19 councils to take part in the final round of the Local Government Advice Scheme established through reforms to the Local Government Act 1999. This Scheme saw the Essential Services Commission SA (ESCOSA) deliver independent, risk-based advice to all of the State’s 68 councils, with the aim of assisting councils when making long-term financial and investment decisions for the benefit of ratepayers. ESCOSA provided its advice to Council in February 2026 - and this confirmed that Council’s historical, current and projected financial performance is mostly sustainable due to Council’s historical and forecast operating surpluses over the long-term. ESCOSA acknowledged Council was – like many regional councils – challenged by a relatively small rateable property base, cost pressures and managing infrastructure over a large geographic area. ESCOSA highlighted three risks impacting Council’s sustainability: 1. Not annually applying indexation to its asset base, potentially resulting in an understatement of depreciation charges and funding requirements for asset renewals. 2. History of not fully funding asset renewals in line with the requirements of its Infrastructure Asset Management Plans. 3. Not achieving the planned reversal in operating deficits over the short to medium term as noted in its October 2025 Long-Term Financial Plan. Indexation has been applied in this plan and more work will take place in the coming year to verify and update asset expenditure forecasts. Largely due to valuations undertaken on bridges and stormwater assets in 2026, along with indexation being applied to the asset base, there is a reduction in previously forecast operating surpluses in the middle years of the plan. Total depreciation expenses over the 10 years from 2026/27 to 2035/36 have increased from a forecast of approximately $93.5M in the last adopted LTFP, to $111M in this plan. Administration will continue to look for operating savings and work with Council to review projects over the life of the plan. Council is committed to ensuring the financial sustainability of our operations, while continuing to meet our strategic objectives and the needs of our community. It is anticipated Council will perform, on average, in line with our key financial indicator targets: • Operating Surplus Ratio – between 0% and 10% • Asset Renewal Funding Ratio (as a percentage of AMPs) – between 80% and 120% While the Net Financial Liabilities Ratio (NFLR) target sits between 0% and 100%, a lower than 0% NFLR is forecast over the life of the plan. Council’s cash balance increases significantly in the second half of this LTFP. These key financial indicators – which are explained more fully in this document – are used to assess our overall financial sustainability. Based on the assumptions listed in this LTFP, Council will experience an operating surplus in every year of the plan. However, this will be relatively small sitting below 2% for the first five years, with ongoing improvement to that position across the 10 years. Naracoorte Lucindale Council Long Term Financial Plan 2027 – 2036
2
Modest rate increases of 4% are forecast for the life of the plan. However, a strong operating position in later years of the plan means that, in the longer term, there may be opportunities to increase capital renewal or service levels without significant impact on our ratepayers, or to limit the rate increases. The Asset Renewal Funding Ratio, as a percentage of Council’s Infrastructure Asset Management Plan, remains within target for the 10 years, showing the LTFP is aligned with the forward works program. It is assumed proposed new projects will not proceed unless they are supported through external funding and ratepayer feedback. While Council will maintain financial sustainability, ongoing review of services and community projects will be undertaken, including analysis of appropriate levels of cash for Council to hold in reserve.
Kelly Westell Chief Executive Officer
Naracoorte Lucindale Council Long Term Financial Plan 2027 – 2036
3
The Naracoorte Lucindale Story Our region is home to almost 8,700 people (2021 Census) and the population is forecast to grow as people move to the region and families grow. Located in the heart of the Limestone Coast Region, Naracoorte Lucindale Council is the natural service and business hub for many communities in both South Australia and Western Victoria. Located 330km from Adelaide and 440km from Melbourne we are blessed with natural attractions, prime agricultural land, reliable rainfall, accessible underground water, a diverse and strong community and a vibrant rural economy, including the wine growing region of Wrattonbully and the neighbouring wine regions of the Coonawarra and Padthaway. The Naracoorte Lucindale Council district covers 4,500 square kilometres with 70% of the land being primary production; a significant economic contributor to the Limestone Coast, with livestock, horticulture, cropping and viticulture all important to the Council area. Naracoorte is our largest town, offering residents and visitors a range of accommodation, dining, sporting and recreational, business, retail and service options. The tight-knit community of Lucindale is the second largest township and is located 40km west of Naracoorte, halfway to the Limestone Coast coastline. Our other smaller communities of Hynam, Frances and Kybybolite contribute to our rich fabric and heritage, and offer something individual, special and unique. The climate in Naracoorte makes it the perfect destination all year round. The spectacular Naracoorte Caves National Park - SA’s only World Heritage listed site - and the free Naracoorte Swimming Lake are key attractions. Our established and extensive trail network provides quality opportunities for outdoor enthusiasts to either walk or cycle and a chance for visitors to see the abundant local wildlife. Dotted around the region are lakes and camping opportunities to enjoy, and fabulous hospitality experiences abound to sample local food and wines.
Naracoorte Lucindale Council Long Term Financial Plan 2027 – 2036
4
Strategic Plan & Context The purpose of Council’s Long Term Financial Plan (LTFP) is to guide the future strategies and actions of the Council to ensure that Council achieves its Strategic Directions in a financially sustainable manner. In June 2023, Council endorsed a new Strategic Plan. The development of the plan provided an opportunity to reflect on our strengths and community aspirations, reassess strategic directions over the next 10 years, and develop actions and deliverables for the community over the next 5 years. Our Strategic Directions for 2023-2033 are; 1. Plan for and manage growth 2. Embrace our cultural Diversity 3. Grow the visitor economy and our regional service hub 4. Preserve our natural environment and enhance our built assets 5. Invest in key infrastructure and assets 6. Activate our recreation, events, arts and cultural opportunities Due to the nature of Local Government and the high level of long-lived assets for which Council is responsible, Council’s Infrastructure & Asset Management Plan (IAMP) – comprising a number of asset management plans for different asset classes and sites – is integral to the development of a robust LTFP. Council’s IAMP aims to forecast infrastructure consumption and renewal needs, as well as considering new infrastructure to meet the future service needs and desires of our community.
Naracoorte Lucindale Council Long Term Financial Plan 2027 – 2036
5
Legislative Requirements The Local Government Act 1999, prescribes a number of requirements in relation to LTFPs. Section 122 (1a) (a) states that a Council must adopt an LTFP for a period of at least 10 years. Section 122 (1b) states that the financial projections in an LTFP adopted by Council must be consistent with those in the IAMP adopted by the Council. Council reviews these plans together annually to ensure data is up to date and consistent. Section 122(4) (a) requires Council to undertake a review of its LTFP as soon as practicable after adopting the Council’s Annual Business Plan for a particular year. Council generally adopts its Annual Business Plan in June. Section 122(4) (b) states that, in any event, Council must undertake a comprehensive review of its strategic management plans (which includes the LTFP) within two (2) years after each general election of the Council. The Local Government (Financial Management) Regulations 2011 Part 2, Section 5 provides further detail in relation to required content of an LTFP.
Key Assumptions The following assumptions have been used as the basis for preparing the Long Term Financial Plan: Based on best estimates, it has been assumed that the movement in Consumer Price Index (CPI) as at 30 June (which incorporates data from the preceding 12 months from 1 July) is forecast at 3.3% for the second year and 3.0% for the remaining term of the plan. A modest growth factor is assumed. Priority is given to funding the maintenance or renewal of existing assets. Priority is given to undertaking works that reduce future maintenance costs of Council and/or significantly extend useful life of existing assets. Funding opportunities will continue to be investigated, and grant revenue targeted in a strategic manner.
REVENUE
Rate Income – increases at 5.0% for the first year and 4.0% for the remaining term of the plan. Service Charge Income, Statutory Charges, User Charges, Reimbursements and Other Income – increases forecasted at 3.3% for the second year and 3.0% for the remaining term of the plan. Investment Income - has been calculated at an assumed rate of 4.50% per annum for the term of the plan. Grants Commission Allocation – movement in CPI forecast at 3.3% annually for the second year and 3.0% for the remaining term of the plan. Roads to Recovery Allocation – a five-year allocation, which commenced in 2024-25 and through to EOFY 2028-29, with payments received each year for the term. It is assumed that the prevailing allocations will be increased by CPI for the remainder of the plan. Additional Grants (including amounts specifically for new or upgraded assets) – grant funding will be pursued across the term of the plan.
Naracoorte Lucindale Council Long Term Financial Plan 2027 – 2036
6
EXPENDITURE
It has been assumed that staff levels will remain relatively constant, therefore employee costs will increase by 3.0% per annum. This reflects employment contracts, reclassifications and movement through the applicable salary/wage increments as per Enterprise Agreements. Contracts, materials and other – movement in CPI forecast at 3.3% for the second year and 3.0% for the remaining term of the plan. Finance Charges – Council’s current loan borrowings are all fixed for both term and interest rate, so this includes actual interest payable. Depreciation – Annual Depreciation has been indexed by CPI for the life of plan.
ASSETS
Current Trade & Other Receivables and Inventories – it has been assumed that these will remain constant. Community Loans – it has been assumed that no new community loans will be granted for the term of the Plan. Majority of Community Loans are repaid to Council by 2028/2029. Renewal of Assets – forecasts of expenditure have been based on the IAMP (expressed in $’000). 26-27
27-28
28-29
29-30
30-31
31-32
32-33
33-34
34-35
35-36
TOTAL
7,663
11,890
8,509
8,545
8,802
7,187
5,535
5,871
13,179
5,893
83,074
New & Upgraded Assets – minimal expenditure on new or upgraded assets is planned in the latter years of the plan (expressed in $’000). 26-27
27-28
28-29
29-30
30-31
31-32
32-33
33-34
34-35
35-36
TOTAL
2,934
4,358
2,704
1,928
2,163
2,612
1,159
1,000
3,086
2,603
24,547
LIABILITIES
Trade & Other Payables – it has been assumed that these figures will remain constant. Liabilities in relation to the Harry Tregoweth Retirement Village are included in Trade & Other Payables. It has been assumed that the units will be maintained at 100% occupancy for the term of this Plan. There are two (2) new borrowings proposed in the latter part of the plan, specifically for the Naracoorte Regional Livestock Exchange. One of the three (3) existing loans is due to be finalised in the 2027-28 financial year. It has been assumed that LSL Provision will reduce, due to greater diligence being placed on the management of leave.
Naracoorte Lucindale Council Long Term Financial Plan 2027 – 2036
7
DISPOSAL AND REVALUATION OF ASSETS
Council’s AMP and LTFP will be updated as assets are revalued over the term of this plan, as per Council’s Accounting for Infrastructure, Property, Plant & Equipment Policy. While the financial impact of future revaluations is unknown, this plan incorporates indexation on assets to minimise any future shocks. Proceeds from Sale of Assets has been included in the plan however no allowances have been made for the profit/loss on disposal of such assets.
EXCLUDED PROJECTS
There are a number of potential projects Council discusses in general terms from time to time. These projects have not been taken into consideration. The impact on the LTFP would need to be considered following preparation of costings and direction by Council.
Financial Strategy The following strategy is essential for Council’s future financial sustainability: Continued review and improvement of the Infrastructure & Asset Management Plan and supporting documentation, including reviews of asset conditions, service levels, hierarchies and master plans. Forging strong links between projected asset spend and the Long Term Financial Plan. Loan borrowings to be used as appropriate to achieve strategic targets, where detailed analysis of cost/benefit has been undertaken. Requests for expansion of asset base to be fully assessed for “whole of life” cost and benefit prior to any commitment. Grant revenue to be targeted in a strategic manner. This means that grant revenue will not be accessed where the benefits are not clear and there is potential to delay Council objectives. Projects that are unsuccessful in achieving grant funding will be subject to further consideration and potentially delayed until funding is achieved or considered for borrowing (if appropriate).
Naracoorte Lucindale Council Long Term Financial Plan 2027 – 2036
8
Operating Surplus Ratio Operating surplus is the difference between day-to-day income and expenditure. The ratio is calculated by dividing the operating result by the operating income.
Operating Surplus Ratio 12% 10%
Ratio
8% LTFP Projected Max Target
6%
Min Target
4% 2% 0%
2027
2028
2029
2030
2031
2032
2033
2034
2035
2036
Plan Year Target To achieve an operating surplus ratio of between 0% and 10% over any five-year period. The graph indicates that Council will be operating within its target range. However, this position can be easily influenced by movements in Council’s operating income and expenditure, forecasted CPI and/or adjustments to depreciation and grant income.
Naracoorte Lucindale Council Long Term Financial Plan 2027 – 2036
9
Net Financial Liabilities Ratio Net Financial Liabilities are defined as total liabilities, less financial assets. The ratio is calculated by dividing the net financial liabilities by operating income.
Net Financial Liabilities Ratio 150% 100% 50%
Ratio
0%
2027
2028
2029
2030
2031
2032
2033
2034
2035
2036
LTFP Projected Max Target Min Target
-50%
-100% -150%
Plan Year Target Net financial liabilities ratio is greater than zero but less than 100% of total operating revenue. As minimal borrowings have been considered over the life of the LTFP, forecasted capital expenditure over the life of the plan significantly outweighs forecasted income streams. This ultimately results in Council maintaining a strong cash balance throughout the life of the plan. Council has two existing loans for NRLE, with one to be finalised by 30 June 2028 and the remaining loan for the D-Yards roof and pens to be reviewed upon maturity of its 5-year fixed period (2027-2028). Borrowings have been forecasted to occur in the final two years of the plan for new infrastructure located at the NRLE, but this will only occur if grant funding is made available for the remaining balance of the project cost.
Naracoorte Lucindale Council Long Term Financial Plan 2027 – 2036
10
Asset Renewal Funding Ratio (as a % of depreciation) This ratio indicates the extent to which existing infrastructure assets are being renewed and replaced compared with depreciation expense in the asset management plan. It focuses on maintaining service levels and preventing asset obsolescence rather than funding new or additional assets.
Asset Renewal Funding Ratio (Asset Renewal as a % of Depreciation) 140% 120% 100%
Ratio
LTFP Projected
80%
Max Target Min Taget
60% 40% 20% 0%
2027
2028
2029
2030
2031
2032
Plan Year
2033
2034
2035
2036
Target Capital outlays on renewing/replacing assets are greater than 80% but less than 120% of depreciation expenditure. While the renewal ratio for the early years of the plan remains within Council’s target range, underspending on renewal and replacement over the medium to long term is likely to adversely impact on achievement of service levels. However, this ratio should be assessed over the life of the plan as there are peaks and troughs and many of Council’s asset have long useful lives. Desired service levels of the community also significantly impact the Asset Renewal Funding Ratio. Naracoorte Lucindale Council Long Term Financial Plan 2027 – 2036
11
Asset Renewal Funding Ratio (as a % of AMP) This ratio indicates the extent to which existing infrastructure assets are being renewed and replaced compared with the asset renewal and replacement expenditure identified as required in Council’s Infrastructure Asset Management Plan.
Asset Renewal Funding Ratio (Asset Renewal as a % of AMP)
140% 120% 100%
LTFP Projected Max Target Min Target
Ratio
80% 60% 40% 20% 0%
2027
2028
2029
2030
2031
2032
Plan Year
2033
2034
2035
2036
Target Capital outlays on renewing/replacing assets net of proceeds from sale of replaced assets is greater than 80% but less than 120% of planned expenditure according to the Summary Infrastructure & Asset Management Plan. If capital expenditure on renewing or replacing existing assets is at a level consistent with that proposed in soundly prepared IAMPs (ie that is based on long-run affordable service levels) then it is likely that a Council is reasonably optimising timing of asset renewal activity. The LTFP target for the Asset Renewal Funding Ratio, is between 80% and 120%. Naracoorte Lucindale Council Long Term Financial Plan 2027 – 2036
12
Summary of Financial Performance & Position Statement The Summary of Financial Performance & Position Statement (SFPPS) shows Council’s financial outlook at a strategic level. The data included in this report is used to calculate the ratios in the previous sections. The operating surplus/(deficit) is considered the most critical indicator of a Council’s financial performance and the achievement of this target (0% 10%) ensures that each generation ‘pays their way’, rather than any generation ‘living off their assets’ and leaving it to future generations to address the issue of repairing worn out infrastructure. The result of the SFPPS is the movement in Net Financial Liabilities (Net Lending/Borrowing) for the year based on planned capital and operating budgets for that year. Achieving a zero result on the net lending/(borrowing) measure in any one year essentially means that the Council has met all its expenditure (both operating and capital) from the current year’s income (with income including amounts received specifically for new/upgraded assets).
Conclusion Council is the custodian of infrastructure and assets, with a replacement cost of $393 million as at 30 June 2026 (net worth of assets $279.3 million) Sound asset management is the key to financial sustainability. The LTFP, as presented in the following appendices, indicates that Council will have an operating surplus for most years of the LTFP. Based on advice from ESCOSA’s Review conducted in 2025, indexing of depreciation has been incorporated into the plan. The effect of this is a sliding operating surplus in the first two years of the plan, a small operating deficit forecasted for years 3 and 4 and returning to an operating surplus for the remainder of the plan. The continued trajectory of the operating surplus is a positive step for Council, providing the opportunity to review rate revenue increases in the latter years to the benefit of the ratepayer (i.e. reduce the rate revenue increase) or the inclusion of other projects, or increased service levels, could be considered. As the LTFP is reviewed annually, the financial implications may change based on continued maturity of Asset Management Plans.
Naracoorte Lucindale Council Long Term Financial Plan 2027 – 2036
13
Statement of Comprehensive Income Year Ending 30 June:
Operating Revenue Rates Charges User Charges Investment Income Operational Grants Reimbursements Other Total Operating Revenue Operating Expenses Employee Costs Contracts, Materials and Other Depreciation Finance Charges Other Total Operating Expenses Operating Surplus / (Deficit) Physical Resources Free of Charge Amounts specifically for new or upgraded assets Asset disposal Net Surplus / (Deficit) Other Comprehensive Income Total Comprehensive Income
2027 Endorsed Budget $'000
2028 Year 2 Plan $'000
2029 Year 3 Plan $'000
2030 Year 4 Plan $'000
2031 Year 5 Plan $'000
2032 Year 6 Plan $'000
2033 Year 7 Plan $'000
2034 Year 8 Plan $'000
2035 Year 9 Plan $'000
2036 Year 10 Plan $'000
15,736 308 2,613 438 4,778 173 128 24,173
16,365 318 2,699 593 4,935 178 133 25,222
17,020 327 2,780 478 5,083 184 137 26,009
17,701 337 2,864 484 5,236 189 141 26,951
18,409 347 2,950 593 5,393 195 145 28,032
19,145 358 3,038 706 5,555 201 149 29,152
19,911 368 3,129 882 5,721 207 154 30,373
20,707 379 3,223 1,200 5,893 213 158 31,774
21,536 391 3,320 1,554 6,070 219 163 33,252
22,397 403 3,420 1,742 6,252 226 168 34,607
6,929 7,805 9,015 103
7,136 7,908 9,699 110
7,350 8,145 10,138 101
7,571 8,389 10,534 94
7,798 8,641 10,918 87
8,032 8,900 11,325 79
8,273 9,167 11,749 71
8,521 9,442 12,141 63
8,777 9,725 12,539 54
9,040 10,017 13,015 85
23,851 323
24,853 369
25,735 274
26,588 363
27,444 587
28,336 816
29,260 1,112
30,167 1,607
31,095 2,158
32,157 2,449
0
0
0
0
0
0
0
0
0
0
1,199
3,390
1,295
1,776
1,823
1,163
564
596
5,000
1,271
1,522
3,759
1,569
2,139
2,410
1,978
1,676
2,203
7,158
3,720
1,522
3,759
1,569
2,139
2,410
1,978
1,676
2,203
7,158
3,720
Statement of Financial Position As at 30 June:
2027 Endorsed Budget $'000
2028
2029
2030
2031
Year 2 Plan $'000
Year 3 Plan $'000
Year 4 Plan $'000
2032
Year 5 Plan Year 6 Plan $'000 $'000
2033
2034
2035
2036
Year 7 Plan $'000
Year 8 Plan $'000
Year 9 Plan $'000
Year 10 Plan $'000
ASSETS Current Assets Cash and Cash Equivalents Current Trade & Other Receivables Community Loans Inventories Total Current Assets
12,098 954 9 625 13,686
9,389 985 43 646 11,062
10,158 1,015 3 665 11,840
12,469 1,045 3 685 14,202
14,918 1,077 3 705 16,703
18,709 1,109 3 727 20,548
25,749 1,142 4 748 27,643
33,470 1,177 4 771 35,421
37,484 1,212 4 794 39,494
46,303 1,248 0 818 48,369
Non-current Assets Community Loans Infrastructure, Property, Plant & Equipment WIP Not Capitalised Total Current Assets
82 274,648 1,060 275,790
39 280,826 1,095 281,960
36 281,464 1,128 282,628
33 281,085 1,161 282,279
30 280,834 1,196 282,060
27 278,803 1,232 280,062
23 273,216 1,269 274,508
20 267,467 1,307 268,793
16 271,007 1,346 272,369
0 266,307 1,387 267,693
289,476
293,023
294,468
296,482
298,763
300,610
302,151
304,214
311,863
316,062
1,781 0 207
1,840 0 119
1,895 0 125
1,952 0 133
2,010 0 140
2,071 0 148
2,133 0 157
2,197 0 166
2,263 0 202
2,331 0 240
846
804
763
725
689
655
622
591
561
533
2,834
2,762
2,784
2,810
2,840
2,874
2,911
2,953
3,025
3,104
0 1,784
0 1,665
0 1,540
0 1,407
0 1,267
0 1,119
0 962
0 796
0 1,230
0 1,644
423 0 2,207
401
381
362
344
327
311
295
280
266
2,067
1,921
1,770
1,611
1,446
1,272
1,091
1,510
1,910
5,041 284,435
4,829 288,194
4,705 289,763
4,579 291,903
4,451 294,312
4,319 296,291
4,184 297,967
4,044 300,170
4,535 307,328
5,014 311,048
Total Assets
LIABILITIES Current Liabilities Trade & Other Payables Bank Overdraft Borrowings Lease Liability Leave Provisions Landfill Rehabilitation Liabilities
Non-current Liabilities Trade & Other Payables Loan Borrowings New Borrowings Lease Liability Leave Provisions Landfill Liability
Total Liabilities Net Assets EQUITY
As at 30 June:
Accumulated Surplus Asset Revaluation Reserves Other Reserves Adjustment to Cash & Borrowings for effects of inflation
Total Equity
2027 Endorsed Budget $'000
2028
2029
2030
2031
2032
Year 2 Plan $'000
Year 3 Plan $'000
Year 4 Plan $'000
58,555 224,473 1,407
62,314 224,473 1,407
63,883 224,473 1,407
66,023 224,473 1,407
68,432 224,473 1,407
70,411 224,473 1,407
72,087 224,473 1,407
74,290 224,473 1,407
81,448 224,473 1,407
85,168 224,473 1,407
284,435
288,194
289,763
291,903
294,312
296,291
297,967
300,170
307,328
311,048
Year 5 Plan Year 6 Plan $'000 $'000
2033
2034
2035
2036
Year 7 Plan $'000
Year 8 Plan $'000
Year 9 Plan $'000
Year 10 Plan $'000
NARACOORTE LUCINDALE COUNCIL STATEMENT OF CASH FLOWS FOR THE 10 YEAR PERIOD ENDED 30 JUNE
CASH FLOWS FROM OPERATING ACTIVITIES Receipts All Rates Statutory Charges User Charges & Commercial Income Investment Income Grants, Subsidies & Contributions Reimbursements Other Income Net GST Movement Payments Employee costs Materials, contracts & other expenses Finance costs Net GST Movement (capital budget review) Movement in Cash Receivables Movement in Cash Payables Movement in Inventory Movement in Provisions (Leave) Cash flow rounding NET CASH PROVIDED BY OPERATING ACTIVITIES CASH FLOWS FROM INVESTMENT ACTIVITIES Receipts Amounts for New or Upgraded Assets Amounts for New or Upgraded Assets (NRLE)
$ Inflows (Outflows) 2027
$ Inflows (Outflows) 2028
$ Inflows (Outflows) 2029
$ Inflows (Outflows) 2030
$ Inflows (Outflows) 2031
$ Inflows (Outflows) 2032
$ Inflows (Outflows) 2033
$ Inflows (Outflows) 2034
$ Inflows (Outflows) 2035
$ Inflows (Outflows) 2036
Endorsed Budget
Year 2 Plan
Year 3 Plan
Year 4 Plan
Year 5 Plan
Year 6 Plan
Year 7 Plan
Year 8 Plan
Year 9 Plan
Year 10 Plan
15736 308 2875 438 4778 190 141 1535
16365 318 2969 593 4935 196 146 2081
17020 327 3059 478 5083 202 150 1585
17701 337 3150 484 5236 208 155 1538
18409 347 3245 593 5393 214 159 1605
19145 358 3342 706 5555 221 164 1484
19911 368 3442 882 5721 227 169 1188
20707 379 3546 1200 5893 234 174 1228
21536 391 3652 1554 6070 241 179 2214
22397 403 3762 1742 6252 249 185 1454
-6929 -9631 -103 0
-7136 -10290 -110 0
-7350 -10040 -101 0
-7571 -10247 -94 0
-7798 -10575 -87 0
-8032 -10723 -79 0
-8273 -10704 -71 0
-8521 -11029 -63 0
-8777 -12310 -54 0
-9040 -11853 -85 0
0
-31
-30
-30
-31
-32
-33
-34
-35
-36
0
59
55
57
59
60
62
64
66
68
0
-21
-19
-20
-21
-21
-22
-22
-23
-24
62
-63
-60
-57
-54
-52
-49
-47
-44
-42
9,400
10,011
10,359
10,846
11,458
12,095
12,819
13,709
14,659
15,430
1,199 -
3,390 -
1,295 -
1,776 -
1,823 -
1,163 -
564 -
596 -
4,365 635
616 654
Contributions Proceeds - Sale of Replaced Assets Proceeds - Sale of Surplus Assets Proceeds - Sale of Real Estate Developments Proceeds - Community Loans
137 -
336 -
404 -
285 -
263 -
470 -
495 -
440 -
147 -
157 -
9
9
43
3
3
3
3
4
4
4
(7,663) (2,934)
(11,890) (4,358)
(8,509) (2,704)
(8,545) (1,928)
(8,802) (2,163)
(7,187) (2,612)
(5,535) (1,159)
(5,871) (1,000)
(13,179) (3,086)
(5,893) (2,603)
(9,251)
(12,513)
(9,471)
(8,409)
(8,876)
(8,164)
(5,631)
(5,831)
(11,114)
(7,065)
620
-
-
-
-
-
-
-
635
654
(262)
(207)
(119)
(125)
(133)
(140)
(148)
(157)
(166)
(202)
NET CASH USED IN FINANCING ACTIVITIES
357
(207)
(119)
(125)
(133)
(140)
(148)
(157)
469
453
NET INCREASE/(DECREASE) IN CASH HELD
506
(2,709)
769
2,312
2,449
3,791
7,039
7,721
4,014
8,818
CASH AT THE BEGINNING OF REPORTING PERIOD
11,592
12,098
9,389
10,158
12,469
14,918
18,709
25,749
33,470
37,484
CASH AT END OF REPORTING PERIOD
12,098
9,389
10,158
12,469
14,918
18,709
25,749
33,470
37,484
46,303
Payments Expenditure on renewal/replacement of assets - WIP (renewal) Expenditure on renewal/replacement of assets - WIP (new) Expenditure on renewal/replacement of assets Expenditure on new Assets NET CASH USED IN INVESTMENT ACTIVITIES CASH FLOWS FROM FINANCING ACTIVITIES Receipts Proceeds from Loan Borrowings Proceeds from Leasing Payments Repayments of Borrowings Repayments of lease liability Repayment of Aged Care Facility Deposits