OFFICE MARKET SNAPSHOT Q2 2026
After GDP growth of 1.7% in Q1, Hungary's economy is projected to expand by approximately 1.5–1.7% in 2026, according to Colliers. Inflation fell to 1.7% in June, the second-lowest monthly reading of the year. By mid-July, the EUR/HUF exchange rate was hovering around 355–360, following a period of strengthening supported by the election outcome and the still-elevated interest rate environment. The labour market has remained resilient, with the unemployment rate standing at 4.3% in May 2026, and no significant changes are expected in the near term.
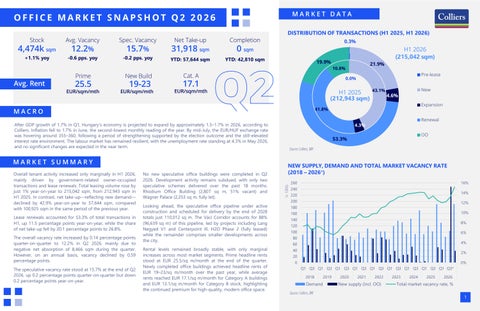
Overall tenant activity increased only marginally in H1 2026, mainly driven by government-related owner-occupied transactions and lease renewals Total leasing volume rose by just 1% year-on-year to 215,042 sqm, from 212,943 sqm in H1 2025 In contrast, net take-up reflecting new demand declined by 42.9% year-on-year to 57,644 sqm, compared with 100,925 sqm in the same period of the previous year
Lease renewals accounted for 53 3% of total transactions in H1, up 11.5 percentage points year-on-year, while the share of net take-up fell by 20 1 percentage points to 26 8%
The overall vacancy rate increased by 0.14 percentage points quarter-on-quarter to 12.2% in Q2 2026, mainly due to negative net absorption of 8,466 sqm during the quarter. However, on an annual basis, vacancy declined by 0 59 percentage points.
The speculative vacancy rate stood at 15.7% at the end of Q2 2026, up 0 2 percentage points quarter-on-quarter but down 0.2 percentage points year-on-year.
No new speculative office buildings were completed in Q2 2026. Development activity remains subdued, with only two speculative schemes delivered over the past 18 months: Rhodium Office Building (2,807 sq m, 51% vacant) and Wagner Palace (2,253 sq m, fully let)
Looking ahead, the speculative office pipeline under active construction and scheduled for delivery by the end of 2028 totals just 110,012 sq m The Váci Corridor accounts for 88% (96,639 sq m) of this pipeline, led by projects including Lang Negyed V1 and Centerpoint III, H2O Phase 2 (fully leased) while the remainder comprises smaller developments across the city
Rental levels remained broadly stable, with only marginal increases across most market segments Prime headline rents stood at EUR 25.5/sq m/month at the end of the quarter. Newly completed office buildings achieved headline rents of EUR 19–23/sq m/month over the past year, while average rents reached EUR 17 1/sq m/month for Category A buildings and EUR 13.1/sq m/month for Category B stock, highlighting the continued premium for high-quality, modern office space
Source: Colliers, BRF