1 minute read
"Analysis of Bitcoin Based on Monthly Chart"


SUMMARY OF Q1 PRICE ACTION:
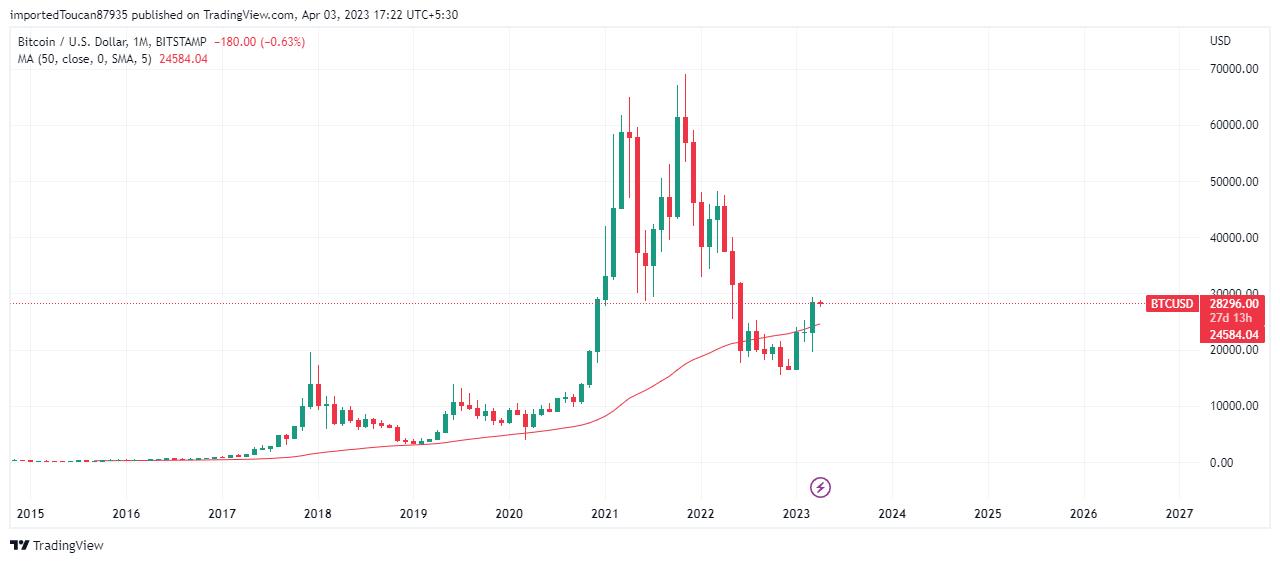
Upon analysing the technical aspects of Bitcoin's price action during this period, it is evident that the last three candlesticks on the monthly chart accurately depict the performance of the first quarter.
Advertisement
In January, Bitcoin experienced a significant surge, resulting in a nearly 40% increase in prices. However, this upward trend was short-lived as it encountered a resistance barrier at the September 2022 high of $22,800. This event was marked by the emergence of a long, full-bodied candle in the market charts.
In February, prices opened and closed at a similar level, just above the September 2022 high. According to technical analysis, the Doji is a single-candlestick pattern that occurs when a narrow-body forms in the middle of the monthly range, which in this case is the February high and low. This pattern indicates indecision in the market as both bulls and bears fail to gain traction, resulting in prices settling around the monthly open.
In March, a full-body candle with a long lower-wick was observed. This was accompanied by the failure of the aforementioned banks, which led to an increase in demand for Bitcoin. As a result, prices surged past a significant level of prior resistance and are now holding steady above the 50-month moving average. This trend indicates a strong support level for Bitcoin and suggests a potential upward trajectory for the cryptocurrency.


