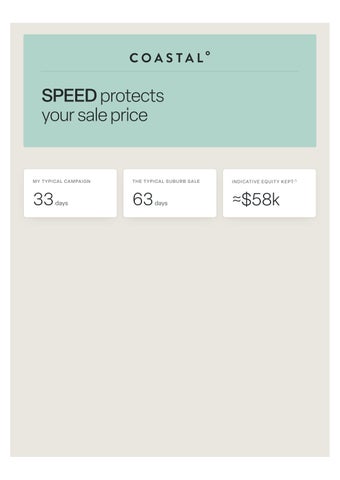
SPEED protects your sale price
MY T YPICA L CA MPAIG N
THE T YP ICAL SUBUR B SA L E
INDICATIVE EQUIT Y KEPT △
33
63
≈$58k
days
days
Less time on market means less accumulated buyer leverage —
1
the single biggest driver of price degradation
Median days on market Lower is stronger for the vendor · measured from first advertised date to sale
Thomas Fliniks
33 days
10 sales
All other agents
63 days
630 sales
Thomas Fliniks
Hope Island market (all other agents combined)
THOMAS FLINIKS VS. THE MARKET MEASURE
ROLLING 1 2 MONTHS THOMAS FLINIKS
ALL OTHER AGENTS
Sales
10
630
Median days on market
33
63
Baseline
+30 days (≈1.9× longer)
Market exposure
2
Hope Island agents — ranked by speed
Buyer negotiating leverage reflects a widely accepted principle — the longer a campaign runs, the more room a buyer has to negotiate. AGENTS WITH 10+ SALES · ROLLING 1 2 MONTHS AGENT
SALES
MEDIAN DOM
BUYER LEVERAGE
Thomas Fliniks
10
33
Low
Sally O'Neill
20
44
Low
Alex Caraco
16
45
Low
Dhi Vig
12
52
Low
Lorraine Drysdale
18
53
Low
Gemma White
17
66
Moderate
Matt Gates
16
67
Moderate
Evan Molloy
10
71
Moderate
Aaron Kibble
10
72
Moderate
Alex Phillis
16
150
High
3
Why speed matters — the cost of time on market
Time on market is not neutral. Once initial marketing traction is established, the discount a vendor accepts rises sharply through the first three months a home is listed.
Median vendor discount by time on market △ Discount from original asking price · Rolling 12 months
0–30 days
1.1%
31–60 days
3.5%
61–90 days
6.4%
Beyond 90 days, we don't report a figure. Very long campaigns are inconsistent in their reporting due to relistings and reduced re-launch prices.
A property that sells within a month typically trades near its asking price. By two to three months on the market, vendors are giving up around six percent — and the pressure only grows from there.
4
What that speed is worth to you
INDICATIVE PRICE DEGRADATION BY TIME ON MARKET △ SALE PRICE
WITHIN 30 DAYS (~1.1%)
31–60 DAYS (~3.5%)
61–90 DAYS (~6.4%)
$1,000,000
≈$11,000
≈$35,000
≈$64,000
$1,500,000
≈$17,000
≈$53,000
≈$96,000
$2,000,000
≈$22,000
≈$70,000
≈$128,000
$2,500,000
≈$28,000
≈$88,000
≈$160,000
$3,000,000
≈$33,000
≈$105,000
≈$192,000
5
Method & data
Every figure comes from one dataset, calculated the same way for every agent. Two kinds of number appear, marked throughout so nothing is overstated: Measured — computed directly from the records Indicative △ — an observed suburb-wide relationship, not a per-agent measurement
About the headline figures. My typical campaign (33 days) is the median time on market across my Hope Island sales. The
typical suburb sale (63 days) is the median across every other Hope Island agent combined — 30 days longer, roughly double my time. Indicative equity kept (≈$58,000) is what a shorter campaign protects on a $2M home, comparing my typical-campaign discount band (~3.5%) against a 61–90 day campaign (~6.4%) — indicative, not a quote or guarantee for any one home.
Prepared by
Thomas Fliniks, COASTAL°.
Source
Pricefinder sold-listings export for Hope Island, rolling twelve months: 647 sales, 640 after removing related-party transfers.
Days on market
Measured. First advertised date to sale date. The median is used for every agent, applied identically.
Vendor discount
Indicative. (Original asking − sale price) ÷ original asking, taken as the median across the 119 sales carrying a usable published asking price. Many Hope Island homes are marketed as "Contact Agent / Auction / Offers Over" with no published price and are necessarily excluded. Figures describe the suburb-wide relationship between time on market and discounting, not a measured discount for any named agent. Beyond 90 days the figure is not reported (relistings / reduced relaunch prices).
Named ranking
Lists only agents with 10 or more sales in the window — a statistically meaningful sample, of whom my campaigns reach a result the fastest. The market-wide comparison and the discount figures draw on all suburb sales, not only these agents.
△
Indicative discount figures describe the observed relationship between time on market and price discounting across Hope Island over the period. They are a comparative guide for discussion, not a measured discount rate achieved by any named agent, and not a prediction of the outcome for any individual property. Days-on-market, sales-count and agent figures are calculated directly from the Pricefinder dataset. The named-agent ranking is limited to agents with 10 or more sales in the period. Prepared to inform a listing discussion.
Thomas Fliniks · Hope Island vendor equity analysis · rolling 12 months