
27 minute read
Effects of Distinct Force Magnitude of Spinal Manipulative Therapy on Blood Biomarkers of Inflammation: A Proof of Principle Study in Healthy Young Adults


Abstract
Objectives: The purpose of this preliminary study was to determine the influence of thoracic spinal manipulation therapy (SMT) of different force magnitudes on blood biomarkers of inflammation in healthy adults.
Methods: Nineteen healthy young adults (10 female, age: 25.6 ± 1.2 years) were randomized into the following 3 groups: (1) control (preload only), (2) single thoracic SMT with a total peak force of 400N, and (3) single thoracic SMT with a total peak force of 800N. SMT was performed by an experienced chiropractor, and a force-plate embedded treatment table (Force Sensing Table Technology) was used to determine the SMT force magnitudes applied. Blood samples were collected at pre intervention (baseline), immediately post intervention, and 20 minutes post intervention. A laboratory panel of 14 different inflammatory biomarkers (pro, anti, dual role, chemokine, and growth factor) was assessed by multiplex array. Change scores from baseline of each biomarker was used for statistical analysis. Two-way repeated-measures analysis of variance was used to investigate the interaction and main effects of intervention and time on cytokines, followed by Tukey’s multiple comparison test (P ≤ .05).
Results: A between-group (800N vs 400N) difference was observed on interferon-gamma, interleukin (IL)-5, and IL6, while a within-group difference (800N: immediately vs 20 minutes post-intervention) was observed on IL-6 only.
Conclusion: In this study, we measured short-term changes in plasma cytokines in healthy young adults and found that select plasma pro-inflammatory and dual-role cytokines were elevated by higher compared to lower SMT force. Our findings aid to advance our understanding of the potential relationship between SMT force magnitude and blood cytokines and provide a healthy baseline group with which to compare similar studies in clinical populations in the future. (J Manipulative Physiol Ther 2022;45;20-32)
Key Indexing Terms: Manipulation, Spinal; Cytokines; Blood; Plasma; Biomarkers
Introduction
Spinal manipulation therapy (SMT) is a manual technique commonly used by chiropractors to clinically manage spinal pain and other musculoskeletal disorders.1 SMT is characterized by the application of a high-velocity, lowamplitude maneuver. It is further characterized by its biomechanical characteristics, including the amount of force applied during SMT and how fast the force application was.2-4 A recent review on physiological responses induced by manual therapy highlighted that SMT produced changes in muscle spindle response, nociceptive reflex response and neuronal activity, electromyography, and immunologic response.5 In addition, the SMT dosage (eg, varying thrust forces and/or thrust durations) influenced short-term physiological responses to SMT treatment.4 Higher SMT force magnitude has been shown to lead to larger spinal vertebral displacements6 and larger force distribution at the segment and adjacent spinal segments.7 Nevertheless, the relationship between force magnitude and changes in physiological responses after SMT remains to be further elucidated.
Inflammatory cytokines are a large family of small proteins that are mainly produced in and secreted by immune cells, such as monocytes, macrophages, and T helper cells, although they can be released by most of the nonimmune nucleated cells.8,9 Accumulating evidence has shown that transient release of cytokines, including tumor necrosis factor-α (TNF-α), interleukin 1β (IL-1β), and IL-6 and other inflammatory mediators, may be pivotal to proper neuroimmune cell communication, cell signaling, and cellular development against infectious or non-infectious stimuli (eg, tissue trauma).8,9 Pro-and anti-inflammatory cytokines have been largely studied due to their putative participation in the pathophysiology of diverse pain-related conditions including spinal pain.8,48 In addition, circulatory cytokines hold the potential to inform of peripheral inflammatory processes occuring after tissue injury (eg, trauma, surgery, or radiation), acute and chronic infection, sepsis, cancer and autoimmune diseases.8,10-13 Indeed, blood biomarkers may also be informative to monitor normal biological processes, the progression of a given disorder, and to monitor changes in response to intervention.14
Mechanotherapy encompasses many forms of therapeutic application, including SMT. Noticeably, mechanical characteristics, such as loading and duration, have been shown to modulate the release of pro-and anti-inflammatory cytokines.5,15-18 In a pre-clinical study, Waters et al observed that high load cyclic compressive massage increased the macrophage infiltration and elevated muscle inflammation in healthy tibialis anterior muscle.19 Stimulated macrophages are important in the release of inflammatory cytokines and contribute to inflammation, intercellular signaling, and tissue repair.20 Furthermore, Butterfield et al observed that the lower loading magnitude of compressive massage stimulated the M2 subpopulation of macrophages, which are involved in tissue repair and regeneration, rather than the M1 subpopulation of macrophages, which are associated with the secretion of proinflammatory cytokines.21 Although the physiologic mechanisms of distinct mechanotherapy modalities (eg, massage and SMT) are not fully understood, it is possible that SMT also induces changes in cytokines that are typically attributed to M1 (pro-inflammatory) and M2 (anti-inflammatory) after receiving this therapy.
Previous studies have demonstrated that SMT can modulate circulatory blood cytokines and oxidative stress biomarkers in healthy and clinical populations.22−25 Nevertheless, few studies have attempted to draw a relationship between force magnitudes and cytokines. In studying isolated polymorphonuclear neutrophils and classic monocytes, Brennan et al reported that SMT peak thrust force of approximately 900N increased neutrophils and monocytes respiratory burst and enhanced TNF-α secretion compared to sham SMT ( 250N) in healthy young adults.26,27 This observation pointed out that force magnitude may trigger a specific signature on white blood cells and cytokine release in healthy adults; however, neither the effect at the systemic level nor the clinical implication is clear. As we move toward an era of precision medicine, improving our understanding of how SMT and its biomechanical characteristics influence blood biomarkers related to inflammation becomes pivotal in this evolving process.
The overall aim of this proof of principle study was to explore inflammatory-related biomarkers that are potentially affected by SMT force magnitude in healthy individuals. Our specific aim was to determine the impact of thoracic spinal manipulation with different force magnitudes on blood biomarkers of inflammation in healthy adults. We hypothesized that circulatory proinflammatory cytokines would be increased when a greater SMT force magnitude was applied.
Methods
This was an original sample analysis of a panel of circulatory pro-and anti-inflammatory cytokines. The present study was conducted at Canadian Memorial Chiropractic College Simulation Laboratory and Life Science Laboratory and was approved by the Canadian Memorial Chiropractic College Research Ethics Board (REB# 192034). All participants provided written informed consent before participating in this study.
Study Sample
The study sample consisted of young, healthy adults, mostly chiropractic students, of both sexes. Inclusion criteria included the following: no pain in any region of the body in the previous 30 days, had not received SMT in the previous 7 days, had not presented any other acute health condition (eg, acute musculoskeletal injury, cold, flu) up to a week before the data collection, and had no contraindications to thoracic SMT (eg, history of spinal surgery, thoracic spine fracture, spinal cord injury, osteoporosis, spinal infection, neoplasm and/or spinal malignancy and/or cancer).
Sample Size, Randomization, and Allocation
The target sample size of 11 participants per group (33 total) was estimated based on a previous study assessing the immediate effects of a single thoracic SMT (pre-topost experimental design) in asymptomatic young, healthy individuals, with a reported difference between means of 30% on plasma biomarkers of inflammation.28
Randomization was performed using a random number generator (Microsoft Excel, Microsoft Redmond, WA). Concealed opaque envelopes containing the intervention groups and study participants’ identification numbers were handed to the clinician performing the SMT. Participants were randomly allocated at a (1:1:1) to 1 of the following 3 groups: (1) control (preload force only), (2) 400N (400 N peak force), and (3) 800N (800 N peak force). Participants were blinded to the study allocation.
Instrumentation: Force-Sensing Table Technology Data Acquisition
Participants laid down on the force-sensing table technology (FSTT®) (Canadian Memorial Chiropractic College, Toronto, ON, Canada) in a prone position with the shoulders aligned with the upper border of the plinth. The FSTT® consists of a Leander 900 Z Series treatment table (Leader Health Technologies Corporation, Port Orchard, WA) with an embedded AMTI force plate (Advanced Mechanical Technology Inc, Watertown, MA) and was used to record the SMT force-time characteristics.29 Analog data from force plates were digitally sampled at a rate of 2000 Hz using a ±10V range on a 16-bit analog-to-digital conversion board (Optotrak Data Acquisition Unit, Northern Digital Inc, Waterloo, ON, Canada). The FSTT is a valid and reliable tool when measuring force-time characteristics during SMT.2,29 Digital voltages from the force plate were converted to units of force (Newtons) using the manufacturer-specified calibration matrices.
Interventions
A posterior-to-anterior (P-A) high-velocity, low-amplitude thoracic SMT was applied at the T6-T9 spine region by a licensed chiropractor (DS) with years of clinical and teaching experience and able to modulate force-time characteristics of the applied SMT, ie, able to apply predetermined force magnitudes consistently.
One experimental group received a thoracic SMT with a total peak force magnitude of 400N (±150N), and another group received a thoracic SMT with a total peak force magnitude of 800N (±150N). We chose 400N since it represents the average peak force applied during P-A thoracic SMT and 800N as it has been used as a force magnitude for SMT educational and training purposes, and it determines a 2-fold peak force from the reported average of thoracic SMT.2,30 A third group receiving P-A thoracic SMT without thrust consisting of 200N preload force only was used as a control group. Preload force was defined as the amount of force applied before the thrust. Instructions were provided to DS to achieve similar preload forces in each group. Total peak force was defined in this study as the maximal force (N) applied during the SMT (thrust + preload force).
Blood Samples Collection
Participants were asked to sit in a chair, and an Ontario registered nurse obtained blood samples from a cubital vein. Blood samples were drawn in commercially available tubes (vacutainers − 10 mL tubes) using disposable catheters. The initial 2 mLs were obtained in an extra tube and immediately disposed. Tubes containing ethylenediaminetetraacetic acid (EDTA) anti-coagulant were gently inverted 2 to 5 times to mix blood with EDTA and kept at room temperature until completion of all participant sample collections (approximately 20 minutes). Because the blood draw was carried out 3 times at pre-intervention (baseline), immediately post (IP) after intervention (within a minute), and 20 minutes after intervention in every participant, a peripheral intravenous line was used and kept during the study to avoid multiple needle sticks.
Blood Sample Preparation and Biochemical Analysis
Upon blood draws completion, blood tubes were transferred to the Life Science Laboratory and processed immediately. Samples were centrifuged at 3000 RPM for 15 minutes at 4°C in a refrigerated centrifuge (Allegra X-22 Series, Beckman Coulter, Pasadena, CA). Plasma samples were aliquoted and stored at a −80°C freezer for later inflammatory biomarkers (array of cytokines). For cytokine analysis, 100 microliters of each plasma sample were sent to Eve Technologies for analysis of an array of cytokines utilizing bead-based fluorescence multiplex assay and the commercial kit Human High Sensitivity T-Cell Discovery Array 14-Plex (Eve Technologies Corp, Calgary, AB, Canada). This panel included cytokines that are classified as pro-and anti-inflammatory cytokines, cytokines with a dual role, chemokines, and growth factors31 (granulocytemacrophage colony-stimulating factor, interferon-gamma [IFNγ], IL-1β, IL-2, IL-4, IL-5, IL-6, IL-8, IL-10, IL-12p70, IL-13, IL-17A, IL-23, TNF-α). This assay involved a BioPlex 200 bead-based analyzer (BioRad Laboratories, Hercules, CA), which includes a dual-laser system in combination with a flow-cytometry system. This method is highly sensitive and has been validated for detecting changes of low-abundance cytokines in plasma in healthy individuals.32 Samples were analyzed in duplicates.
Change Score Calculation
After obtaining the raw concentration of all cytokines, we calculated the change score to estimate the effect of a given intervention on each cytokine.33 The withinsubject (individual) change score was firstly determined by calculating the delta from baseline to IP and 20 minutes after intervention (20 min).33 Next, individual scores were grouped according to the given intervention (control, 400N, and 800N) and time point: (time 1: IP − baseline), (time 2: 20 minutes − baseline). Therefore, change scores from baseline at times 1 and 2 per group were used for statistical comparisons.
Statistical Analysis
One-way analysis of variance (ANOVA) was performed to check for similarity of variances between groups at baseline. This step is recommended to be performed before the calculation of change scores.33 We then performed a 2-way repeated-measures ANOVA to investigate the effect of time (main effect) and intervention (main effect) as well as interaction effect (time x intervention) on the dependent variable (cytokines). To examine which means were different (same intervention x time [within-group]; between interventions x each time [between-group]) and to estimate the magnitude of difference, we used Tukey’s multiple comparison test. Tukey’s test offers more control of the experiment's false positive rate (type I error) compared to other multiple comparison tests (ie, Fisher’s least significant difference). All comparisons were 2-tailed, and differences were considered statistically significant when P was ≤ 0.05. Pearson correlation was employed to explore the correlation between cytokines. Only moderate and high correlations were reported. Moderate correlation (positive or negative) corresponded to .50 to .70; high (positive or negative) correlation corresponded to .70 to .90.34 Statistical analyses were performed in Prism (V. 9.0-GraphPad Software, Inc., La Jolla, CA). Data are presented as mean and standard deviation unless otherwise specified.
Results
Twenty-one participants were interested in the study and met the inclusion criteria. Out of the 21, 2 participants were excluded: 1 in the 800N group due to fainting after the first blood draw, and the other because the pre-established peak force range 400 N (±150N) was exceeded. Therefore, data from 19 participants were used for the study analysis. The sociodemographic characteristics (ie, age, sex, and body mass index) as well the mean and standard deviation (SD) of biomechanical variables of interventions, such as preload, total peak force, and time to peak of each group, are presented in Table 1. Briefly, the average total peak forces in 400N and 800N groups were 393.4 ± 34.1 and 847.4 ± 95.1, respectively. The average preload in the control group was 195.4N ± 12.81, almost identical to 400N (183.4 ± 13.8) and 800N (197.8 ± 9.8) groups (Table 1).
Inflammatory Mediators
Baseline data (mean ± SD, minimum, and maximum values) are presented in Table 2. In addition, reference concentration (mean ± SD) from previous studies using similar individuals (healthy adults) and similar sample-related technical features (sample type: plasma; anticoagulant: EDTA; assay: bead-based fluorescence multiplex assay; similar commercial kit) were included in Table 2 to facilitate external comparison.31,35-38
No statistical difference in each plasmatic cytokine concentration among the 3 groups was observed at the baseline (P ≥ .05). Therefore, the change score from baseline could be calculated. The effect of interventions on change scores at times 1 and 2 on pro and antiinflammatory cytokines, cytokines with a dual role, chemokine, and growth factor is described below and further present in Figures 1 and 2. Figures 3 and 4 present the results of Tukey’s multiple comparison analysis (between-group) in all cytokines as mean difference (MD)and 95% confidence interval (CI). A main effect of the intervention was observed on the proinflammatory cytokine IFN-γ (F [2, 16] = 4.153, P = .0353). A betweengroup multiple comparison analysis determined that the levels of IFN-γ in the 800N group were elevated compared to the ones in the 400N (MD: −4.204; 95% CI [−7.979 to −0.428]; P = .0282). Specifically, IFN-γ in the 800N group was higher than 400N at time 1 and time 2 (MD = −4.340; 95% CI [−8.132 to −0.547]; P = 0.022), MD = −4.067; 95% CI [−7.860 to −0.274]; P = .033), respectively (Fig. 1A and 3A). No statistical difference was observed between 800N to control groups (Fig 3A).
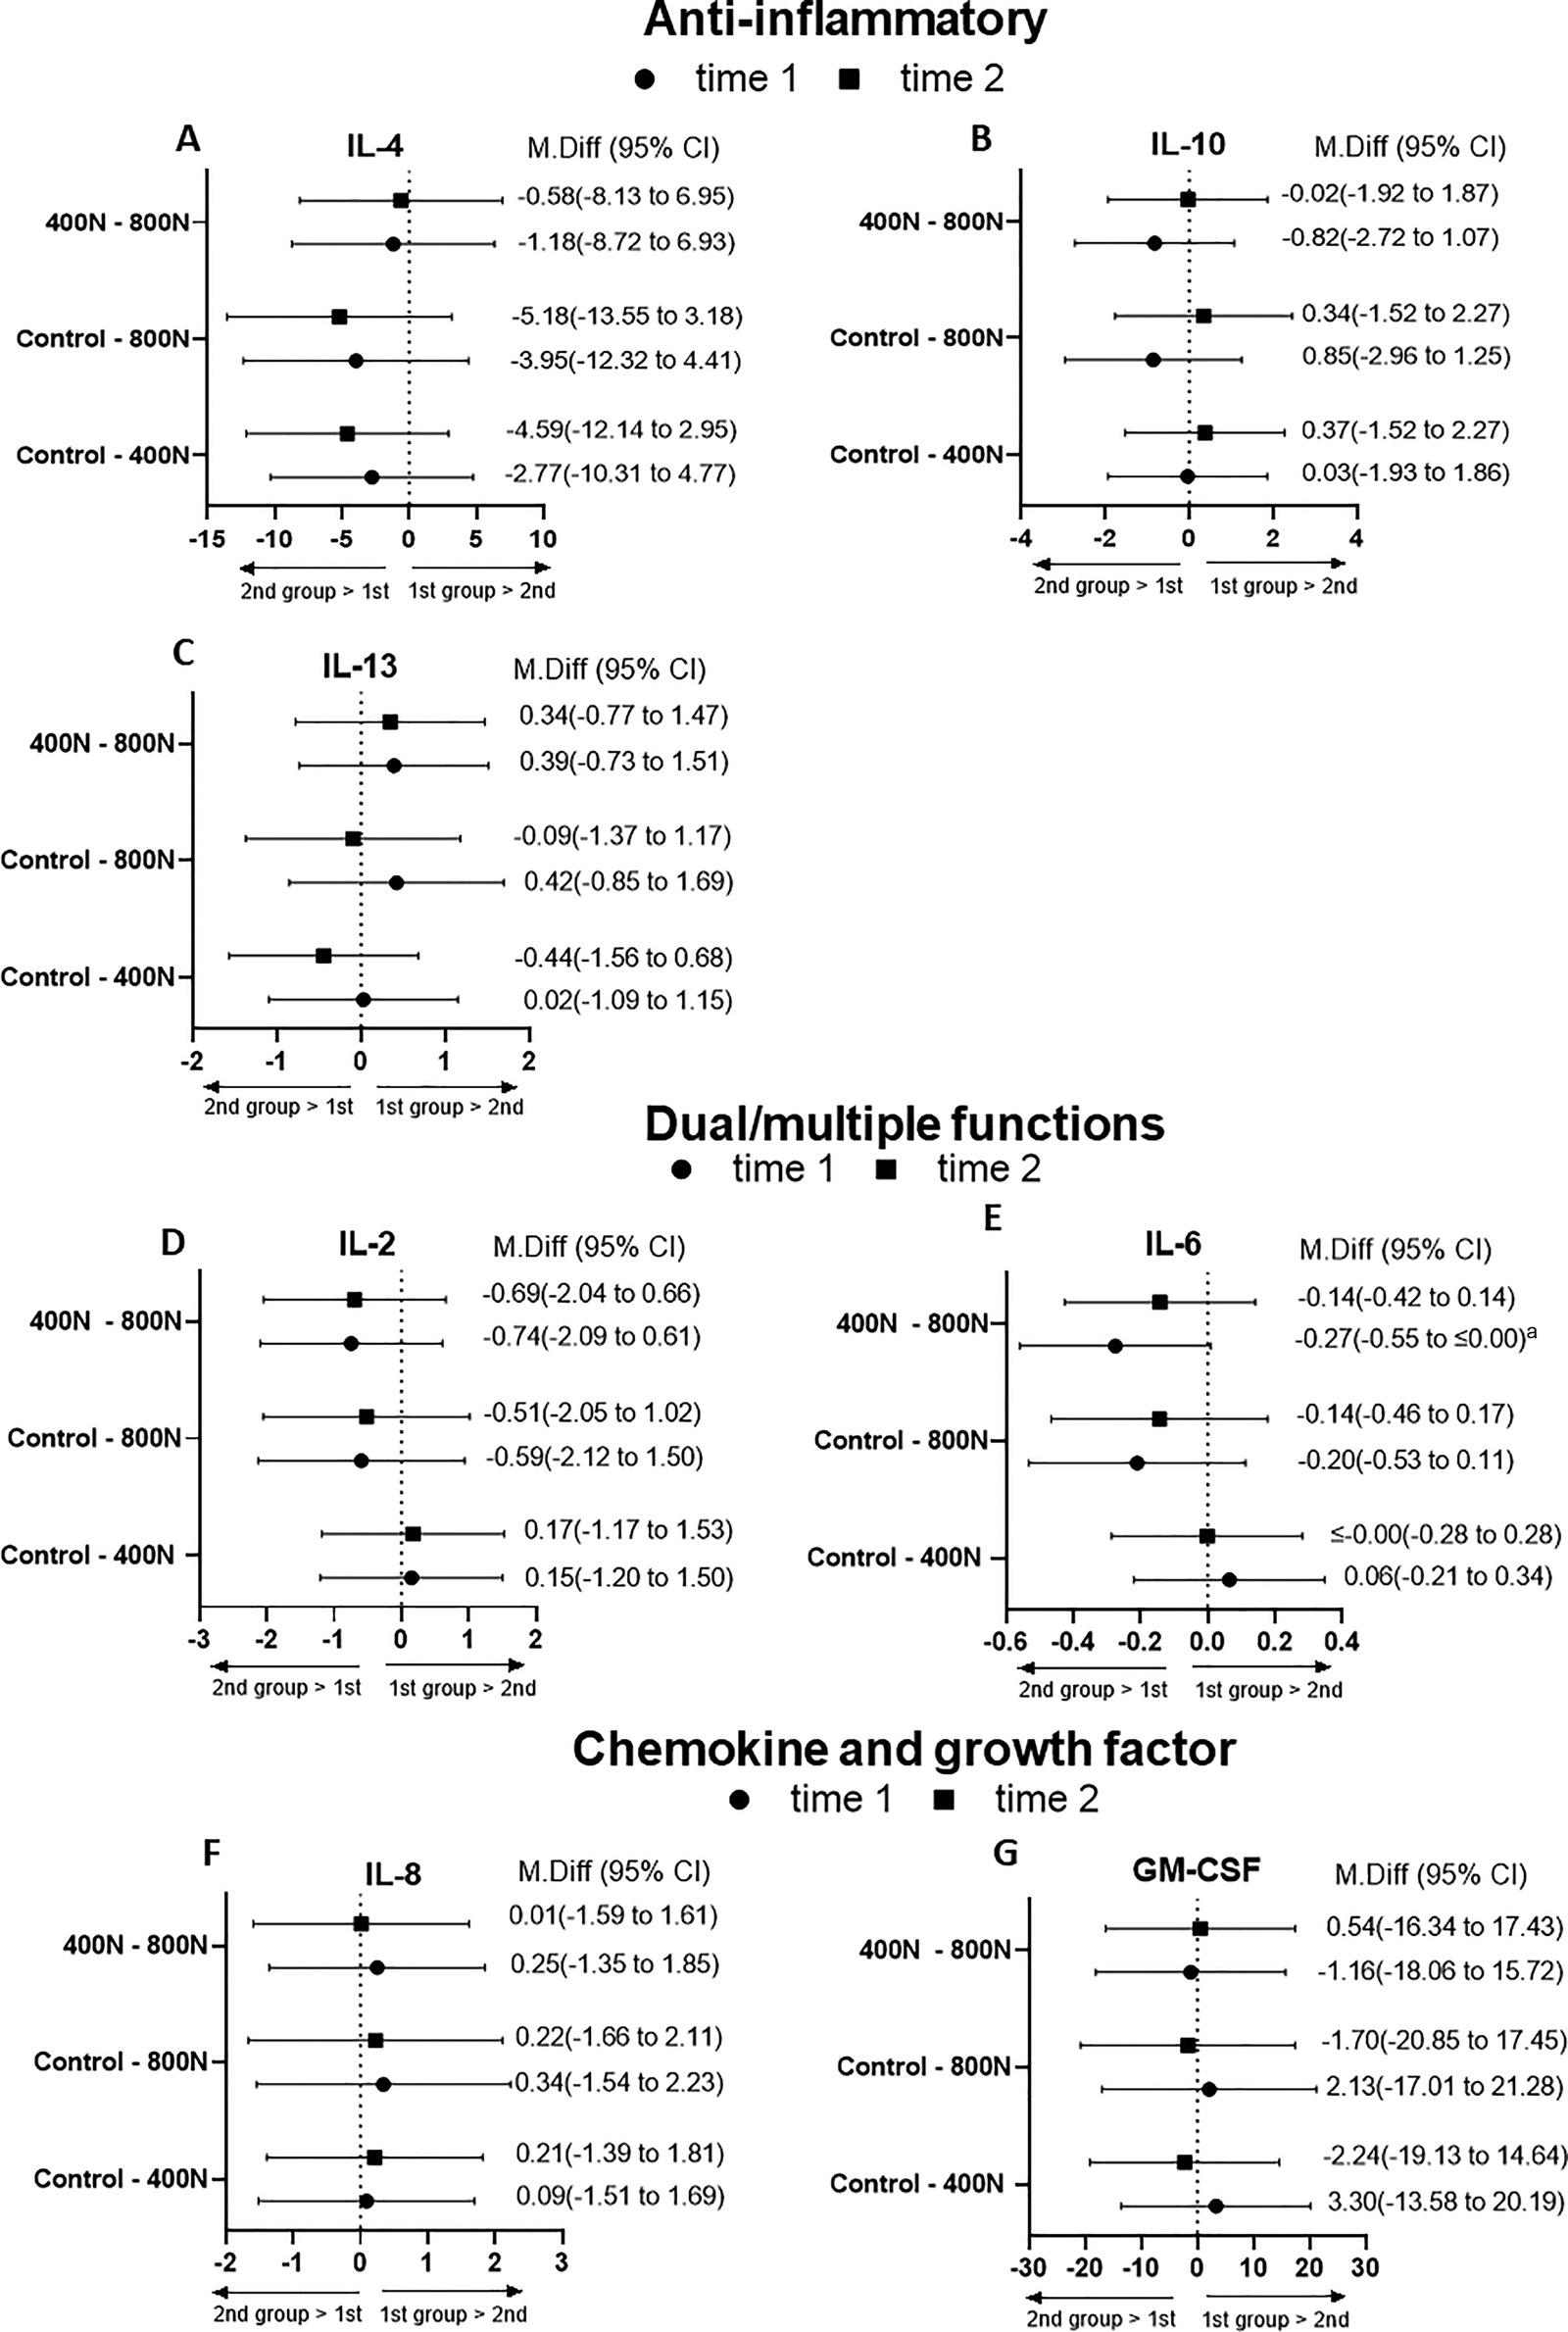
Multiple comparison analysis indicated that the levels of IL-5 in the 800N was higher than in the 400N groups at time 2 (MD: −0.548; [−1.076 to −0.019] [Fig. 1B and 3B]; P = .040); there was no main effect of intervention (P = .080), time (0.092), or interaction (P = .203).
There was an interaction effect (intervention x time) mettheinclusioncriteria.Outofthe21,2participantswere excluded:1inthe800Ngroupduetofaintingafterthe first blooddraw,andtheotherbecausethepre-establishedpeak forcerange400N(§150N)wasexceeded.Therefore,data and95%confidenceinterval(CI).
AmaineffectoftheinterventionwasobservedontheproinflammatorycytokineIFN-g (F[2,16]=4.153, P =.0353).
Abetween-groupmultiplecomparisonanalysisdetermined
Valuesreportedasmean § standarddeviation.
,bodymassindex; Frequency,numberofinterventions; kg/m2,kilogramspersquaremeter; and 800N) and Reference Concentration
IL-106.92(2.17)3.8-9.25.75(2.67)2.5-10.86.12(.78)5.2-7.27.6(7.2)
IL-12p702.91(.99)1.8-4.43.11(1.46)1.6-6.72.81(.76) 2-3.92.6(1.0)
IL-134.63(1.46)2.8-6.94.77(1.59)2.4-7.53.40(1.45)1.5-4.94.4(2.0)
IL-17A9.95(4.16)6.0-15.28.56(1.89)5.33-11.38.45(1.6)6.7-10.87.9(7.8)
IL-23398.8(163.7)262.2-586.9358.2(123.8)215.7-586.9475.9(153.3)306.9-659.3356(290)
Baselineplasmaconcentrations(picograms/milliliter)areshownasmean § SDwithmininumandmaximumvalues(range)pergroup. EDTA,ethylenediaminetetraaceticacid;IL,interleukin; SD,standarddeviation. a Meanconcentration(pg/mL) § SDofplasma-EDTAanalytesassessedbyamultiplexarrayinhealthyadultsreportedonpreviousstudies.2,32-35 thatthelevelsofIFN-g inthe800Ngroupwereelevated comparedtotheonesinthe400N(MD: 4.204;95%CI [ 7.979to 0.428]; P =.0282).Specifically,IFN-g inthe
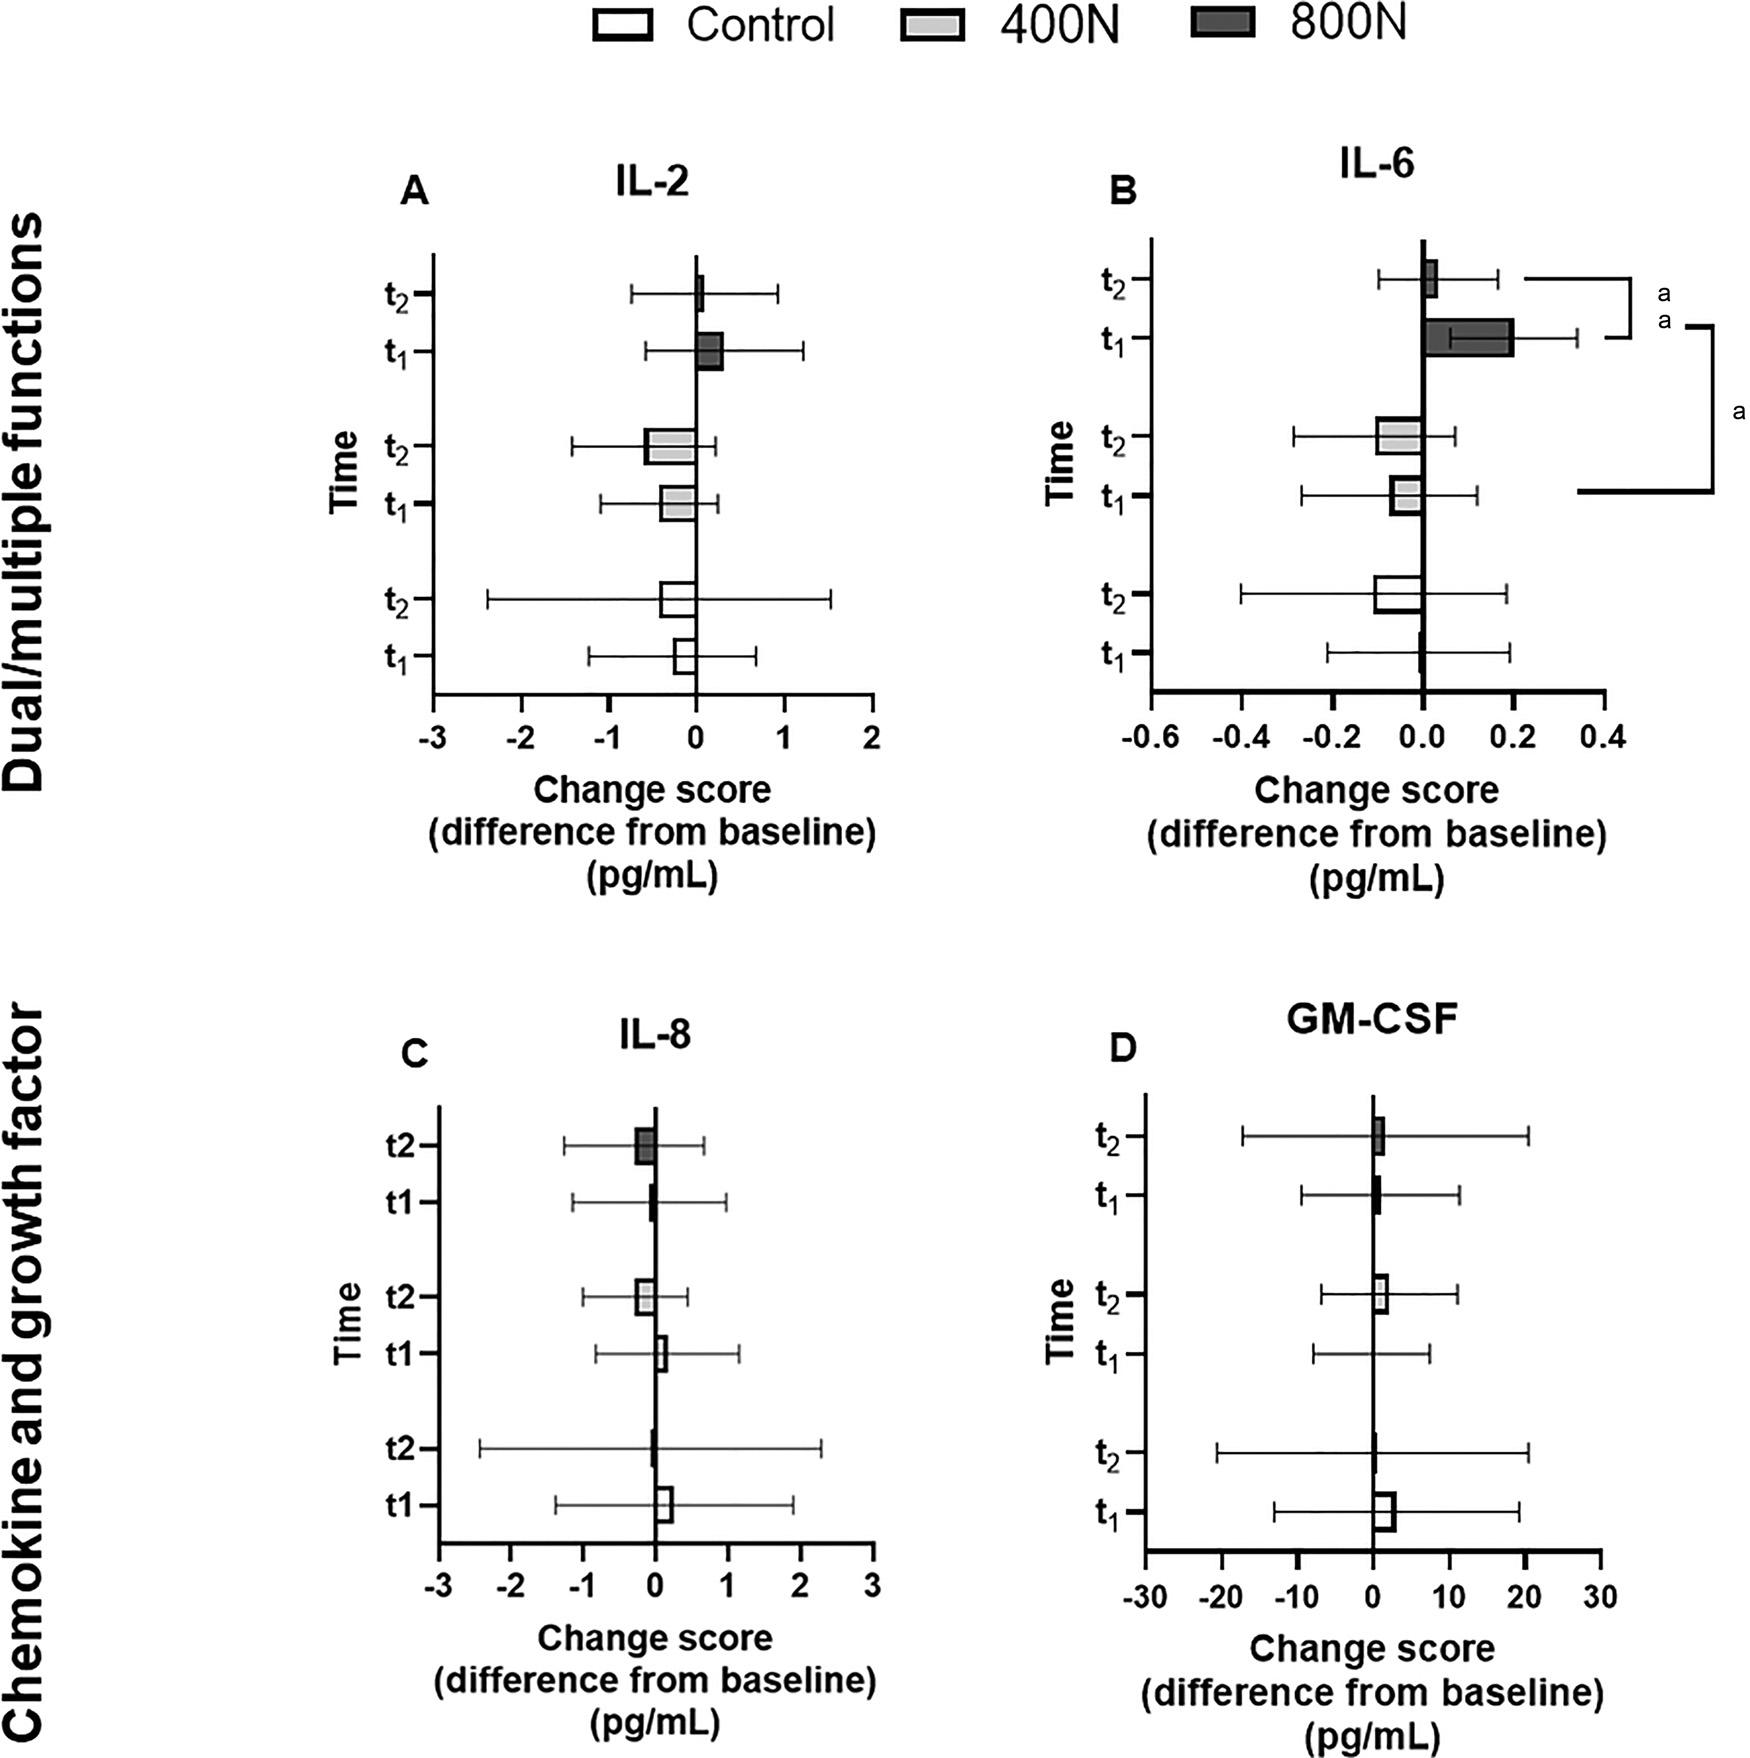
Attime1(IP),Pearsoncorrelationshowedpositivehigh correlationbetweenIFN-g andthepro-inflammatoryIL12p70(r=0.74, P ≤ .01)andthedualrolecytokinesIL-6 observed for IL-6 (F [2, 16] = 3.662, P = .049). Multiple comparison analysis revealed that the levels of IL-6 in the 800N group at time 1 was higher than 800N group at time 2 (MD: 0.166; 95% CI [0.060-0.271]; P = .002) and higher than 400N group at time 1 (−0.274; 95% CI [−0.558 to 0.009]; P = .049) (Fig. 2B and 4E). No statistical difference was observed between 800N to control groups (Fig 4E). No further statistical differences were observed on other cytokines (Fig. 1-4).
At time 1 (IP), Pearson correlation showed positive high correlation between IFN-γ and the pro-inflammatory IL12-p70 (r = 0.74, P ≤ .01) and the dual role cytokines IL-6 (r = 0.77, P ≤ .001) and IL-2 (r = 0.71, P ≤ .001). In addition, a moderate correlation was observed between IFN-γ and the anti-inflammatory cytokine IL-10 (r = 0.69, P ≤ .01).
At time 2 (20 minutes), positive moderate correlation was observed between IFN-γ and the pro-inflammatory cytokines IL-5 (r = 0.68, P ≤ .001), IL-17A (r = 0.56, P ≤ .01), IL12-p70 (r = 0.68, P ≤ .001), IL-1β (r = 0.53, P ≤ .01), TNF-α (r = 0.56, P ≤ .01), anti-inflammatory IL-10 (r = 0.57, P ≤ .01), and dual role cytokines IL-2 (r = 0.55, P ≤ .01) and IL-6 (r = 0.67, P ≤ .001).
Discussion
The findings of this present study demonstrated that distinct force magnitudes of SMT in healthy young adults modulate a select panel of blood biomarkers related to inflammation in distinct ways. While 800N, delivered at the thoracic spine, elevated systemic pro-inflammatory (IFN-γ and IL-5) and the levels of a dual role cytokine (ILTable 6), 400N and control interventions triggered an opposite effect in the short-term. These findings provide preliminary support for the hypothesis that a relationship may exist between SMT force magnitude and blood biomarkers, although no clear distinction between control and 400N intervention was observed on the biomarkers measured in this study.
Studies seeking to understand how biomechanicala spects of SMT (eg, force and speed) affect neurophysiological outcomes have been previously conducted.3,7 However, the clinical translation of such findings may be limited due to the use of robotic apparatus instead of a clinician (handson maneuver).3,7 The FSTT is capable of measuring the force and speed of SMT in a hands-on setting; thereby, it is a promising tool to advance the knowledge regarding SMT force-time characteristics and neurophysiological and biochemical responses in humans in an experimental and clinical setting. By combining the FSTT with the analysis of blood cytokines, our study demonstrated that the 800N group showed statistically higher change scores from baseline of IFN-γ compared to the ones in the 400N at time 1 and 2 after the intervention, higher changes in the IL-5 compared to the 400N at time 2 after intervention and that IL-6 changes in the 800N group at time 1 was higher than the changes in time 2 within this same group and when compared to the 400N group at time 1 in the plasma of healthy individuals.
The inflammatory process can be initiated through a variety of mechanisms, from the introduction of pathogens to challenging the system by mechanical stress.20 Cytokines, including chemokines, are small secreted proteins that specifically affect the interactions and communications between cells.39 The observation of changes in only a few cytokines may reflect the nature of the inflammatory response where classically some cytokines play an initial pro-inflammatory and signaling role (ie, IL-6, IFN-γ, IL1-β, and TNFα), others play an anti-inflammatory role (ie, IL-4 and IL-10), and others drive the accumulation of specific immune cells (eg, neutrophils chemoattracted by IL-8 chemokine) in the tissue under stress.40 A recent review highlighted the interactive role between mechanical stress-strain stimulation and neuro-immunomodulation.41 Cytokine secretion by immune (monocytes, T helper, and macrophages) and non-immune cells (eg, endothelial cells, myocytes, and fibroblasts) are adaptable and directly related to the mechanical cues (ie, load magnitude, frequency, amplitude, and direction).41 On the other hand, studies have measured circulatory cytokines to estimate the degree of tissue damage by mechanical tissue trauma.42,43 It has been shown that tissues commonly exposed to trauma as lung and bone may release higher cytokine levels in the bloodstream compared to skin and muscle.42 Moreover, a remarkable acute (within 24 hours) and sustained (7 days) elevation of plasma IL-6, IFN-γ, IL-5, and IL-23 in blunt trauma young adult patients exceeding concentration values from deemed healthy young individuals have been reported.43 Given that the observed increase on IFN-γ, IL-5, and IL-6 after 800N SMT were within the reference concentration levels (Table 2), IL-23 was lower than baseline and IL-6 decreased 20 minutes after 800N SMT, it is unlikely that 800N SMT is comparable to blunt trauma and drives tissue damage.
Interestingly, previous evidence showed that 1 session of SMT on the upper thoracic spine led to an immediate improvement in the resting cardiac autonomic control without an effect on the blood pressure responsiveness to a sympathoexcitatory stimulus in patients with attime1washigherthanthechangesintime2withinthis samegroupandwhencomparedtothe400Ngroupattime 1intheplasmaofhealthyindividuals.
Fig.1. Influenceofintervention(control,400N,and800N)onplasmapro-andanti-inflammatorycytokinesattime1(t1)and2(t2) determinedwithbead-basedmultiplexassay.(A-G)Pro-inflammatorycytokines.(H-J)Anti-inflammatorycytokines.Thechangesscore wascalculatedbasedonthedifferencebetweenthecytokineconcentration(pg/mL)frombaselinetoimmediately(t1)andto20minutes afterintervention(t2).Scoresontherightfrom0denotecytokineelevationfrombaseline.Scoresontheleftfrom0denotecytokine demotionfrombaseline.Scoresarereportedasmeanand95%CIs.Asterisksdenotethestatisticaldifferencebetweengroups. a .05.Two-wayrepeated-measuresANOVA.Tukey’smultiplecomparisonanalysis.ANOVA,analysisofvariance; CIs,confidence intervals.
Fig. 1 Influence of intervention (control, 400N, and 800N) on plasma pro-and anti-inflammatory cytokines at time 1 (t1) and 2 (t2) determined with bead-based multiplex assay. (A-G) Pro-inflammatory cytokines. (H-J) Anti-inflammatory cytokines. The changes score was calculated based on the difference between the cytokine concentration (pg/mL) from baseline to immediately (t1) and to 20 minutes after intervention (t2). Scores on the right from 0 denote cytokine elevation from baseline. Scores on the left from 0 denote cytokine demotion from baseline. Scores are reported as mean and 95% CIs. Asterisks denote the statistical difference between groups. aP ≤ .05. Two-way repeated-measures ANOVA. Tukey’s multiple comparison analysis. ANOVA, analysis of variance; CIs, confidence intervals.
Fig.2. Influenceofintervention(control,400N,and800N)onplasmadualfunction,chemokine,andgrowthfactorattime1(t1)and2 (t2)determinedwithbead-basedmultiplexassay.GraphsAandBrepresentdualfunctioncytokines.GraphsCandDrepresentchemokineandgrowthfactor,respectively.Thechangesscorewascalculatedbasedonthedifferencebetweenthecytokineconcentration (pg/mL)frombaselinetoimmediately(t1)andto20minutesafterintervention(t2).Scoresontherightfrom0denotecytokineelevation frombaseline.Scoresontheleftfrom0denotecytokinedemotionfrombaseline.Scoresarereportedasmeanand95%CIs.Footnotes denotethestatisticaldifferencebetweengroups. aP ≤ .05, aaP ≤ .01.Two-wayrepeated-measuresANOVA.Tukey’smultiplecomparisonanalysis.ANOVA,analysisofvariance; CIs,confidenceintervals.
Fig. 2 Influence of intervention (control, 400N, and 800N) on plasma dual function, chemokine, and growth factor at time 1 (t1) and 2 (t2) determined with bead-based multiplex assay. Graphs A and B represent dual function cytokines. Graphs C and D represent chemokine and growth factor, respectively. The changes score was calculated based on the difference between the cytokine concentration (pg/mL) from baseline to immediately (t1) and to 20 minutes after intervention (t2). Scores on the right from 0 denote cytokine elevation from baseline. Scores on the left from 0 denote cytokine demotion from baseline. Scores are reported as mean and 95% CIs. Footnotes denote the statistical difference between groups. aP ≤ .05, aaP ≤ .01. Two-way repeated-measures ANOVA. Tukey’s multiple comparison analysis. ANOVA, analysis of variance; CIs, confidence intervals.
Theinflammatoryprocesscanbeinitiatedthrougha varietyofmechanisms,fromtheintroductionofpathogens pro-in flammatoryandsignalingrole(ie,IL-6,IFN-g ,IL1b,andTNFa),othersplayananti-in flammatoryrole(ie, IL-4andIL-10),andothersdrivetheaccumulationofspecificimmunecells(eg,neutrophilschemoattractedbyIL-8 chemokine)inthetissueunderstress.40 Arecentreview
Fig.3. Differencebetweenmeanscoresand95%confidenceinterval(CI)betweeninterventions(controlversus400N,controlversus 800N,400Nversus800N)attime1(t1)andtime2(t2)onplasmapro-inflammatorycytokines.Asterisksdenotethestatisticaldifference betweengroupsatagiventimepoint. aP ≤ .05.Tukey’smultiplecomparisonanalysis.CI,confidenceintervals.
Fig. 3 Difference between mean scores and 95% confidence interval (CI) between interventions (control versus 400N, control versus 800N, 400N versus 800N) at time 1 (t1) and time 2 (t2) on plasma pro-inflammatory cytokines. Asterisks denote the statistical difference between groups at a given time point. aP ≤ .05. Tukey’s multiple comparison analysis. CI, confidence intervals.
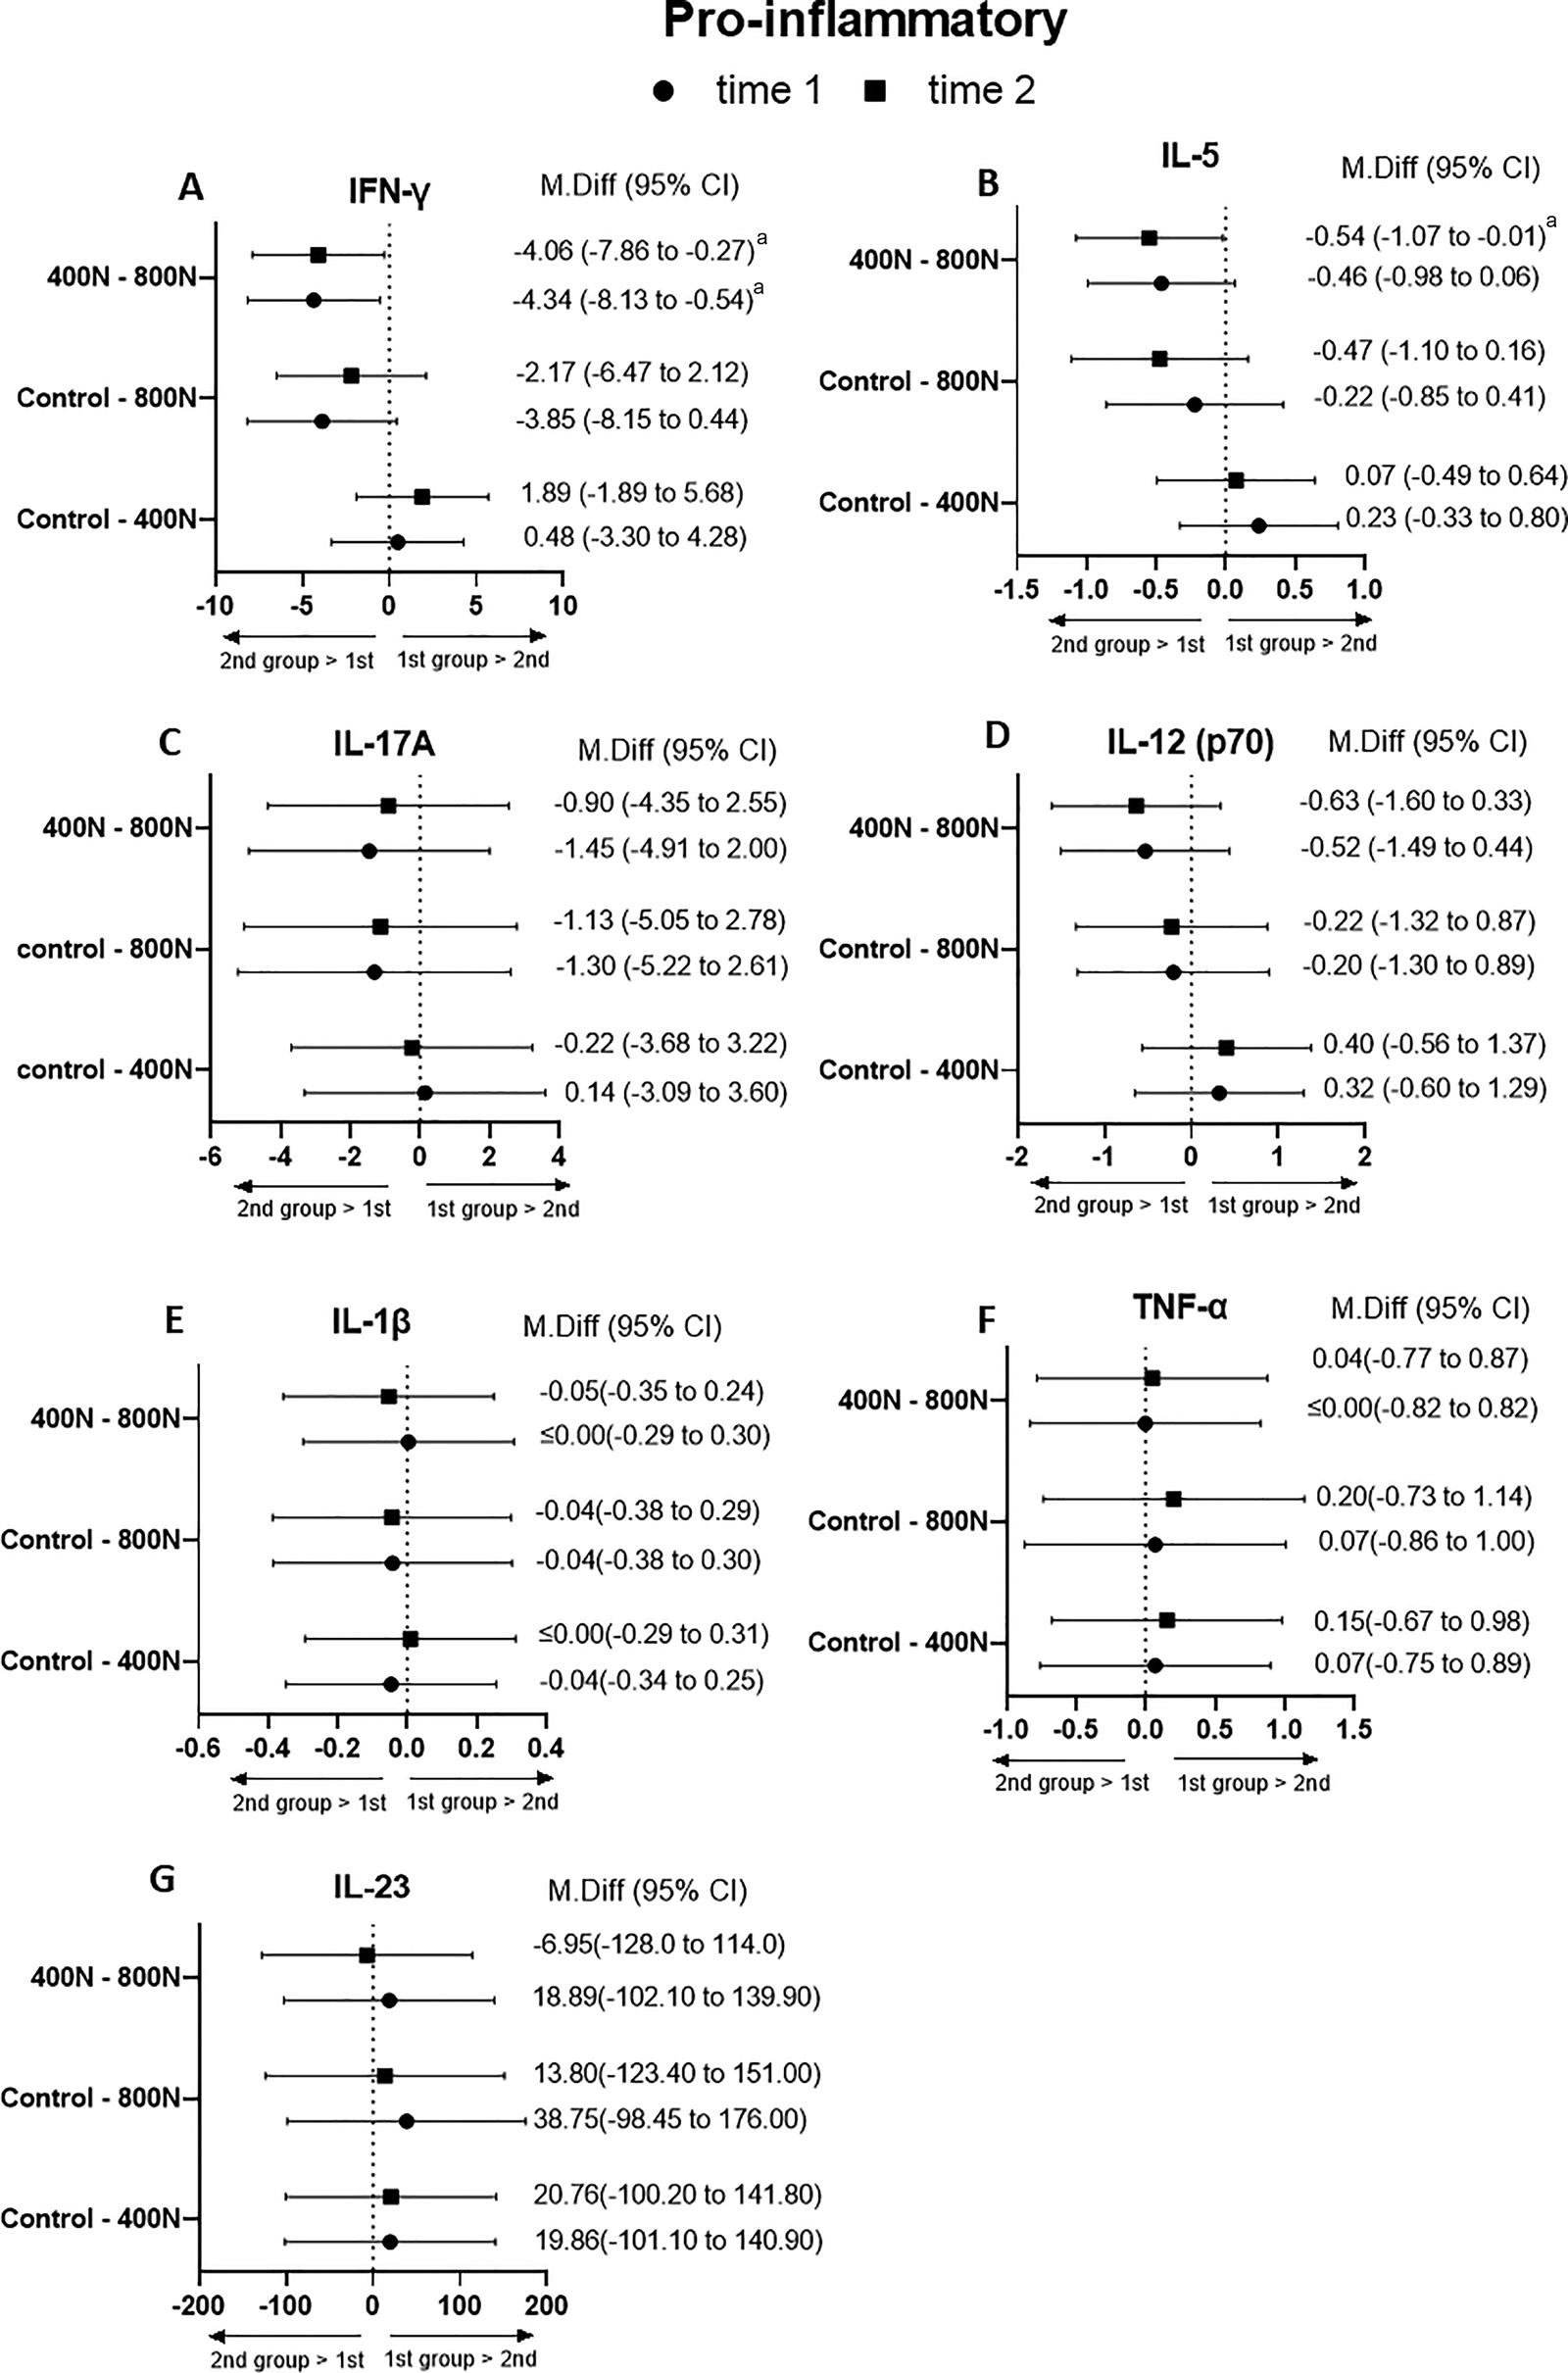
Fig. 4 musculoskeletal pain.44 Vascular endothelial cells contain mechanosensory complexes, which rapidly react to changes in mechanical loading, process the signal, and develop context-specific adaptative responses to rebalance the cell homeostatic state.45 Mechanical strain applied via the endothelial cell-substrate upregulates a spectrum of secreted bioactive molecules.45 Theoretically, bioactive molecules would then dissipate from the site of stimulus into the bloodstream. In this context, we can speculate that changes seen in the vascular bed in the present study may be related to changes in the biomechanical characteristic of the SMT, which may be driving a neuroimmune response and subsequent cytokine secretion. Unfortunately, with our study design, it is not possible to test which cell type (immune or non-immune) is altering systemic cytokines after the intervention. Further investigation is warranted to characterize the mechanisms, cell types, and cellular responses related to the force-magnitude of SMT.
Fig.4. Differencebetweenmeanscoresand95%confidenceinterval(CI)betweeninterventions(controlversus400N,controlversus 800N,400Nversus800N)attime1(t1)andtime2(t2)onplasmaanti-inflammatory,dualfunction,chemokine,andgrowthfactorcytokines.(A-C)Anti-inflammatorycytokines.(D-E)Dualrolecytokines.(F)Chemokineand(G)growthfactor.Footnotesdenotethestatisticaldifferencebetweengroupsatagiventimepoint. aP ≤ .05.Tukey’smultiplecomparisonanalysis.CI,confidenceinterval.
Difference between mean scores and 95% confidence interval (CI) between interventions (control versus 400N, control versus 800N, 400N versus 800N) at time 1 (t1) and time 2 (t2) on plasma anti-inflammatory, dual function, chemokine, and growth factor cytokines. (A-C) Anti-inflammatory cytokines. (D-E) Dual role cytokines. (F) Chemokine and (G) growth factor. Footnotes denote the statistical difference between groups at a given time point. aP ≤ .05. Tukey’s multiple comparison analysis. CI, confidence interval.
Our experiment also showed that despite the lack of statistical significance (likely due to the small sample size and inter-individual variability), some cytokines presented similar (qualitative) profiles related to the given intervention (control, 400N, or 800N) (Fig. 1-4). Consistent with the overall change pattern of the pro-inflammatory IFN-γ (800N—increase; 400N—decrease; control— decrease) compared to baseline, other pro-inflammatory cytokines, such as IL-5, IL-12p70, and IL-17A and dual role cytokines (IL-2 and IL-6), had a similar pattern of changes that may likely be driven by interventions. Interestingly, these cytokines were moderate to strongly correlated with IFN-γ. This provides some support for the speculative hypothesis of a specific SMTdriven effect on both the magnitude and direction of the change of these putative cytokines, at least in the short-term experimental window of the present study.
Lending support to this hypothesis, previous evidence demonstrated that different mechanical stress-strain stimuli (based on different loads and lengths of stimulation) were capable of inducing differential responses in cytokine and growth factor secretions of a bioengineered tendon.46 In addition, varying mechanical load magnitude, frequency, and amplitude trigger distinct adaptation on circulatory monocyte attraction pattern and their tissue differentiation to polarized macrophages (M1 pro-inflammatory and/or M2 anti-inflammatory).41,47 Therefore, specific biomechanical characteristics of SMT may determine the phenotype of cytokine response. Future studies are needed to address how specific these changes are related to SMT and whether the pattern of observed changes of each intervention may have clinical implications.
Our findings also pointed out that no clear distinction between control and 400N groups was observed on the biomarkers measured in this study. For example, 6 out of 7 pro-inflammatory cytokines were decreased from baseline in both 400N and control groups (Fig. 1A-1G). We may speculate that similarities between these 2 groups may be driven by the preload force (~200N), which is likely half of the total peak force of the 400N group. Despite this observation, the magnitude of the decrease after the 400N SMT was likely larger, at least in some of the cytokines, compared to the control group. This difference may be due to the thrust phase. However, no statistical difference between these 2 groups was observed in any of the cytokines to support this assumption. Owing to our study characteristics (preliminary observation), further investigation is needed to clarify the possible distinction effects between the 400N SMT and control intervention on plasma cytokines.
Limitations
Although we used a high sensitivity method to measure plasma cytokine concentrations, the short half-life, interaction with biological inhibitors, and protein binding in the circulatory system may limit their quantification.37,48 It is known that technical variability, such as commercial kits, using serum versus plasma, using different anticoagulants (citrate, heparin, EDTA), freezing-thawing cycles, assay methods (enzyme-linked immunosorbent assay, beadbase multiplex), are important limitations to consider when establishing normal reference range and cut-off values of blood cytokines for clinical diagnosis utility.35,37,38 Despite these limitations, putative cytokine changes in response to distinct SMT force magnitudes might aid in the identification of potential objective biomarker candidates of treatment response and thereby lend clinical utility.
Our intended target sample size of 11 participants per group could not be reached due to the COVID-19 pandemic. Due to the small sample size, the probability of type I and type II error is increased. To minimize the chances of these errors and protect the data from spurious results we conducted 2-way repeated-measures ANOVA and Tukey’s multiple comparison test instead of multiple t tests and other less rigorous multiple comparison tests. Nonetheless, despite the novelty of our preliminary findings, studies with a larger sample size are needed, and prudent interpretation of our results is recommended.
Instead of a clinical population, this study was conducted in young, healthy adults. Here, we aimed to study a homogenous sample (young, healthy adults) to minimize the variability to provide proof-of-principle evidence. Our recent systematic review and meta-analysis demonstrated that blood cytokine concentration is highly variable, even with a population with the same diagnosis.48 As a result, targeting young, healthy adults enables us to better observe the effects of distinct SMT force magnitudes on systemic putative biomarkers without the interference of underlying pathology that may likely be interfering in the cytokine milieu. Therefore, studying healthy young asymptomatic samples is an important first step that aids to establish a baseline response on blood cytokines in distinct SMT force magnitudes.
Another limitation of our study is that we only assessed the short-term changes in plasma cytokines. Previous evidence demonstrated that while treatment frequency did not significantly affect clinical outcomes during and following the P-A SMT treatment period, the dosage (force and speed) influenced short-term physiological responses to SMT treatment.4 Therefore, further studies are required to determine the temporal effects of multiple SMT—for example, over the course of several weeks of treatment— on blood cytokines.
Lastly, this study focused on SMT force magnitude, which was defined as the total peak force of the SMT. Other forcetime characteristics of SMT, such as force rate, were not controlled. Future studies are needed to investigate how modulation of other biomechanical characteristics of the SMT may impact systemic cytokines.
Future Studies
Our preliminary findings are valuable for future research studying the mechanisms of SMT and provide a healthy baseline group with which to compare similar studies in clinical populations. However, the clinical value and implication of our preliminary findings require further work specially in clinical presentations of altered nociception processing that may be partly or fully explained by an altered inflammatory milieu.
Conclusion
This study demonstrated that a selection of blood inflammatory biomarkers was affected by distinct SMT force magnitudes. The authors observed IFN-γ , IL-5, and IL-6 were elevated by higher SMT force (800N) compared to lower SMT force (400N). Our present findings aid to advance our understanding of the potential relationship between SMT force magnitude and blood cytokines, a step towards precision medicine.
Acknowledgments
We thank Isabella Magnani and Steven Tran for their technical support provided during data collection and data analysis.
Funding Sources and Conflicts of Interest
This research project was funded by the Internal Research Support Fund at Canadian Memorial Chiropractic College. No conflicts of interest were reported for this study.
Contributorship Information
Concept development (provided idea for the research):
F.C.K.D., M.F., S.I.
Design (planned the methods to generate the results):
F.C.K.D., M.F., S.I., D.S.
Supervision (provided oversight, responsible for organization and implementation, writing of the manuscript):
F.C.K.D., M.F., S.I., D.S.
Data collection/processing (responsible for experiments, patient management, organization, or reporting data):
F.C.K.D., D.S.
Analysis/interpretation (responsible for statistical analysis, evaluation, and presentation of the results):
F.C.K.D., W.A.P., D.W.D.W.
Literature search (performed the literature search):
F.C.K.D., W.A.P., M.F.
Writing (responsible for writing a substantive part of the manuscript):
F.C.K.D., M.F., W.A.P., D.W.D.W., D.A.K.
Critical review (revised manuscript for intellectual content, this does not relate to spelling and grammar checking):
W.A.P., D.W.D.W., D.A.K., S.I.
Practical Applications
• This study found that select plasma proinflammatory and dual-role cytokines were elevated by higher compared to lower thoracic SMT force in healthy young adults.
• Present findings aid to advance our understanding of the implication of SMT force magnitude on blood inflammatory biomarkers.
• These biomarkers can be routinely measured and monitored and hold the potential to be used to objectively measure the response to interventions in conditions where inflammation plays a role, such as nociceptive, neuropathic, and nociplastic pain disorders.
• The clinical implication of this study is unknown since the clinical effectiveness of SMT may be or not be related to the force magnitude of the SMT or changes reflected in circulating inflammatory markers.
References
1. Beliveau PJH, Wong JJ, Sutton DA, et al. The chiropractic profession: a scoping review of utilization rates, reasons for seeking care, patient profiles, and care provided. Chiropr Man Therap. 2017;25:35.
2. Starmer DJ, Guist BP, Tuff TR, Warren SC, Williams MGR. Changes in manipulative peak force modulation and time to peak thrust among first-year chiropractic students following a 12-week detraining period. J Manipulative Physiol Ther. 2016;39(4):311-317.
3. Nougarou F, Page I, Loranger M, Dugas C, Descarreaux M. Neuromechanical response to spinal manipulation therapy: effects of a constant rate of force application. BMC Complement Altern Med. 2016;16:161.
4. Pasquier M, Daneau C, Marchand A-A, Lardon A, Descarreaux M. Spinal manipulation frequency and dosage effects on clinical and physiological outcomes: a scoping review. Chiropr Man Therap. 2019;27(1):23.
5. Lima CR, Martins DF, Reed WR. Physiological responses induced by manual therapy in animal models : a scoping review. Front Neurosci. 2020;14:430.
6. Colloca CJ, Keller TS, Harrison DE, Moore RJ, Gunzburg R, Harrison DD. Spinal manipulation force and duration affect vertebral movement and neuromuscular responses. Clin Biomech. 2006;21(3):254-262.
7. Funabashi M, Nougarou F, Descarreaux M, Prasad N, Kawchuk G. Influence of spinal manipulative therapy force magnitude and application site on spinal tissue loading: a biomechanical robotic serial dissection study in porcine motion segments. J Manipulative Physiol Ther. 2017;40 (6):387-396.
8. Zhang J-M, An J. Cytokines, Inflammation and pain. Int Anesth Clin. 2007;45(2):27-37.
9. Gonçalves dos Santos G, Delay L, Yaksh TL, Corr M. Neuraxial cytokines in pain states. Front Immunol. 2020;10:3061.
10. Teodorczyk-Injeyan JA, Triano JJ, Injeyan HS. Nonspecific low back pain: inflammatory profiles of patients with acute and chronic pain. Clin J Pain. 2019;35(10):818-825.
11. Duarte FCK, West DWD, Linde LD, Hassan S, Kumbhare DA. Re-examining myofascial pain syndrome : toward biomarker development and mechanism-based diagnostic criteria. Curr Rheumatol Rep. 2021;23(8):69.
12. Bäckryd E, Tanum L, Lind A, Larsson A, Gordh T. Evidence of both systemic inflammation and neuroinflammation in fibromyalgia patients, as assessed by a multiplex protein panel applied to the cerebrospinal fluid and to plasma. J Pain Res. 2017;10:515-525.
13. Carp SJ, Barbe MF, Winter KA, Amin M, Barr AE. Inflammatory biomarkers increase with severity of upper-extremity overuse disorders. Clin Sci. 2007;112(5):305-314.
14. Califf RM. Biomarker definitions and their applications. Exp Biol Med. 2018;243(3):213-221.
15. d’Agostino MC, Craig K, Tibalt E, Respizzi S. Shock wave as biological therapeutic tool: From mechanical stimulation to recovery and healing, through mechanotransduction. Int J Surg. 2015;24(Pt B):147153.
16. 16. Wong VW, Paterno J, Sorkin M, et al. Mechanical force prolongs acute inflammation via T-cell- dependent pathways during scar formation. FASEB J. 2011;25(12):4498-4510.
17. Waters-banker C, Dupont-versteegden EE, Kitzman PH, Butterfield TA. Investigating the mechanisms of massage efficacy: the role of mechanical immunomodulation. J Athl Train. 2014;49(2):266-273.
18. Huang C, Holfeld J, Schaden W, Orgill D, Ogawa R. Mechanotherapy: revisiting physical therapy and recruiting mechanobiology for a new era in medicine. Trends Mol Med. 2013;19(9):555-564.
19. Waters-Banker C, Butterfield TA, Dupont-Versteegden EE. Immunomodulatory effects of massage on nonperturbed skeletal muscle in rats. J Appl Physiol. 2014;116(2):164-175.
20. Butterfield TA, Best TM, Merrick MA. The dual roles of neutrophils and macrophages in inflammation: a critical balance between tissue damage and repair. J Athl Train. 2006;41 (4):457-465.
21. Butterfield TA, Zhao Y, Agarwal S, Haq F, Best TM. Cyclic compressive loading facilitates recovery after eccentric exercise. Med Sci Sport Exerc. 2008;40(7):1289-1296.
22. Kolberg C, Horst A, Moraes MS, et al. Peripheral oxidative stress blood markers in patients with chronic back or neck pain treated with high-velocity, lowamplitude manipulation. J Manipulative Physiol Ther. 2015;38(2):119-129.
23. Teodorczyk-injeyan JA, Triano JJ, Gringmuth R, Degraauw C, Chow A, Injeyan HS. Effects of spinal manipulative therapy on inflammatory mediators in patients with non-specific low back pain: a nonrandomized controlled clinical trial. Chiropr Man Therap. 2021;29(1):3.
24. da Silva FB, Santos MC, da Silva TC, et al. Spine adjusting instrument (Impulse) attenuates nociception and modulates oxidative stress markers in the spinal cord and sciatic nerve of a rat model of neuropathic pain. Pain Med. 2021;23(4):761-773.
25. Duarte FCK, Kolberg C, Riffel APK, Souza JA, BelloKlein A, Partata WA. Spinal manipulation therapy improves tactile allodynia and peripheral nerve functionality and modulates blood oxidative stress markers in rats exposed to knee-joint immobilization.
J Manipulative Physiol Ther. 2019;42(6):385-398.
26. Brennan PC, Kokjohn K, Kaltinger JC, et al. Enhanced phagocytic cell respiratory burst induced by spinal manipulation: potential role of substance P. J Manipulative Physiol Ther. 1991;14(7):399-408.
27. Brennan PC, Triano JJ, McGregor M, Kokjohn K, Hondras MA, Brennan DC. Enhanced neutrophil respiratory burst as a biological marker for manipulation forces: duration of the effect and association with substance P and tumor necrosis factor. J Manipulative Physiol Ther. 1992;15(2):83-89.
28. Molina-Ortega F, Lomas-Vega R, Hita-Contreras F, et al. Immediate effects of spinal manipulation on nitric oxide, substance P and pain perception. Man Ther. 2014;19(5):411-417.
29. Rogers CM, Triano JJ. Biomechanical measure validation for spinal manipulation in clinical settings. J Manipulative Physiol Ther. 2003;26(9):539-548.
30. Herzog W. The biomechanics of spinal manipulation. J Bodyw Mov Ther. 2010;14(3):280-286.
31. Karsten E, Breen E, Herbert BR. Red blood cells are dynamic reservoirs of cytokines. Sci Rep. 2018;8(1):3101.
32. Rosenberg-Hasson Y, Hansmann L, Liedtke M, Herschmann I, Maecker HT. Effects of serum and plasma matrices on multiplex immunoassays. Immunol Res. 2014;58(2-3):224-233.
33. Vickers AJ, Altman DG. Analysing controlled trials with baseline and follow up measurements. Br Med J. 2001;323 (7321):1123-1124.
34. Mukaka MM. Statistics corner: a guide to appropriate use of correlation coefficient in medical research. Malawi Med J. 2012;24(3):69-71.
35. Jackman RP, Utter GH, Heitman JW, et al. Effects of blood sample age at time of separation on measured cytokine concentrations in human plasma. Clin Vaccine Immunol. 2011;18(2):318-326.
36. Bender DE, Schaettler MO, Sheehan KCF, Johanns TM, Dunn GP. Cytokine profiling in plasma from patients with brain tumors versus healthy individuals using 2 different multiplex immunoassay platforms. Biomark Insights. 2021;16: 11772719211006666.
37. Chaturvedi AK, Kemp TJ, Pfeiffer RM, et al. Evaluation of multiplexed cytokine and inflammation marker measurements: A methodologic study. Cancer Epidemiol Biomarkers Prev. 2011;20(9):1902-1911.
38. Günther A, Becker M, Göpfert J, Joos T, SchneiderhanMarra N. Comparison of bead-based fluorescence versus planar electrochemiluminescence multiplex immunoassays for measuring cytokines in human plasma. Front Immunol. 2020;11: 572634.
39. Zhang L, Hu X, Li X, et al. Potential chemokine biomarkers associated with PTSD onset, risk and resilience as well as stress responses in US military service members. Transl Psychiatry. 2020;10(1):31.
40. Woodcock T, Morganti-Kossmann MC. The role of markers of inflammation in traumatic brain injury. Front Neurol. 2013;4:18.
41. Adams S, Wuescher LM, Worth R, Yildirim-Ayan E. Mechano-immunomodulation: mechanoresponsive changes in macrophage activity and polarization. Ann Biomed Eng. 2019;47(11):2213-2231.
42. Perl M, Gebhard F, Knöferl MW, et al. The pattern of preformed cytokines in tissues frequently affected by blunt trauma. Shock. 2003;19(4):299-304.
43. Lamparello AJ, Namas RA, Billiar TR. Young and aged blunt trauma patients display major differences in circulating inflammatory mediator profiles after severe injury. J Am Coll Surg. 2018;228(2):148-160.e7.
44. Rodrigues PTV, Corrêa LA, Reis FJJ, Meziat-Filho NA, Silva BM, Nogueira LAC. One session of spinal manipulation improves the cardiac autonomic control in patients with musculoskeletal pain: a randomized placebo-controlled trial. Spine (Phila Pa 1976). 2021;46(14):915-922.
45. Fang Y, Wu D, Birukov KG. Mechanosensing and mechanoregulation of endothelial cell functions. Compr Physiol. 2019;9(2):873-904.
46. Cao T V, Hicks MR, Campbell D, Standley PR. Dosed myofascial release in three-dimensional bioengineered tendons: effects on human fibroblast hyperplasia, hypertrophy, and cytokine secretion. J Manipulative Physiol Ther. 2013;36 (8):513-521.
47. Zheng W, Li X, Li J, et al. Mechanical loading mitigates osteoarthritis symptoms by regulating the inflammatory microenvironment. SSRN Electron J. 2021. https://doi.org/10.2139/ ssrn.3866409. Online ahead of print.
48. Kumbhare D, Hassan S, Diep D, et al. Potential role of blood biomarkers in fibromyalgia patients: a systematic review with meta-analysis. Pain. 2021. https://doi.org/10.1097/j.pain.0000000000002510. Online ahead of print.
OriginallypublishedintheJournalofManipulativeand PhysiologicalTherapeutics.2022Jan;45(1):20-32.Epub 2022 Jun 25
ReproducedwithpermissionfromElsevier
Access Online:https://doi.org/10.1016/j.jmpt.2022.03.012
