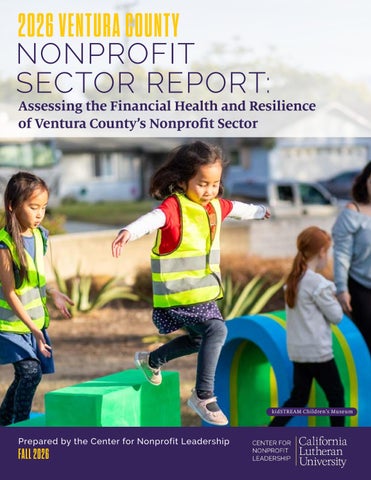
2026 VENTURA COUNTY
NONPROFIT SECTOR REPORT:
Assessing the Financial Health and Resilience of Ventura County’s Nonprofit Sector
kidSTREAM Children’s Museum
Prepared by the Center for Nonprofit Leadership
FALL 2026 2026 Ventura County Nonprofit Sector Report
1
2
2026 Ventura County Nonprofit Sector Report
2026 Ventura County Nonprofit Sector Report
3
4
2026 Ventura County Nonprofit Sector Report
2026 Ventura County Nonprofit Sector Report
5
Table of Contents
6
Page
Topics
07
Introduction
08
Why We Wrote This Report
10
Background & Purpose
12
Methodology
14
Executive Summary
19
Detailed Findings
22
1. Philanthropic Investment
26
2. Workforce
30
3. Sector Foundation
34
4. Sector Capacity
38
5. Liquidity
41
6. Stability (Deficit Rate)
44
7. Revenue Diversification
47
8. Momentum
2026 Ventura County Nonprofit Sector Report
Introduction
Boys & Girls Club of Camarillo 2026 Ventura County Nonprofit Sector Report
7
Why We Wrote This Report Every worthwhile project begins with a question. Our question was surprisingly simple: How financially healthy is Ventura County’s nonprofit
sector? The answer proved more challenging than initially expected—and that realization became the motivation for creating this report. Ventura County’s nonprofit organizations strengthen our community in countless ways. They care for each of us, our families, and our neighbors. They enrich our quality of life, and help make Ventura County a place where people can thrive. Their success is measured in lives changed and communities strengthened. Yet every mission, no matter how inspiring, depends upon a strong financial foundation. Sustainable funding is not the mission—it is what makes the mission possible. We wrote this report because we believe the financial condition of the nonprofit sector is itself a community asset. A financially healthy sector has the capacity to attract talented people, invest in innovation, respond to emerging needs, and remain resilient and responsive during difficult times. A financially fragile sector must focus on survival rather than opportunity. Understanding how resources flow into, through, and across the sector is therefore not an accounting exercise; it is a way of understanding our community’s capacity to serve, adapt, and prosper. Our purpose is not to rank organizations or reduce their work to financial statistics. Rather, it is to move the conversation beyond anecdotes toward consistent, longitudinal evidence. Better information leads to better conversations. Better conversations lead to better decisions. And better decisions strengthen the organizations that strengthen Ventura County. No single measure can capture nonprofit health. Just as a physician considers multiple vital signs, this report brings together eight complementary dimensions to provide a balanced view of the sector’s financial well-being. We rely on historical IRS data because audited history reveals the structural trends that short-term snapshots often miss. The data come from Candid, the nation’s leading source of nonprofit information. Candid collects, standardizes, and curates IRS filings and other nonprofit data for millions of 501(c) (3) organizations, creating one of the world’s most comprehensive and trusted nonprofit databases. Its consistent methodology, national scope, and long historical record make meaningful comparisons possible across organizations, communities, states, and years.
8
2026 Ventura County Nonprofit Sector Report
Why We Wrote This Report (Cont’d) This report also reflects the mission of the Center for Nonprofit Leadership (CNL). By combining objective analysis with the Center’s commitment to strengthening nonprofit leadership, we hope to provide nonprofit executives, board members, funders, policymakers, and community partners with knowledge that supports wiser decisions and stronger collaboration. The report builds upon the biennial State of the Region report produced by the Ventura County Civic Alliance, diving deeper into the questions that emerge from that body of research. This report was made possible, in part, through the generous financial support of the Ventura County Community Foundation’s William A. & Cynthia D. Fairburn, Jr. Memorial Fund, along with the valued thought partnership and financial underwriting provided by Candid. Together, these investments help equip our community with knowledge and insight that strengthen the nonprofit sector while inspiring greater generosity and more informed philanthropy. We will consider this report successful if it becomes more than something people read. We hope it encourages better questions, informs philanthropy and public policy, helps organizations benchmark their progress, identifies emerging risks sooner, celebrates the sector’s strengths, and establishes a trusted baseline that improves year after year. No index can fully capture the complexity of Ventura County’s nonprofit community, and no methodology is perfect. We offer this report with humility—not as the final word, but as a foundation for learning, discussion, and action. If it helps our community make wiser decisions and build a stronger, more resilient nonprofit sector, it will have achieved exactly what we hoped.
Stephen Goodall Former Trustee of Candid Former CEO of J.D. Power
2026 Ventura County Nonprofit Sector Report
Dena Jenson Executive Director, Center for Nonprofit Leadership at California Lutheran University
9
Background & Purpose Why This Report Matters for Ventura County Ventura County is served by a vast network of nonprofit organizations that together form one of the region’s most important—yet least visible—pillars of community well-being. In 2024, these organizations generated more than $3.6 billion in economic activity, representing approximately 5% of Ventura County’s gross domestic product (GDP). Beyond delivering essential services that touch nearly every resident, the financial health of the nonprofit sector is closely intertwined with the strength and resilience of the county’s overall economy. Yet while nonprofits are asked to do more than ever, there is remarkably little shared, system-level understanding of the financial condition of the sector that delivers these services. Individual organizations report their results. Funders assess the nonprofits they support. But the community rarely steps back to ask a larger question: How financially healthy is Ventura County’s nonprofit sector as a whole — and is it becoming stronger or more fragile over time? This report is designed to answer that question.
Why Financial Health Matters Nonprofit financial health is not an abstract accounting concept. It directly affects the community’s ability to respond to need, adapt to change, and withstand shocks. A financially healthy nonprofit sector: • Has enough capital to meet growing demand • Can attract and retain qualified staff
• •
Can absorb economic downturns and natural disasters Can invest in innovation and long-term solutions
A financially fragile sector, by contrast, may be forced to cut services, defer investments, or close programs precisely when the community needs them most.
In recent years, Ventura County nonprofits have operated in an increasingly complex and uncertain environment. Rising housing costs and workforce shortages, natural disasters, public health emergencies, shifting government and philanthropic funding, rapid technological advances, evolving regulatory requirements, and broader social and economic change have placed new demands on the sector. Understanding whether the nonprofit ecosystem is becoming more resilient or more strained is therefore essential for anyone who cares about the region’s future.
The Purpose of This Report The Center for Nonprofit Leadership (CNL) at California Lutheran University created this report to provide Ventura County with a clear, credible, and data-driven picture of nonprofit sector financial health. Specifically, this report seeks to: • Establish a baseline for how strong and resilient Ventura County’s nonprofit sector is today • Track change over time, so trends — both positive and negative — become visible • Identify structural strengths and weaknesses that are not apparent from individual organizations alone • Support better decision-making by funders, nonprofit leaders, and policymakers • Encourage more strategic investment in the long-term sustainability of the sector This is not a ranking of organizations. It is a system-level diagnostic — a way to see how the ecosystem that supports Ventura County residents is performing as a whole.
10
2026 Ventura County Nonprofit Sector Report
Background & Purpose (Cont’d) Why a Sector-Wide Index Is Needed Most nonprofit reporting focuses on individual organizations. That is necessary — but it is not sufficient. A healthy community requires a healthy nonprofit ecosystem. It includes: • a balanced mix of small, mid-sized, and large organizations; • diversified and reliable funding streams; • adequate cash reserves; • a stable, well-compensated workforce; • collaborative systems that streamline administration, share best practices, and improve community outcomes; and • sufficient overall scale to meet community needs. Weaknesses become visible when data are aggregated across the sector. Its omission weakens the explanation for why the index is needed.
Mesa
This report brings together financial and workforce data from hundreds of Ventura County nonprofits and translates them into a unified Nonprofit Financial Health Index — a tool that allows the community to understand not just how nonprofits are doing, but how the system they collectively create is evolving.
How This Report Should Be Used The goal of this report is not to declare winners or losers. It is to spark informed conversation and coordinated action. For funders, it provides insight into where capital is most needed and how funding strategies can strengthen sector resilience. For nonprofit leaders, it offers context for understanding their own challenges and opportunities. For policymakers, it highlights the nonprofit sector as essential community infrastructure that merits attention and support. Most importantly, it creates a shared factual foundation for Ventura County to ask better questions about how to sustain the organizations that sustain our communities. 2026 Ventura County Nonprofit Sector Report
11
Methodology How the Nonprofit Financial Health Index Works The Ventura County Nonprofit Sector Financial Health Index is designed to provide a clear, objective picture of how strong, stable, and resilient the county’s nonprofit ecosystem is over time. Rather than relying on a single financial statistic, the Index combines 20 distinct financial and operating metrics across eight dimensions of nonprofit health: The dimensions are organized to reflect a natural cause-and-effect chain in nonprofit financial health: 1. Philanthropic Investment represents the flow of philanthropic capital into the sector. 2. Workforce captures the sector’s ability to attract and retain the people who deliver services. 3. Sector Foundation reflects long-term structure and scale of the nonprofit ecosystem. 4. Sector Capacity reflects the sector’s ability to translate its people, organizations, and resources into effective services and community impact. 5. Liquidity reflects how much financial runway organizations have to absorb shocks. 6. Stability measures whether that growth is financially sustainable. 7. Revenue Diversification measures exposure to funding risk. 8. Momentum shows whether nonprofits are growing or shrinking in response to community needs. This sequence moves from external resources, to organizational performance, to long-term system capacity, helping readers understand not just how healthy the sector is, but why.
How Scoring Works Each of the 20 metrics is scored on a five-point scale: Score Meaning: When adding together the scores across all 20 metrics, the minimum possible score is 20. 1. 2. 3. 4. 5.
Distressed — serious weakness and elevated risk Fragile — functioning but vulnerable to stress Stable but uneven — the core is intact, but important weaknesses remain Strong — healthy, resilient performance Very Strong — high-performing and well-positioned
Ventura County’s performance on each metric is compared to appropriate benchmarks (typically California or national data) and assigned a score based on where it falls within the distribution. Each metric contributes equally to the overall Index.
How the Overall Index Is Calculated There are 20 metrics, each scored from 1 to 5. When adding together the scores across all 20 metrics, the minimum possible score is 20. The maximum possible score is 100. The Nonprofit Financial Health Index is the sum of all 20 metric scores. This produces an intuitive 100-pointstyle index with an actual range of 20 to 100.
12
Santa Paula Art Museum 2026 Ventura County Nonprofit Sector Report
Methodology (Cont’d) How To Interpret the Index The full possible range of scores (20 to 100) is divided into five bands: Index Score <30 30 - 49 50 - 69 70 - 89 90 - 100
Characterization Distressed Fragile Stable (but uneven) Strong Very Strong
What the Index Is Designed to Do The Index does not evaluate individual nonprofits. It measures the overall financial health of the nonprofit ecosystem serving Ventura County residents. It answers one central question:
How resilient is Ventura County’s nonprofit sector, and how is that changing over time? Food Share Ventura County
Data Sources This report analyzes Ventura County nonprofit financial data for the years 2019 through 2024. All financial data presented in this report are drawn from Candid.org, the leading nonprofit data and research organization in the United States. Candid was formed through the merger of GuideStar and the Foundation Center and serves as the primary national repository of nonprofit financial and organizational information. Its database is built primarily from IRS Form 990 filings, which nonprofit organizations are required to submit annually. Because these data are derived from federal tax filings, there is an inherent time lag between an organization’s financial activity and when those data become publicly available. In practice, this means that financial data for the most recent year may be incomplete or unavailable at the time of analysis. As a result, this report emphasizes multiyear trends (2019–2024) rather than short-term fluctuations, and it should be understood that figures for the most recent year may be revised as additional filings are processed. Data for 2024 represents approximately 90% of the total tax filings expected for the year. To provide a timely assessment of the nonprofit sector’s financial health, estimates have been developed from the data currently available. These estimates are intended to provide a directionally reliable view of sector trends and will be updated as additional tax filings are received. All workforce-related indicators in the report—including employment levels, wages, and nonprofit share of the local labor force—are sourced from the Ventura County Civic Alliance’s 2019, 2021, 2023 and 2025 State of the Region (SOTR) reports. These reports draw on government labor statistics and regional economic data to provide a standardized view of workforce conditions across Ventura County and comparable regions. 2026 Ventura County Nonprofit Sector Report
13
Executive Summary
14
Reel Guppy Outdoors 2026 Ventura County Nonprofit Sector Report
Executive Summary (Cont’d) A Strong Foundation. An Underpowered System. Ventura County’s nonprofit sector plays an indispensable role in the well-being of our communities. Every day, nonprofit organizations provide housing, health care, food assistance, education, arts and culture, environmental stewardship, disaster response, and countless other services that improve the quality of life for Ventura County residents. Collectively, they also represent a major economic force, generating more than $3.6 billion in annual economic activity—approximately 5% of Ventura County’s gross domestic product. The nonprofit sector is not only a cornerstone of community well-being; it is an essential component of the county’s economic vitality. This report provides the first comprehensive, system-level assessment of the financial health of Ventura County’s nonprofit ecosystem. Drawing on financial and workforce data from across the sector, the Ventura County Nonprofit Sector Financial Health Index examines whether the nonprofit system has the financial capacity not only to meet today’s needs, but also to adapt, invest, and remain resilient in the years ahead. The findings tell an encouraging—but cautionary—story.
Ventura County’s nonprofit sector is fundamentally capable, but it is operating well below its potential. The organizations are serving their communities. Services continue to be delivered. The nonprofit ecosystem in Ventura County is well-developed and increasingly mature. Yet the financial resources flowing through that system have not kept pace with the demands placed upon it. In short, the pipes exist, but the water pressure is low. As a result, nonprofits are increasingly being asked to accomplish more with less. The sector is not experiencing an immediate financial crisis. Most organizations continue to meet their short-term obligations, and the county’s nonprofit infrastructure remains strong. At the same time, persistent operating deficits, chronic undercapitalization, and limited philanthropic investment are steadily reducing the sector’s ability to build reserves, invest in people and infrastructure, and respond to future challenges. In short, Ventura County does not lack capable nonprofit organizations. It lacks sufficient financial investment to fully realize the potential of the organizations it already has.
Casa Pacifica Centers for Children and Families 2026 Ventura County Nonprofit Sector Report
15
Executive Summary The Big Picture: Temporary Gains, Lasting Challenges The Ventura County Nonprofit Sector Financial Health Index reveals a distinct pattern over the six-year period(2019-2024). Between 2019 and 2021, the sector experienced meaningful improvement. Philanthropic giving, federal pandemic relief, and unprecedented community need combined to strengthen the region’s nonprofit finances, expand employment, and increase service delivery. The Index reached its highest level in 2021, reflecting the sector’s healthiest period in recent years. As pandemic-era funding and emergency programs came to an end, however, many of those gains began to recede. Overall financial health declined from its 2021 peak before stabilizing in 2023 and showing modest improvement in the estimated 2024 results. While the sector today remains healthier than it was before the pandemic, it has not sustained the exceptional gains achieved during that extraordinary period.
Viewed in hindsight, the Index reveals that the pandemic temporarily masked—not resolved— many of the nonprofit sector’s underlying financial challenges. Extraordinary philanthropy, federal relief programs, and several transformational Philanthropic Investments enabled organizations to expand services, strengthen their finances, and respond to unprecedented community need. As those temporary resources diminished, however, longstanding structural constraints began to reemerge, including limited sector capacity, uneven financial sustainability, and a level of philanthropic investment that has not kept pace with community need. These findings suggest that while the sector has demonstrated remarkable resilience, many of its most important financial challenges remain unresolved.
Where the Sector Is Most Constrained 1. Sector Capacity: The Sector Is Built to Deliver, But Not Fully Resourced
2. Financial Stability: Today’s Services Are Increasingly Being Financed with Tomorrow’s Resources
3. Philanthropic Investment: The County’s Philanthropic Base Remains Too Small and Too Concentrated
Ventura County has a healthy number of nonprofit organizations serving its residents and an increasingly strong foundation of scaled nonprofits capable of delivering services. Yet compared with California, the sector operates with substantially fewer financial resources per resident. Revenue, assets, and overall service capacity remain well below statewide norms, limiting nonprofits’ ability to expand programs, invest in technology and facilities, build financial reserves, and respond to emerging community needs.
Nearly half of Ventura County’s operating nonprofits now report annual operating deficits. While most organizations continue to serve their communities without interruption, persistent deficits gradually weaken financial resilience by reducing reserves, delaying investments, and limiting organizational flexibility. Left unaddressed, this pattern increases the risk that nonprofits will become less able to respond when community needs inevitably grow or unexpected challenges arise.
Despite meaningful growth during the pandemic, philanthropic investment in Ventura County remains well below comparable levels across California. The sector continues to rely on a relatively small number of major funders, while overall philanthropic investment has not kept pace with rising operating costs or growing demand for services. Expanding both the level and breadth of philanthropic support represents one of the clearest opportunities to strengthen the county’s nonprofit sector over the long term.
16
2026 Ventura County Nonprofit Sector Report
Executive Summary (Cont’d) Where the Sector Shows Strength 1. Sector Foundation: A Healthy Ecosystem Ready to Grow
2. Revenue Diversification: An Encouraging but Incomplete Trend
One of the report’s strongest findings is the overall health of Ventura County’s nonprofit ecosystem. The county has developed a balanced mix of small, mid-sized, and larger organizations, with an increasingly strong backbone of scaled nonprofits capable of delivering services across the community. Unlike many regions, Ventura County shows little evidence of a “missing middle,” suggesting that the organizational infrastructure needed to address community challenges is already in place.
Revenue diversification has shown modest improvement in recent years, suggesting that some nonprofits are becoming less dependent on a single category of funding. The share of organizations with diversified revenue increased from 46% in 2022 to an estimated 48% in 2024. However, this remains below the 50% observed before the pandemic, and more than half of Ventura County nonprofits still rely heavily on a single primary funding source. While the recent trend is encouraging, the findings suggest that revenue concentration remains a significant financial risk for much of the sector.
3. Workforce and Liquidity: Stability That Supports Continued Service Despite increasing financial pressures, Ventura County nonprofits have continued to expand employment over time and generally maintain sufficient liquidity to sustain day-to-day operations. Although workforce compensation and cash reserves remain areas requiring attention, these indicators suggest that most organizations continue to deliver essential services while managing an increasingly challenging operating environment. Taken together, these strengths present an important opportunity for Ventura County. The nonprofit sector already possesses many of the characteristics of a resilient ecosystem. The challenge is not rebuilding the sector, but strengthening its financial capacity so those existing strengths can translate into greater long-term resilience, innovation, and community impact.
Interface Children & Family Services 2026 Ventura County Nonprofit Sector Report
17
Executive Summary (Cont’d) Implications for Action The findings point to a shared responsibility for strengthening Ventura County’s nonprofit sector. While no single organization or institution can address every challenge identified in this report, nonprofit leaders, funders, and policymakers each have an important role to play in building a more resilient nonprofit ecosystem. For Nonprofit Leaders
For Funders and Philanthropy
For Policymakers
The findings reinforce the importance of managing not only for mission, but also for long-term financial resilience. As operating costs continue to rise and funding becomes more uncertain, strengthening balance sheets, building operating reserves, improving financial sustainability, and diversifying revenue sources become strategic priorities rather than administrative concerns. Organizations that invest in financial resilience will be better positioned to sustain services, attract talent, and respond to future community needs.
The data suggest that Ventura County’s greatest opportunity is not to create more nonprofit organizations, but to strengthen the organizations that already serve the community. Expanding philanthropic investment, increasing multiyear and unrestricted operating support, promoting crosssector collaboration, and investing in organizational capacity, technology, leadership development, and financial resilience can produce benefits that extend well beyond individual grants. Such investments strengthen the nonprofit ecosystem as a whole, enabling organizations to deliver greater and more sustainable community impact.
The report also underscores the nonprofit sector’s importance as essential community infrastructure and a significant contributor to Ventura County’s economy. Public policies that promote predictable funding, timely reimbursement, effective public-private partnerships, and strategic investment in nonprofit capacity can strengthen both the sector and the communities it serves. Supporting nonprofit financial health is not simply an investment in individual organizations—it is an investment in Ventura County’s long-term economic and social well-being.
Final Takeaway This report ultimately tells a hopeful story. Ventura County already possesses a nonprofit sector with the leadership, organizational foundation, and commitment necessary to meet many of the community’s most pressing needs. The opportunity now is to provide the financial resources that allow those organizations not simply to sustain today’s services, but to build the resilience, innovation, and capacity needed to meet tomorrow’s challenges. The future of Ventura County’s nonprofit sector will depend less on creating new organizations than on fully investing in the organizations—and the community infrastructure—that already exist.
18
United Parents 2026 Ventura County Nonprofit Sector Report
Detailed Findings
California Lutheran University, Michael DeTerra 2026 Ventura County Nonprofit Sector Report
19
Detailed Findings What Ventura County’s Nonprofit Financial Health Is Telling Us The Ventura County Nonprofit Sector Financial Health Index provides more than a single measure of sector performance. It offers a framework for understanding the forces shaping the financial health of the county’s nonprofit ecosystem and how they interact over time. Viewed as a whole, the findings tell a consistent story. Between 2019 and 2021, the sector became noticeably stronger. Extraordinary philanthropic support, federal relief funding, and heightened community need combined to increase financial resources, expand employment, and strengthen several key indicators. The Index reached its highest point in 2021, reflecting a period of unusual investment and growth. As those temporary sources of support began to recede, the picture changed. Overall financial health declined from its pandemic peak and has since declined and then showed modest estimated improvement. The estimated 2024 results suggest that Ventura County’s nonprofit sector continues to function effectively, but many of the gains realized during the pandemic have moderated as underlying structural challenges have re-emerged. Ventura County Nonprofit Sector Financial Health Index
House Farm Workers!
20
2026 Ventura County Nonprofit Sector Report
Detailed Findings (Cont’d) The eight dimensions of the Ventura County Nonprofit Sector Financial Health Index reveal that Ventura County’s nonprofit sector is neither uniformly strong nor uniformly weak. Rather, its financial health reflects a combination of important strengths, areas of stability, and significant vulnerabilities.
Ventura County Nonprofit Sector Performance Across Financial Health Dimensions
The county’s greatest strengths lie in the structure of the nonprofit ecosystem itself. The sector has developed a healthy mix of small, mid-sized, and larger organizations, with an increasingly strong backbone of scaled nonprofits capable of delivering services throughout the community. Revenue diversification has also improved, reducing many organizations’ dependence on a single funding source. Other dimensions suggest a sector that remains stable but requires continued attention. Workforce growth, while slowing from its pandemic pace, has remained positive, and most organizations continue to maintain sufficient liquidity to meet their short-term obligations. These strengths help explain why the sector continues to deliver essential services despite growing financial pressures.
Museum of Ventura County
2026 Ventura County Nonprofit Sector Report
21
1. Philanthropic Investment (Fragile) A Weak and Uneven Funding Base Philanthropic investment is one of the most important indicators of overall health because nearly every operating nonprofit in Ventura County relies on philanthropic support, accounting for approximately 28% of total nonprofit revenue each year. While philanthropic funding in Ventura County has grown in recent years — particularly during and following the pandemic — giving per capita within the county remains well below both California and national averages. In addition, Ventura County’s charitable funding is highly concentrated among a relatively small number of donors, with the leading contributors varying from year to year.
Implication: For funders and community foundations, this highlights a core leverage point: the system is undercapitalized at its root. Increasing total philanthropic investment — and directing more funding toward general operating support — is essential if the sector is to build resilience rather than simply manage scarcity. Ventura County Nonprofit Sector: 2024 Financial Health Dimensions
Ventura County Nonprofit Sector: Philanthropic Investment Metrics
TOArts
22
2026 Ventura County Nonprofit Sector Report
Philanthropic Investment Metrics Is Ventura County attracting enough philanthropic dollars, are those dollars growing over time, and are they diversified across funders (or concentrated among a few)?
Implication: Philanthropic investment is “risk capital” for the sector—supporting program growth, innovation, and the ability to respond to shocks. Persistently low giving levels constrain nonprofit capacity; highly concentrated giving increases volatility and vulnerability when a small number of funders change priorities. Metrics included: 1. Giving per capita (level) 2. Giving momentum (growth trend) 3. Funder concentration (reliance on top funders) Giving Per Capita– How much philanthropic funding flows to Ventura County nonprofits per resident? Why It Matters: Per-capita giving is an intuitive measure of whether the county’s nonprofit sector is being resourced in proportion to population. A sustained per-capita gap often shows up as under-capacity: thinner staffing, less ability to invest, and less resilience. Measurement: Total charitable funding in Ventura County divided by Ventura County population benchmarked vs. other regions Bottom Line for Ventura County: Ventura County’s percapita giving remains very low relative to benchmarks, despite improvement since 2019. Estimated giving was approximately $186 per resident in 2024, essentially flat with 2023 and still only about one-third of California and U.S. levels. This persistent gap likely constrains staffing, program scale, and longterm resilience.
2026 Ventura County Nonprofit Sector Report
Giving Per Capita
23
Philanthropic Investment Metrics (Cont’d) Giving Momentum– Is philanthropic funding for Ventura County nonprofits growing, and how strong is growth? Why It Matters: Momentum indicates whether philanthropy is keeping pace with rising costs, service demand, and the need for nonprofit investment. Strong momentum can be a leading indicator of improving sector capacity—especially if it persists. Measurement: Year-over-year (YoY) percent change in total charitable funding
Giving Momentum (YoY % Change in Funding)
Ventura County Community Foundation
Bottom Line for Ventura County: Ventura County experienced strong charitable giving growth from 2019 through 2022, including especially strong growth in 2021 during the height of the pandemic. Much of this increase appears to reflect the extraordinary philanthropic response of foundations and individual donors to an unprecedented period of community need. In addition, a few Ventura County nonprofits received one-time transformational grants between 2020 and 2022 that were unrelated to the pandemic, further boosting Philanthropic Investment. Giving momentum, however, softened in 2023 and remained essentially flat in 2024. As the extraordinary conditions and funding associated with the pandemic have subsided, Ventura County nonprofits will need to articulate compelling opportunities for philanthropic investment if they hope to sustain or expand recent giving levels. Otherwise, charitable giving across the county may gradually return toward its pre-pandemic trajectory.
24
Westminster Free Clinic
2026 Ventura County Nonprofit Sector Report
Philanthropic Investment Metrics (Cont’d) Funder Concentration– How concentrated is Ventura County philanthropic funding? Why It Matters: High concentration increases fragility. If a few major funders shift priorities, consolidate, or reduce giving, nonprofits may face sudden funding gaps. Lower concentration usually signals a healthier, more resilient funding ecosystem. Measurement: Top-five funder contributions divided by total foundation and public charity grants to Ventura County nonprofits, by year. Regional benchmark comparisons will be added in future editions of the report as comparable data become available. Funder Concentration (Top -5 Donor Share of Total Charitable Grants in Ventura Co.)*
Casa Pacifica Centers for Children and Families
Bottom Line for Ventura County: Ventura County shows consistent and meaningful concentration risk when it comes to philanthropic funding. Except for 2020, the five largest funders accounted for approximately one-fifth to one-quarter of all charitable funding received by Ventura County nonprofits each year. While the composition of the top five funders changes over time, this level of concentration is high enough that a relatively small number of funding decisions can materially affect the county’s nonprofit ecosystem. By comparison, larger and more mature philanthropic ecosystems typically distribute charitable funding across a much broader base of donors, reducing dependence on any one funder and increasing long-term resilience.
Philanthropic Investment Overall Assessment Ventura County’s philanthropic investment story remains fragile: giving has grown substantially since 2019, but the baseline remains low, recent momentum has slowed, and funding remains meaningfully concentrated. The estimated 2024 data do not suggest deterioration, but they also do not yet show the scale of philanthropic expansion needed to close the county’s persistent funding gap.
*Note: Top-5 funders excludes donor advised funds and community foundations, since these organizations represent multiple donors.
2026 Ventura County Nonprofit Sector Report
25
2. Workforce (Stable) Growth with Persistent Compensation Strain Ventura County’s nonprofit workforce is more stable than in the past, but important strains remain. Nonprofits in Ventura County meaningfully added jobs from 2021 through 2023, but growth slowed in 2024 despite rising wages. Nonprofits in the county face a persistent, systemic problem of lower wages relative to the countywide average and to statewide nonprofit norms.
Implication: Without improvements in compensation and workforce sustainability, nonprofits risk a slow erosion of organizational capacity. For funders and policymakers, workforce investments — including support for competitive wages and leadership development — should be seen as infrastructure investments, not overhead.
Ventura County Nonprofit Sector: 2024 Financial Health Dimensions
Ventura County Nonprofit Sector: Workforce Metrics
Climate First: Replacing Oil & Gas (CFROG)
26
2026 Ventura County Nonprofit Sector Report
Workforce Metrics Is Ventura County’s nonprofit sector keeping up in building and sustaining the workforce it needs— through job growth, competitive wage growth, and fair wage positioning relative to the broader local labor market? Why It Matters: Nonprofits deliver services through people. When staffing is tight, wages lag, or nonprofit pay falls behind local norms, organizations face higher turnover, persistent vacancies, reduced program capacity, and weaker resilience during demand spikes. Metrics included: 1. Job Creation-nonprofit job growth vs local economy and vs California nonprofits 2. Wage Growth-nonprofit wage growth vs local wages, inflation, and California nonprofits 3. Wage Parity- nonprofit wages vs overall wages locally, compared to the same relationship statewide
Job Creation– How has the pace of job creation among Ventura County’s nonprofits compare? Why It Matters: If nonprofit job growth is lagging, organizations may be unable to scale services or replace departing staff— especially during periods of rising demand. Strong nonprofit job creation is an encouraging sign of sector capacity and growth. Measurement: Year-over-year change in Ventura County nonprofit jobs compared to the county and California nonprofits. Bottom Line for Ventura County: Ventura County nonprofits created jobs at a strong pace from 2021 through 2023 as philanthropic investment increased, suggesting that much of the additional funding was used to expand services and staffing rather than build reserves. As funding growth moderated, job creation slowed to about 2% in 2024, though it remained in line with the county’s overall economy.
2026 Ventura County Nonprofit Sector Report
Job Creation (YoY % Change in Total Number of Jobs)
27
Workforce Metrics (Cont’d) Wage Growth– How has the growth in wages paid by Ventura County nonprofits kept up with overall wages in the county, regional inflation, and nonprofits across California? Why It Matters: Wage growth is a leading indicator of whether nonprofits can retain staff in a competitive labor market. If wages don’t keep up with inflation and local wage growth, nonprofits face recruiting/ retention pressure and rising vacancy risk. Measurement: Year-over-year percentage change in average annual wages paid by Ventura County nonprofits compared to the overall average for the county, California nonprofits, and regional inflation.
YoY % Change in Average Annual Wages
Big Brothers Big Sisters of Ventura County
Bottom Line for Ventura County: Wage growth has been volatile. Ventura County nonprofits experienced relatively strong wage growth in 2020 and 2021, but 2022 and 2023 reflected significant wage pressures, with nonprofit wage growth lagging both inflation and California nonprofit wage growth. The improvement in 2024 is encouraging, suggesting nonprofits may be regaining some ground. However, a single year of stronger wage growth does not eliminate the sector’s longer-term compensation challenges, and volatility remains a persistent concern.
Conejo Schools Foundation
28
2026 Ventura County Nonprofit Sector Report
Workforce Metrics (Cont’d) Wage Parity– Are nonprofit wages in Ventura County in line with nonprofit wages statewide, after accounting for Ventura County being a lower-wage labor market? Why It Matters: Nonprofits compete for talent locally. This measure adjusts for Ventura County’s overall wage environment, so the comparison is fair. If Ventura County’s nonprofit wage gap is larger than California’s, local nonprofits are at a disadvantage in attracting and retaining staff—even after adjusting for the county’s lower wage market. Measurement: % difference between Ventura County nonprofit average wages vs. county, state, and California nonprofit average wages. Average Annual Wages
Saticoy Food Hub
Bottom Line for Ventura County: Even after adjusting for Ventura County’s lower wage environment, the county’s nonprofits appear to pay materially less (29%) relative to average local wages and 37% less than the average nonprofit wages across the state. This is a persistent structural workforce risk: it makes recruiting and retention harder and increases pressure on service delivery—especially in roles where nonprofit and private/public employers compete directly.
Big Brothers Big Sisters of Ventura County
Workforce Overall Assessment Ventura County’s workforce position is best described as stable but strained. Job creation has been a strength, and 2024 wage growth was encouraging. However, the sector continues to face a persistent wage-parity problem that may undermine retention, leadership continuity, and service quality over time. Overall, the workforce picture has improved, but compensation remains a core vulnerability.
2026 Ventura County Nonprofit Sector Report
29
3. Sector Foundation (Very Strong) The Ecosystem Has a Strong Foundation At the system level, Ventura County’s operating nonprofit ecosystem demonstrates a strong, balanced structure. The distribution of organizations across small, mid-sized, and larger nonprofits is proportionally healthy, and the county shows little evidence of the “missing middle” that characterizes many nonprofit ecosystems. This suggests that the underlying organizational architecture of the sector is fundamentally sound and has continued to strengthen over time.
Implication: The principal challenge facing Ventura County is not the structure of the nonprofit sector itself, but ensuring that organizations have sufficient financial and human resources to expand their impact. Because the ecosystem is relatively well developed and increasingly scalable, strategic investments in nonprofit capacity have the potential to produce broad, system-wide benefits. Ventura County Nonprofit Sector: 2024 Financial Health Dimensions
Ventura County Nonprofit Sector: Sector Foundation Metrics
Mesa
30
2026 Ventura County Nonprofit Sector Report
Sector Foundation Metrics Does Ventura County have a healthy nonprofit “ecosystem structure”—with enough scaled, backbone organizations (the “missing middle” issue), and evidence that the distribution is shifting toward greater organizational scale over time?
Implication: A county can have many nonprofits and still lack capacity if too many are very small. A healthier structure typically includes: a.) a meaningful share of scaled organizations (capacity to employ staff, manage systems, deliver reliably), b.) a solid mid-sized “backbone” layer (the “missing middle” question), and c.) evidence the ecosystem is evolving toward more scale over time. Metrics included: 1. Scaled Operations — % of nonprofits with $500K+ in annual revenue 2. Backbone-to-Small Ratio — ratio of mid-sized ($500K–$4.94M) to small (<$500K) organizations 3. Distribution Shift — change over time in the share of nonprofits at $500K+ Scaled Operations– How much of the sector exists at “scaled” revenue levels– i.e., $500K+ in annual revenue? Why It Matters: Organizations at or above ~$500K are more likely to sustain staffing, systems, and service delivery. If the scaled share is low, the ecosystem may be dominated by micro/small organizations that struggle to build durable capacity. Measurement: % of Ventura County nonprofits with $500K+ in annual revenue. Scaled Operations (% of Ventura Co. Nonprofits With $500K+ in Annual Revenue)
Ride On Therapeutic Horsemanship
Bottom Line for Ventura County: Ventura County’s share of scaled nonprofits has remained consistently healthy and has generally trended upward over time, increasing from 19% in 2019 to an estimated 24% in 2024. This places the county in a very strong position, with nearly one in four operating nonprofits now functioning at what can reasonably be considered a scaled level. 2026 Ventura County Nonprofit Sector Report
31
Sector Foundation Metrics (Cont’d) Backbone-to-Small– Is the number of mid-sized nonprofits sufficient enough relative to the number of small organizations to provide sufficient services and benefits to the county (“missing middle” risk)? Why It Matters: A robust “middle” layer often serves as the operational backbone for community impact—large enough to deliver consistently, small enough to remain close to community needs. Too few midsized organizations can weaken coverage, specialization, and resilience. Measurement: Ratio of mid-sized (“Backbone”) nonprofits ($500K–$4.94M) to small nonprofits (< $500K)
The Samaritan Center of Simi Valley
Bottom Line for Ventura County: Ventura County shows little evidence of a “missing middle.” The backbone layer of mid-sized nonprofits strengthened beginning in 2020 and has remained very strong since then. The Backbone-to-Small Ratio increased from 0.179 in 2019 to 0.231 in 2024, reflecting a growing share of mid-sized organizations relative to small nonprofits—a positive indicator of organizational capacity, service coverage, and longterm sector resilience.
The Arc of Ventura County
32
2026 Ventura County Nonprofit Sector Report
Sector Foundation Metrics (Cont’d) Distribution Shift– Has the share of medium and large organizations increased or decreased over time? Why It Matters: A rising share of scaled organizations can signal strengthening sector capacity and sustainability. A declining share can indicate fragmentation, undercapitalization, or challenges moving organizations beyond small scale. Measurement: Change in the share of Ventura County nonprofits that are $500K or more in annual revenue.
Leadership Ventura County
TOArts, Stacy Gleason
Bottom Line for Ventura County: Ventura County experienced a meaningful structural shift toward more scaled nonprofits during 2020–2021, followed by a period of relative stability in 2022–2023. The estimated 2024 data suggest that this positive trend has resumed, with the share of nonprofits operating at $500,000 or more in annual revenue reaching its highest level in the period analyzed. Overall, the direction continues to be clearly positive, indicating a nonprofit ecosystem that is gradually becoming more organizationally scaled.
Sector Foundation Overall Assessment: Ventura County’s nonprofit ecosystem exhibits a strong and increasingly resilient organizational structure. Nearly one in four operating nonprofits now operates at $500,000 or more in annual revenue, while the county’s backbone of mid-sized organizations has strengthened, reducing concerns about a “missing middle.” Following a substantial structural shift toward larger organizations during 2020–2021, the estimated 2024 data indicate that this positive evolution has continued. Overall, Ventura County’s nonprofit sector appears well-positioned to support broad service delivery and long-term resilience, provided organizations continue to grow and successfully transition from small to mid-sized scale. 2026 Ventura County Nonprofit Sector Report
33
4. Sector Capacity (Distressed) A System That Cannot Fully Execute Despite a strong structure, the sector’s capacity to execute is distressed. Ventura County has a comparable nonprofit presence to California (roughly on par per resident), but substantially lower service reach and asset depth per resident—both consistently lower than the average for California and other comparable regions. Net: Sector Capacity is weak, driven by under-capitalization, not for the lack of organizations. In simple terms: the pipes exist, but the water pressure is low. Organizations are trying to meet complex and growing needs with limited financial and physical capacity.
Implication: This is one of the clearest investment opportunities in the report. Ventura County does not need to create a nonprofit ecosystem from scratch; it needs to better capitalize the ecosystem that already exists. Strategic investments in operating capacity, facilities, technology, systems, and balance-sheet strength could unlock substantial latent potential. Ventura County Nonprofit Sector: 2024 Financial Health Dimensions
Ventura County Nonprofit Sector: Sector Capacity Metrics
U.S. Vets
34
2026 Ventura County Nonprofit Sector Report
Sector Capacity Metrics Is Ventura County’s nonprofit sector adequately capitalized to deliver services at scale and remain resilient in the face of economic shocks? Metrics included: 1. Organization Presence — nonprofits per 10,000 residents (Ventura vs California) 2. Service Reach — nonprofit revenue per capita (Ventura vs California) 3. Resource Base — nonprofit assets per capita (Ventura vs California) Organization Presence– Does Ventura have a comparable “presence” of nonprofit organizations relative to California? Why It Matters: Nonprofit density is a rough indicator of service access points and civic infrastructure. It helps separate a coverage problem (too few organizations) from a capitalization problem (organizations exist, but are under-resourced).
Ride on Therapeutic Horsemanship
Measurement: Count of nonprofit organizations ÷ population, expressed as nonprofits per 10,000 residents, benchmarked to California.
Bottom Line for Ventura County: Ventura County’s nonprofit presence is essentially on par with California and Los Angeles County. In 2024, Ventura County had approximately 13 nonprofits per 10,000 residents, almost identical to the statewide level. This strongly suggests the county’s capacity challenge is not a shortage of organizations, but rather the resource level per organization/per resident (addressed in the next two metrics). 2026 Ventura County Nonprofit Sector Report
35
Sector Capacity Metrics (Cont’d) Service Reach– How much nonprofit “service economy” (program activity and funding flow) exists per resident, and is Ventura County operating at a material smaller scale than its peers? Why It Matters: Revenue per capita is a direct proxy for the throughput of nonprofit services and funding. Low revenue per capita typically implies constrained program reach, thinner staffing capacity, and fewer dollars circulating through community service systems. Measurement: Nonprofit revenue per resident (per capita) benchmarked to California. Bottom Line for Ventura County: Ventura County’s nonprofit sector continues to operate at a much smaller scale per resident than the averages for California, Los Angeles, and Santa Barbara Counties. The estimated 2024 nonprofit revenue per capita was about $4,388, or roughly 37% of California’s level. Although Ventura County has improved since 2019, the gap remains large and structural—implying Ventura’s nonprofit ecosystem is delivering meaningfully less funded program activity per person, which likely shows up as lower staffing intensity, smaller program scale, and less ability to absorb demand surges. Service Reach (Operating Nonprofit Revenue per Capita)
The Samaritan Center of Simi Valley
The Ojai Raptor Center
36
2026 Ventura County Nonprofit Sector Report
Sector Capacity Metrics (Cont’d) Resource Base– Does the sector have the financial depth to invest, scale, and absorb shocks? Why It Matters: Assets per capita reflect the sector’s financial resilience and ability to: invest in facilities/technology, bridge delayed reimbursements, manage cash-flow volatility, and respond to emergencies. A thin asset base means less shock absorption countywide. Measurement: Nonprofit assets per resident (per capita) benchmarked to California. Bottom Line for Ventura County: Ventura County nonprofits continue to have a much thinner asset base than those across California or in the counties of Los Angeles or Santa Barbara. The estimated 2024 assets per capita were approximately $5,836, or about 29% of California’s level. This limits the sector’s ability to invest, absorb shocks, and build long-term resilience.
Resource Base (Operating Nonprofit Assets per Capita)
Reel Guppy Outdoors
kidSTREAM Children’s Museum
Sector Capacity Overall Assessment Ventura County’s Sector Capacity story is primarily under-capitalization, not under-coverage. The organizations exist, and the sector’s presence is normal relative to the population. But the sector has far less revenue flow and balance-sheet depth per resident than is the norm across California. As a result, Ventura County’s nonprofit ecosystem has the structure to serve the community, but not yet the financial capacity to operate at the scale and resilience the community requires.
2026 Ventura County Nonprofit Sector Report
37
5. Liquidity (Stable) Surviving in the Short Run Liquidity, measured by months of cash on hand, is currently stable. Ventura County nonprofits generally maintain sufficient liquidity to meet their short-term obligations, helping explain why the sector continues to function despite mounting financial pressures. However, the estimated 2024 data suggest that liquidity has weakened modestly since its post-pandemic peak, with fewer organizations maintaining robust cash reserves and more falling below minimum safety thresholds.
Implication: Liquidity provides short-term survival, but not long-term resilience. Many organizations are one shock away from financial stress. Funders should recognize that cash reserves and working capital are not luxuries — they are core components of financial health.
Ventura County Nonprofit Sector: 2024 Financial Health Dimensions
Ventura County Nonprofit Sector: Liquidity Metrics
One Step A La Vez
38
2026 Ventura County Nonprofit Sector Report
Liquidity Metrics Do Ventura County nonprofits have enough financial reserves to operate reliably and withstand short-term shocks—without service disruption, layoffs, or emergency fundraising? Why It Matters: Liquidity is the sector’s short-term safety margin. Adequate cash/investments allow nonprofits to bridge timing gaps (government reimbursements, delayed grants, seasonal revenue), handle unexpected expenses, and avoid disruptive cuts during downturns. Metrics included: 1. Liquidity Risk- Ventura County nonprofits with less than 3 months of cash on hand 2. Liquidity Adequacy- Ventura County nonprofits with 6 months or more of cash on hand Liquidity Risk– What share of Ventura County nonprofits have dangerously low liquidity—defined as less than 3 months of cash on hand? Why It Matters: <3 months is a widely understood “safety minimum.” A high share of organizations below this threshold implies elevated risk of missed payroll and delayed vendor payments, program interruptions, and reactive fundraising and instability during shocks. Measurement: % of Ventura County nonprofits with < 3 months of cash on hand (Cash + Investments) ÷ Avg. Monthly Expenses Bottom Line for Ventura County: Liquidity risk remains a meaningful concern. Following significant improvement during the pandemic, the estimated 2024 data indicate that approximately 41% of Ventura County nonprofits now hold less than three months of cash on hand, up from roughly 38% in the prior two years. While the sector remains in a slightly stronger position than in 2019, a meaningful share of Ventura County nonprofits continues to operate with little financial cushion, leaving them vulnerable to reimbursement delays, unexpected expenses, or economic downturns.
Saticoy Food Hub
Liquidity Risk (% of Ventura Co. Nonprofits With <3 Months of Cash)
Free Clinic of Simi Valley, Fred Bauermeister
2026 Ventura County Nonprofit Sector Report
39
Liquidity Metrics (Cont’d) Liquidity Adequacy– What share of Ventura County nonprofits have sufficient liquidity (i.e., 6+ months of cash)? Why It Matters: 6+ months is a practical buffer that improves resilience and planning capacity. A higher share of nonprofits above this threshold suggests better ability to withstand volatility, less disruption during shocks, and more room for investment (staffing, systems, growth). Measurement: % of Ventura County nonprofits with ≥ 6 months of cash on hand. Bottom Line for Ventura County: A meaningful share of Ventura nonprofits maintains adequate liquidity buffers—peaking at 50% in 2021 and declining to 41% in 2024. Despite the decline in share over the past four years, 41% of Ventura County nonprofits with over 6 months of cash is a healthy stabilizer for the ecosystem, but it coexists with the still-large at-risk group (<3 months), reinforcing the “barbell” structure: many organizations are either quite safe or quite exposed. Additionally, the median months of cash has been steadily declining since 2021 suggesting the pandemic-era financial cushions are being depleted. Liquidity Adequacy (% of Nonprofits w/ 6+ Months of Cash & Median Months of Cash)
Liquidity Overall Assessment Ventura County’s nonprofit sector continues to demonstrate adequate short-term liquidity, but recent trends suggest that this strength is gradually eroding. Many organizations retain sufficient reserves to navigate routine disruptions, yet approximately two out of every five nonprofits now operate below the three-month safety threshold. Overall, liquidity remains a relative strength compared with other indicators, but the estimated 2024 data suggest that maintaining adequate working capital is becoming more difficult as temporary pandemic-era resources continue to fade.
40
2026 Ventura County Nonprofit Sector Report
6. Stability (Fragile) Chronic Operating Deficits - The “Silent Risk” Stability remains one of the most significant financial challenges facing Ventura County’s nonprofit sector. While most organizations continue to deliver services, a growing share consistently spend more than they receive, gradually eroding their financial resilience. Since the height of the pandemic, when 38% of operating nonprofits experienced a deficit, that share has risen to nearly half in 2024, meaning that 46% Ventura County nonprofits operate at a deficit.
Implication: This is a classic “silent risk.” Deficits do not always produce immediate failure, but they erode institutional strength over time. Without improvements in revenue models and cost structures, the sector’s current stability is not sustainable. Ventura County Nonprofit Sector: 2024 Financial Health Dimensions
Ventura County Nonprofit Sector: Stability Metrics
TOArts, Stacy Gleason 2026 Ventura County Nonprofit Sector Report
41
Stability Metrics Are Ventura County nonprofits consistently able to live within their means—and is that stability improving or deteriorating now that emergency-era funding has faded? Why It Matters: Financial stability is the foundation of every nonprofit’s ability to serve its community. Organizations that routinely spend more than they bring in are forced to deplete reserves, delay investments, cut programs, or rely on emergency fundraising. When deficits are widespread, the entire nonprofit ecosystem becomes fragile—less able to withstand economic shocks, funding shifts, or sudden increases in community need. Metrics included: 1. Deficit Rate- share of nonprofits operating with an annual operating deficit 2. Deficit Trend- year-over-year change in the deficit rate Deficit Rate– What share of organizations fail to cover their annual operating costs? Why It Matters: A high deficit rate indicates systemic strain: widespread operating losses typically lead to reserve drawdowns, deferred investment, cuts to services, and reduced resilience. Measurement: For each year, an organization is counted as having an operating deficit if total expenses exceed total revenue. Bottom Line for Ventura County: Ventura County’s operating deficit rate remains persistently high and continues to worsen. The estimated nearly half deficit rate in 2024 represents the highest level during the period analyzed, meaning nearly one out of every two operating nonprofits reported expenses exceeding revenue during the year. Such a high proportion of organizations operating at a deficit points to systemic financial strain rather than isolated management challenges.
Deficit Rate (% of Ventura Co. Nonprofits Operating with a Deficit)
Ventura Land Trust, Jeff Young
42
2026 Ventura County Nonprofit Sector Report
Stability Metrics (Cont’d) Deficit Trend– Is financial stability improving or deteriorating following COVID-era support? Why It Matters: Even if a sector has a high deficit rate, the direction matters. Improving trends suggest adaptation and recovery; worsening trends signal growing fragility and rising risk of service disruption.
Ventura Land Trust, Jeff Young
Measurement: Year-over-year percentage point change in the share of Ventura County nonprofits reporting an operating deficit. Deficit Trend (YoY Change in Ventura County Nonprofits with Deficit)
Bottom Line for Ventura County: Ventura County experienced a meaningful improvement in financial stability during 2021 as pandemic-related funding strengthened nonprofit finances. That improvement, however, proved temporary. Deficit rates increased substantially in 2022 and again in 2023, with the estimated 2024 data showing continued deterioration. The pattern suggests that many organizations have struggled to sustain financial balance as emergency funding has receded and operating costs have continued to rise.
Stability Overall Assessment Ventura County’s nonprofit sector continues to face persistent operating instability. Nearly half of operating nonprofits are estimated to have reported annual deficits in 2024, indicating that financial strain has become a systemic characteristic of the sector rather than a temporary consequence of the pandemic. Although emergency funding briefly improved operating results in 2021, those gains have steadily dissipated. Without stronger recurring revenue, improved operating margins, or greater investment in general operating support, many nonprofits are likely to continue to draw down reserves, delay strategic investments, and operate with limited financial flexibility. 2026 Ventura County Nonprofit Sector Report
43
7. Revenue Diversification (Strong) A Strength with Room to Grow Revenue diversification is a recently encouraging financial trend. Nearly half of the county’s nonprofits generate revenue from multiple sources rather than relying predominantly on a single funding stream. This diversification helps organizations better withstand shifts in government funding, philanthropy, program revenue, or economic conditions. While overall diversification has remained relatively stable in recent years, approximately half of Ventura County nonprofits continue to depend on a single dominant revenue source, leaving much of the sector exposed to funding disruptions.
Implication: Diversified revenue creates flexibility and resilience. Nonprofits with multiple funding sources are generally better positioned to adapt when one source declines, pursue new opportunities, and maintain services during periods of financial uncertainty. Expanding diversified funding should remain a strategic priority for nonprofit leaders and funders seeking to strengthen the long-term resilience of Ventura County’s nonprofit sector. Ventura County Nonprofit Sector: 2024 Financial Health Dimensions
Ventura County Nonprofit Sector: Revenue Diversification Metrics
Women’s Economic Ventures (WEV), Sarita Relis Photography
44
2026 Ventura County Nonprofit Sector Report
Revenue Diversification Metrics How dependent are Ventura County nonprofits on a single source of revenue, and how resilient are they if that funding changes? Why It Matters: Organizations that rely heavily on one revenue source are more vulnerable to funding disruptions. Diversified revenue strengthens financial resilience by helping nonprofits sustain programs and adapt to changing community needs. Metrics included: 1. Diversification- Nonprofits with less than 90% of annual revenue coming from one revenue category 2. Diversification Trend- Year-over-year change in the percentage of nonprofits that maintain diversified revenue. Diversification– What share of Ventura County nonprofits maintain diversified revenue rather than relying primarily on a single funding source? Why It Matters: Revenue diversification is a key measure of financial resilience. Organizations with multiple revenue sources are better able to withstand funding disruptions, sustain programs, and respond to changing community needs. Measurement: % of Ventura County nonprofits with less than 90% of annual revenue coming from one revenue category (e.g., program services, government grants, etc.) Bottom Line for Ventura County: Revenue diversification represents one of Ventura County’s stronger financial characteristics. An estimated 48% of operating nonprofits in 2024 received meaningful revenue from multiple sources, earning a Strong rating under the Financial Health Index. Although diversification has remained relatively stable over time, just over half of Ventura County nonprofits continue to rely on a single dominant revenue source. The county, therefore, demonstrates encouraging progress while still facing substantial exposure to funding concentration across much of the sector. Revenue Diversification (% of Ventura Co. Nonprofits with Diverse Revenue Streams*)
Ventura Regional Fire Safe Council
2026 Ventura County Nonprofit Sector Report
45
Revenue Diversification Metrics (Cont’d) Diversification Trend– Is revenue diversification improving or weakening over time? Why It Matters: Diversification levels tell only part of the story. Trends matter as well. An increasing share of nonprofits with diversified revenue signals improving financial resilience, while declining diversification indicates growing dependence on single funding sources and greater financial risk.
Museum of Ventura County
Measurement: Year-over-year change in the percentage of nonprofits that maintain diversified revenue. Diversification Trend (YoY %-Point Chg. in Ventura Co. Nonprofits with Diversified Revenue*)
Museum of Ventura County
Bottom Line for Ventura County: Revenue diversification has remained remarkably stable over the past six years. Following modest fluctuations during the pandemic period, the share of nonprofits with diversified revenue has generally remained between 46% and 50%. The estimated 2024 data suggest little meaningful change from 2023, indicating that Ventura County has maintained its overall level of diversification but has not yet achieved broader diversification across the sector.
Revenue Diversification Overall Assessment Revenue diversification is one of the stronger dimensions of Ventura County’s nonprofit financial health. Nearly half of the county’s nonprofits maintain diversified revenue sources, reducing their exposure to the loss of any single funding stream. However, the data also indicate that a slight majority of organizations remain highly dependent on one primary source of revenue. Overall, Ventura County’s revenue diversification is best characterized as strong but incomplete—providing an important foundation for financial resilience while leaving significant opportunity to further reduce funding concentration across the sector.
46
2026 Ventura County Nonprofit Sector Report
8. Momentum (Stable) Growth Is Continuing, but Resilience Is Lagging Ventura County’s nonprofit sector continues to expand, but growth alone does not necessarily translate into greater financial strength. Revenues have generally grown at a healthy pace, reflecting increasing community demand and organizational activity. Asset growth, however, has been less consistent, suggesting that nonprofits are not fully converting today’s growth into tomorrow’s financial resilience.
Implication: • •
For nonprofits: Revenue growth is encouraging, but the sector-wide pattern suggests many organizations may not be translating growth into reserve-building and balance-sheet depth. That raises vulnerability if revenue softens or costs rise. For funders: There is a strong case for pairing growth investments with financial resilience supports— multi-year flexible funding, explicit reserve-building, capitalization/capacity grants (systems, tech, finance function), and incentives that help organizations convert growth into durable assets. Ventura County Nonprofit Sector: 2024 Financial Health Dimensions
Ventura County Nonprofit Sector: Momentum Metrics
Ventura Regional Fire Safe Council 2026 Ventura County Nonprofit Sector Report
47
Momentum Metrics Is Ventura County’s nonprofit sector building financial momentum—growing its revenue base and strengthening its balance sheet over time—and is it keeping pace with (or outperforming) California? Why It Matters: Momentum captures whether the sector is expanding its ability to serve (revenue growth) and building staying power (asset growth). Sustained momentum typically supports better staffing, program expansion, and resilience. Weak momentum can foreshadow future strain—especially if costs rise and demand increases. Metrics included: 1. Revenue Growth-year-over-year (YoY) total revenue growth; Ventura County vs. California 2. Asset Growth-year-over-year (YoY) total asset growth; Ventura County vs. California Revenue Growth– Are Ventura County nonprofits growing total revenue faster or slower than California nonprofits? Why It Matters: Revenue growth is the sector’s primary “fuel gauge.” When revenue grows faster than the state, it often reflects stronger fundraising/contract competitiveness and expanding service capacity. When it lags, it can signal stagnation that later shows up as staffing stress and weaker reserves. Measurement: Compare the difference between Ventura County’s and California’s year-over-year change in total revenue. Is Ventura County outperforming or underperforming California? Bottom Line for Ventura County: Ventura County nonprofits have demonstrated strong revenue growth throughout most of the period analyzed, generally outperforming California nonprofits. The estimated 2024 data suggest that growth has moderated somewhat but remains positive. This sustained expansion reflects continued demand for nonprofit services and the sector’s ability to attract financial resources despite an increasingly challenging operating environment. Revenue Growth (YoY % Change in Total Revenue)
The Arc of Ventura County
48
2026 Ventura County Nonprofit Sector Report
Momentum Metrics (Cont’d) Asset Growth– Are Ventura County nonprofits strengthening their balance sheets—growing total assets year over year—faster or slower than California nonprofits? Why It Matters: Asset growth reflects the accumulation of staying power: reserves, investments, property/equipment, and overall financial depth. Strong asset growth supports resilience and future investment. Weak asset growth suggests thinner margins, limited reinvestment, or difficulty building reserves—even if revenue is rising. Measurement: Compare the difference between Ventura County’s and California’s year-over-year change in total assets. Is Ventura County outperforming or underperforming California? Bottom Line for Ventura County: Growth in Ventura County nonprofit assets has been considerably less consistent than growth in revenue. While balance sheets expanded during parts of the study period, asset growth slowed or weakened in other years, suggesting that the county’s nonprofits have often used new revenues to sustain current operations rather than build long-term financial strength. The estimated 2024 data suggest modest improvement, but balance-sheet growth continues to lag overall organizational growth. Asset Growth (YoY % Change in Total Assets)
Momentum Overall Assessment Ventura County’s nonprofit sector continues to move forward, but its financial momentum remains incomplete. Organizations are generating more revenue and expanding their activities, yet much of that growth is being consumed by rising operating costs, persistent deficits, workforce pressures, and ongoing undercapitalization. As a result, the sector is becoming larger without becoming proportionately more resilient. 2026 Ventura County Nonprofit Sector Report
49
50
2026 Ventura County Nonprofit Sector Report
2026 Ventura County Nonprofit Sector Report
51
Phone: (805) 493-3959 Web: www.callutheran.edu/nonprofit Email: nonprofit@callutheran.edu
California Lutheran University, Michael DeTerra
52
2026 Ventura County Nonprofit Sector Report