THE LATEST ON REGIONAL COST TRENDS
COST INDEX Q1 2026

KURT’S KEY UPDATES
THE LATEST ON REGIONAL COST TRENDS
COST INDEX Q1 2026
KURT’S KEY UPDATES
Kurt Jaeger
Executive Vice President, Preconstruction jaegerk@claycorp.com
314.595.6373
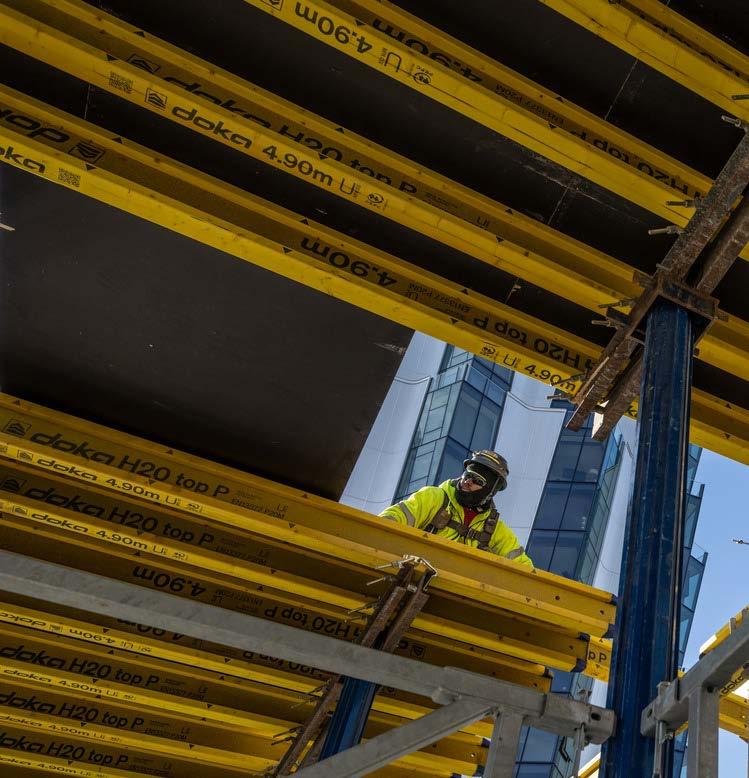
In Q1 2026, the U.S. construction market continued to experience mixed momentum. Overall activity was moderated by elevated financing costs and cautious private-sector capital deployment. Nonresidential construction remained supported by sustained investment in data centers, advanced manufacturing, and energy infrastructure. Expansion of hyperscale AI campuses and semiconductor fabrication facilities continued to drive demand for structural steel, electrical distribution equipment, backup power systems, and specialized cooling infrastructure, placing ongoing pressure on select supply chains.
Material availability remained generally stable across most commodity categories; however, long lead times persisted for transformers, switchgear, generators, copper-related products, and certain mechanical and controls components tied to high-capacity power applications. Labor availability remained constrained in several skilled trades, particularly electrical and mechanical sectors, contributing to localized cost escalation and schedule sensitivity. As the market entered the second quarter, contractors and owners continue to emphasize early procurement strategies, subcontractor engagement, and supply chain diversification to mitigate execution risk and maintain project certainty on large, technically complex developments.
Annual Construction
Increase of 3.03%
The Clayco Cost Index Q1 2026 provides an overview of regional construction cost trends. Clayco believes the current year over year rate of 3.03% will increase in the near term due to increased commodity price projections and shortages in skilled labor supply. The report includes detailed insights on material and construction producer price indexes, delivery lead times, and city-specific cost comparisons across various regions. We would like to extend our sincere thanks to our vendors and trade partners for their
invaluable contributions in providing the data and insights that helped shape the Clayco Cost Index Q1 2026.
In March 2026, private construction spending increased 0.8% from February and rose 1.0% year-over-year. For the first three months, spending declined by 0.7% compared to the same period in 2025.
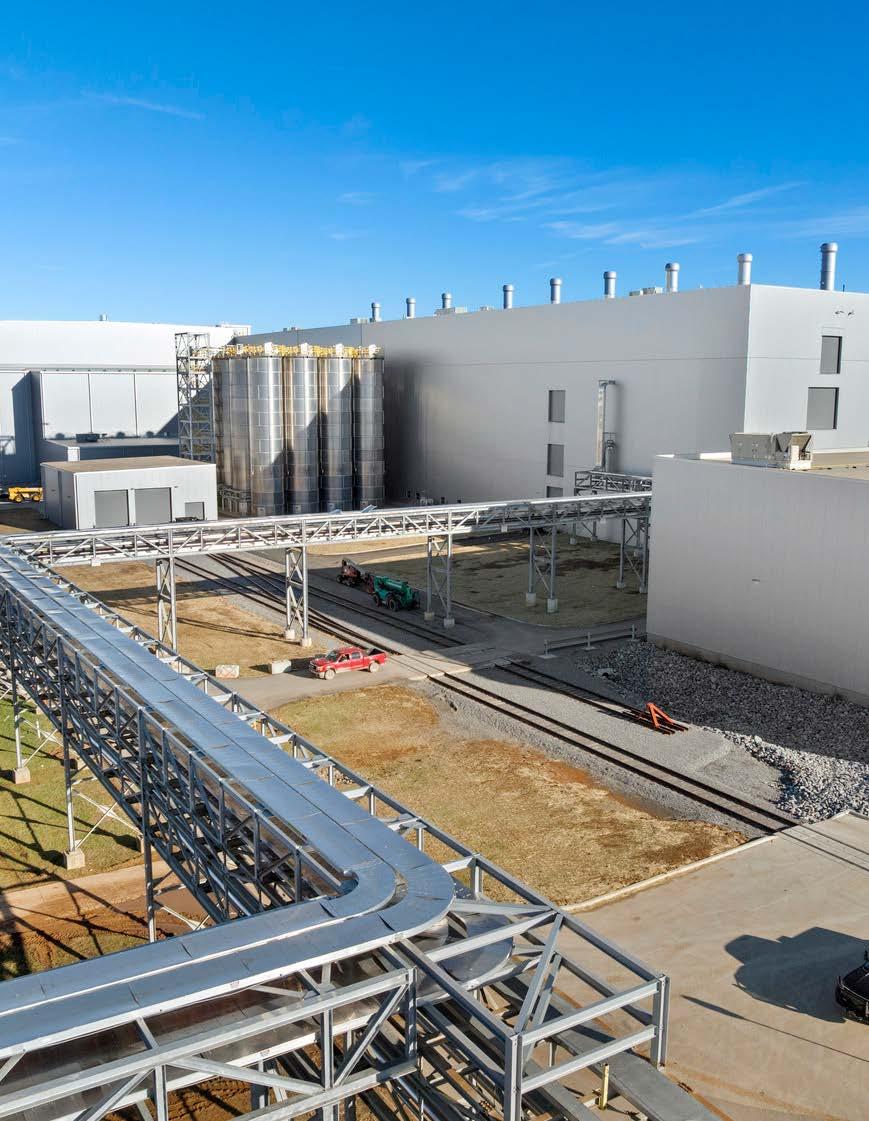
The material indexes are a quarterly compilation from our suppliers, trade partners, self-perform entities and nationally published commodity indexes. The material cost consist of the following: Concrete, Aggregates, Carbon Steel Pipe, Stainless Steel Pipe, Rebar, Wide Flange Steel, 5/8” Drywall, Copper, Hot Milled Sheet Steel, Lumber, Crude Oil and Hot Liquid Asphalt.
National City Cost Index, reference RSMeans 2026 Second Quarter. Shown are six of the main markets in each of the four regions. These are weighted averages, leveraging material and labor across all scopes of work. This chart compares city to city cost based on a national average of 1.
NATIONAL AVERAGE = 1.0 National City Cost Index, reference RSMeans 2026 Second Quarter. Shown are six of the main markets in each of the four regions. These are weighted averages, leveraging material and labor across all scopes of work. This chart compares city to city cost based on a national average of 1.
Northeast
West
These numbers constitute both union & non-union composite rates, as well as year over year changes for the following trades: Concrete Mason, Carpenter, Electrician, Iron Worker, Laborer and Plumber. Midwest
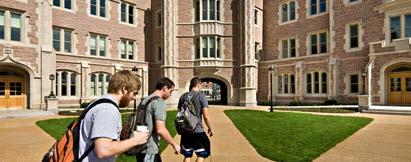
Washington University Neil S. Hirsch Center for Alumni & Career Engagement
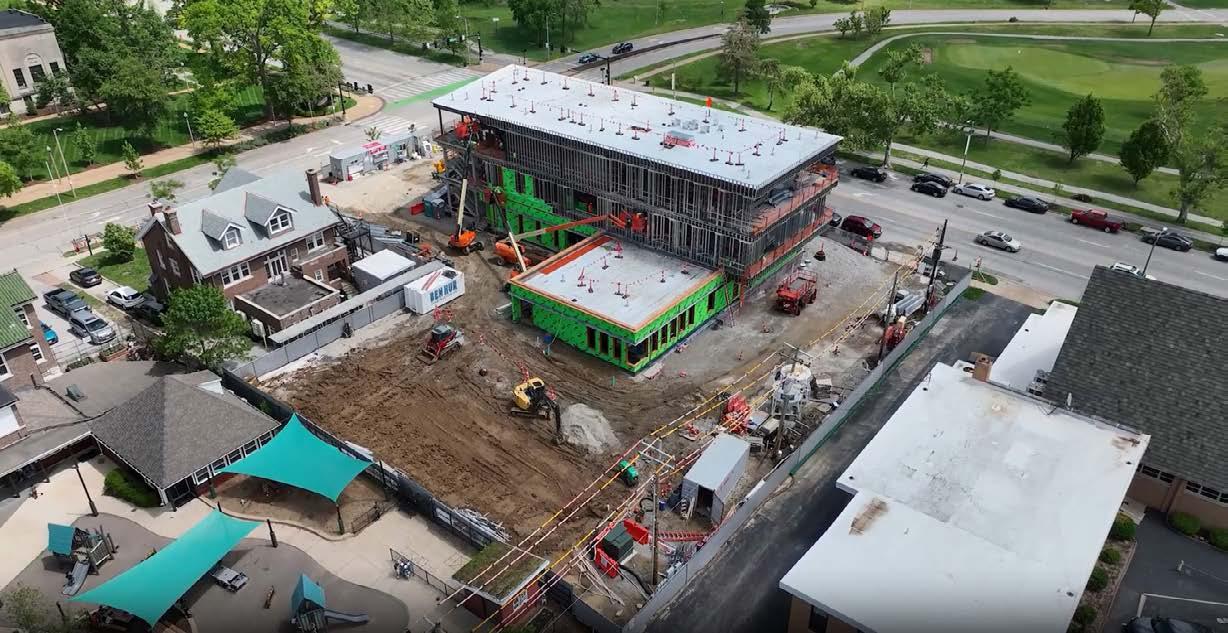
Construction is underway on the Neil S. Hirsch Center, a new home for the Center for Career Engagement and an alumni welcome center. The building will serve as the front door to welcome Washington University in St. Louis alumni when they return to the Danforth Campus, and as a hub for students, alumni and employers to interact in various ways, including on-campus interviews, networking and recruiting events. The more than 30,000-square-foot, three-story building was designed by St. Louis-based Christner Architects and Clayco will be the contractor.
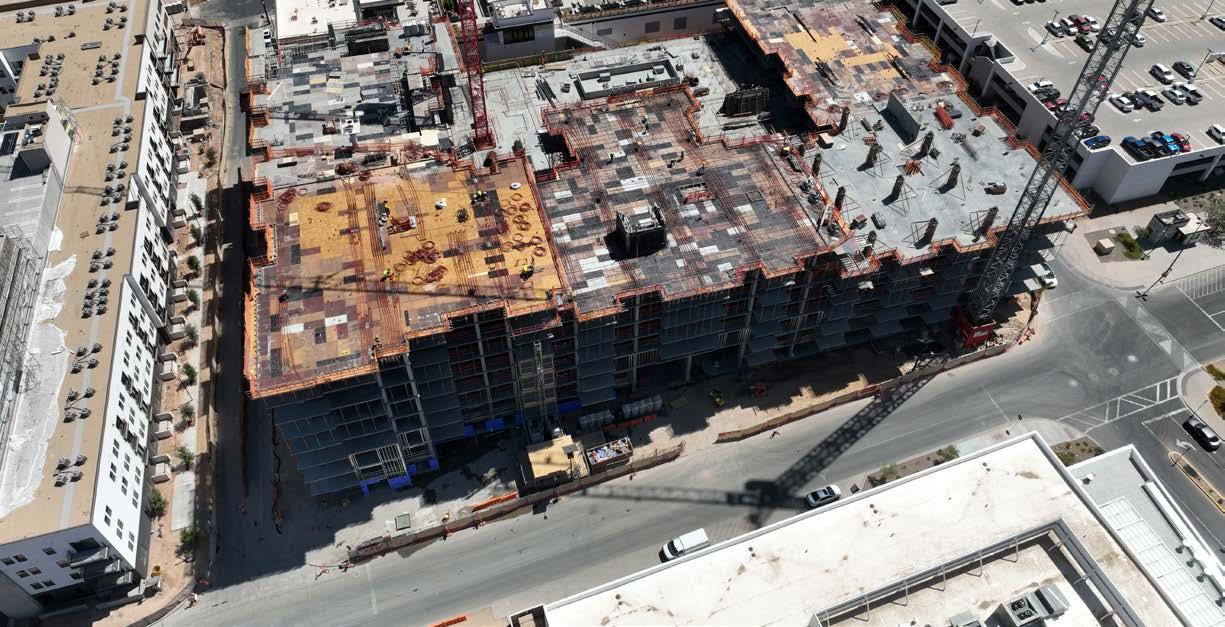
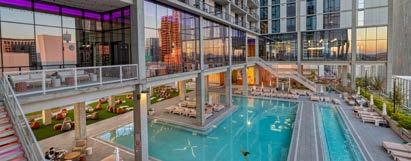
This 11-story, residential tower will sit adjacent to Life Time’s athletic country club and spa, allowing residents direct access to a range of high-end health and wellness services. The project, designed by LJC, will feature a rooftop pool and lounge, pickleball courts, coworking spaces, a private dining room, and ground-level retail. Each residence will offer curated design touches, upscale finishes, and smart technology throughout.
The following graphs depict material price changes each quarter, with the initial baseline set at Q1 2025. The values represent the percentage change from the initial baseline, offering a clear perspective on quarterly fluctuations in material prices.
The 2025 Q4 Clayco cost projections for Q1 2026 resulted in a 1.82% variance from the actual Q1 2026 costs.
STEEL JOIST & DECKING 4-5 Months ACOUSTICAL DECKING 6-9 Months STEEL BEAMS/COLUMNS 7 Months ROOFING Insulation Board, Membrane, Fastners &
Breakroom Appliances 2-12 Weeks
Doors 6-8 Weeks
Levelers & Dock Seals 8-16 Weeks
Commercial =<25 tons 13-15 Weeks
DX ROOFTOP UNITS
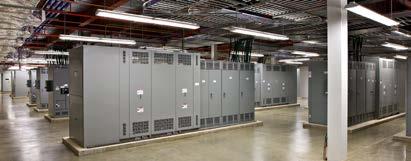
28-48 Weeks Switchboards 18-38 Weeks Panelboards 8-18 Weeks