18 minute read
B. Programming

1. Three Ways to Think About Programming
(The following was presented to the Steering Committee on a call on October 11)
Advertisement
We have submitted a draft report on construction assemblies, and the second phase of our work involves programming the housing. Programming in its most basic sense, just means what space needs a given size household might have.
There are several ways to approach the programming exercise. One is to understand what exists. Another might focus on what needs there may be that are not currently being met. A third might ask how other factors like savings, down payments, financing, subsidies, competition, lot size, availability of services and utilities, and the availability of land might affect housing.

If these other factors are important, it may make the first two approaches less important. Each approach is progressively more difficult.
a) What Exists
This is the easiest and most mechanical approach to programming. We have information from the 2011 RON census, and the 2013-14 Poverty Report which have a lot of helpful information about the sizes and make up of households. We have a rough idea of the sizes of housing models on the island since World War II. We have the Smart House alternates with 2 and 4 bedrooms. If the future of housing on Nauru is more of what exists, this approach needs to be given a lot of weight.
b) What Existing Needs Go Unmet
We can speculate on this, but we need a lot of help in answering this question. It’s hard to know if we are even asking the right questions. The census tells us, for example, that the existing housing stock skews heavily toward single family over multi-family, and to home ownership over renting.
We have heard there is a preference for living with immediate families rather than extended families but this is old information and we don’t know if it has standing anymore.
Although the census doesn’t tell us much about this, the history of housing prototypes since World War II tells us that ready-made housing mostly varies from 70 square meters on the low side, to 170 square meters on the high side.
Then the census gives us a breakdown of household size by percentage; averaging 6 people, but also with a high number of unmarried single people in the age range from 15 to 35, and a small percentage of households, but a significant number of people in households, of 10-15 people.
Does a range of 70-170 square meters correlate to the needs of the household sizes described in the census? If not, how is the existing housing inadequate?
Based on the number of single adults, we see a possible need for housing smaller than 70 square meters. Given the choice, maybe this significant group would live in very small houses for a time. Maybe, given the choice, they would still live in extended households. Regardless, the answer would be important to programming the housing.
We’d like to know if households of 10-15 people are extended families or unrelated to one another, or a combination. If they are extended families, are these large households the preferred living arrangements of just necessary for affordability? If it is the preferred arrangement, then maybe 170 square meters isn’t the upper limit of the needs.
c) What Other Factors Affect or Will Affect the Range of Housing
In 1994, David Whitfield made two observations that he didn’t explicitly connect. He said that housing prototypes have been subsidized in the past, and he said that Nauruan housing is larger, on a per person basis, than housing on other Pacific Islands.
What if these two observations are related – that is, what if subsidies lead to modest overbuilding? It may mean that policy will affect housing in ways that are relatively easy to predict. Just as likely, policy will have unforeseen impacts, too.
In the first phase of the housing study, we suggested that Nauruan homeowners would be well served by building durable homes, but that there would be incentives to reduce front loaded costs which might, in turn, undermine durability and leave Nauruans with a depreciating asset. Does it make sense to create counterincentives for people to spend more money in the beginning so that their houses are of value to their descendants in a generation?
Nauru doesn’t have the wealth it had when Whitfield referred to housing subsidies. If subsidies don’t exist, how will that affect the programming of the housing? The housing committee has told us that homeowners don’t add up a list of rooms they need, then back into the overall size of a house. They work the other way- calculating the overall size they can afford and then dividing the house up into rooms. How does this affect programming, and how much does an analysis of existing housing help us program housing in the future?
Can an appreciable number of people save money for housing? What are down payments on loans and how does the size of the down payment affect programming? Would artificially lowdown payments have the same effect as subsidies – that is, would they result in larger average houses?
Is there, or will there be, a real estate market that allows homeowners to move with relatively ease? Does the small size of the island’s population create impediments to buying and selling homes? If there is a lot of friction in any potential housing market, how might this affect programming housing?
Does it require the ability to expand a house? Does it suggest rental outbuildings? Does it discourage small starter houses, or make them more important? Does it increase the need for family compounds?
Will there be a government effort like the Smart House that dominates the market, or will there be competition? Would a single housing initiative be the best way to benefit from scale economies? Could it address, with a limited number of models, the range of needs reflected in the census?
Would competition be the quickest way to root out problems? Would smaller builders have lower overhead that offsets their inability to achieve scale economies? Could minimum standards be maintained with competition? Could durable construction be better encouraged with a single or with multiple initiatives?
Should there be more multifamily options, despite the fact that the census says renting is relatively rare? If there are no subsidies, or if a lack of savings is an impediment to ownership, do rental options make sense where they didn’t in the past?
Is there a mechanism for placing value on unimproved land based on the size and location of the lot? If there is, could smaller lots increase the affordability of land with houses?
Is there anything about programming that could increase security? Does security lie in dispersion of housing on larger lots, or in smaller secured yards? Would usable and private outdoor space make it easier to build some smaller houses?
What kinds of unforeseen opportunities will be presented by the HGI and the planning of topside – the roads, the blocks, the lots, the public spaces – that Metrocology will provide this winter?
Many of the questions in this third approach are unanswerable. Even this inability to answer these questions right now has implications for programming the housing. Likely Nauru will require flexibility and as many options as possible.
(Note, the following was not presented to the Steering Committee, but might be thought of as a fourth way of thinking about programming)
d) Addendum on Programming
In programming a house, you can stipulate the space needs and derive a cost for the house. Or you can stipulate the cost of the cost, based on estimated unit costs, and back into the list of rooms. In reality, you informally do both and see how close needs or desires match up with the desired budget. Another way to think of programming is the reconciliation of these two processes – either the budget gets relaxed a little, or the space requirements are relaxed a little.
Take the example of the Smart House. Although its sizes seem consistent with historical models, the programming was apparently not based on precedents. The budget for the 20 Smart Houses is listed as $3,000,000, so it appears that each house has been estimated at $150,000. It’s possible this was the starting point for the exercise, or it is possible the size of the model was starting point.
We do not know what costs this number includes - if it is hard costs or soft costs - or if this is a full or subsidized cost, or if the entire cost of construction is to be passed through to the homeowner. Since there are two models that vary in size and since we do not know the programmatic mix, it is impossible for us to determine an estimated square foot cost.
If better information is available on the likely range of unit construction costs, it would help a lot to know that. Then you could work backwards from a total budget. This method is more consistent with how the housing committee described the process of self-built housing.
If some of the assemblies are more expensive than they need to be, like the foundations of the smart house, then their elimination allows you to either build a slightly larger house, move the discretionary money to other assemblies, or reduce the cost of the house.
2. Notes on the Presentation by the Global Institute for Sustainable Prosperity
October 12, 2021, for a call on October 11.
The import of this report for housing lies mostly in the findings that even the most optimistic models for government debt affor d little prospect of housing subsidies like those prevalent when the island was wealthier. Subsidies can have the effect of causing people to overbuild. Whitfield suggested in 1994 that Nauruan housing was generally larger than housing on other Pacific Islands and subsidies are one possible explanation for this.
Conversely, without the prospect of subsidies, which currently go to families with children, it is likely that Nauruans should be looking for housing types smaller than the smallest prototypes in the past.
Also relevant to housing is the report’s conclusion that solar electricity and island grown food is critical to reducing government debt. Solar panels and food production would unavoidably compete with topside land dedicated to housing. This, in turn, suggests that reasonably compact settlements be an option for any topside housing.
Fadhel and the members of the Institute presented three scenarios for future expenditures, revenues, and budget balances. Only the third scenario offered the hope that the budget could be balanced.
RCP revenue is currently about 55% of total revenue. It has been modeled at both zero, in Scenario 1, and at 50% of current levels in Scenarios 2 and 3. This is offset in Scenarios 2 and 3 by reducing money in imported fuel for electricity generation and on imported food.
Scenario 1 assumed zero revenues from the RPC and a continuation of past trends for expenditures on imported fuels and food.
Scenario 2 assumed future RPC revenues of 50% of current revenues and modestly increased generation of solar energy and food production on the island. This decreased expenditures on fuel and imported food but did not eliminate budget deficits.
Scenario 3 still assumed future RPC revenues of 50% of current RPC revenues, further increased electricity generated from solar, and further increased island food production to a point where budget deficits were eliminated.
Two important things are unclear: 1) how much land is required to increase solar and food production in Scenario 3 (There is an attempt to work through this below) and 2) whether the savings realized by increased production of solar energy and food included the costs and investments related to those increases.
Even in Scenario 3, and even if the projected savings are nets savings after infrastructure investments for food and solar production, there is apparently no revenue for housing subsidies as there was several decades ago. As noted above this will impact programming.
The final slides of the presentation stress the need for education and training, and so if construction skills can be built up, the HGI would contribute to building those workforce skills. It is unclear whether there would be a revenue increase from the wages of construction jobs the program would create. SECTION table 1: Households, population size and adult equivalents by expenditure level HouseHold table 3: Number and proportion of children per household by expenditure level cHildReN
8. The following table summarises the characteristics of the survey in terms of the estimates for the total number of HH and population in Nauru. The table also shows the estimated number of “adult equivalent” population which is used as the basis for the poverty/hardship estimates.
c.2 HouseHold exPeNdituRe
14. Household total weekly expenditure averaged $665 AUD and the average total weekly expenditure per capita adult equivalent (p.c.a.e).was $125.38 AUD. For the lowest expenditure deciles (1st and 2nd deciles), the average weekly household expenditure was $384 AUD and $432 AUD ($43.25 and 67.39 pcaae), respectively, compared to $920AUD and $1053 AUD ($239.21 and 405.44 pcaae) per week for the highest expenditure deciles (9th and 10th deciles (Table 4).
table 4: weekly household and adult equivalent average total expenditure (Aud $ per week) by decile
3. What the Census, The Poverty Report, Existing Housing, and the Smart House Tell us About Programming
a) The Census
The 2011 Republic of Nauru Census draws a pretty clear picture of housing in Nauru as it exists –ownership versus rentals, single family as against multi-family, the distribution of household size, or the number of rooms and bedrooms, or the age of the housing, or car ownership.
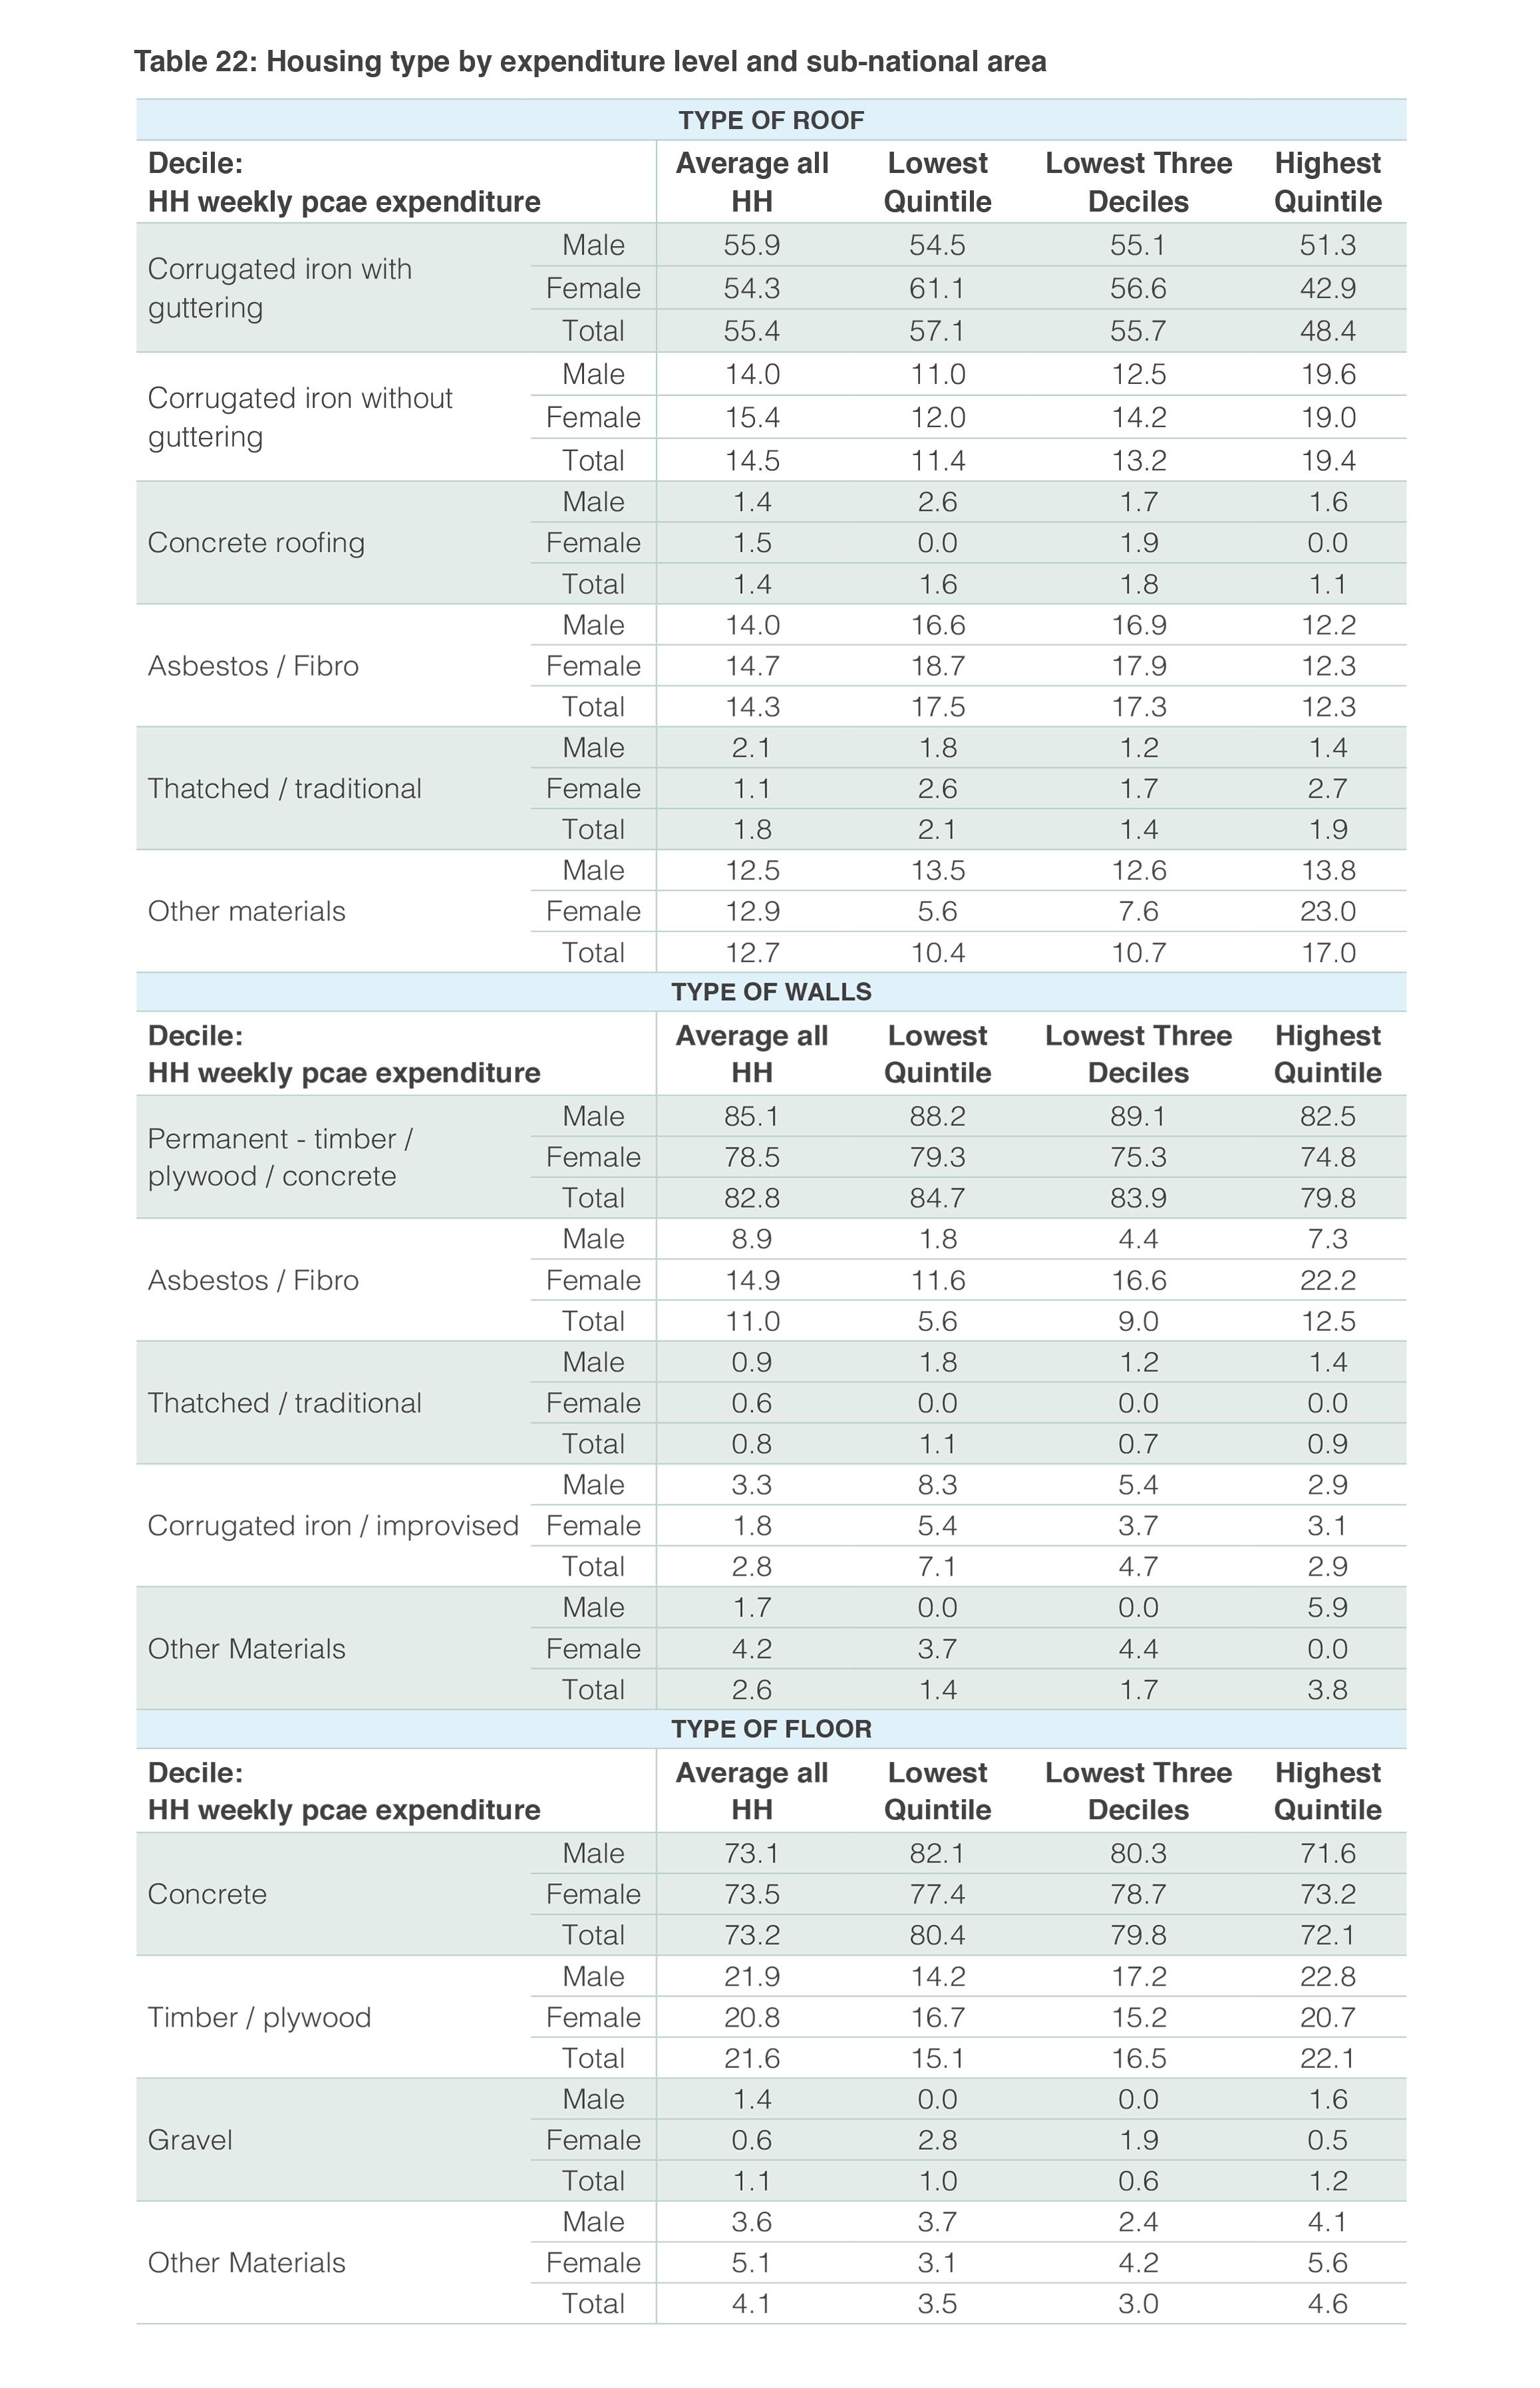
It gets into detail about assemblies that were referenced in the precedents phase – the material of the walls, the types of windows, and the material of the roofs; even the size and the material of gutters, downspouts and cisterns, and the prevalence of types of kitchen appliances.
It is less helpful on the total square footage of houses, or the number of people per bedroom, or bathroom, or the size of bedrooms, or the relationships of those sharing a large household. Some of these shortcomings can be addressed by reference to historic housing types or to the Smart House.
b) The Poverty Report of 2012-2013
This reports average household size at 6.8 compared to the 6 cited in the census. This report breaks household size down by income decile. The average household is 11.1 in decile 1 and 3.1 in decile 10. (Table 1)
Children per household is 4.1 in decile 1 and 0.9 in decile 10. (Table 3).
16.8% of households were considered poor by the report’s measures. This included 24% of the population. Poverty among widows was 60%.
Table 22 cites 75% of households have concrete floors and 21% have wood framed floors. This breakdown is not in the census.
c) Other Sources
As noted, housing since World War II has ranged from 70 square meters to 170 square meters, but we have no plans of these houses and so have little information on the size of rooms. We have little or no information on self-built housing.
We know that the housing stock is aging and that some of it has not held up well. We know from historical photos that the assemblies of buildings change over time. In the precedents binder we noted that different ways of building usually reflect different ideas about how to assess the trade-offs of different assemblies. We assume some changes are based on experience and that still others are based on trimming costs.
For the sizes of rooms, for which so little information is available, we have relied inordinately on the Smart House and on some feedback from the housing committee. But we also got the impression that the Smart Housing programming was not the result of detailed surveying of needs than an informal averaging of what exists.
As mentioned previously, the housing committee said that programming is seldom an additive process of identifying space needs, but one in which the overall size is determined by affordability, and that the rooms are derived from that. At the same time, we do not know exactly how the cost of a given size house is determined, or if there are conventions for unit costs.
As noted earlier, we do not know if the existing housing reflects the range of existing needs, but it is likely that it doesn’t, and so we are left to guess about the needs that are unaddressed.
Most existing housing was built when Nauru was a wealthier nation, and the housing could be subsidized. It is likely that this encouraged overbuilding a little, just as low interest rates on home loans might cause people to overbuild.
As the housing is relatively old, existing housing would fail to capture any social changes, and it is difficult to tell if Nauruans would live the same way if afforded more choices in living arrangements. Would living with the immediate family be preferred as anecdotes have it?
Would younger singles move into smaller houses or rentals? Would the elderly move back in with mature children? Is there preference for thinner houses with more windows and better cross ventilation, or is cost the overwhelming determinant of window count and sizes? Could there be an inner yard that is walled and secured. Would porches be used and justify their costs? We have little information on any of this and don’t know if surveys could identify these preferences.
Finally, as mentioned above, we don’t know how policy might affect the programming of the housing. Likely subsidies – either direct subsidies or artificially low interest rates or down payments – would be an incentive to overbuild. Is there a habit of saving for homes? Would a much smaller housing option make it easier to make down payments?
Can houses be bought and sold, or are they difficult to re-sell? If they are difficult to re-sell, how does this affect the sizes of homes? Is there a small-scale speculative market for houses?
Are they built only with a buyer in mind? We understand it has been a while since the last housing program. Has recent demand for housing created a private market for building that could be used to good advantage now?
Does a single large government initiative like the Smart House afford the best prospect of achieving scale economies, or are any potential scale economies offset by higher overheads and administrative costs? Would competitive initiatives be more responsive to housing needs and something like the Smart House? Would they be harder to monitor and regulate?
C. House Types
1. Proposed Single Family House Types
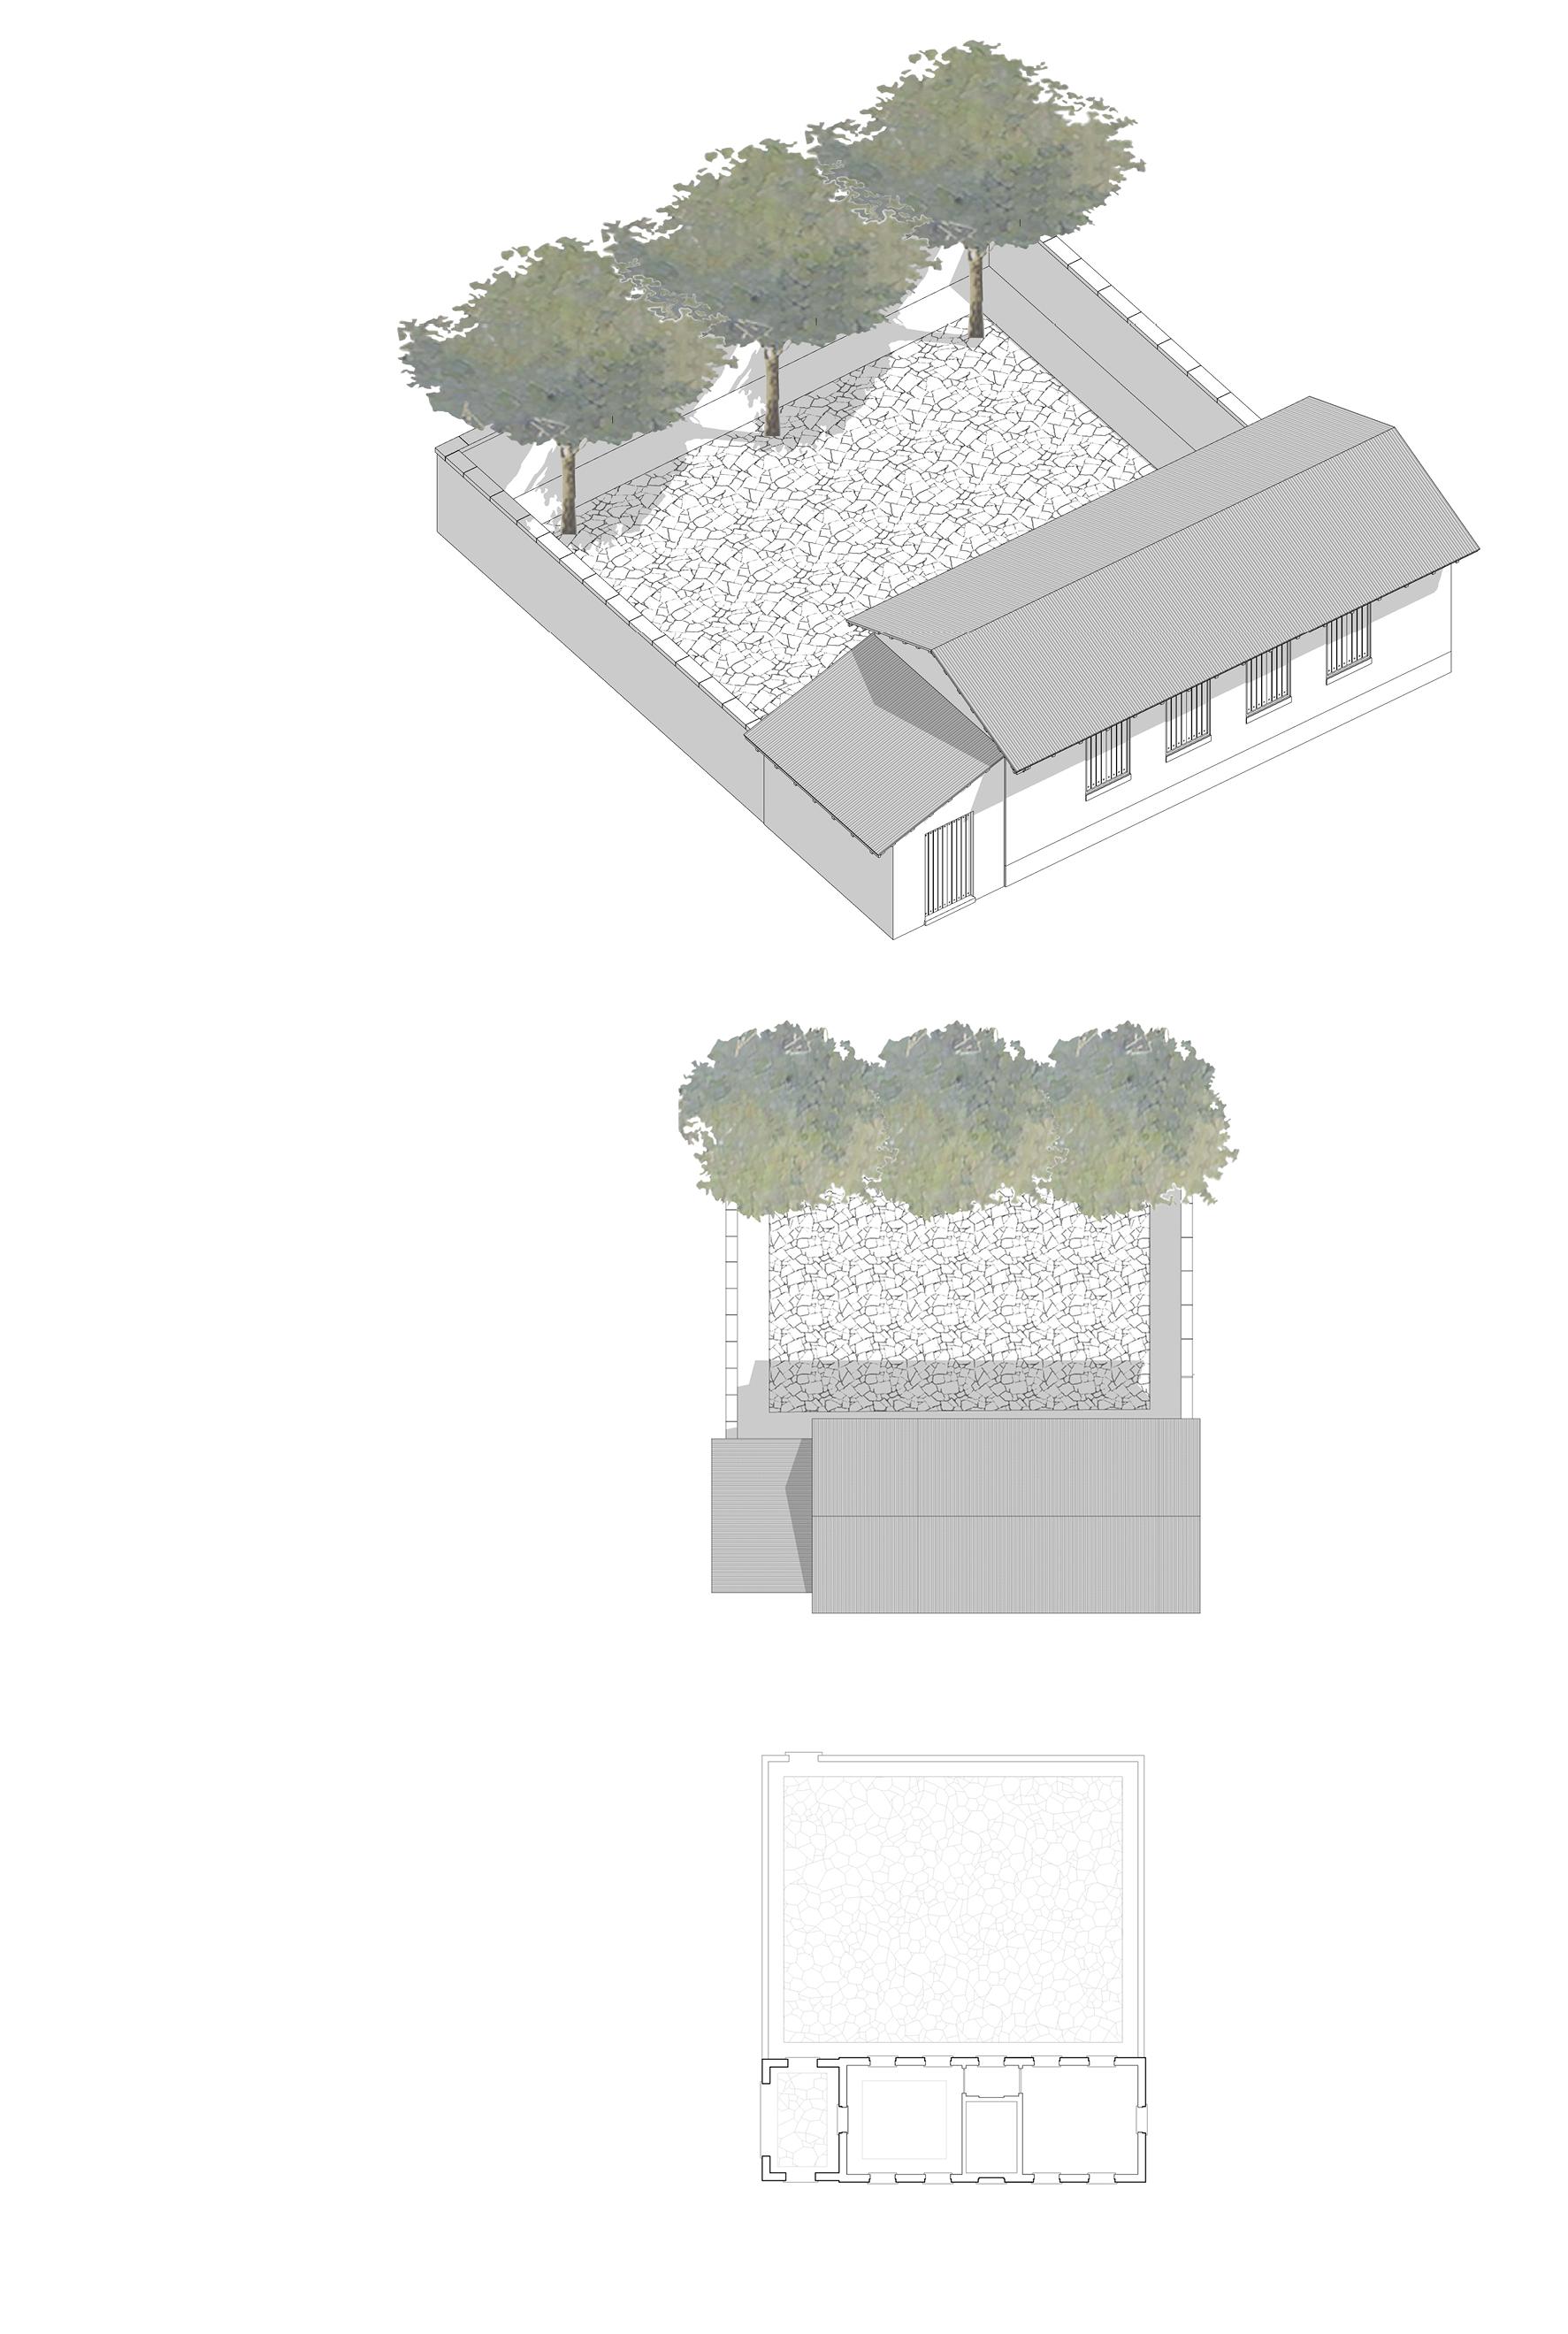
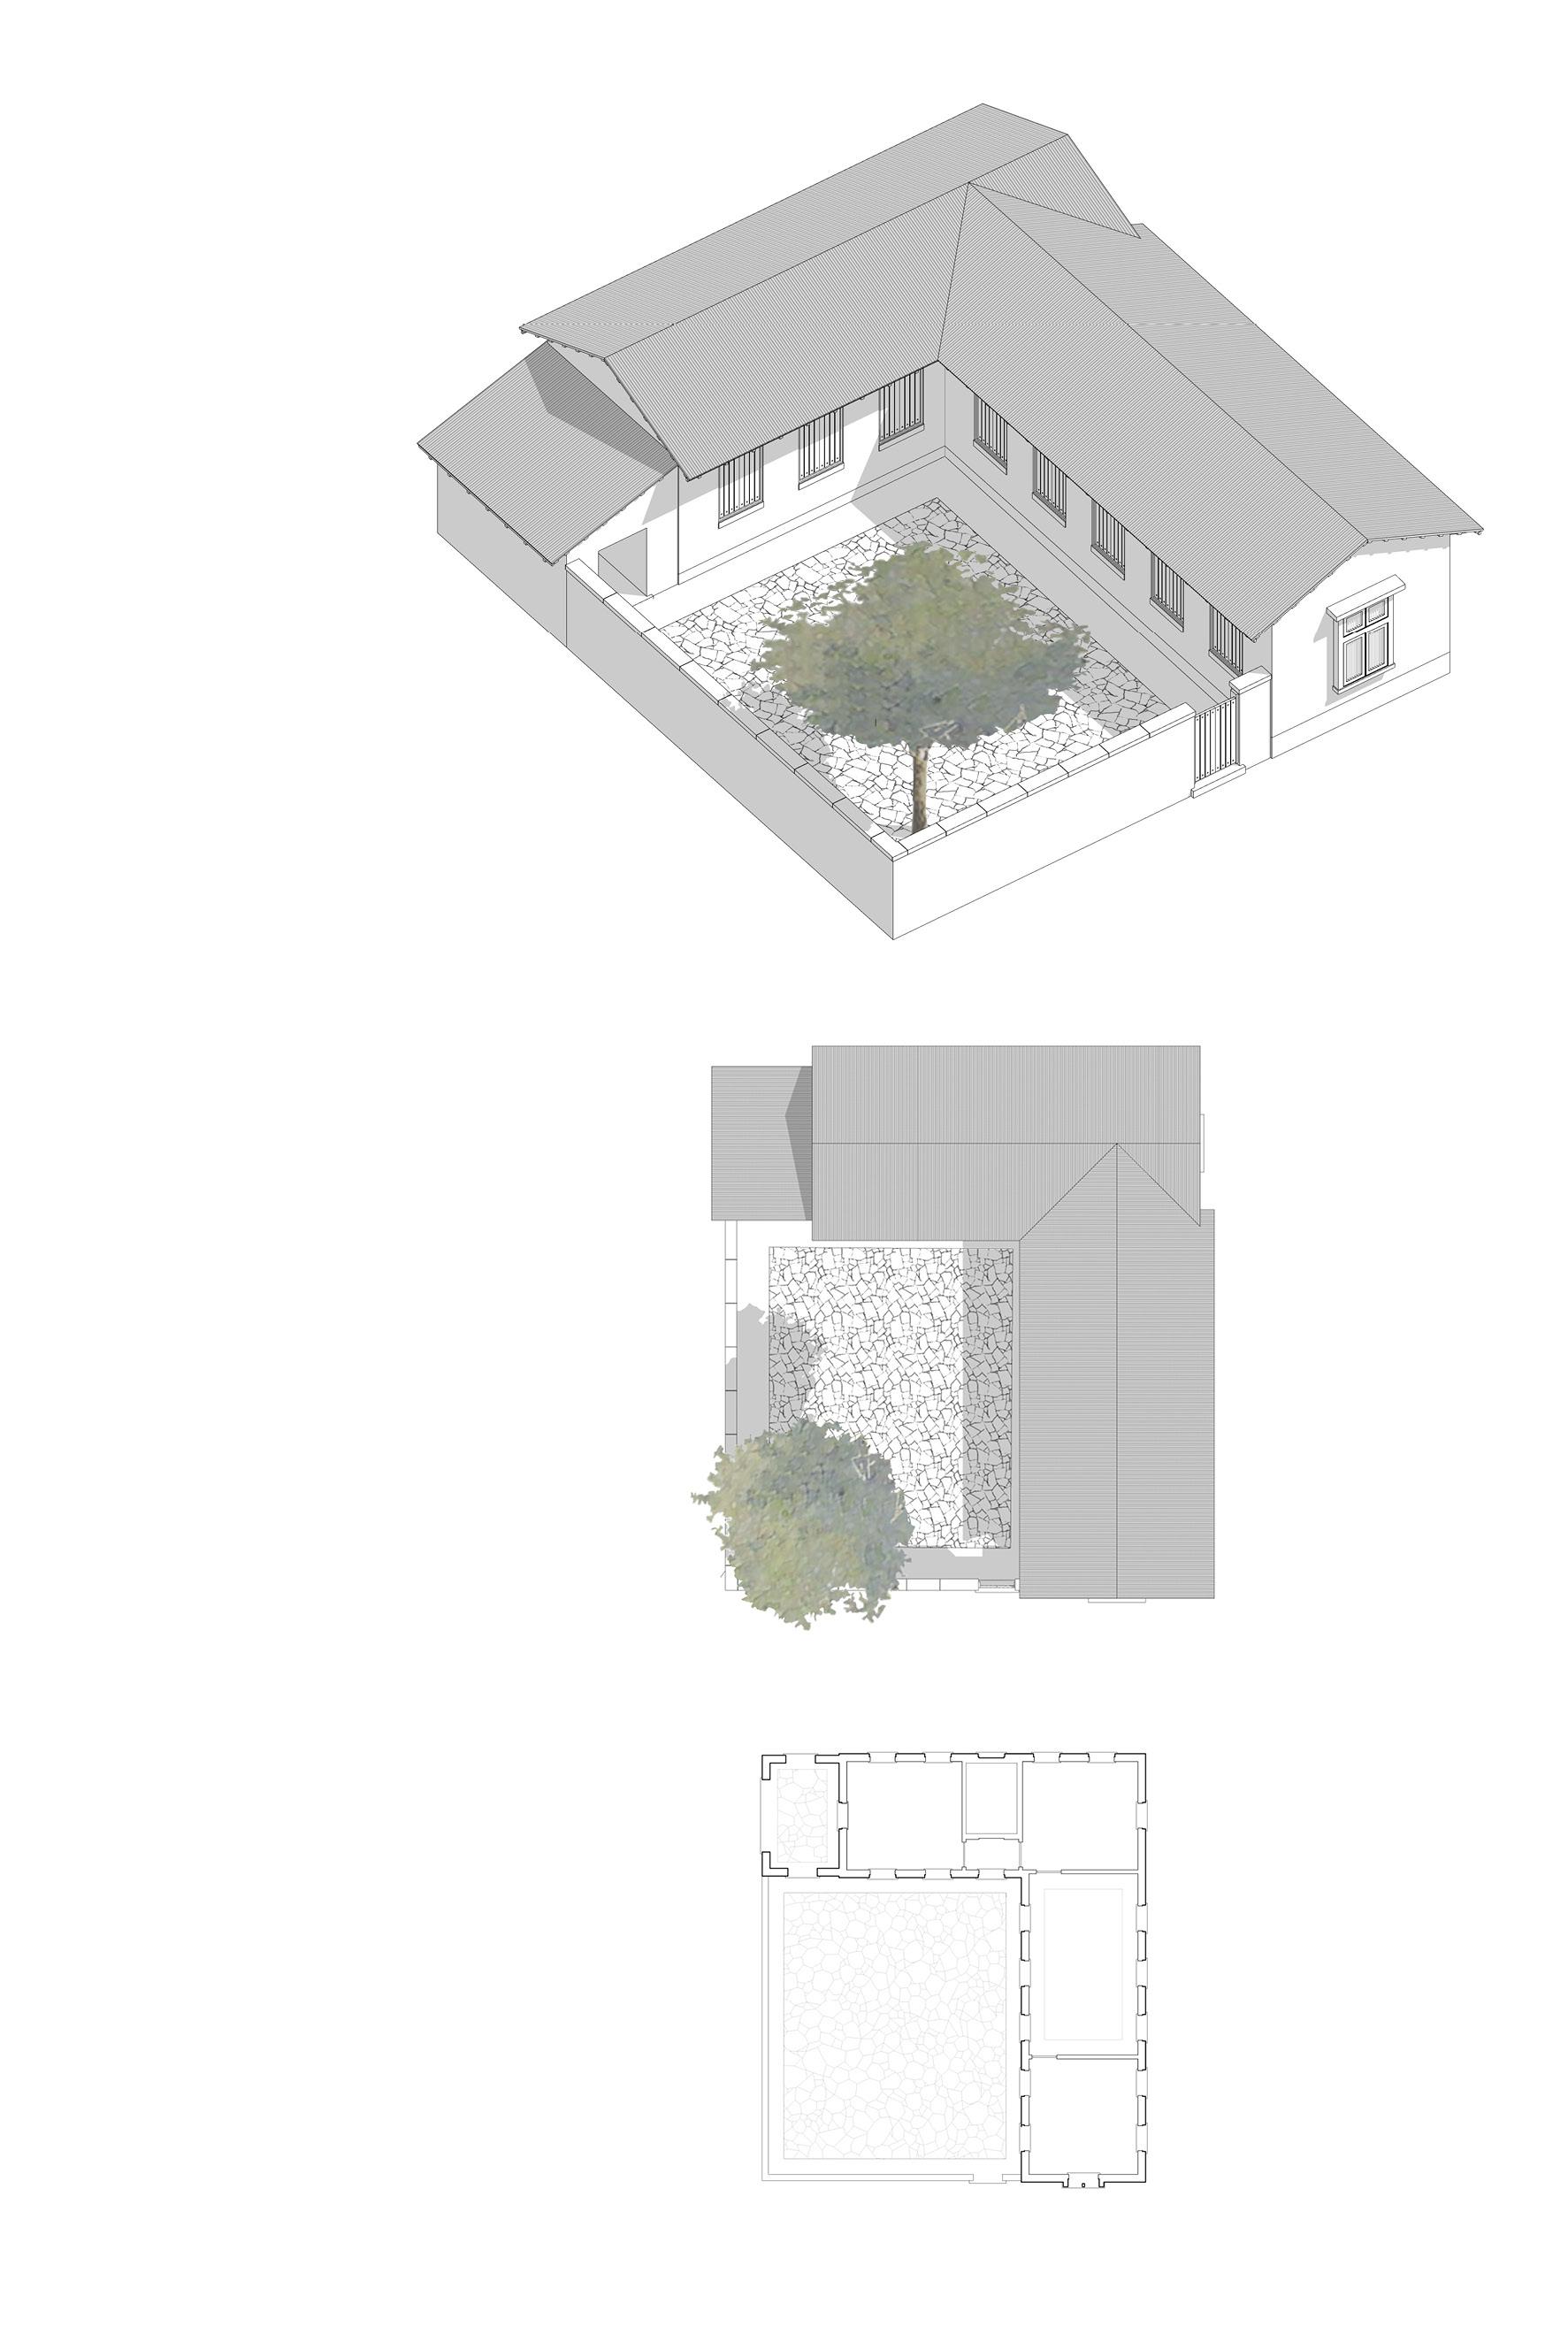
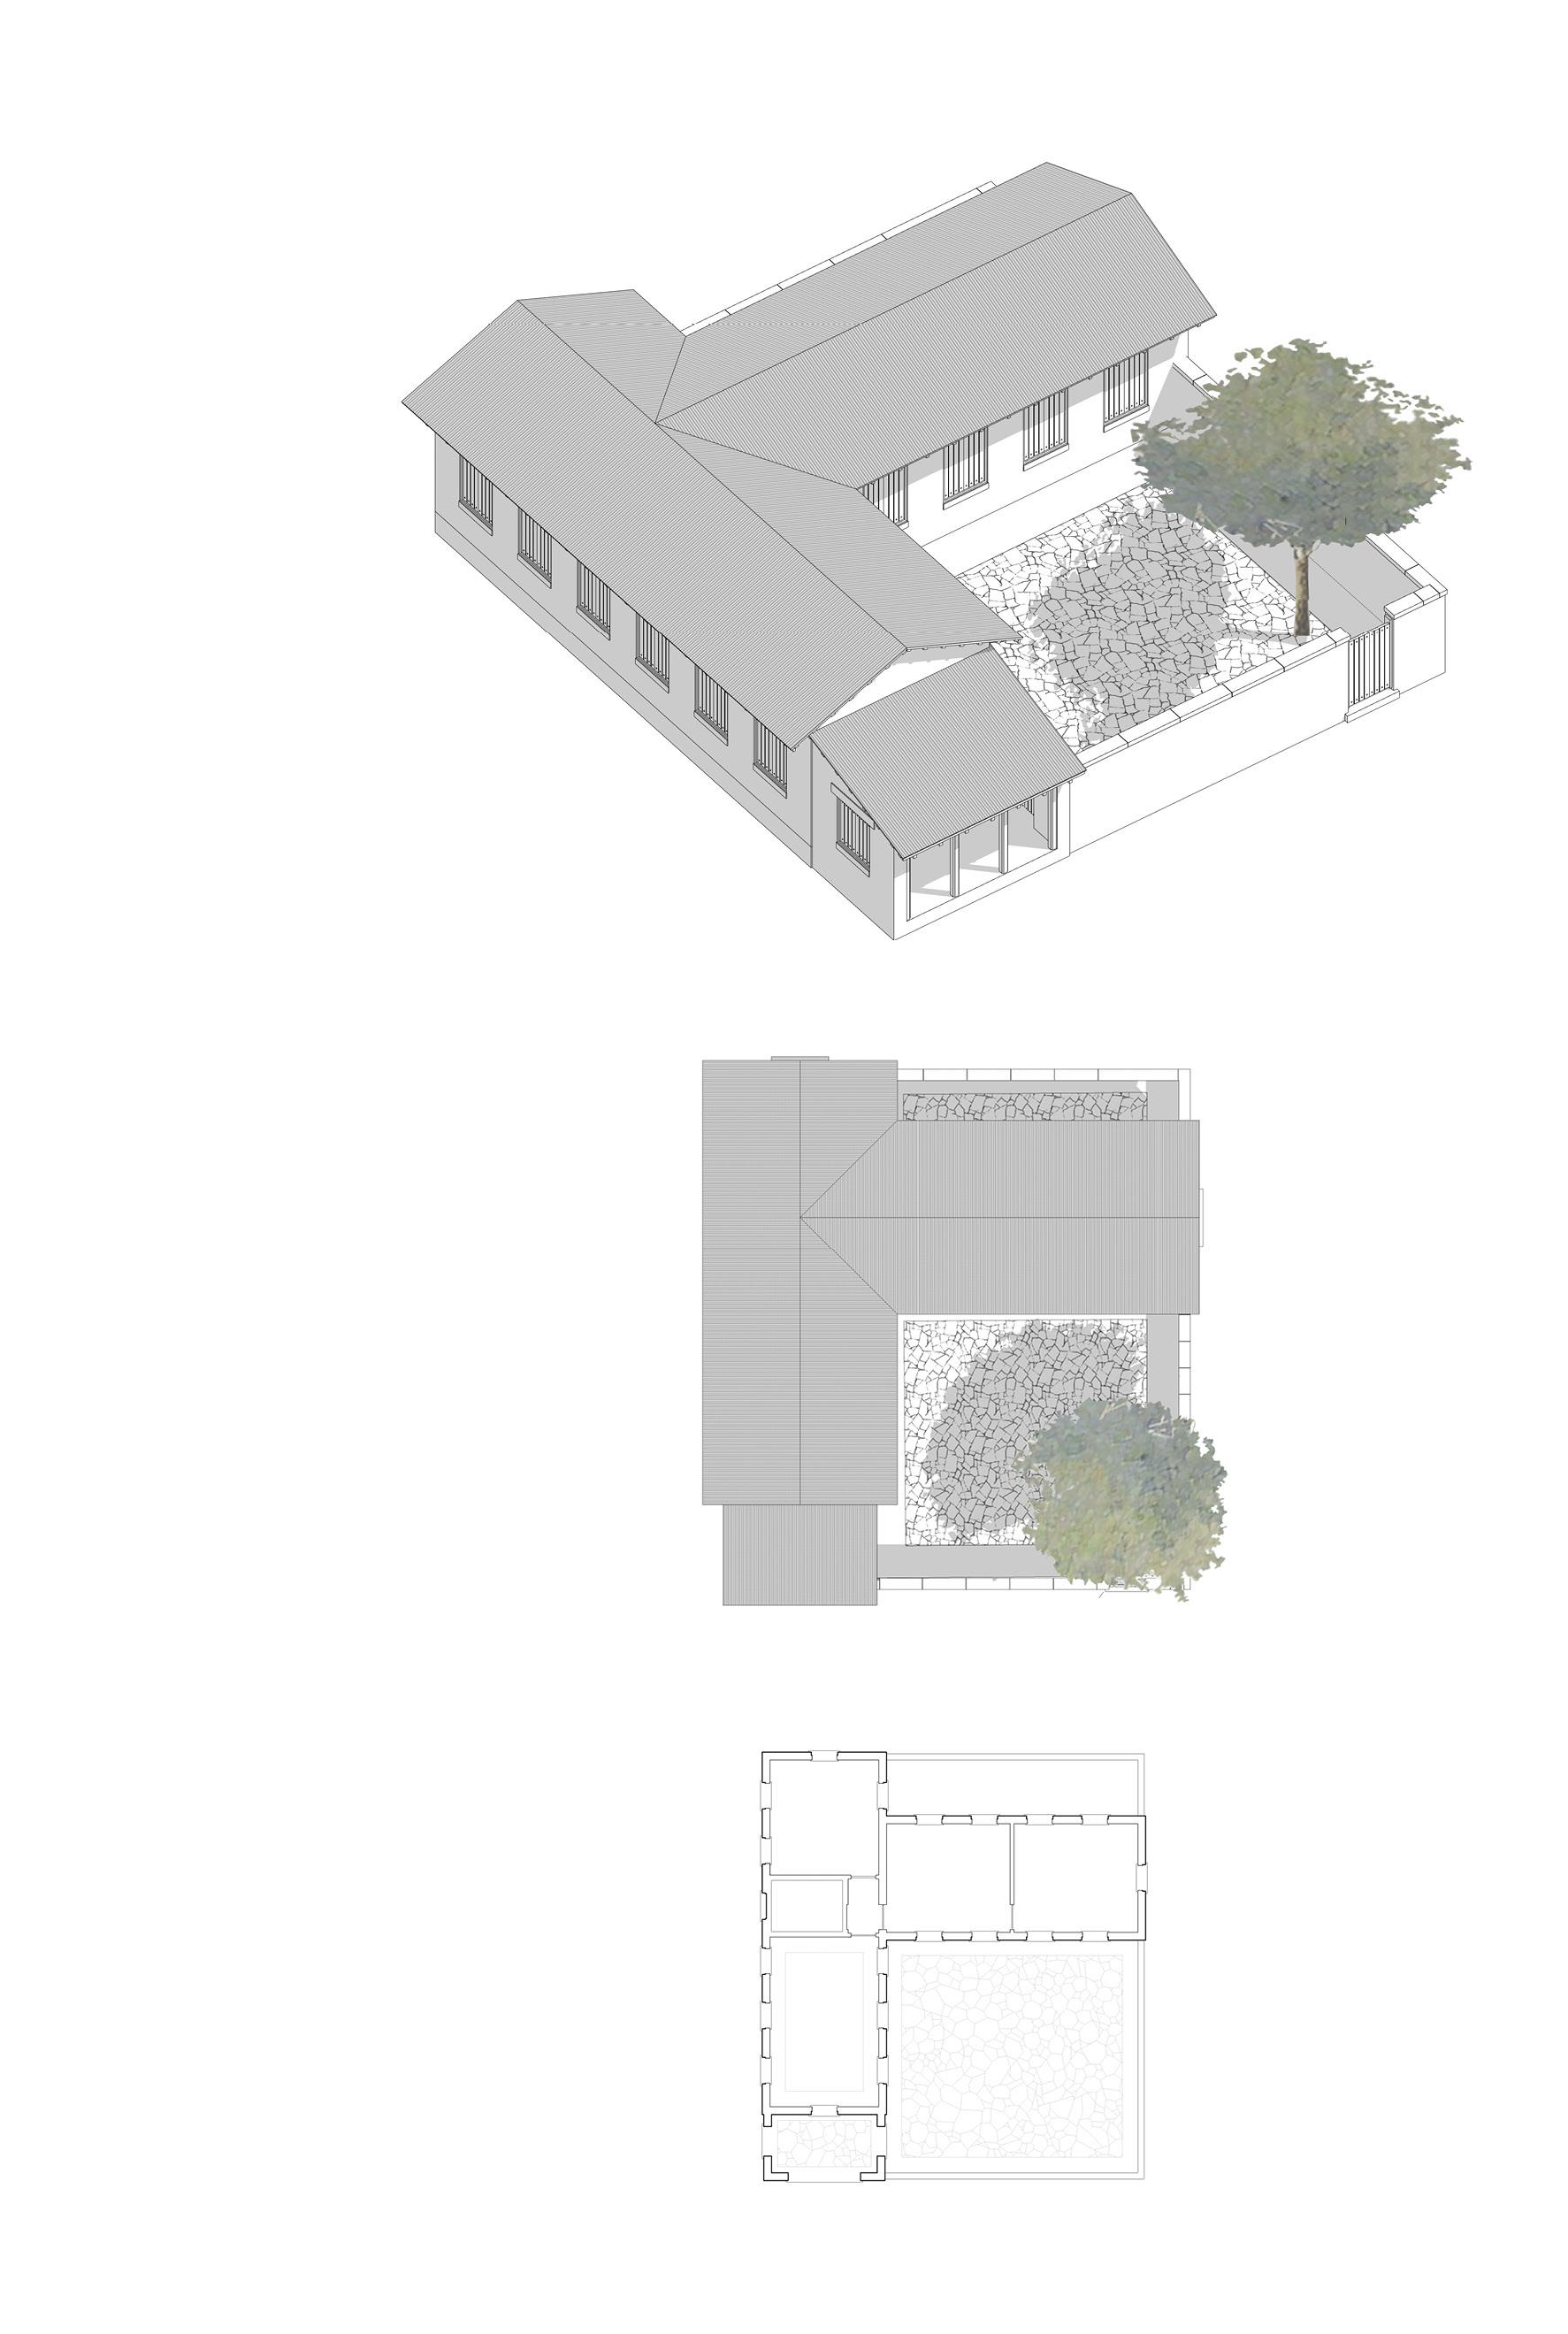
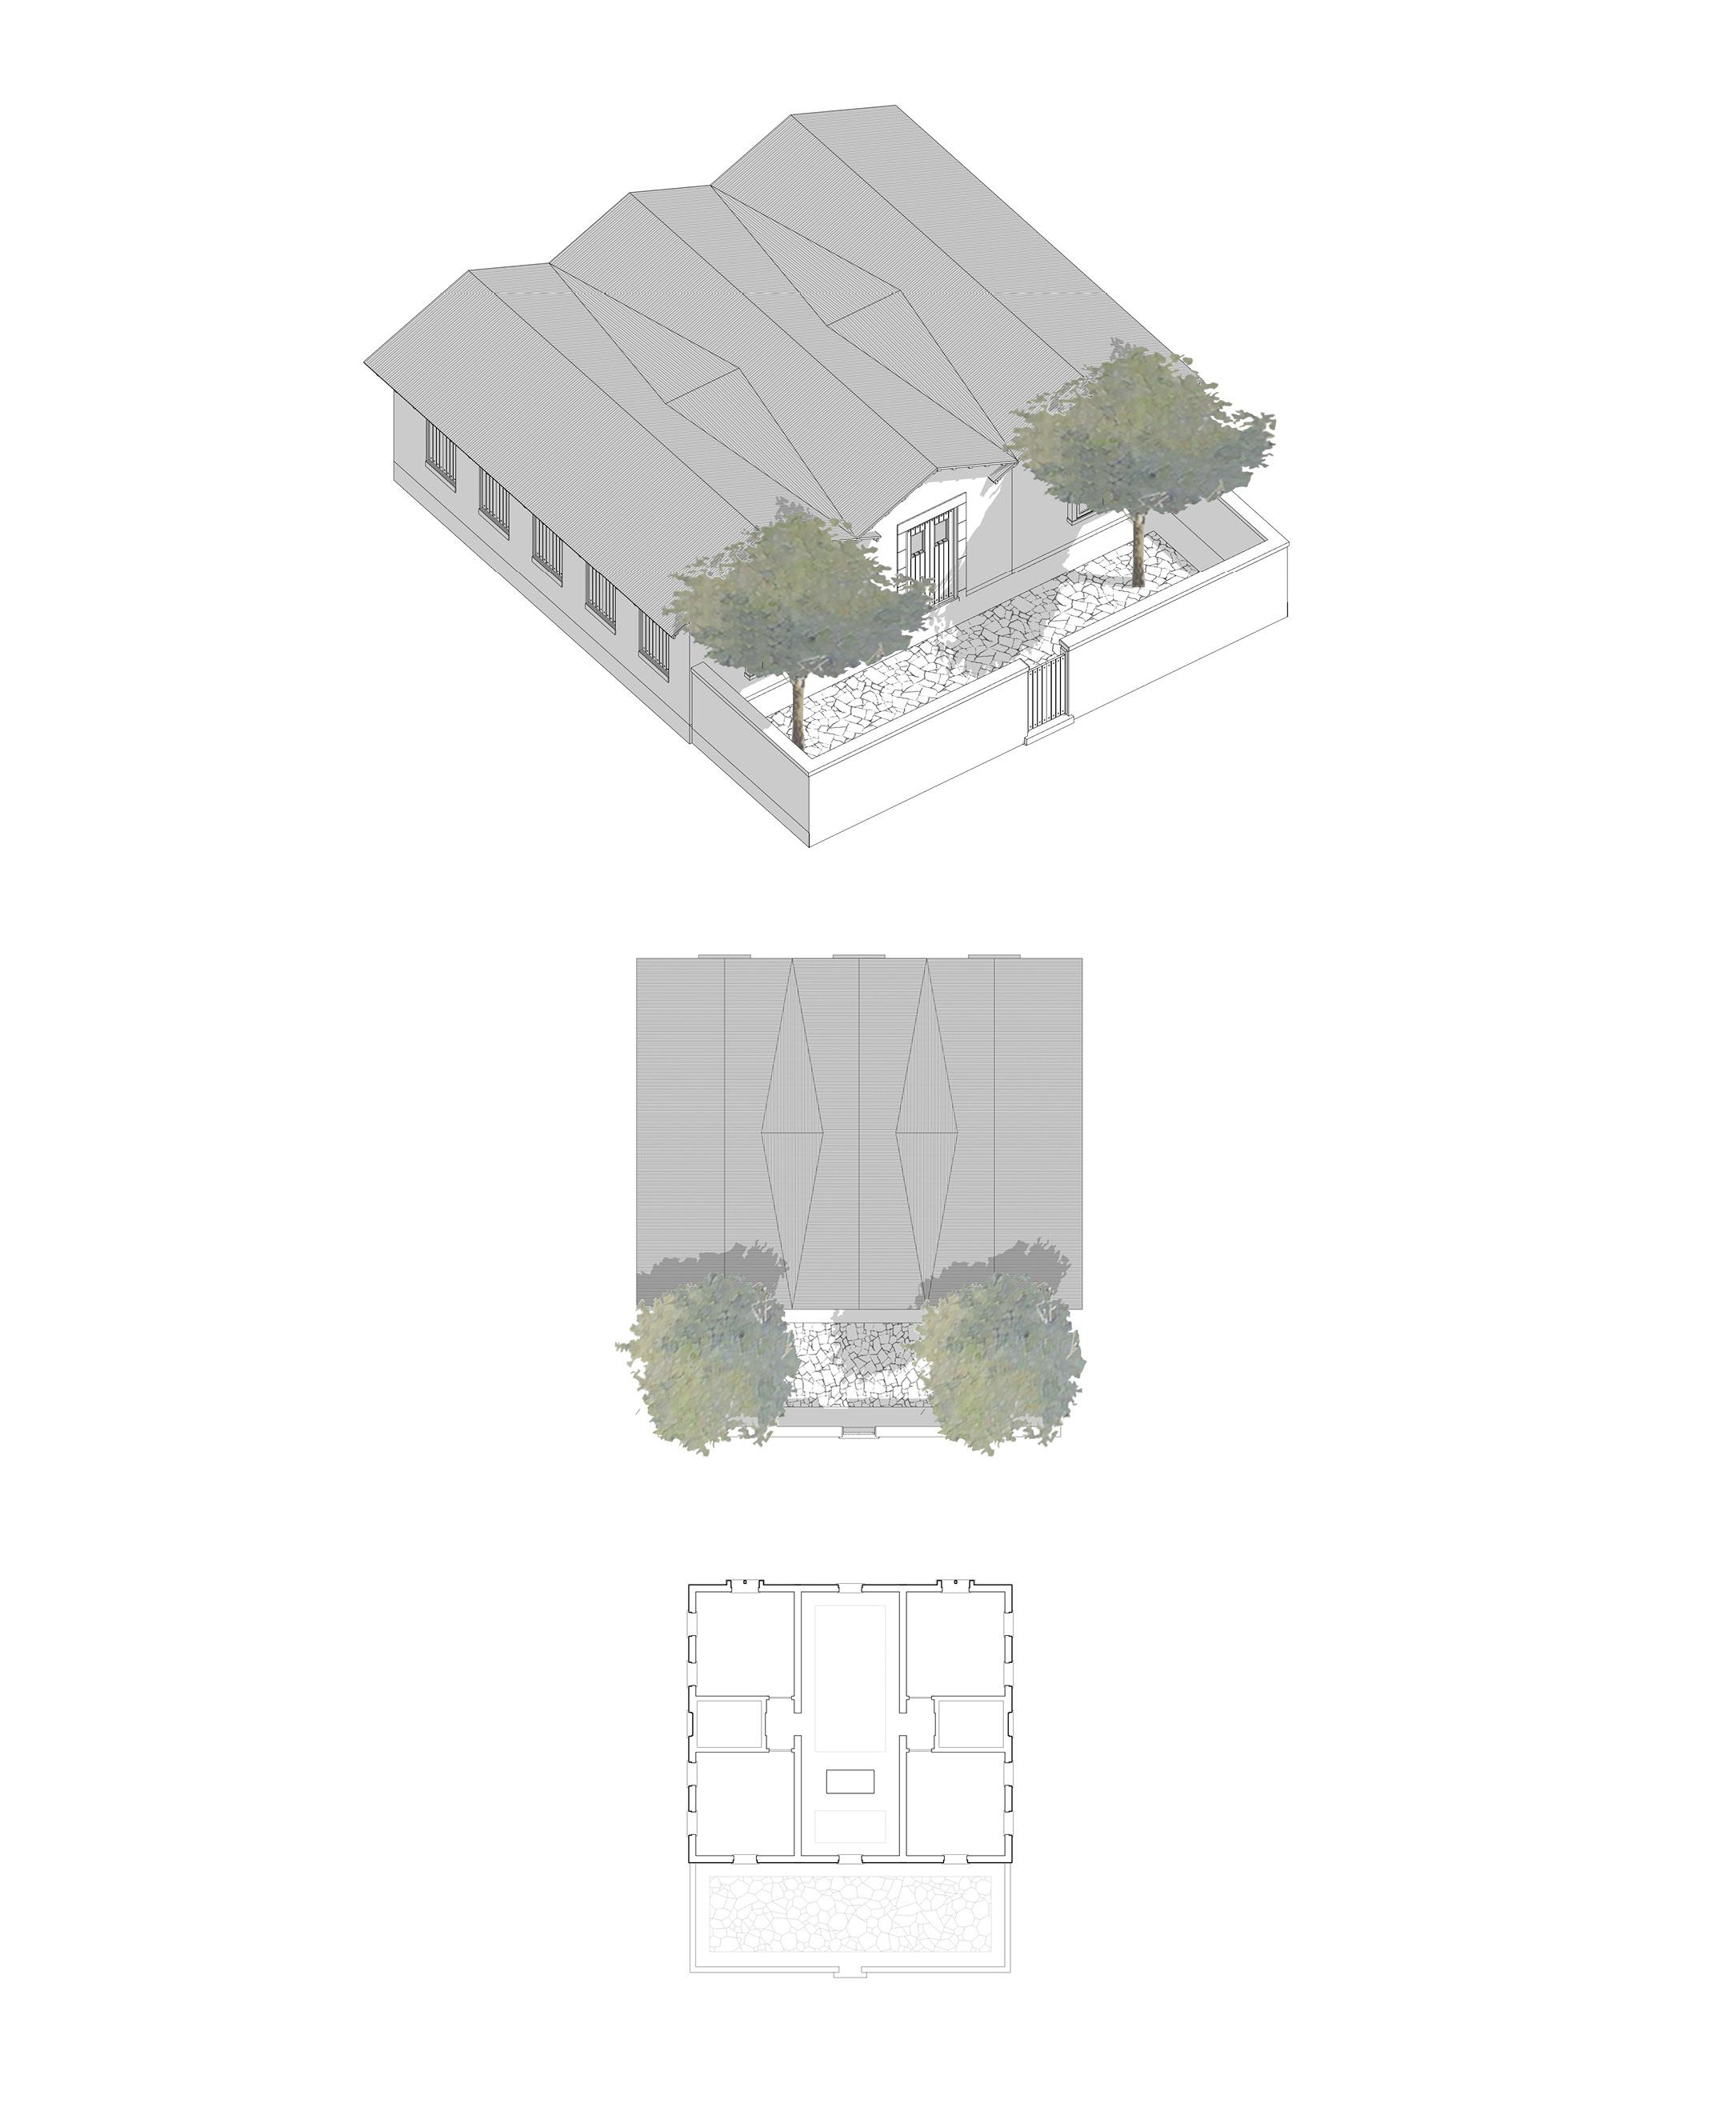
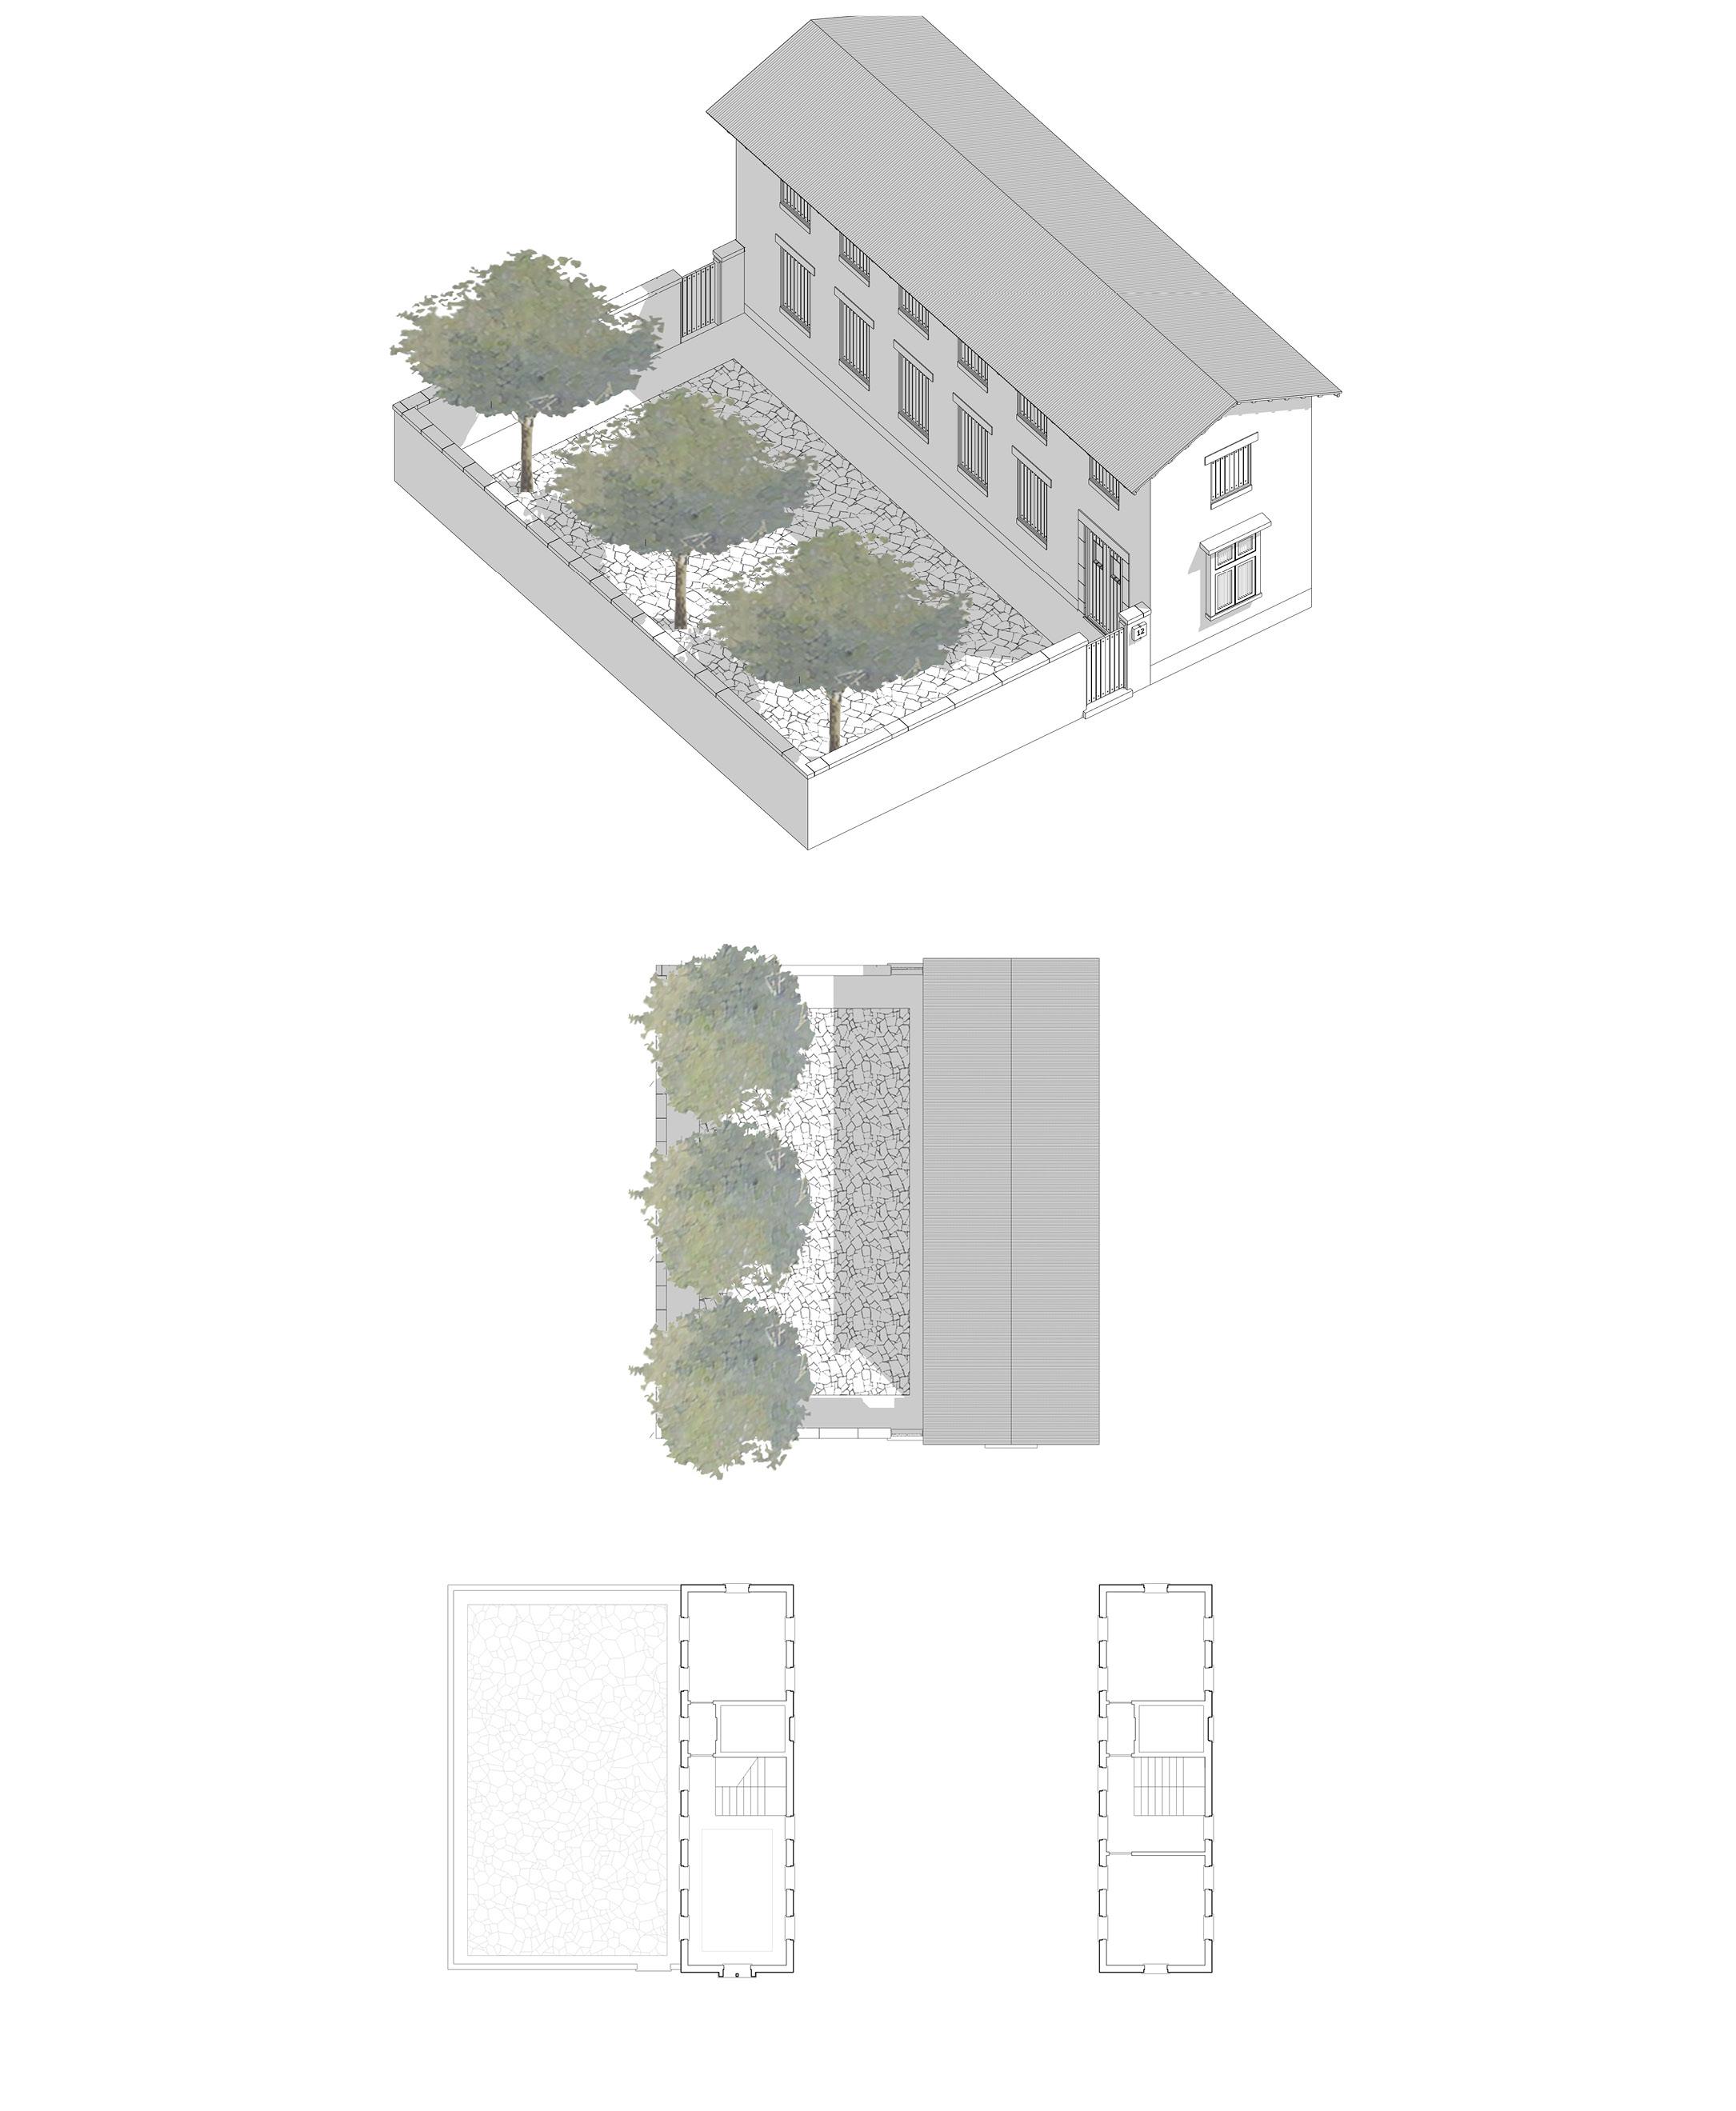
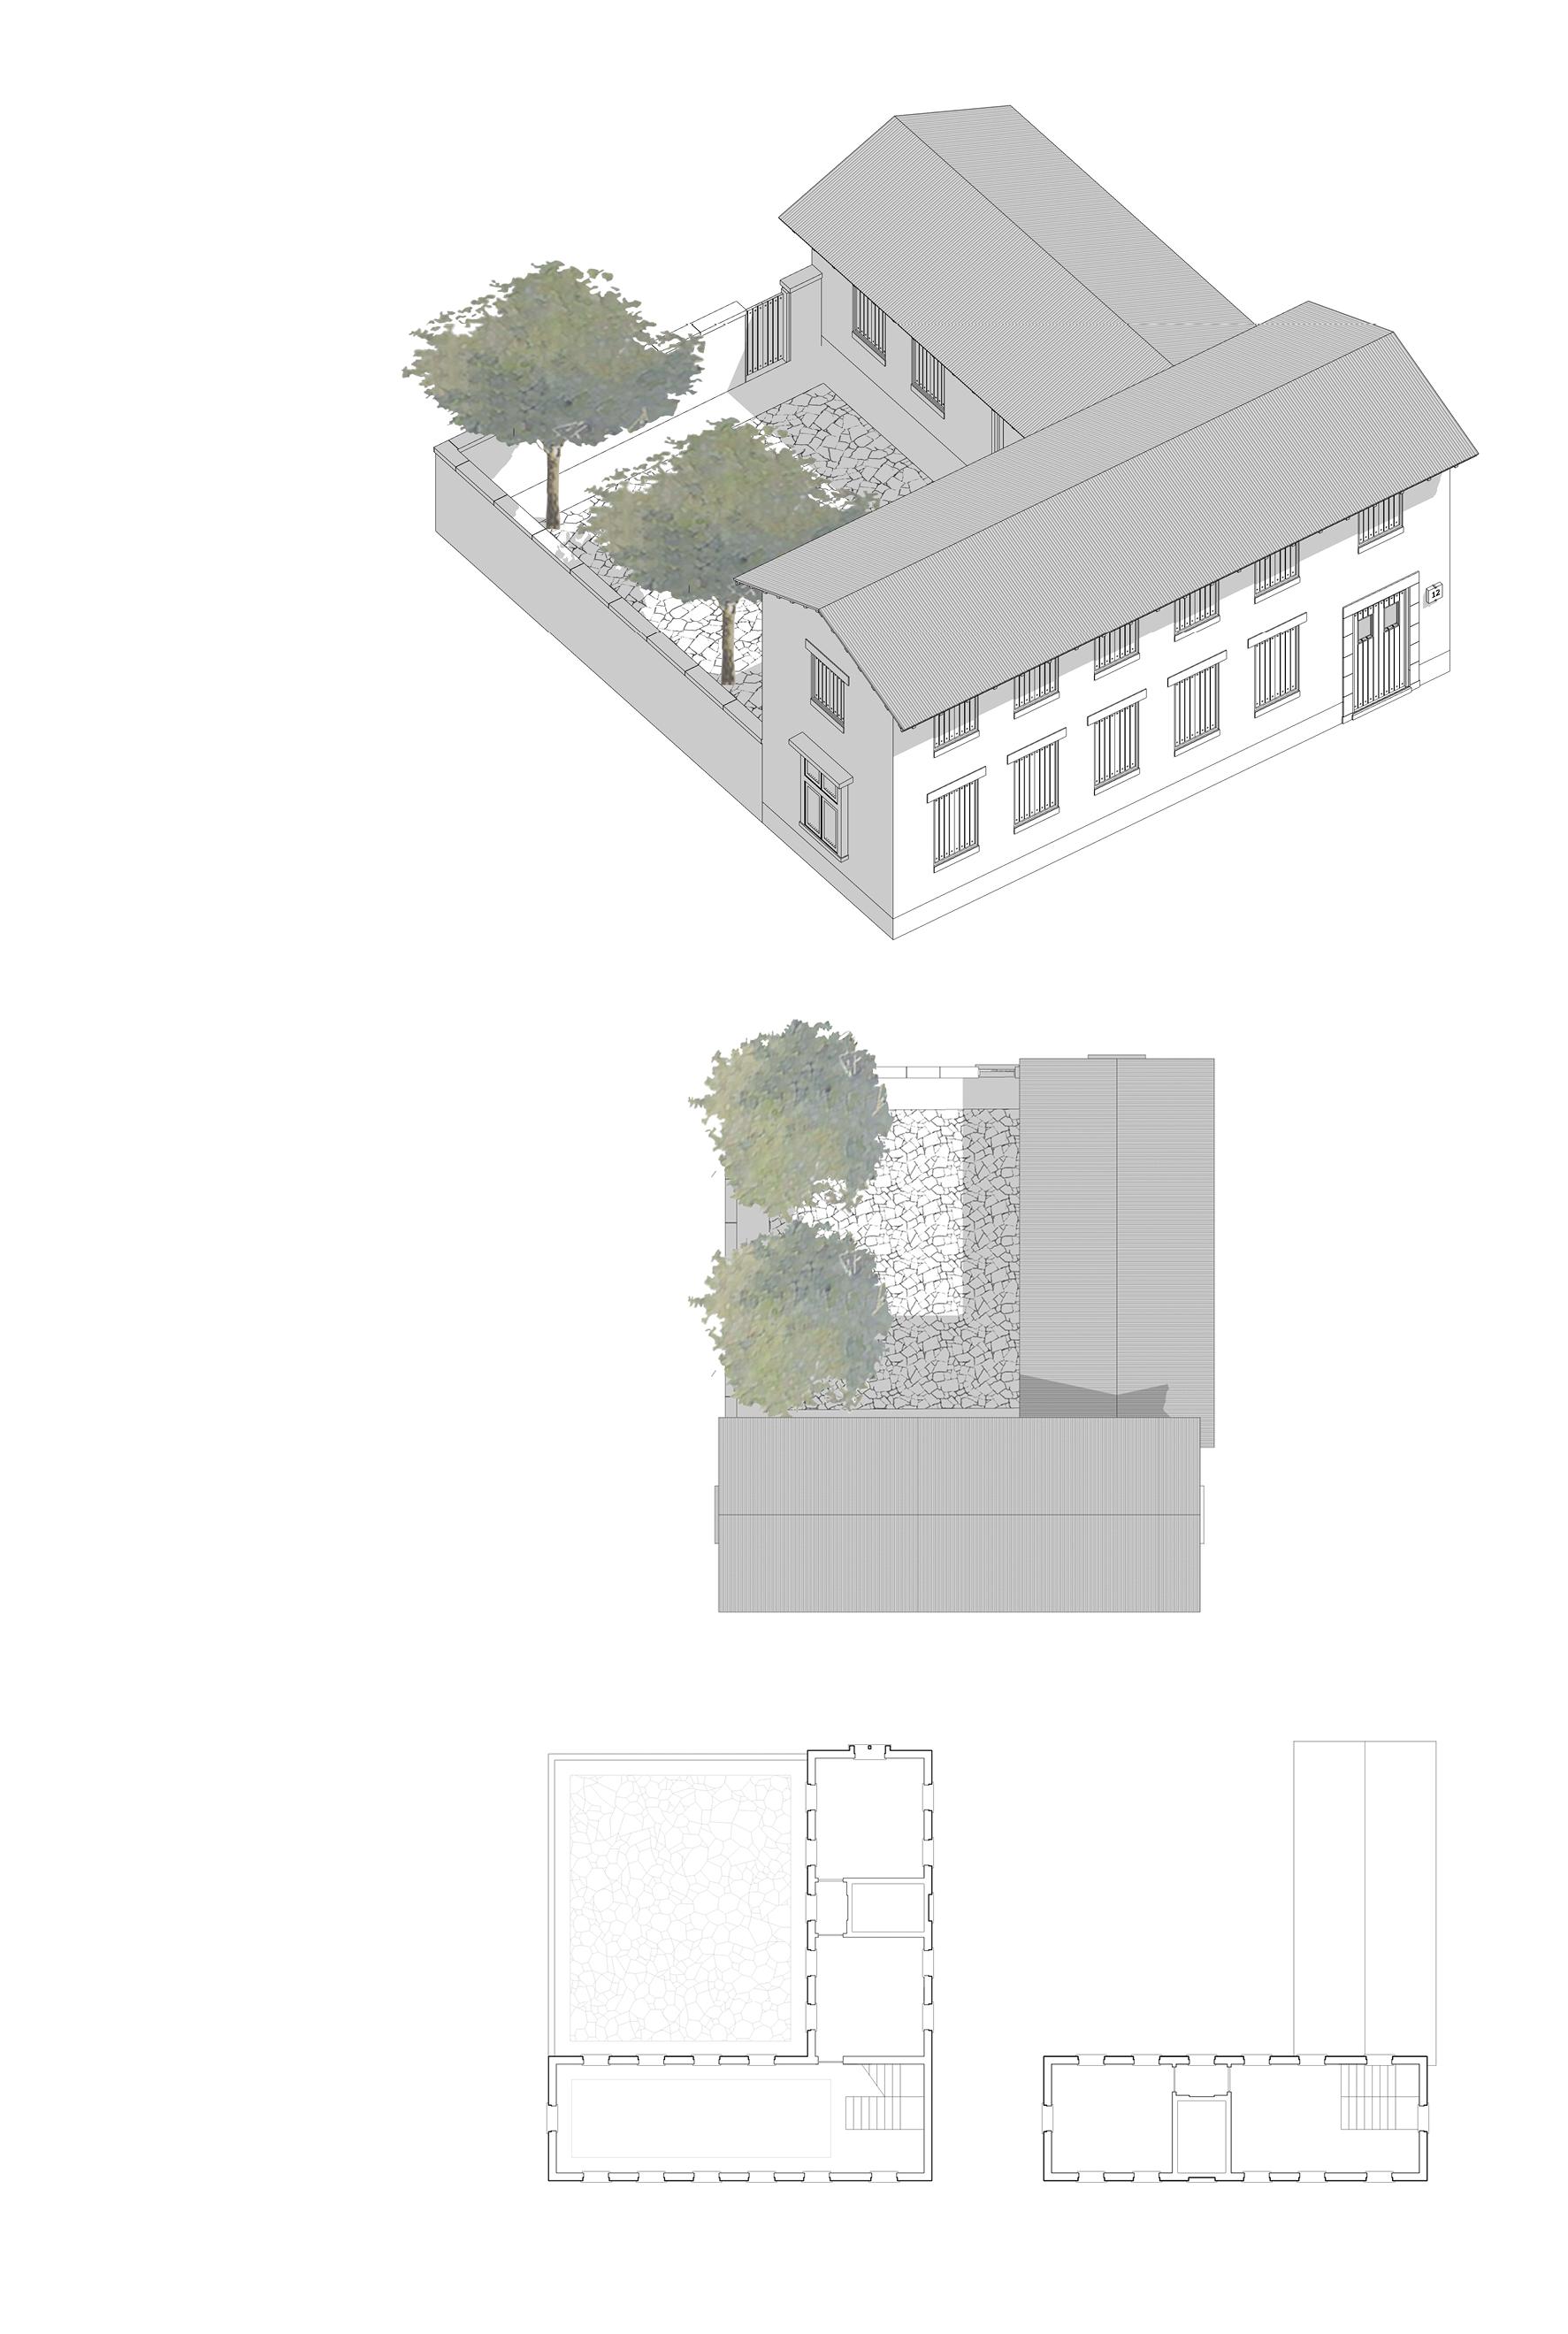
The following studies take a limited number of plan types with more or less constant cross sections and extrude them or bend them or change their orientation to the street. Houses are typically 4 meters wide on the outside and closer to 3.6 meters on the inside, a number the housing committee suggested that bedrooms converge on.
Bedrooms are usually about 3.6 meters on a side. Public rooms are 3.6 meters wide and variable in length but usually converging on the 10 meter length of the public rooms of the Smart House. Bathrooms are typically half the size of a bedroom.
The important constant for saving money is the cross section. Length can vary for flexibility. Wings can be extended. Straight houses can be expanded into L’s and C shapes. Frontages and setbacks can be constant or vary. Orientations can vary. With these limited and relatively inexpensive planning variables, neighbourhoods can achieve unlikely variety from a handful of house types.
The four-bedroom version of the Smart House is about 120 square meters. The two-bedroom version is about 80 square meters. There should be a smaller house type than currently exists, so we developed a 40 square meter type. We tried to keep all variants close to one of these multiples but that proved a little inflexible. If the cross section can be maintained as a constant, modules should be relative less important.
Roof forms can vary even as the plans stay the same. Gable roofs predominate, but there are some single pitch roofs like those on the Smart House. There was briefly a historic house type on Nauru with porches, and if used and if affordable and secured in inner yards, they might be an option again – a covered exterior space that might relive the interior spaces a little.
The percentage of openings in the walls is higher than that of the smart house, but lower than the 50-80% suggested by Whitfield. Window spacing is generally based on half a bedroom module or about 1.8 meters. Windows are relatively large.
Because the houses are thin most rooms would get good cross ventilation, and views on 2 or 3 walls, including at least one onto a secure courtyard.
Then on top of the plan types, assemblies can vary to give even more variety. Window types can vary. The percentage of glass or shutters can vary. Houses can be entered directly or from inner yards. Where there is a little extra money to be spent to good affect it can be used someplace prominent on the street, like around an entry. The minsters have talked about using limestone. It could be used in courtyard floors or around doors. Any discretionary expense should be used to great effect. SECTION
In the first phase of work, we looked at every assembly and streamlined the costs of hidden assemblies like foundations that added northing to the quality of life. The reason we did this was so that there might be a little money left of bring some pleasure, maybe as you enter or leave a house.
Maybe some trades can develop that specialize in solid doors or gates, or on shutters, or on stone surrounds at the front door, or on shallow bays that secure operable jalousie windows so that security and ventilation are both possible.
Maybe small inner yards of more or less constant sizes and with limited walls, can provide for secure outdoor life while unsecured outer yards that vary greatly with lot sizes and shapes can adjust to the variables of the neighbourhood plan and accommodate gardens or small livestock.
Small inner yards lend themselves to more limited landscaping that is attractive but requires less care and that can even be seen from the street over courtyard walls. Street trees, in turn, will be visible from private yards. Shallow setbacks can have small beds of plants in front of the house. The rest of the right of way can be publicly maintained to consistent standards.
a) Attached Housing and Multi-Family Housing
There is a separate study of larger buildings that should have lower square meter construction costs and, for a given number of bedrooms, smaller overall sizes. The larger buildings are twice as wide, at 7.5 meters, and the plans can be two rooms deep, which provides more flexible and more efficient plan layouts. Larger buildings can be one or two stories. Site coverages can approach 50%. The repetition that helps lower costs can be mitigated with careful site planning.
Whereas the single family houses are based on the programming of the Smart Houses, and older post war precedents, there are no specific Nauru precedents for this larger housing, though precedents from other countries are cited in the appendix.
b) The Importance of Site Planning
Good site planning is the key to multi-family housing. Indifferent or expedient site planning, like the housing built by the British Phosphate Corporation at the port, produces blocks marked chiefly by their repetition, and lack of privacy or security. This has given multi-family housing a bad reputation on the island. This means, in turn, that options for more compact and less expansive housing are harder for Nauruans to consider. But land is scarce and single family housing is relatively more expensive, and multi-family housing should be one option for Nauru in the future.
The aggregated multi-family housing in the next two sections tries to show how to benefit from scale economies, but without the inhuman repetition of the port housing.
House Type - Smart House
One Story Area 75m²
2 Bedrooms
Footprint 12.5m x 14m
Lot Size 14m x 14m
SECTION 2.C
House Type - Smart House


Two Story Area 115m²
4 Bedrooms
Footprint 12.5m x 14m
Lot Size 14m x 14m
House Type - I-1
Area 40m²
1 Bedroom
Footprint 12.5m x 14m
Lot Size 14m x 14m
SECTION 2.C
House Type - I-2
Area 40m²

1 Bedroom
Footprint 12.5m x 14m
Lot Size 14m x 14m
House Type - I-3
Area 40m²
1 Bedroom
Footprint 12.5m x 14m
Lot Size 14m x 14m
House Type - L-1
Area 80m²

3 Bedrooms
Footprint 12.5m x 14m
Lot Size 14m x 14m
House Type - L-2


Area 80m²
2 Bedrooms
Footprint 12.5m x 14m
Lot Size 14m x 14m
SECTION 2.C
House Type - L-3
Area 75m²
2 Bedrooms
Footprint 12.5m x 14m
Lot Size 14m x 14m
House Type - L-4
Area 75m²
2 Bedrooms
Footprint 12.5m x 14m
Lot Size 14m x 14m
SECTION 2.C
House Type - L-5

Area 80m²
3 Bedrooms
Footprint 12.5m x 14m
Lot Size 14m x 14m
House Type - H-1
Area 130m²
4 Bedrooms
Footprint 12.5m x 14m
Lot Size 14m x 14m
SECTION 2.C
House Type - H-2
Area 115m²

4 Bedrooms
Footprint 12.5m x 14m
Lot Size 14m x 14m
House Type - U-1
Area 125m² 4 or 5 or 6 Bedrooms
Footprint 12.5m x 14m
Lot Size 14m x 14m
House Type - U-2
Area 115m² 4 Bedrooms


Footprint 12.5m x 14m
Lot Size 14m x 14m
House Type - U-3
Area 115m²
4 Bedrooms
Footprint 12.5m x 14m
Lot Size 14m x 14m
METROCOLOGY MERRILL, PASTOR & COLGAN
SECTION 2.C
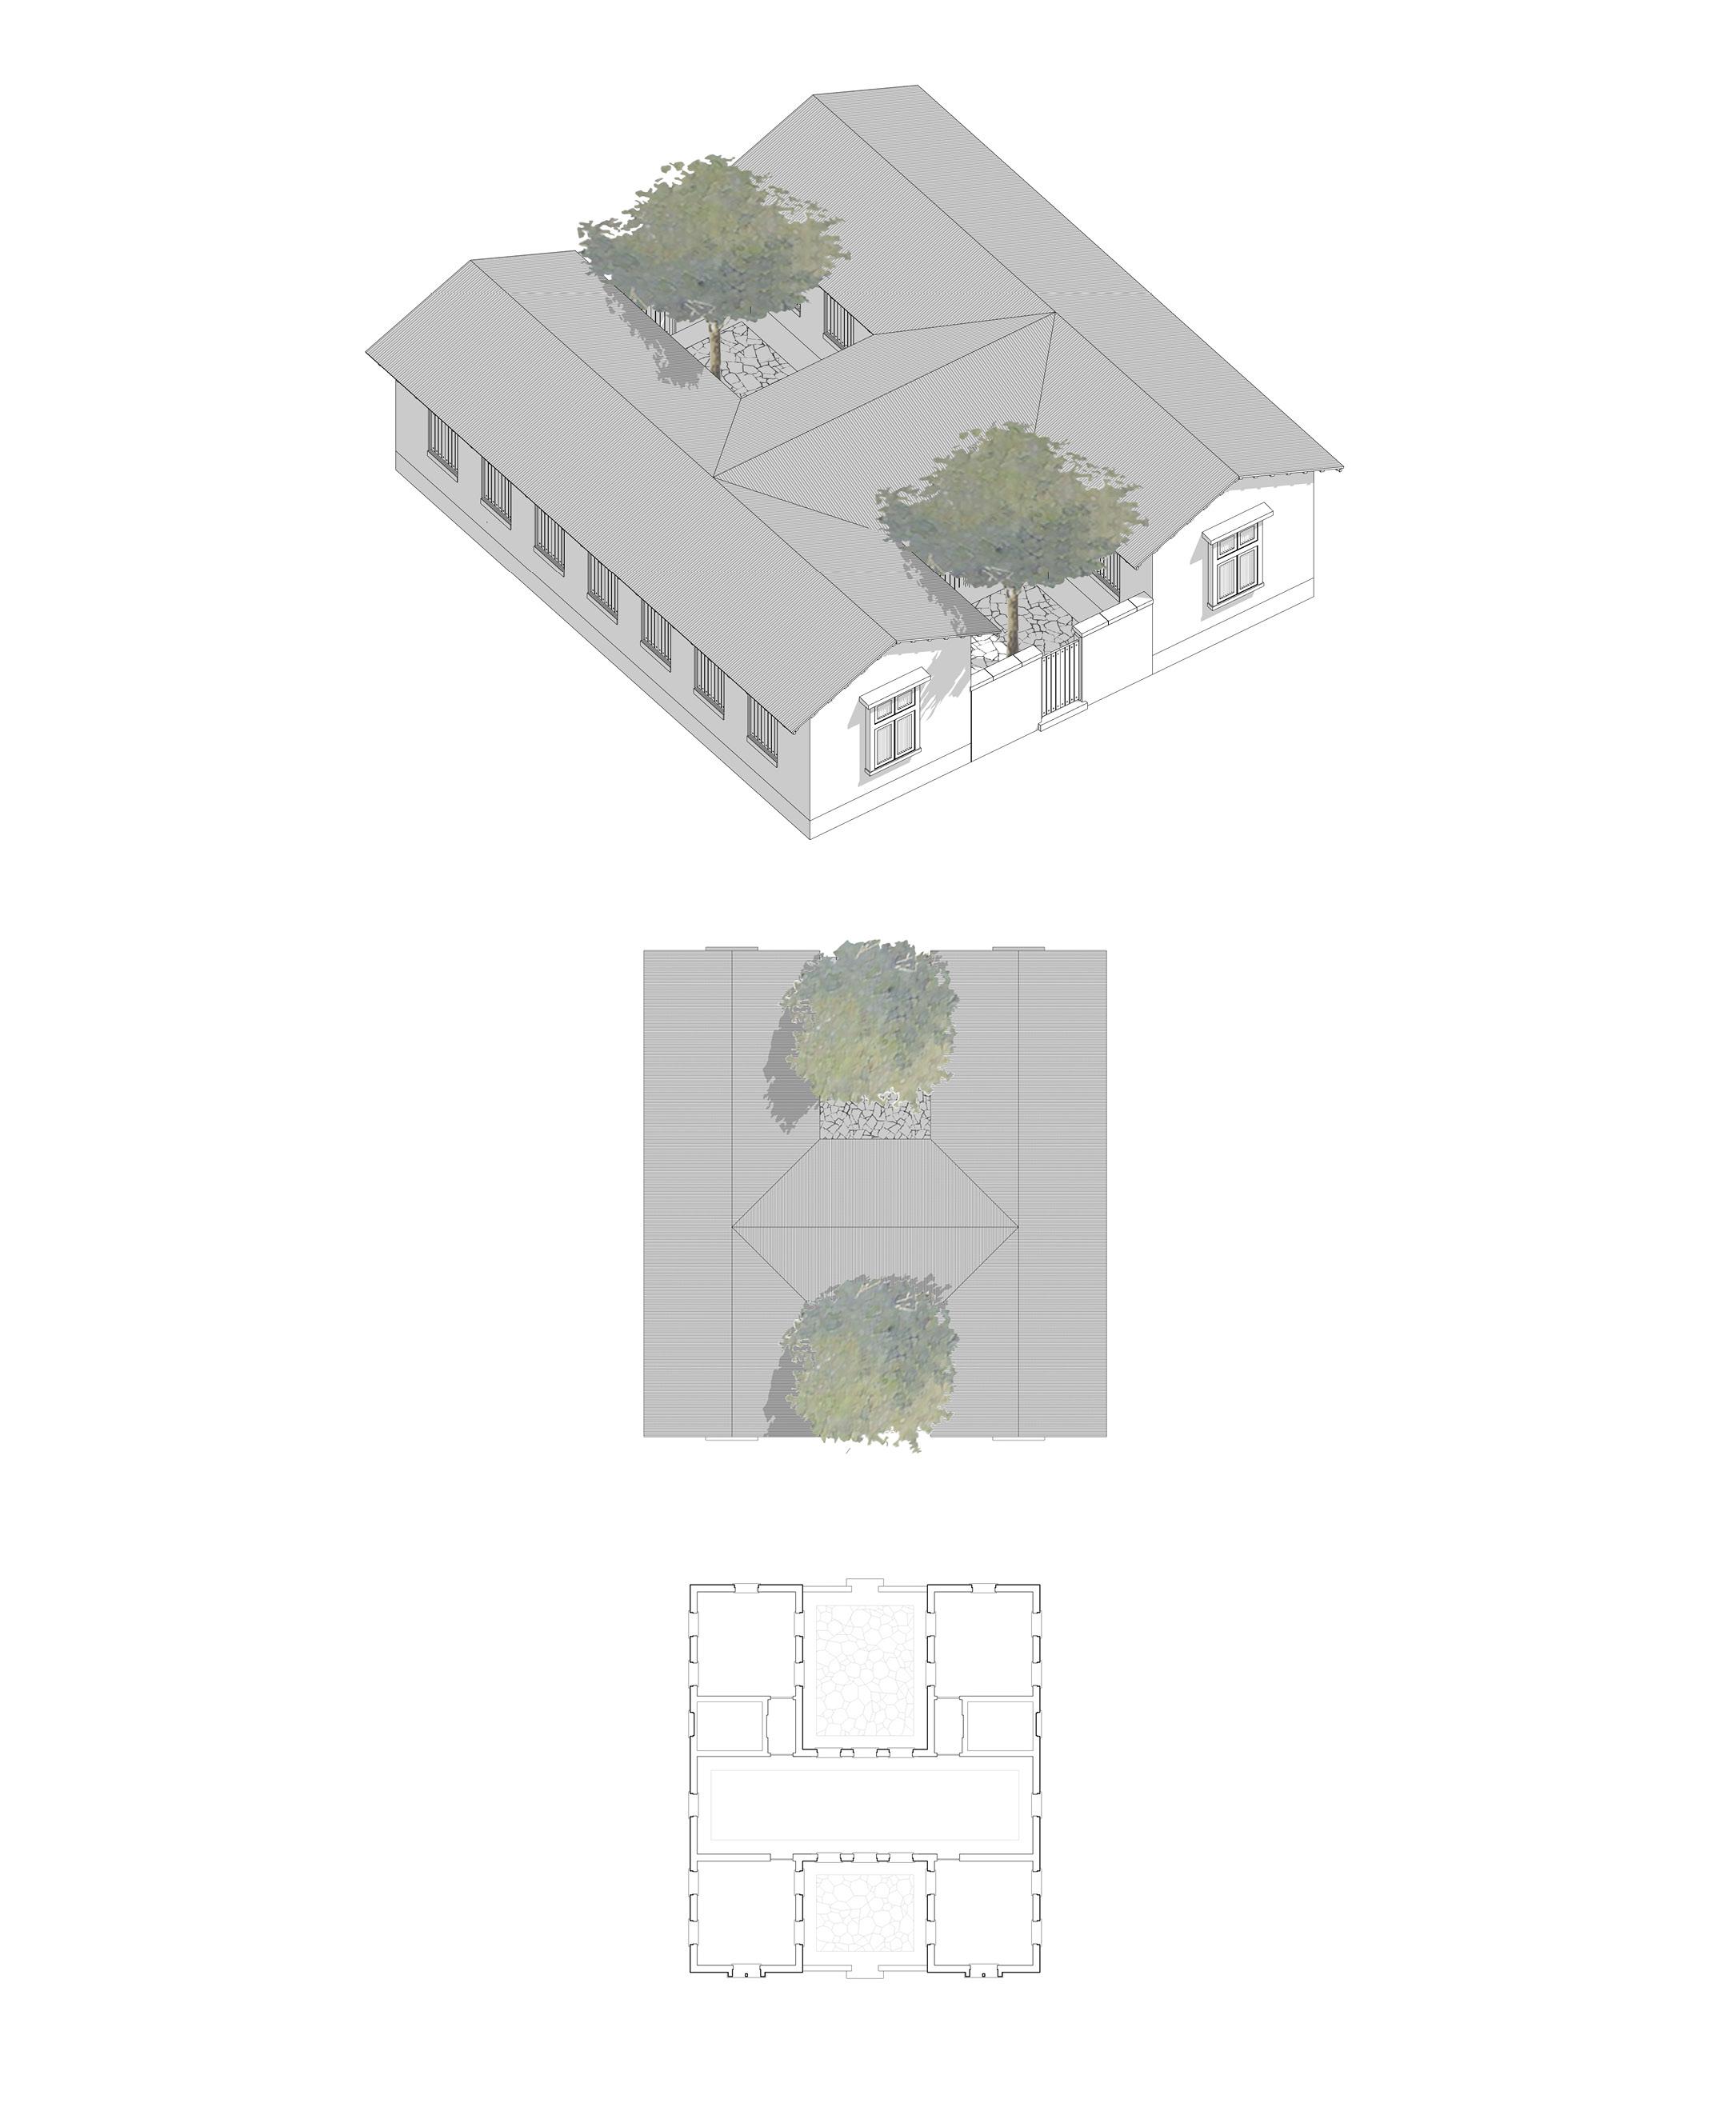
House Type - Atrium 1

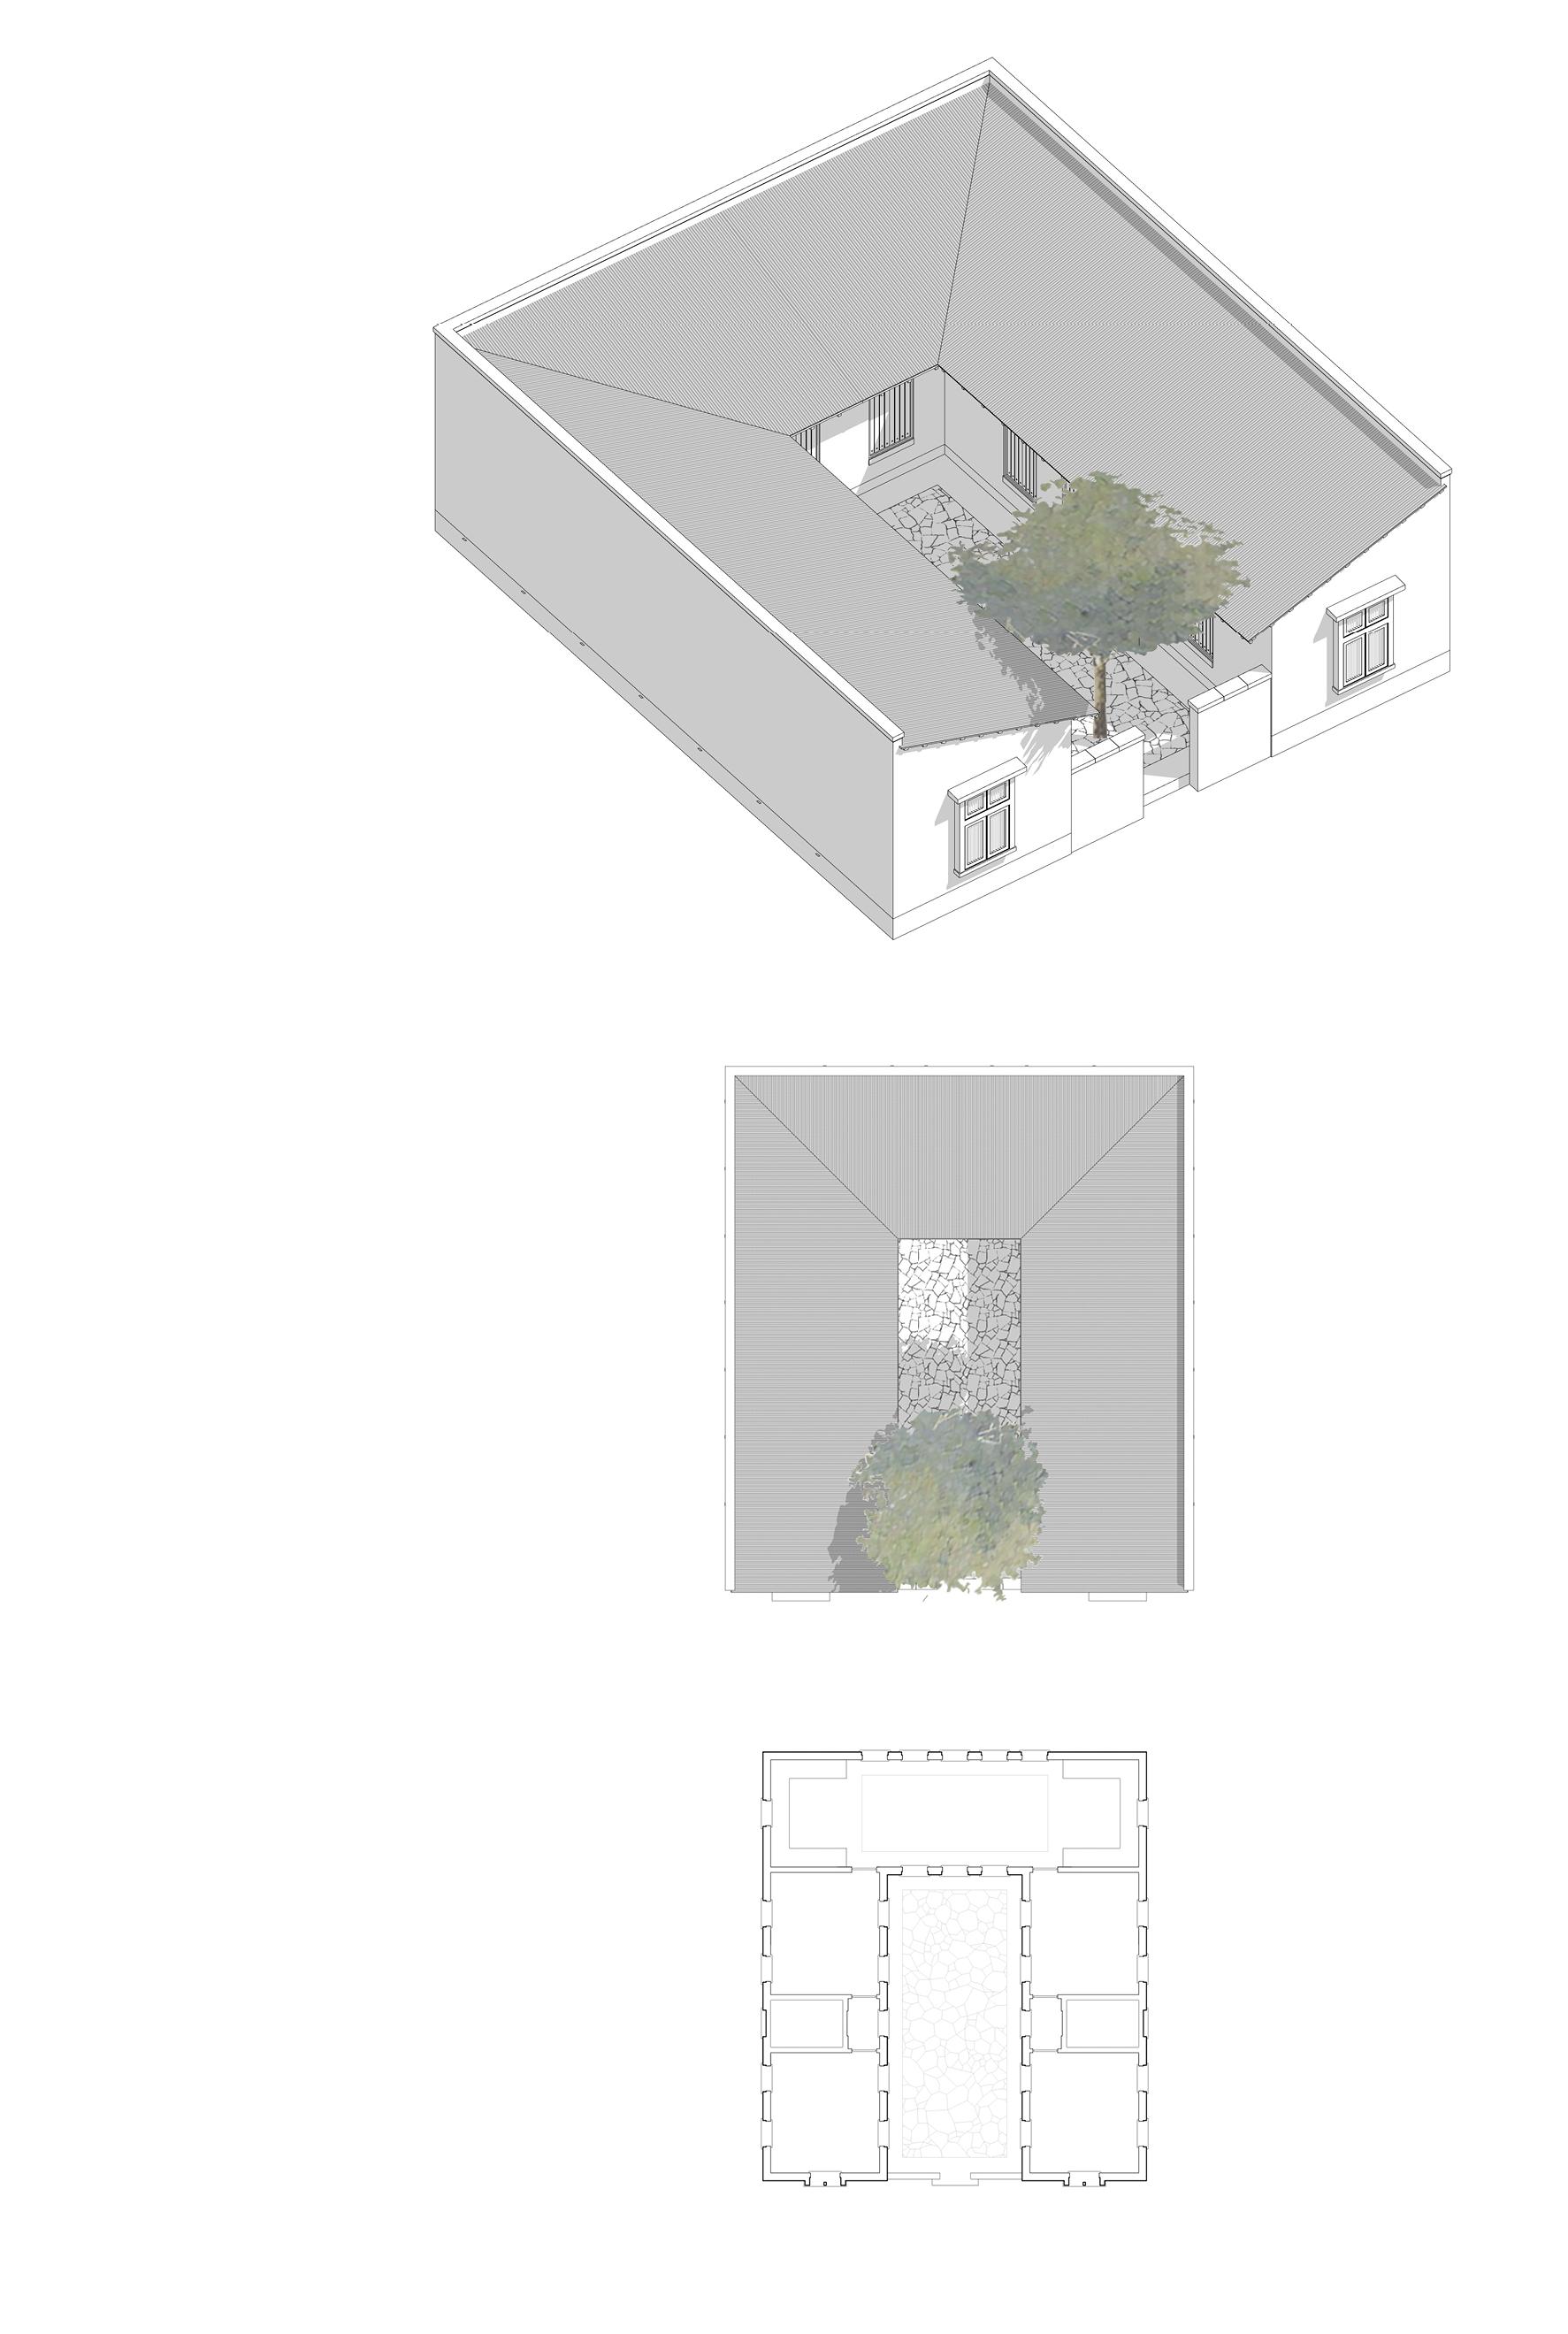
Area 130m²
4 Bedrooms
Footprint 12.5m x 14m
Lot Size 14m x 14m
House Type - Atrium 2
Area 130m²
4 Bedrooms
Footprint 12.5m x 14m
Lot Size 14m x 14m
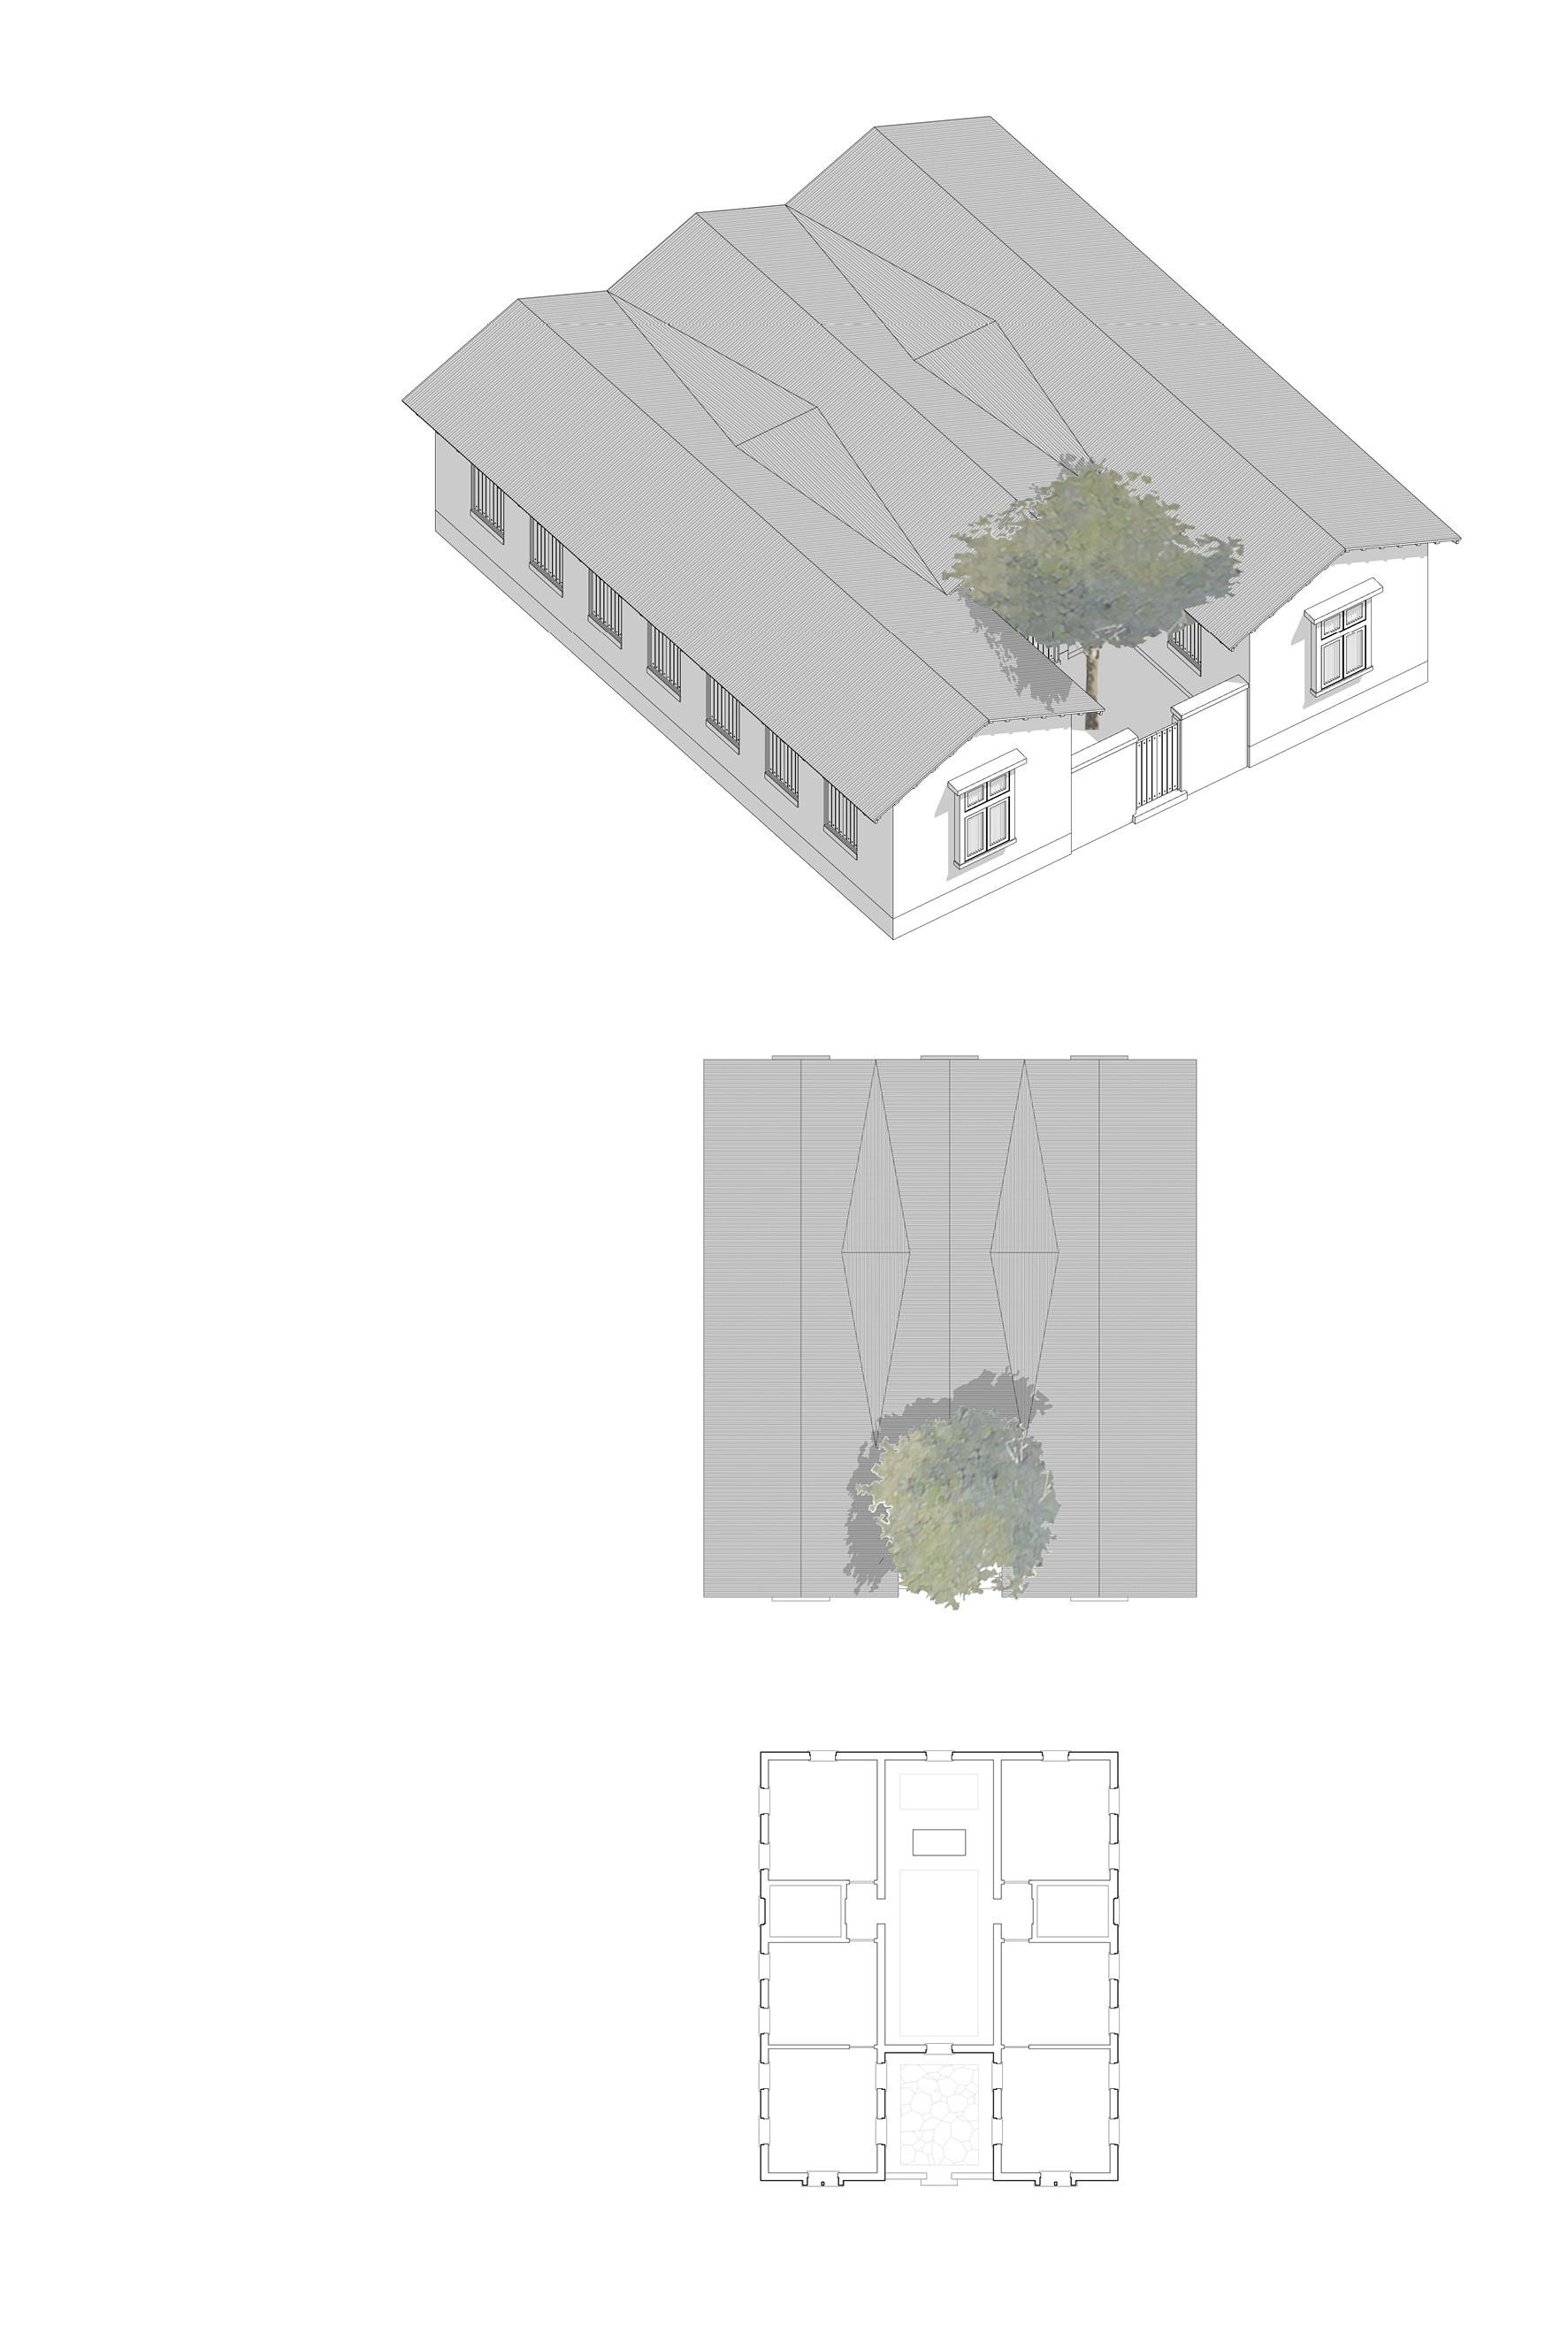
SECTION 2.C
House Type - Block 1
Area 150m²
6 Bedrooms
Footprint 12.5m x 14m
Lot Size 14m x 14m
House Type - Block 2


Area 130m²
4 Bedrooms
Footprint 12.5m x 14m
Lot Size 14m x 14m
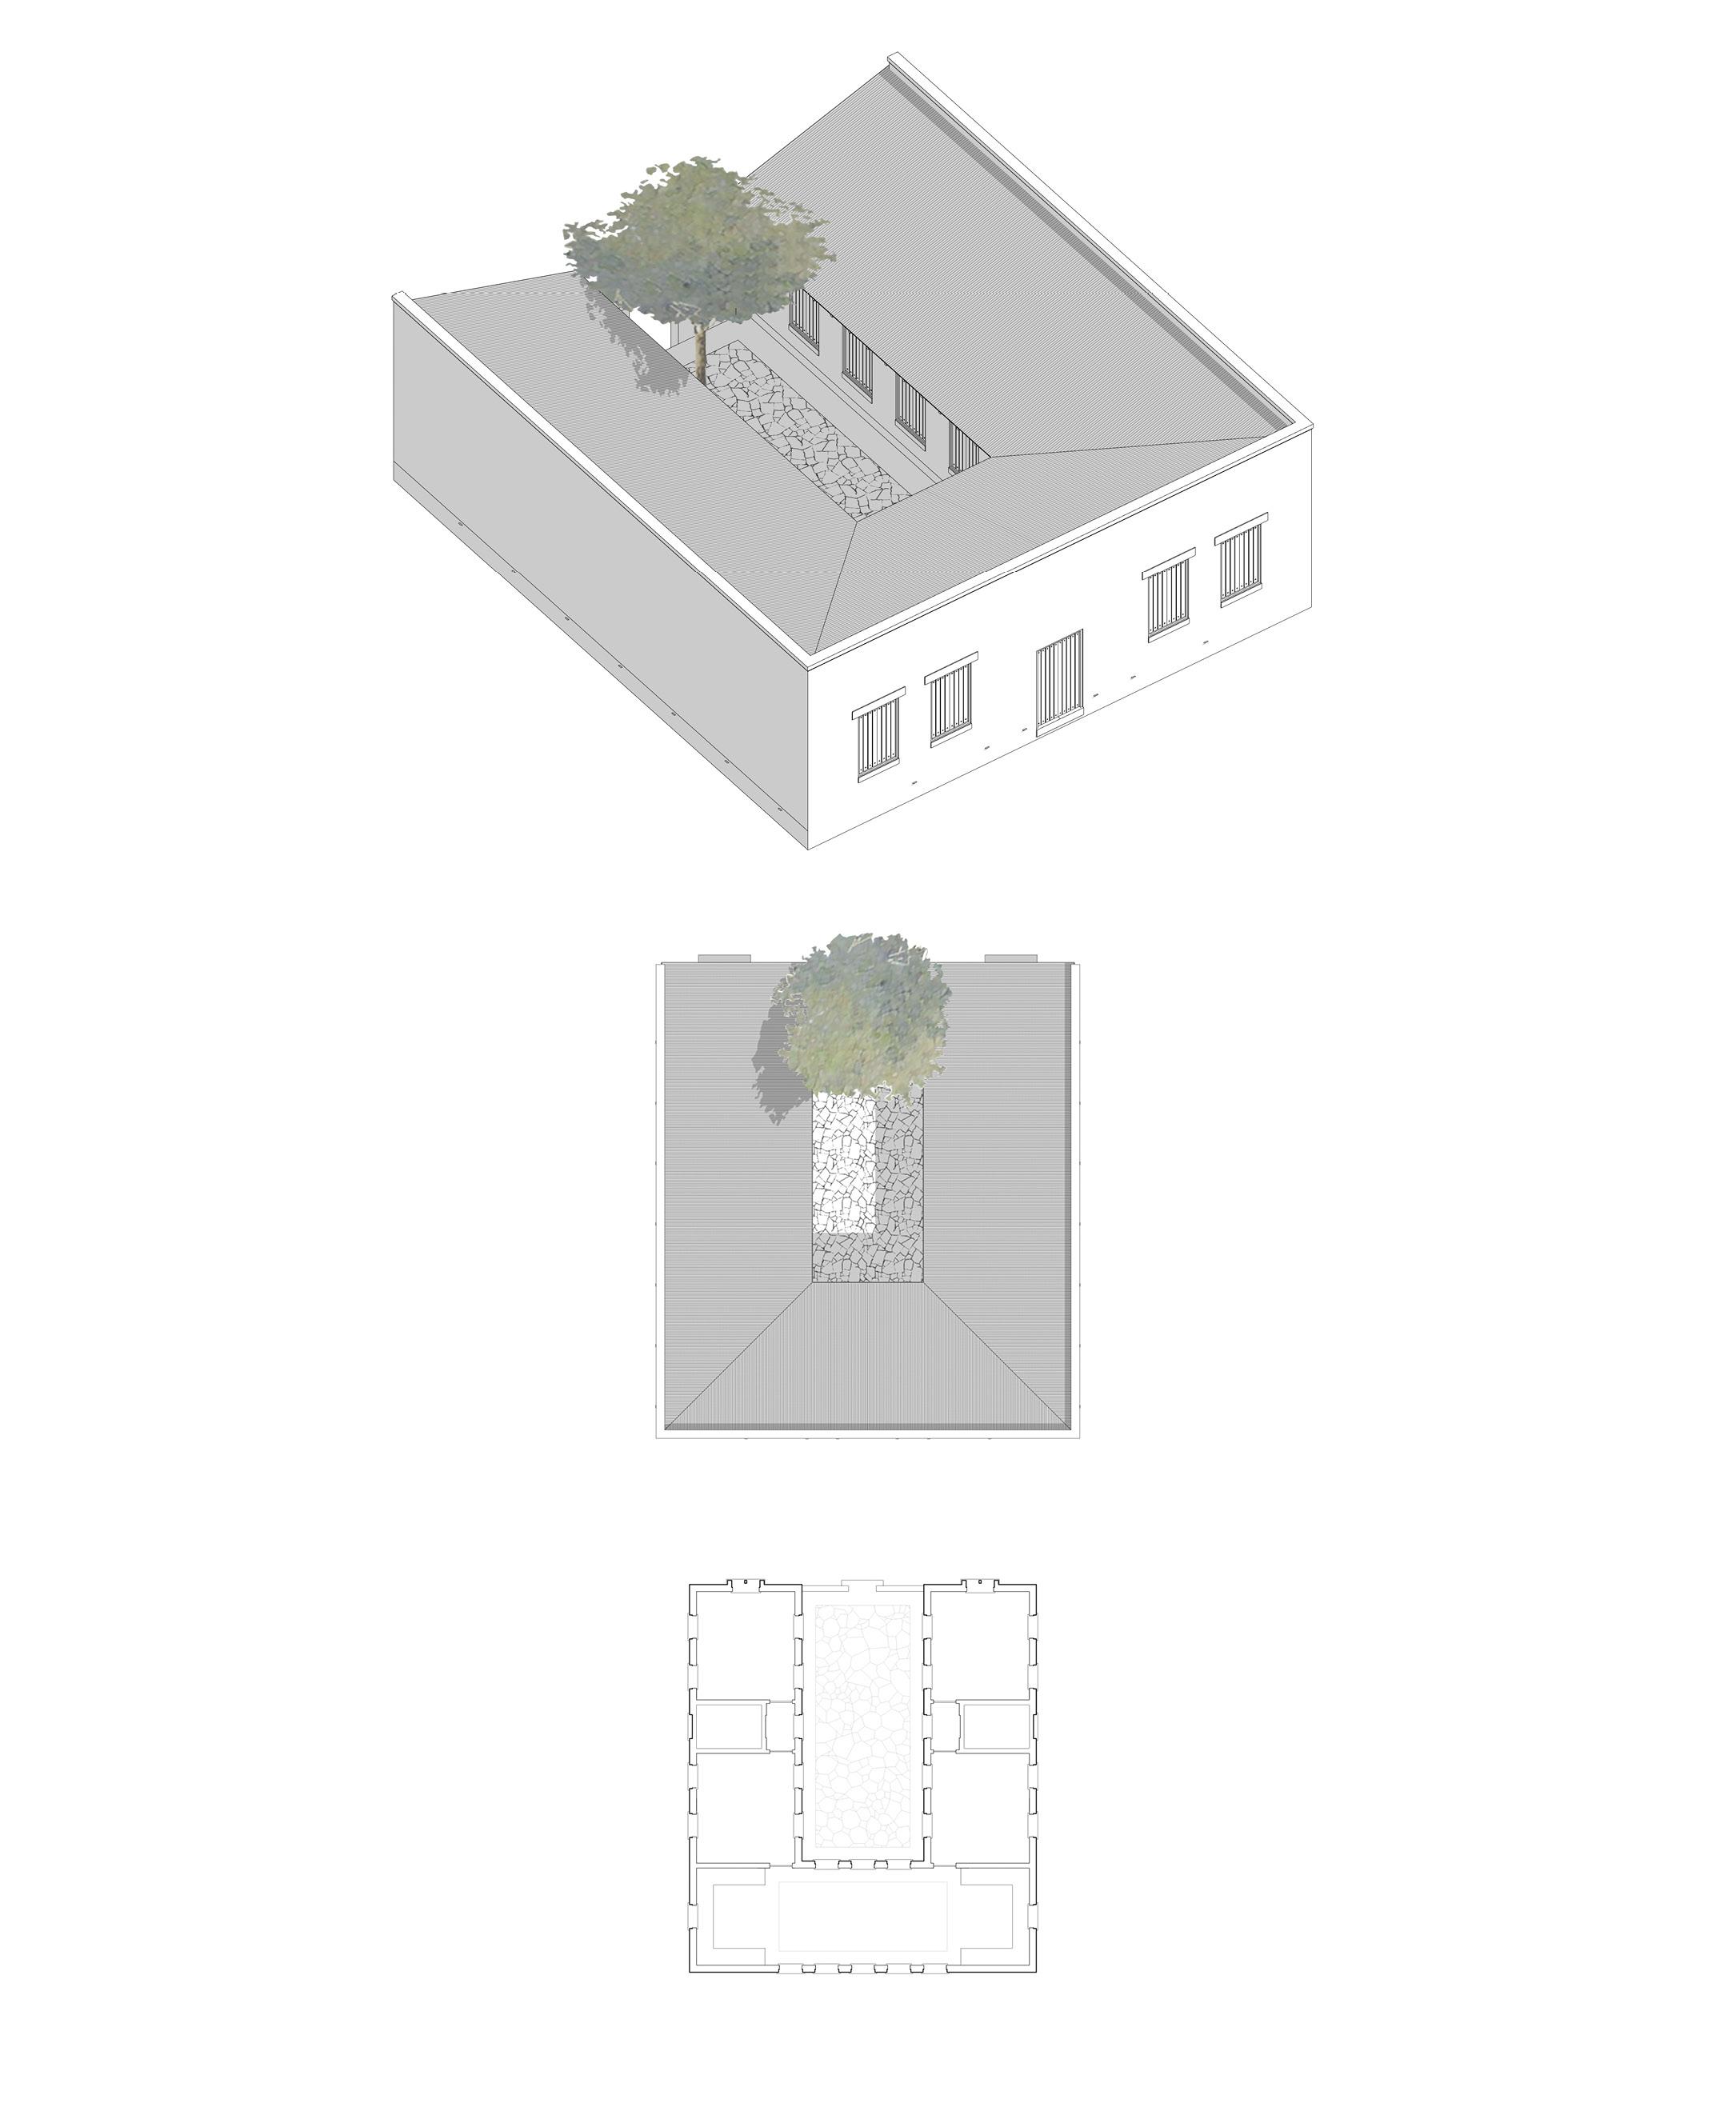
SECTION 2.C
House Type - Block 3
Area 130m²
4 Bedrooms
Footprint 12.5m x 14m
Lot Size 14m x 14m
House Type - Block 4

Area 115m²
4 Bedrooms
Footprint 12.5m x 14m
Lot Size 14m x 14m
METROCOLOGY MERRILL, PASTOR & COLGAN
SECTION 2.C
House Type - Cross 1
Area 90m²
3 Bedrooms
Footprint 12.5m x 14m
Lot Size 14m x 14m
House Type - Two Story 1
Area 115m²
3 Bedrooms
Footprint 12.5m x 14m
Lot Size 14m x 14m
SECTION 2.C
House Type - Two Story 2
Area 140m²
3 or 4 Bedrooms
Footprint 12.5m x 14m
Lot Size 14m x 14m
SECTION 3.0 AGGREGATION STUDIES
SECTION 3.0

