NATIONAL
COLLEGE OF DESIGN AND
NATIONAL
COLLEGE OF DESIGN AND



COURSE DESCRIPTION

This course provides a comprehensive introduction to AI and data-driven decision-making for sustainable building projects in the architecture, engineering, and construction (AEC) industry. It emphasizes how data analytics, machine learning, and AI technologies can be leveraged to enhance decision-making across all stages of building project design and construction, from concept to completion.
The course aims to equip students with practical skills for applying AI tools to real-world challenges, enabling them to work effectively with data or pursue further research in AI for the built environment. Throughout the course, students will explore current applications of AI in the AEC industry, including tools for optimizing building design and performance simulations, automated design generation, and the integration of generative AI into design workflows. The course provides hands-on experience with AI and data-driven tools, preparing students to contribute meaningfully to the transformation of building project design and construction through AI.
We would like to thank Kajima The GEAR for hosting the students, and acknowledge our guest speaker Bryan Ong from Open Government Products for sharing valuable industry insights.
COURSE INSTRUCTOR
Yuqian Ang -
Assistant Professor (Presidential Young Professor), College of Design and Engineering
TEACHING FELLOWS
Xueyu Chen
Tao Wang
Lujia Zhu
EDITORIAL TEAM
Editors: Xueyu Chen, Lujia Zhu
Design & Layout: Lujia Zhu
STUDENTS
Aaditya Krishna
Arjun Srirengan
Cheng Zhiyue
Chenxi Lei
Cherry Kim
Chuan Fang Tan
Fanxiang Qu
Gaoyuan Wang
Guanli Feng
Hongchang Xu
Huanxiang Gao
Huoyu Zheng
Junyue Xu
Kaifeng Zhu
Kefan Chen
Liren Wang
Luhan Zhao
Ma Haitong
Muhammad Ridhwan Bin Mohamed Sulaiman
Qinhuan Liu
Roman Buckle
Shivani Sridhar
Su Haotian
Tan Wenyu
Tian Purui
Wenqing Dong
Wu Yi
Xinrui Zhang
Xinyao Li
Yudian Chen
Yunjia Wang
Zesheng Yang
Zhongbin Li
Xueyu Chen, Lujia Zhu, Tao Wang. Teaching Fellows City Syntax Lab
The course projects are organized into four themes: Energy, Urban Environmental WellBeing, Multi-objective Optimization, and Urban Design. Across 17 projects, students explore how artificial intelligence, simulation, and data-driven modeling can support sustainable design from building performance prediction to urban-scale spatial analysis.
Projects in this theme focus on predicting, analyzing, and reducing building energy use through AI-supported workflows. Students explore how machine learning and surrogate models can accelerate energy performance evaluation, identify key design variables, and support early-stage decisions on building form, envelope, systems, and operation. These projects highlight the role of AI in making energy-conscious design faster, more scalable, and more responsive to design changes.
Urban Environmental Well-Being projects examine how buildings and urban environments affect human comfort, health, and environmental quality. Topics may include daylight availability, air quality, thermal comfort, and other performance indicators related to user experience. These projects emphasize that sustainable design is not only about reducing energy use, but also about creating healthier and more comfortable spaces.
Beyond single-metric optimization, projects in the Multi-objective Optimization theme examine how AI can support design and operation problems that involve competing performance goals. Students use surrogate modeling, optimization, forecasting, and dashboard-based analytics to evaluate trade-offs among energy use, daylight, thermal comfort, water efficiency, operational robustness, and stakeholder needs. These projects emphasize AI as a tool for comparing alternatives, revealing trade-offs, and supporting more balanced, evidence-based decisions.
Urban Design projects extend AI-supported sustainable design from individual buildings to neighbourhood and district scales. Students use GIS data, social media signals, spatial indicators, clustering methods, machine learning, and generative AI to evaluate residential block quality, pedestrian comfort, green-space accessibility, and regenerative urban interventions. These projects show how AI can help identify spatial inequities, diagnose low-performing streets or estates, and test interventions such as greenery, shading, cycling corridors, and pocket parks. The emphasis is on making spatial analysis more scalable, interpretable, and action-oriented.
Retrox Sg: An AI-Assisted Toolkit for Rapid and Explainable Retrofit Evaluation in Singapore Small Office Buildings
Yunjia Wang
A Balanced Light Control Framework Combining Central and Personalized Systems under Dynamic Occupancy Conditions --- A Surrogate-Based Optimization Approach Validated with Historical Data
Kefan Chen, Guanli Feng
for Predicting Energy Consumption During the Initial Architecture Design
Xinrui Zhang, Yudian Chen
Method for Predicting Energy Consumption During the Initial Architecture Design Phase
Kaifeng Zhu, Zesheng Yang
Aaditya Krishna, Shivani Sridhar
Surrogate-Model-Based Evaluation of Building Energy Consumption and Demand Response Potential: A Case Study of the NUS SDE2 Building
Qinhuan Liu, Gaoyuan Wang
Assessing Workplace Window Views through Visual Features: Impacts on Satisfaction, Health and Perceived Restoration
Liren Wang, Chenxi Lei, Huanxiang Gao
Machine learning-based indoor lighting environment simulation design tool
Junyue Xu, Zhongbin Li, Fanxiang Qu
Comparison of Simple Models in Short-term Air Quality (PM2.5)
Surrogate-Based Multi-Objective Optimization for Energy and Comfort in Singapore Educational Buildings
Ma Haitong, Cheng Zhiyue, Tian Purui
Wu Yi, Tan Wenyu 82
AI-supported Surrogate Modeling for Sustainable Residential Building Design in Shenzhen, China
Evaluating Temporal and Operational Generalization of Data-Driven Forecasting Models in Office Buildings
Roman Buckle, Cherry Kim
Machine learning-based performance prediction model for daylight and thermal comfort in parametric office design
Hongchang Xu, Huoyu Zheng
AI-Driven Dashboard for Energy and Water Monitoring at TTSH-ICH
Chuan Fang Tan, Muhammad Ridhwan Bin Mohamed Sulaiman
Xinyao Li, Luhan Zhao 114
Machine learning–driven scoring model for Singapore residential blocks using QGIS data
Singapore Walker
A Scalable Urban Microclimate-Aware Street Scoring and AI-Driven Design Framework: From Bugis to Comparative Districts in Singapore
Wenqing Dong
AI for Equitable Access to Urban Green Spaces and Bicycle Infrastructure: A Regenerative Perspective for People and Environment
Arjun Srirengan
Xueyu Chen, Lujia Zhu, Tao Wang. Teaching Fellows City Syntax Lab
Sustainable building design is a complex process with no single optimal answer. A building must reduce energy use and carbon emissions while also supporting comfort, daylight quality, cost efficiency, resilience, and architectural intent. These goals often interact with one another and sometimes conflict. For this reason, sustainable design is not simply a technical calculation, but a process of balancing multiple performance objectives within a specific design context.
Although there is no universal solution, good sustainable design has recognizable performance qualities. A well-designed building should respond to its climate, use resources efficiently, provide healthy and comfortable indoor environments, and remain adaptable to future needs. Building performance simulation has long helped designers evaluate these qualities by predicting energy use, daylight availability, thermal comfort, and other environmental outcomes.
However, simulation-based design also has limitations. Detailed simulations can be time-consuming, technically demanding, and difficult to apply during early design stages, when information is incomplete and design options change rapidly. Machine learning and surrogate modeling can help address this challenge. By learning from simulation data or real building data, AI models can quickly predict building performance, explore large design spaces, and identify promising design solutions. This makes sustainable design faster, more scalable, and more evidence-based.
This course, Artificial Intelligence for Sustainable Building Design, brings together knowledge from building science, environmental design, computer science, and data-driven modeling to support the next generation of sustainable design tools and workflows. Students will learn not only how AI methods can address specific aspects of building performance — including energy use, carbon emissions, daylight availability, thermal comfort, and design optimization — but also how human expertise can guide these techniques in defining meaningful goals, interpreting results, and balancing trade-offs.
How might machine learning help predict building energy performance at early design stages? How might simulation data be used to train surrogate models that reduce computational time while preserving design insight? How can AI-supported workflows support decisions that consider not only performance efficiency, but also comfort, resilience, cost, and environmental responsibility?
These and other questions will be explored throughout the course, demonstrating how AI can be applied to address complex problems in sustainable building design. As learning prototypes, the methods and exercises in this course are not only examples of technical tools, but also opportunities to understand the knowledge and judgment needed to use AI responsibly. The aim is to help students develop ways of creating and applying intelligent design technologies: technologies powered by machine learning and simulation, but meaningfully guided by building science, design intent, and human concerns.
Yunjia Wang
Retrofit evaluation
Surrogate modeling
Energy prediction
Machine learning
Building performance
# HIGHLIGHTS
• RetroX SG is an AI-Assisted, web-based toolkit that accelerates retrofit evaluation for Singapore small office buildings by combining BPSgenerated data with surrogate models to predict energy, carbon, and economic outcomes.
• It supports rapid comparison of practical retrofit measures and improves transparency via explainable ML insights on influential variables, helping stakeholders make clearer decisions.
• The toolkit emphasizes early-stage usability, enabling fast scenario screening when conventional BPS is too slow for large retrofit combinations.
Buildings account for a significant portion of Singapore's electricity consumption, with the existing building stock dominating operational demand. Retrofit evaluation through conventional building performance simulation (BPS) tools such as EnergyPlus is time-consuming and computationally intensive when multiple design scenarios must be tested. This study presents RetroX SG, an AI-Assisted toolkit that combines BPS-generated data with machine learning surrogate models to rapidly predict energy, carbon, and economic outcomes for practical retrofit measures in small office buildings. The toolkit enables fast, transparent, and user-friendly evaluation of retrofit options to support stakeholders in making informed retrofit decisions for sustainable buildings in Singapore (Markarian et al., 2024; Westermann & Evins, 2019). The
research gap addresses three key challenges: (1) few case studies using machine learning for building retrofits in Singapore's tropical climate context, (2) limited scope of retrofit objectives that typically focus on either energy efficiency or cost minimization rather than holistic approaches (Bocaneala et al., 2024), and (3) lack of convenient toolkits for early-stage retrofit comparison involving non-professional stakeholders. By combining BPS and surrogate modeling, RetroX SG evaluates practical retrofit measures across multiple Key Performance Indicators (KPIs): energy use intensity (EUI), cooling load, retrofit cost, and payback period. The toolkit demonstrates how artificial intelligence can support and accelerate retrofit evaluation while maintaining accuracy and interpretability (Shen & Pan, 2023).
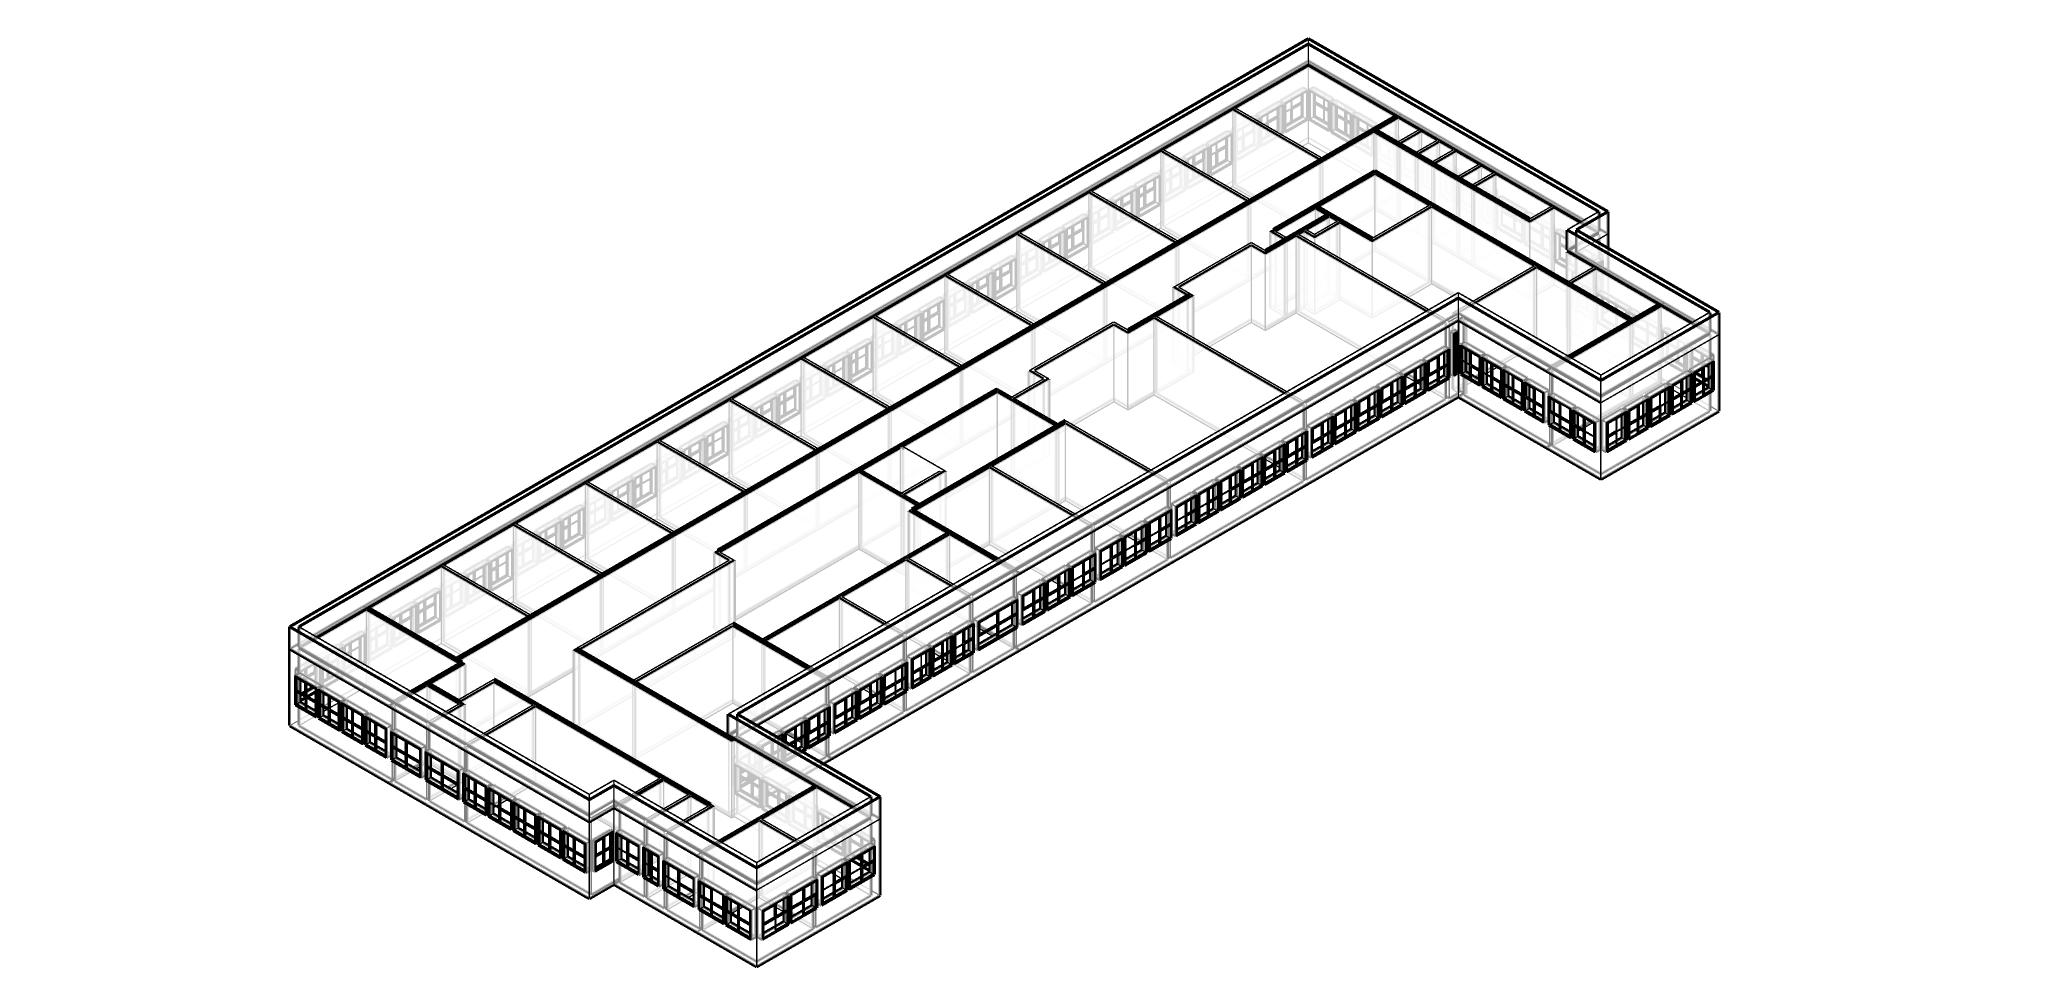
Figure 1. Axonometric view of the modeled single-storey office building showing building form and spatial layout
A single-storey office building (939.62 m² GFA) was modeled in DesignBuilder using Singapore's IWEC weather file. The building includes office zones, circulation areas, a computer lab, and auxiliary rooms, with a VAV water-cooled chiller system (COP 6.0) and a window-to-wall ratio (WWR) of 35%. This baseline model represents a typical small office building in Singapore's tropical climate.
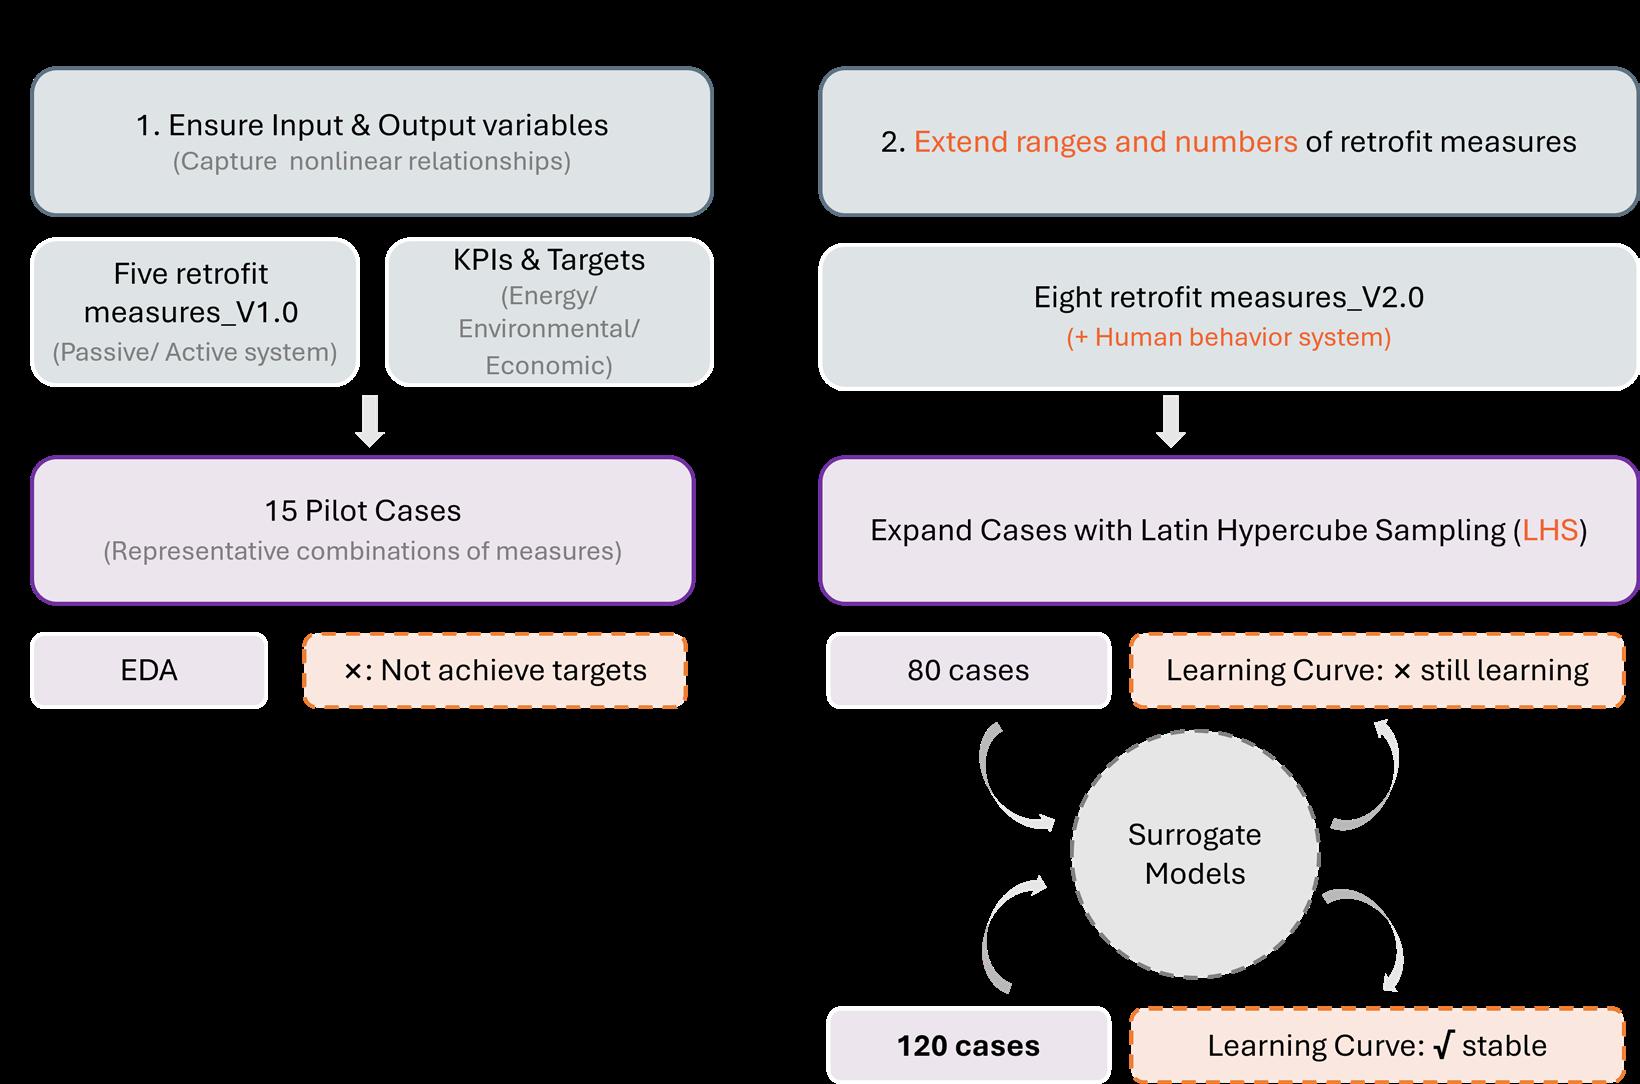
Figure 2. Data generation framework showing Latin Hypercube Sampling applied to eight retrofit measures, generating 120 scenarios for model training
Eight retrofit measures spanning building envelope (façade, roof, window) and human systems (lighting and HVAC) were selected with 2–3 levels each, generating 120 scenarios using Latin Hypercube Sampling (Ali et al., 2023). The dataset includes energy variables (room electricity, lighting electricity, cooling electricity, and cooling load) and economic variables (retrofit cost, annual cost savings, payback period). Exploratory Data Analysis identified key patterns: EUI ranges from 130–190 kWh/m², most payback periods span 10–20 years, and schedule adjustment combined with high-performance envelope materials drives optimal performance.
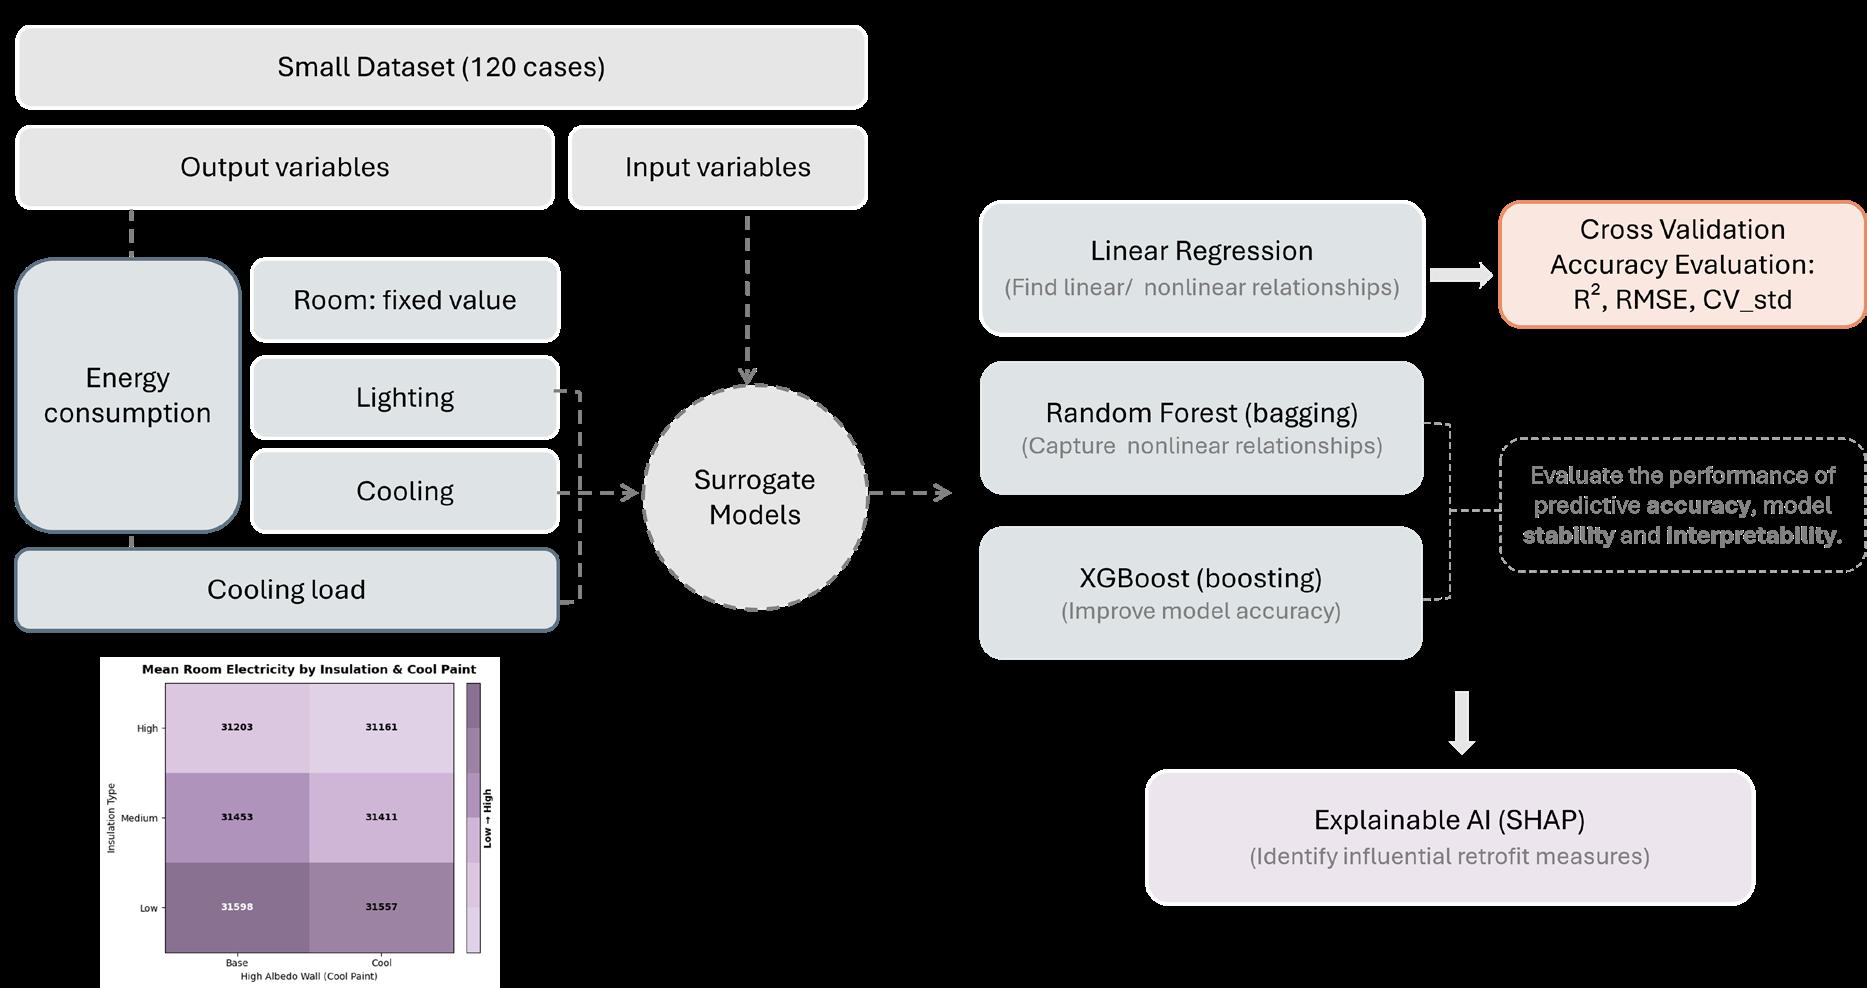
Figure 3. Surrogate model training and validation results comparing Linear Regression, Random Forest, and XGBoost performance across energy output variables
Three machine learning algorithms—Linear Regression (LR), Random Forest (RF), and XGBoost—were trained independently for each target variable. A 5-fold crossvalidation approach was adopted to prevent overfitting on the small dataset. Model accuracy was assessed using R² and root mean squared error (RMSE). LR achieved optimal performance for cooling electricity and cooling load (R² = 0.993) due to their near-linear relationships with HVAC setpoint and insulation parameters. XGBoost outperformed other models for lighting electricity (R² = 0.922) and total energy consumption (R² = 0.987) because of nonlinear interactions among lighting power density (LPD), control strategies, and schedule adjustments (Thrampoulidis et al., 2021).
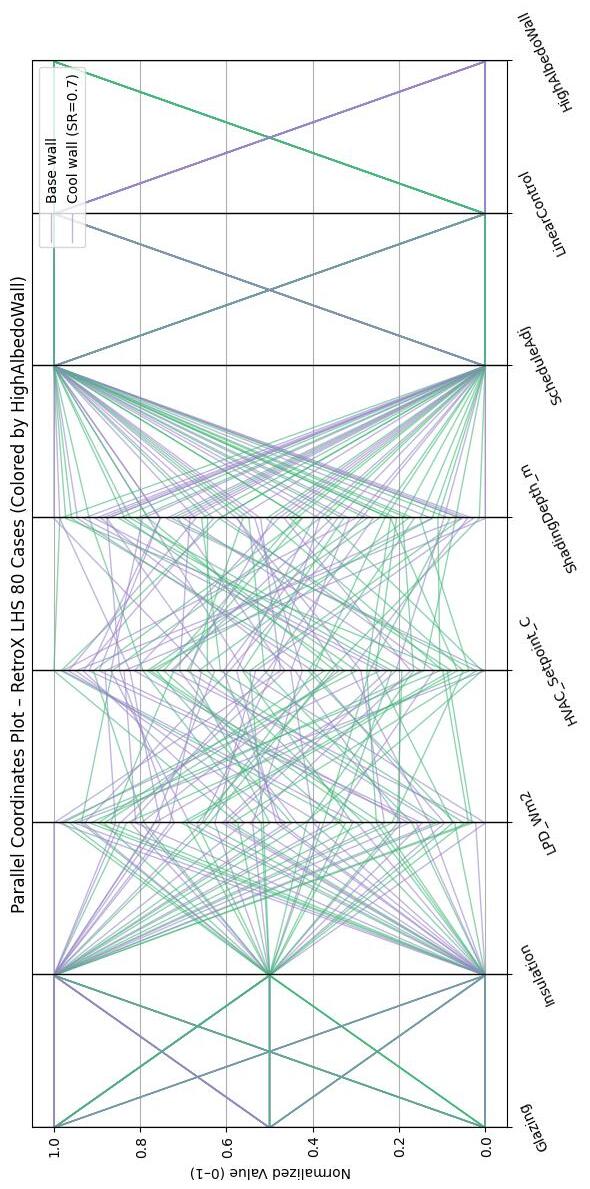
Figure 4. Parallel coordinates visualization of 120 retrofit cases, illustrating the relationships between input variables and Key Performance Indicators
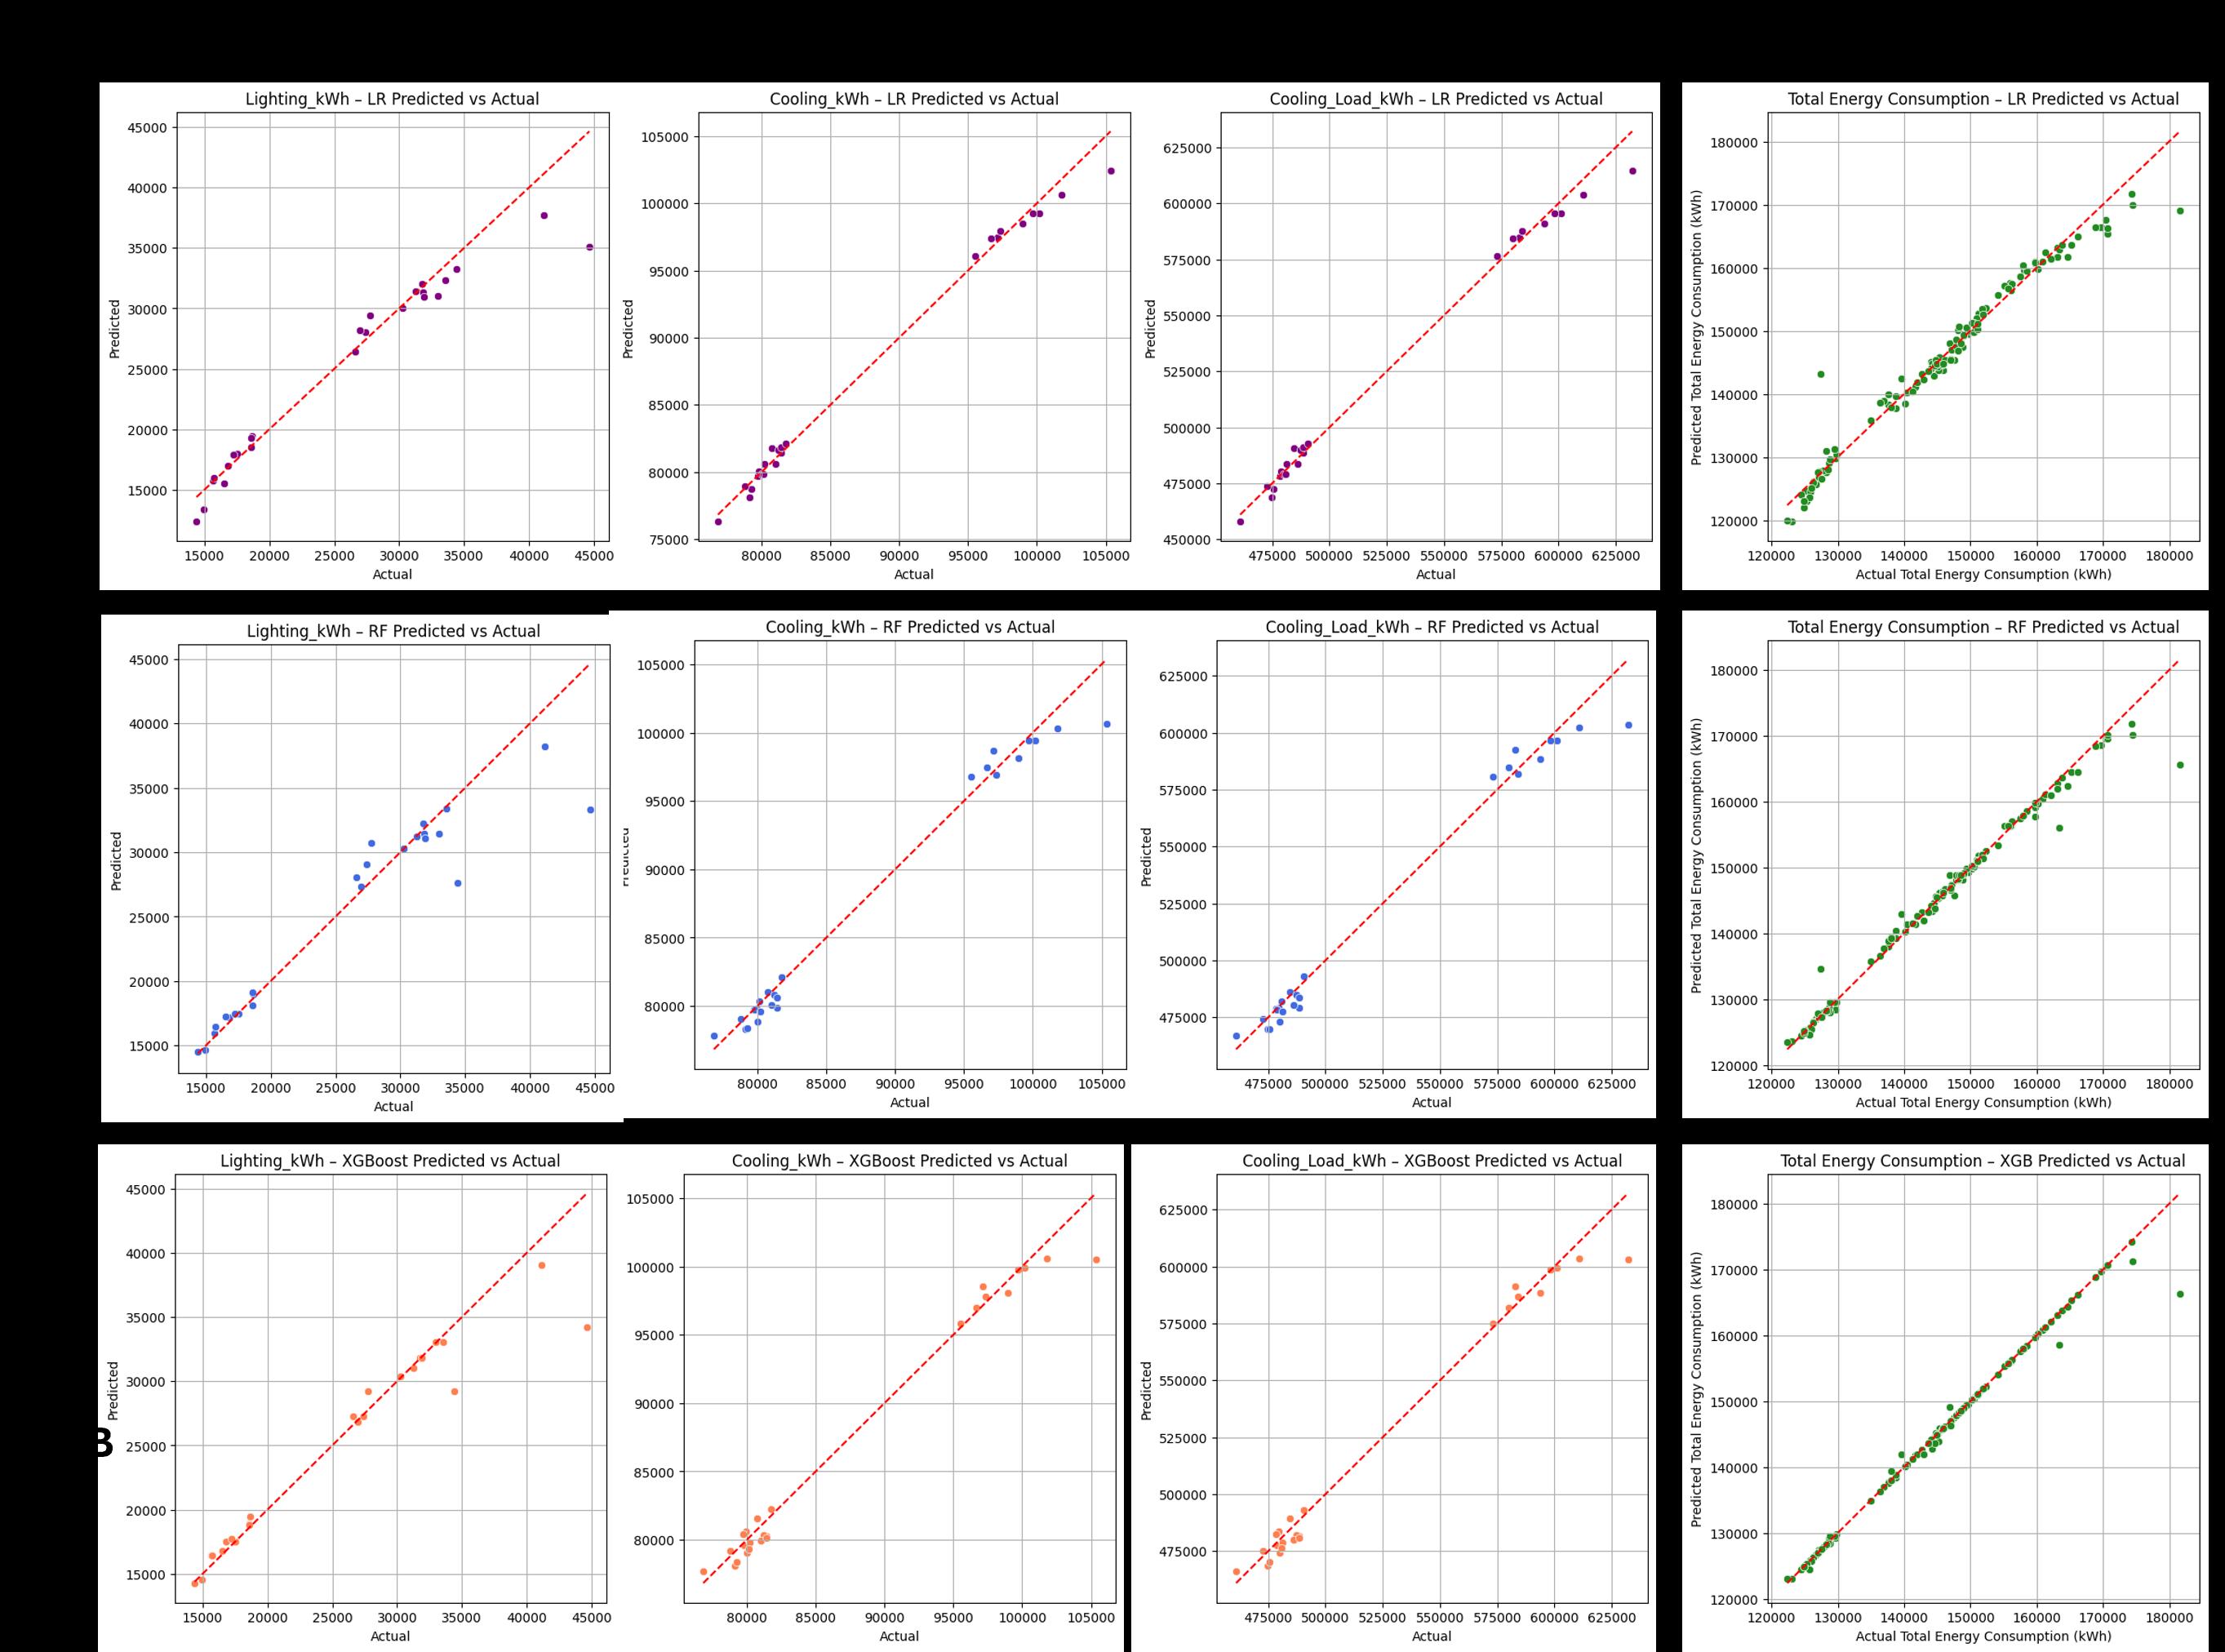
Figure 5. Model prediction performance visualized through scatter plots comparing predicted vs. simulated values, with R² and RMSE metrics for each algorithm
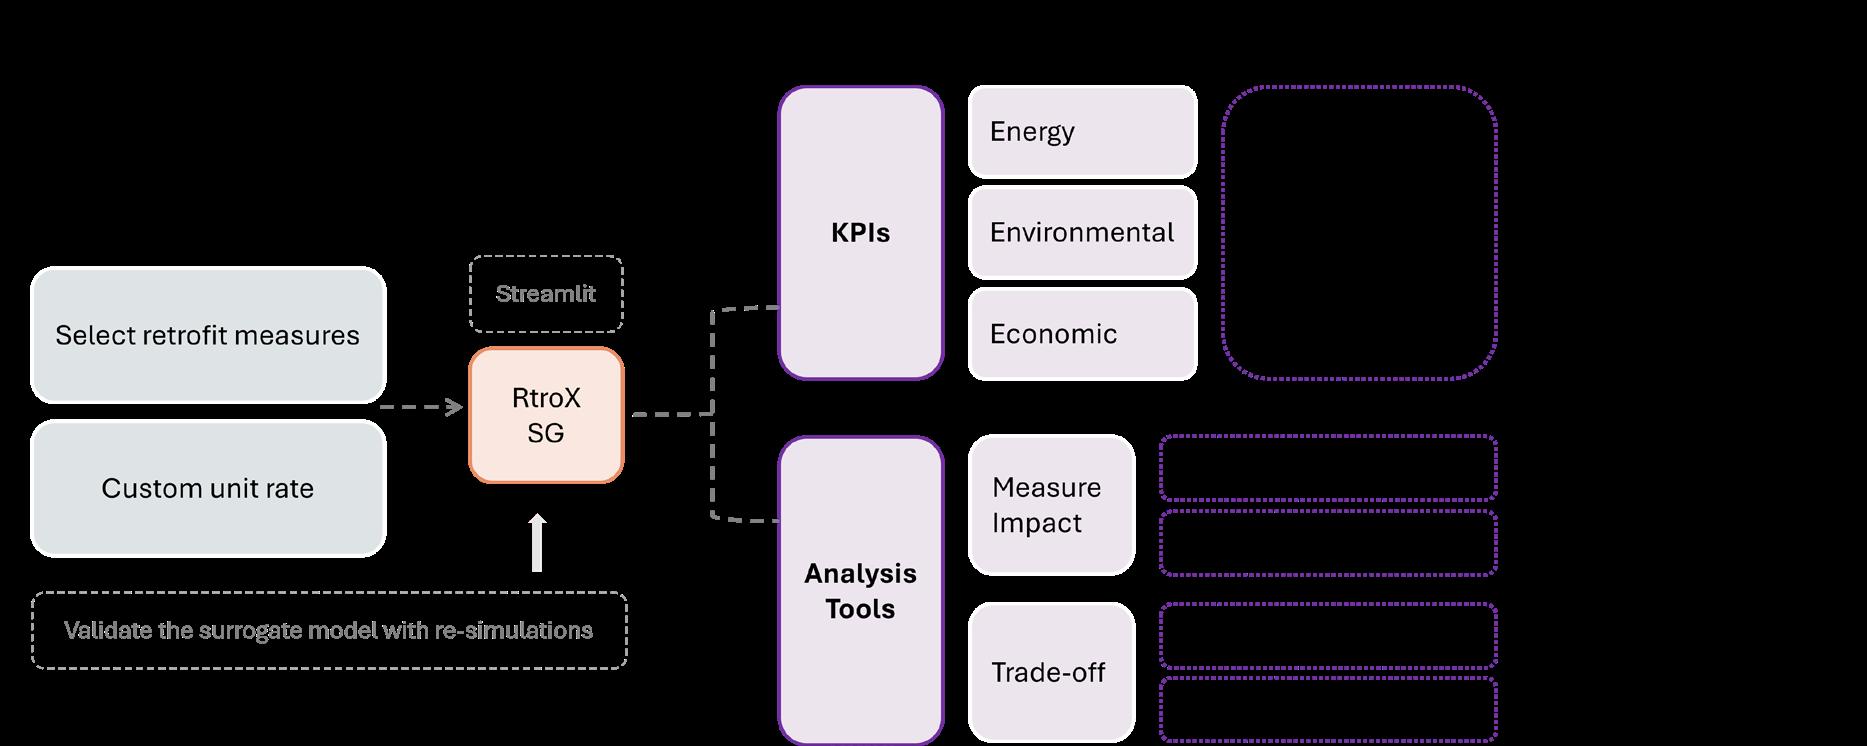
Figure 6. RetroX SG toolkit architecture diagram showing User Inputs, KPIs calculation module, and integrated Analysis Tools for decision support
A web-based toolkit was developed using Streamlit with three main modules: (1) User Inputs for retrofit measure selection and unit rate customization, (2) KPIs displaying energy, environmental, and economic metrics with benchmark comparisons, and (3) Analysis Tools including Measure Impact Analysis (bar, waterfall, radar charts), Weighted Impact Index balancing energy and cost, and Trade-off Explorer showing Pareto-optimal retrofit solutions. The toolkit integrates explainable AI (SHAP) to identify influential retrofit measures and verify model predictions align with physical principles.
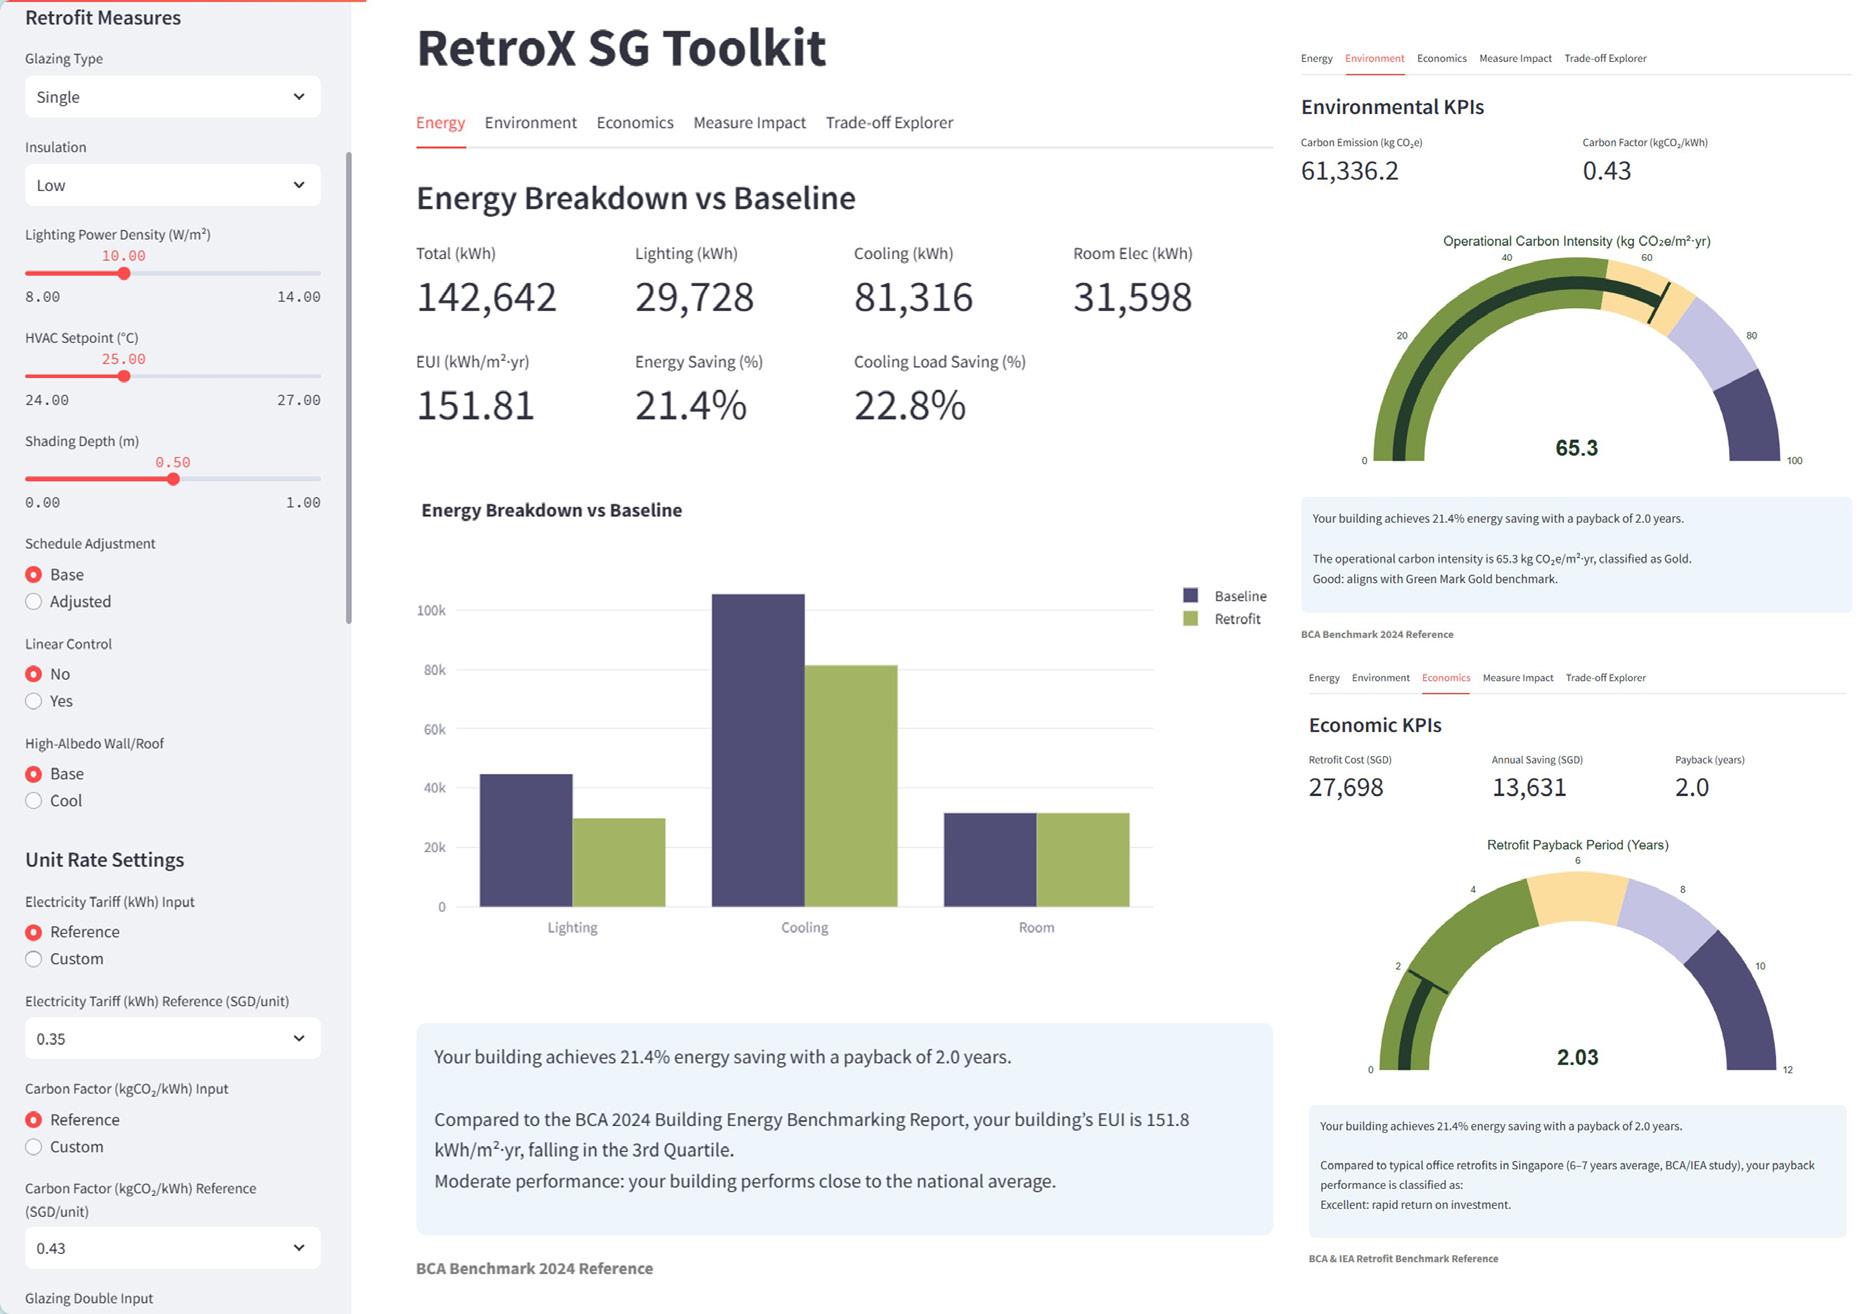
Figure 7. Key Performance Indicator dashboard displaying Energy (EUI and energy breakdown), Environmental (carbon intensity gauge), and Economic (payback period gauge) metrics
The toolkit calculates three categories of KPIs: (1) Energy indicators including energy consumption, EUI, and cooling load reduction percentage; (2) Environmental indicators measuring operational carbon intensity (kgCO₂e/m²·yr) using Singapore's grid emission factor of 0.43 kgCO₂/kWh; and (3) Economic indicators including retrofit cost (Capex), annual cost savings, and payback period. Among the 120 retrofit cases evaluated, 75% achieved EUI in the third quartile (second-best performance tier), 23.3% reached the second quartile, and only 1.7% remained in the bottom quartile, demonstrating significant improvement potential from baseline conditions.
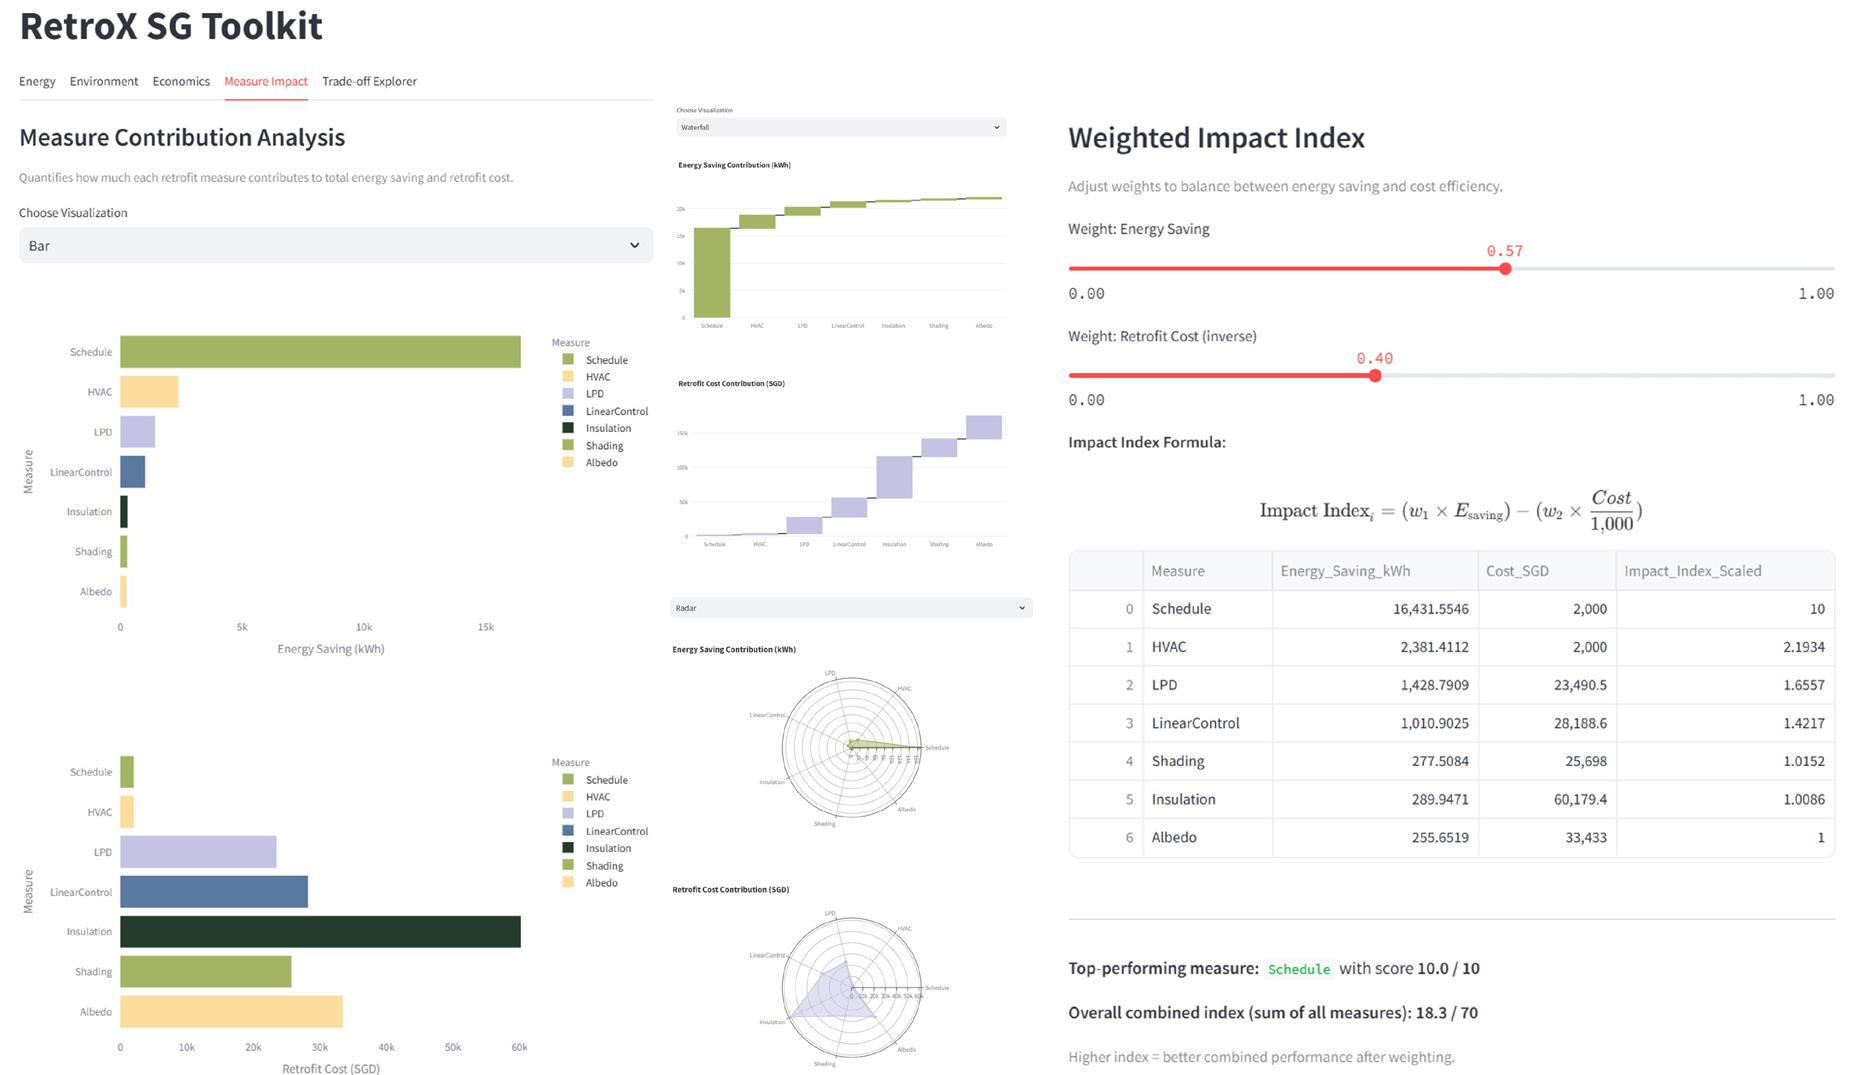
Figure 8. Measure Impact visualization showing the contribution of each retrofit measure to total energy savings and retrofit cost through waterfall and radar chart representations
Measure contribution analysis quantifies the impact of individual retrofit options on total energy savings and retrofit cost. Among the 14 retrofit cases meeting Green Mark Energy Efficiency criteria, all incorporated linear lighting control and schedule adjustments for both lighting and HVAC systems. Sixty-two percent featured highinsulation materials and low-E glazing, while 46% applied high-albedo wall coatings. The most energy-efficient combinations adopted LPD values of 8–10 W/m², elevated HVAC setpoints (1–2°C higher than baseline), and moderate-to-deep shading depths (0.7–0.9 m), demonstrating the importance of combined, synergistic measures (Madushika et al., 2023).
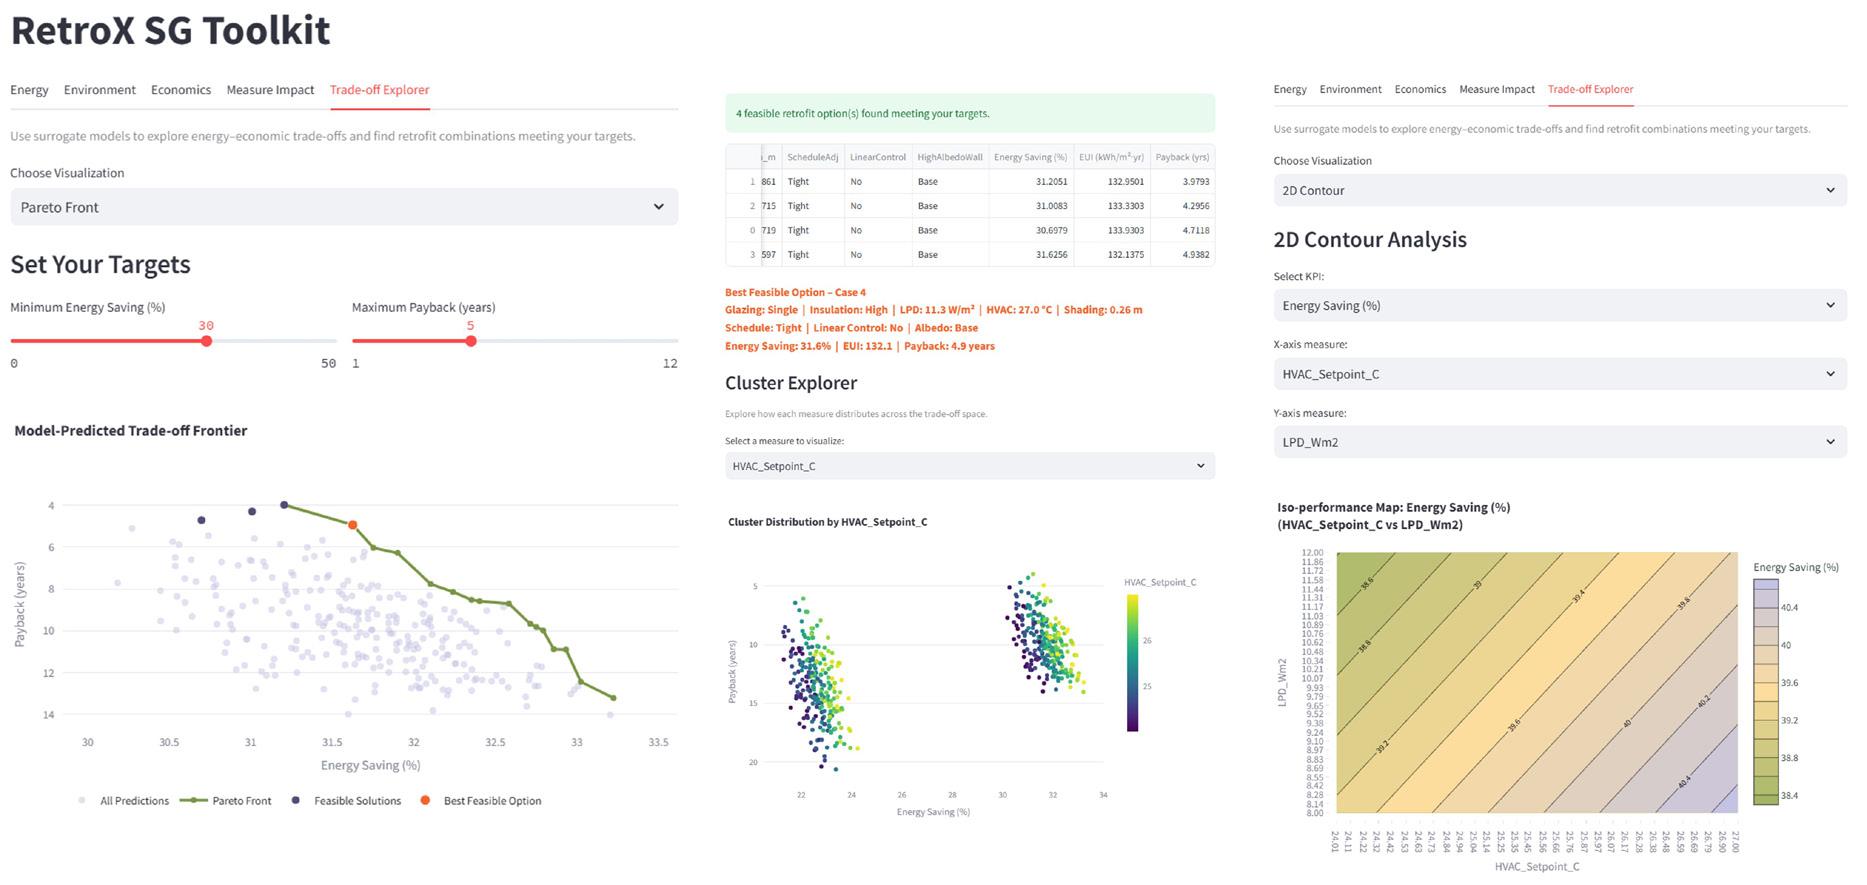
Figure 9. Trade-off Explorer showing Pareto front of retrofit combinations, with cluster distribution highlighting the strong influence of operational schedule adjustments on energy-cost trade-offs
The Trade-off Explorer module enables users to define target ranges for energy savings and payback years, displaying the global Pareto front across all retrofit combinations. This feature identifies feasible and optimal solutions according to current preferences. A Cluster Explorer visualizes the distribution of retrofit strategies across the tradeoff space, with clustering revealing that schedule adjustments have the strongest influence on the energy savings–cost trade-off. Additionally, 2D contour analysis supports sensitivity analysis and measure interaction evaluation by varying two retrofit measures while holding others at mean values.
RetroX SG demonstrates a practical approach to accelerating retrofit evaluation for small office buildings in Singapore by combining building performance simulations with machine learning surrogate models. The toolkit achieves rapid prediction of energy, carbon, and economic KPIs, significantly reducing reliance on time-consuming and computationallyintensive simulations. Surrogate models attained high internal accuracy (R² > 0.89), confirming the feasibility of AI-based retrofit assessment. Linear Regression effectively captured near-linear cooling trends, while XGBoost successfully handled nonlinear lighting interactions. Explainable AI analysis (SHAP) identified schedule adjustment as a key driver of total energy performance and enhanced model interpretability. However, empirical validation using re-simulated test cases revealed limited generalization beyond the trained design space, with negative or near-zero R² values indicating model
extrapolation challenges. This limitation stems from sparse coverage of the multi-dimensional design space (only 120 cases), which may not capture complex nonlinear interactions. Future work should enlarge datasets with diverse building types and detailed features, adopt physics-informed machine learning approaches to integrate energy balance constraints, and explore transfer learning frameworks to adapt surrogate models to new building types with minimal retraining (Jiang et al., 2025). Despite these limitations, RetroX SG remains a transparent, user-friendly platform for exploring retrofit options and visualizing performance trade-offs, supporting evidencebased decision-making for sustainable building retrofits in Singapore.
Ali, A., Jayaraman, R., Mayyas, A., Alaifan, B., & Azar, E. (2023). Machine learning as a surrogate to building performance simulation: Predicting energy consumption under different operational settings. Energy and Buildings, 286. doi: 10.1016/ j.enbuild.2023.112940.
Bocaneala, N., Mayouf, M., Vakaj, E., & Shelbourn, M. (2024). Artificial Intelligence Based Methods for Retrofit Projects: A Review of Applications and Impacts. Archives of Computational Methods in Engineering, 32(2), 899–926. doi: 10.1007/s11831024-10159-7.
Jakob, M. (2007). The trade-offs and synergies between energy efficiency, costs and comfort in office buildings.
Jiang, Z., et al. (2025). Physics-informed machine learning for building performance simulation-A review of a nascent field. Advances in Applied Energy, 18. doi: 10.1016/j.adapen.2025.100223.
Madushika, U. G. D., Ramachandra, T., Karunasena, G., & Udakara, P. A. D. S. (2023). Energy Retrofitting Technologies of Buildings: A Review-Based Assessment. Energies, 16(13). doi: 10.3390/ en16134924.
Markarian, E., et al. (2024). Informing building retrofits at low computational costs: a multi-objective optimisation using machine learning surrogates of building performance simulation models. Journal of Building Performance Simulation, 1–17. doi: 10.1080/19401493.2024.2384487.
Shen, Y., & Pan, Y. (2023). BIM-supported automatic energy performance analysis for green building design using explainable machine learning and multi-objective optimization. Applied Energy, 333. doi: 10.1016/ j.apenergy.2022.120575.
Shirzadi, N., Lau, D., & Stylianou, M. (2025). Surrogate Modeling for Building Design: Energy and Cost Prediction Compared to SimulationBased Methods. Buildings, 15(13). doi: 10.3390/ buildings15132361.
Thrampoulidis, E., Mavromatidis, G., Lucchi, A., & Orehounig, K. (2021). A machine learning-based surrogate model to approximate optimal building
retrofit solutions. Applied Energy, 281. doi: 10.1016/j.apenergy.2020.116024.
Westermann, P., & Evins, R. (2019). Surrogate modelling for sustainable building design – A review. Energy and Buildings, 198, 170–186. doi: 10.1016/j.enbuild.2019.05.057.
Kefan Chen, Guanli Feng
# KEYWORDS
Indoor lighting comfort
PECS & Background control
Energy saving
Multi-objective optimization
Surrogate model
# HIGHLIGHTS
• Proposes a Balanced Light Control Framework that coordinates central background lighting with personal task lights (PECS) to minimize lighting energy while meeting illuminance and uniformity requirements under dynamic occupancy (SS 531:2006).
• Uses simulation-based optimization (ClimateStudio + Galapagos) across multiple occupancy distributions to generate optimal control solutions, then trains a multimodal surrogate model (CNN + tabular inputs) to predict near-optimal lighting states in real time.
• Validated with historical BEE Hub occupancy data, the optimized strategy reduces energy from 39.92 kWh to 34.72 kWh (13%) over 285 hours and achieves up to 68.3% lower power than traditional ceilinglight-only operation at certain occupancy levels.
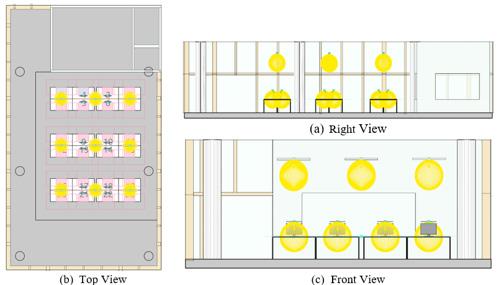
As building intelligence advances, balancing lighting system energy optimization with visual comfort remains critical. Lighting directly impacts occupant work efficiency and represents a significant portion of building energy consumption. Traditional centralized control systems struggle to meet diverse occupant needs, while Personalized Environmental Control Systems (PECS) lack coordination with background systems. This research proposes a balanced framework integrating both systems to achieve dual optimization of visual light comfort and energy consumption under dynamic occupancy conditions.
The study constructs a simulated lighting environment based on a 3D office model with random occupancy distribution data. Background and PECS parameters are optimized using a penalty-based multiobjective framework. A surrogate model trained on optimization results predicts optimal strategies for new occupancy patterns. Validation using historical data demonstrates significant energy savings while maintaining comfort standards.
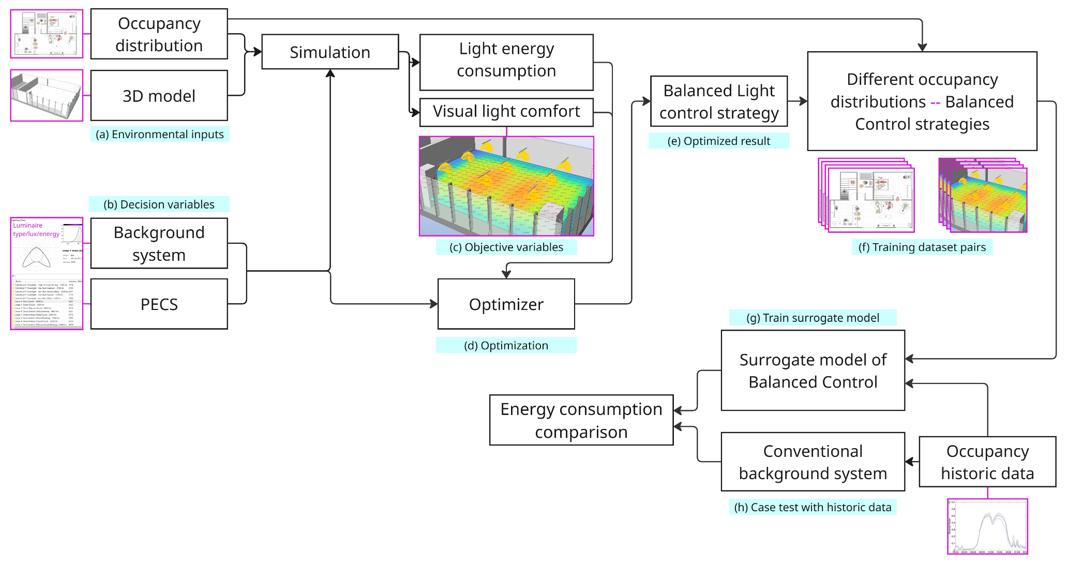
Figure 2. Integrated methodology showing environmental inputs, decision variables, optimization, surrogate model, and validation phases.
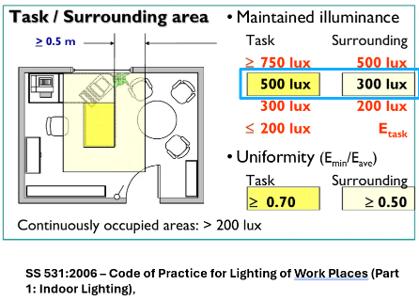
Figure 3. Lighting comfort requirements for task and surrounding areas per workplace standards.
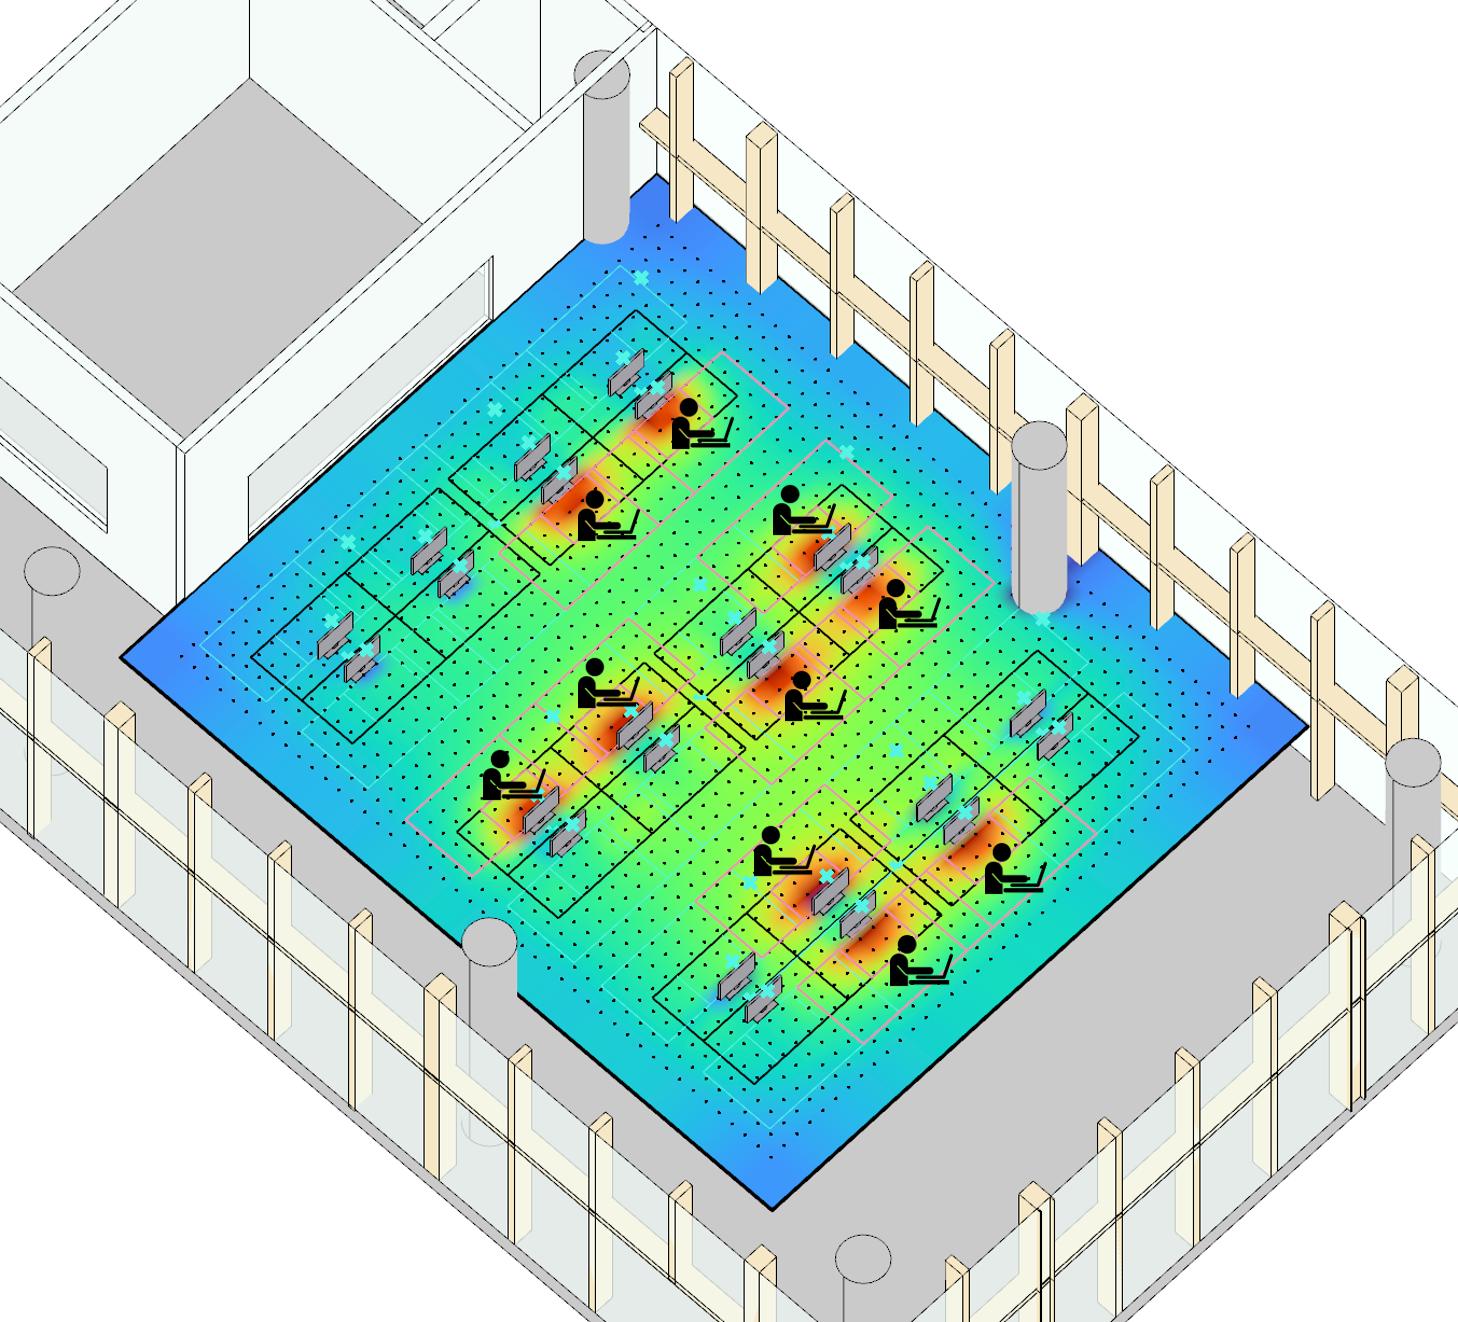
The methodology integrates six components: environmental inputs, decision variables, objective variables, optimization process, surrogate model construction, and case validation. Decision variables comprise three ceiling light levels (zone-based control) and 24 independent task light levels, enabling flexible dimming based on occupancy distribution (Figure 2).
Optimization objectives balance lighting energy consumption with visual comfort using a penalty-based fitness function. Comfort requirements follow SS 531:2006 standards: task areas require minimum 500 lux illuminance with 0.70 uniformity, while surrounding areas require 300 lux minimum with 0.50 uniformity (Figure 3).
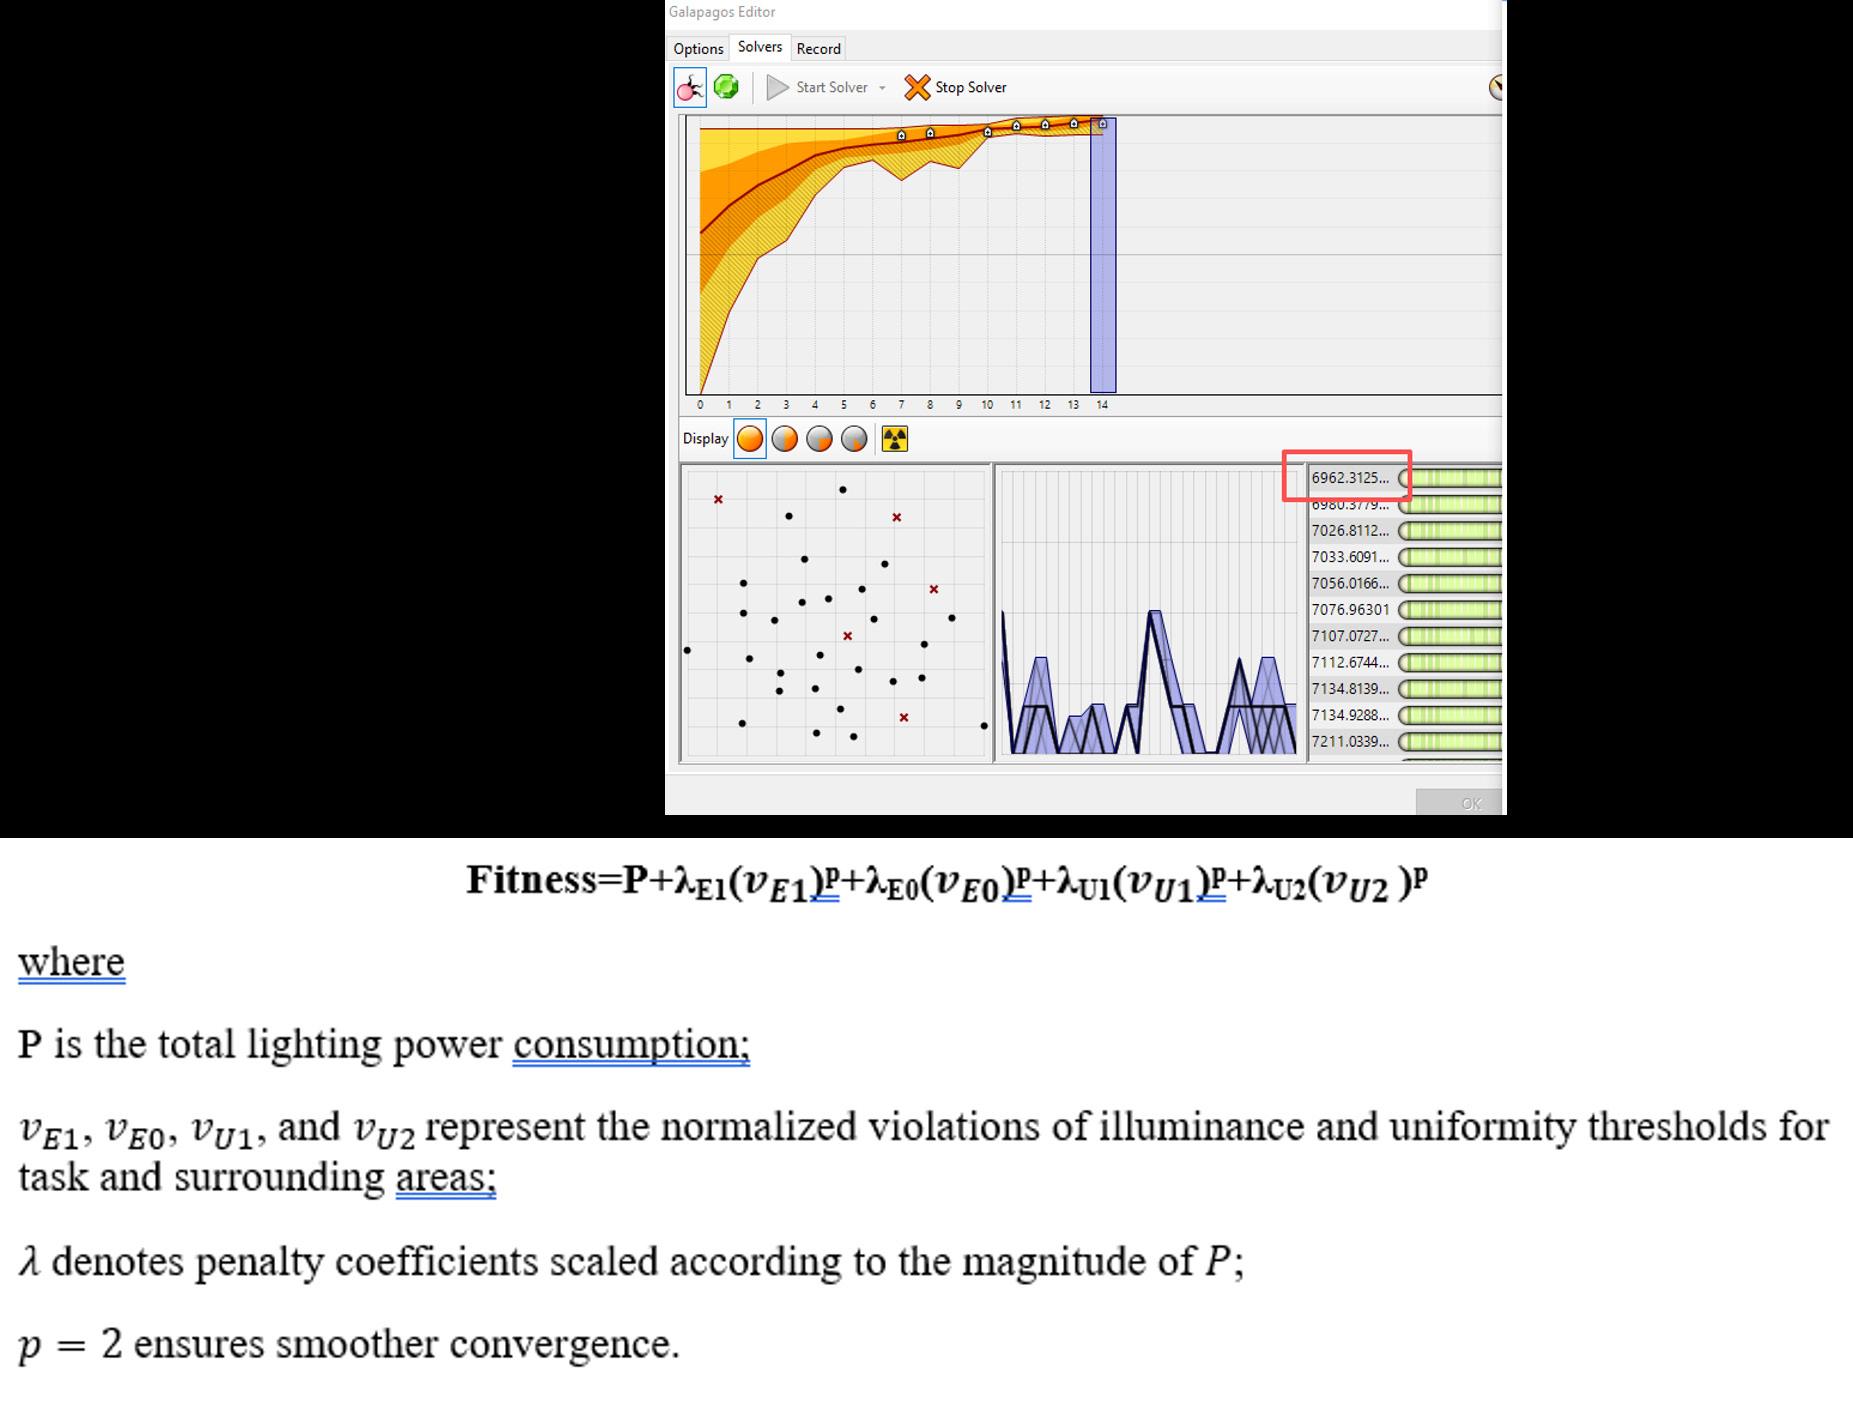
Figure 4. Optimization process using penalty-based fitness function to balance comfort and energy objectives.
Galapagos evolutionary optimizer generates optimal lighting strategies under diverse occupancy scenarios using ClimateStudio simulations. The penalty function imposes high costs on solutions failing to meet comfort standards, ensuring the optimizer converges to feasible solutions with minimal energy consumption(Figure 4).
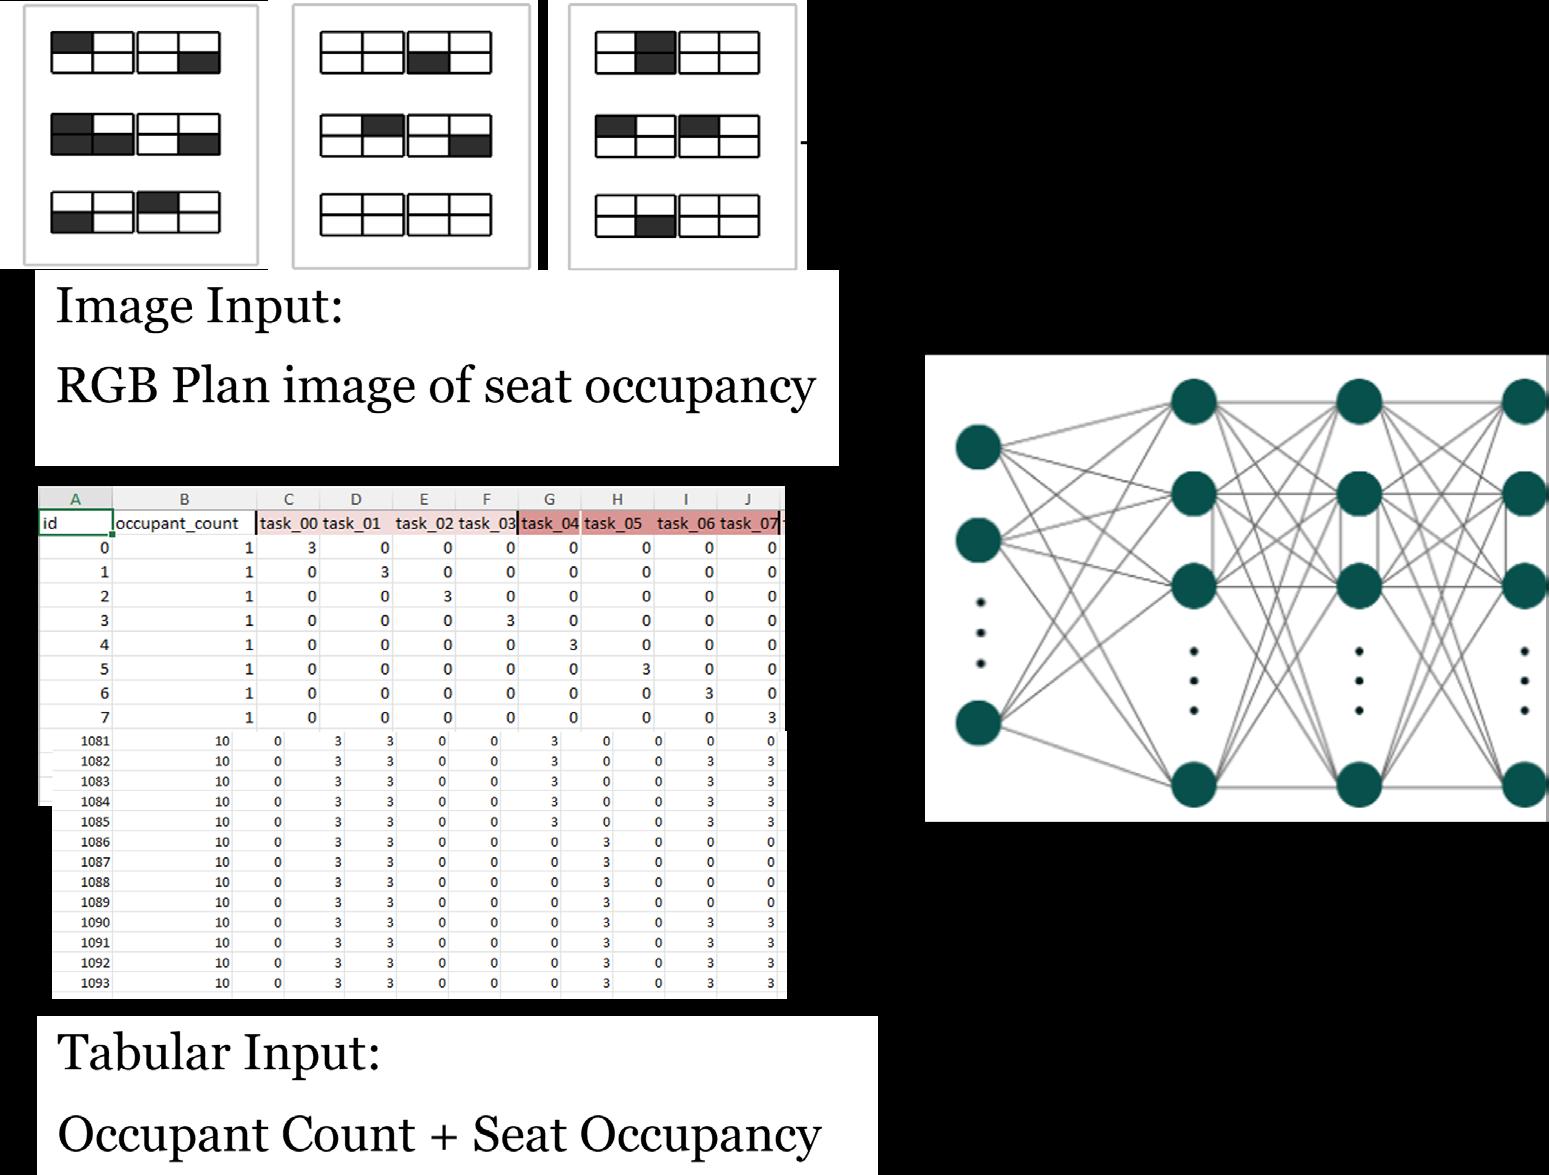
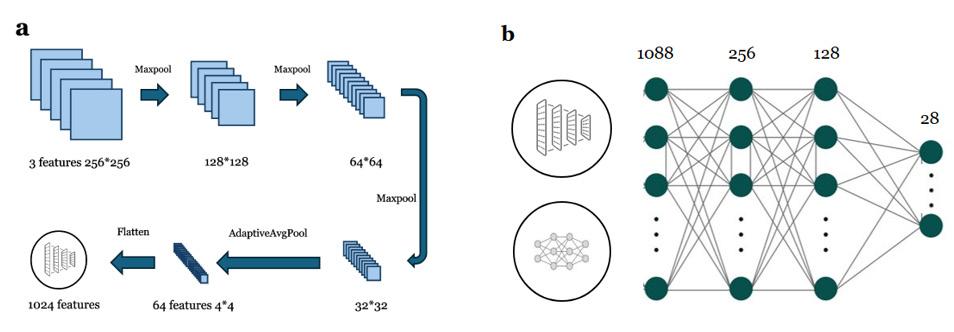
A multimodal surrogate model processes both image and tabular inputs: an RGB plan image (256×256 pixels) encoding seating layout, and a 25-dimensional vector containing occupancy count and seat-occupancy indicators. The
CNN image branch extracts spatial features, while a fully connected tabular branch processes occupancy data, with fusion MLP layers predicting 28 output features including lighting levels and power consumption.
The surrogate model was trained with batch size 32 over 300 epochs at learning rate 0.002 with 0.2 validation split. Training loss rapidly decreased within the first 50 epochs and converged to approximately 0.01–0.005, while validation loss stabilized between 0.005–0.00, indicating excellent generalization without overfitting.
The optimized control strategy reduced total lighting energy consumption from 39.92 kWh to 34.72 kWh over a 285-hour study period, representing a 13% reduction. Compared to traditional ceiling-only lighting, the optimized approach achieved energy savings up to 68.3% at certain occupancy levels, with consistent improvements as occupancy count increased.
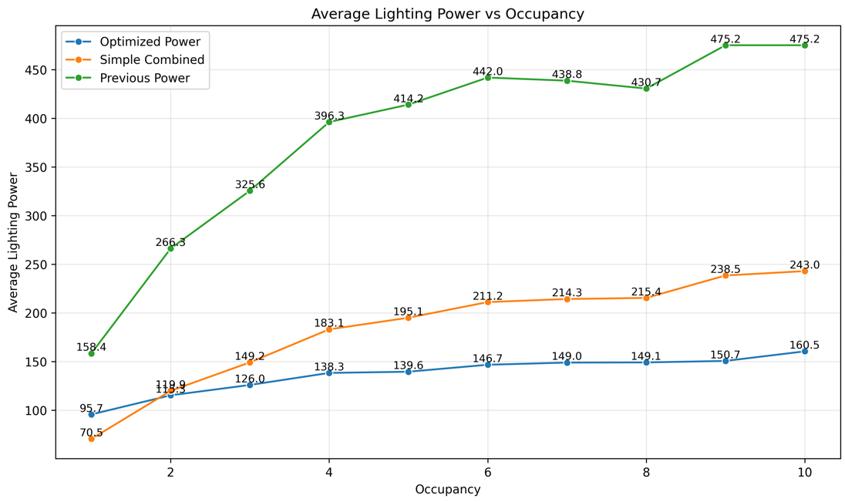
Figure 8. Average lighting power consumption across three control strategies (Traditional, Simple Combined, Optimized) showing occupancy-dependent energy savings up to 68.3%.
Analysis of power consumption during the study period demonstrated consistent performance of the optimized strategy across varying temporal occupancy patterns. Both simple combined and optimized approaches significantly reduced energy use compared to traditional lighting, with the optimized model providing superior performance in most time intervals except during low-occupancy periods.
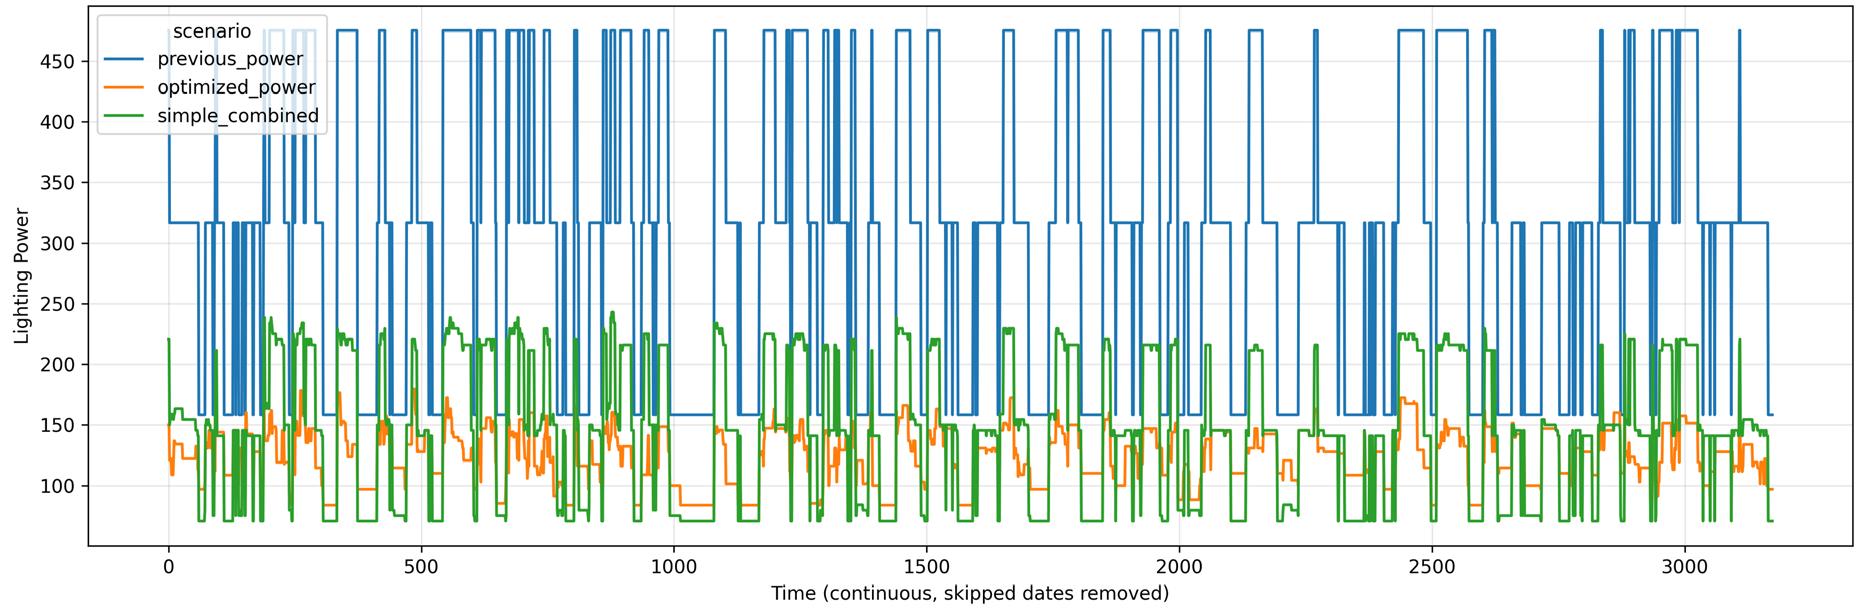
Figure 9. Lighting power variation throughout the study period (5-minute timesteps), comparing traditional, simple combined, and optimized control strategies during nighttime hours.
This research demonstrates an effective framework integrating simulation-optimization and machine learning to achieve intelligent adaptive lighting control in open-plan offices. The surrogate model achieves high prediction accuracy (validation loss ≈ 0.005), enabling real-time control decisions based on occupancy patterns. Using historical BEE Hub occupancy data, the optimized strategy reduced total energy consumption by 13% while maintaining comfort standards, with peak energy savings reaching 68.3% at certain occupancy levels relative to traditional methods.
The framework's success lies in its integrated approach: genetic algorithm optimization generates high-quality training data under diverse scenarios, the multimodal surrogate model rapidly predicts optimal states from
occupancy inputs, and validation with realworld data confirms applicability. However, limitations exist: optimization data generated under idealized simulation conditions may not fully capture real-world variability; model prediction accuracy decreases at low occupancy levels; and the study focuses only on nighttime lighting, excluding daylighting influence. Future work should incorporate diverse occupancy scenarios, lowoccupancy training samples, real-world sensor measurements, and whole-day simulations including daylighting to improve robustness and extend applicability to diverse building types and occupancy profiles.
De Korte, E. M., Spiekman, M., Hoes-van Oeffelen, L., Van Der Zande, B., Vissenberg, G., Huiskes, G., & Kuijt-Evers, L. F. M. (2015). Personal environmental control: Effects of pre-set conditions for heating and lighting on personal settings, task performance and comfort experience. Building and Environment, 86, 166–176. https://doi. org/10.1016/j.buildenv.2015.01.002
Lesina Debiasi, L. (2020). Illuminating Preference: Rethinking Colored Lighting in Workplace Environments [Thesis, Massachusetts Institute of Technology]. https://dspace.mit.edu/ handle/1721.1/130183
Papinutto, M., Colombo, M., Golsouzidou, M., Reutter, K., Lalanne, D., & Nembrini, J. (2021). Towards the integration of personal task-lighting in an optimised balance between electric lighting and daylighting: A user-centred study of emotion, visual comfort, interaction and form-factor of task lights. Journal of Physics: Conference Series, 2042(1), 012115. https://doi.org/10.1088/17426596/2042/1/012115
Tekler, Z. D., Ono, E., Peng, Y., Zhan, S., Lasternas, B., & Chong, A. (2022). ROBOD, room-level occupancy and building operation dataset. Building Simulation, 15(12), 2127–2137. https:// doi.org/10.1007/s12273-022-0925-9
Xinrui Zhang, Yudian Chen
# KEYWORDS
Energy Consumption Prediction
Data Generation
U-Net
Dice Loss
XGBoost
# HIGHLIGHTS
• Develops a two-stage AI workflow that enables architects to obtain early performance estimates from simple design sketches by combining image-based façade understanding with tabular performance prediction.
• Uses U-Net semantic segmentation to extract window and wall regions from façade renderings and automatically compute orientationspecific WWR via pixel counting, reducing manual measurement effort.
• Trains an XGBoost model on a Grasshopper + Climate Studio synthetic dataset using 7 intuitive geometric inputs to predict EUI and Mean Illuminance, and finds XGBoost outperforms MLP and TabNet for this low-dimensional structured task.
Performance-driven design has become an indispensable part of contemporary architectural practice; however, early-stage performance evaluation remains heavily reliant on time-consuming simulation workflows. During conceptual design, architects often rely on intuition or simplified experience because detailed geometric models are not developed yet, and full simulation in tools such as EnergyPlus are time-taken and labourintensive.
Recent advances in Artificial Intelligence (AI) offer an opportunity to address this inconvenience. Image-based deep learning can automatically interpret architectural sketches and photographs, while tabular machine learning models can learn relationships
between simple geometric parameters and building performance metrics.
This project integrates these functions to assist in preliminary performance design planning.
The workflow employs a U-Net semantic segmentation model to extract façade features from rendered diagrams, generating Windowto-Wall Ratio (WWR) values. Subsequently, these values are combined with building parameters to train an XGBoost model for predicting Energy Use Intensity (EUI) and Mean Illuminance (MI).
The U-Net semantic segmentation model was employed to extract window and wall regions from rendered architectural images. The dataset comprises 200 architectural photographs with corresponding LabelMe JSON annotation files, converted into semantic segmentation masks with class mapping: background (0), window (1), and wall (2).
The architecture consists of an encoder that extracts hierarchical features and a decoder that reconstructs spatial detail. Skip connections bridge corresponding encoder and decoder layers, enabling fine-grained spatial cues to be preserved. Training employed a hybrid loss function combining Cross-Entropy Loss (70%) with Dice Loss (30%), addressing class imbalance.
Following segmentation, WWR was computed using pixel counts of window and wall classes. The function calculates WWR as the ratio of window pixels to the total façade pixels (window plus wall), enabling rapid extraction of WWR from a single façade photograph.
The U-Net model successfully demonstrates an automated WWR calculation framework. Despite limitations in dataset scale, the model achieves reasonable segmentation accuracy and generates acceptable WWR estimates. Wall regions achieved higher IoU owing to their large pixel presence, while window IoU remained acceptable given dataset constraints.
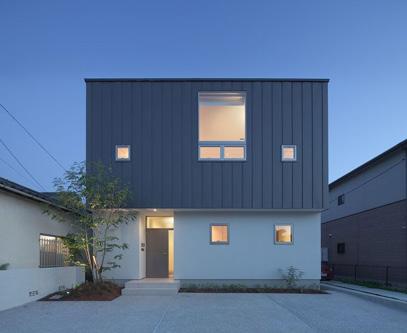
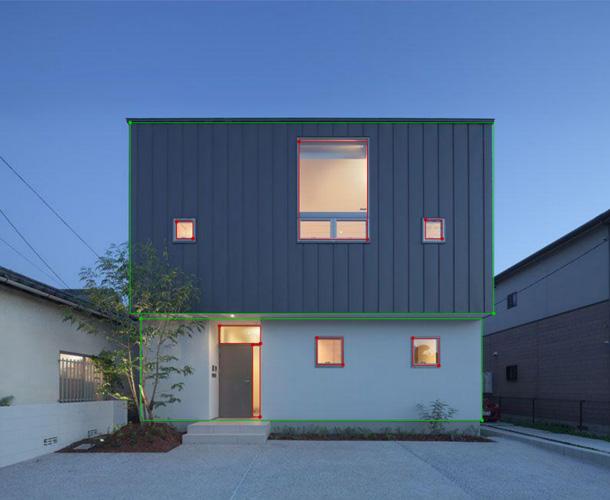
Upon successful training, the XGBoost model achieved excellent performance metrics:
R² Score: 0.9894
MAE: 0.0995
RMSE: 0.2862
Following the initial successful training using XGBoost, the same workflow was applied to two additional algorithms: Multi-Layer Perceptron (MLP) and TabNet. XGBoost achieved the best overall performance across all evaluation metrics, aligning with industry consensus that XGBoost is the most powerful choice for structured tabular data.
This integrated workflow enables architects to rapidly obtain early performance estimates directly from design sketches. The comprehensive process begins with an initial architectural sketch, rendering of the four façades, extraction of WWR values using the U-Net model, and finally prediction of EUI and MI using the XGBoost model.
By integrating semantic segmentation with numerical prediction models, this workflow shortens the design-analysis loop from hours to minutes, supporting more informed and iterative decision-making during the earliest stages of architectural design. This significantly accelerates the iterative design process and enables comprehensive sustainable design
to be conducted during the preliminary architectural design phase.
Future work could incorporate larger annotated datasets, improved model architectures such as DeepLab or Mask R-CNN, and additional façade classes including doors and shading systems. The XGBoost model will be continually expanded to incorporate a greater number of architectural parameters and will aim to integrate real-world urban building environments in Singapore.
Kaifeng Zhu, Zesheng Yang
# KEYWORDS
Battery Energy Storage System
Model Predictive Control
Renewable Energy System Optimization
# HIGHLIGHTS
• Proposes a data-driven predictive optimization framework for cost-effective PV–BESS operation under dynamic electricity pricing, combining multi-resolution forecasting with rule-based battery control.
• Evaluates multiple demand and PV forecasting models (Random Forest, XGBoost, LSTM, Transformer) at 5-min, 15-min, and 1-hour resolutions, showing that model choice depends on target and temporal scale rather than a single “best” predictor.
• A German industrial case study shows BESS integration can reduce operating costs by up to 14%, while forecasting accuracy alone does not guarantee maximal savings due to prediction–control interactions.
Global final energy consumption has been steadily increasing, with the building sector accounting for nearly 28% of total demand by 2023 (Motherway et al., 2024). The transition towards renewable energy sources, particularly photovoltaics (PVs), provides significant advantages in energy security and environmental sustainability (Okuneviciute Neverauskiene et al., 2025). However, the intermittency of PV generation creates a temporal mismatch between energy supply and real-time building demand, commonly illustrated by the "duck curve" (Sheha, Mohammadi and Powell, 2020).
Battery Energy Storage Systems (BESS) offer a reliable approach to alleviating renewable energy intermittency and enhancing grid resilience (Liang et al., 2024). Model Predictive
Control (MPC) has emerged as a promising solution for optimizing BESS operation under dynamic conditions. Previous studies have demonstrated significant cost reductions through predictive optimization: up to 26% in electricity costs via PSO-based frameworks (Hossain et al., 2023) and 10–17% operational cost reductions over daily and monthly schedules (Diouf and Noro, 2025). Despite these advances, limited work has explored the combined effect of forecasting both PV generation and building energy demand on BESS operation cost. This study proposes a framework to enable cost-effective PV-BESS operation through model predictive control, focusing on a medium-sized industrial facility in Germany.
The case study involves a medium-sized industrial facility in Offenbach am Main, Germany, consisting of offices, workshops, server rooms, and a vehicle emissions laboratory. The facility hosts a 749 kWp PV system and a gas-fired CHP plant. Multiresolution datasets (5-min, 15-min, 1-hour) were aggregated from weather variables, historical electricity consumption, and PV generation data over four summer weeks (Engel et al., 2025).
Four machine learning models were evaluated for electricity demand and PV generation forecasting: Random Forest, Rolling-XGBoost (shallow learning), and LSTM and Transformer (deep learning). A Genetic Algorithm was employed for hyperparameter optimization of deep learning models. The overall methodology framework is shown in Figure 1.
A rule-based control algorithm was designed for battery charging and discharging under dynamic electricity pricing. The battery charges when the real-time electricity price falls below a threshold of 0.28 EUR/kWh and discharges during peak-price hours. The control logic is illustrated in Figure 2.
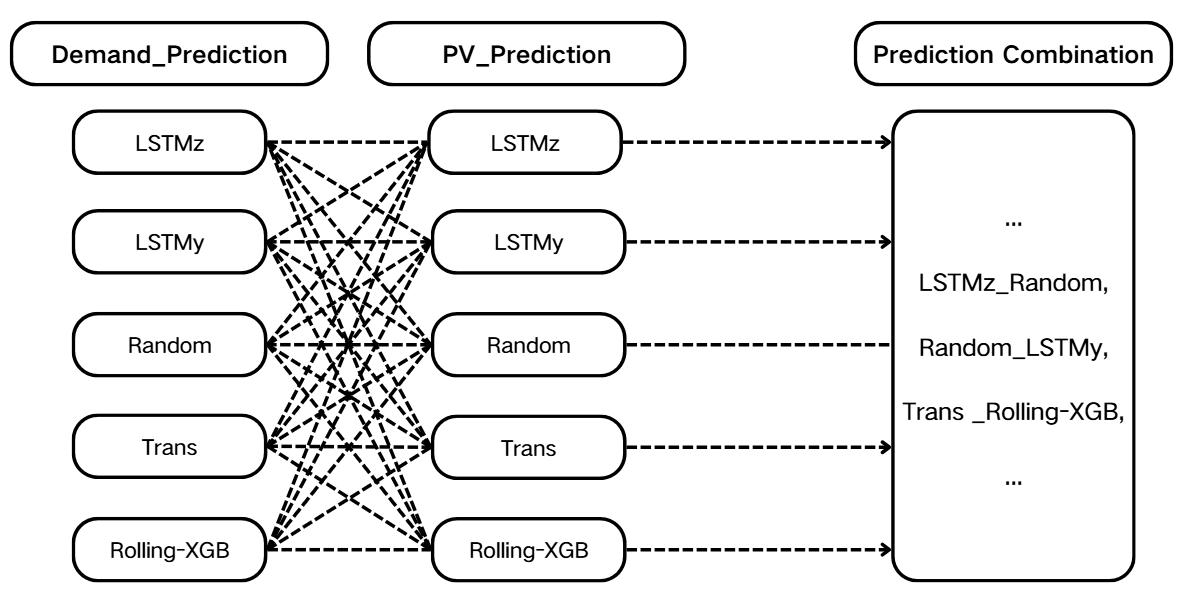
Figure 1. Overall methodology framework for the PV-BESS optimization study
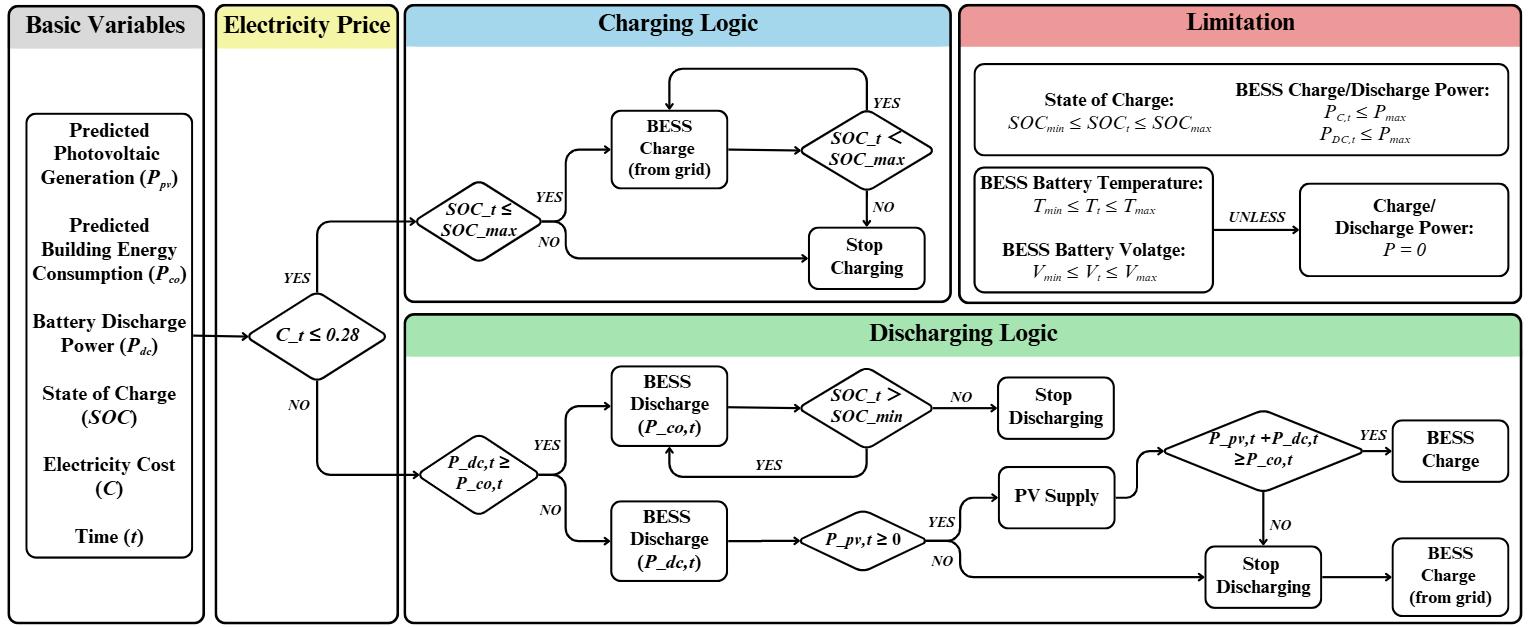
Figure 2. Rule-based battery control logic for charging and discharging operations
The prediction models demonstrated varying accuracy across different temporal resolutions. Random Forest and XGBoost generally achieved competitive performance with lower computational cost, while LSTM and Transformer models captured complex temporal patterns. Figure 3 shows the prediction comparison results.
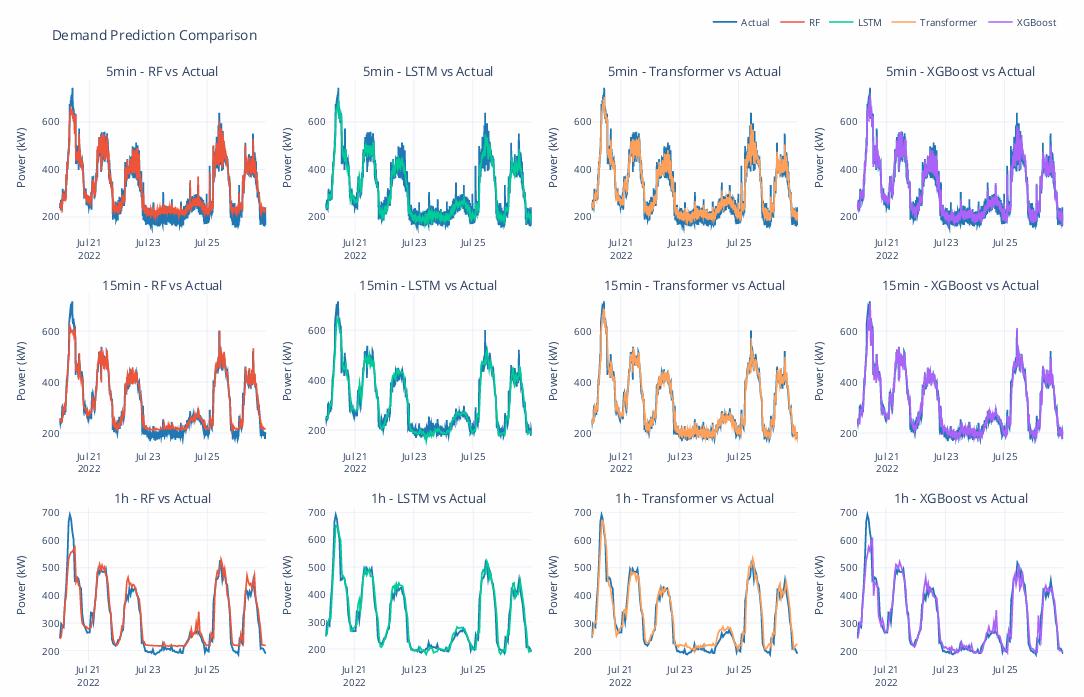
Figure 3. Prediction performance of forecasting models across temporal resolutions
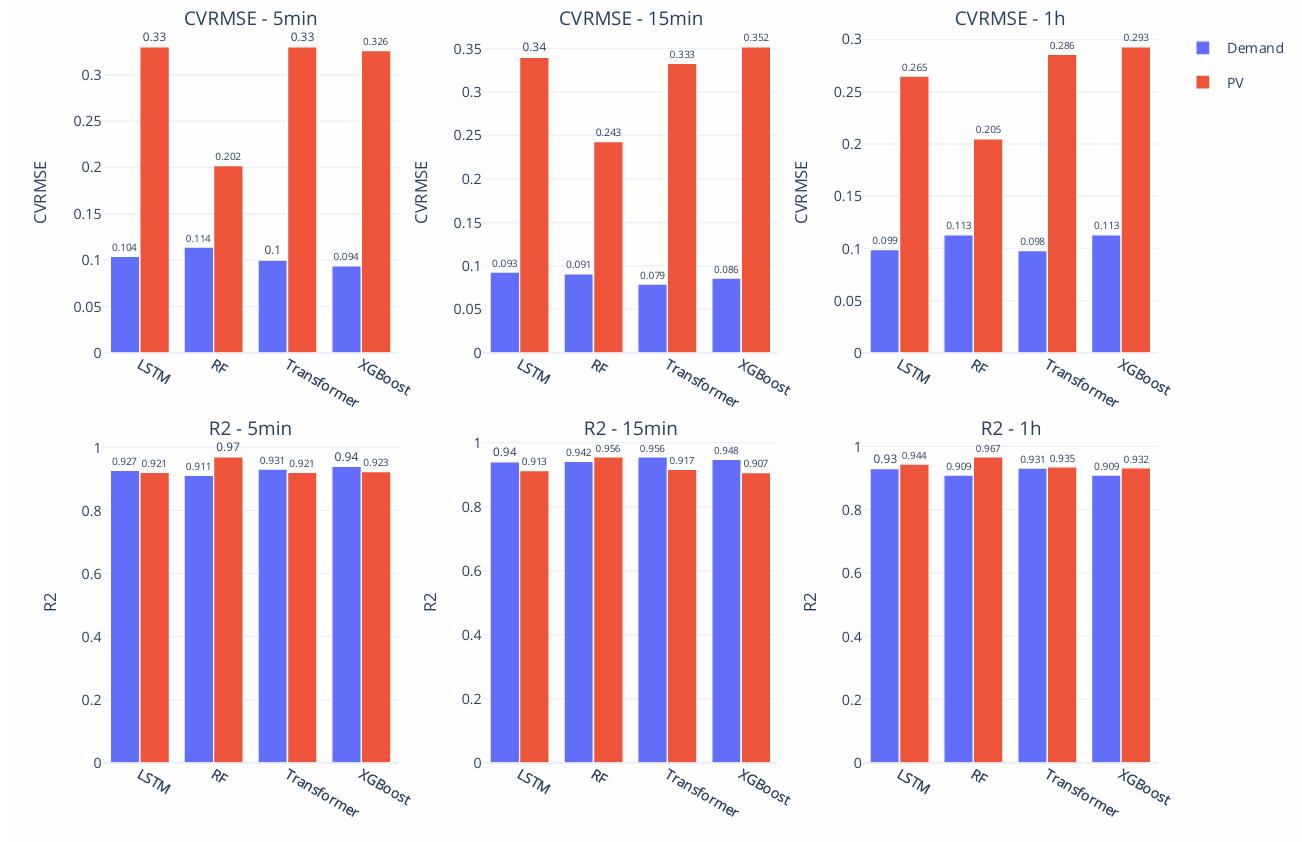
A comprehensive comparison across all models revealed that forecasting accuracy alone does not guarantee optimal BESS operation cost. The interaction between prediction quality and control strategy plays a crucial role in determining economic outcomes.
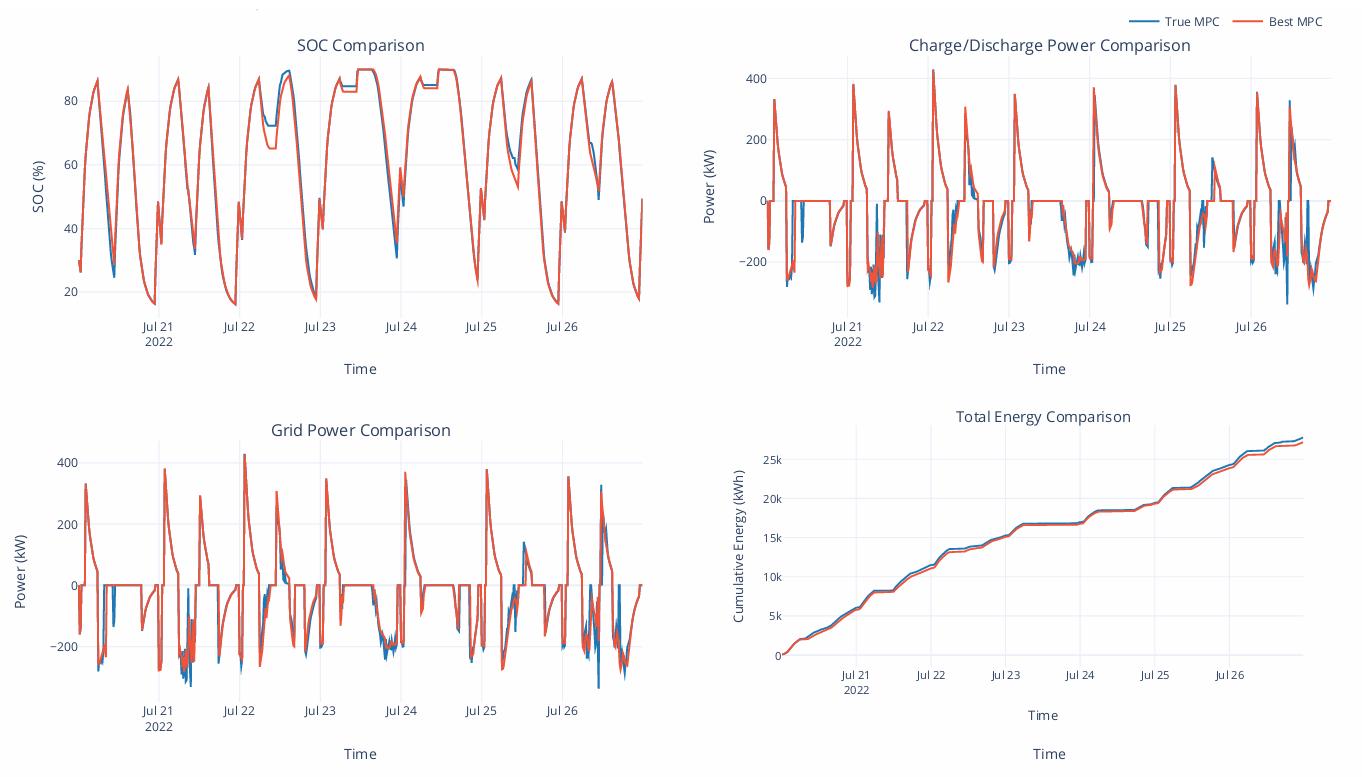
Figure 4. Comprehensive model comparison across evaluation metrics
The analysis of energy demand patterns alongside PV generation and BESS operation reveals the temporal dynamics of the facility's energy system. Figures 5-7 illustrate various aspects of the demand-supply relationship and BESS behavior.
study period
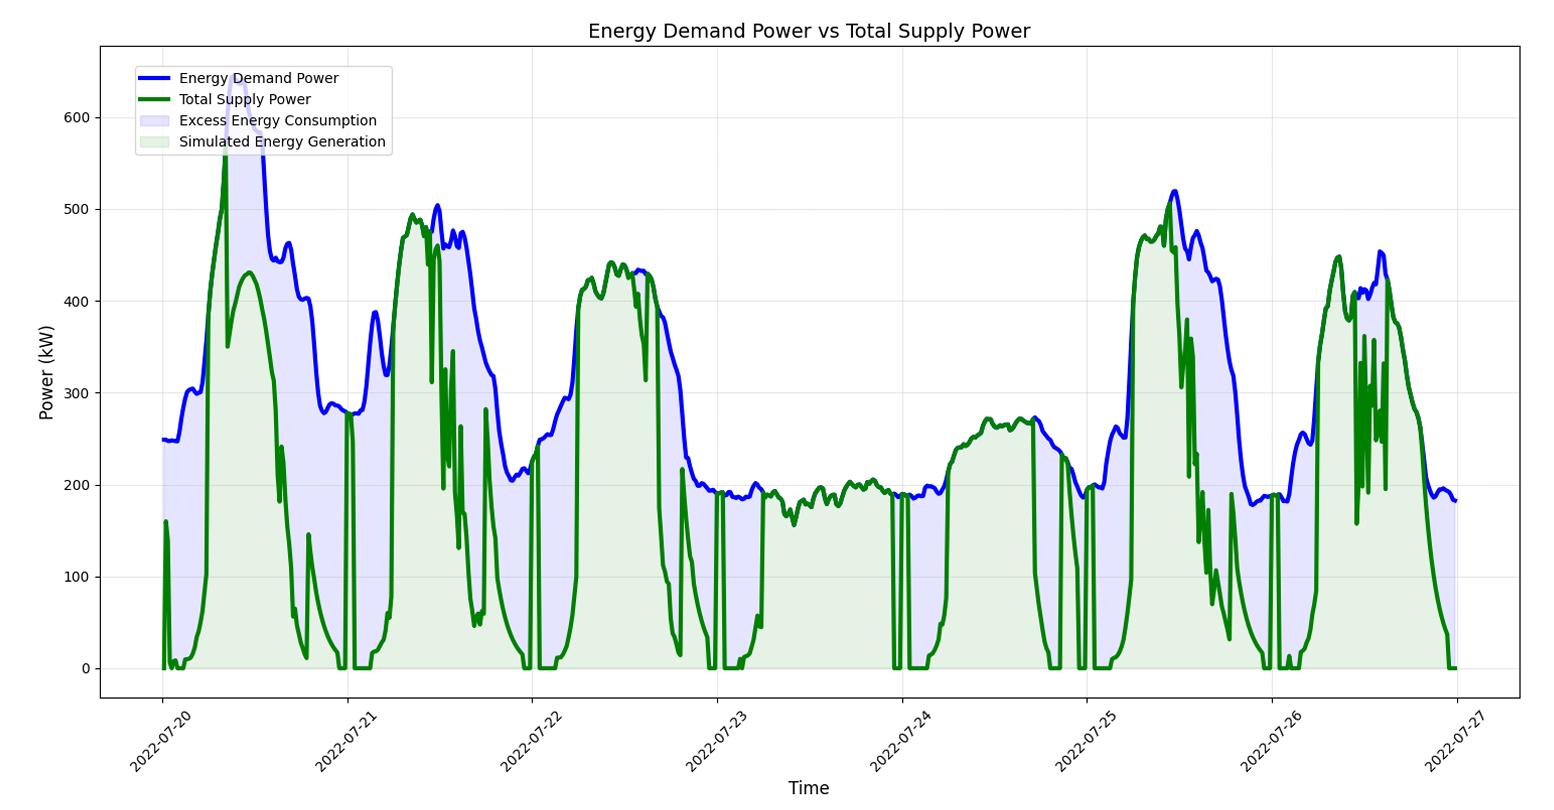
6. Demand and supply balance showing grid interaction patterns
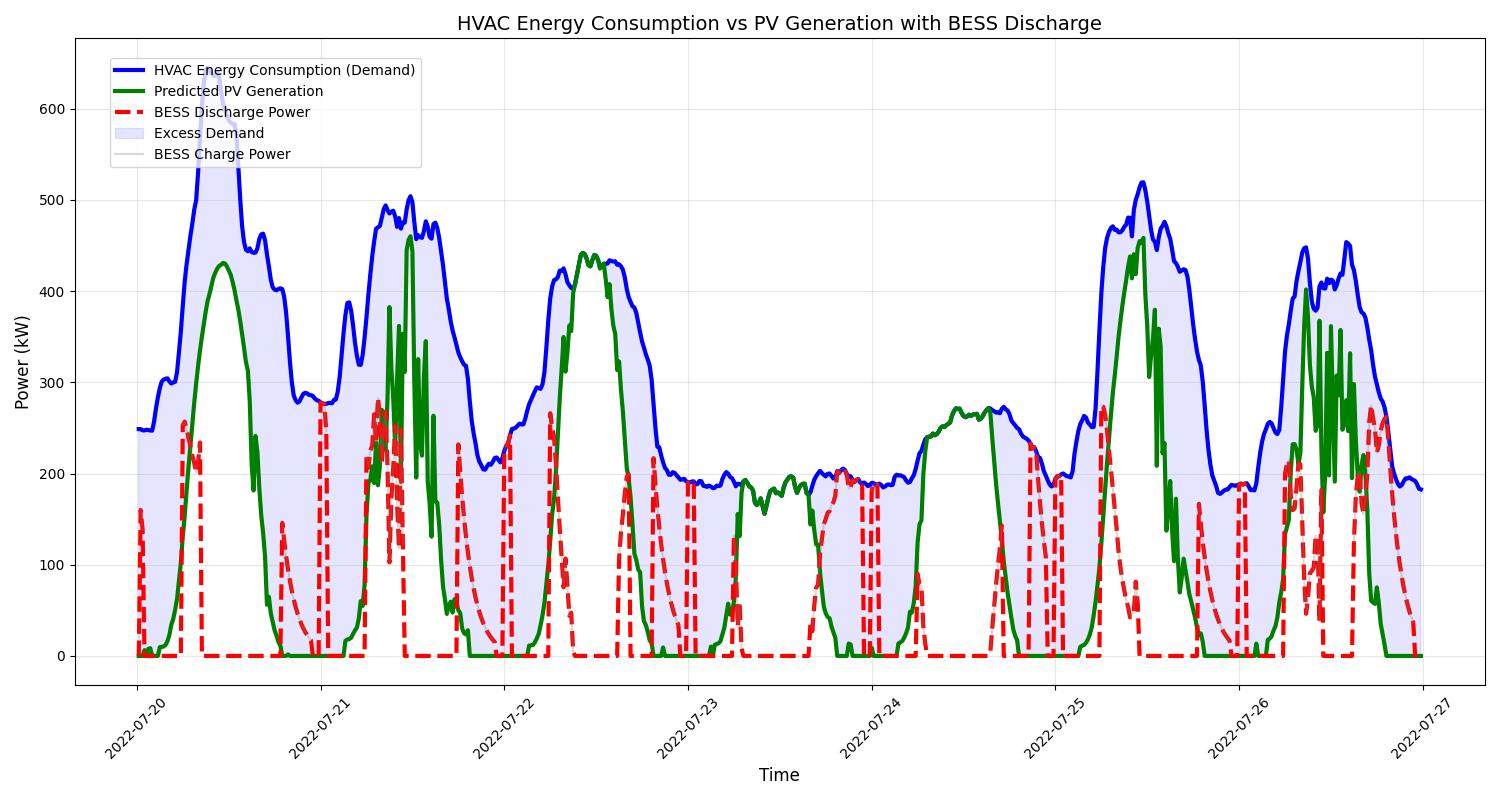
7. Integrated energy demand, BESS operation, and PV generation profiles
The BESS operation results demonstrate effective charge-discharge cycling aligned with dynamic pricing. The system achieves up to 14% reduction in energy costs through optimized battery scheduling. Safety constraints including state of charge limits and temperature bounds were maintained throughout operation.
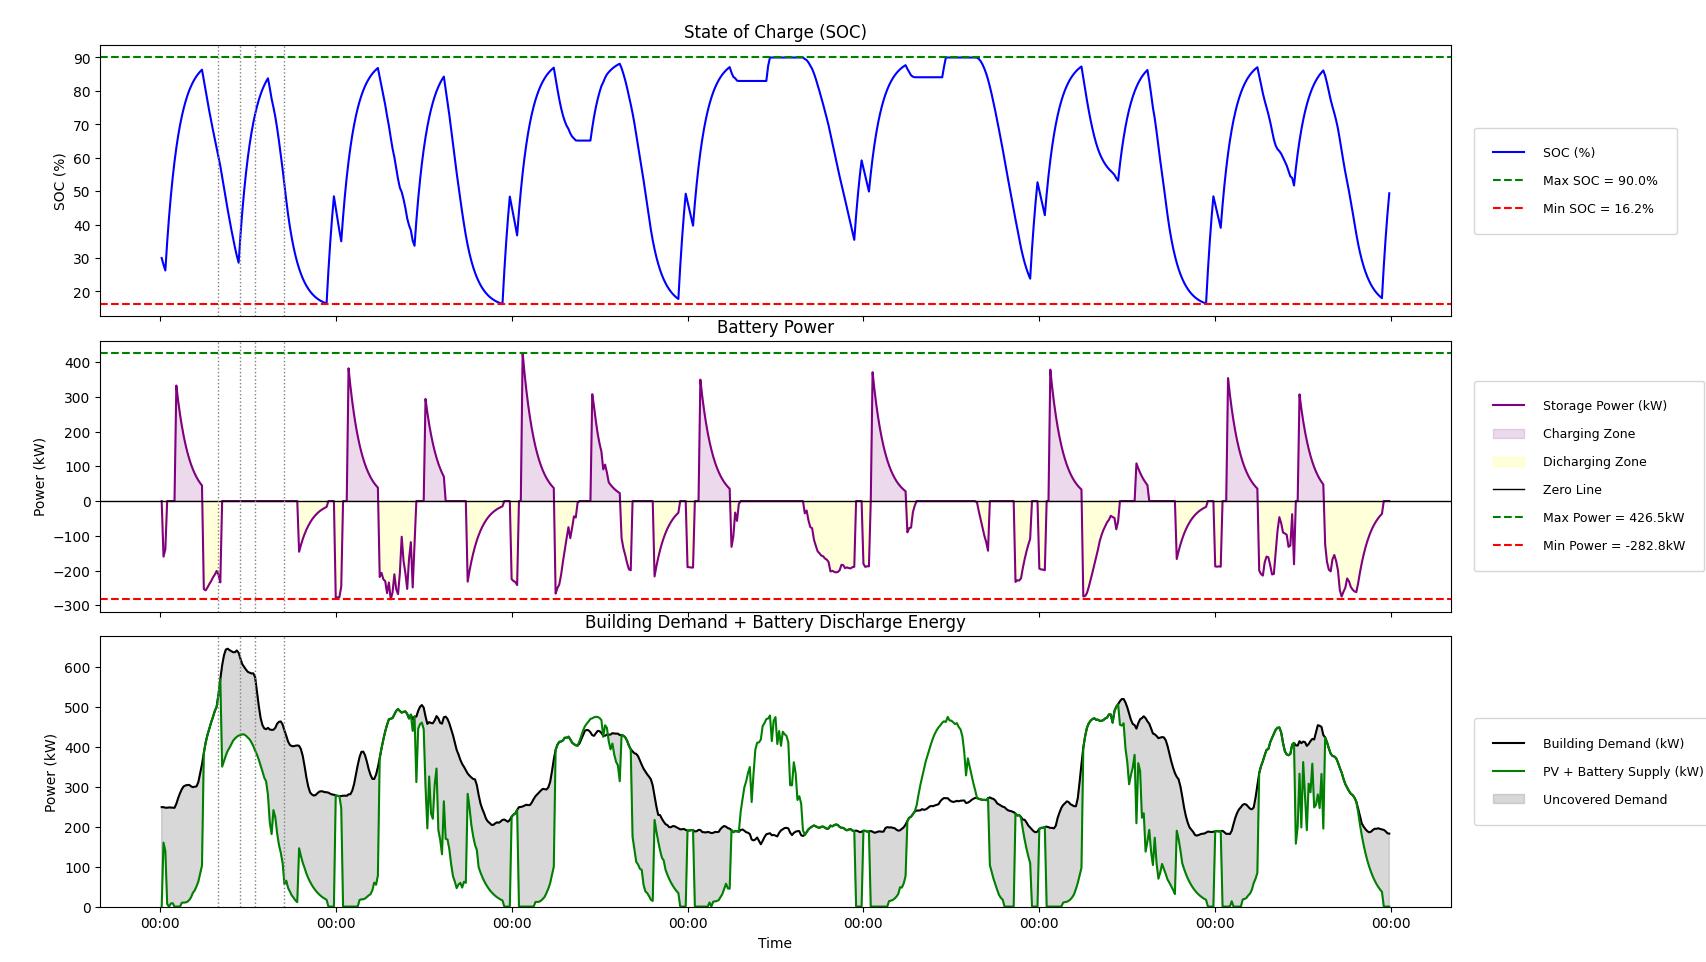
Figure 8. BESS charging and discharging behavior over the test period
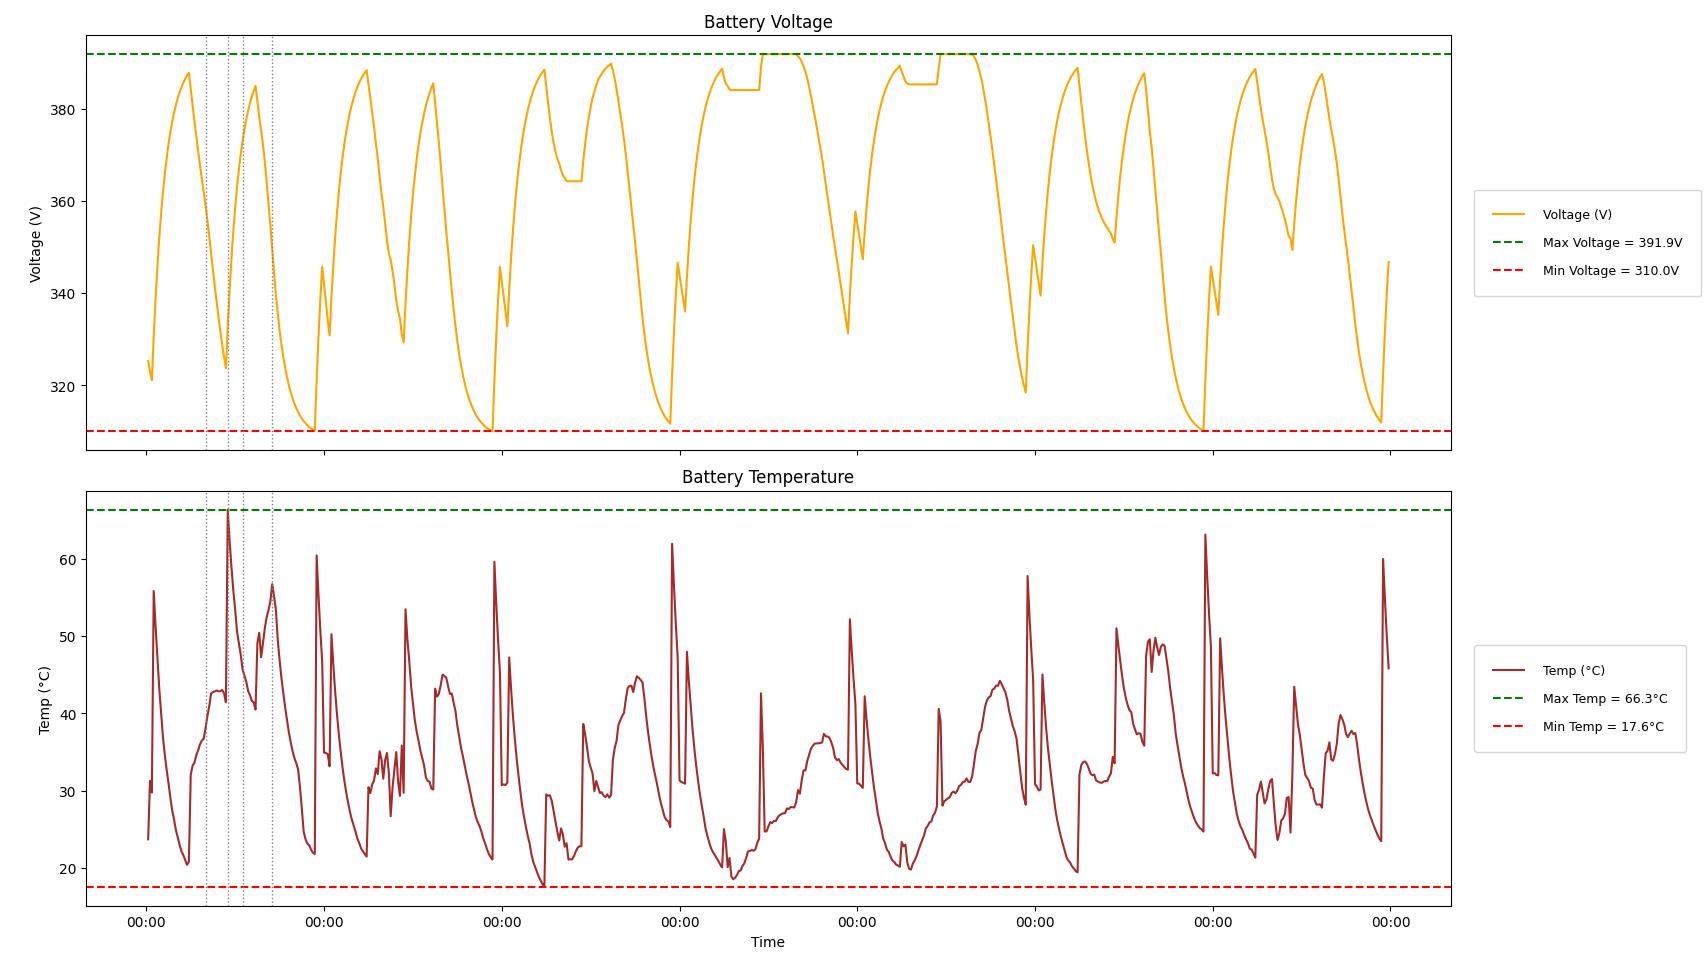
Figure 9. BESS safety metrics: state of charge and temperature monitoring
The top-performing model combinations were evaluated based on both forecasting accuracy and economic performance. Results indicate that the best forecasting model does not always yield the lowest operational cost, highlighting the importance of prediction-control interaction.
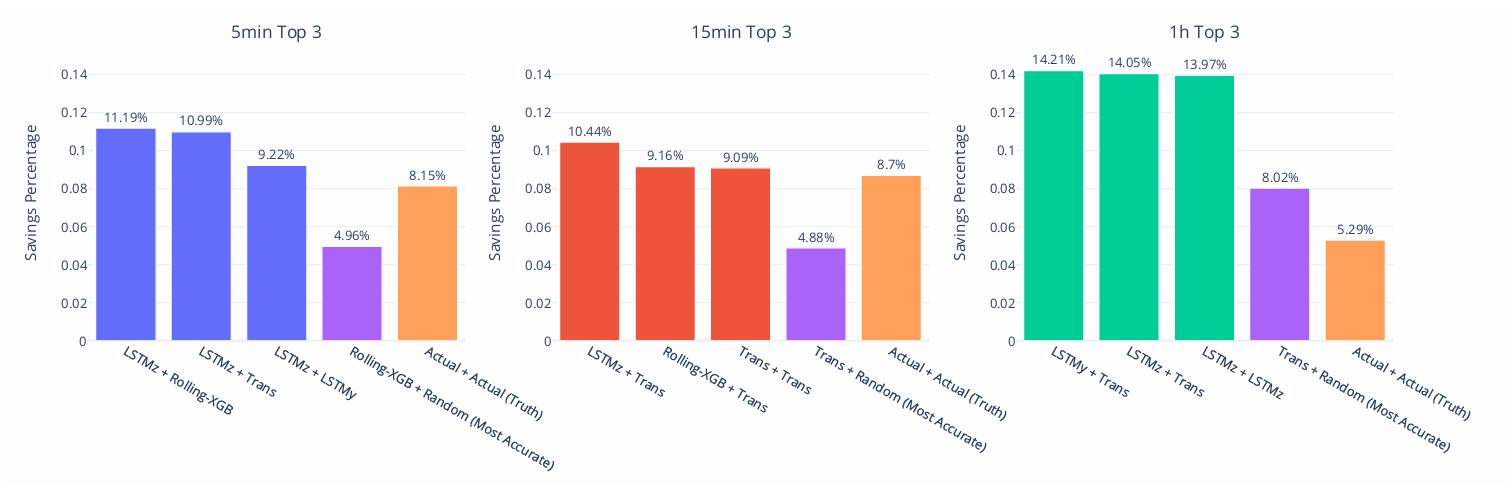
10. Top-performing model combinations for BESS cost optimization
This study developed and evaluated a predictive optimization framework for costeffective PV-BESS operation in a German industrial facility. The framework integrates multi-resolution forecasting models with a rulebased battery control strategy under dynamic electricity pricing. Results demonstrate that BESS operation can reduce energy costs by up to 14%, validating the economic viability of the proposed approach.
A key finding is that forecasting accuracy alone does not guarantee optimal economic performance. The interaction between prediction quality and control strategy is critical, suggesting that future research should focus on co-optimization of forecasting and control components. Limitations include the use of a single case study and simplified
control logic. Future work could incorporate more sophisticated control algorithms such as reinforcement learning, extend the evaluation to different building types and climates, and explore real-time adaptive strategies for improved robustness.
Diouf, B. and Noro, M. (2025). Operational cost reductions through optimized BESS scheduling. Energy and Buildings.
Engel, D. et al. (2025). Multi-resolution energy dataset for industrial building analysis. Applied Energy.
Hossain, M. et al. (2023). PSO-based optimization framework for commercial building BESS operation. Energy Conversion and Management.
Liang, Y. et al. (2024). Energy storage systems for renewable energy integration in buildings. Renewable and Sustainable Energy Reviews.
Motherway, B. et al. (2024). Global energy consumption trends and building sector demand. IEA World Energy Outlook.
Sheha, M., Mohammadi, K. and Powell, K. (2020). The duck curve and its implications for renewable energy integration. Energy Policy.
Syed, I. and Raahemifar, K. (2016). Predictive optimization-based PV-BESS strategy for selfconsumption improvement. Solar Energy.
Sketch-to-simulation workflow
Window shading devices
Computer vision geometry extraction
Parametric modelling
Energy Use Intensity (EUI) evaluation
• Enables rapid, user-friendly sketch-to- simulation for custom window shading devices.
• Imports geometry and orientation directly into Rhino/Grasshopper for parametric 3D modelling.
• Predicts shading performance using simulation from Rhino/ Grasshopper(ladybug- honeybee).
• Reduces manual modelling time and streamlines the design workflow for architects and engineers.
Windows are essential architectural elements that admit valuable daylight and fresh air into buildings. However, they are a primary contributor to heat gain, especially in hot climates. Shading devices such as horizontal overhangs are commonly used to reduce solar exposure and improve occupant comfort. The effectiveness of shading is determined by parameters like window size, facade orientation, and the design of the fins. Traditionally, fin dimensions are chosen using manual calculations based on depth-to-height ratios for horizontal fins or depth-to-width for vertical fins, a process that is time-consuming and often iterative (Krishna & Sridhar, 2026).
A significant barrier to entry for most architects is the need to conduct extensive energy simulation to assess the potential impact of design changes. This project introduces a specific scope focused on shading devices to
create a workflow that is easy and intuitive for any designer. The approach integrates computer vision, parametric modeling, and energy simulation into a unified tool that allows users to capture a photo of a window, sketch a shading device, and immediately receive performance feedback without requiring advanced simulation expertise.
By leveraging the MiDaS depth estimation model and YOLO-8 object detection trained specifically on windows, this tool seeks to automate and estimate Energy Use Intensity (EUI) savings, promoting sustainable and datadriven decision-making for architects and designers (Kumar et al., 2025). The workflow bridges the gap between intuitive design sketching and technical analysis, significantly reducing both the barrier to entry and the time required for performance-based design iteration.
The research develops an AI-Assisted workflow consisting of four integrated phases(Figure 1):
Designers capture a window photo using a smartphone, sketch the shading device on the image in a distinct color (e.g., red), and note the window orientation (N, S, E, W). This keeps early design exploration intuitive and accessible.
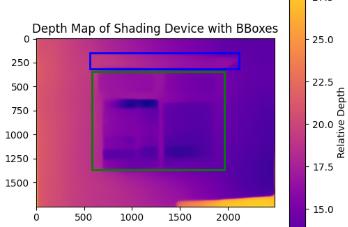
Four automated processes extract dimensional data: (a) Window Detection using YOLO-based models trained on 212 window images to identify boundaries and return bounding boxes; (b) Shading Detection using HSV colour segmentation to isolate the sketched device; (c) Depth Estimation using Intel's MiDaS monocular depth model to generate depth maps and calculate proportional depth ratios; and (d) Proportion Calculation to compute scale-independent ratios for width, height, depth, and positioning offsets.
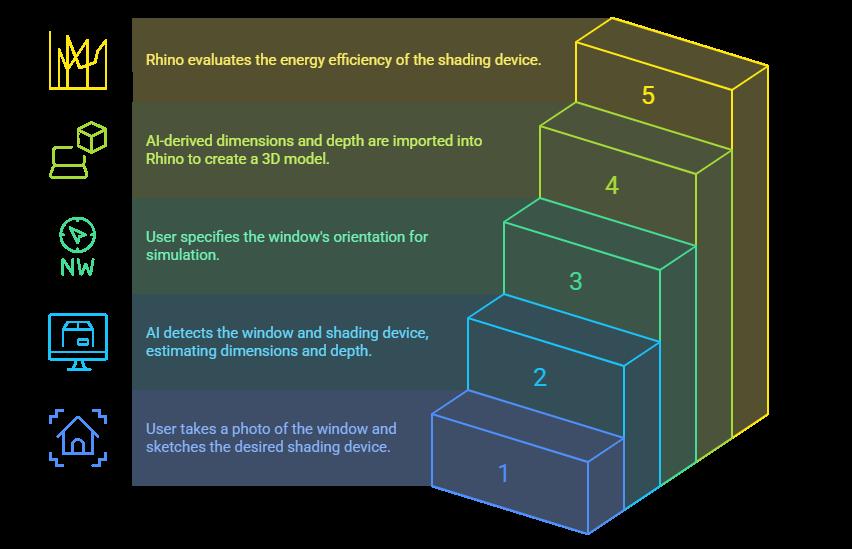
Figure 1: Complete workflow from sketch input through energy simulation analysis.
A parametric script in Grasshopper creates a room model, positions the window according to orientation, and generates shading geometry by scaling the extracted ratios to actual building dimensions.
Ladybug and Honeybee plugins simulate two scenarios: baseline (no shading) and proposed (with shading) using local weather data. The system calculates Energy Use Intensity (EUI) and percent energy savings using the formula: Percent Savings = (EUI_baseline - EUI_shaded) / EUI_baseline × 100%.
The developed tool successfully demonstrates the integration of AI-driven computer vision with parametric design and energy simulation. Key findings include:
1 Automated Window Detection
The YOLO-8 model accurately identifies window boundaries from smartphone photographs, with confidence scores validating detection reliability.
2 Depth Estimation Accuracy:
The MiDaS depth model reliably extracts proportional depth information from single images, enabling accurate scaling of sketched shading devices to real-world dimensions.
3 Parametric Integration
Successfully imported extracted parameters into Grasshopper for automated 3D room and window geometry generation, reducing manual modeling time by an estimated 6080%.
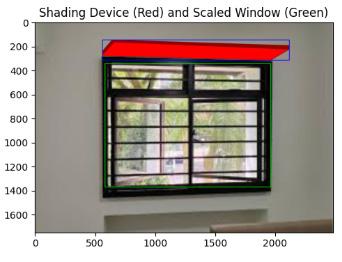
Testing on sample use-cases demonstrates measurable EUI reductions. For typical window orientations, appropriately designed shading devices show energy savings of 15-35% depending on climate zone and window-towall ratio.
The interface includes an interactive dropdown menu for selecting building orientation (North, South, East, West), making the tool accessible to designers without advanced simulation expertise.
The 'Sketch to Shading' tool successfully bridges the traditional gap between intuitive design sketching and rigorous energy performance analysis. By integrating AIdriven computer vision (MiDaS and YOLO8), parametric modeling (Grasshopper), and energy simulation (Ladybug/Honeybee), the workflow enables architects and designers to rapidly evaluate custom window shading devices without extensive simulation expertise. The tool reduces manual modeling time by an estimated 60-80% while maintaining accuracy in depth estimation and performance prediction.
Key strengths include the user-friendly input mechanism, automated geometry extraction, and immediate performance feedback. However, future work should
address limitations such as expanding YOLO-8 training datasets for greater window diversity, validating results against measured building data, and extending the workflow to include vertical louvers and other shading typologies. The potential for cloud-based deployment via Flask enables seamless sharing and real-time interaction for design automation. Overall, this research demonstrates how AI can democratize performance-based design, making sustainable shading optimization accessible to a broader range of design professionals and reducing the barrier to entry for evidence-driven architectural decision-making.
Krishna, A., & Sridhar, S. (2026). Sketch to Shading: AI-driven assessment of window shading device performance. National University of Singapore.
Kumar, R., Wang, Y., & Zhang, Q. (2025). Deep learning for automated window detection and shading optimization in building facades. Journal of Sustainable Building Design, 12(3), 245-262.
Ranftl, R., Lasinger, K., Hafner, D., Schindler, K., & Koltun, V. (2021). Towards robust monocular depth estimation: Mixing datasets for zeroshot cross-dataset transfer. IEEE Transactions on Pattern Analysis and Machine Intelligence, 44(3), 1604-1617.
Ultralytics. (2024). YOLOv8: A new family of realtime object detection models. Retrieved from https://github.com/ultralytics/ultralytics
Crawley, D. B., Lawrie, L. K., Winkelmann, F. C., Buhl, W. F., Huang, Y. J., Pedersen, C. O., et al. (2001). EnergyPlus: Creating a new-generation building energy simulation program. Energy and Buildings, 33(4), 319-331.
Qinhuan Liu, Gaoyuan Wang
# KEYWORDS
Demand response
Surrogate model
Building energy simulation
EnergyPlus
Random Forest regression
# HIGHLIGHTS
• Develops a simulation-to-surrogate workflow to evaluate cooling energy use and demand-response potential for the NUS SDE2 building under temperature setpoint reset strategies
• Generates 54,000 EnergyPlus-based setpoint–time scenarios using representative TMY days, weather inputs, and internal/perimeter zone setpoint combinations to capture cooling-load flexibility.
• Trains an XGBoost surrogate model with high predictive accuracy (R² = 0.97, MAE = 1.94), enabling rapid full-year HVAC energy prediction and identifying outdoor temperature and perimeter-zone setpoints as key drivers of demand response.
The building sector accounts for more than 30% of global final energy consumption and nearly 40% of total carbon emissions (Hu et al., 2022). HVAC systems typically contribute more than half of total building energy use. As renewable energy sources increase, demand response (DR) strategies enable end-users to flexibly adjust energy consumption in response to grid signals (Paterakis et al., 2017). HVAC systems offer significant potential for DR participation due to their large thermal
mass and tolerance of moderate temperature fluctuations. This study evaluates the DR potential of the SDE2 building at the National University of Singapore through surrogate model-based assessment. The framework uses detailed EnergyPlus simulations coupled with machine learning regression to efficiently predict cooling energy consumption under various setpoint scenarios, enabling rapid DR assessment without repeated full-scale simulations.
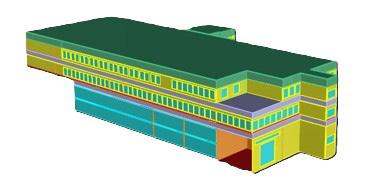
A detailed EnergyPlus model was developed for the SDE2 building, utilizing its existing Rhino geometric model. The simulation parameters were configured according to ASHRAE 90.1-2019 standards. A typical meteorological year was used for baseline cooling energy profiles. The model incorporates various thermal zones for different room types, with careful attention to wall adjacency relationships and inter-floor heat transfer representation (Samad et al., 2016).
A surrogate model was constructed using machine learning regression to capture the nonlinear relationship between setpoint adjustments and cooling energy use. The model was trained on 54,000 setpoint-time scenarios generated from EnergyPlus simulations across 90 days. Multiple algorithms were evaluated, with XGBoost selected for its superior accuracy and stability. Input features include outdoor temperature, humidity, solar radiation, and temperature setpoint adjustments. The model achieved an R² score of 0.97 and MAE of 1.94 on the validation set (Wei et al., 2025).
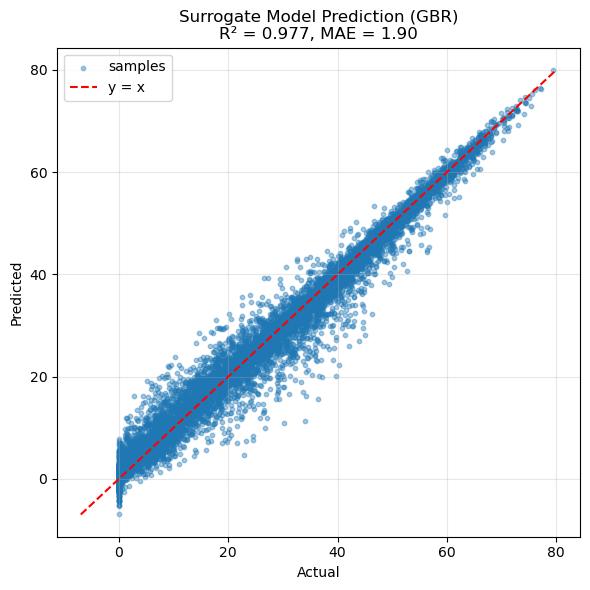
The XGBoost surrogate model demonstrated excellent predictive accuracy with an R² score of 0.97. The scatter plot of predicted versus actual cooling loads shows minimal deviation from the ideal y=x line, confirming the model's ability to capture the complex nonlinear relationships between environmental conditions and energy consumption.
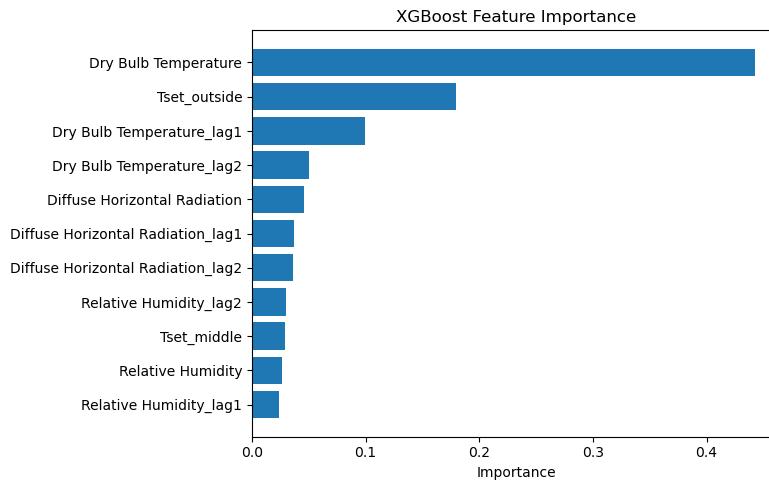
Feature importance analysis reveals that outdoor dry-bulb temperature and perimeter setpoint temperature are the dominant predictors of cooling energy consumption. Lagged temperature features also exhibit high importance, highlighting the significance of thermal inertia in energy prediction.
Cooling load simulations under different setpoint temperatures (24°C and 28°C) demonstrate the significant impact of temperature adjustments on HVAC energy demand. The comparison reveals substantial operational flexibility in the building, with higher setpoints substantially reducing the required cooling load and overall energy consumption.
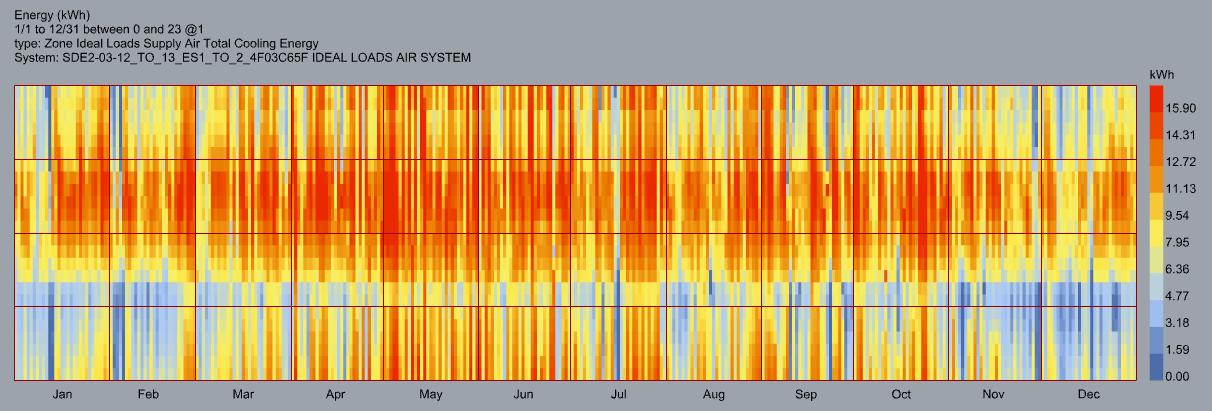
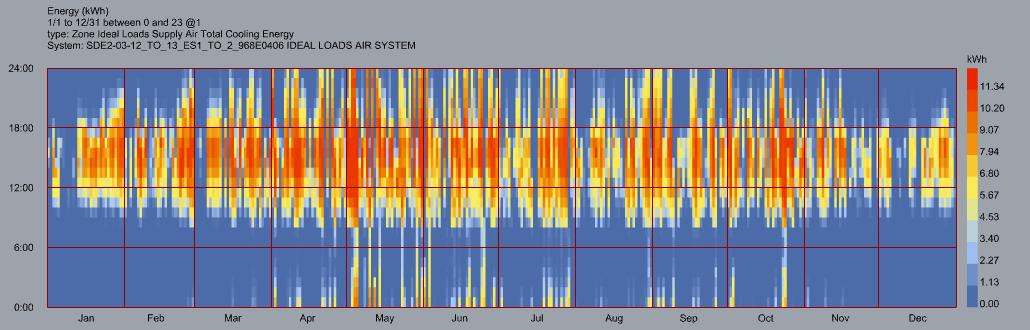
Using the trained surrogate model, annual HVAC energy consumption profiles were generated for complete meteorological year predictions. The results reveal substantial degree of operational flexibility, with different setpoint strategies showing significant variation in annual energy consumption. This demonstrates strong potential for implementing demand response control strategies
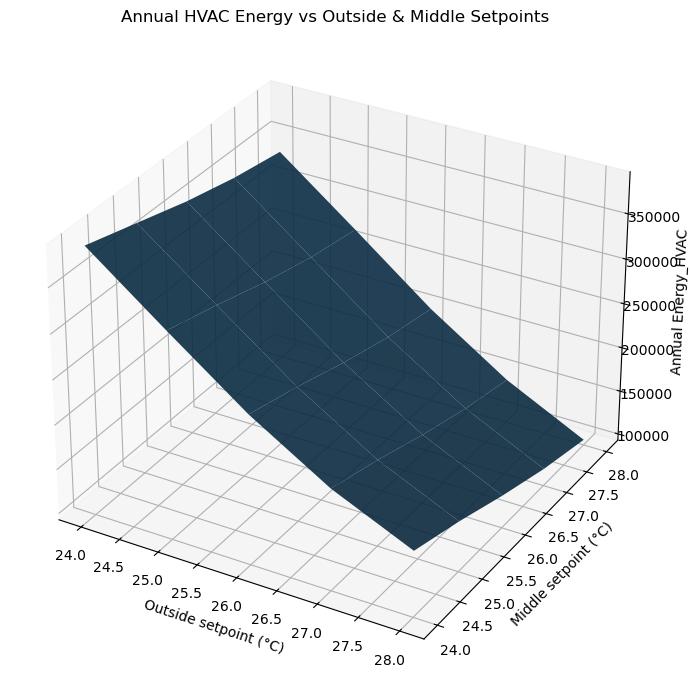
This study presented a surrogate-modelbased framework for efficiently evaluating the energy performance and demand response potential of the NUS SDE2 building. By coupling detailed EnergyPlus simulations with machine-learning regression, the framework successfully captures the nonlinear impacts of setpoint adjustments and weather conditions on cooling energy consumption. The XGBoost surrogate model achieved excellent predictive accuracy (R² = 0.97), enabling rapid DR assessment without computationally intensive full-scale simulations. Results demonstrate that moderate temperature resets can produce meaningful load reductions. The relatively uniform thermal characteristics of SDE2 lead to limited variation in zone-
level flexibility compared to more complex buildings. This approach provides a fast and reliable alternative to conventional simulation methods and establishes a foundation for scalable demand response analysis across building portfolios. Future work should extend this methodology to larger and more complex buildings where greater heterogeneity may unlock higher zone-targeted flexibility potential (Hu et al., 2023).
D'Agostino, D., Mazzella, S., Minelli, F., & Minichiello, F. (2022). Obtaining the NZEB target by using photovoltaic systems on the roof for multi-storey buildings. Energy and Buildings, 267, 112147.
Huang, S., Katipamula, S., & Lutes, R. (2021). Experimental investigation on thermal inertia characterization of commercial buildings for demand response. Energy and Buildings, 252, 111384.
Hu, M., Rajagopal, R., & de Chalendar, J. A. (2023). Empirical exploration of zone-by-zone energy flexibility: A non-intrusive load disaggregation approach for commercial buildings. Energy and Buildings, 296, 113339.
Hu, S., Zhang, Y., Yang, Z., et al. (2022). Challenges and opportunities for carbon neutrality in China's building sector—Modelling and data. Building Simulation, 15: 1899–1921.
Li, B., Liu, Z., Wu, Y., Wang, P., Liu, R., & Zhang, L. (2023). Review on photovoltaic with battery energy storage system for power supply to buildings: Challenges and opportunities. Journal of Energy Storage, 61, 106763.
Luz, T., & Moura, P. (2019). 100% Renewable energy planning with complementarity and flexibility based on a multi-objective assessment. Applied Energy, 255: 113819.
Luo, N., Langevin, J., Chandra-Putra, H., et al. (2022). Quantifying the effect of multiple load flexibility strategies on commercial building electricity demand and services via surrogate modeling. Applied Energy, 309: 118372.
Luo, Z., Peng, J., Hu, M., et al. (2023). Multiobjective optimal dispatch of household flexible loads based on their real-life operating characteristics and energy-related occupant behavior. Building Simulation, 16: 2005–2025.
Paterakis, N. G., Erdinç, O., & Catalão, J. P. S. (2017). An overview of demand response: Key-elements and international experience. Renewable and Sustainable Energy Reviews, 69: 871–891.
Samad, T., Koch, E., & Stluka, P. (2016). Automated demand response for smart buildings and
microgrids: The state of the practice and research challenges. Proceedings of the IEEE, 104: 726–744.
Stanelyte, D., Radziukyniene, N., & Radziukynas, V. (2022). Overview of demand-response services: A review. Energies, 15(5), 1659.
Tang, R., Fan, C., Zeng, F., et al. (2022). Datadriven model predictive control for power demand management and fast demand response of commercial buildings using support vector regression. Building Simulation, 15: 317–331.
Theocharides, S., Makrides, G., Livera, A., Theristis, M., Kaimakis, P., & Georghiou, G. E. (2020). Dayahead photovoltaic power production forecasting methodology based on machine learning and statistical post-processing. Applied Energy, 268, 115023.
Urrutia, L. Z., Pascual, J. F., Iribarren, E. P., Garay, R. S., & Pino, I. G. (2025). Model predictive control with self-learning capability for automated demand response in buildings. Applied Thermal Engineering, 258, 124558.
Wang, D., Zheng, W., Wang, Z., et al. (2024). Quantifying the potential of load flexibility for building HVAC system using model predictive control strategy. Energy and Buildings, 323: 114819.
Wei, Z., Tang, Z., Chen, S., Zhang, Y., Wang, Z., Geng, Y., & Lin, B. (2025). Scalable evaluation of demand response potential of HVAC systems: Establishing comprehensive room-centric model library and surrogate models. Building Simulation, 1-16.
Zhu, J., Niu, J., Tian, Z., et al. (2022). Rapid quantification of demand response potential of building HVAC system via data-driven model. Applied Energy, 325: 119796.
Zhu, J., Tian, Z., Niu, J., Lu, Y., Zhou, H., & Li, Y. (2025). Direct Load Control Strategy of Centralized Chiller Plants for Emergency Demand Response: A Field Experiment. Buildings, 15(3), 462.
Liren Wang, Chenxi Lei, Huanxiang Gao
Workplace window views
Visual features
Restorative perception
Semantic segmentation
Random Forest
# HIGHLIGHTS
• Standardized, desk-level photographs of workplace window views enable comparable, quantitative analysis of visual content across scenes.
• A combined workflow – semantic segmentation plus PSO-optimized random forest – links pixel-level view composition to satisfaction, perceived health impact, and restorative perception.
• Results indicate strong alignment among the three indicators, with natural elements (sky, trees, plants) contributing positively and built elements (walls, doors, floors) often contributing negatively, informing evidence-based view and façade design.
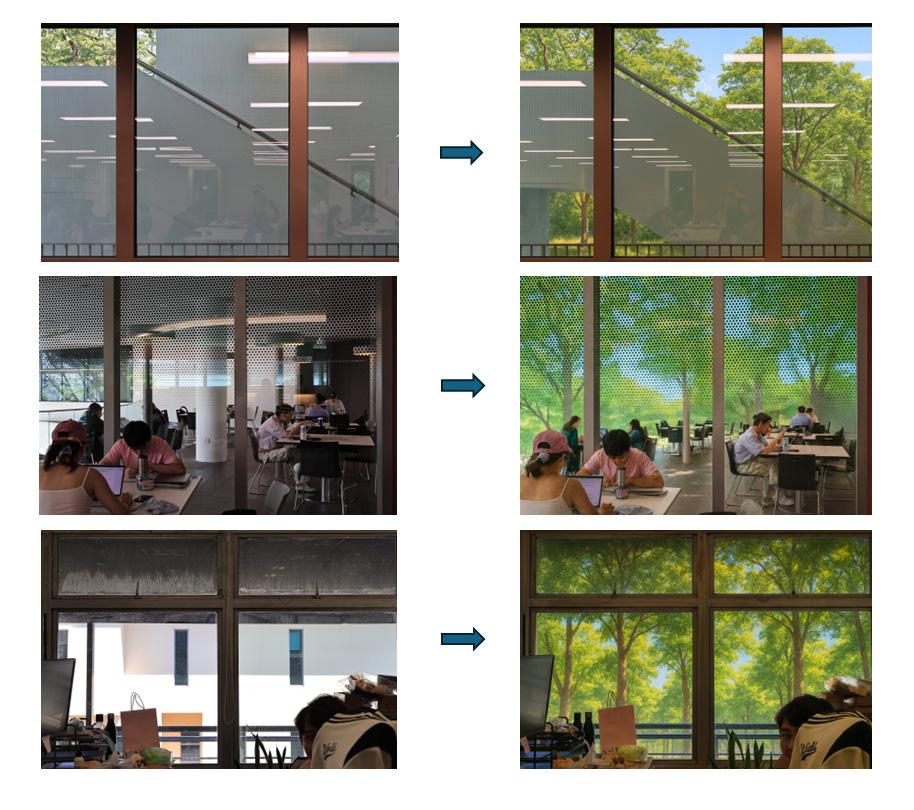
The visual environment of the workspace significantly influences occupants' comfort, satisfaction, and performance (Zhang et al., 2023). Windows provide a critical visual connection to the outdoors. For people who spend much of their time indoors, this visual connection has been shown to benefit physical and mental health, enhance cognitive function, and reduce stress (Ko et al., 2020). Window view content can be described from multiple dimensions, including the Natural Feature Ratio, Artificial Feature Ratio, Observer Landscape Distance, and Visible Volume (Kent & Schiavon, 2020).
Two key research gaps remain. First, existing studies rarely use window-view images collected under standardized conditions. Differences in camera height, viewpoint, framing, lighting, and capture timing lead to inconsistent visual content, making it difficult to extract comparable features or generalize findings to real workplace settings. Second, the evaluation indicators used across studies— such as satisfaction, perceived restorativeness, productivity, and well-being—are highly
fragmented. Prior work seldom examines how these indicators relate to one another or how specific visual features jointly influence them. This lack of an integrated analytical framework constrains understanding of how window-view variables shape multiple aspects of workplace experience.
To address these gaps, the present study adopts a standardized, image-based approach to examine how workplace window views shape psychological responses. Participants evaluated each image along three dimensions—Satisfaction, Health Impact, and Perceived Restoration—providing a multidimensional assessment of windowview experience. These ratings were paired with quantified visual indices extracted through image processing, enabling combined statistical analysis and predictive modelling. The findings aim to establish a coherent analytical foundation for understanding window-view experience and support evidence-based guidelines for healthier and more visually supportive workplaces.
A total of 60 high-resolution window-view photographs were collected from seated desk perspectives under controlled conditions—consistent viewpoint, visual content, and camera height (1.25 m, simulating a typical seated eye level). All images were captured on the same day between 14:00 and 16:00. using a Canon R50 camera equipped with an 18–45 mm lens. The photographs depict the range of window views observable within office environments at the National University of Singapore (NUS). Each image was taken while facing the window directly, from a distance that allowed the entire window frame to be included within the frame (Kent & Schiavon, 2020; Lindemann-Matthies et al., 2021).
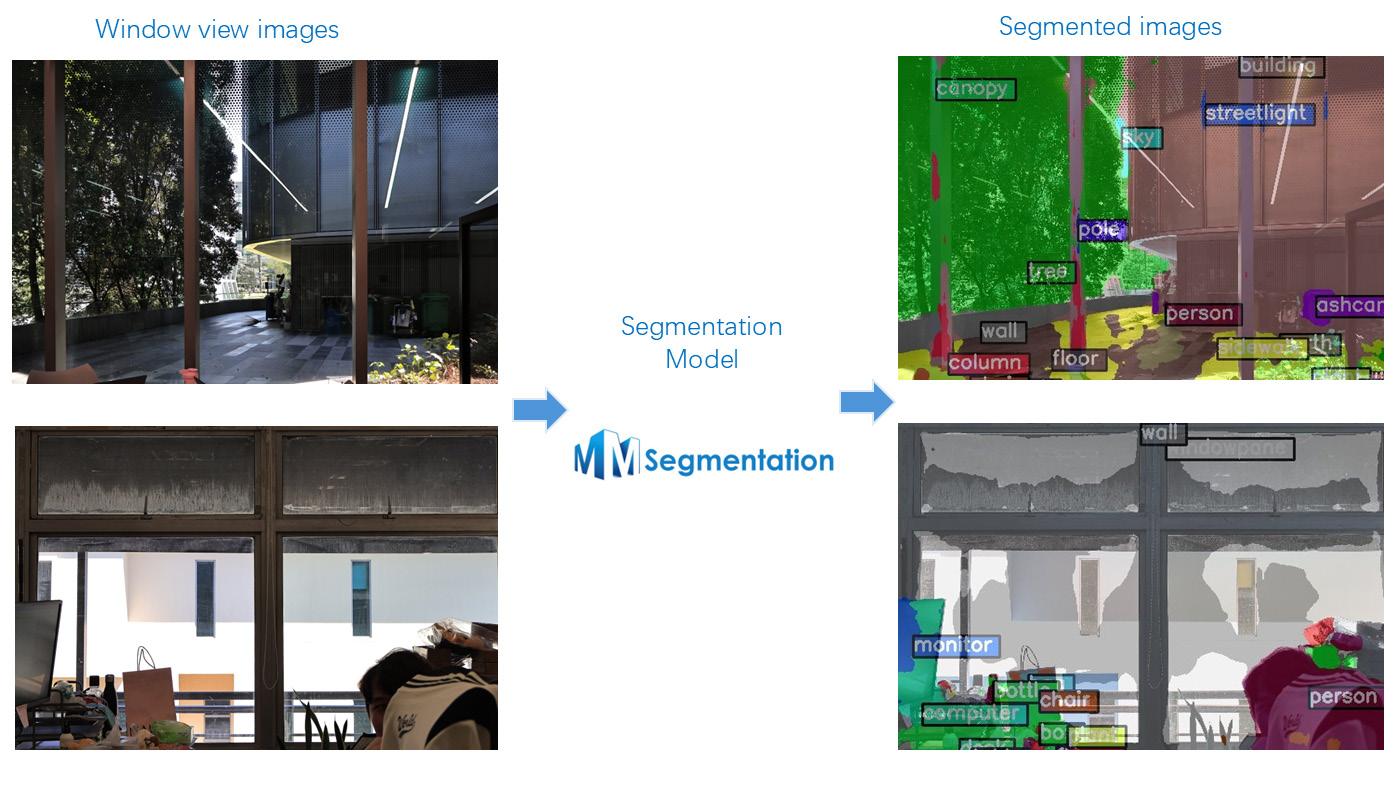
After categorizing the 60 window-view images into five primary types—buildings, stairwells, people, trees, and distant views—21 representative images were selected for evaluation, excluding redundant or highly similar photographs. Each category retained approximately 3–5 images chosen for their clearly distinguishable and characteristic visual features. The 21 images were then imported into the MMSegmentation library for semantic segmentation and object recognition, allowing us to quantify the pixel proportion of each object within the images and construct feature vectors that characterize their visual content (Contributors, 2020; Ingabo & Chan, 2025). The SegFormer-based framework performed best for window-view scenarios. Semantic segmentation provided various algorithms suitable for different application scenarios; after evaluating all models offered by the library, the SegFormer-based framework was found to perform best for window-view scenarios.
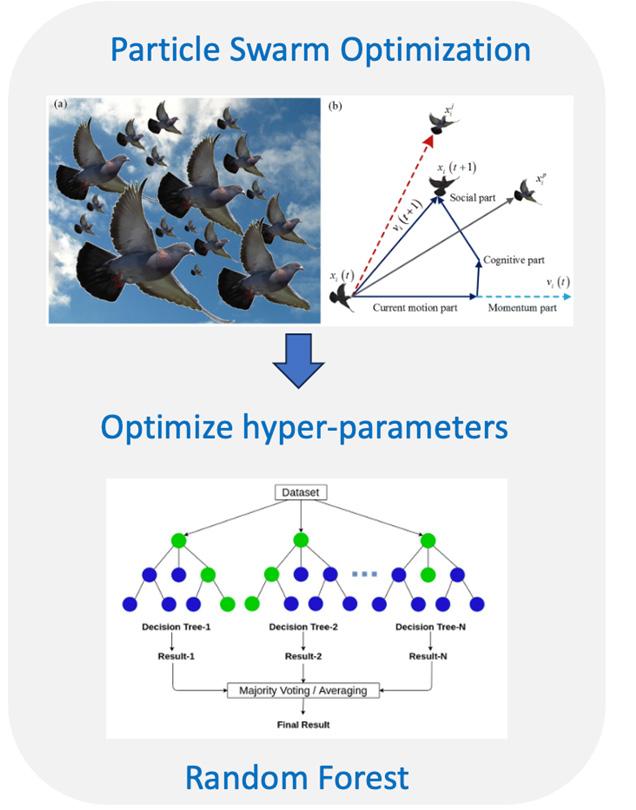
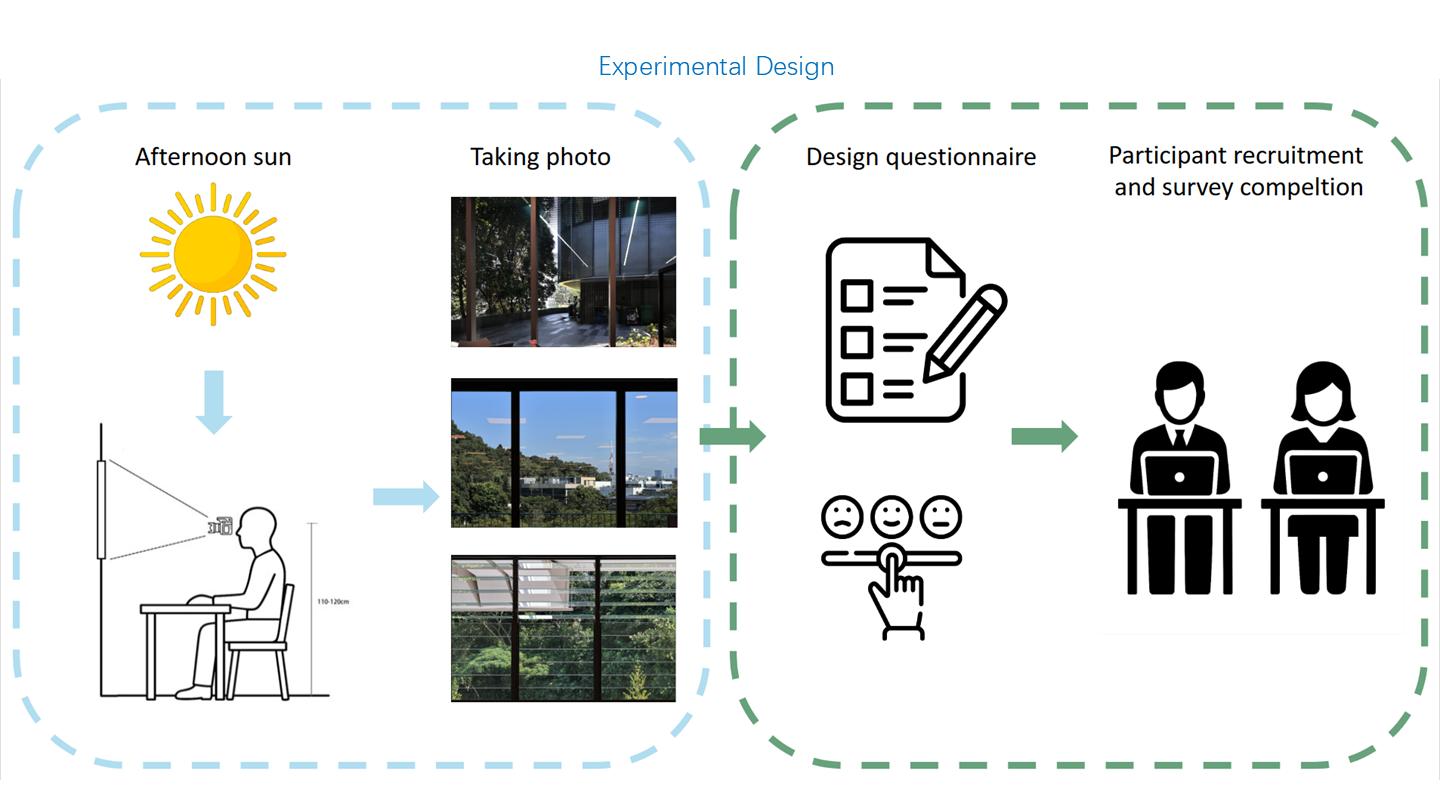
A total of 20 participants were recruited, comprising 10 males and 10 females, primarily consisting of PhD students or office employees and students who spend more than five hours per day in office environments. All participants were in good physical health, non-smokers, non-drinkers, and free from visual impairments such as color blindness or eye diseases. During the experiment, participants were asked to imagine each image as the view from a window in their workplace. Responses to all items were rated on a seven-point Likert scale, where 1 = strongly disagree / not at all and 7 = strongly agree / very much.
Cronbach's α coefficients were calculated to evaluate the internal consistency of the measurement constructs. Across the 21 images, the Health dimension showed α values ranging from 0.81 to 0.98, while the Restoration dimension showed α values between 0.91 and 0.99. When pooling items across all images, overall reliability remained extremely high (Health α > 0.95; Restoration α > 0.97). These results confirm that responses within each construct were highly consistent, supporting the robustness of the questionnaire and the validity of subsequent analyses.
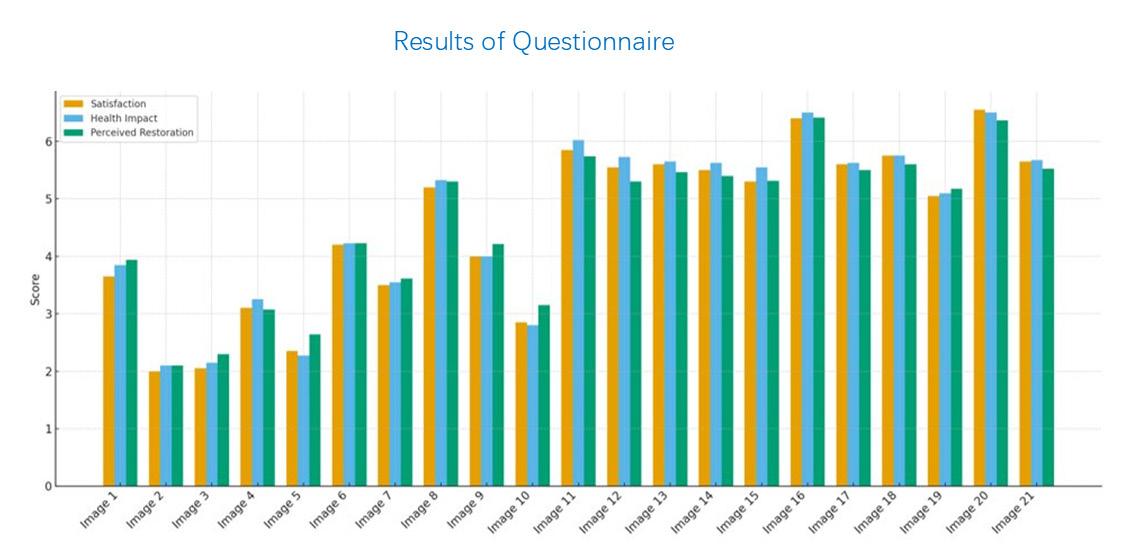
Averaged across all images, the evaluations of Satisfaction, Health Impact, and Restoration showed highly similar overall levels, with mean scores of 4.68, 4.71, and 4.73, respectively. Despite these comparable averages, the score ranges were wide, extending more than four points on the seven-point scale. Satisfaction scores ranged from 2.0 to 6.55, Health from 2.1 to 6.5, and Restoration from 2.1 to 6.41, indicating substantial differentiation in the perceived psychological benefits of the window views. The distribution of scores suggested three broad performance levels: a small subset of images fell at the lower end, with all three dimensions scoring only around 2.0–2.6, well below the overall average; a larger group of images received generally positive evaluations, with scores typically ranging from 3.0 to 5.8 across dimensions; and only a very small number of images reached the extreme high end, achieving mean values above 6.3 on Satisfaction and Restoration and approximately 6.5 on Health, representing exceptionally strong perceived benefits relative to the dataset.
To further assess the relationship among the three psychological dimensions, correlations were computed using the image-level mean scores across the 21 window views. The results showed consistently strong positive associations among Satisfaction, Health, and Restoration. Pearson correlation coefficients were 0.998 between Satisfaction and Health, 0.997 between Satisfaction and Restoration, and 0.994 between Health and Restoration, indicating that the three dimensions varied in a highly synchronized manner across images. These strong inter-dimensional correlations suggest that images receiving higher mean scores on one dimension generally received higher scores on the other two. Likewise, images that scored lower on one dimension tended to score lower across all three. No image displayed a clearly divergent profile across the dimensions, indicating that the three measures are closely aligned and exhibit minimal differentiation in their scoring patterns.
Based on the trained Particle Swarm Optimization–Random Forest (PSO-RF) models, feature-importance evaluation of the Random Forest was applied to quantify the contribution of each feature on different response categories. The results indicate that the key factors affecting the three categories of participants' responses are largely consistent. Among them, the proportion of wall in the scene is the most influential feature across all
response categories, while other elements— such as door, sky, floor, and trees/plants—also play substantial roles in shaping participants' perceptions. Overall, most man-made elements in the window view tend to have a negative impact on multiple types of perceived comfort, whereas natural landscape features generally contribute positively to these perceptions.
This study shows that three commonly used indicators for evaluating window-view experience—Satisfaction, Health Impact, and Perceived Restoration—are closely aligned when assessed through standardized workplace window-view images. The results also demonstrate that a consistent set of visual features, identified through semantic segmentation, contributes to participants' evaluations across all indicators. These findings provide a clearer basis for understanding how occupants perceive window views and highlight the value of standardized imagebased methods for environmental evaluation. For practice, the results suggest that workplace design strategies that increase exposure to natural elements and reduce obstructive built features are likely to support more positive satisfaction, health, and restoration experiences.
Several limitations should be acknowledged. Static photographs cannot represent temporal
dynamics such as changes in weather, movement, or sunlight, all of which may influence real-world perception. The sample consists mainly of young adults in a university context, which may limit generalizability. Additionally, while the segmentation model identifies numerous object categories, not all visual information—such as texture, contrast, or spatial coherence—can be captured through object proportions alone. These factors suggest caution when extrapolating the findings beyond the current dataset. Future work should validate these findings using a controlled set of AI-generated or modified images that systematically vary key visual components, conducting a second evaluation experiment with such stimuli to confirm the robustness of the identified visual predictors and improve the predictive accuracy of window-view models, supporting their application in workplace design and planning.
Bellazzi, A. (2022). Virtual reality for assessing visual quality and lighting perception: A systematic review. Building and Environment.
Chamilothori, K., Chinazzo, G., Rodrigues, J., DanGlauser, E. S., Wienold, J., & Andersen, M. (2019). Subjective and physiological responses to façade and sunlight pattern geometry in virtual reality. Building and Environment, 150, 144–155.
Contributors, Mms. (2020). MMSegmentation: Openmmllab semantic segmentation toolbox and benchmark.
Gao, H., Liu, J., Lin, P., Hu, G., Patruno, L., Xiao, Y., Tse, K., & Kwok, K. (2023). An optimal sensor placement scheme for wind flow and pressure field monitoring. Building and Environment, 244, 110803.
Han, K.-T. (2003). A reliable and valid self-rating measure of the restorative quality of natural environments. Landscape and Urban Planning, 64(4), 209–232.
Hartig, T., & Staats, H. (2006). The need for psychological restoration as a determinant of environmental preferences. Journal of Environmental Psychology, 26(3), 215–226.
Higuera-Trujillo, J. L., Maldonado, J. L.T., & Millán, C. L. (2017). Psychological and physiological human responses to simulated and real environments: A comparison between Photographs, 360° Panoramas, and Virtual Reality. Applied Ergonomics, 65, 398–409.
Ingabo, S. N., & Chan, Y.-C. (2025). Contextual evaluation of the impact of dynamic urban window view content on view satisfaction. Building and Environment, 267, 112303.
Kent, M., & Schiavon, S. (2020). Evaluation of the effect of landscape distance seen in window views on visual satisfaction. Building and Environment.
Ko, W. H., Schiavon, S., Zhang, H., Graham, L. t, Brager, G., Mauss, I., & Lin, Y.-W. (2020). The impact of a view from a window on thermal comfort, emotion, and cognitive performance. Building and Environment.
Li, M., Xue, F., Wu, Y., & Yeh, A. G. (2022). A room
with a view: Automatic assessment of window views for high-rise high-density areas using City Information Models and deep transfer learning. Landscape and Urban Planning.
Lindemann-Matthies, P., Benkowitz, D., & Hellinger, F. (2021). Associations between the naturalness of window and interior classroom views, subjective well-being of primary school children and their performance in an attention and concentration test. Landscape and Urban Planning, 214, 104146.
Masoudinejad, S., & Hartig, T. (2020). Window View to the Sky as a Restorative Resource for Residents in Densely Populated Cities. Environment and Behavior, 52(4), 401–436.
Vasquez, N. G., Rupp, R. F., Andersen, R., & Toftum, J. (2022). Occupants' responses to window views, daylighting and lighting in buildings: A critical review. Building and Environment.
Wang, N., & Boubekri, M. (2010). Investigation of declared seating preference and measured cognitive performance in a sunlit room. Journal of Environmental Psychology, 30(2), 226–238.
Zhang, X., Du, J., & Chow, D. (2023). Association between perceived indoor environmental characteristics and occupants' mental well-being, cognitive performance, productivity, satisfaction in workplaces: A systematic review. Building and Environment.
Junyue Xu, Zhongbin Li, Fanxiang Qu
# KEYWORDS
Machine Learning
Building Lighting Simulation
# HIGHLIGHTS
• Develops a machine-learning-based daylighting design tool that predicts three climate-based daylight metrics (DA, UDI, ASE) for a typical Singapore room, enabling near real-time feedback during earlystage window design.
• Builds a parametric Grasshopper–Honeybee (Radiance) workflow to generate a sensor-level dataset across key window variables (e.g., WWR, head/sill height, orientation, glazing VLT, obstruction depth) and exports structured features/targets for surrogate training.
• Trains and compares Random Forest vs MLP surrogates, selects RF for better accuracy and usability, and adds standards checking + reverse optimization to flag non-compliance and propose improved parameter combinations
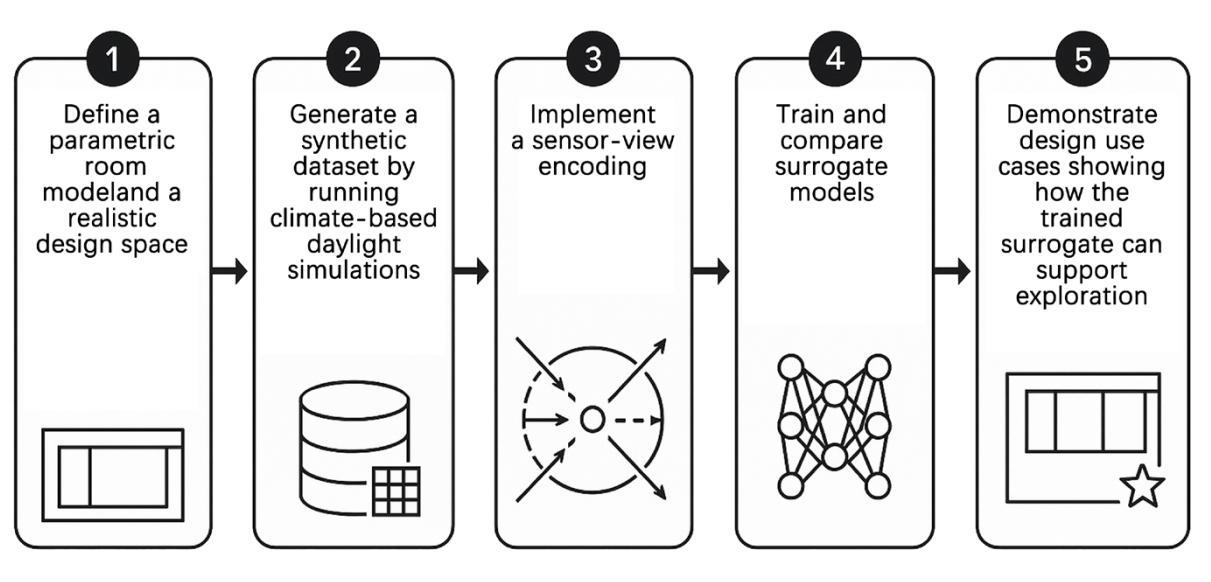
Natural lighting is a key factor influencing building energy consumption, visual comfort, and the learning and living experience of occupants. In Singapore's tropical climate, it is closely tied to solar radiation, particularly in deeper room layouts. Climatebased daylighting metrics (CBDMs) such as Daylight Autonomy (DA), Useful Daylight Illuminance (UDI), and Annual Sunlight Exposure (ASE) are now widely used in standards to assess daylight performance (Nourkojouri et al., 2021). However, annual daylight simulations across many design options are computationally expensive, which limits their applicability in early-stage design or large parametric studies. In this context, surrogate models based on machine learning offer a promising way to approximate simulation results much more rapidly, enabling near real-time design feedback and a broader exploration of the design space.
Most existing daylighting surrogate models use very simple, project-specific parameters. This study develops a compact yet practical surrogate model for a typical Singaporean room that simultaneously predicts multiple climate-based daylight metrics (DA, UDI, ASE) and is lightweight enough to provide real-time feedback on alternative window and shading options during early design (Li et al., 2023).
The overarching objective is to develop and rigorously evaluate a sensor-based deeplearning surrogate model that rapidly predicts multiple annual climate-based daylight metrics in a typical Singapore room. By coupling sensor data, annual simulations and data-driven modelling within a single framework, the research aims to deliver near realtime, performance-based feedback for designers and to establish a methodological basis for using AI to support more sustainable, human-centred and high-performing learning and working environments.
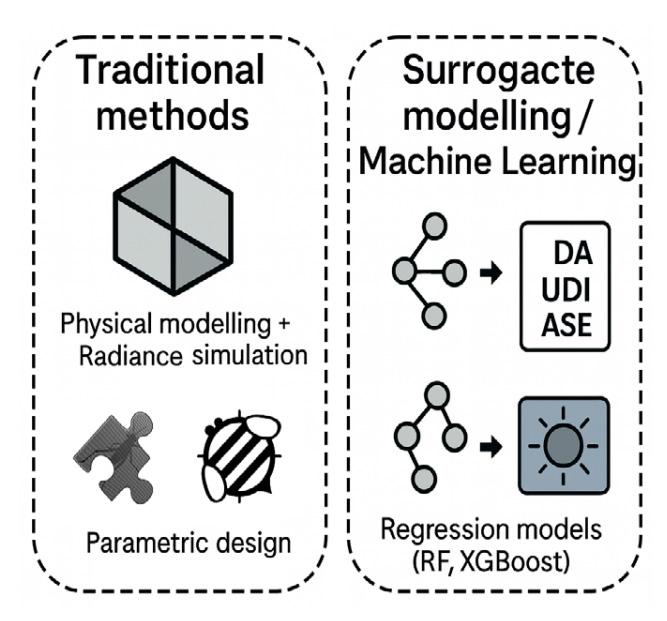
DA (Daylight Autonomy): The fraction of annual occupied hours during which daylight illuminance at a given point in the space is at or above 300 lux.
UDI (Useful Daylight Illuminance): The proportion of time during which illuminance within a space falls within the range of [100 lux – 2000 lux].
ASE (Annual Sunlight Exposure): The number of hours per year during which a space receives direct light exceeding 1000 lux.
A shoebox classroom model was constructed in Grasshopper with key geometric parameters explicitly exposed as inputs. The workflow generates climate-based daylighting simulations for each design instance using Radiance. Variable design parameters include window-to-wall ratio (0.2–0.7), window head height (2.2–3.0 m), sill height (0.8–1.2 m), orientation (0–360°), glazing VLT (0.35–0.70), and external obstruction depth (0–1.5 m), reflecting typical Singaporean school designs (Xu et al., 2025).
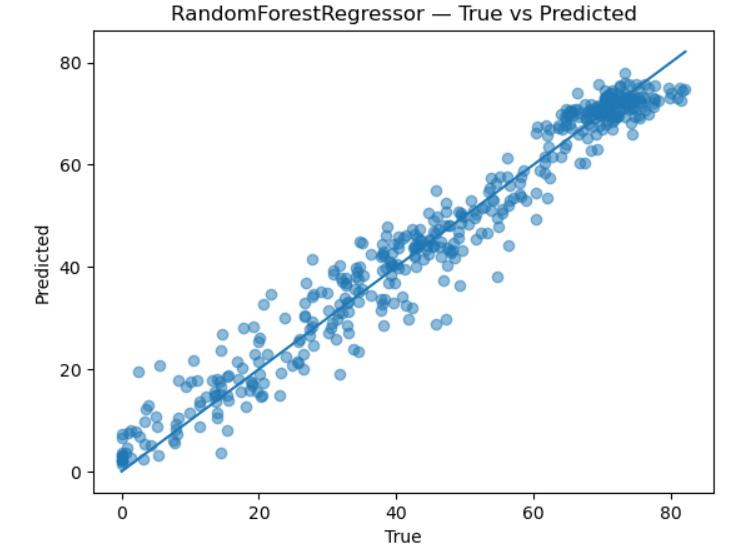
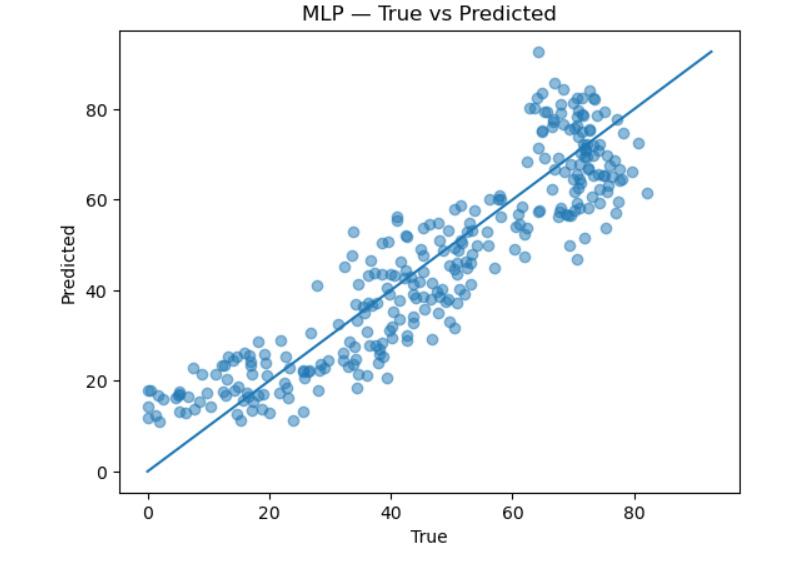
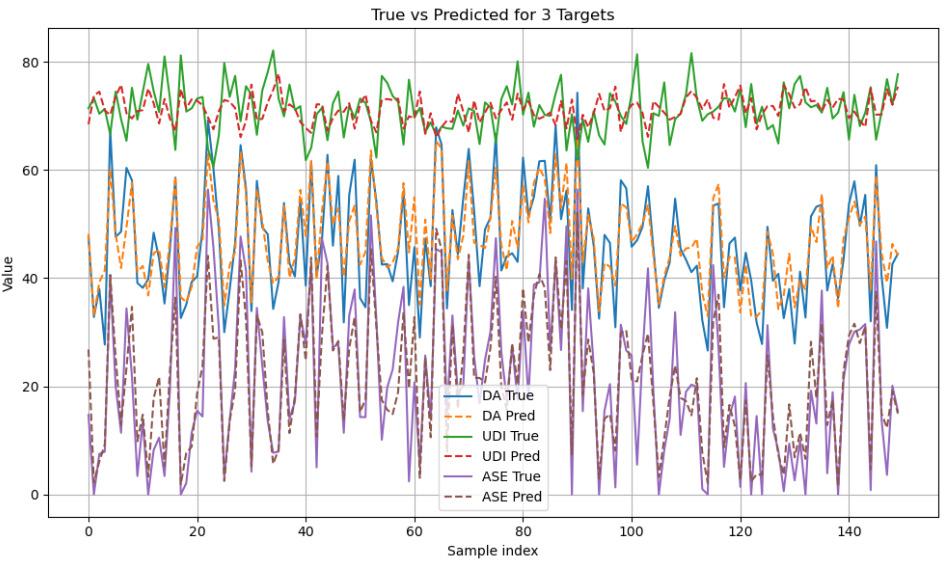
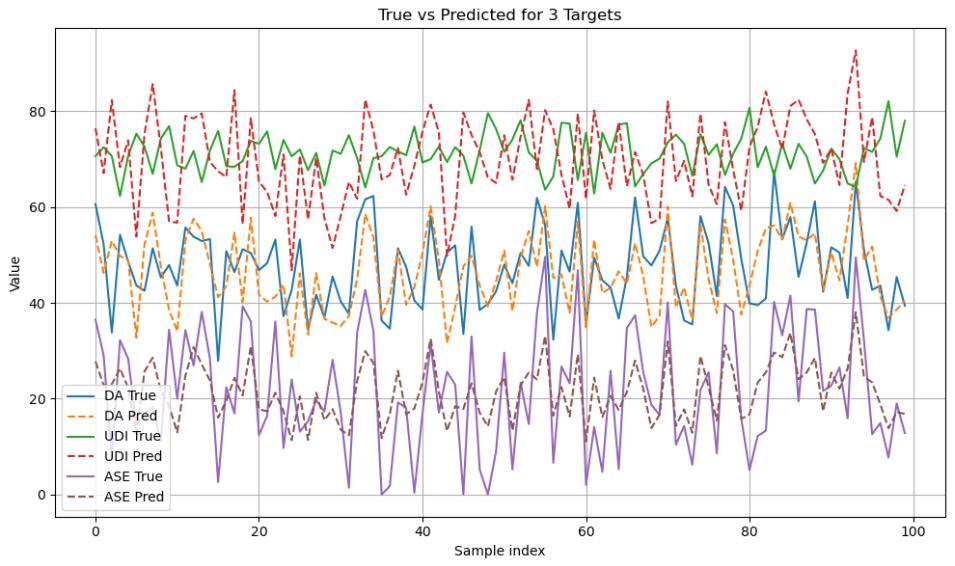
Two machine learning models were trained: a Random Forest (RF) regressor and a Multi-Layer Perceptron (MLP) neural network. The RF model demonstrated superior overall prediction accuracy and was selected for the final tool because MLP training has high data quality requirements and is less user-friendly (Xu et al., 2025).
This research demonstrates that machine learning-driven surrogate models effectively predict daylighting performance indicators (DA, UDI, ASE) in early-stage architectural design. The Random Forest model achieves robust prediction accuracy while maintaining computational efficiency, enabling architects to receive near real-time performance feedback on window and shading design options. The workflow demonstrates three important methodological advantages: complete reproducibility through explicit parametric control in Grasshopper, scalability and automation for rapid dataset generation, and the ability to identify problematic design configurations and suggest modifications based on standards and requirements.
Key findings from simulation analysis include: window-to-wall ratio remains the primary determinant of daylighting availability; window
head height strongly influences daylighting penetration depth; and orientation affects both the quantity and temporal distribution of daylight.
Limitations include focus on a single building typology with fixed internal materials and limited shading types, simplified urban context and indirect-light conditions, and relatively small training datasets specific to tropical climate conditions. Future improvements should extend to more complex geometries and multiple room types, introduce dynamic shading and interior reflectance variations, test model robustness on out-of-domain cases, and develop a user-friendly interface for easier data input.
Li, S., et al. (2023). "Simple mathematical models to link climate-based daylighting metrics (CBDMs)." PMC Publications of National Center for Biotechnology Information.
Nourkojouri, H., Zomorodian, Z.S., Tahsildoost, M., & Shahaghian, Z. (2021). "A machine-learning framework for daylight and visual comfort assessment in early design stages." arXiv preprint arXiv:2109.06450.
"Application of Simulation-Based Metrics to Improve the Daylighting Performance in Buildings." LIDSEN, AEER journal (2024).
Kazanasmaz, T., et al. (2016). "Three approaches to optimize optical properties and size of fenestration windows using daylighting metrics." Solar Energy.
PM2.5 short-term forecasting
Time-series lag features
Meteorological covariates
Random Forest regression
• Construct short-term air quality prediction models based on five years of hourly PM2.5 and other meteorological data from the Beijing Olympic Sports Center Air Quality Monitoring Station.
• Implemented a progressive modeling framework - from simple persistence and rolling-average baselines to linear, polynomial, and tree-based regression models.
• Evaluated the model performances.
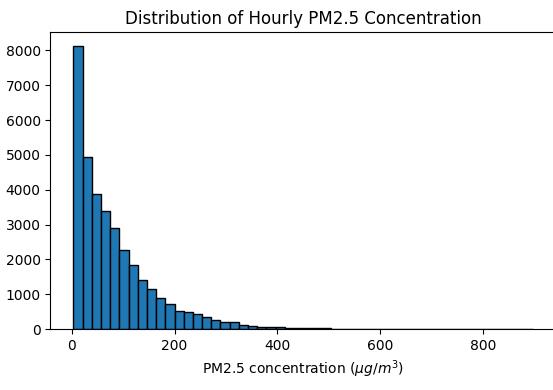
Air pollution has always been a critical issue affecting public health and urban sustainable development. In large cities like Beijing, seasonal and short-term pollution events frequently occur, posing significant challenges to residents' lives and urban management. Among all air pollutants, fine particulate matter (PM2.5) is a crucial indicator with tiny particle size that can penetrate the human respiratory barrier, associated with risks of respiratory, cardiovascular, and lung cancer diseases. PM2.5 can also damage urban ecosystems, corrode buildings, and increase the burden
of environmental governance. Therefore, the ability to predict PM2.5 concentrations in the short term (e.g., one hour in advance) is crucial for public travel, the selection of protective measures, and urban emergency response decisions. This project develops a machine learning-based PM2.5 short-term prediction model using PM2.5 concentration data from the past 24 hours and meteorological factors, predicting PM2.5 levels for the next hour and exploring the feasibility of implementing short-term air quality predictions in real-world environmental monitoring.
The project implements a progressive modeling framework starting from simple persistence and rolling-average baselines to linear, polynomial, and tree-based regression models. Input features include PM2.5 values lagged 1-24 hours, rolling means over 6/12/24hour windows, concurrent meteorological
variables (temperature, pressure, dew point, rainfall, wind speed, wind direction), and timeencoded features (hour and month of year as sine and cosine functions). The prediction target is PM2.5 concentration at time t+1, with data split into 80% training and 20% test sets.
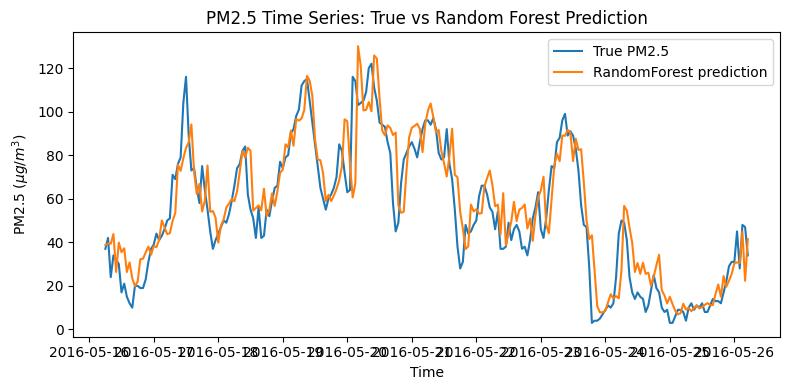
The random forest regressor emerges as the best-performing model, achieving the lowest RMSE (27.97 μg/m³) and MAE (15.79 μg/m³) with an R² of 0.889. This significantly outperforms the persistence baseline (RMSE 30.89 μg/m³, R² 0.865) by approximately 2 μg/m³. Linear models show modest improvements over
persistence, with ordinary linear regression and regularized variants achieving RMSE around 28.5 μg/m³ and R² of 0.88, demonstrating that a simple linear relationship between recent PM2.5 values, weather conditions, and time-ofday already explains much of the predictable variation.
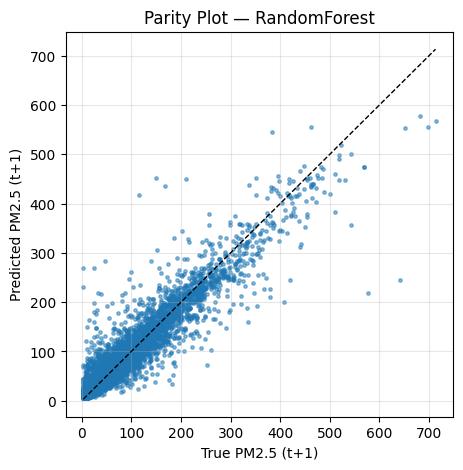
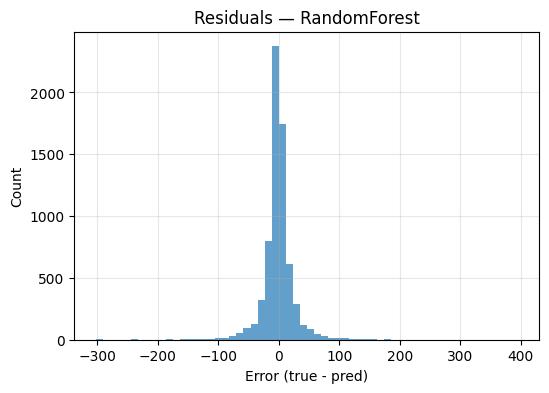
The parity plot reveals that the random forest model clusters low-to-medium concentration predictions tightly around the 45-degree line, indicating excellent agreement with observations in normal conditions. However, extreme high-concentration episodes are slightly underestimated, a common challenge
in environmental forecasting. The residual histogram is centered near zero but exhibits heavier tails, suggesting occasional large errors during extreme pollution events.
The random forest feature importance analysis identifies PM2.5 at lag-1 as the dominant predictor, with wind speed (WSPM) as the second most important meteorological variable. This confirms that short-term PM2.5 dynamics are highly persistent and that weather conditions provide useful but secondary information for one-hour-ahead predictions.
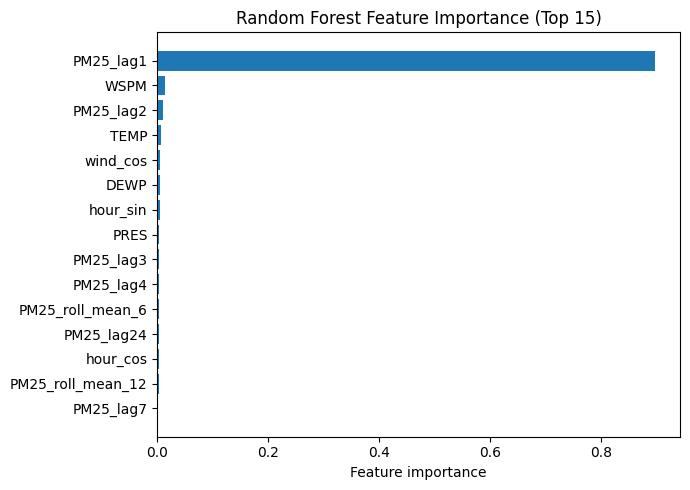
This project demonstrates that one-hour-ahead PM2.5 forecasting is highly auto-correlated and relatively stable. The persistence model itself achieves RMSE around 30.9 μg/m³ and R² about 0.87, confirming strong short-term persistence. Linear and regularized polynomial regression improve error metrics slightly, showing that a simple linear relationship between recent PM2.5 values, weather conditions, and timeof-day explains much of the predictable variation. Random Forest emerges as the best performer, reaching RMSE close to 28.0 μg/ m³ and R² around 0.89. Despite this success, all models tend to underestimate very high pollution peaks, indicating that extreme events are difficult to capture using only basic meteorological variables and short timeseries lags. From a practical perspective, this study suggests that even without deep learning architectures or sophisticated time-
Chen, S. (2015). Beijing PM2.5 [Dataset]. UCI Machine Learning Repository. https://doi. org/10.24432/C5JS49
Karmoude, M., Munhungewarwa, B., Chiraira, I., Mckenzie, R., Kong, J., Smith, B., Ayana, G., Njara, N., Mathaha, T., Kumar, M., & Mellado, B. (2025). Machine learning for air quality prediction and data analysis: Review on recent advancements, challenges, and outlooks. Science of The Total Environment, 1002, 180593. https://doi. org/10.1016/j.scitotenv.2025.180593
Wu, X., Zhu, J., & Wen, Q. (2024). Shortterm prediction of PM2.5 concentration by hybrid neural network based on sequence decomposition. PloS one, 19(5), e0299603. https:// doi.org/10.1371/journal.pone.0299603
series models, a lightweight machine-learning pipeline can already provide useful one-hour PM2.5 forecasts. The approach is transparent, easy to implement in Python, and serves as a solid starting point or baseline for more advanced research.
Ma Haitong, Cheng Zhiyue, Tian Purui
# KEYWORDS
Building simulation
Educational building
Random Forest
Multi-Objective Optimization
MOTPE algorithm
# HIGHLIGHTS
• Proposes a surrogate-based multi-objective optimization framework for Singapore educational buildings to balance energy use (EUI), daylight performance (UDI), and thermal comfort (TDT) in early-stage design.
• Builds a large, diverse simulation dataset by applying Latin Hypercube Sampling across 9 school building models and 10 design parameters, producing 1,350 scenarios for training and optimization.
• Trains a Random Forest surrogate (Test R² = 0.76) and couples it with MOTPE to generate a Pareto front, then uses an Ideal Point Method to select a balanced “ideal” solution and reveal parameter importance.

The construction industry accounts for a significant share of global energy consumption and carbon dioxide emissions. Educational buildings, as a major category of public buildings, contribute substantially to this demand due to their long operational hours and high occupant density. In tropical climates such as Singapore, these buildings present unique challenges in balancing thermal comfort, lighting quality, and energy efficiency. The key performance goals of building design—energy consumption, daylighting, and thermal comfort—are influenced by multiple factors including building geometry, envelope properties, and indoor settings. However, these performance metrics often conflict with each other, making simultaneous optimization a complex challenge.
Existing simulation-based multi-objective optimization methods are computationally intensive and lack flexibility. To address this, the present study proposes a surrogatebased optimization framework for educational buildings in Singapore, using Latin Hypercube Sampling (LHS) to generate diverse building parameter sets. Simulation results are used to train a Random Forest surrogate model, enabling efficient multi-objective optimization via the MOTPE algorithm. An Ideal Point Method is applied to identify the most balanced solution from the Pareto front, as illustrated by the case building models shown in Figure 1.
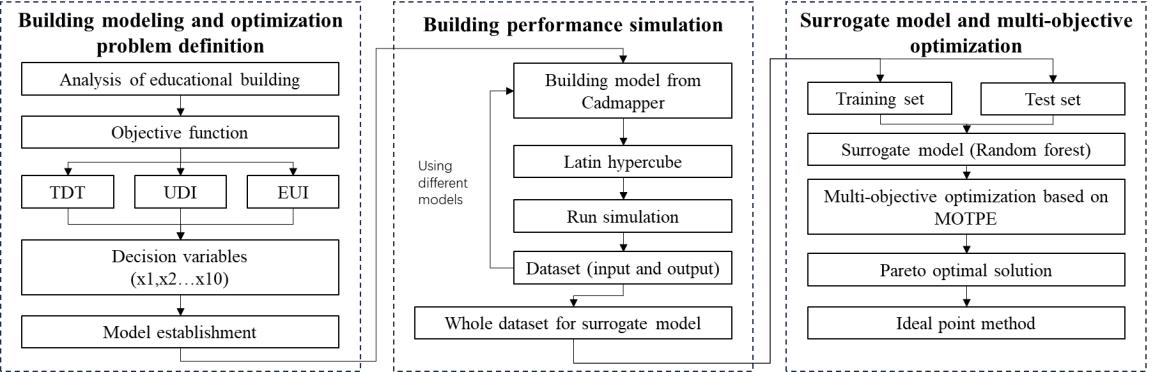
Nine primary and secondary school buildings in Singapore were selected as case studies. Ten key design parameters were defined, covering wall-related variables (window-to-wall ratios for four orientations), shading-related variables (depth and angle), and device-related variables (glazing type, U-value, HVAC COP, cooling setpoint). Three optimization objectives were established: Energy Use Intensity (EUI), Useful Daylight Illuminance deviation (UDI low+up), and Thermal Discomfort Time (TDT), as shown in Figure 2.
The building performance simulation workflow was developed using the Ladybug and Honeybee plugins in Grasshopper, covering thermal comfort, energy consumption, and lighting comfort. LHS was used to generate 150 design parameter combinations for each of the nine models, resulting in 1,350 simulation runs. The final dataset comprises 12 input variables and 3 output indicators.
A Random Forest surrogate model was trained on 80% of the dataset, with the remaining 20% as the test set. Hyperparameter tuning via grid search yielded final parameters of max_depth=9 and n_estimators=90, achieving a Training R² of 0.90 and Test R² of 0.76. The surrogate model was then coupled with the MOTPE algorithm (1,500 maximum iterations) to derive Pareto-optimal solutions. The Ideal Point Method was applied to select the most balanced design configuration.
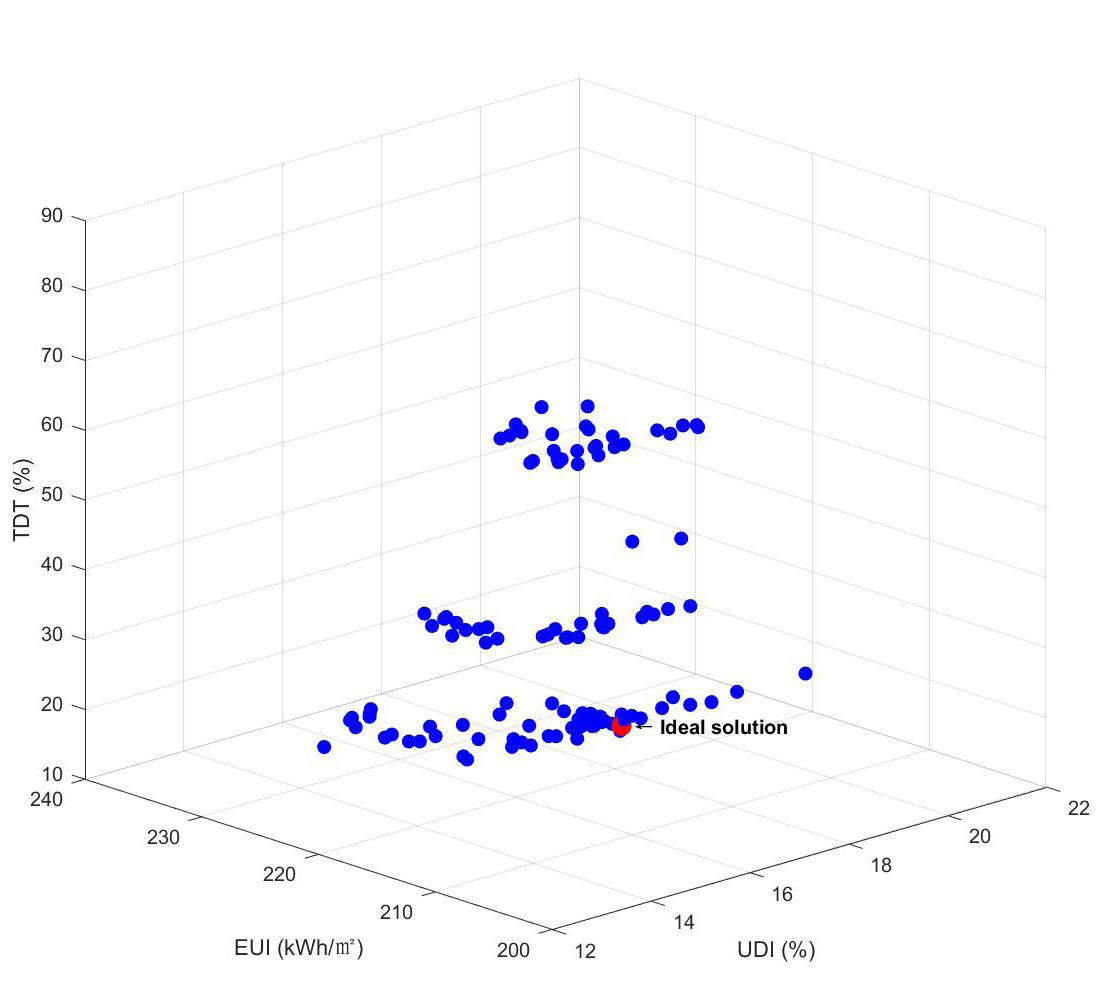
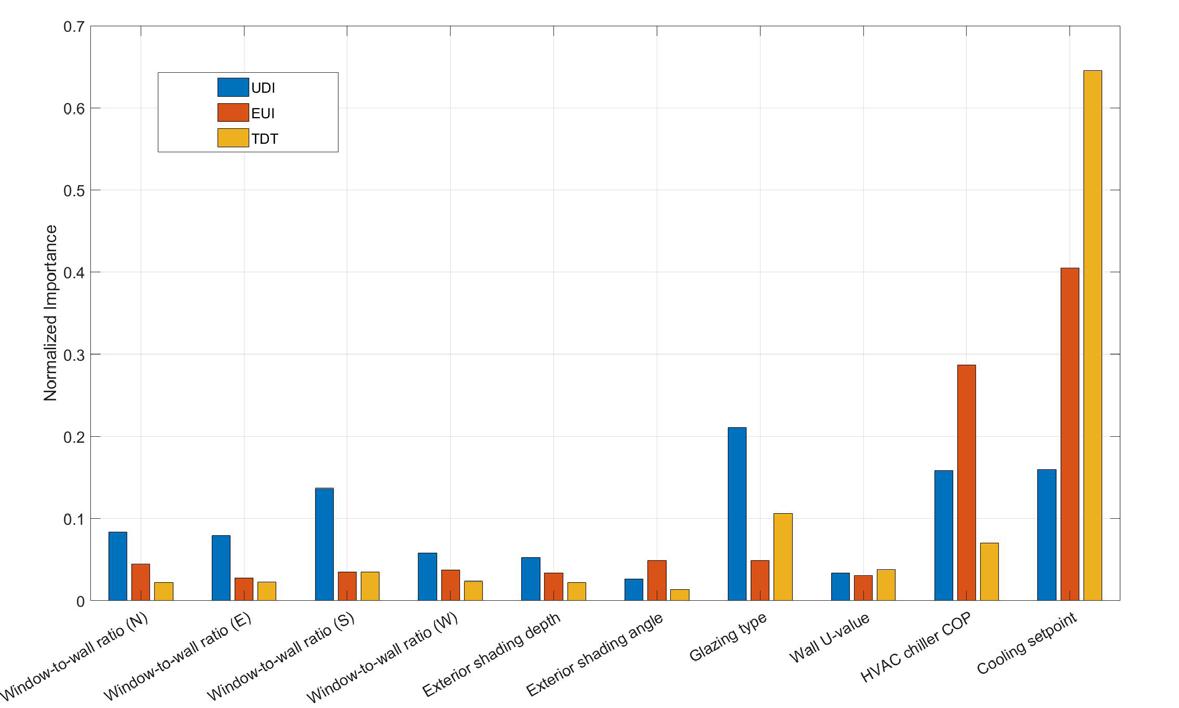
MOTPE optimization produced a Pareto optimal frontier demonstrating the tradeoff relationships among EUI, TDT, and UDI. Each point on the frontier represents a nondominated solution where improvement in one objective leads to compromise in at least one other. The Ideal Point Method identified a unique ideal solution achieving the best balance across all three objectives, as shown in Figure 3.
Parameter importance analysis revealed that cooling setpoint and HVAC Chiller COP dominate EUI and TDT performance, while glazing type shows a significant impact on daylight performance (UDI). Window-to-wall ratio on the west orientation also exhibited notable influence. These insights provide clear guidance for prioritizing design decisions during building performance optimization, as shown in Figure 4.
This study presents a surrogate-based multiobjective optimization framework to support the early-stage design of educational buildings in Singapore. By employing Latin Hypercube Sampling, a diverse and representative set of building parameter combinations was generated through nine typical school models, forming a dataset of 1,350 samples. Random Forest was used to construct a surrogate model that accurately captures the relationships between design variables and optimization objectives. This surrogate model was integrated with the MOTPE algorithm to efficiently explore multi-objective optimization between energy use intensity, daylight satisfaction, and thermal discomfort time.
The optimization process produced a Pareto front, and the Ideal Point Method identified an ideal solution demonstrating the framework’s
effectiveness in balancing performance goals while reducing simulation cost. The ideal solution features lower window-to-wall ratios on the north and west facades, moderate shading, low-E glazing, high insulation, and optimized HVAC settings.
Future work will focus on enhancing model fidelity by refining building zoning strategies, simulating complete building systems instead of simplified volumes, and using a larger set of building models to improve the accuracy of the surrogate. This framework provides a valuable tool for the early design phase of school buildings in tropical climates.
Sundaram K, Preethaa K R S, Natarajan Y, et al. Advancing building energy efficiency: A deep learning approach to early-stage prediction of residential electric consumption. Energy Reports, 2024, 12: 1281–1292.
Nasrollahzadeh N. Comprehensive building envelope optimization: Improving energy, daylight, and thermal comfort performance of the dwelling unit. Journal of Building Engineering, 2021, 44: 103418.
Wu C, Pan H, Luo Z, et al. Multi-objective optimization of residential building energy consumption, daylighting, and thermal comfort based on BO-XGBoost-NSGA-II. Building and Environment, 2024, 254: 111386.
Xu Y, Yan C, Pan Y, et al. A three-stage optimization method for the classroom envelope in primary and secondary schools in China. Journal of Building Engineering, 2022, 52: 104487.
Wang R, Lu S, Feng W. A three-stage optimization
methodology for envelope design of passive house considering energy demand, thermal comfort and cost. Energy, 2020, 192: 116723.
# KEYWORDS
Surrogate Model
Energy Simulation
Daylighting
Thermal Comfort
AI in Buildings
# HIGHLIGHTS
• Develops an AI-supported surrogate-modeling workflow for earlystage sustainable residential design in Shenzhen (hot-humid climate) by linking parametric modelling with EnergyPlus and Radiance simulations.
• Generates 500 randomized design samples by varying WWR, wall U-value, cooling setpoint, and heating setpoint, and trains Random Forest and SVR surrogates to predict EUI, UDI, and a combined comfort index.
• Achieves high predictive performance with Random Forest (R² = 0.89 for EUI, 0.90 for UDI, 0.93 for comfort), identifies dominant drivers via sensitivity analysis, and selects balanced design options through multiobjective scoring.
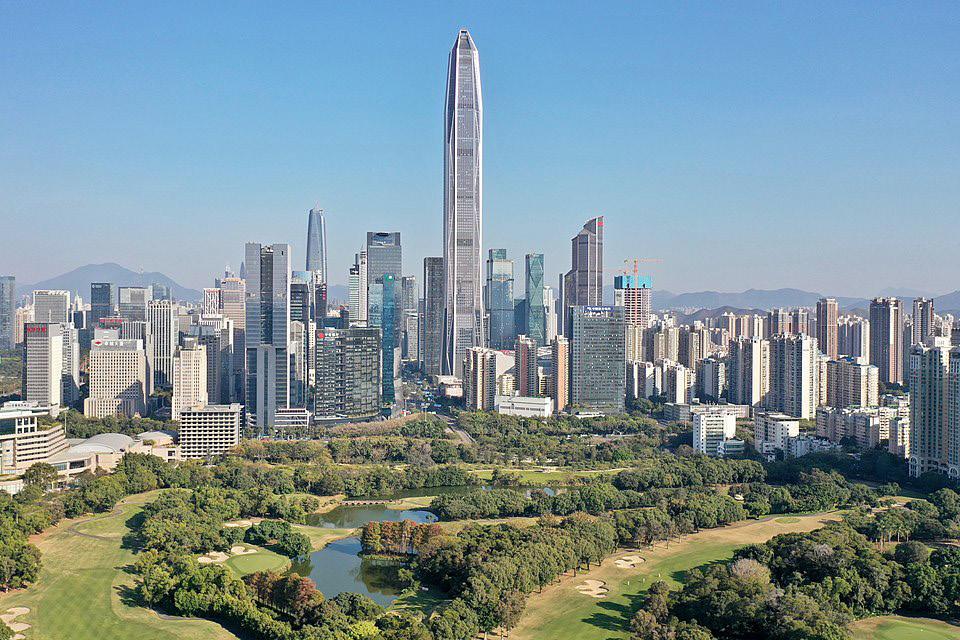
As global climate change intensifies, improving energy efficiency and indoor environmental quality (IEQ) in buildings has become a critical topic in sustainable development (Bourdeau et al., 2019). Shenzhen, located in a hothumid subtropical region, faces extremely high cooling loads in residential buildings. Traditional simulation-based design workflows, although accurate, are time-consuming and computationally demanding, especially during early design stages where thousands of iterations may be required.
Artificial intelligence, particularly surrogate modeling techniques, provides a powerful alternative. By learning the nonlinear relationships between design parameters and performance metrics, surrogate models can deliver near-real-time predictions, enabling
rapid design exploration and informed decision-making (Ali et al., 2023). This study evaluates the feasibility and accuracy of AIsupported surrogate models for predicting three key performance metrics—Energy Use Intensity (EUI), Useful Daylight Illuminance (UDI), and a combined thermal–daylight comfort index—in a typical Shenzhen residential setting. The study integrates parametric modeling in Rhino-Grasshopper, EnergyPlus and Radiance simulations, and Random Forest (RF) and Support Vector Regression (SVR) surrogate models to develop a practical workflow for performance-driven building design.
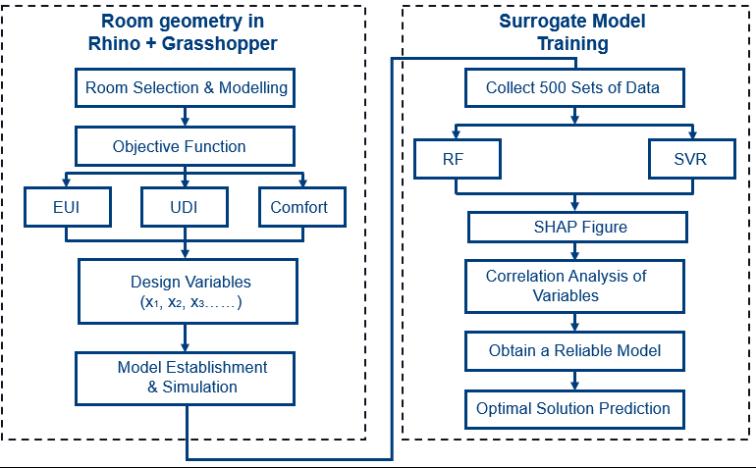
A geometric model based on a real residential building in Shenzhen was created in Rhino and connected to Grasshopper for parametric simulation. Four key design variables were defined: Window-to-Wall Ratio (WWR, 0.2–0.8), U-value (0.5–2.5 W/m²K), cooling setpoint (24–26°C), and heating setpoint (14–18°C).
Using parametric variations, 500 simulation samples were generated. EnergyPlus produced EUI and temperature-related comfort metrics, while Radiance evaluated UDI (Nabil & Mardaljevic, 2005). A combined comfort index was calculated as C = 0.6C_temp + 0.4C_day, integrating thermal and daylight comfort with weighted scores.
Two supervised learning algorithms were trained on the dataset with an 80/20 train-test split: Random Forest (RF) as the primary model and Support Vector Regression (SVR) as a comparison baseline (Hussien et al., 2023). SHAP analysis was applied for sensitivity interpretation. A multi-objective optimization scoring criterion was defined to balance EUI and comfort for identifying the optimal design solution (Yılmaz & Yılmaz, 2021). The overall workflow is shown in Figure 2.
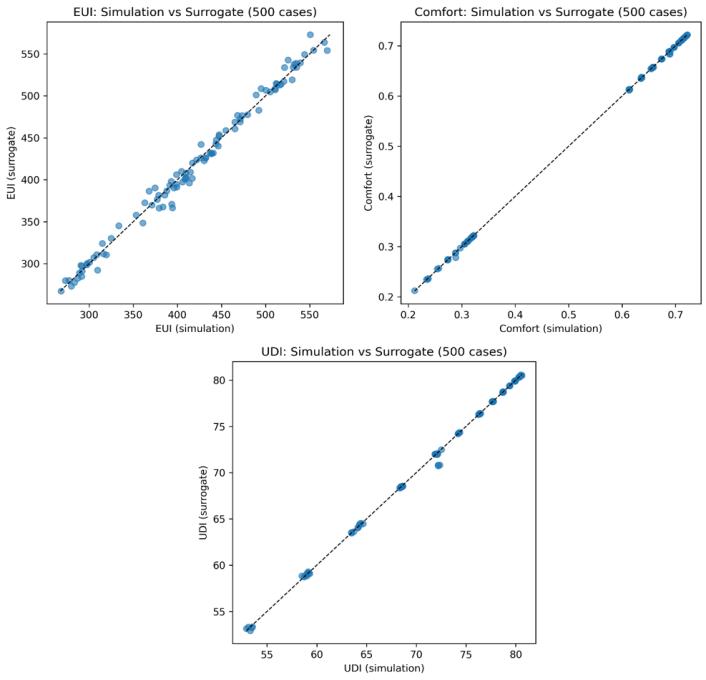
The Random Forest surrogate model achieved high predictive accuracy across all three performance metrics, with R² values of 0.89 (EUI), 0.90 (UDI), and 0.93 (comfort). The scatter plots in Figure 2 compare surrogate model predictions against original simulation outputs. Most data points are distributed closely
around the 45° reference line, indicating high fidelity and minimal systematic deviation. The comfort index exhibits the strongest correlation, reflecting the model’s effectiveness in capturing combined thermal–daylight behavior.
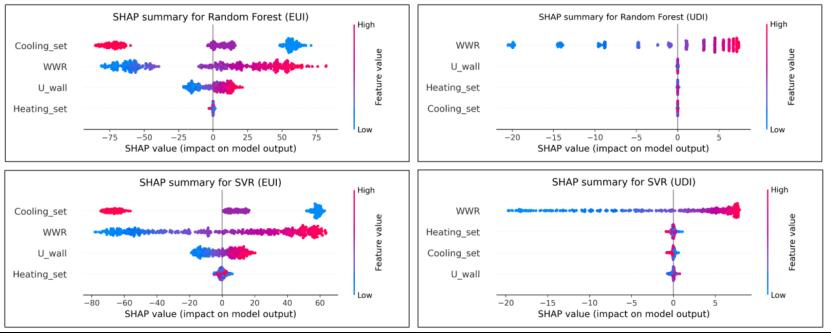
SHAP-based sensitivity analysis was conducted for both RF and SVR models, as shown in Figure 3. Cooling setpoint was identified as the dominant influencer of EUI, with higher values significantly reducing energy consumption. WWR emerged as the most influential factor for UDI, with larger window areas increasing daylight availability. U-value showed moderate effects across metrics, while heating setpoint had minimal impact—consistent with Shenzhen’s hot-humid climate where cooling demand dominates (Aydın et al., 2015).
A multi-objective optimization approach was applied using the scoring formula Score = EUI_norm − α × Comfort (α = 0.7). The optimal design solution achieved a balanced configuration: WWR of 0.28, U-value of 0.98 W/m²K, cooling setpoint of 26°C, and heating setpoint of 14°C, yielding a predicted EUI of 255.93 kWh/m², UDI of 63.50%, and comfort index of 0.654. This configuration balances energy efficiency with acceptable daylight and thermal comfort performance.
This study successfully developed and validated an AI-supported surrogate modeling workflow for sustainable residential building design in Shenzhen, China. By integrating parametric modeling, energy and daylight simulations, and machine learning techniques, the study demonstrated that surrogate models can significantly accelerate performancedriven design exploration in the early stages. The Random Forest model achieved high predictive accuracy for all three metrics, and sensitivity analysis confirmed that cooling setpoint and WWR are the most influential design parameters in hot-humid climates.
Several limitations should be noted. The current model is based on a single building
Ali, A. et al. (2023). Machine learning as a surrogate to building performance simulation: Predicting energy consumption under different operational settings. Energy and Buildings, 286.
Aydın, E. A. et al. (2015). Optimisation of energy consumption and daylighting using surrogate models.
Bourdeau, M. et al. (2019). Modeling and forecasting building energy consumption: A review of data-driven techniques. Sustainable Cities and Society, 48.
Hussien, A. et al. (2023). Predicting energy performances via Random Forest. Journal of Building Engineering.
Nabil, A., & Mardaljevic, J. (2005). Useful daylight illuminance: A new paradigm for assessing daylight in buildings. Lighting Research & Technology, 37(1).
Yılmaz, Y., & Yılmaz, B. Ç. (2021). A weighted multi-
geometry and a limited set of four design variables. Future studies could incorporate more complex geometries, additional parameters such as shading devices or natural ventilation strategies, and seasonal variations in comfort. Moreover, integrating real-time occupant feedback or climate adaptation strategies could further enhance applicability. This research contributes to the growing body of knowledge on AI-aided sustainable design and offers a practical, reusable, and scalable framework for leveraging machine learning in high-performance building design.
objective optimisation approach to improve based facade aperture sizes in terms of energy, thermal comfort and daylight usage. Journal of Building Physics, 44(5), 435–460.
Roman Buckle, Cherry Kim
# KEYWORDS
Deep learning
Time-series forecasting
Building thermal modeling
Physics-informed neural networks
Recursive prediction
# HIGHLIGHTS
• Evaluates temporal and operational generalization of deep-learning indoor air temperature forecasting models using long-term, 1-minute data from the BCA SkyLab Living Lab, highlighting model drift across changing building regimes.
• Identifies distinct 2024–2025 operating regimes via t-SNE + K-means clustering (including weekday/weekend patterns and a 2025 setpoint shift) and tests models across multiple distribution-shifted subsets.
• Shows that recursive forecasting amplifies errors by up to an order of magnitude; recursive training and moderate physics-informed losses improve performance in select regimes but introduce trade-offs, underscoring challenges for MPC/RL deployment.
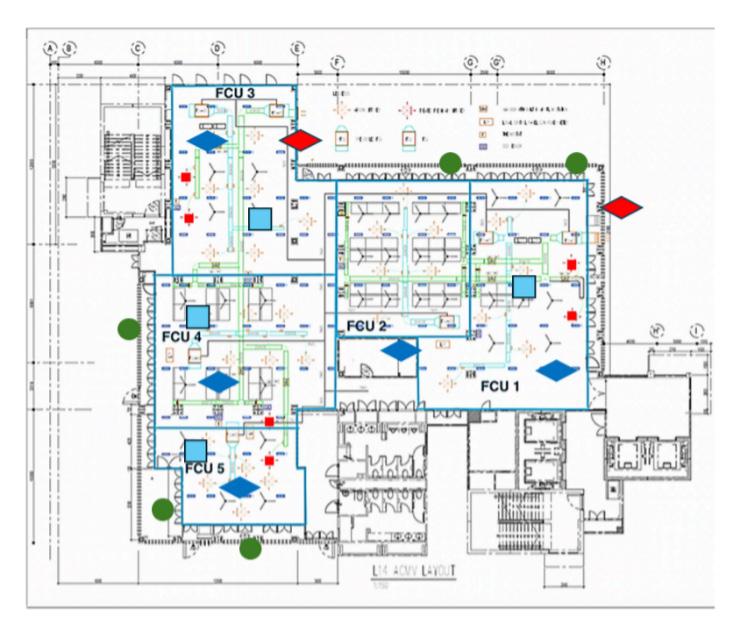
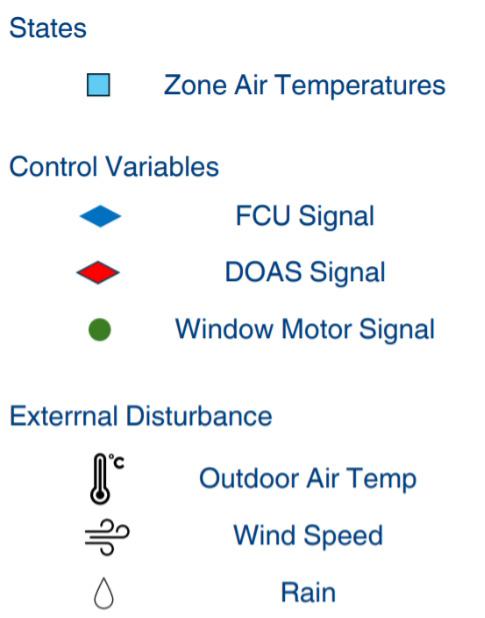
Data-driven forecasting models are essential for building control and energy management, yet their robustness across temporal and operational boundaries remains poorly understood. This study evaluates the temporal and operational generalization of deep learning models for indoor air temperature prediction using 19 months of data from the BCA SkyLab Living Lab. Models trained on 2024 data were tested across multiple distinct operational regimes in 2025, identified through t-SNE clustering analysis. Both oneoff and recursive forecasting horizons were
assessed to reflect short-term operational control and longer-horizon predictions needed for reinforcement learning applications. Results demonstrate substantial performance degradation under distribution shift, with recursive forecasting errors increasing by up to an order of magnitude. Interestingly, models with weaker short-horizon accuracy exhibited greater stability under recursive prediction. Recursive training and physics-informed constraints improved performance in select regimes but introduced performance trade-offs in others.
We modeled indoor temperature forecasting as a supervised time-series prediction task using diverse neural network architectures combining recurrent backbones (LSTM/BiLSTM), convolutional layers (1D temporal convolutions), and attention mechanisms (temporal and dimensional attention). BiLSTM was selected to incorporate both past and future contextual patterns including daily cycles and operational schedules. Attention layers capture temporal periodicity and crossfeature dependencies. Recursive prediction was evaluated by feeding model outputs back as inputs for subsequent steps, simulating long-horizon forecasting scenarios relevant to reinforcement learning control (Liu et al., 2023).
Physics-informed penalty weights were incorporated to enforce building thermodynamics and HVAC operational principles. Constraints included temperature boundaries, thermal inertia, HVAC energy balance, window effects on indoor temperatures, CO2-occupancy relationships, and solar radiation effects. Models were trained with varying constraint strengths (0.5, 1.0, 1.5) to balance fidelity to physical principles with learning of actual operational behavior (Dong et al., 2024).
K-means clustering (K=3) was applied to identify distinct operational regimes within the dataset. Three clusters emerged: (1) early 2025 weekday data with transitional operation, (2) established 2025 weekday data with new operational setpoints, and (3) weekend data with passive building operation. Training occurred on March–October 2024 data with validation on November 2024, while evaluation encompassed five test sets spanning late-2024 temporal generalization and regime-specific 2025 performance.
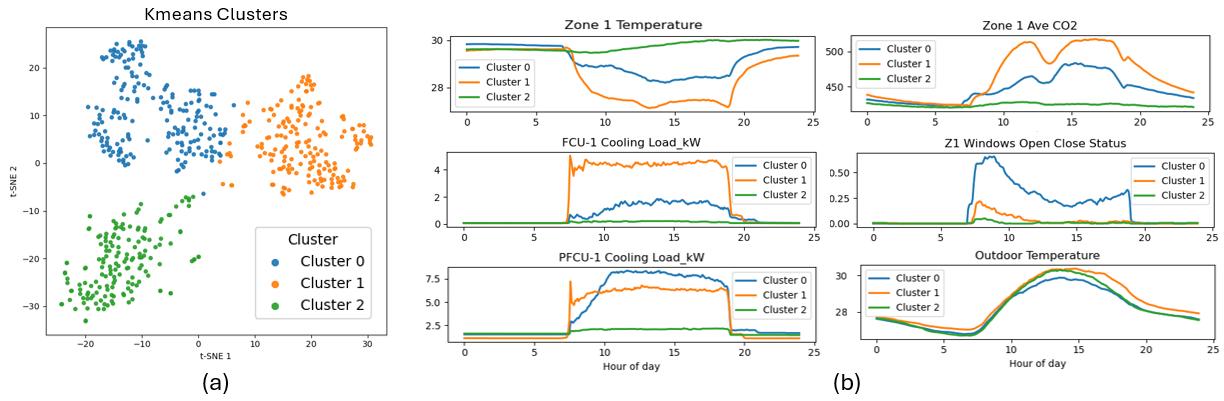
Figure 2: K-means clustering (K=3) of operational regimes and corresponding diurnal thermal profiles
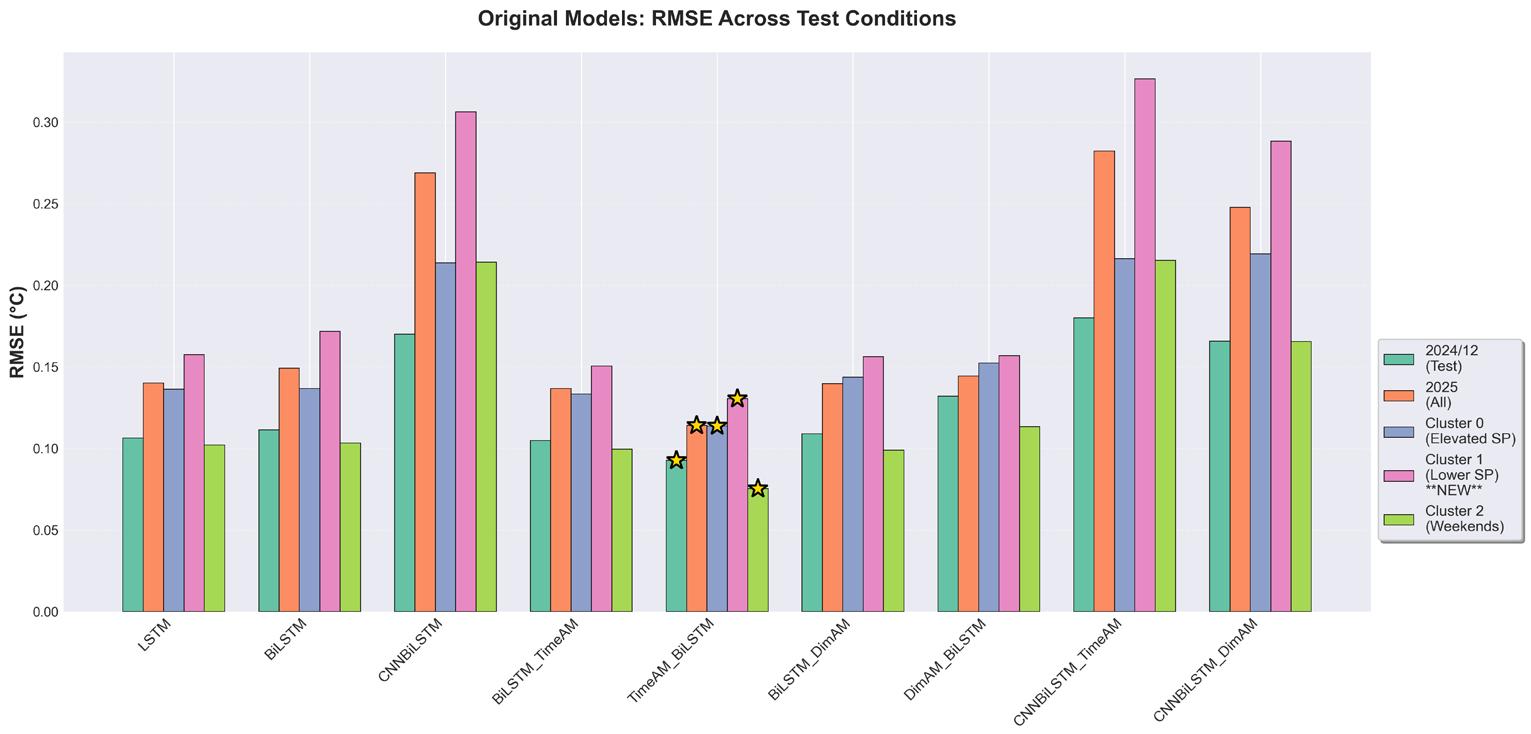
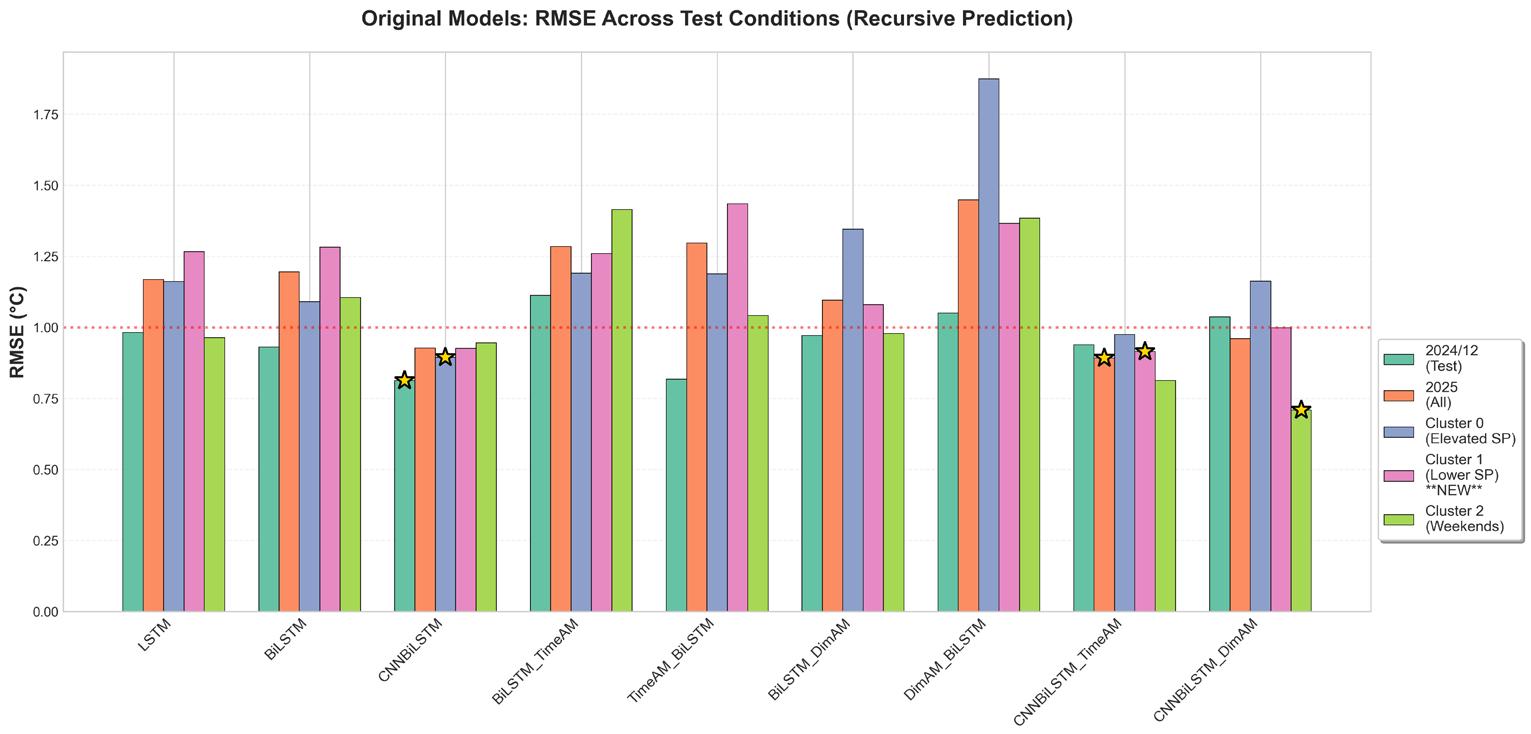
Models exhibited best performance in December 2024 and 2025 weekend regimes, reflecting reduced operational complexity. The TimeAM_BiLSTM variant achieved lowest overall RMSE, while CNN-based architectures performed worst, suggesting that convolutional layers before recurrent layers hinder temporal feature extraction for this task. All models maintained acceptable RMSE for operational use within their training distribution.
Recursive prediction substantially amplified errors across all models, often increasing RMSE by close to an order of magnitude relative to one-off predictions. This indicates poor generalization under error accumulation. Notably, the weakest one-off models (CNNBiLSTM) were most stable recursively, achieving lowest RMSE in majority of regimes. This counterintuitive result suggests that architectural biases toward stability differ fundamentally from biases toward raw prediction accuracy.
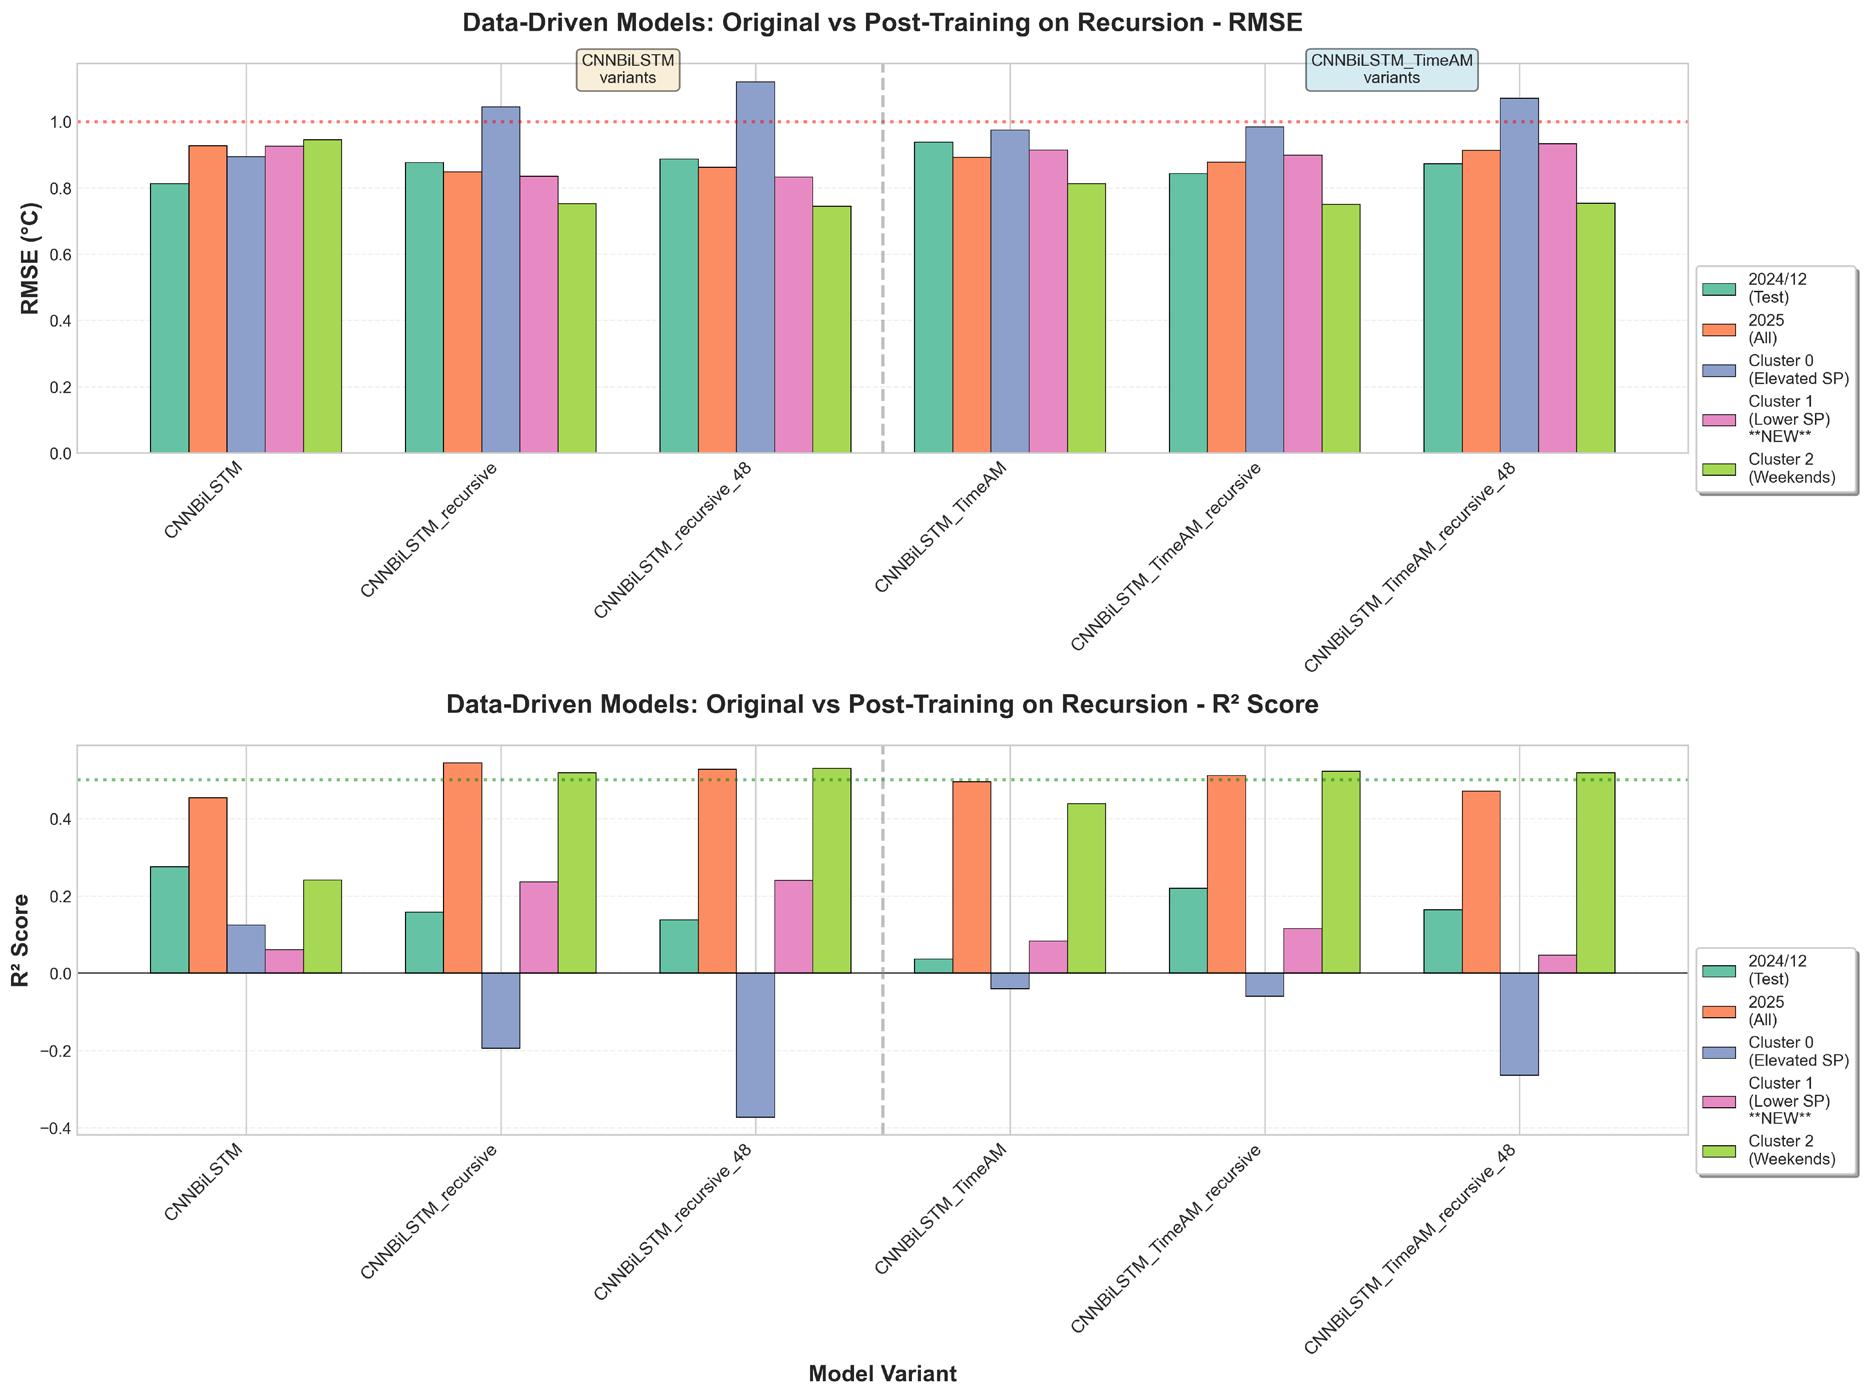
Figure 5: Impact of recursive training objectives (24-step vs 48-step) on recursive prediction stability
The two strongest baseline models (CNNBiLSTM and CNNBiLSTM_TimeAM) were retrained using recursive prediction objectives at 24-step and 48-step horizons. Recursive training improved performance on full 2025 datasets, weekends, and Cluster 1 regimes, supporting the hypothesis that recursive optimization stabilizes long-horizon rollouts. However, performance degraded on early-2025 (Cluster 0) and late-2024 data. Models trained with 48-step recursion underperformed 24-step variants, suggesting that longer-horizon objectives may introduce instability or overregularization (Runge & Zmeureanu, 2021).
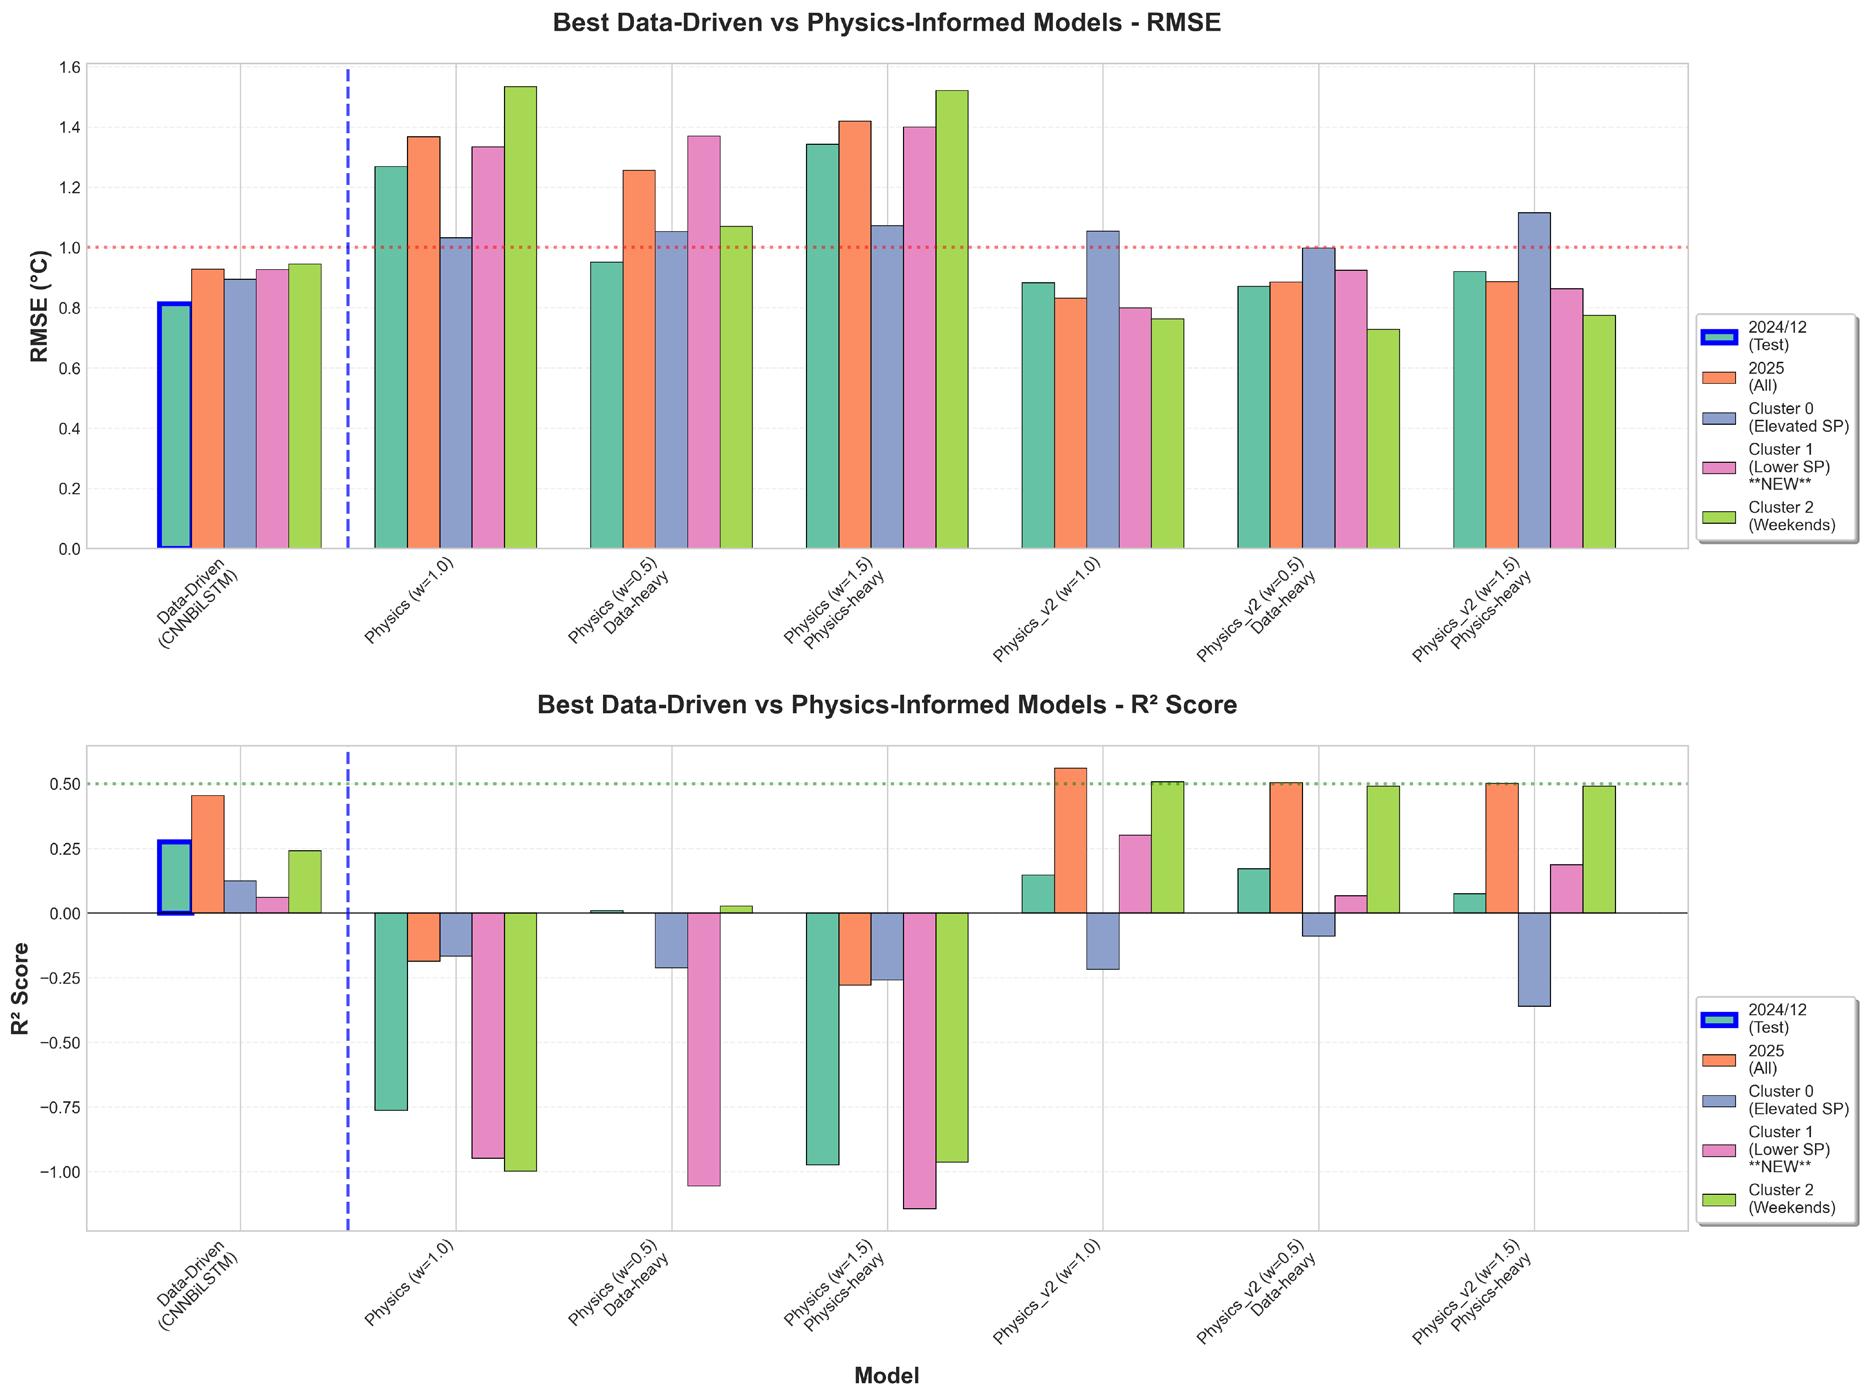
4 Physics-Informed Model Performance
Physics-informed CNNBiLSTM models with constraint weights of 0.5, 1.0, and 1.5 were trained and evaluated. Without recursive training, physics-informed variants performed poorly with mostly negative R² scores, suggesting overly strict constraints suppress learning of real building dynamics. However, when combined with 24-step recursive training, the balanced model (weight 1.0) achieved highest R² (0.56) on full 2025 dataset, outperforming all other approaches. Performance gains concentrated on 2025 Cluster 1 and weekend regimes, while Cluster 0 and late-2024 remained problematic. These results indicate physics constraints prevent unrealistic behavior but require complementary recursive optimization for regime-specific accuracy (Manfren et al., 2024).
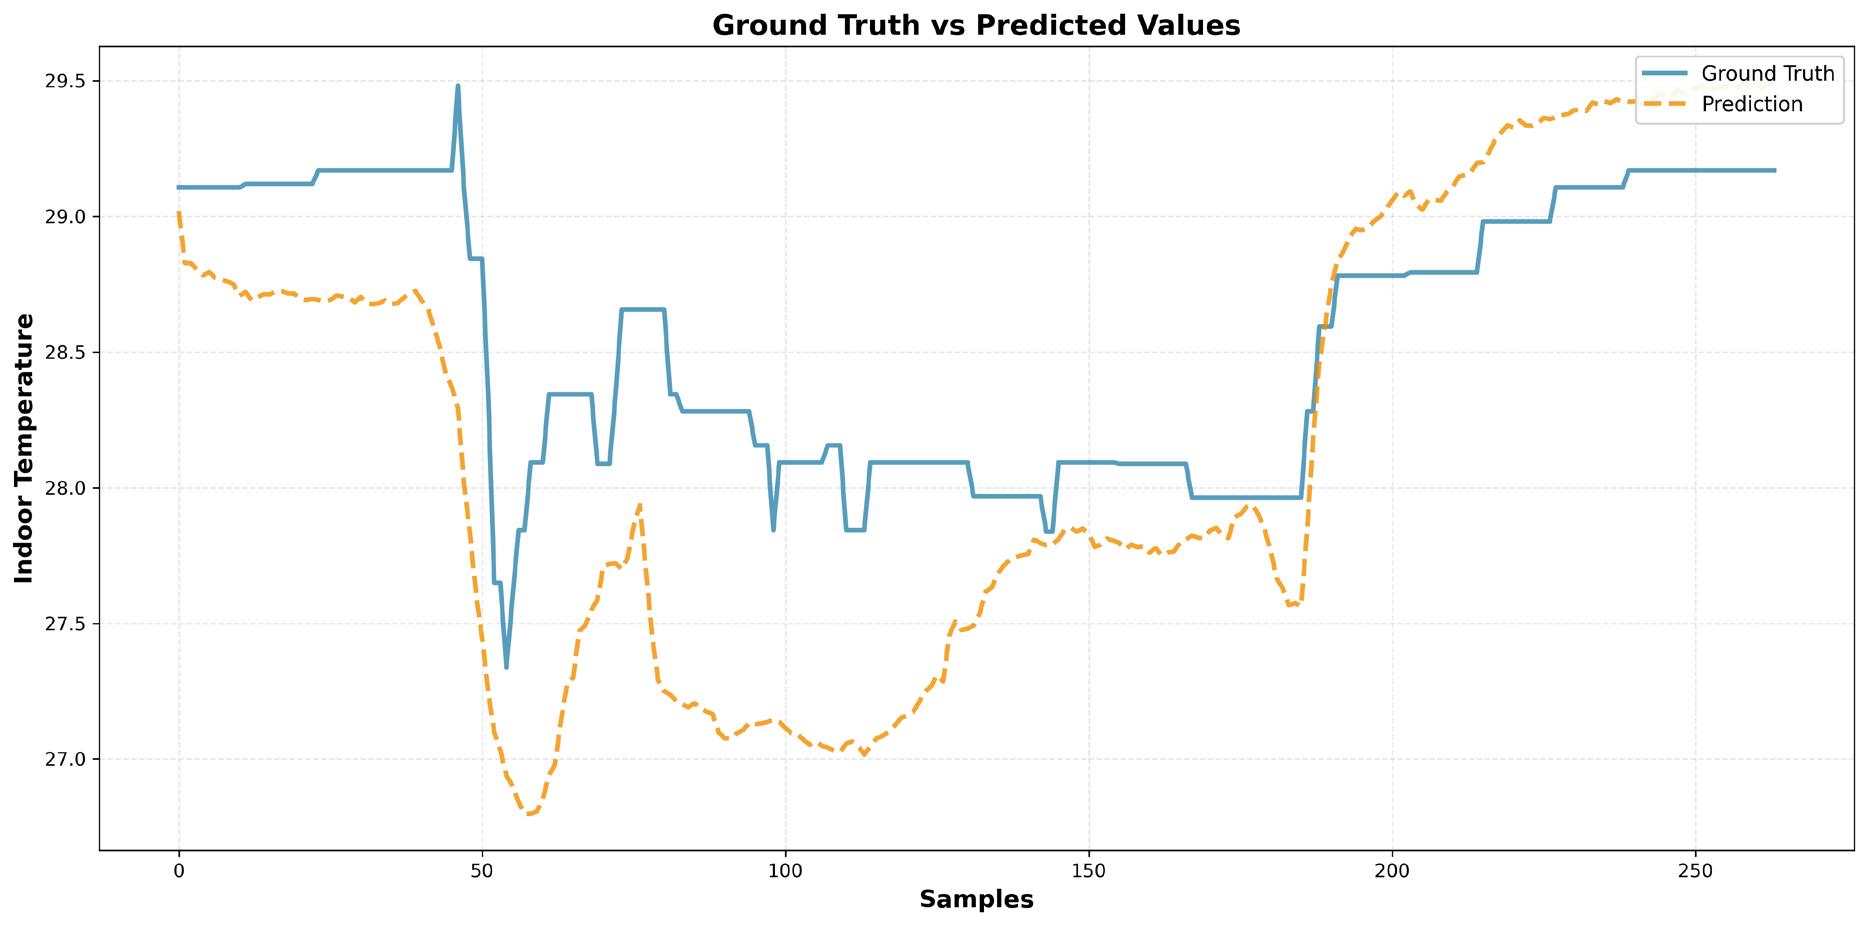
Figure 7: 288-step recursive prediction trajectories: physics-informed CNNBiLSTM (weight 1.0) versus observed Zone 1 temperature
Examination of long-horizon prediction trajectories revealed that best-performing physics-informed models accurately capture general thermal response patterns but struggle with precise temperature tracking over sustained horizons. The recursive nature of forecasting compounds even small single-step errors into significant trajectory divergence. Visually, models either converge toward incorrect steady-state values or exhibit oscillatory behavior, indicating incomplete learning of regime-specific thermodynamics (Zhang et al., 2024).
This research reveals a fundamental tension in data-driven forecasting for building control: while modern deep learning architectures achieve strong accuracy within their training distributions, their ability to generalize across temporal transitions and changing operational conditions is severely limited. Cross-period evaluation demonstrated clear sensitivity to distribution shift, with performance declining substantially when models encounter unseen 2025 operational regimes. Recursive forecasting further exposed architectural vulnerabilities, producing errors an order of magnitude larger than one-off predictions.
A striking finding is that architectures underperforming in short-horizon tasks often exhibited greater recursive stability, suggesting that robustness to error accumulation is governed by distinct architectural properties from raw prediction accuracy. This dissociation implies that practitioners cannot simply select models based on test accuracy; recursive stability must be independently assessed. Recursive training offered partial improvements, particularly for dominant operational modes, but introduced instability when horizons extended beyond 24 steps. Physics-informed training provided additional benefits only with moderate constraint strengths combined with recursive optimization; overly strict physical penalties suppressed the model's capacity to learn real operational dynamics.
These findings identify a central challenge for deploying data-driven models in building control systems: forecasting models must simultaneously withstand temporal drift, evolving operational states, and error accumulation under recursive deployment. Future work should prioritize hybrid frameworks combining data-driven and physics-based components adaptively, uncertainty-aware forecasting to signal confidence in predictions, and automated retraining strategies triggered by distribution shift detection. Only through such integrated approaches can forecasting models provide the robust long-horizon predictions required by model predictive control and reinforcement learning building control systems.
Dong, X., Guo, W., Zhou, C., Luo, Y., Tian, Z., Zhang, L., Wu, X., & Liu, B. (2024). Hybrid model for robust and accurate forecasting building electricity demand combining physical and data-driven methods. Energy, 2024.
Liu, H., Liang, J., Liu, Y., & Wu, H. (2023). A review of data-driven building energy prediction. Buildings, 2023.
Manfren, M., Gonzalez-Carreon, K., & James, P. (2024). Interpretable data-driven methods for building energy modelling—a review of critical connections and gaps. Energies, 2024.
Runge, J., & Zmeureanu, R. (2021). A review of deep learning techniques for forecasting energy use in buildings. Energies, 2021.
Zhang, C., Lu, J., Huang, J., & Zhao, Y. (2024). Endto-end data-driven modeling framework for automated and trustworthy short-term building energy load forecasting. Building Simulation, 2024.
Hongchang Xu, Huoyu Zheng
Facade Parameters
Daylighting
Thermal Comfort
UDI
PMV
Machine Learning
Parametric Modelling
# HIGHLIGHTS
• Builds a parametric simulation dataset in Grasshopper by varying key façade variables (WWR, sill height, and orientation) and computes UDI and PMV to support rapid early-stage comfort evaluation.
• Trains two Random Forest surrogate models that predict UDI and PMV with high accuracy, enabling fast performance estimation without rerunning full simulations.
• Reconnects the trained surrogates to Grasshopper and uses Wallacei for multi-objective optimization, showing convergence toward façade parameter ranges that better balance daylight and thermal comfort.
Early-stage building design decisions strongly influence the daylighting quality and thermal comfort experienced within occupied spaces. However, rigorous environmental simulations such as EnergyPlus calculations are computationally intensive, making it challenging for designers to rapidly test a wide range of façade configurations. As a result, there is growing interest in using data-driven methods to approximate building performance and support faster design iteration (Li et al., 2022).
This project investigates whether machine learning models can be trained to accurately predict two key indoor comfort metrics: Useful Daylight Illuminance (UDI), which represents daylighting performance, and Predicted Mean Vote (PMV), which represents thermal performance. A parametric workflow was constructed in Grasshopper to generate a
A total of 500 sets of real building data were collected from the Singapore PropertyGuru website, including layout dimensions, window width, and sill height. These dimensions were distributed across four cardinal orientations (0°, 90°, 180°, 270°) to ensure comprehensive coverage of Singapore's diverse building stock. Three key façade parameters were identified:
Window-to-Wall Ratio (WWR): Controls the proportion of glazing on the façade and strongly influences daylight penetration and solar heat gain.
Sill Height: Modifies the vertical position of the glazing and affects both daylight distribution and view angle.
simulation dataset by systematically varying three geometric parameters that strongly influence daylight access and solar exposure: window-to-wall ratio (WWR), sill height, and façade orientation.
By focusing on a minimal yet meaningful set of façade parameters, this study explores the potential of lightweight predictive models to support rapid early-stage decision-making. The objective is to evaluate whether machine learning can reproduce the underlying performance trends with high accuracy. The resulting framework offers insight into the feasibility of integrating predictive models into early design workflows, reducing reliance on full simulation for every design iteration.
Orientation (0°, 90°, 180°, 270°): Determines exposure to the sun path and affects both daylight availability and heat gain throughout the day.
Simplified office spaces were modelled in Grasshopper with a default window height of 2.1 metres. Window widths were processed to derive window-to-wall ratios, and the dataset encompassed 125 parametric configurations per orientation.
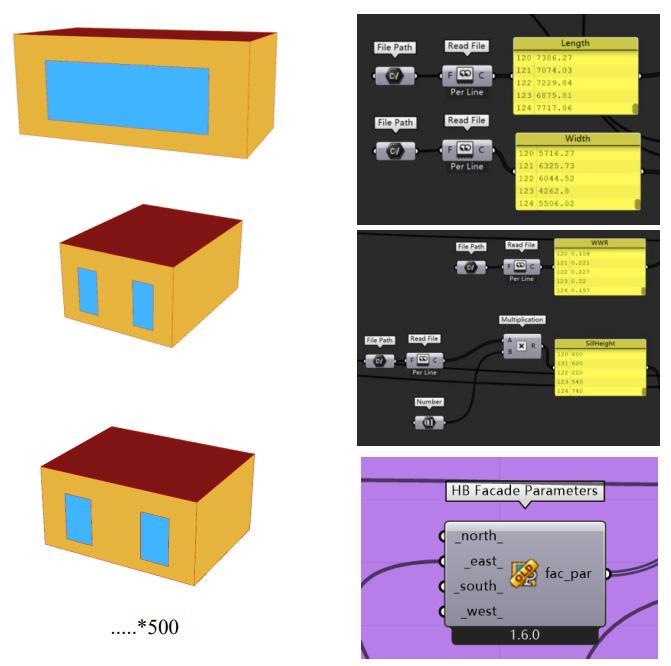
For every parametric configuration, daylight and thermal metrics were computed using Ladybug and Honeybee simulation tools. Useful Daylight Illuminance (UDI) was obtained through daylighting simulation, while Predicted Mean Vote (PMV) was derived from Honeybee thermal comfort calculation modules with fixed indoor environmental assumptions. The resulting dataset consisted of input parameters (WWR, sill height, orientation, layout dimensions) paired with corresponding UDI and PMV values.
Using Colibri components within Grasshopper, 125 sets of data were automatically input sequentially and simulated in a loop, repeated four times for different orientations. A data recorder was used to systematically collect 500 sets of UDI and PMV values.
The Random Forest regression method was selected to model UDI and PMV due to its robustness and ability to capture nonlinear relationships between façade parameters and performance outcomes. Two separate models were trained using the three façade parameters—WWR, sill height, and orientation—as inputs. The dataset was divided into an 80/20 train-test ratio, and a 300-tree Random Forest was configured to balance accuracy and computational efficiency. Hyperparameters were kept conservative to mitigate overfitting. Model performance was evaluated using coefficient of determination (R²) and mean absolute error (MAE).
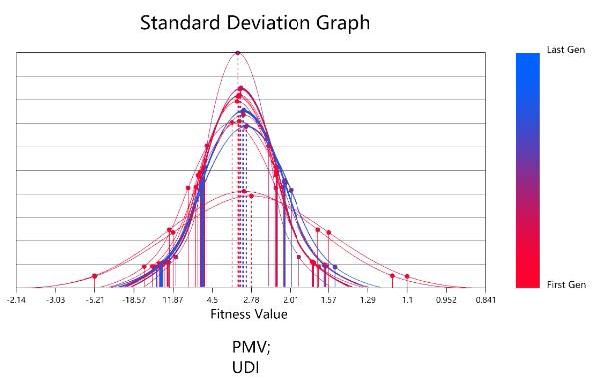
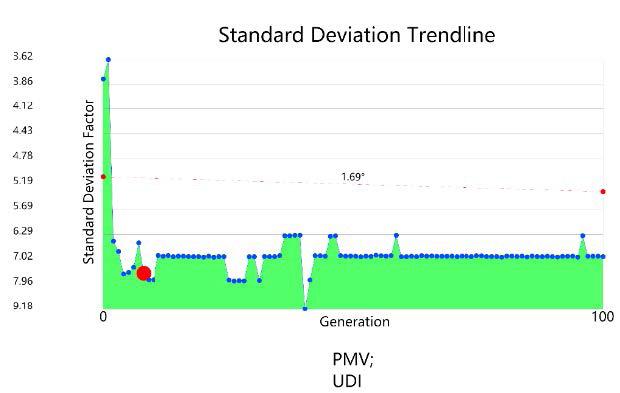
The machine learning models achieved very high predictive accuracy for both UDI and PMV. The UDI model achieved R² = 0.9996 with MAE = 0.1340, while the PMV model achieved R² = 0.9999 with MAE = 0.0007. This exceptional performance is expected because the dataset was generated from noise-free physics-based simulations, and the three input variables form a smooth, deterministic design space. The slightly higher MAE in the UDI model reflects the greater sensitivity of daylighting to geometric variation, while the very small PMV error results from the narrower thermal variation under fixed indoor conditions. Overall, these results demonstrate that Random Forest models effectively approximate the underlying simulation behaviour and can reliably predict UDI and PMV within the defined design space.
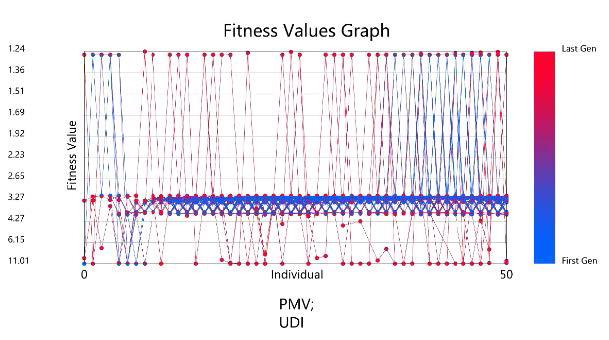
The trained models were integrated into Grasshopper and used with Wallacei for multiobjective optimization. Assuming a small office with a frontage of 10 metres and depth of 6.2 metres in Singapore, the optimization workflow systematically explored parameter combinations to minimize negative UDI (maximize daylight) and minimize PMV (improve thermal comfort). The optimization was run at 50 population size for 100 generations, totaling 5000 iterations. The time efficiency advantage is striking: traditional direct simulation-optimization would require approximately 85 hours for 5000 iterations. Using the machine learning proxy model, this time was reduced to 9 hours—a 9-fold speedup. This demonstrates the practical value of surrogate models for supporting rapid design exploration. The parallel coordinate plot (Figure 5) indicates that the evolutionary process successfully identified regions of the design space with superior combined performance. The convergence of lines
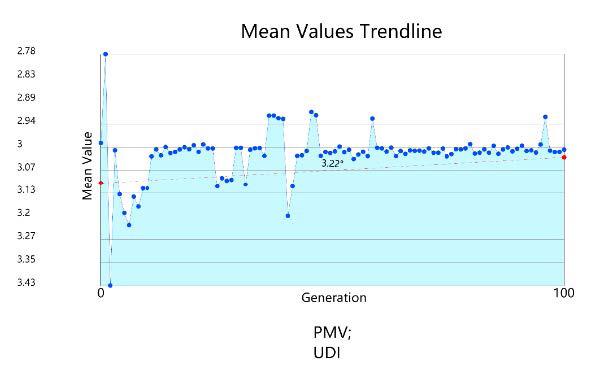
suggests that façade orientation and WWR play more influential roles in shaping fitness outcomes, while sill height demonstrates a smaller but still noticeable effect on overall performance. The convergence analysis demonstrates clear evolutionary progress. The initial population displayed wide variability in performance, but standard deviation decreased sharply in early generations and stabilized at a low level, indicating that the population converged to consistent highperforming solutions. The fitness value and mean trendlines reinforce this behaviour: early generations contained a mix of low and high performers, but later generations became dominated by tightly clustered, higher-fitness individuals. This confirms that the evolutionary algorithm effectively filtered out poorperforming configurations and progressively refined the population toward more optimal façade parameter combinations that balance both daylight and thermal comfort.
This study successfully demonstrated that machine learning models and evolutionary optimization can be effectively combined to support early-stage façade design. Using a simulation-generated dataset defined by three key façade parameters—WWR, sill height, and orientation—the Random Forest models achieved near-perfect accuracy in predicting both UDI and PMV. These results validate that surrogate models can reliably approximate daylight and thermal comfort trends within a controlled design domain.
The Wallacei optimization further revealed clear convergence toward parameter combinations that provide balanced improvement in performance. The evolutionary process demonstrated excellent capability to guide designers toward higher-quality solutions without the computational burden of repeated full simulation. Although the findings
Li, Y., Huang, C., Zhang, G., & Yao, J. (2022). Machine Learning Modeling and Genetic Optimization of Adaptive Building Façade Towards the Light Environment. CAADRIA 2022: Post-Carbon (pp. 141-150). Sydney, Australia: Association for Computer-Aided Architectural Design Research in Asia.
are promising, they remain bounded by the simplified conditions of the study: only three façade parameters were included, and thermal conditions were held constant. Consequently, the models perform exceptionally well within this limited design domain but may not generalize to more complex or realistic building conditions. Nevertheless, the workflow demonstrates strong potential for supporting early-stage design by enabling rapid performance prediction and systematic exploration of design alternatives. With broader datasets and extended parameters, the same methodology could support more generalizable predictive tools for real-world building applications.
Chuan Fang Tan, Muhammad Ridhwan Bin Mohamed Sulaiman
# KEYWORDS
Building Management System (BMS) analytics
Energy Use Intensity (EUI)
Water Efficiency Index (WEI)
Random Forest forecasting
Anomaly detection
# HIGHLIGHTS
• Develops an AI-Assisted monitoring dashboard for TTSH-ICH to support a 10% reduction target for EUI and WEI by converting fragmented operational data into actionable, stakeholder-friendly insights.
• Integrates multi-source data (BMS exports, monthly utility bills, and physical meter readings), normalizes by floor area/occupancy, and visualizes performance metrics, historical trends, and zone-level water usage for targeted investigations.
• Random Forest improves robustness and achieves higher fit (R² = 0.895 for EUI, 0.839 for WEI), enabling scenario-based planning and early alerts.
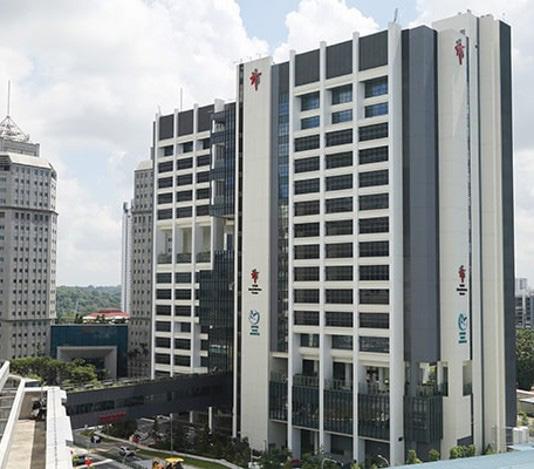
The Tan Tock Seng Hospital Integrated Care Hub (TTSH-ICH) plays a key role in Singapore's healthcare landscape, offering rehabilitative and sub-acute care in a high-occupancy, operationally complex environment (TTSH, 2024). As part of the National Healthcare Group, TTSH-ICH is aligned with the Ministry of Health and Ministry of Sustainability and the Environment directives to advance environmental performance across the healthcare sector.
TTSH management has pledged to meet MSE targets for a 10% reduction in Energy Use Intensity (EUI) and Water Efficiency Index (WEI) by 2030, with ICH targeting 2035 given its operational ramp-up through 2025. While the Building Management System (BMS) captures consumption data, this information remains
largely underutilized (Aidev, 2025). Existing research on data-driven energy dashboards has focused primarily on retail and office sectors, with hospitals remaining underexplored (Arjunan et al., 2022).
This project addresses the gap by developing a data-driven dashboard that visualizes water and energy usage across time, space, and functional zones within TTSH-ICH. The dashboard integrates AI predictive modelling to estimate how changes in occupancy levels influence consumption, supporting proactive resource planning and alignment with national reduction targets.
The project leverages multi-dimensional datasets from TTSHICH, integrating three data sources: the BMS providing realtime or hourly readings with CSV export capabilities, monthly utility bills for benchmarking and cost tracking, and physical monthly meter readings for data verification. This multi-source approach ensures cross-verification and enhanced reliability.
Collected data are categorized and normalized by floor area, adjusted for occupancy, and aligned temporally. The processed data includes daily water usage by area, monthly water and electricity data, building configuration parameters, and occupancy estimates for scenario-based predictions.
Streamlit with Replit AI Agent was selected as the platform for dashboard development due to its Python-native integration with data science workflows, rapid prototyping capabilities, and support for interactive widgets. The dashboard features include performance metrics panels, spatial water usage analysis, historical trend visualization, predictive analytics, comparison reports, and data export functionality.
Two prediction models were implemented: linear regression for baseline trend estimation and random forest for capturing non-linear relationships between occupancy, environmental factors, and resource consumption. These models support forward-looking EUI and WEI predictions and anomaly detection capabilities.
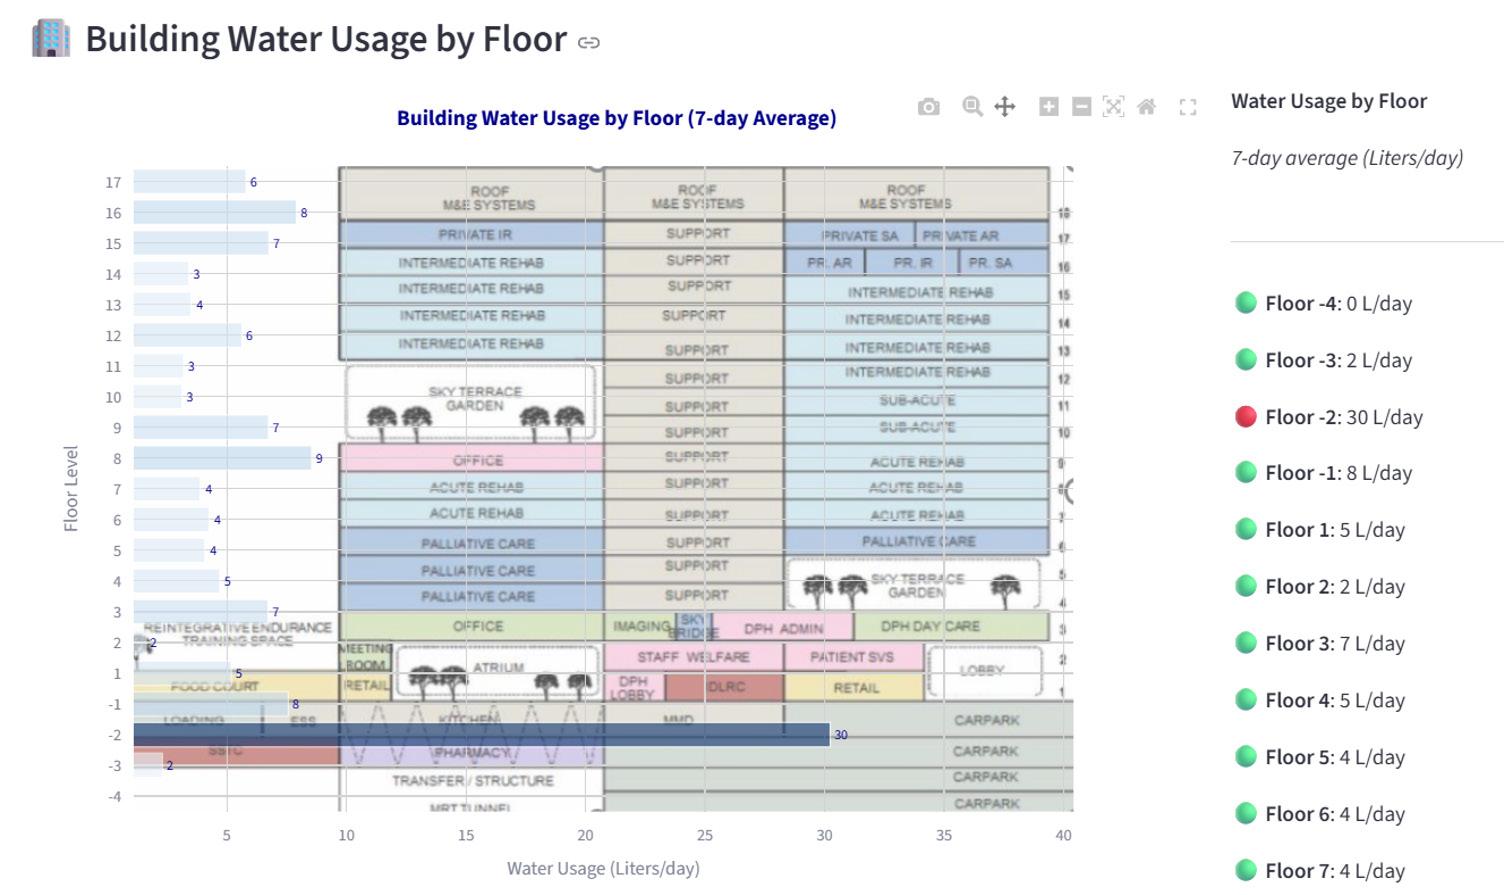
The dashboard successfully integrates multiple data streams into a unified visualization platform. The performance metrics panel provides real-time EUI and WEI tracking against reduction targets using color-coded gauges for quick visual feedback. Figure 2 illustrates the dashboard performance visualization.
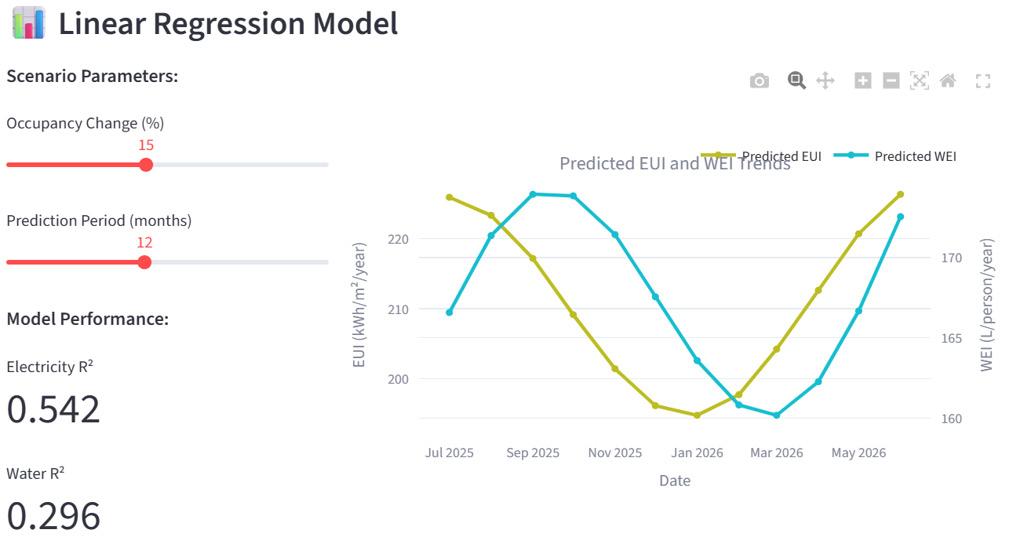
Spatial analysis of water consumption across hospital zones revealed significant variation between functional areas. The dashboard enables identification of highconsumption zones and potential anomalies, supporting targeted intervention strategies.
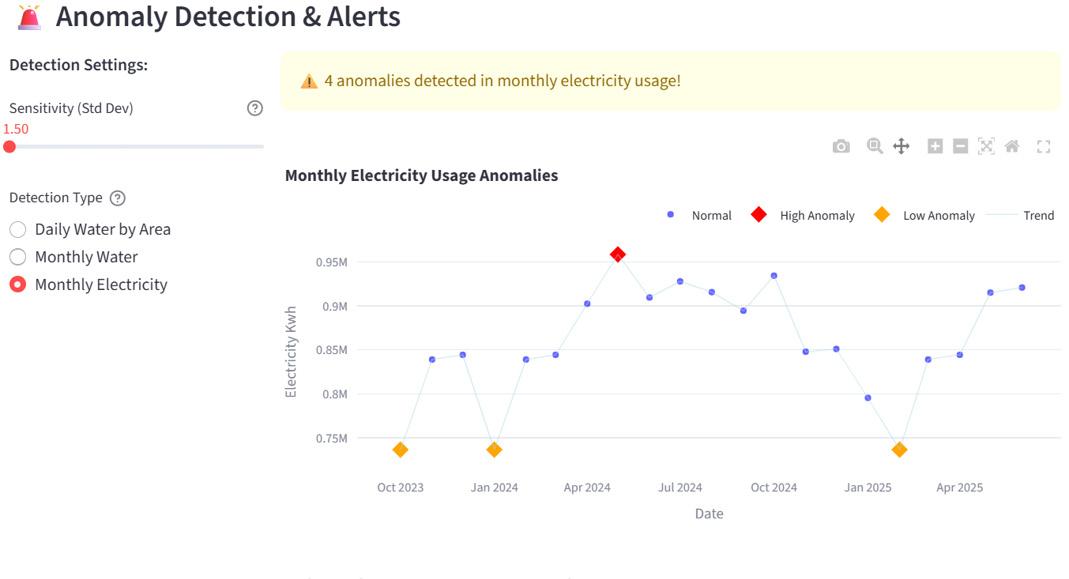
Predictive Model Performance
The predictive analytics module enables scenario-based simulations of future EUI and WEI based on occupancy changes. The random forest model demonstrated stronger performance than linear regression in capturing non-linear consumption patterns, providing more accurate predictions for operational planning.
This project successfully developed a datadriven dashboard prototype for energy and water monitoring at TTSH-ICH. The dashboard integrates BMS data, utility bills, and meter readings into a unified platform that supports real-time performance tracking, spatial analysis, and predictive modelling. The tool serves multiple stakeholders including operations managers, ESG teams, and facility engineers by providing actionable insights for achieving MSE reduction targets.
While the current prototype demonstrates the feasibility of AI-driven resource monitoring in a hospital setting, several limitations exist. The predictive models rely on limited historical
data and would benefit from longer time series as the facility matures. Future developments could include real-time BMS integration, more granular zoning analysis, integration of renewable energy data, and extension to other NHG facilities. The dashboard serves as a scalable prototype for data-driven sustainability management in healthcare institutions.
Aidev (2025). Data-driven energy dashboards for real-time building performance tracking. AI for Development Review.
Arjunan, P. et al. (2022). Data-driven energy models for office, hotel, and retail buildings in Singapore. Applied Energy.
TTSH (2024). Tan Tock Seng Hospital ESG and Sustainability Framework. National Healthcare Group.
Xinyao Li, Luhan Zhao
QGIS analysis machine learning residential planning
# HIGHLIGHTS
• Builds an open-source, district-scale evaluation workflow for Singapore HDB blocks.
• Quantifies block-level spatial quality using interpretable GIS indicators, including network-based accessibility (QNEAT3 walking distance to bus stops), greenery ratio, water ratio, and building density, and converts them into a composite score via transparent formulas.
• Trains a Random Forest regressor to automate score prediction and reveal feature importance, showing accessibility and density as dominant drivers and enabling district-wide mapping and exploratory optimization for improvement strategies.
The shortage of land in Singapore has driven residential areas towards higher density, creating tension between density and livability (Wang et al., 2022). While high density accommodates more residents on limited land, it may lead to crowded living conditions, poor ventilation and natural lighting, and inefficient transportation routes, thereby affecting residents' living experience and quality of life. This study proposes an integrated machine learning–driven scoring model for evaluating residential blocks in Singapore using QGIS spatial indicators as key inputs.
The entire workflow integrates OpenStreetMap data, QGIS processing, accessibility modelling, greenery and water ratio calculations, building density analysis, sunlight hours analysis and a Random Forest scoring model. Our approach
combines manual scoring criteria with machine learning to enable automated prediction and district-wide evaluation. The resulting evaluation system identifies spatial quality for HDB blocks across Singapore, facilitating urban planning decisions and design optimization.
Key performance indicators include: (1) spatial efficiency (building density and sunshine duration), (2) environmental performance (green space ratio and water body ratio), and (3) accessibility (shortest walking distance from building entrance to transit stations). By training a machine learning model on manually scored data, we demonstrate how computational frameworks can support objective neighbourhood-level evaluation and help identify priority areas for urban renewal.
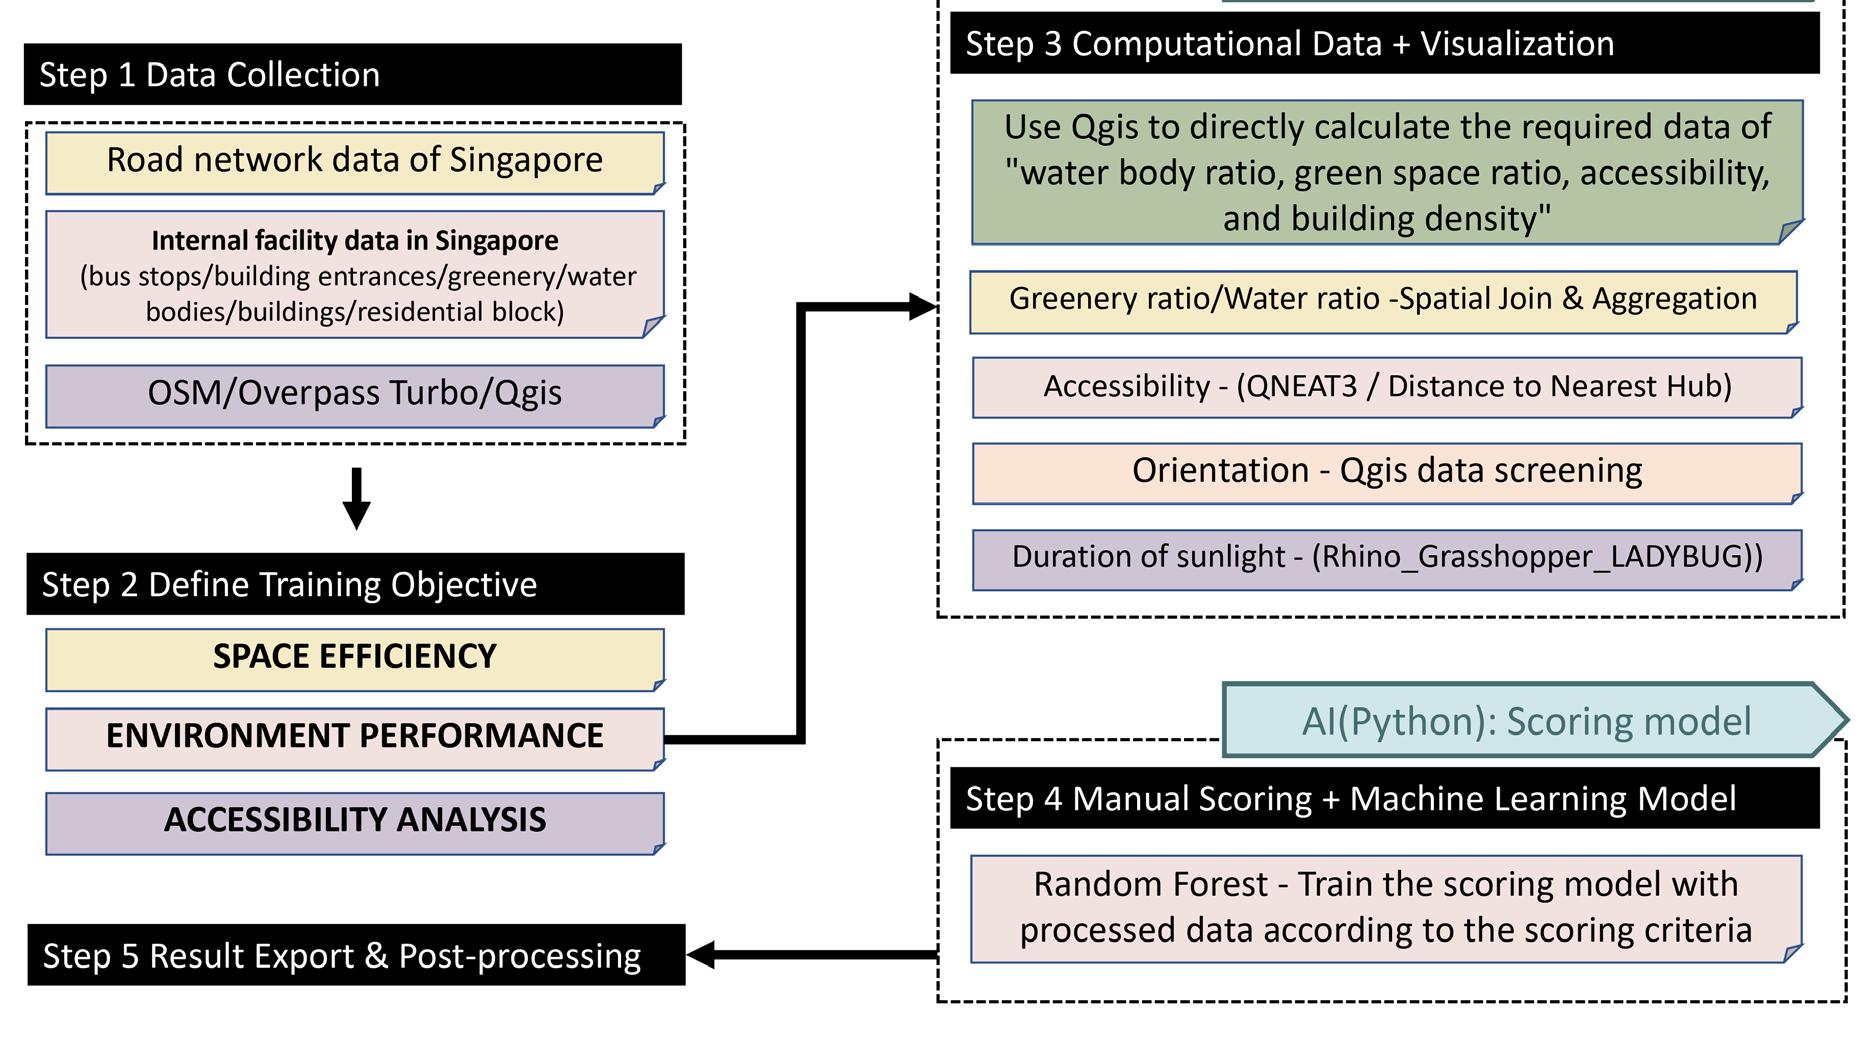
Data collection follows a three-step process: (1) Download descriptive information (Tags) from OpenStreetMap; (2) Input query codes on Overpass Turbo using filtered tags; (3) Utilize the QGIS QuickOSM plugin for direct data extraction and import. Pretreatment includes clipping (removing unnecessary data and focusing on target regions: Bukit Batok and Punggol), geometry repair (fixing vector layer errors), and reprojection (converting from WGS 84 to Singapore SVY21/TM coordinate system for metric accuracy).
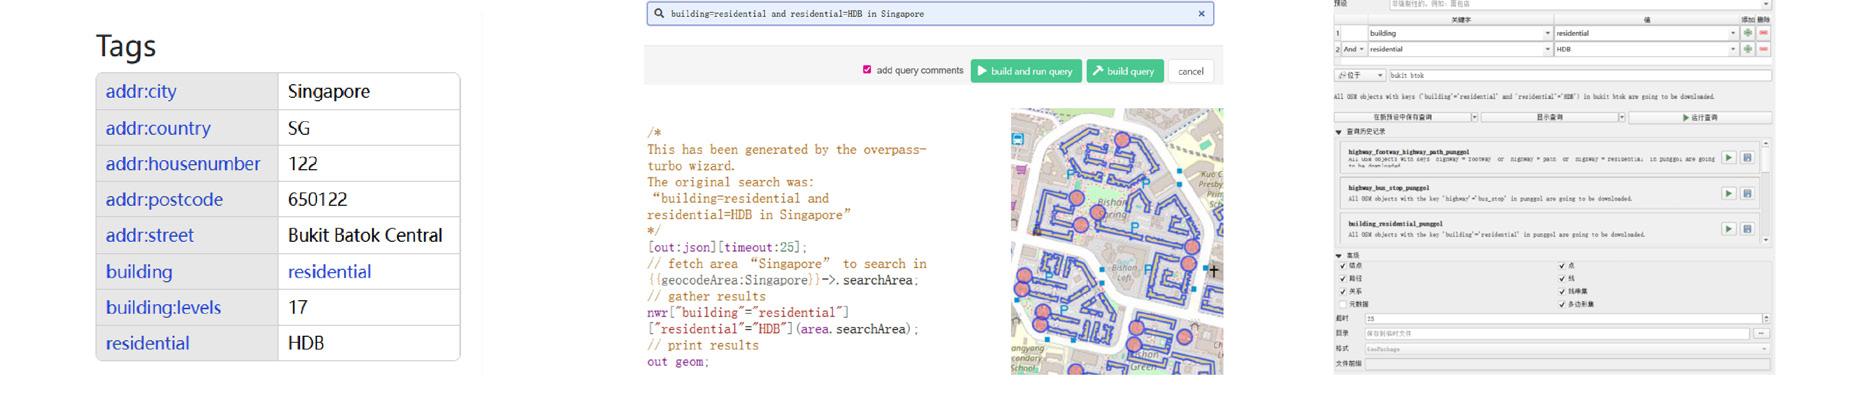
Accessibility was calculated using QNEAT3 (QGIS Network Analysis Tool), computing actual walking distances from residential buildings to nearest bus stops via the road network. Greenery ratio was calculated by intersecting green-related areas (parks, grassland, open spaces) with residential blocks, aggregating green area and dividing by block area. Water ratio followed the same workflow, extracting water polygons from hydrological layers. Building density was defined as the ratio between built-up footprint and parcel land area. Building footprint polygons were intersected with the block polygons to clip out only the building parts lying inside each block. Sunlight hours were analyzed in Ladybug, but could not be integrated into the final model due to block-ID incompatibility between QGIS datasets and exported CSVs.
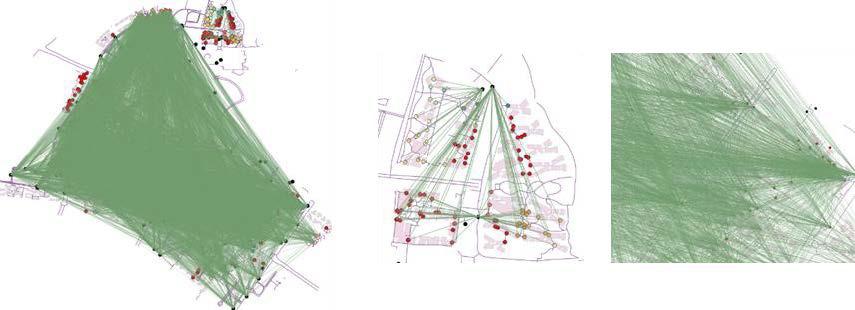
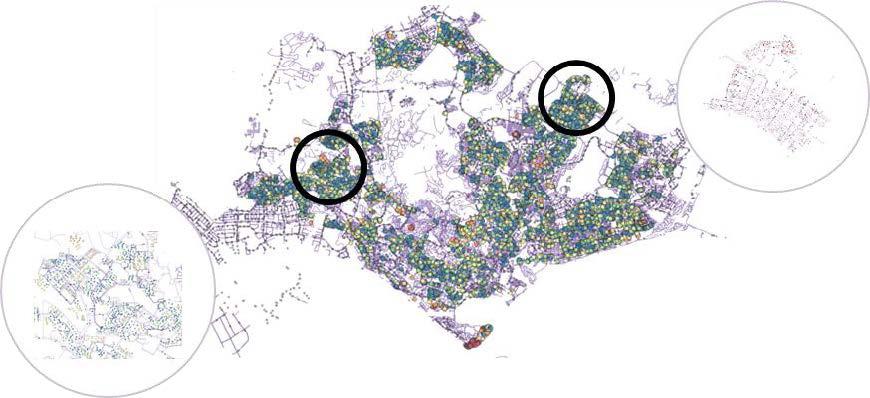
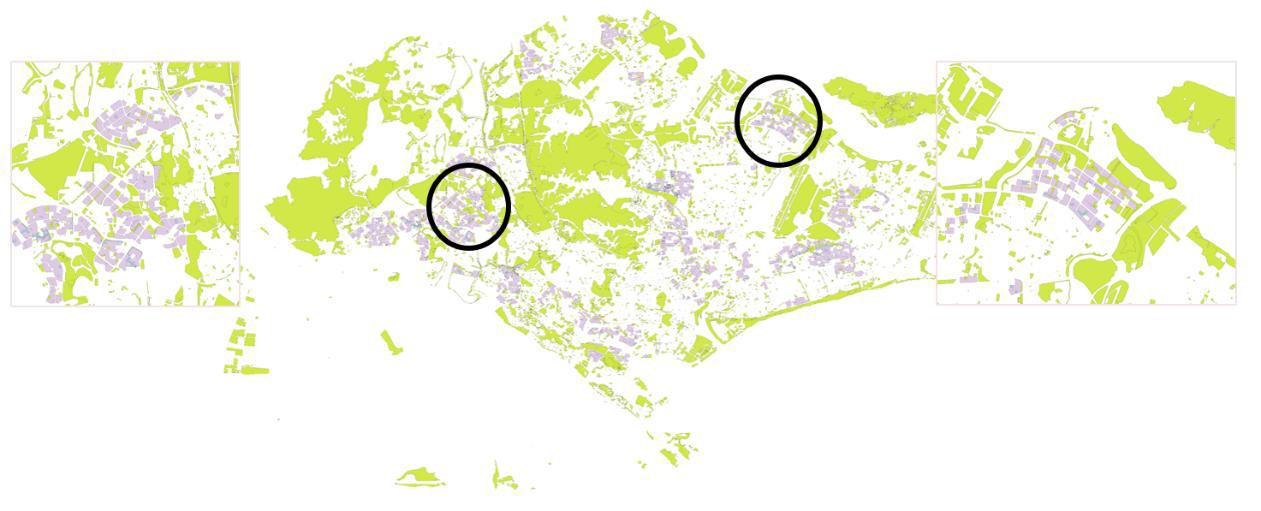
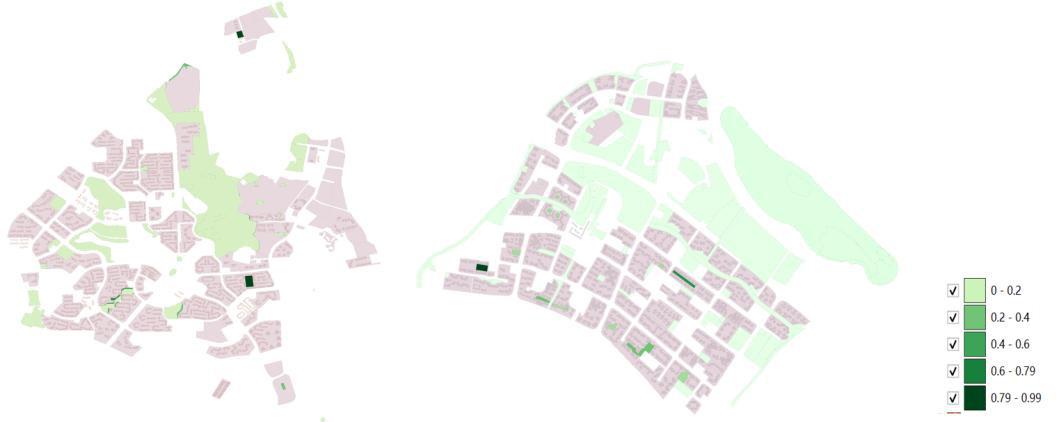
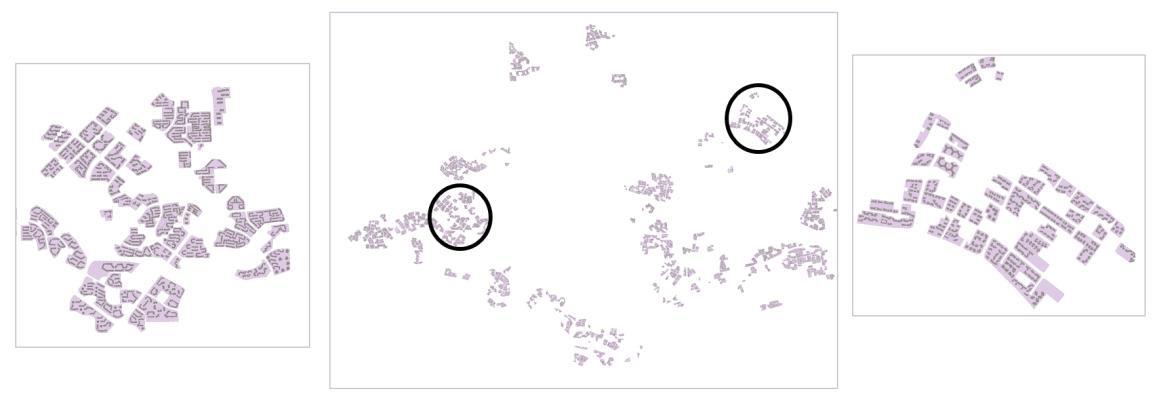
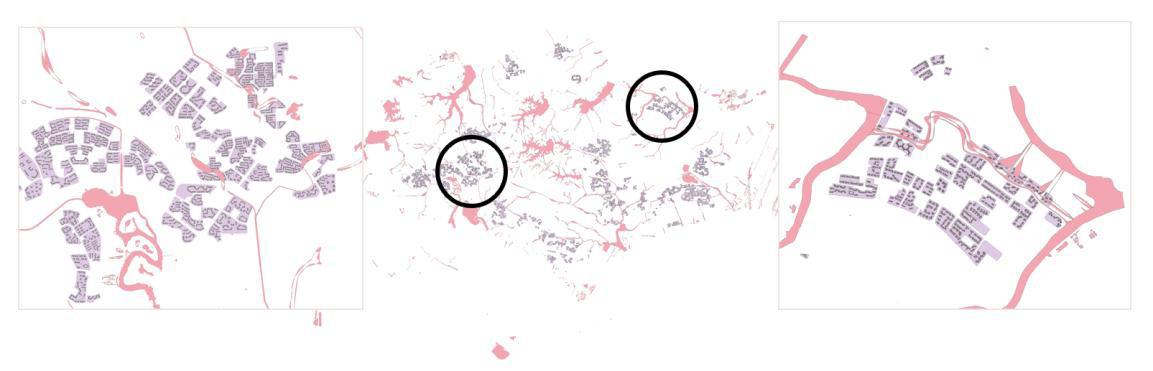
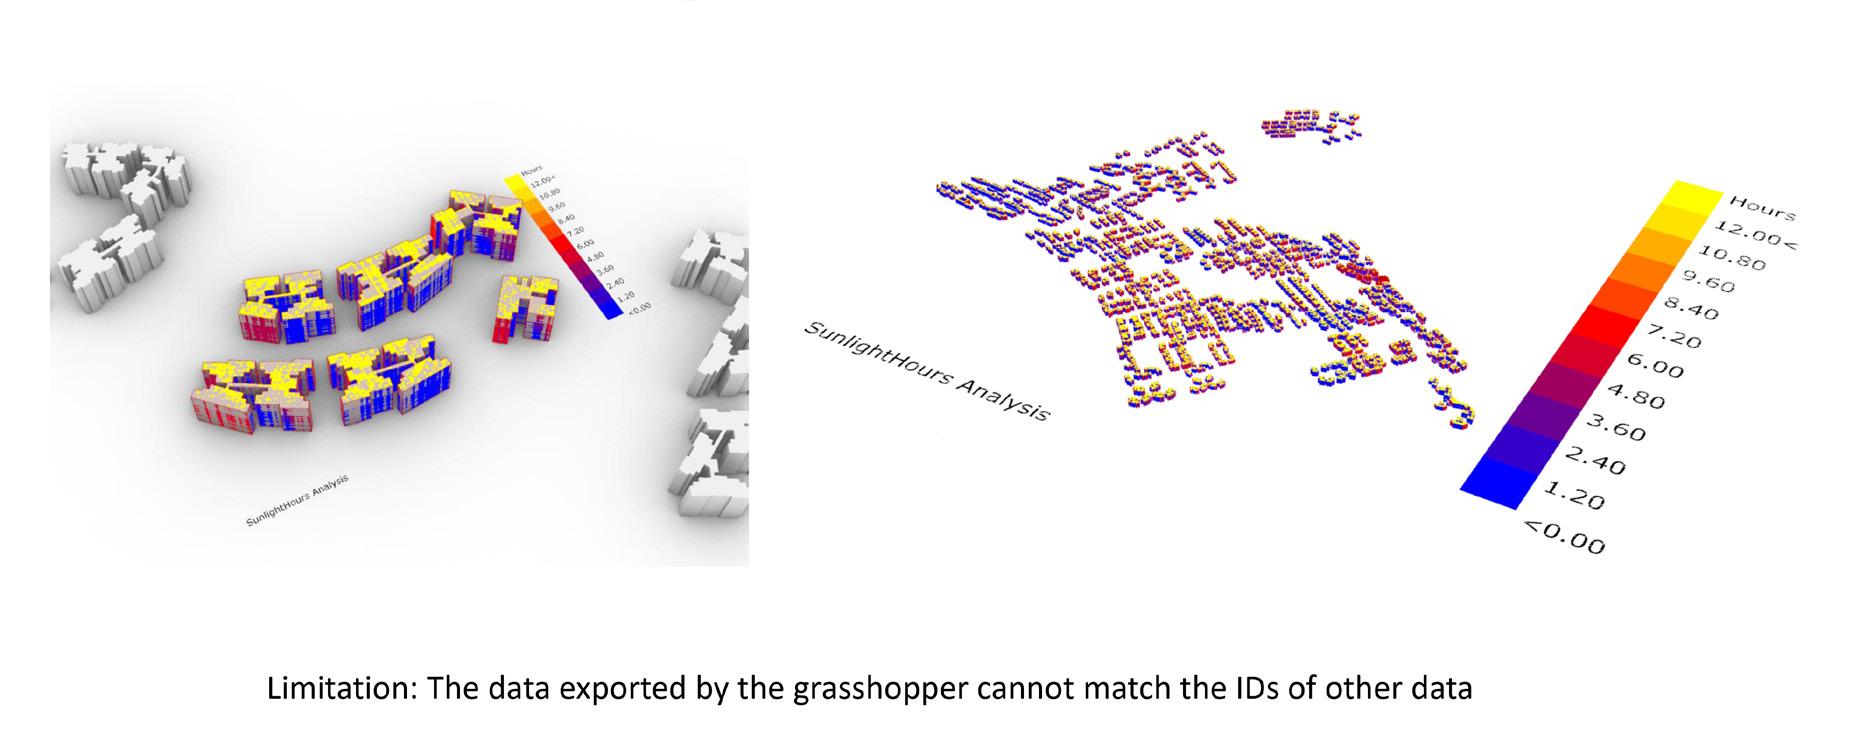
Manual scoring formulas were designed to translate planning preferences into numerical values. Building density employed a linear penalty function with a 50% footprint coverage threshold. Accessibility was scored on a 100–0 scale for walking distances of 0–2000 m. Greenery and water ratios were treated as positive contributors, scaled to 0–100 and weighted at 25% and 15% respectively. These four components were aggregated using fixed weightings: building density (30%),
accessibility (30%), greenery (25%), and water (15%).
A Random Forest regressor was selected as the machine learning model, utilizing building density ratio, green space ratio, water area ratio, and minimum walking distance as input features. The training set was extracted from Bukit Batok and validated on test data. The model was evaluated using coefficient of determination (R²) and mean absolute error (MAE).
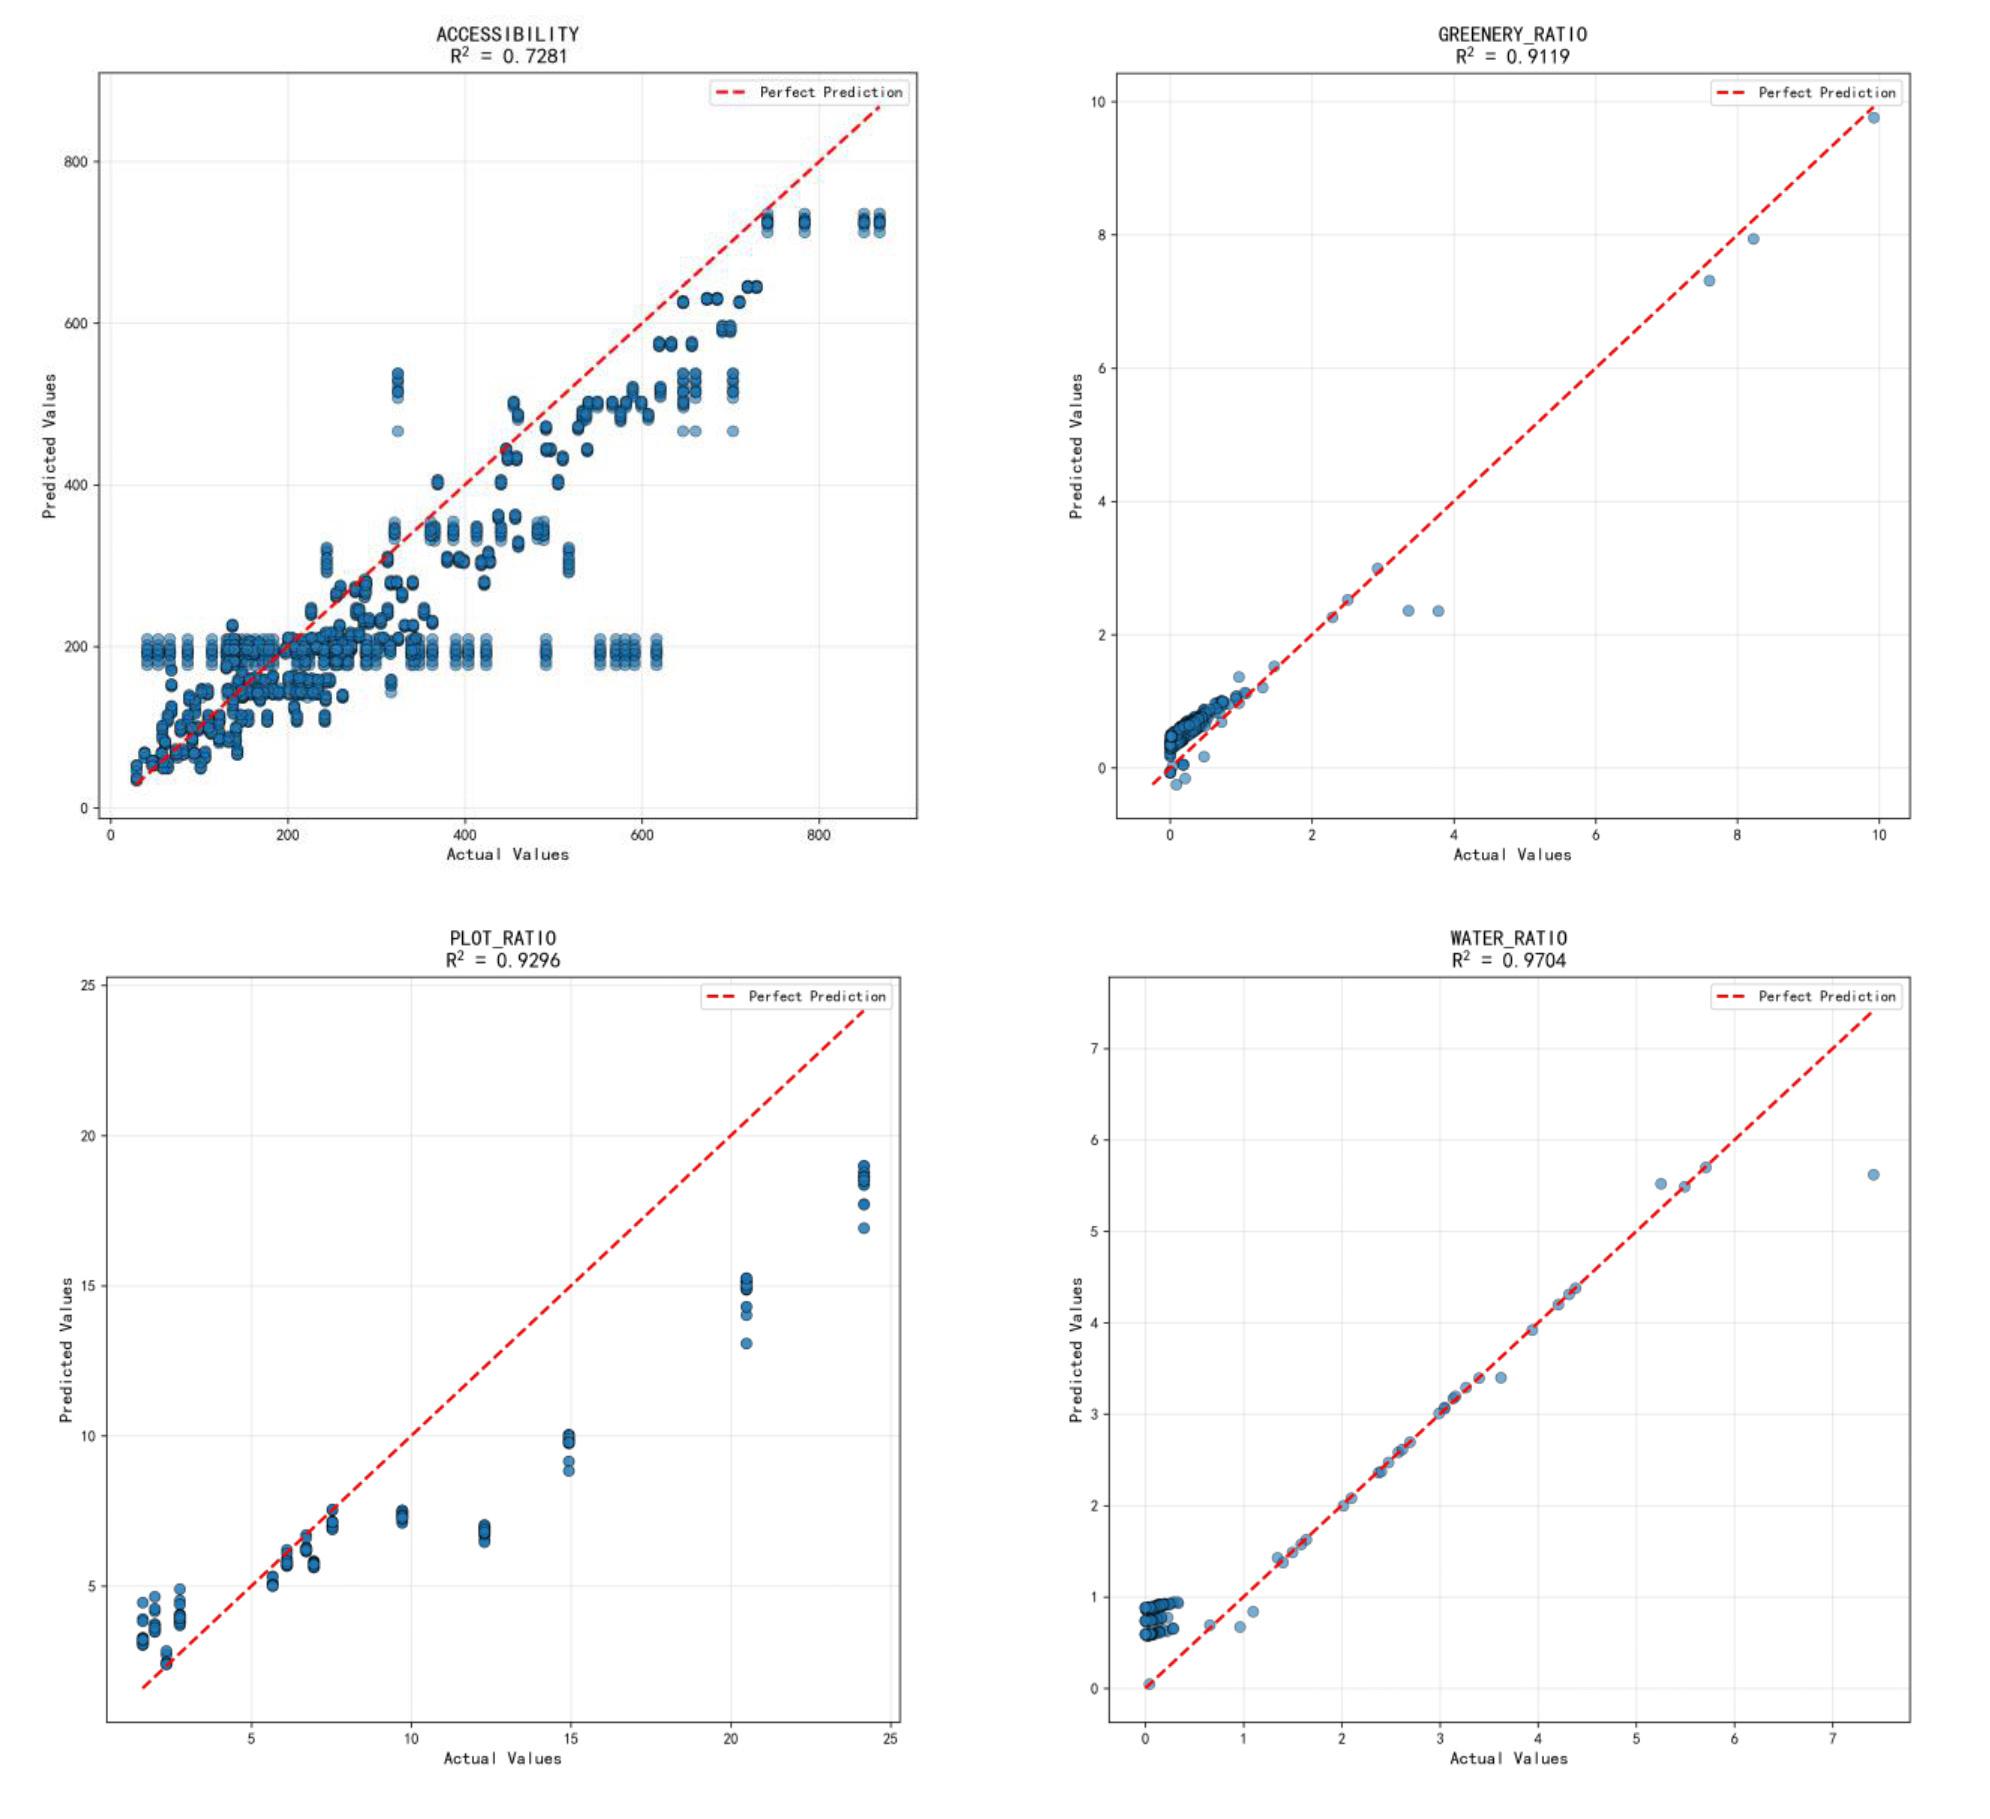
The machine learning model successfully predicted quality scores for all residential areas within Bukit Batok and Punggol. Spatial distribution patterns aligned with planning objectives: Punggol exhibits abundant waterfront and green spaces alongside superior transit infrastructure, resulting in higher accessibility scores and overall quality ratings. Conversely, Bukit Batok demonstrates greater variation in building density, reflecting diverse residential development phases.
Feature importance analysis indicates that accessibility and building density are the primary predictors of residential quality, followed by green space ratio and water body ratio. These findings underscore the critical importance of walkability and density
management in determining neighbourhood livability. The model enables direct districtwide comparisons, revealing clusters of underperforming areas and identifying spatial patterns that warrant improvement strategies.
Model performance metrics demonstrate robust predictive capability, with R² values indicating strong alignment between predicted and manually scored values. Sensitivity analysis reveals that adjusting green space ratios or enhancing accessibility significantly elevates scores in moderately performing districts, validating the framework's utility for guiding design interventions.
This study developed a computational framework for assessing the quality of residential neighbourhoods in Singapore by integrating OpenStreetMap data, QGIS spatial analysis, manual scoring, and machine learning techniques. The approach provides a scalable and objective tool for neighbourhood-level evaluation, assisting planners in identifying priority areas for renewal and testing early design strategies.
Key limitations include incomplete integration of solar exposure analysis due to data ID mismatches, and accessibility modelling limited to walking distance to bus stops. Future research may incorporate multimodal transport networks, microclimate modelling, and resident feedback to enhance the
framework's interpretability and applicability. While reliance on manual scoring formulas introduces subjective elements, the Random Forest model mitigates this by learning patterns from aggregated data. Despite using a single scoring system presenting operational challenges across diverse planning contexts, the framework's advantage lies in providing a macro, holistic overview of spatial quality across the region.
This workflow demonstrates flexibility for application to other regions possessing comparable spatial data infrastructure. The transparent, open-source methodology enables reproducibility and adaptation to local planning contexts and priorities.
Wang, L., Janssen, P., & Chen, K. W. (2022). Evolutionary design of residential precincts: A skeletal modelling approach for generating building layout configurations. In Proceedings of the 27th International Conference of the Association for Computer-Aided Architectural Design Research in Asia (CAADRIA 2022) (pp. 415–424).
Zheng, H., & Yue, R. E. N. (2020). Architectural layout design through simulated annealing algorithm. In Proceedings of the 25th International Conference of the Association for Computer-Aided Architectural Design Research in Asia (CAADRIA 2020): RE-Anthropocene, Design in the Age of Humans (pp. 275–284).
# KEYWORDS
Social media mining
Clustering, micro-climate
Street quality assessment prompt-to-design translation
# HIGHLIGHTS
• Develops “Singapore Walker,” a scalable workflow that combines Instagram hotspot mining, microclimate proxies (shade fraction and PET), and composite street scoring to evaluate pedestrian corridors in Bugis and Chinatown.
• Generates data-driven walking routes using DBSCAN clustering, centroid extraction, PCA-based waypoint ordering, and shortestpath routing, then evaluates comfort at the street-segment level to distinguish systemic vs. localized issues.
• Translates low-performing segment typologies into structured prompts and produces before–after concept visualizations via diffusion models (Midjourney), linking diagnostics to actionable, climateresponsive streetscape ideas.
This project develops Singapore Walker, a datadriven framework that transforms social media "popularity tracks" into a practical and efficient pedestrian corridor. The study integrates social-media analytics, microclimate indicators, and AI-Assisted design generation to evaluate and improve pedestrian streets in Singapore.
Using Bugis as the primary case and Chinatown as a comparative district, the workflow extracts geotagged Instagram posts, identifies hotspots through clustering, and generates a likely walking route using PCA ordering and shortestpath routing. The route is segmented and
assessed using shade fraction, PET estimation, and social-media popularity to construct a composite comfort score.
Results reveal systemic thermal and walkability weaknesses in Bugis and more diverse microclimate performance in Chinatown. The study further translates low-performing segment typologies into design prompts and produces before-after visualizations using diffusion models. The framework demonstrates how data-driven diagnostics and generative tools can support early-stage, climate-response street design.
Workflow Overview
geojson.io --→ Overpass --→ Apify →Colab
Boundary POI list IG posts
Colab→text matching + geolocation
Weighted hotspot points
DBSCAN / KMeans clustering
Weighted centroids (candidate waypoints)
PCA ordering (linearisation)
Snap to street network
Shortest path
Route
District boundaries for Bugis and Chinatown were defined according to primary enclosing road networks. Bugis was bounded by Victoria Street (north), Beach Road (south), Bras Basah Road (west), and Crawford Street (east), enclosing approximately 532,000 m2. Chinatown was bounded by New Bridge Road (north), Neil Road (south), Cantonment Road (west), and Cross Street (east), enclosing approximately 237,600 m2.
Base maps were obtained from CADMapper, providing building footprints, street centerlines, and topographic outlines. Boundary polygons were manually traced in geojson.io according to perimeter roads identified, ensuring alignment with actual street edges.
Using the Instagram Scraper, three scraping tasks were created to extract tens of thousands of posts, including captions, hashtags, and URLs. A custom gazetteer was created using OpenStreetMap (OSM) POIs and colloquial place names, enabling robust text-to-place matching. Each POI was assigned a weighted score combining mention frequency and recency weight.
DBSCAN identified dense hotspot clusters without requiring pre-defined counts. KMeans extracted stable geometric centroids from each cluster. PCA projected centroids onto a one-dimensional axis, allowing the system to infer a natural sequence. Shortest-path routing then connected the waypoints to generate a representative walking route.
Each route was converted into discrete street segments. Three key indicators were computed for each segment: (1) Instagram intensity—aggregated and normalized 0-1; (2) Shade fraction—calculated from street buffers intersected with OSM greenery polygons; (3) PET estimation—simplified model with PETsun approximately 44 degrees C and PETshade approximately 34 degrees C calibrated to Singapore conditions.
A microclimate score aggregated normalized PET and shading values, while a final composite score integrated microclimate (70% weight) and Instagram mentions (30% weight) to reflect environmental comfort and social perception of place quality.
Bugis hotspots are scattered and heterogeneous, reflecting a mix of malls, alleys, and plazas. The generated route reflects this diversity but reveals weak pedestrian connectivity. Chinatown hotspots are highly concentrated around shophouse streets, creating dense pedestrian corridors with strong spatial cohesion.
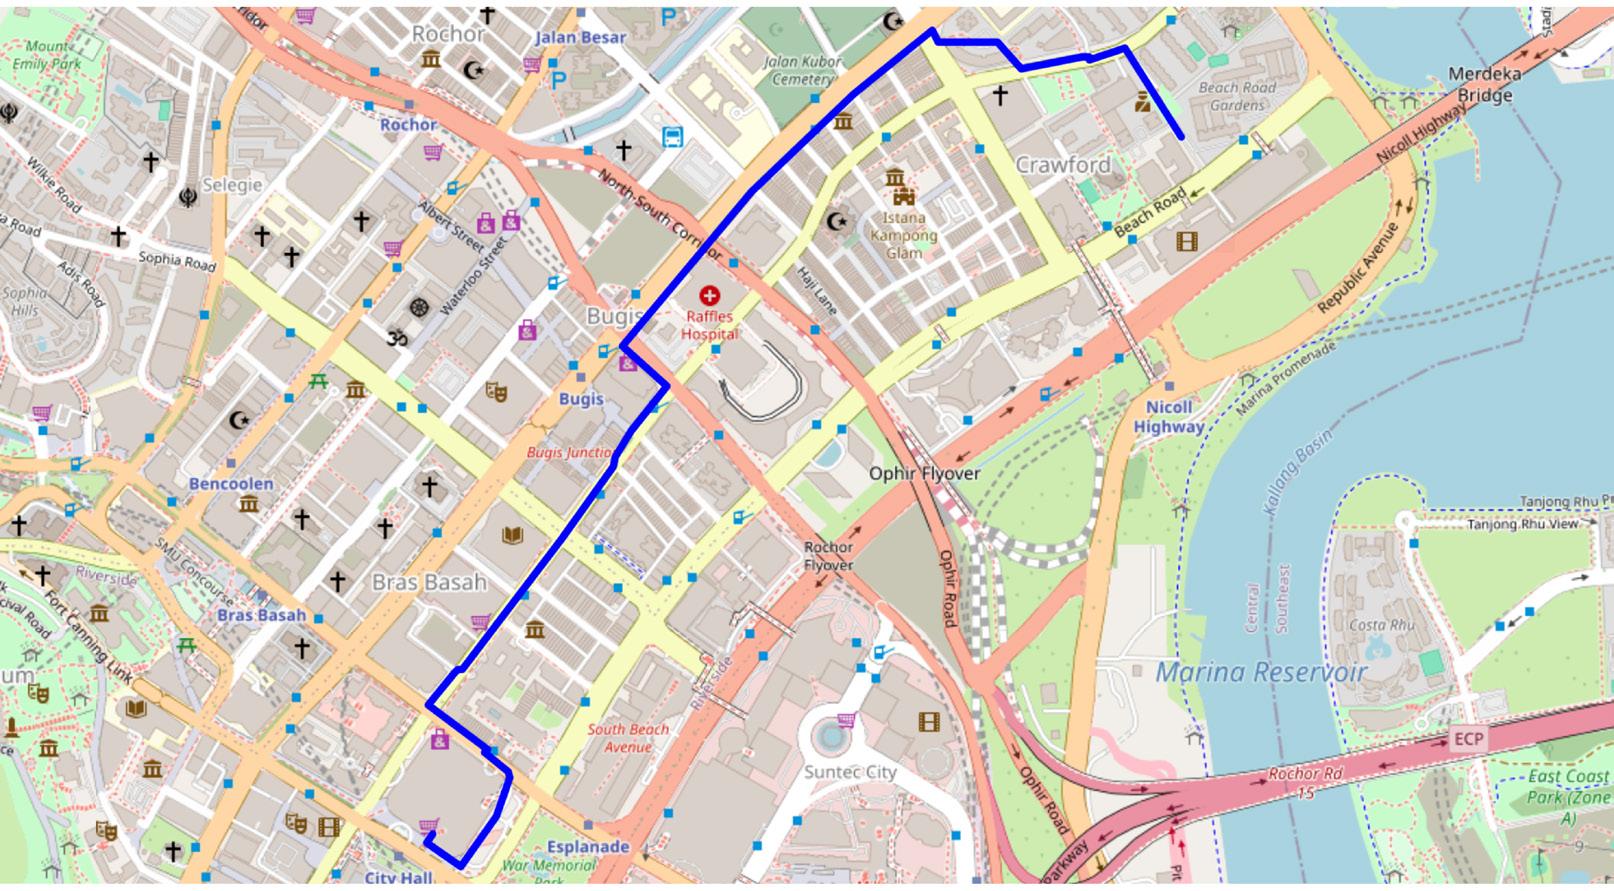
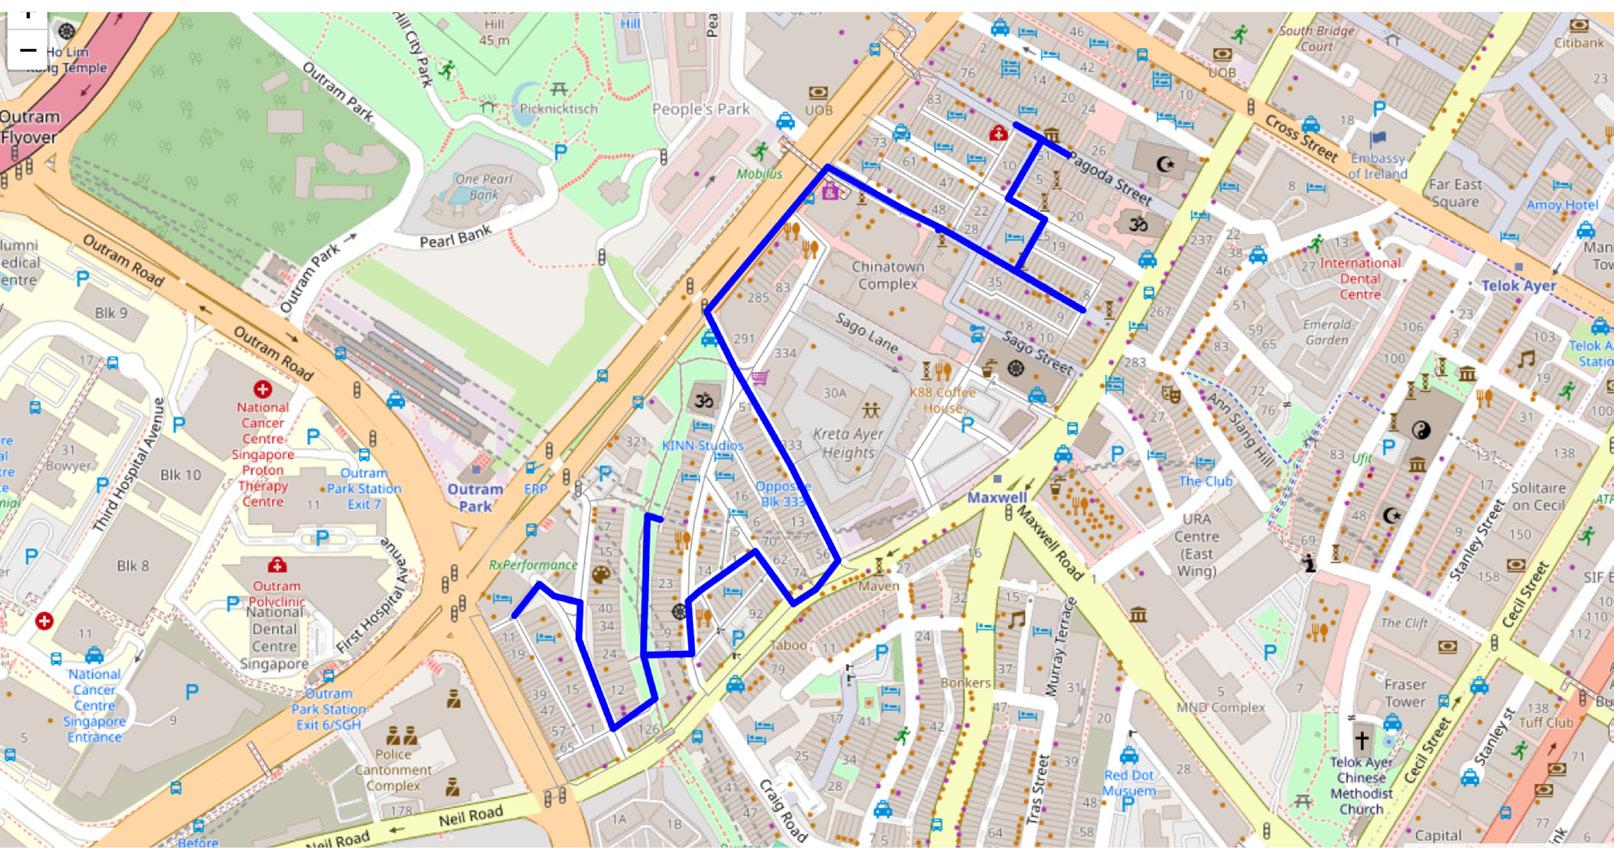
Final score distributions reveal critical differences between districts. Bugis has very few high-performing segments, indicating low shade, high PET, and wide roads with minimal pedestrian programming. Most segments cluster in the 0-0.15 range.
Chinatown exhibits a wide score range from low to very high, with more inherent climatic advantages and numerous segments exceeding 0.8 composite comfort.
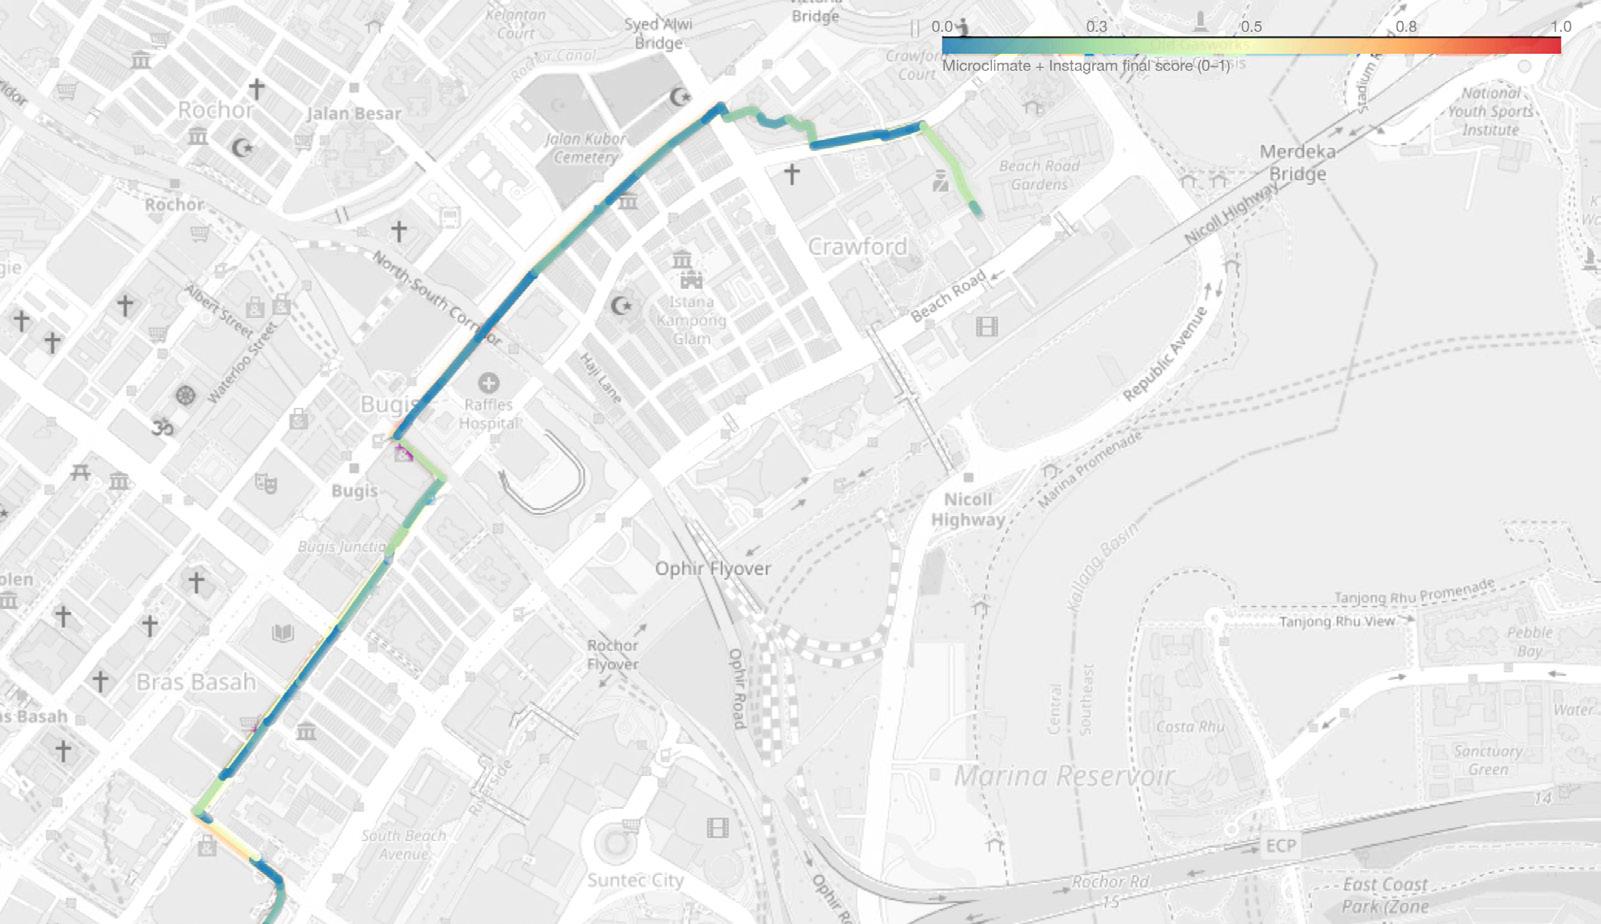
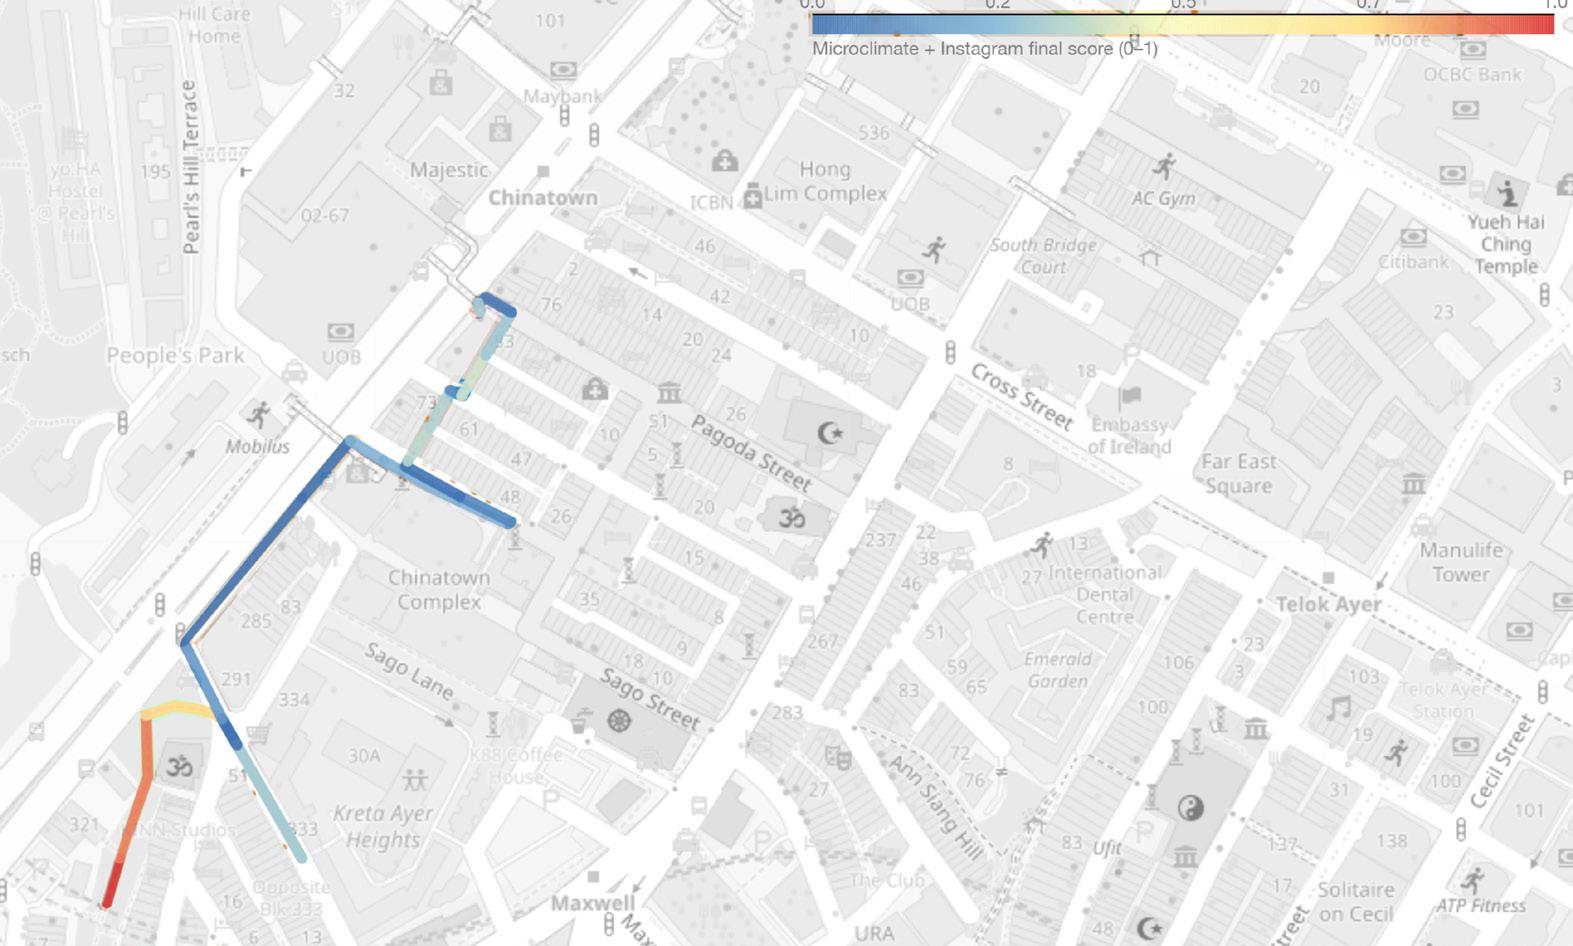
Segments with systemic weaknesses were translated into design prompts and processed through diffusion models. Generated visualizations illustrate multiple intervention strategies: continuous canopy structures that convert overheated arcades into comfortable walkways; layered tree planting that softens vehicle-dominated edges; micro-street activation in back lanes; and culturally expressive shading devices that improve thermal comfort.
These concept-level visualizations demonstrate how quantitative performance gaps can directly inform spatial design directions, bridging computational analysis with generative design practice.
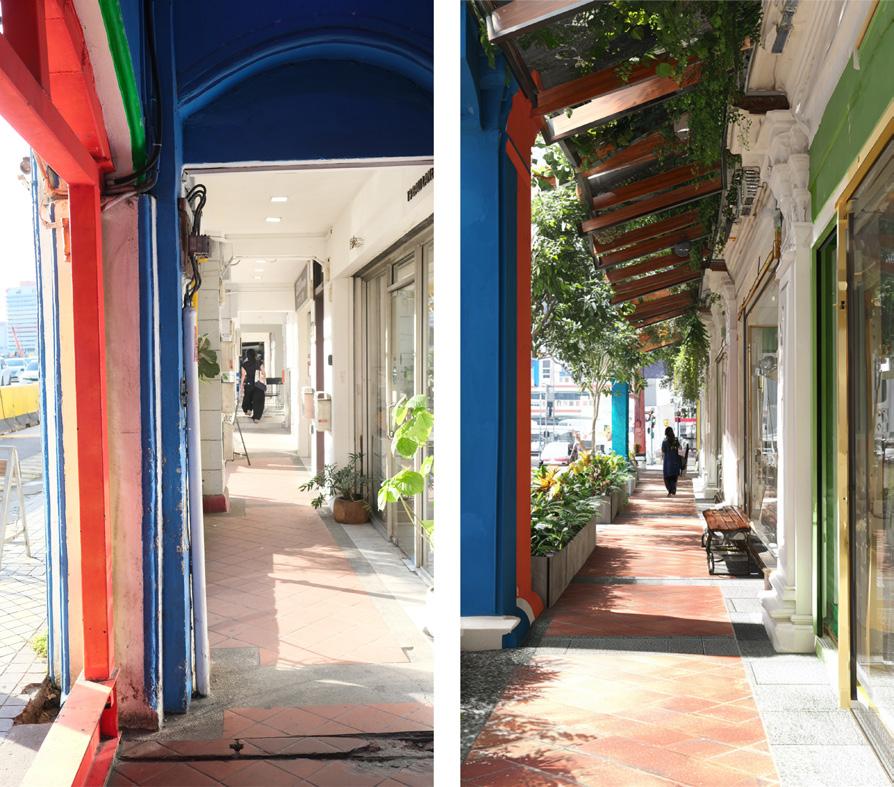
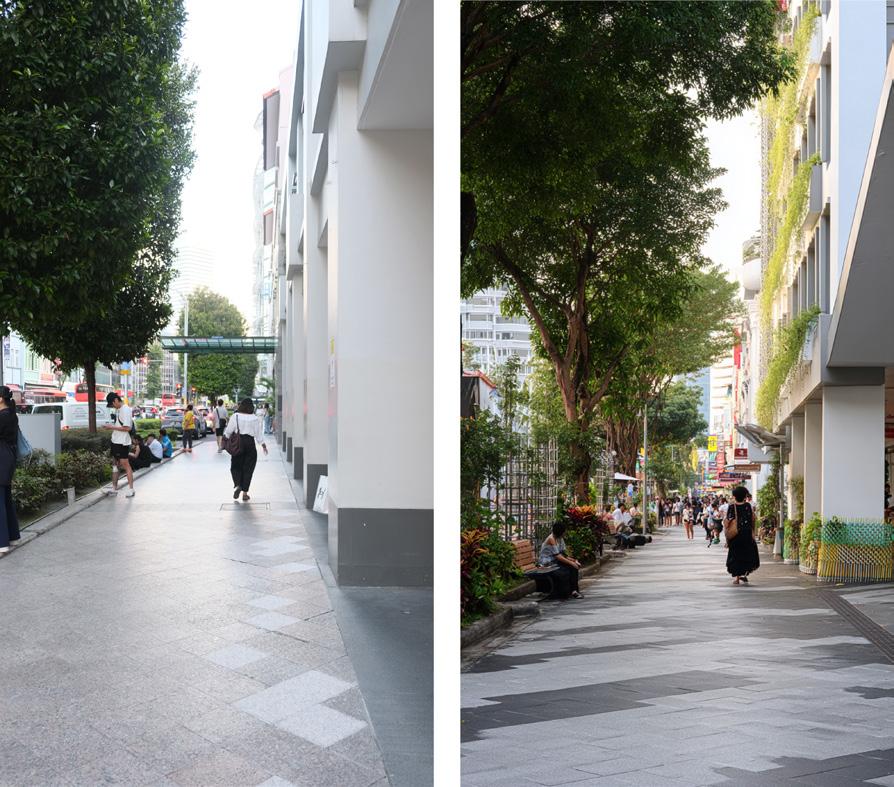
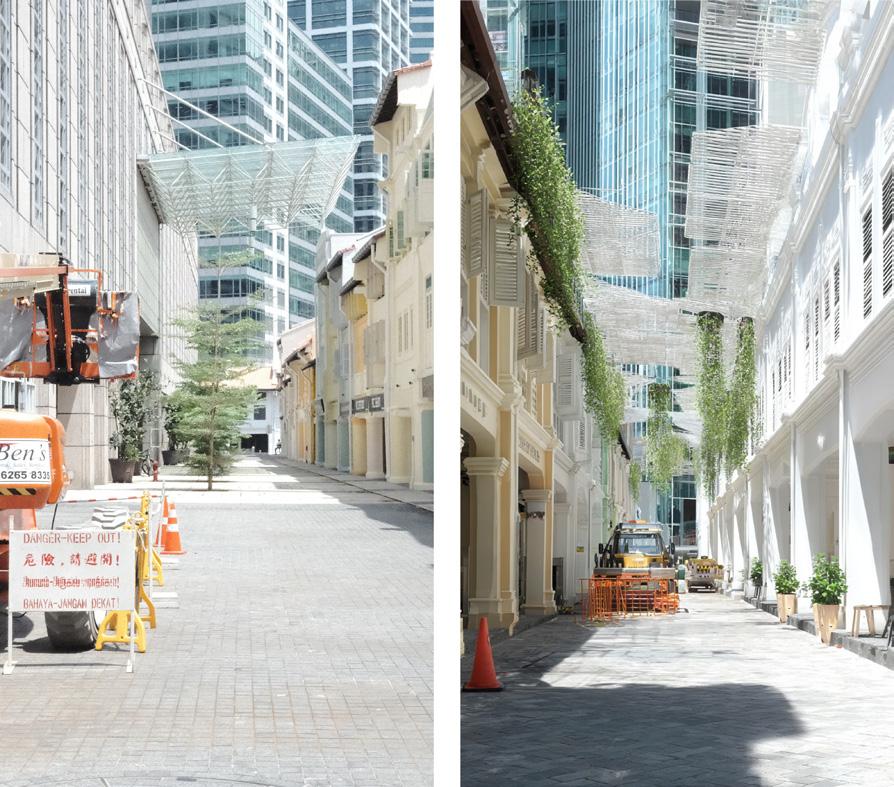
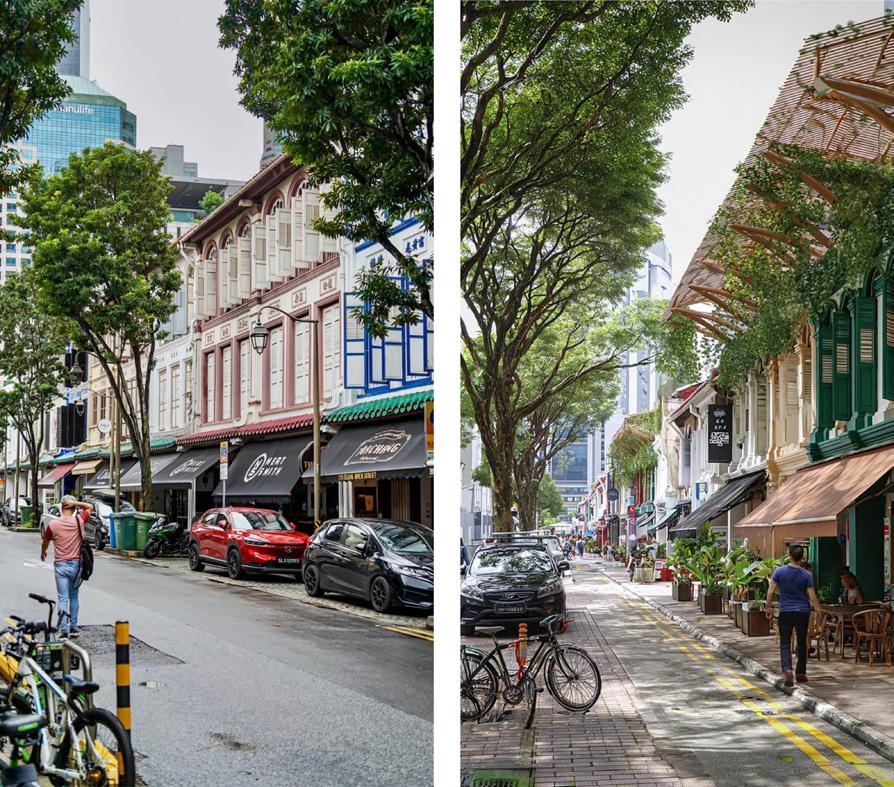
This study demonstrates a structured workflow integrating microclimate metrics, humanexperience indicators from social media, and AI-Assisted visualization to support climate-responsive streetscape design. By analyzing Bugis and Chinatown through shade fraction, PET estimation, composite scoring, and typology extraction, the project reveals consistent problem patterns: Bugis lacks adequate shading and experiences high thermal stress, while Chinatown demonstrates more resilient microclimate diversity.
The translation of quantitative issues into design-oriented prompts shows how datadriven diagnosis can directly inform spatial interventions. Diffusion-based image generation helps visualize concept-level
improvements such as continuous canopy shading, passive cooling retrofits, greener facades, and culturally expressive structures. The workflow illustrates how computational analysis and generative models can meaningfully complement early-stage urban design practice.
Apify. (2024). Instagram Scraper.
CADMapper. Building footprint and street network data extraction tool.
Hoppe, P. (1999). The physiological equivalent temperature - a universal index for the biometeorological assessment of the thermal environment. International Journal of Biometeorology, 43(2), 71-75.
OpenStreetMap Foundation. (2024). OpenStreetMap data and Overpass API.
Scikit-learn. (2024). Clustering and dimensionality reduction algorithms (DBSCAN, KMeans, PCA).
# KEYWORDS
Accessibility Index
Regenerative City
Clustering
Parametric Scenarios
Geospatial AI
Green Equity
HDB Singapore
# HIGHLIGHTS
• AI-enabled geospatial workflow merges HDB/SingStat, NParks/URA, and LTA datasets in SVY21 to compute accessibility-related indicators and diagnose spatial inequities across HDB estates.
• Combines K-means and DBSCAN clustering with a composite Accessibility Index; Random Forest validation shows distance-to-park is the dominant driver of accessibility outcomes.
• Tests three Python–Grasshopper intervention scenarios: pocket parks deliver the largest and most equitable ΔAI gains, cycling corridors provide moderate improvements, and short green links have minimal impact. PCA confirms outcomes are primarily distance-driven.
Urban greenery and bicycle infrastructure are two critical co-benefits of regenerative city design, responsible for reducing urban heat, enhancing liveability, and improving public health. However, their spatial distribution is often highly skewed, particularly across highdensity public-housing towns. The Centre for Liveable Cities (CLC, 2023) highlighted that future regenerative cities must integrate nature, health, and inclusion through datadriven planning.
Previous research has underscored how unequal green-space access aligns with socio-economic divides (Kabisch et al., 2021; Wolch et al., 2014), yet applications of AI in
spatial equity remain underexplored. This study develops an AI-enabled geospatial workflow that integrates GIS preprocessing, unsupervised learning (K-Means, DBSCAN), and a composite Accessibility Index to diagnose inequities and evaluate design interventions across Singapore's HDB estates. Three parametric scenarios—pocket-park insertion, cycling-corridor enhancement, and green-link connectors—were generated using a PythonGrasshopper workflow and evaluated through changes in accessibility.
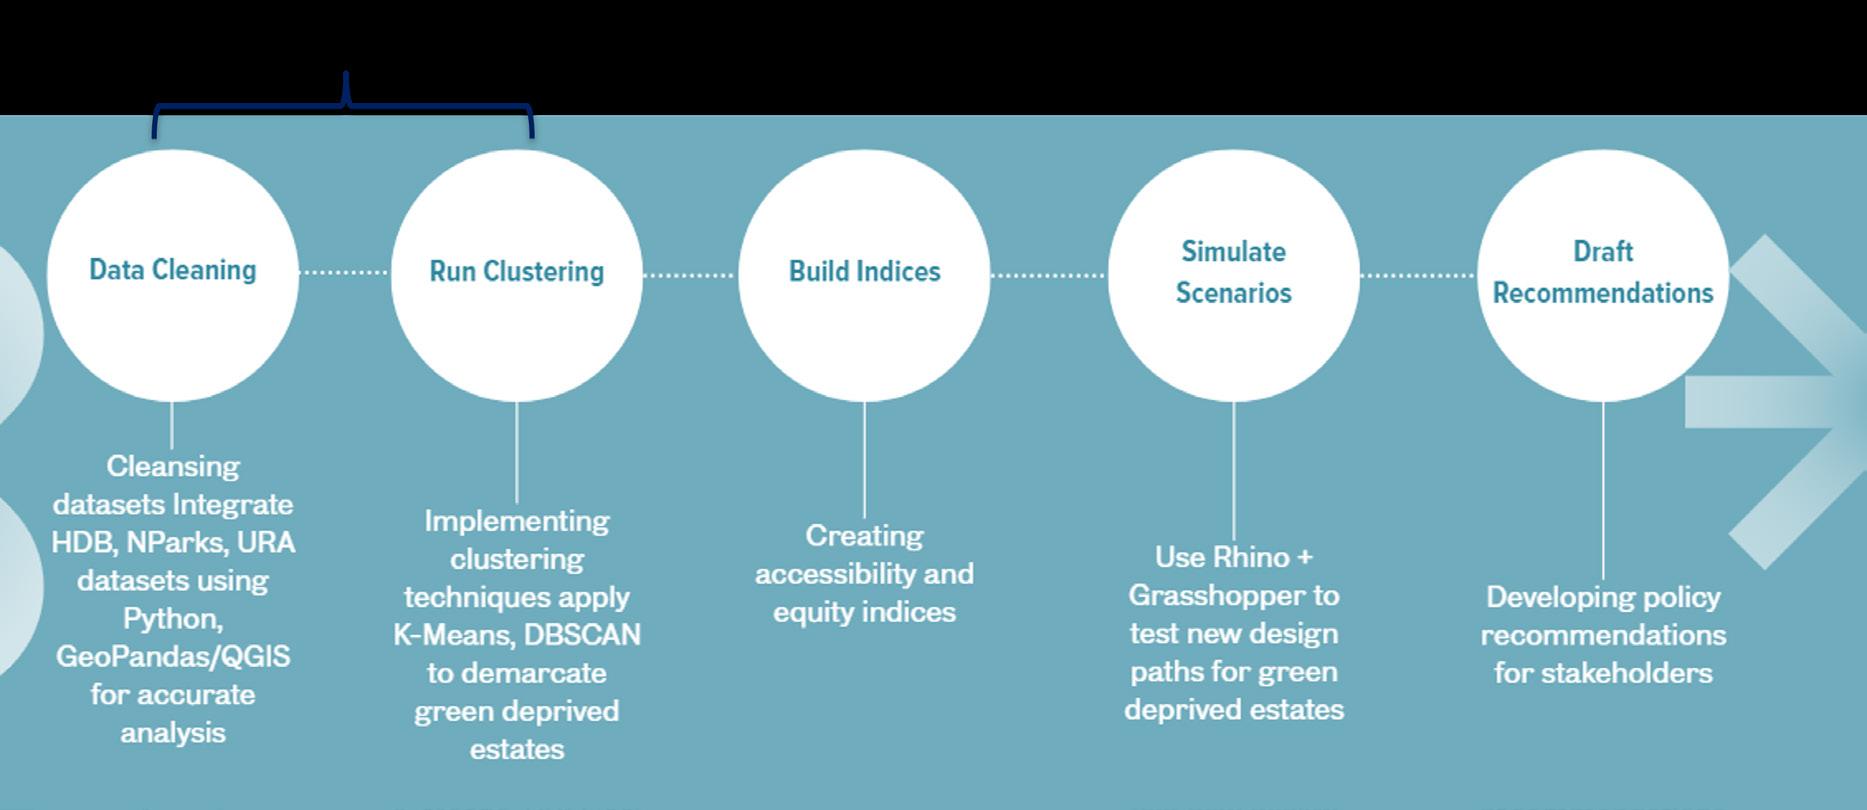
The study integrates publicly available datasets from HDB Property Information, SingStat Census Data, URA/NParks green-area polygons and park locations, and LTA bicycle-path networks. Each HDB estate was geocoded and assigned three primary variables: Green Area Ratio, Population Density, and Distance to Nearest Park. All datasets were transformed to the SVY21 coordinate reference system (EPSG:3414) for compatibility with Rhino and Grasshopper
Correlation analysis revealed a moderate negative correlation between greenery and density, indicating a structural trade-off between compactness and ecological presence. The correlation heatmap and summary statistics are shown in Figure 2.
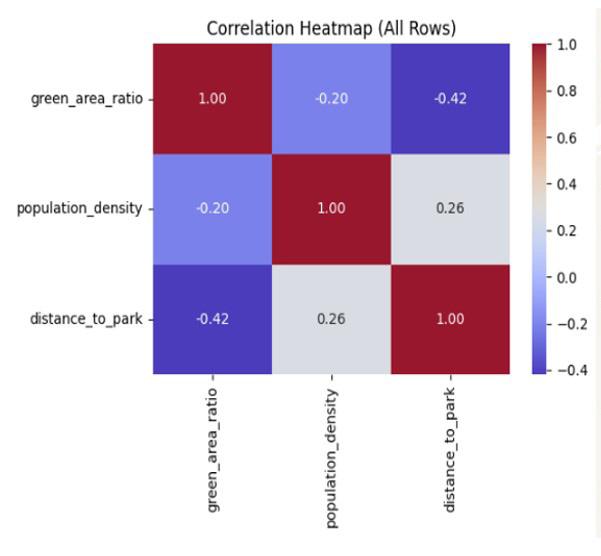
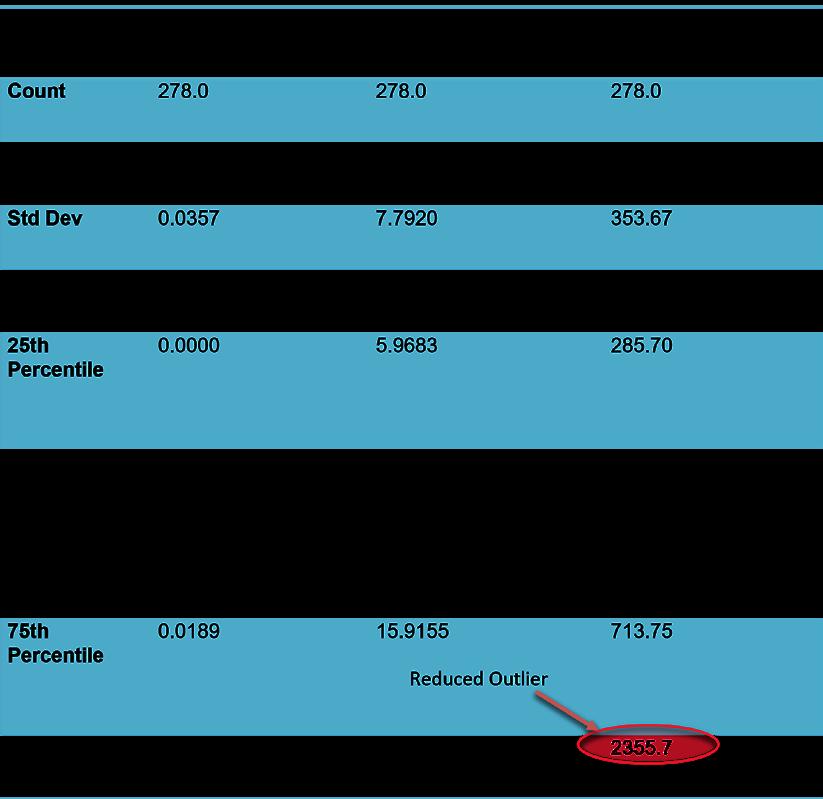
Figure 2. Correlation heatmap and summary statistics of critical indicators
Three scenarios were designed to measure micro-scale urban planning adjustments: Scenario A introduces pocket parks (60x60 m) in underserved areas; Scenario B establishes cycling corridor enhancements connecting estates to the Park Connector Network; and Scenario C adds green links of up to 150 metres to bridge HDB buildings to nearest parks. The GeoJSON-Grasshopper workflow for parametric design is shown in Figure 3.
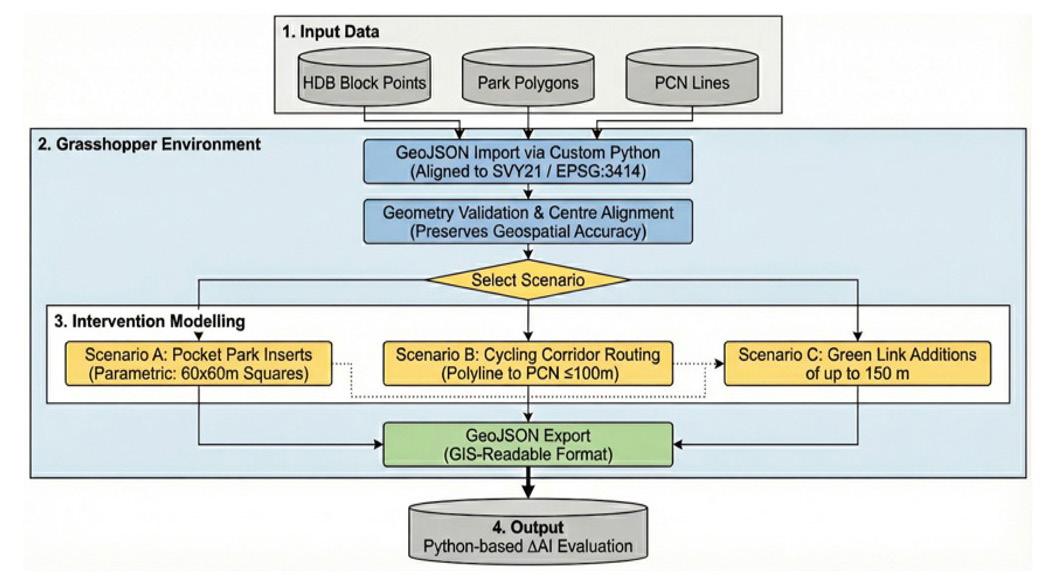
Figure 3. GeoJSON-Grasshopper workflow for parametric scenario construction
K-Means clustering with optimal k=4 revealed clear differentiation between mature, dense estates with low greenery and new towns with integrated park networks.
DBSCAN further identified outlier estates representing either ultra-green areas or hyper-dense conditions at critical extremes.
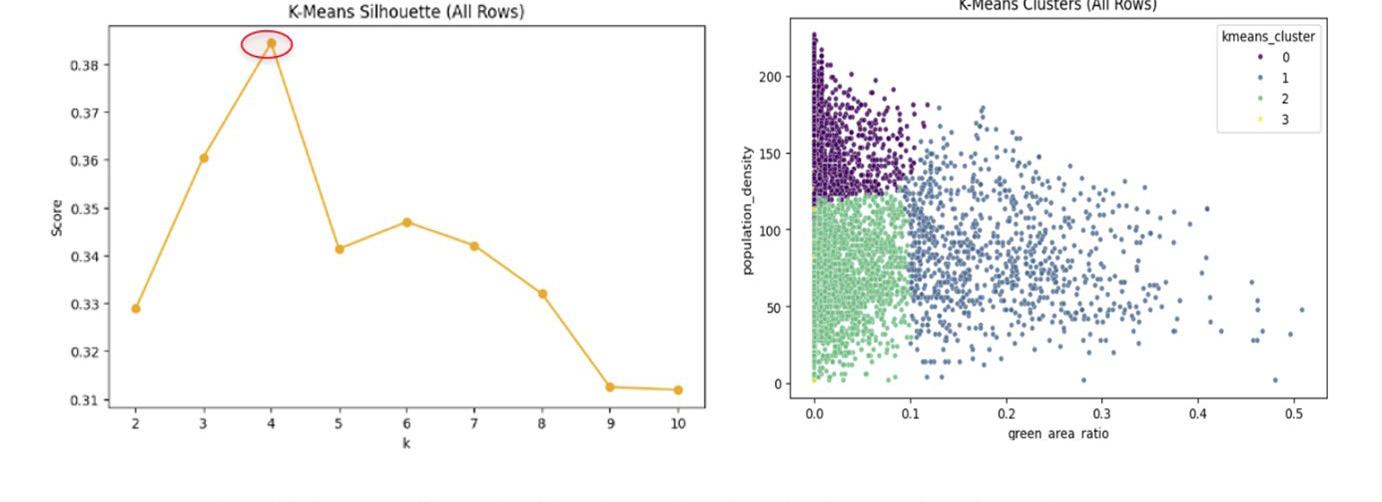
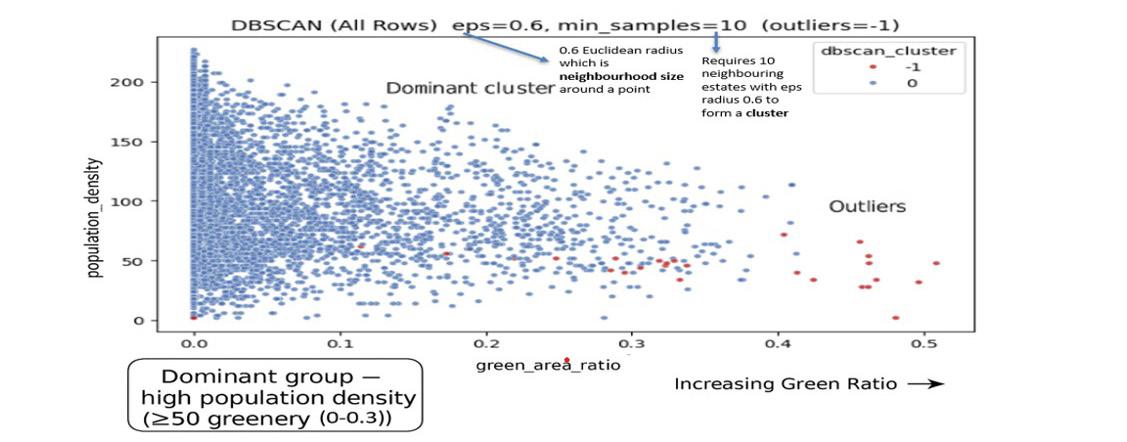
5. DBSCAN clustering identifying outlier and extreme-condition estates
The Random Forest model confirmed that distance_to_park contributes almost half of the Accessibility Index variance, achieving an R-squared of 0.99. This validates the distance-driven nature of accessibility outcomes in Singapore's housing estates.
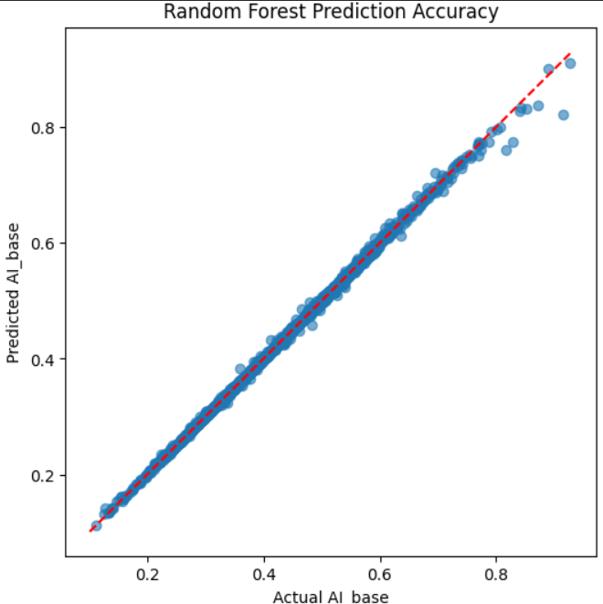
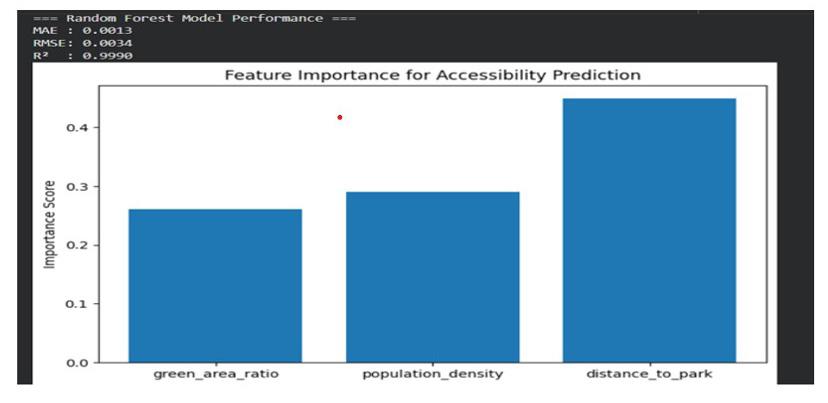
Scenario A (Pocket Parks) yielded the strongest and most equitable accessibility improvements, driven by direct reductions in distance-to-park. Scenario B provided moderate corridor-based gains, while Scenario C demonstrated minimal system-wide impact. PCA confirms that accessibility outcomes are primarily distance-driven rather than mobility-driven.
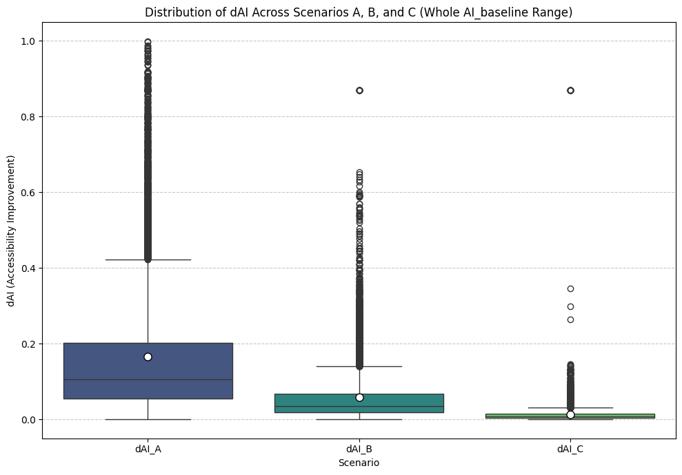
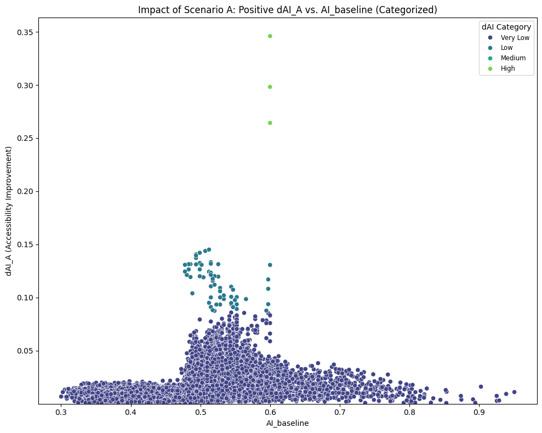
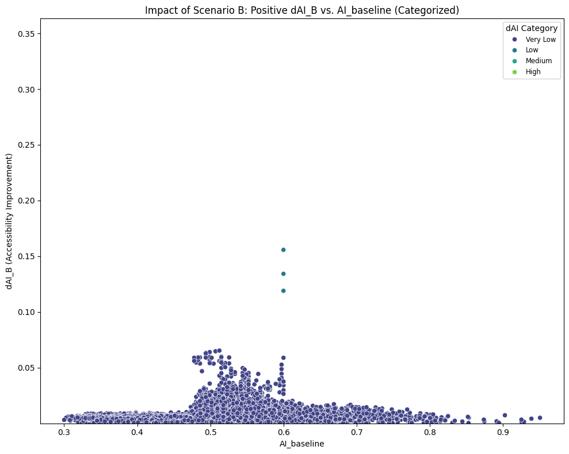
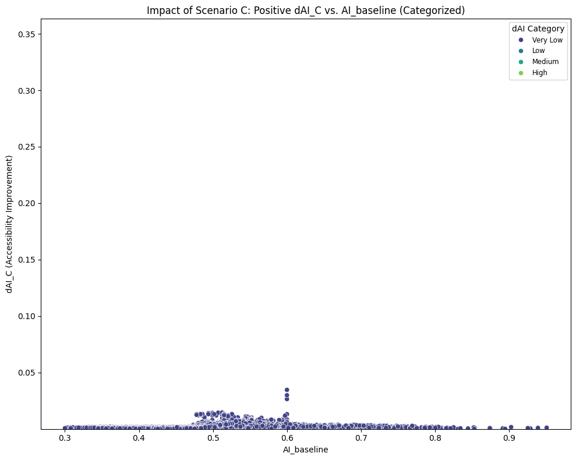
Figure 8. Scenario impact comparison: accessibility improvements across interventions
PCA analysis confirmed that the primary driver of accessibility variance is distancerelated rather than mobility-related, reinforcing the effectiveness of interventions that directly reduce physical proximity to green spaces.
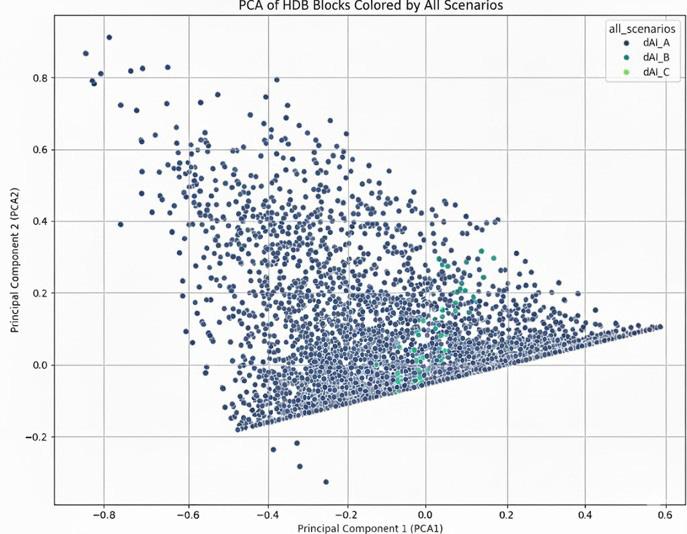
This study demonstrated how geospatial AI, combined with parametric design, can guide regenerative and people-centred urban planning. The AI-enabled workflow successfully diagnosed spatial inequities in green-space access across Singapore's HDB estates and evaluated three intervention scenarios through changes in the Accessibility Index. Scenario A (Pocket Parks) emerged as the most effective strategy, yielding the strongest and most equitable improvements.
The findings reinforce that accessibility outcomes are primarily distance-driven, suggesting that targeted micro-scale interventions can achieve meaningful impact without large-scale infrastructure investment. Future work should incorporate mobility-
Centre for Liveable Cities (CLC) (2023). Regenerative cities: integrating nature, health, and inclusion through data-driven planning. Singapore.
Kabisch, N. et al. (2021). Unequal green-space access and socio-economic divides in urban environments. Environmental Research Letters.
Wolch, J. R. et al. (2014). Urban green space, public health, and environmental justice. Landscape and Urban Planning, 125, 234–244.
sensitive metrics, seasonal microclimate effects, demographic weighting, and cost-based optimization to enhance the framework's practical applicability for urban planners and policymakers.
We would like to thank Kajima The GEAR for hosting the students, and acknowledge our guest speaker Bryan Ong from Open Government Products for sharing valuable industry insights.

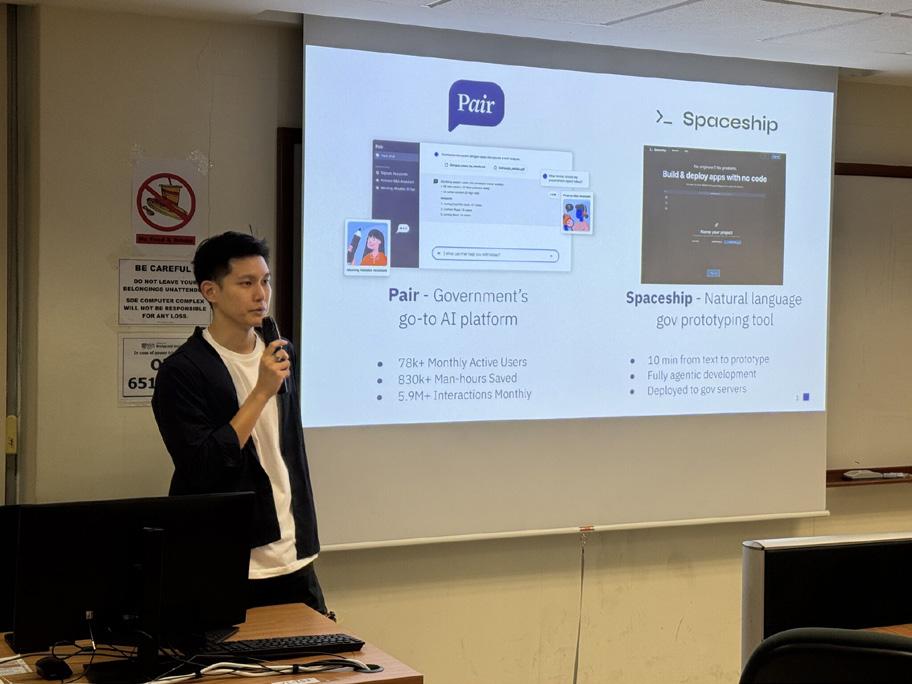
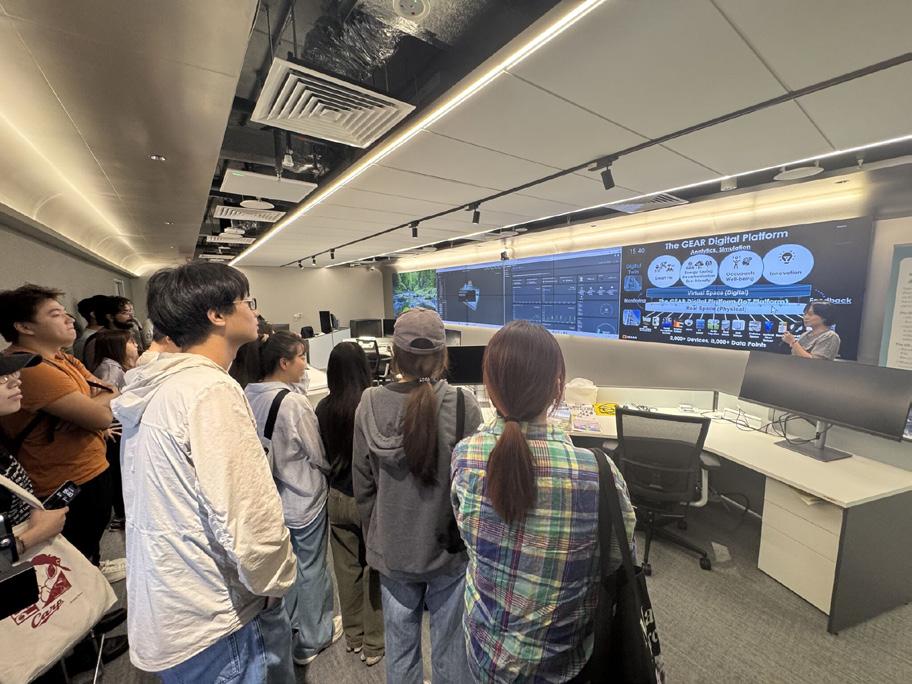
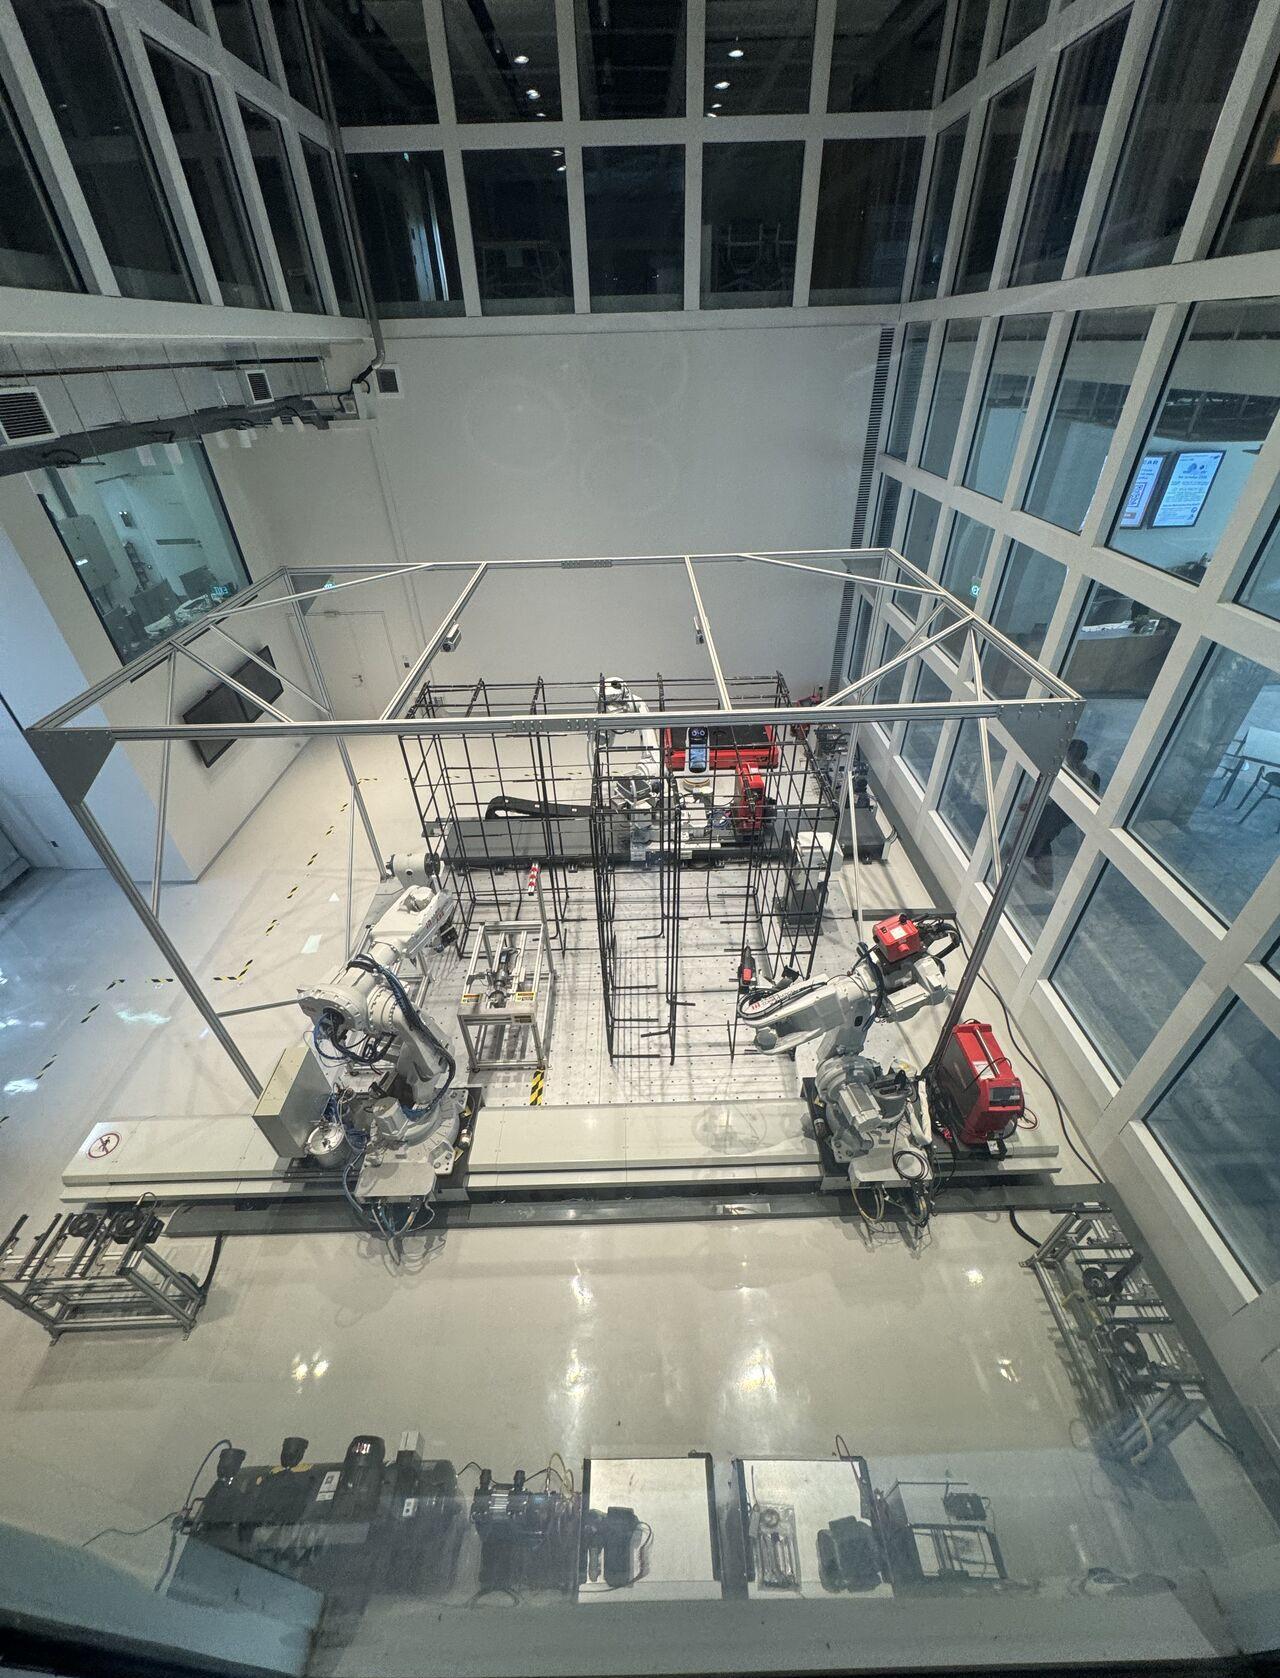
©. All rights reserved. No part of this book may be reproduced in any form without prior written permission.
Text and Images © 2025 by the respective authors.
The editors have attempted to acknowledge all sources of imags used and apologize for any errors or omissions.