City of Independence

City of Independence

ACKNOWLEDGEMENTS
CHAPTER ONE EXECUTIVE SUMMARY
1.2 PLAN FRAMEWORK: VISION TO ACTION
1.3 PHASED IMPLEMENTATION: A DISCIPLINED FIVE-YEAR APPROACH
CHAPTER TWO – COMMUNITY PROFILE
2.1 DEMOGRAPHICS
2.2 BENCHMARK ANALYSIS
2.3 KEY LEADERSHIP AND FOCUS GROUP INTERVIEWS
2.4 COMMUNITY SURVEYS
CHAPTER THREE – EXISTING AND FUTURE PARKS, FACILITIES, AND AMENITIES
3.1 PARKS AND OPEN SPACE CONDITIONS
3.2 PARK CLASSIFICATIONS
3.3 LEVEL OF SERVICE ANALYSIS
3.4 MAPPING
CHAPTER FOUR – PROGRAMS, SERVICES, AND OPERATIONS
4.1 RECREATION TRENDS ANALYSIS
4.2 RECREATION PROGRAM ANALYSIS
4.3 OPERATIONAL AND MAINTENANCE REVIEW
CHAPTER FIVE – FINANCIALS
5.1 FUNDING STRATEGIES
5.2 CAPITAL IMPROVEMENT PLAN
CHAPTER SIX – MASTER PLAN IMPLEMENTATION
6.1 STRATEGIC ACTION PLAN
CHAPTER SEVEN - CONCLUSION
APPENDIX A: COMMUNITY SURVEY
APPENDIX B: YOUTH SURVEY
APPENDIX C: PARK AND FACILITY ASSESSMENTS
APPENDIX D: PROGRAM DEVELOPMENT WORKSHEET
APPENDIX E – NATIONAL RECREATION TRENDS
APPENDIX F: PROGRAM LIFECYCLES
APPENDIX G: PROGRAM CLASSIFICATION
APPENDIX H: ANCILLARY SERVICES
APPENDIX I: MAINTENANCE STANDARDS
APPENDIX J: LEVEL OF SERVICE STANDARDS
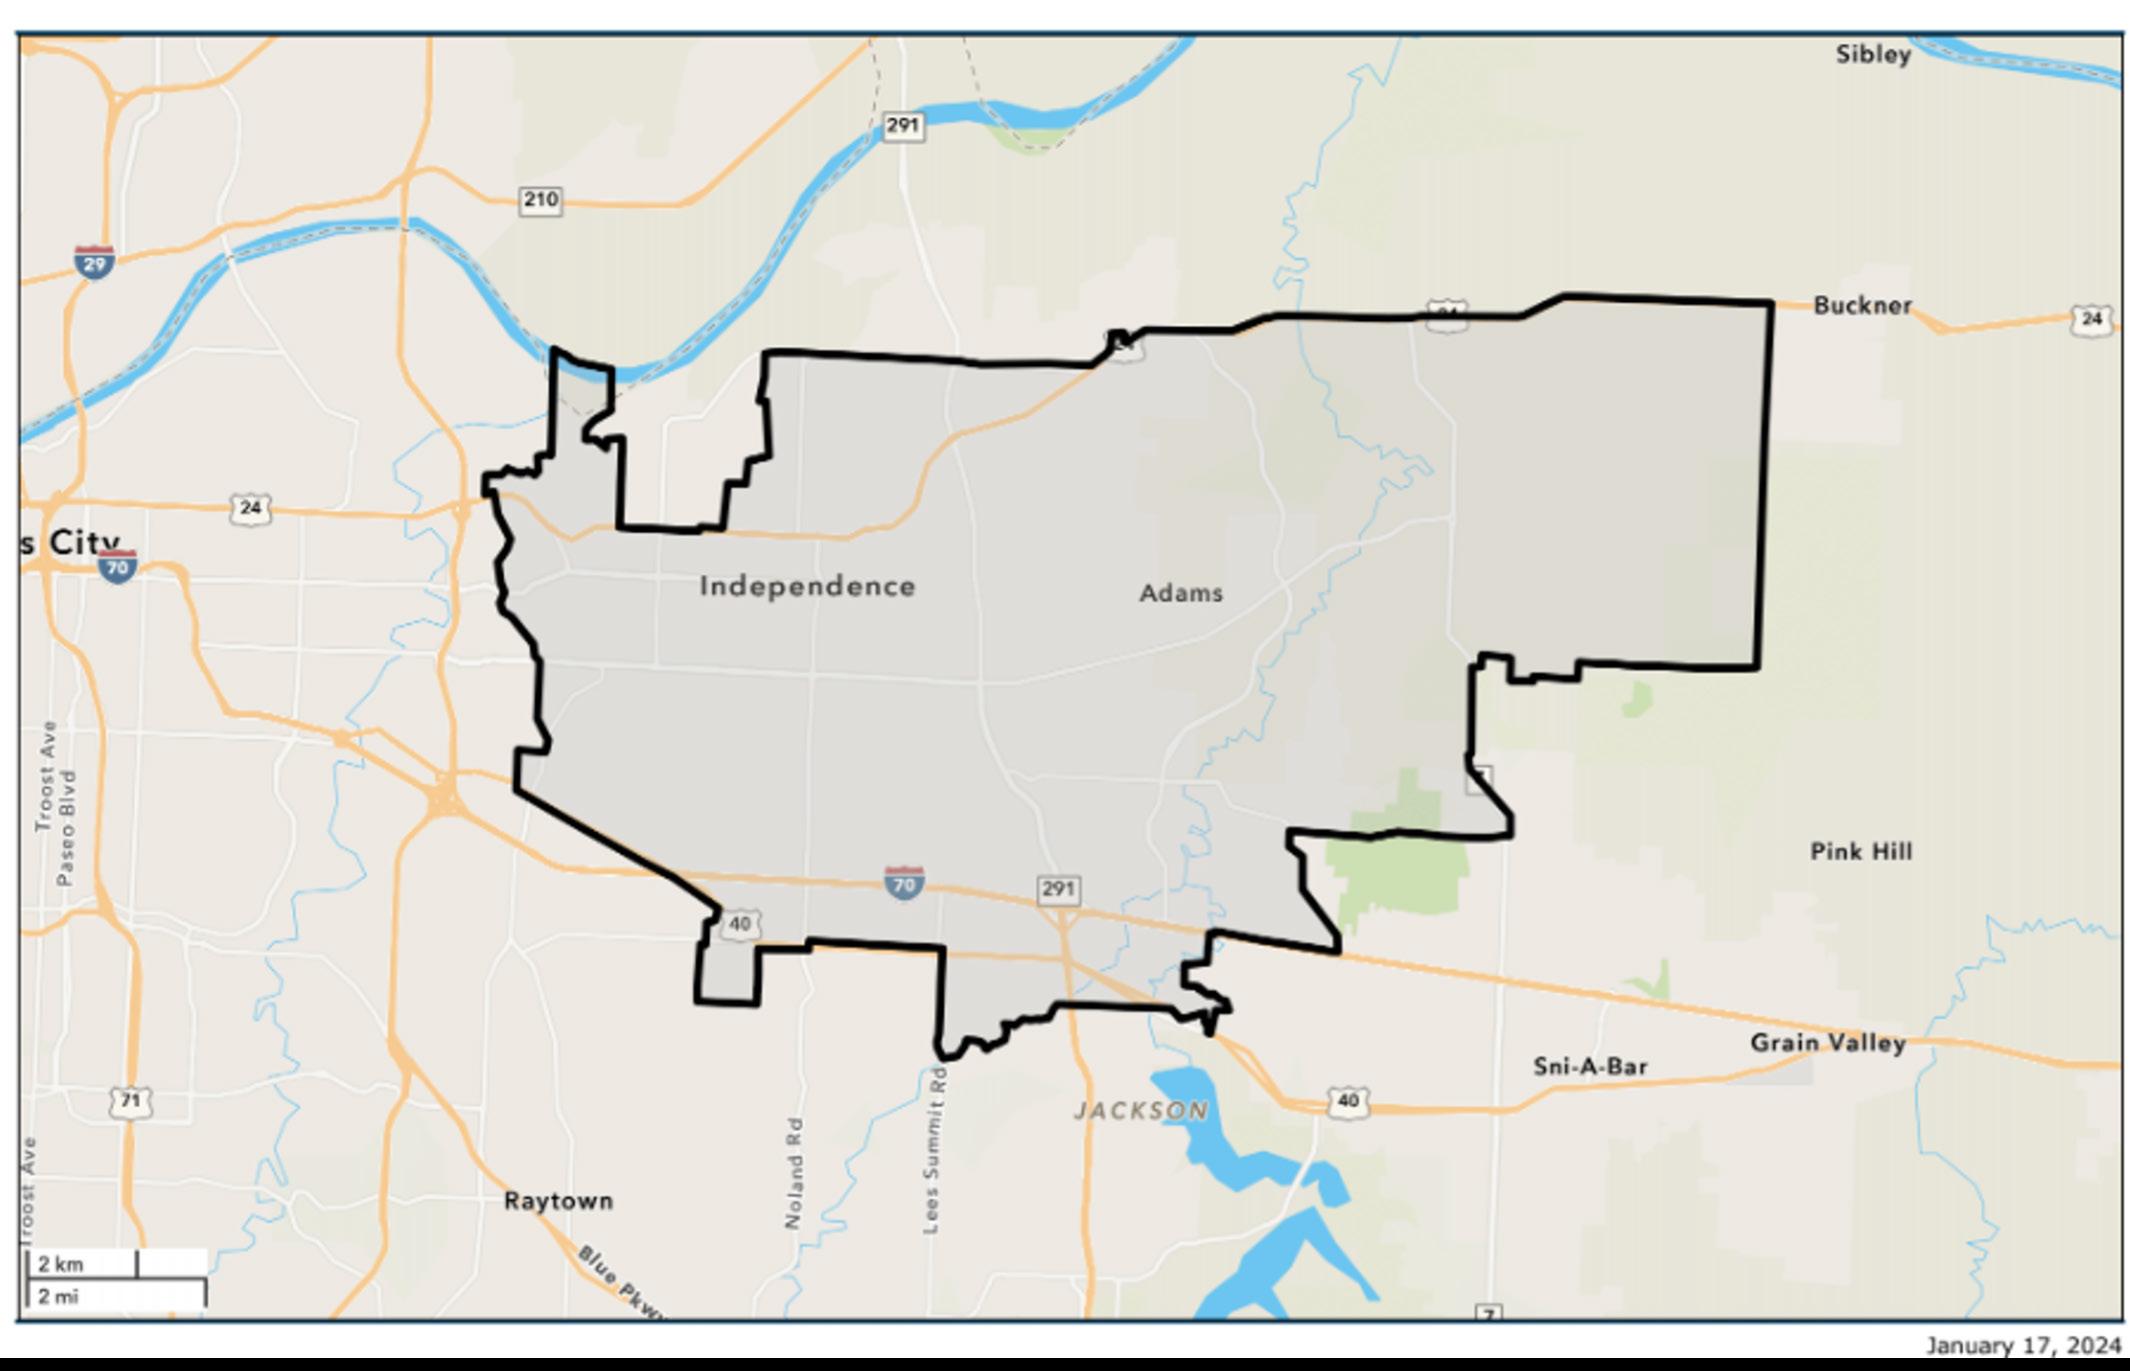
Figure 1 Independence City Boundaries
Figure 2 Total Population of Independence
Figure 3 Total Number of Households
Figure 4 Independence Population by Age Segments
Figure 5 Race
Figure 6 Hispanic Population
Figure 7 Income Characteristics
Figure 8 Comparative Income
Figure 9 Independence Populations: East and West
Figure 10 Population Density
Figure 11 Total Trail Mileage Comparison
Figure 12 Total Number of Fields and Courts
Figure 13 2025 Per Capita Revenue
Figure 14 Total FTEs
Figure 15 NRPA Metrics - Core Programs
Figure 16 Priority Investment Ratings: Facilities and Amenities
Figure 17 Priority Investment Rating: Programs
Figure 18 Youth Survey - Communications and Marketing
Figure 19 Youth Survey - Participation in programs
Figure 20 Youth Survey - Activities Youth would like to learn more about
Figure 21 Youth Survey - Favorite things to do at a park
Figure 22 Youth Survey - Who youth visit parks with
Figure 23 General Sport Market Potential Index
Figure 24 Fitness Market Potential Index
Figure 25 Outdoor Activities Market Potential Index
Figure 26 Commercial Recreation Market Potential Index
Figure 27 Recreation Program Assessment Snapshot – Data showing the status of current IPR programming
Figure
Figure
Figure 32 Ages
Figure 33 Similar recreation providers in Independence
Figure 34 MacMillan Matrix for program investment decisions
Figure 35 Example use of MacMillan Matrix for Independence programming
Figure 36 Building organizational capacity
Figure 37 Pricing strategies currently used for core program areas
Figure 38 Total costs for the program
Figure 39 Recommended cost recovery targets based on service classifications
Figure 40 Total Full Time Equivalent Comparison between
Figure
Figure 42 Active vs. Nonactive Trend
Figure 43 Total Core Actives
Figure 44 Participation by Generation
Figure 45 General Sports Participatory Trends
Figure 46 General Sports Participatory Trends, Continued
Figure 47 General Fitness Participatory Trends
Figure 48 General Fitness Participatory Trends, Continued
Figure 49 Outdoor/Adventure Participatory Trends
Figure 50 Water Sports/Activities Participatory Trends
Figure 51 Ancillary service participation and financial data provided by Independence staff
Table 1 City Benchmark Information
Table 2 Trail Mileage
Table 3 Recreation and Aquatic Facilities
Table 4 Revenue and Expenses
Table 5 Capital Budget
Table 6 Annual Membership Rates
Table 7 Staff (Full Time Equivalents)
Table 8 Contractors used for parks and recreation operations
Table 9 Core Programs
Table 10 Recreation Program Strengths, Challenges, and Opportunities
Table 11 Recreation program focus areas
Table 12 Recommended core program areas and outcomes
Table 13 Example of tiered approach on decision making for community events
Table 14 Gaps and overlaps for current core program areas
Table 15 Core program areas pricing recommendations
Table 16 Marketing and Communications Analysis
Table 17 Plans, Policies, and Procedures
Table 18 Sustainable Projects
Table 19 Expanded Services Projects
Table 20 Visionary Projects
Table 21 Lifecycle Stages Of Programs
Table 22 Arts & Culture
Table 23 Continuing Education / Life Skills
Table 24 Rentals
Table 25 Nature Programs
Table 26 Senior Programs
Table 27 Special Events
Table 28 Sports & Wellness
Table 29 Ancillary Service Participation and Financial Data Provided by Independence Staff
Table 30 Level of Service Standard
Mayor Rory Rowland
Councilmember, Mayor Pro Tem, 1st District John Perkins
Councilmember, At-large Jared Fears
Councilmember, At-large Bridget McCandless
Councilmember, 2nd District Brice Stewart
Councilmember, 3rd District Heather Wiley
Councilmember, 4th District Jennie Vaught
Diane Kyser, Chair
Kevin Baird
Kay Douglas
Jana Evans
Paula Martin
Pamela Jean Smith
Katherine Leiker
Lisa Reynolds, Interim City Manager
Charlie Dissell, Assistant City Manager
Morris Heide, Director of Parks and Recreation
Mike Hicks, Assistant Director – Parks, Facilities, & Grounds
Erika Geering, Assistant Director - Recreation Services
Jennifer Kim, Assistant to the Director
Kimberle Franks, Fiscal Administrator
Thank you.
Independence’s parks and recreation system is a valued public asset that contributes to quality of life and community identity. However, years of deferred investment, aging infrastructure, and limited organizational capacity have constrained the system’s ability to fully meet current and future needs.
This Parks and Recreation Master Plan provides a clear, fiscally responsible roadmap to modernize and elevate parks and recreation services over the next five years. The plan is implementation-driven, aligning priorities, funding strategies, and standardized practices to ensure progress is achievable and transparent to the community.
The guiding intent of this plan is to protect existing assets, invest strategically, expand access, and position the department to deliver consistent, high-quality services to Independence residents.
The Master Plan is structured around five strategic pillars, each supported by phased actions, funding strategies, and performance expectations. Together, they establish a practical path for Independence Parks and Recreation to transition to a revitalized, forward-looking system.
PROTECTING PUBLIC INVESTMENT FIRST
Independence will shift from deferred maintenance and reactive investment to a proactive, lifecycle-based approach that improves safety, usability, and community confidence in parks and facilities. Implementation focus areas include:
• An intentional focus on maintaining and modernizing existing parks and facilities before expanding the system.
• A shift from reactive repairs to planned, lifecycle-based reinvestment.
• Prioritizing underutilized spaces for reinvestment rather than new construction where feasible.
SERVING RESIDENTS WHERE THEY ARE TODAY
Programs will be right-sized, inclusive, and responsive to community priorities, focusing on quality over quantity while addressing service gaps for youth, seniors, families, and young adults. Recreation services will focus on these key areas:
• Focus on core community needs, including youth, seniors, families, and underserved populations.
• Emphasize quality and access rather than program volume.
• Avoid duplicating services offered by other sectors by prioritizing instructional, inclusive, and life-skills programming particularly for youth and seniors.
Parks will function as everyday community spaces, connected physically and socially to the neighborhoods they serve. This can be accomplished through these key focus areas:
• Prioritize investments in underserved neighborhoods, particularly the east-side of Independence.
• Improve safety, visibility, and comfort in parks through Crime Prevention Through Environmental Design (“CPTED”) and universal design principles, increased staffing, and community partnerships.
Revitalization requires more than new facilities and programs, it requires a modern, wellsupported organization capable of consistent service delivery and continuous improvement. To accomplish this, several key focus areas have been identified for the next five years:
• Modernize internal systems, policies, and staffing alignment for consistent oversight and implementation.
• Ensure the department has the capacity to deliver what the community expects through additional staffing, enhanced resources, and strategic community partnerships.
• Shift from informal practices to standardized operations for increased accountability and improved performance.
• Continuously monitor the implementation of master plan strategies through the action plan and report on progress regularly though a scorecard that explains successful outcomes that are accomplished.
Independence will manage parks and recreation with a business-minded approach that balances affordability and long-term financial health. Also, Independence’s parks, trails, and recreation facilities play a measurable role in attracting employers, retaining residents, and strengthening redevelopment areas. Independence Parks and Recreation should position itself as an integral partner in Independence’s overall economic development strategy. By intentionally aligning park investments, programming, and placemaking efforts with economic development goals, the City will benefit from expanded revenue capacity creating a beneficial cycle of reinvestment. Successful outcomes of the key focus areas listed below include greater financial resilience and public trust in reinvestment decisions for the parks and recreation system.
• Manage parks and recreation with a business-minded framework, consistently tracking financial performance and community impact of parks and recreation services.
• Diversify earned income funding sources and explore public-private partnerships and sponsorships.
• Clearly communicate the value and cost of services to the public.
• Position Independence, through a revitalized parks and recreation system and a more competitive position for business development, to attract young professionals and families. Reinvest an appropriate portion of economic gains back into the park system.
• Align park improvements with future redevelopment efforts in key areas of the City.
This parks and recreation master plan is intentionally designed to ensure each pillar and its strategies have clear actions that support the overall vision of the parks and recreation system. Every future investment of public dollars should contribute to the long-term revitalization of the park system.
By aligning strategy with implementation, Independence will be positioned not just to maintain its parks and recreation system, but to elevate it, modernize it, and ensure it remains a cornerstone of community quality of life for decades to come.
Finally, the master plan includes a phased implementation plan that will allow community leadership to consistently evaluate the progress of each master plan strategy, adjust investments accordingly, and maintain fiscal control during all implementation phases. The phases have been summarized below:
SHORT-TERM (1-2 YEARS):
Establish foundational policies, begin planning for long term enhancements, introduce priority programs and services, and accomplish early visible improvements.
MID-TERM (3-5 YEARS):
Scale priority programs to public demand, reinvest in key facilities through additional community engagement and data-driven planning practices, and strengthen partnerships for additional capacity.
LONG-TERM (5+ YEARS):
Sustain improvements, adapt to growth, and position the system for future investment.
2.1.1
As a part of the Parks and Recreation Master Plan, the demographics of Independence (“City”) were studied to obtain information about the residents to gain a better understanding of population size, age distribution, household income, and cultural diversity. This data is to assist the City and Parks and Recreation as they consider programs, activities, and the other factors that can influence parks and recreation services in the City.
This analysis is reflective of the City’s total population and its key characteristics such as age segments, race, ethnicity, income levels, recreational activities and trends. It is important to note that future projections are based on historical patterns.


DEMOGRAPHIC ANALYSIS


The U.S. Census Bureau and the Environmental Systems Research Institute (ESRI), two of the largest research and development organizations dedicated to Geographical Information Systems (GIS) specialize in population projections and market trends. All data was acquired in September 2025, and reflects actual numbers as reported in the 2020 Census as well as estimates for 2020 and 2025 obtained by ESRI. Straight line linear regression was utilized for 2035 and 2040 projections.
The City’s boundaries shown below were utilized for this demographic analysis (Figure 1).
The graph below (Figure 2) portrays the population of the City and the annual population growth rate represented by orange markers for selected years based on census data, estimates, and future projections.
In 2010, the population was 116,830, increasing to 123,028 by the 2020 Census, with an annual growth rate of 0.53%. This growth became negligible by 2025, with the population reaching 123,102 and the annual growth rate dropping to 0.02%. However, the 2030 projection shows a population of 122,789, accompanied by a negative growth rate of -0.05%, indicating a slight population decrease. By 2035, the population is expected to rebound to 125,706, with a stronger growth rate of 0.48%. Finally, by 2040, the population is projected to reach 127,258, with a more modest growth rate of 0.25%.
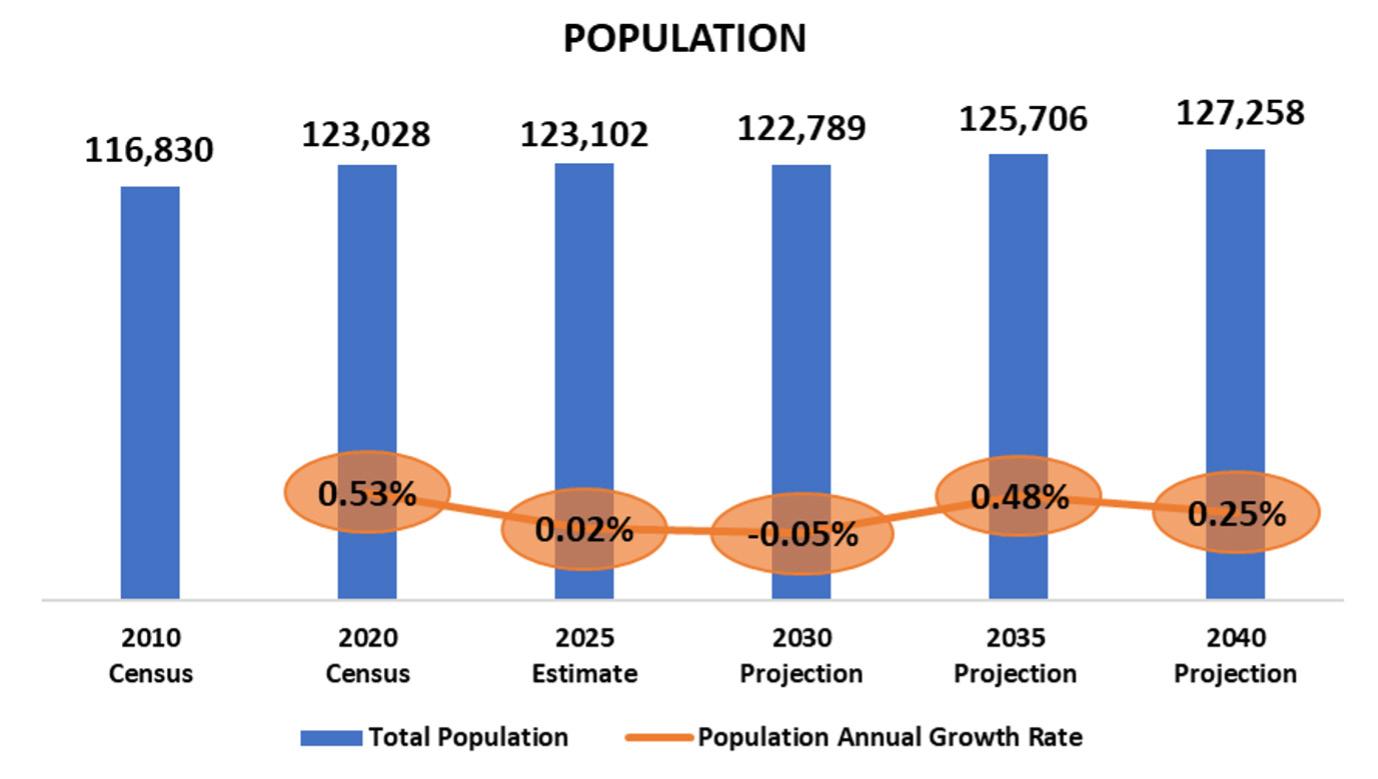
The overall population shows a minor fluctuating pattern over the years. There is growth between 2010 and 2030, but a temporary decline is projected in 2030. This decline is followed by a recovery in population size in 2040. The growth rates correspond to these changes, with negative growth in 2030, followed by recovery, but at a moderate rate as 2035 approaches and again moderate growth of 0.25% in 2040.
This chart reflects both periods of growth and contraction in population size, likely influenced by various factors such as migration, birth rates, and economic changes, which could affect longterm planning for infrastructure, housing, and services as well as operations and facility plans for the future in the park system.
In Figure 3 and starting with 2010, the number of households was 48,742, growing to 51,140 by the 2020 Census, with an annual growth rate of 0.49%. By 2025, the number of households increased to 51,631, although the growth rate slowed to 0.24%. However, a minute increase in the number of households is projected for 2030, with the count increasing to 51,807 and the growth rate at 0.07%. The number of households is expected to recover by 2035, reaching 53,008, with a stronger growth rate of 0.46%. By 2040, the number of households is projected to make another slight increase to 53,800, though the growth rate will slow slightly to 0.30%.
The overall trend in the number of households follows a pattern similar to population growth, with steady increases up to 2025. (Figure 3). This demonstrates slight implications for housing demand, urban planning, and community services over the coming years.
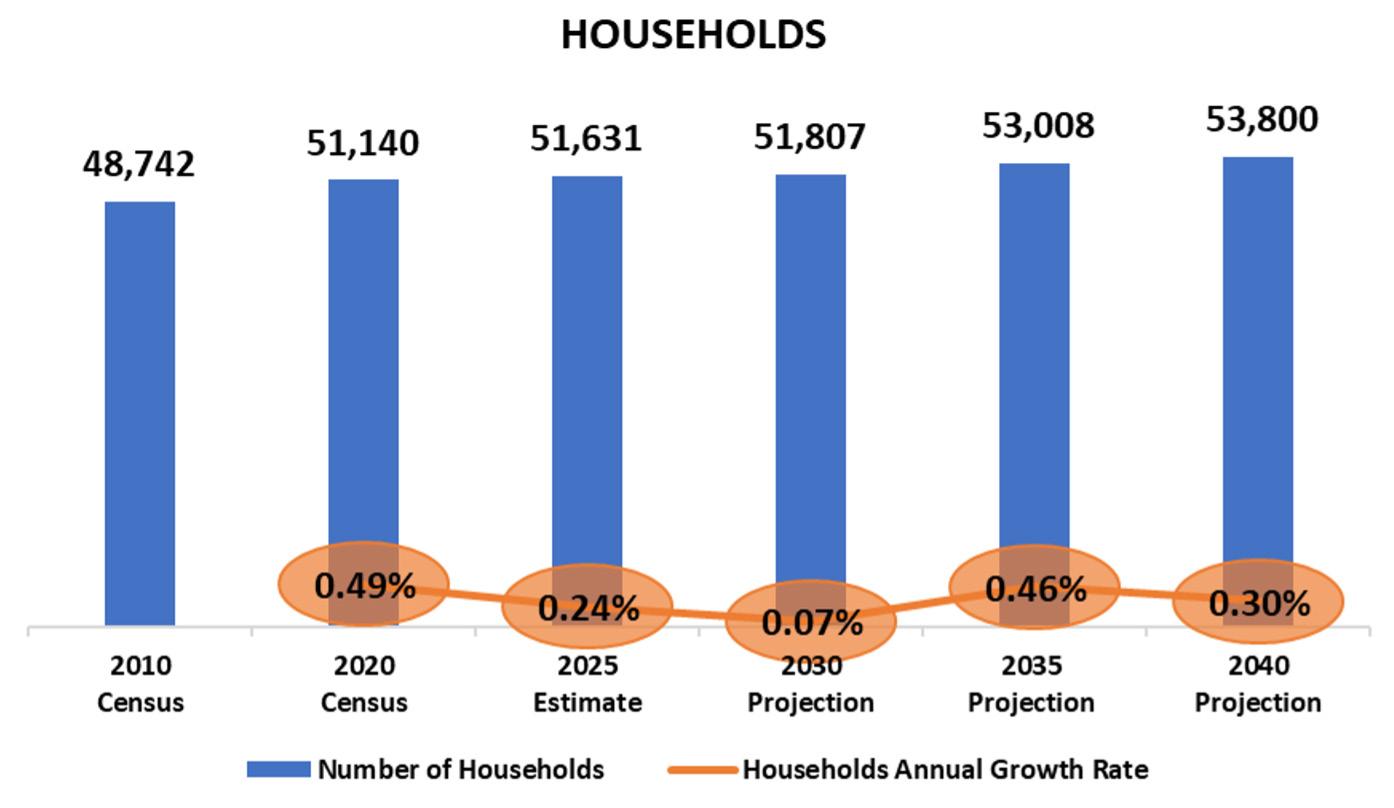
The charts on population and households reveal a clear correlation between the two metrics over time. The temporary decline in population projected for 2030, followed by recovery, suggests that external factors, such as economic conditions, population patterns, or demographic shifts, may affect both metrics simultaneously. Additionally, the household growth, although it is slightly lower, indicates that while population size affects household numbers, household formation may also depend on factors like household size, housing availability, lifestyle changes, new people coming into the community, and existing residents. There is a strong positive correlation between population growth and household numbers, with similar patterns of growth and contraction reflected in both charts.
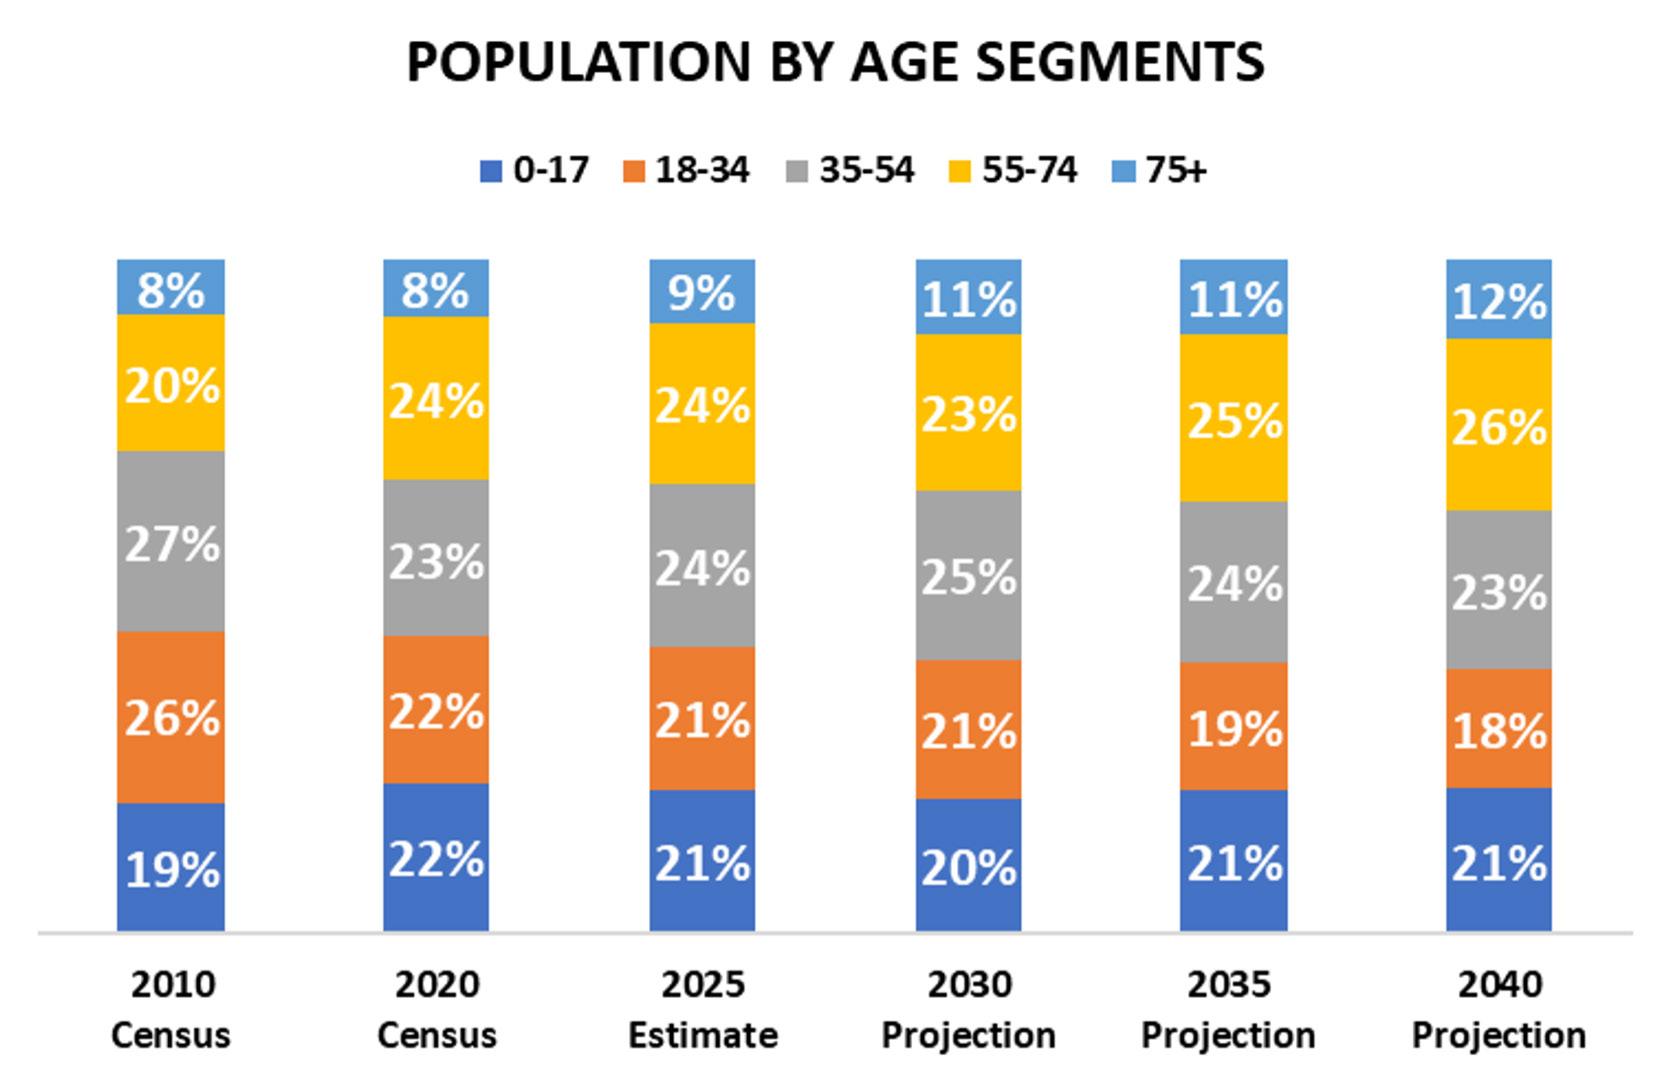
The population of Independence is steadily aging, showing a clear demographic shift toward older residents. In 2025, the community is relatively balanced: 21% are under 18, 21% are 18–34 years old, and 57% are in the two age groups where ages range from 35 and older. (Figure 4) After 2025, the share of residents aged 55 and older continues to climb (by 4%), while younger adult segments (18–34) experience a steady decline. By 2040, 38% of Independence residents will be age 55 or older, up from 28% in 2010. This pattern highlights an opportunity, or potential need, for Independence to offer active adult and senior-friendly facilities, wellness programming, and accessible parks, while continuing to offer programs to increase interest in recreation for young families. Key takeaways include:
• 2025, balanced but aging population
57% of Residents are 35+ 55+ Ages Increase 10% to 2040
Fewer Young Adults
More Seniors
• Marks a demographic turning point
• 55+ years old increase by 2040
• Increase is to 38%
• 18 - 34 age group declines steadily to 2040
• Decline is from 26% in 2010 to 18% in 2040
• 75+ population grows from 8% to 12%
• Shows a 50% increase over 30 years
The minimum categories for data on race and ethnicity from federal statistics, program administrative reporting, and civil rights compliance reporting are defined as below. The 2010 Census data on race is not directly comparable with data from the 2000 Census and earlier censuses; therefore, caution must be used when interpreting changes in the racial composition of the US population over time. The latest (Census 2010) definitions and nomenclature are used within this analysis.
• American Indian – This includes a person having origins in any of the original peoples of North and South America (including Central America), who maintains tribal affiliation or community attachment.
• Asian – This includes a person having origins in any of the original peoples of Asia, Southeast Asia, or the Indian subcontinent including for example, Cambodia, China, India, Japan, Korea, Malaysia, Pakistan, the Philippine Islands, Thailand, and Vietnam.
• Black – This includes a person having origins in any of the Black racial groups of Africa.
• Native Hawaiian or Other Pacific Islander – This includes a person having origins in any of the original peoples of Hawaii, Guam, Samoa, or other Pacific Islands.
• White – This includes a person having origins in any of the original peoples of Europe, the Middle East, or North Africa.
• Hispanic or Latino – This is an ethnic distinction, a subset of a race as defined by the Federal Government. This includes a person of Mexican, Puerto Rican, Cuban, South or Central American, or other Spanish culture or origin, regardless of race.
PLEASE NOTE: THE CENSUS BUREAU DEFINES RACE AS A PERSON’S SELF-IDENTIFICATION WITH ONE OR MORE OF THE FOLLOWING SOCIAL GROUPS: WHITE, BLACK, OR AFRICAN AMERICAN, ASIAN, AMERICAN INDIAN, AND ALASKA NATIVE, NATIVE HAWAIIAN AND OTHER PACIFIC ISLANDER, SOME OTHER RACE, OR A COMBINATION OF THESE. ETHNICITY IS DEFINED WHETHER A PERSON IS OF HISPANIC/LATINO ORIGIN OR NOT. FOR THIS REASON, THE HISPANIC / LATINO ETHNICITY IS VIEWED SEPARATE FROM RACE THROUGHOUT THIS DEMOGRAPHIC ANALYSIS.
The racial composition of the population in the City is shown from 2010 to 2038. Each segment represents a different racial category, and the chart highlights changes in racial diversity over time.
In 2010, the majority of the population, 86%, identified as White Alone, shows a percentage of significant and steady decreases across the years. By the 2020 Census, the percentage identified as White dropped to 73%, and it is projected to further decline to 59% by 2040, reflecting a more diverse population in the future. The Two or More Races category (dark blue) has been growing significantly, from just 3% in 2010 to 11% by 2020, and it is projected to rise to 18% by 2040, indicating a notable increase in multiracial individuals and families.
Similarly, the Black or African American Alone group (orange) remains relatively stable at around 9-11%, while the Some Other Race category (green) and the Asian Alone category (yellow) show moderate growth. (Figure 5) The Some Other Race category (green) is projected to rise from 6% in 2010 to 9% by 2040. The American Indian & Alaska Native Alone (gray) and Native Hawaiian & Other Pacific Islander Alone (light blue) categories remain the smallest segments, with little change over time.
The City is becoming increasingly diverse. The White population drops from 86% in 2010 to a projected 59% in 2040, while all other racial groups grow steadily. The Black or African American population rises from 6% to 11%, the Asian population is steady at 1% until 2040 where is edges up another 1%, and residents identifying as Two or More Races show the largest increase—from 12% to 18%.
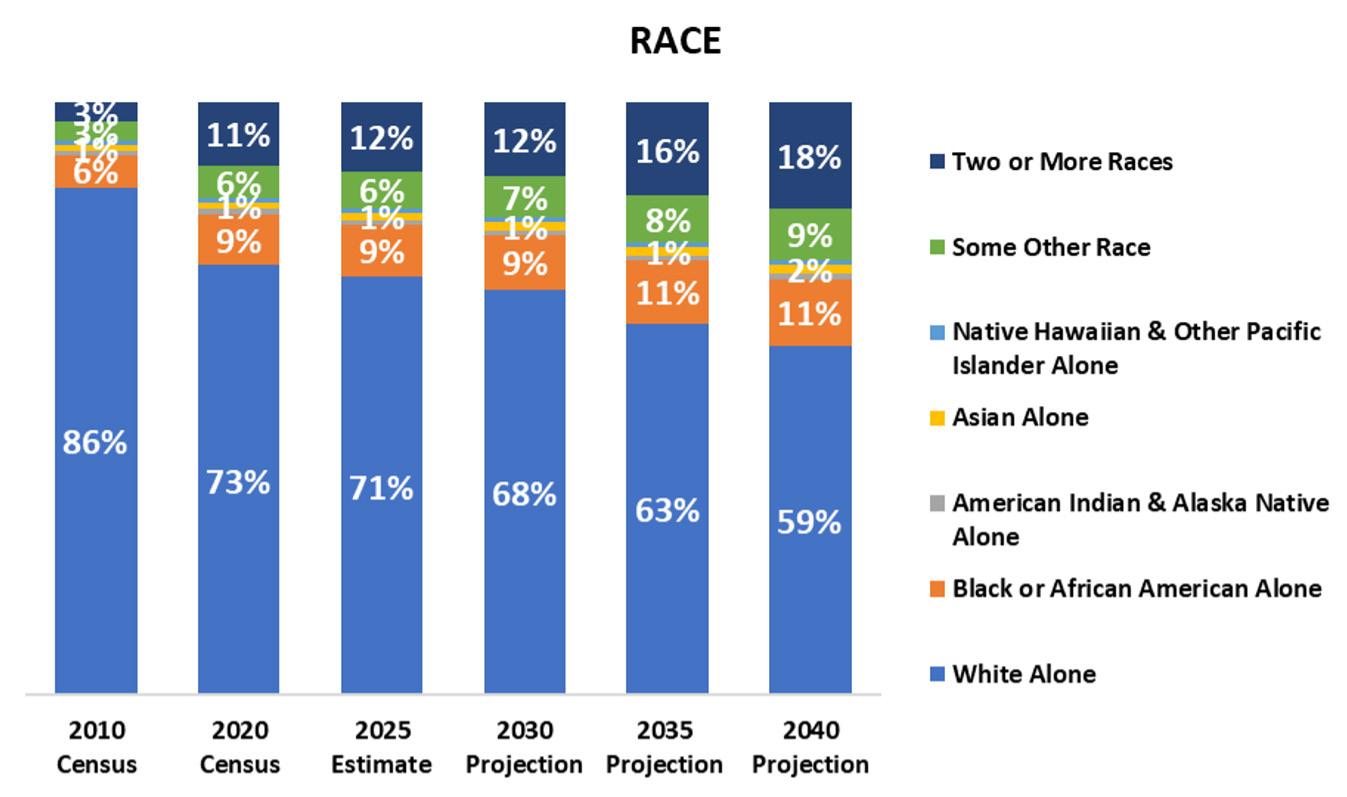
Overall, Independence is evolving from a predominantly White community to a more racially and ethnically diverse city by 2040.
The park system must be mindful of the City’s increasing racial and cultural diversity that will occur in the years to come. Programs that reflect racial diversity will need to be evaluated and included in the programs and activities that Independence offers.
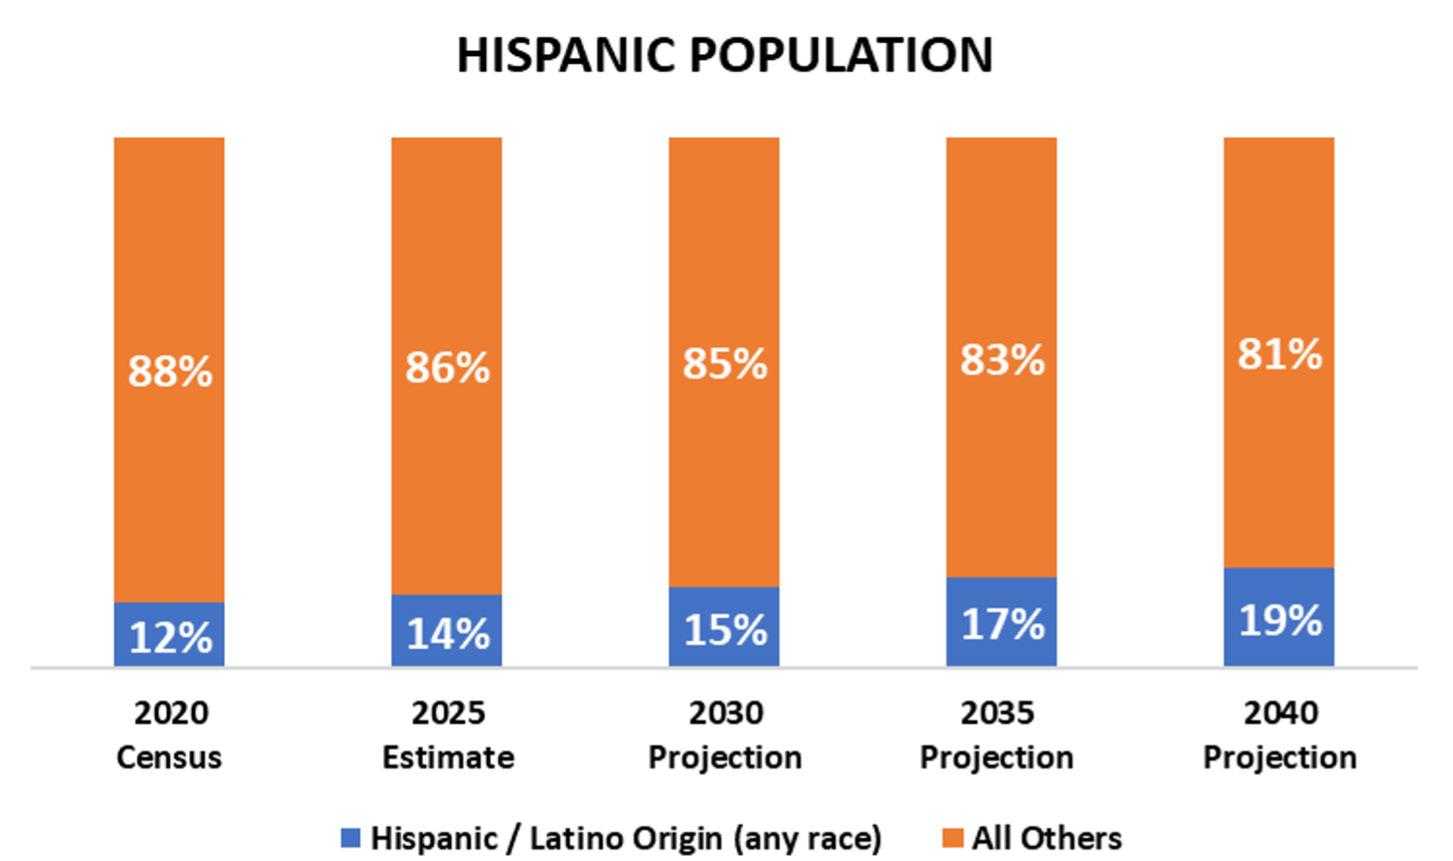
The Hispanic or Latino population in Independence is steadily increasing and becoming a more significant part of the community. In 2020, residents of Hispanic or Latino origin made up 12% of the total population. (Figure 6) That share is projected to rise to 14% by 2025, 15% by 2030, 17% by 2035, and 19% by 2040. Over this 20-year period, the Hispanic population grows by more than half, while the share of all other residents declines 7% from 88% to 81%.
This trend reflects ongoing demographic diversification in Independence, consistent with broader regional and national patterns. The City’s growing Hispanic population may contribute to greater cultural variety, community engagement opportunities, and the need for expanded bilingual and multicultural programs and services. The City and the park system should monitor the population to accommodate the growing ethnic and cultural changes.
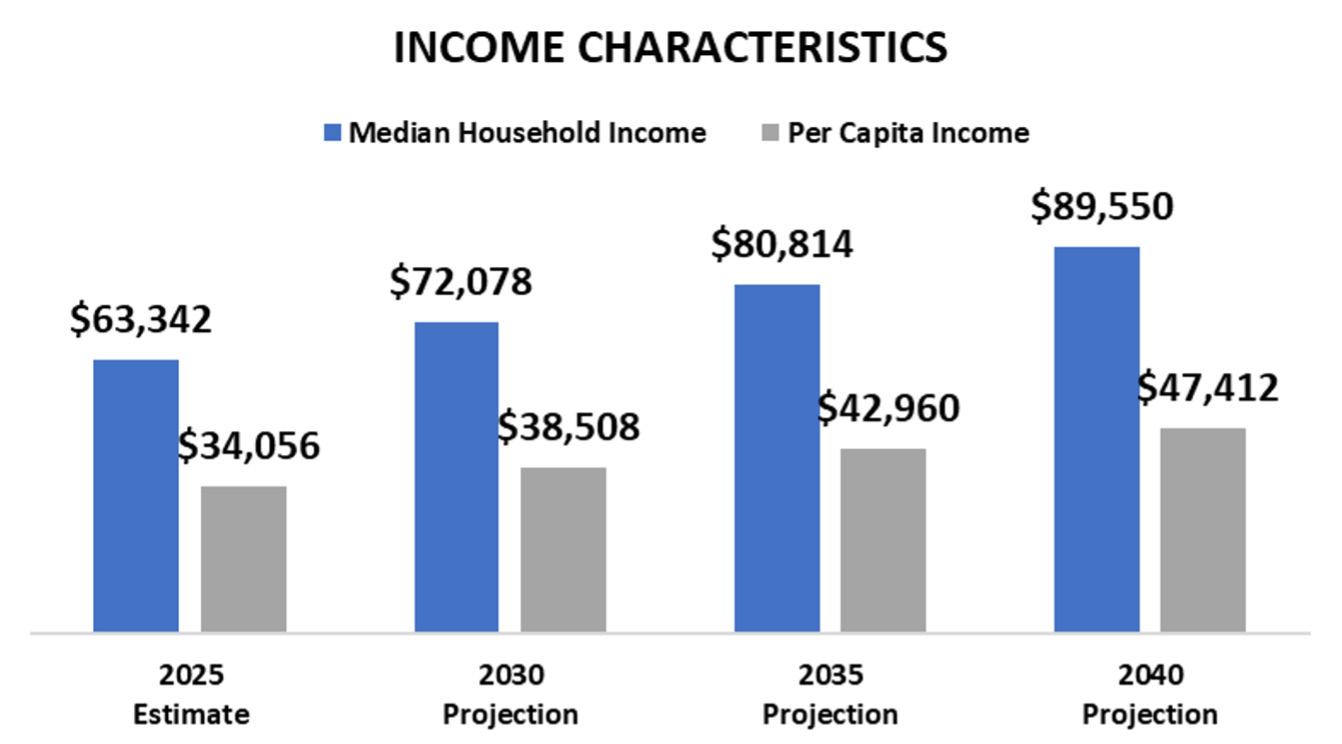
Household income in Independence is projected to rise steadily over the next 15 years. Median household income is expected to grow from about $63,000 in 2025 to nearly $90,000 by 2040. This consistent upward trend suggests improving economic conditions, increased wages, and potentially stronger household purchasing power across the community.
Per capita income represents the average income earned per person which also shows healthy growth during the same period, increasing from about $34,000 in 2025 to just over $47,000 by 2040. (Figure 7) While this growth mirrors household income gains, the smaller rate of increase indicates that larger household sizes or uneven income distribution may continue to influence how economic progress is experienced at the individual level.
Household income plays a significant role in how residents spend money on living expenses and non-essential items. Families with higher incomes often have more flexibility and disposable income to pay for memberships, class fees, sports leagues, and travel programs, allowing them to participate more frequently and in a wider range of activities at park systems. Programs, and recreation facility use for lower-income households may be affected negatively when nonessential expenses are limited due to needed living expenses. Low income residents may rely more on free or low-cost opportunities such as playgrounds, walking trails, and community events which can be subsidized by other revenue sources in the park system.
Median and per capita income are both projected to increase significantly from 2025 to 2040. (41.4% for median income and 39.2% for per capita income). These projected income calculations suggest optimism for households.
To compare median and per capita income with the state of Missouri and the U.S.A., the graph below shows this data for estimated 2025. (Figure 8)
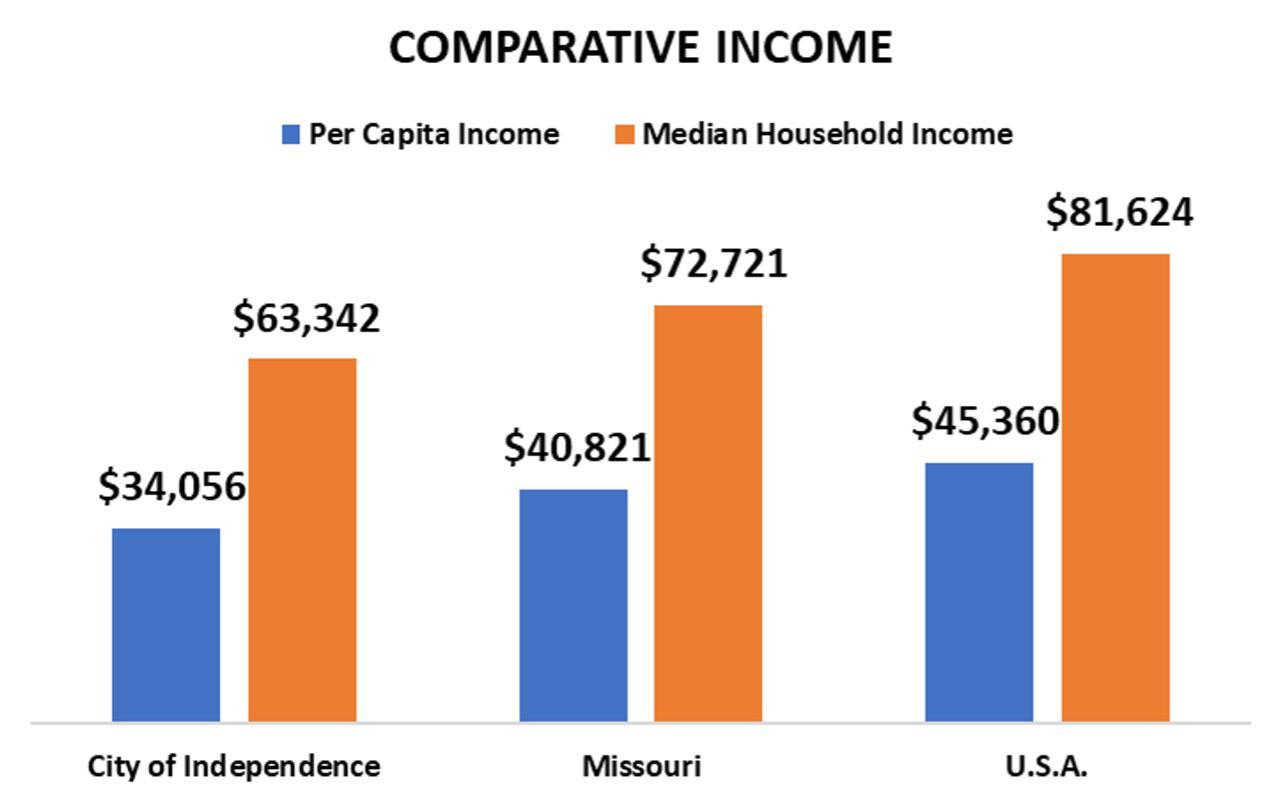
The per capita income and median incomes are considerably lower than the state and nation. In the previous graph for household income, residents of the City are predicted to experience a rise in household income. However, the state and national incomes show that state and national economies and incomes may affect City residents adversely.
Similarly, when looking at median household income, (which represents the midpoint where half of households earn more, and half earn less) Independence is also lower. This discrepancy highlights the gap in household earnings of Independence at both the state and national levels.
This comparison underscores the economic challenges facing Independence. While income levels are growing, as seen in other charts, they remain below average compared to broader state and national data.
Membership fees, program costs, and subsidizing fees will need to be evaluated in an attempt to provide services and programs that are affordable to all income ranges. Cost recovery is largely dependent on fees, and a new center would be greatly affected by revenue that plays a significant role in the financial sustainability of a recreation center.
The demographic and trends analysis presents data showing how the City’s evolving population, income levels, and recreation preferences will directly influence future planning for parks, programs, and facilities. The City’s modest but steady population and household growth indicate a stable community base, while the aging trend along with increased racial and ethnic diversity signals a need for inclusive programming with a wide age segment appeal and reflects the cultural backgrounds of new residents. The City’s population is becoming increasingly diverse, with the percentage of White residents projected to decline significantly by 2040, while Hispanic/Latino and multiracial segments are expected to grow steadily by up to seven percent by 2040.
Rising median and per capita incomes reflect healthy and improving economic conditions; however, overall earnings remain below state and national averages. This underscores the importance of maintaining affordable access to recreation opportunities. Changes in state or federal economic conditions may impact the local economy and influence the affordability of community center memberships and programs. These factors emphasize the need for a costrecovery strategy that ensures financial sustainability while keeping services accessible to changing demographics and a broad range of residents.
Future park and facility planning, including consideration of a new community center, should evaluate all aspects of the existing community and look ahead to emerging trends that can guide facility development, recreational programs and activities.
Three takeaways from the data obtained that relates demographically to the city of Independence from 2020 to 2040: Independence is projected to experience minimal population growth, with a temporary decline around 2025 to 2030, followed by projected recovery by 2035. Similarly, household numbers show a steady course of growth. These numbers reflect the overall demographic trends in the City.
Both median household and per capita incomes in Independence are projected to increase significantly by 2040, with median household income expected to reach $89,550 (a 41.37% increase) and per capita income projected to rise to $47,412 (a 39.2% increase). 1 2 3
The racial composition of Independence is becoming more diverse, with the White population decreasing from 86% in 2010 to a projected 58% by 2040. The Hispanic/Latino population is expected to increase 7%, reaching 19% by 2040.
The entire City of Independence is served by the Parks and Recreation Department, yet there is a gap in the number of parks on the east and west sides of the City.
To demonstrate the east and west service areas, Lee’s Summit Road is considered below as the line of differentiation (Figure 9). Considering the factors shown in the graphics / maps that follow, it is apparent that currently the number of parks are predominately on the west side of the City. In the sections that follow, 2025 statistics were available and are used.
City of Independence, MO




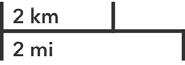
The City population (Figure 9 on previous page) on the west side (brown) and the east side (blue) shows a difference in favor of the west side by 15,673 residents while the east side’s land area is nearly three times larger (~2.68 times) than the land area on the west side of the City. To demonstrate disparity of “more land / less parks” regarding the east side, the west side area makes up ~27% of the City’s total land mass and the east side has ~73% of the total land mass of the City. There are 21 parks on the west side of the City and 4 parks on the east side. The population density map (Figure 10) shows the concentration throughout both sides of the City. There is new development and growth in the upper section of the east side and also the mid-city area which is creating a need for more parks and recreation activities in these areas.



Independence Parks and Recreation identified key operating metrics to benchmark their park system with Lee’s Summit, MO and Springfield, MO. Comparisons will be shown with graphics and described in narratives to demonstrate how operating metrics are factored into facilities, programming, budgets, staffing levels and other park system data. Independence selected the benchmark agencies based on their geographic proximity, demographic similarities related to recreational programming, and the physical attributes of their parks.
To broaden the benchmark beyond Lee’s Summit and Springfield, the National Recreation and Parks Association (NRPA) provides park system data in the NRPA Park Metrics Guide which is the most comprehensive source of benchmark data and insight for parks and recreation agencies to use and evaluate statistics of park systems throughout the nation. Park and recreation agencies also use the NRPA Agency Performance Survey that is prepared annually to self-report data about their park systems.
Where the metrics from Independence align with NRPA data, those references will be cited accordingly. NRPA categorizes the data they have for park systems into quartiles for statistical analysis. This method is a way to group data points, such as park information, income, ages, and household size.
Due to differences in how each park system collects, maintains, and reports data, the benchmark agencies’ answers may have details that are not able to be verified through research. The data provided is assumed accurate relative to the metrics used. Any unknown variations may impact program descriptions, financial data, staffing, park amenities and programs. Therefore, overall comparisons must be viewed with some variants in mind. The benchmark data collection for all systems was completed as of July 2025, and it is possible that information in this report may have changed since the original collection time period.
City population and land area can suggest the relative size of the park system. However, the parks in large cities may be landlocked within their park boundaries or limited to acquiring more land for parks. This chapter will present data about the acres of parkland, the amenities and programs present in Independence, and the two benchmark cities.
This chart (Table 1) shows that the city of Independence has a relatively larger land area (in square miles) and population base compared to Lee’s Summit but slightly smaller (7.81%) than Springfield. Independence has slightly less square miles than Springfield while serving a significantly smaller number of residents (~46,0000). Springfield’s population density is higher, and its city boundaries cover a slightly larger area.
TABLE 1 CITY BENCHMARK INFORMATION
Despite their differences in size, Independence is comparable in number of parks with benchmark cities, and the larger benchmark city shows a similar distribution of park sizes.
Springfield has more parks overall (70), while Independence has 11 more parks than Lee’s Summit. Independence has the least number of park acres of the two benchmark agencies. With more parks and less acres at Independence than Lee’s Summit, the implication may be that Independence has smaller parks than Lee’s Summit. From the data, 62% of Independence’s parks are smaller than 15 acres, and 52% of Lee’s Summit’s Parks are under 15 acres. Small parks located throughout a park system may not get the use of larger size community and regional parks with sports fields, green spaces, larger amenities and facilities. However, maintenance must still be provided to keep the small parks well cared for and enjoyable for residents who want a more passive experience.
Independence has considerably more undeveloped and special use parkland (89 acres) than Lee’s Summit, (5 acres) and it has more than 13 times the amount of acres left undeveloped than Springfield. This suggests Independence has some parkland that could be used for nature programming or for potential development if a suitable use in their system is found. Springfield’s park system appears to be built out with internal land space available for growth. Lee’s Summit is nearly the same situation with only 5 acres of undeveloped land. Any park expansion with either of these park systems will have to be from purchasing land elsewhere in the city.
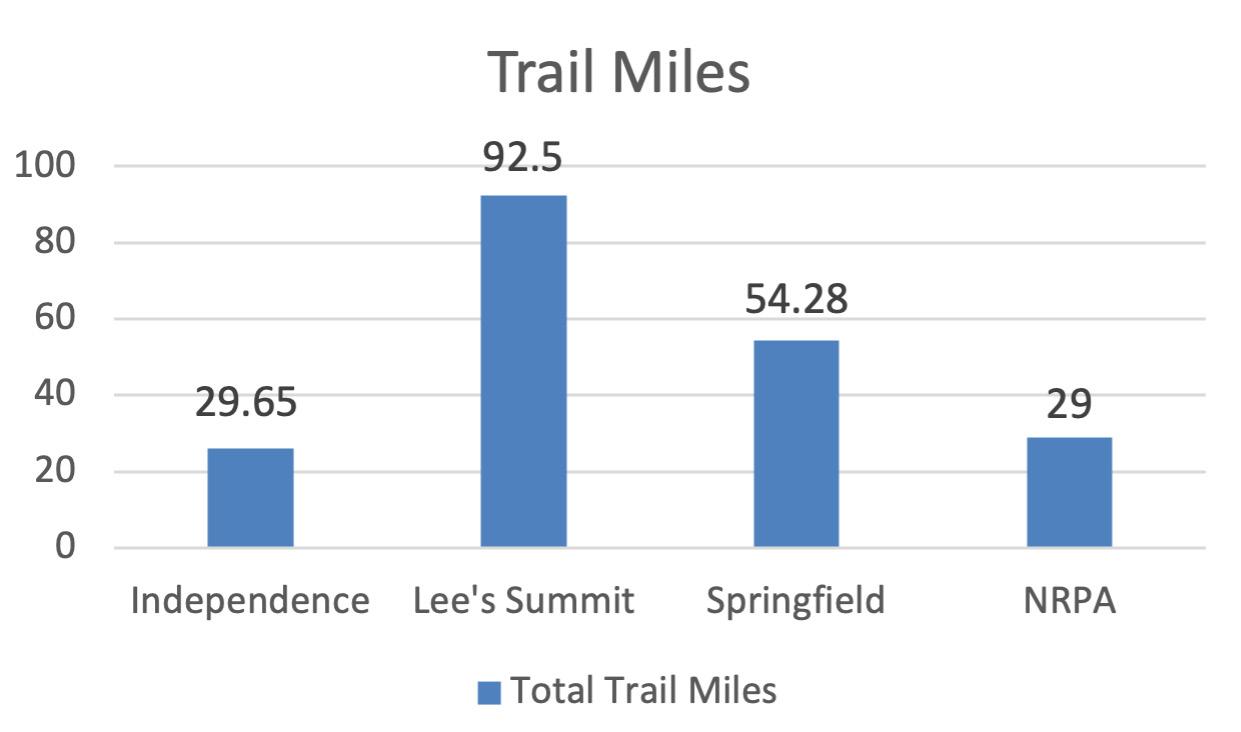
Trails in parks are highly valued by residents and consistently ranked among the most desired park amenity, making them a key feature in a community for enhancing the quality of life (Table 2).
Independence maintains a total of 29.65 miles of trails. Lee’s Summit offers an extensive trail system with over 4 times more total mileage than Independence, including 89 miles of paved trails. Springfield also surpasses Independence in total mileage at 54.28 miles.
NRPA AGENCIES IN THE MIDWEST HAVE 29 MILES OF TRAILS.
Recreation facilities in communities (Table 3) are an appreciated amenity to residents by providing recreational opportunities that promote health, provide a variety of programs and activities, offer gathering and play spaces for various sports, as well as improving the overall quality of life for people in the community. The indoor recreation facilities for Independence and the two benchmark agencies are shown in the graphic below.
*Rec Facilities include: Senior Center, Recreation Center, Multi-Generation Center, Community Center.
Sports fields are a very active part of the park system and bring a community together watching and participating in games and tournaments (Figure 12). Many types of sports activities take place on the fields where youth and adults enjoy outdoor activities and compete with each other in their community and with teams from other communities.
In this graph, fields and courts have been grouped as:
• Ballfields: Baseball and Softball Diamonds
• Rectangular: Soccer, Football, Multi-purpose
• Courts: Basketball, Tennis, Pickleball
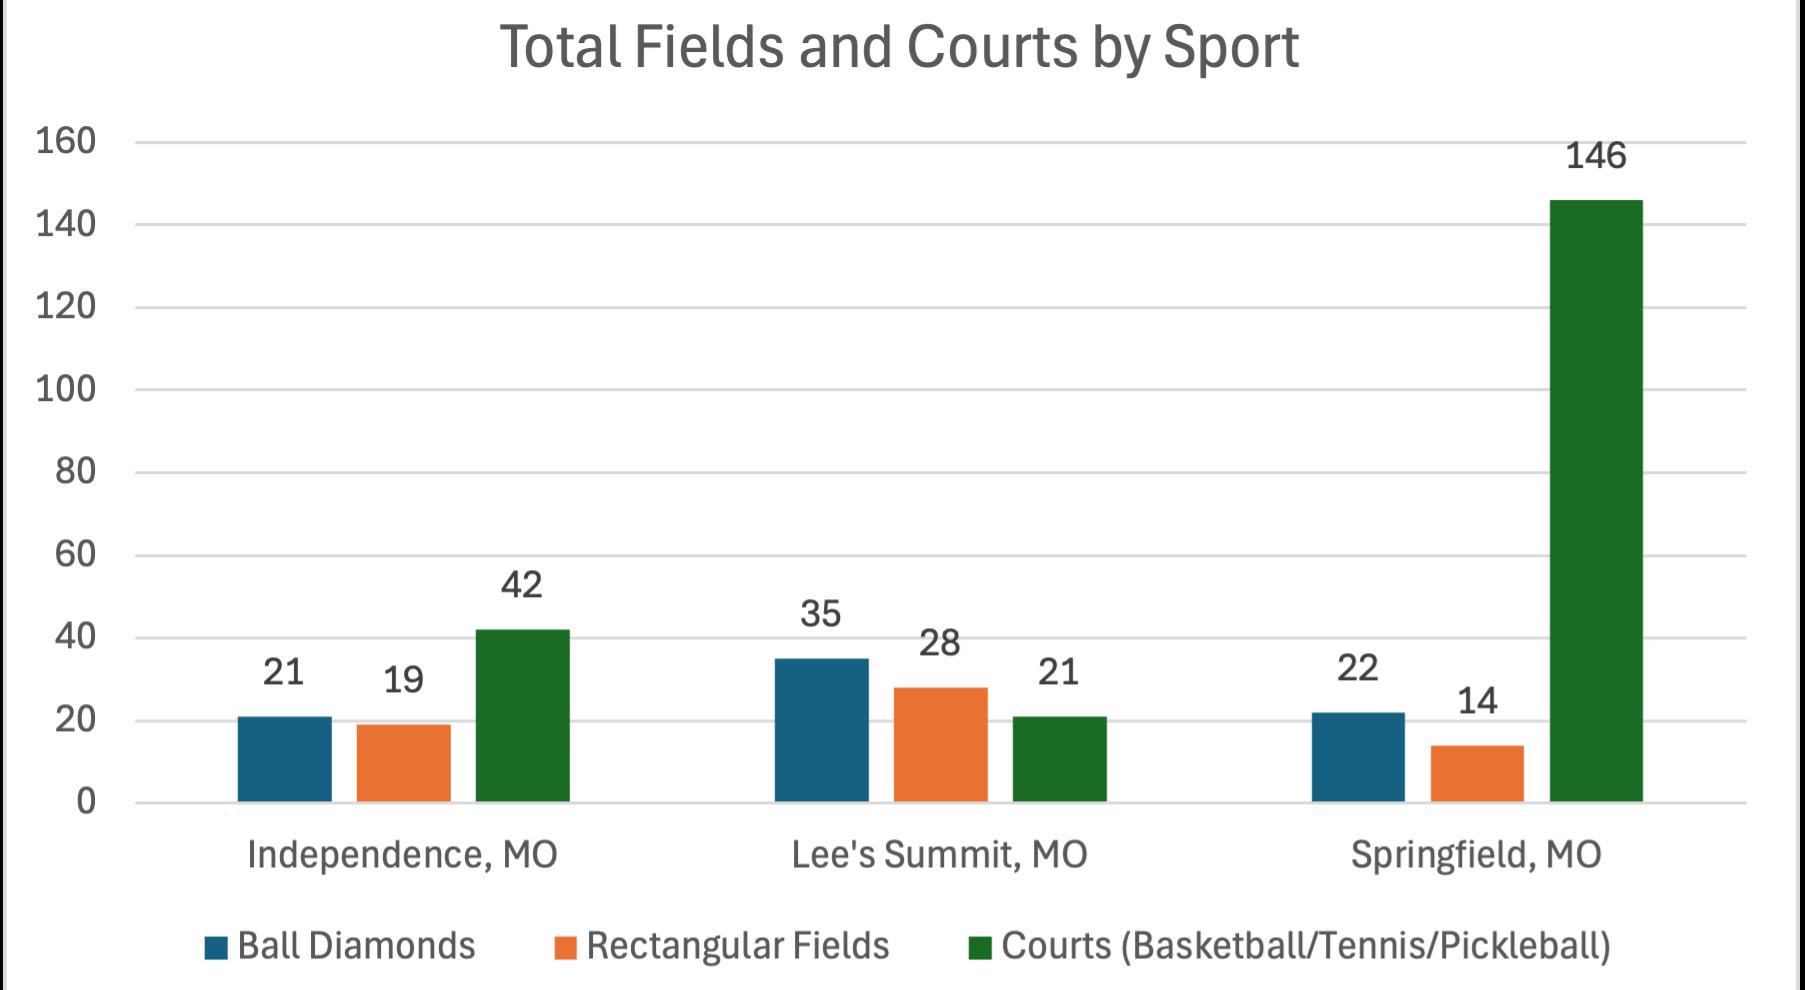
Independence Parks & Recreation has 21 ball fields, which is fewer than Lee’s Summit’s 35 ball fields. Springfield offers a nearly identical number (22), showing that Independence is comparable to Springfield but behind Lee’s Summit in baseball and softball field capacity.
Independence provides 19 rectangular fields, which places Independence in the middle of the three agencies ahead of Springfield but below Lee’s Summit in multipurpose field space for sports like soccer and football.
Independence offers double the sports courts (42) when compared to Lee’s Summit. Springfield’s large number of courts is due in part to the extensive tennis community in the community, as well as leagues, programs, school use and college events.
Using NRPA statistics as a reference, the information below shows the number of residents per fields for Independence and the two benchmark agencies. Ballfields: 1
: 1 field per 9,742 residents Independence: 1 court per 7,694 residents Lee’s Summit: 1 court per 4,983 residents
1 court per 1,162 residents
Internally, parks and recreation departments manage, allocate, and track the funding and revenue they earn, use and receive (Table 4) in various methods. There are many sources from which parks departments obtain funds. Typically, they receive major external funds from taxes, grants, sponsorships, programs, and partnerships. These finances support operations, maintenance, staffing, programming, capital projects, and long-term planning. The chart below shows 2024 (actual budget from the previous year) and 2025 (budgeted this year) for various revenue sources and their total operating expenses for 2024 and 2025.
Earned Revenues (event fees, user fees, parking fees, memberships and program fees)
FY '24 Actual
Independence Parks and Recreation
Lee's Summit Parks and Recreation
Springfield Parks and Recreation
$7,347,144 FY '25 Budgeted
$8,152,428
FY '24 Actual
$14,038,302 FY '25 Budgeted
$14,131,302
FY '24 Actual
$43,729,397 FY '25 Budgeted
$45,141,439
FY '24 Actual
$867,006 FY '25 Budgeted
$489,600*
FY '24 Actual
$5,820,022 FY '25 Budgeted
Unearned Revenue (sponsorships, grants, partnerships, interest earnings, donations, sales of fixed assets)
FY '24 Actual
$344,957 FY '25 Budgeted
$135,805
$6,730,612 FY '24 Actual
FY '24 Actual
$15,883,543 FY '25 Budgeted
$15,149,942
'24
'25 Budgeted
$7,436,736
FY '24 Actual
$1,579,862 FY '25 Budgeted
$750,000
FY '24 Actual
$1,413,716 FY '25 Budgeted
$1,685,000
'24
$8,637,196 FY '25 Budgeted
$8,062,141
$10,856,646 FY '25 Budgeted $10,910,687 FY '24 Actual $18,256,530 FY '25 Budgeted $18,391,700
FY '24 Actual
$22,691,117 FY '25 Budgeted $22,944,335
*The extreme decrease in earned revenue is partially due to the Independence water park closing in 2025.
TABLE 4 REVENUE AND EXPENSES
FY '24 Actual
$39,938,376 FY '25 Budgeted $39,779,277
NRPA PARK METRICS: FINANCIALS
NRPA Agencies Annual Operational Expenses $11,948,769
Annual Operating Expenditures per capita $196.83
Annual Revenue per Capita $89.28
Independence Annual Operational Expenses $8,152,428
Independence Annual Operating Expenditure per capita $66.22
Annual Revenue per Capita $5.08
Typical cities have a designated amount in their budget of 5% - 7% allocated for parks and recreation.
Independence is considered low with the city allotting no general fund budget for park services. The City allots 2-2.5% of their general fund budget for Right of Way Mowing and Facility Maintenance.
Among the three agencies, Independence Parks and Recreation operates with the lowest total operating expenses and has modest amounts coming from earned and unearned revenue.
By comparison, Lee’s Summit and Springfield operate with significantly higher total expenditures, and in Springfield’s total expenditures this reflects a somewhat larger park system as well as a much larger population served by their parks. Both benchmark agencies show higher earned revenue percentages than Independence suggesting more aggressive cost-recovery models and a greater emphasis on revenue-producing programs, rentals, and memberships. It is noted that in the 2025 financial year, Independence Parks and Recreation closed their water park causing their earned revenue to dip to nearly half of what it was the previous year.
It is important to recognize that, although Independence shows a lower percentage in the above areas compared to the benchmark agencies, the methods of how financial information is obtained, recorded, and categorized can vary significantly between agencies. As a result, the dollar amounts presented may not offer a fully accurate comparison of how revenue is classified, what costs are considered operating expenses (as opposed to capital investment projects), and how each agency defines and tracks unearned revenue. This also applies to the types of tax revenue utilized within each municipality, which may differ in structure and scope.
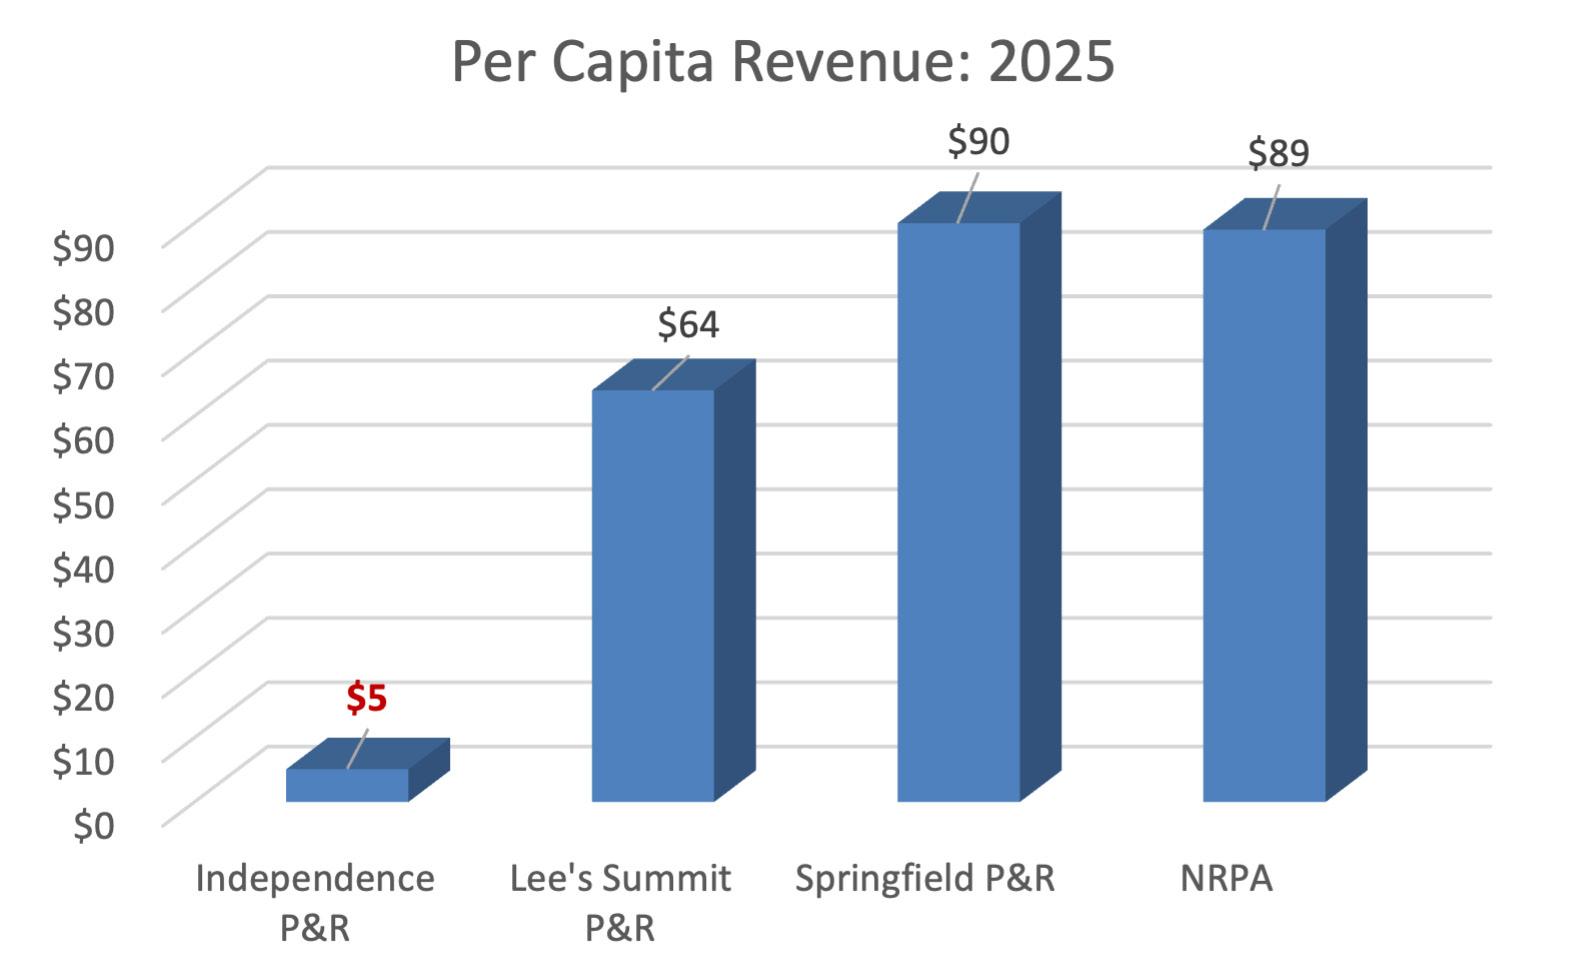
Per capita income is the amount of revenue measured per person within the population for the benchmark cities and Independence in 2025. This chart (Figure 13) demonstrated that Springfield, with the largest population and the largest revenue, has the largest amount of per capita revenue. (data shown utilizes earned income for each agency)
Independence has the lowest per capita revenue, and in 2025 they had a substantial decrease in revenue from 2024 ($867,006 in 2024 / $484,600 in 2025) that caused the minimal amount of per capita revenue. For a more comparable amount from Independence, 2024 data of $867,006 would provide a per capita revenue of $7.00. This amount is still extremely low with the reference to the benchmark agencies and the NRPA statistics.
In FY24, Independence reported no capital spending on non-mobile (stationary) equipment. For FY25, the department has budgeted $300,000 for capital improvements. These figures (Table 5) reflect the department’s previous year’s capital investment strategy and capital spending may have been affected by unforeseen circumstances, re-alignment with internal priorities, project timelines, or available funding sources.
A useful correlation may be drawn by comparing the actual FY24 capital budget to the projected FY25 budget, which can offer insight into expected growth or adjustments in investment priorities for the upcoming fiscal year for the benchmark agencies.
Lee’s Summit provided amounts that show a substantial decrease of 85.2% from 2024 to 2025. Springfield’s capital budget increased 69.2%. Drastic changes in capital budgets can indicate large projects were started or finished, or that deferred maintenance has been financially addressed.
Total capital budget (excluding mobile equipment and capital costs over $100,000 not included in operating expenses)
Memberships at recreation or community centers are a common and important component for revenue generation in parks and recreation systems. Along with fee based programs and day passes they contribute to the earned revenue and financial sustainability of the facility. Table 6 provides an overview and narratives below provide an overview of membership pricing and how they are structured at Independence and the benchmark agencies.
Revenue Generation: Memberships are an important part of the revenue earned, helping to offset operational costs without relying solely on tax funding.
Cost Recovery: According to NRPA, recreation centers typically recover 40–60% of their costs through memberships, fees, and programs.
Independence has the lowest membership fees for both residents and non-residents compared to the benchmark agencies. Calculations in Table 6 portray the large difference.
Resident Rates: Lee’s Summit’s annual resident membership rate is about 4.1 times more than Independence’s, while Springfield’s is roughly 3.8 times more than Independence’s rate.
Independence Parks and Recreation
Adult: $70.00
Family: $210.00
Senior: $50.00
Youth (under 18): $70.00
Adult / Family $360.00
Family - $360 x 4 = $1,440
Adult: $389.00
Family: $602.00
Adult: $100.00
Family: $300.00
Senior: $80.00
Youth (under 18): $100.00
Adult: N/A
Family N/A
Senior: Aquatics N/A
Springfield Parks and Recreation
Senior: $262.00
Youth (under 18): $183.00
While the amenities of Independence are not truly comparable with those of the two benchmark agencies, the affordability in their services is a detriment to achieving sustainable cost recovery goals. Aging program offerings, outdated facilities, and nominal amenities could be another reason that fees are underpriced and should be evaluated.
(Based on NRPA Data and National Averages):
• Annual resident adult memberships: Typically range between $200–$400.
• Annual non-resident adult memberships: Often $300–$600
• Daily drop-in fees: Average around $5–$10 for residents.
• Family passes: May range from $400–$800 annually, depending on amenities included.
Recreation is important to the economic impact on a community, and the agencies were asked if they engage in sports tourism. Participating in sports tourism has a financial benefit to businesses and retailers in the community as well as revenue generation that can provide funding to operate and sustain a park system.
Independence has minimal sports tourism with team sports and tournaments in their community or surrounding areas. Lee’s Summit also has a modest amount of sports tourism that benefits their system. With its many softball and baseball fields and associated income from registrations, parking, and concessions, Springfield is well positioned to generate meaningful revenue through sports tourism.
The actual cost recovery percentages are indicative of the goals set by the park system and possibly the City. Independence recently implemented a 40% cost recovery goal, and they will soon be able to evaluate the costs of services and activities to determine the effect on the increased revenue in their system.
Lee’s Summit meets their cost recovery goal of 65%. Also, Springfield has a high cost recovery goal of 75%, and benchmark data shows they recover approximately 58% of costs associated with their recreation services.
*Low cost recovery is a result of several internal financial factors. A common justification for low cost recovery is that agencies choose to subsidize their programs so that low income residents will have access.
• NRPA data shows that the typical (median) agency has a cost recovery of around 27.2% of their operating expenditures via non tax revenue.
• Cost recovery targets around 30% or higher are commonly seen in agencies with a strong cost-recovery performance.
• In the Midwest region, the median cost recovery level is 34.4%
The benchmark analysis also looked at organizational structures of peer agencies and uses the full time equivalent (“FTE”) measurement to capture the number of full time, part time and seasonal staff that are used for service delivery and operations.
Table 7 on the next page provides the number of full time, part time, and seasonal staff for the previous year and this year to date. Independence’s eight seasonal positions were funded but not filled due to a lack of applicants in 2025.
NOTE; To calculate FTEs: add the total hours of service for which the employer pays wages to employees during the year (but not more than 2,080 hours for any employee) and divide that amount by 2,080)
TABLE 7 STAFF (FULL TIME EQUIVALENTS)
14 TOTAL FTES Benchmark Data: STAFF INFORMATION
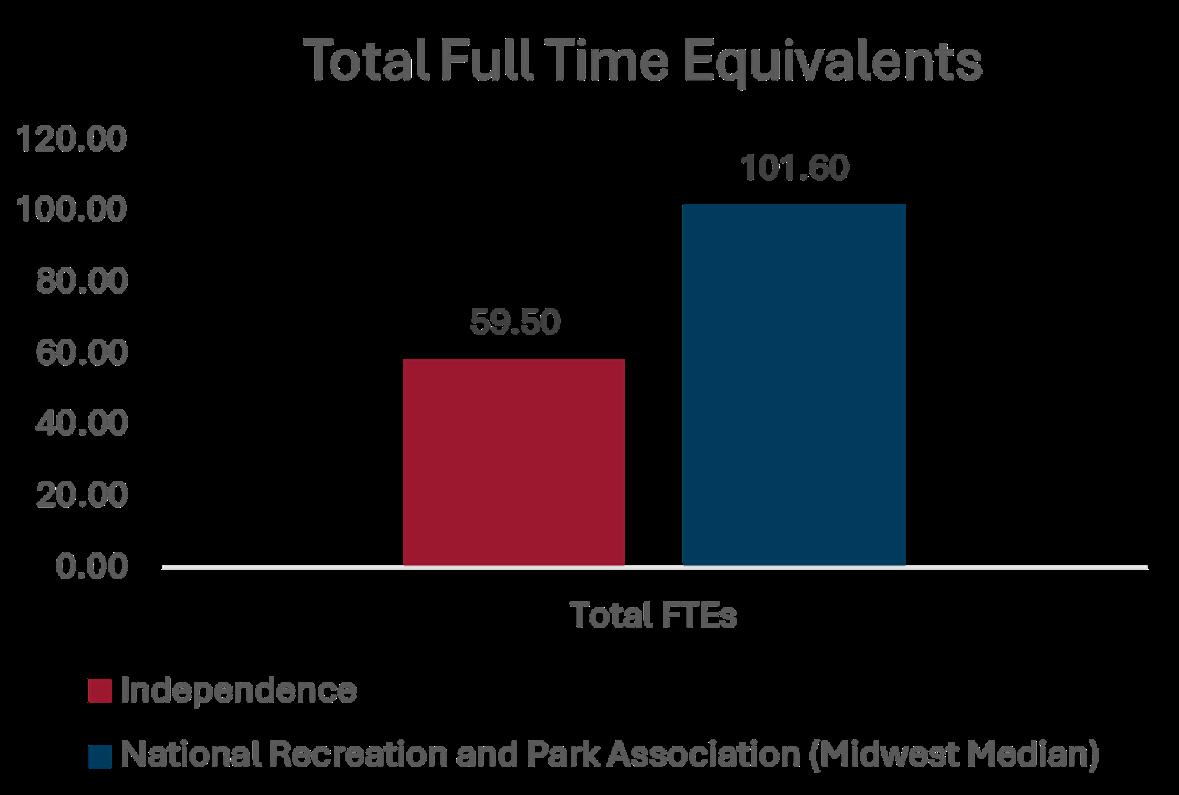
Independence has 59.50 employees in their park system that are dedicated to parks, recreation, and administrative responsibilities. This is higher than Lee’s Summit but much less than Springfield. The differences in staffing are largely dependent on the type of facilities, amenities, and programs that each agency offers. Additionally, NRPA statistics show that the Midwest area and the median quartile agencies employ 101.60 FTEs. This demonstrates that Independence is undoubtedly understaffed.
Springfield has a much larger staff overall than Lee’s Summit and Independence. All three agencies’ staff changed only moderately from year to year in all categories. Independence increased their staff numbers slightly, with seasonal staff positions being the largest increase.
Springfield, by contrast, operates a larger workforce across all staffing categories except for seasonal employees. Their system has a much higher volume of both full-time and part-time employees than Independence, and seasonal staffing is also moderate in number as compared to Lee’s Summit but not comparable to Independence which has eight seasonal positions so far in 2025 increasing from 0 last year. All agencies’ employee count varies only slightly year to year and could indicate similar park related tasks or a minimal allowance of new employee hiring.
The agencies’ staff were not asked about their responsibilities, however for reference NRPA data specifies:
• NRPA Park Metrics show a median of 58 FTEs for agencies who manage between 251 to 1,000 park acres.
• The Midwest region shows the median of 21.0 park employees per 10,000 residents
• NRPA agencies data also shows how total labor hours are distributed among an agency’s variety of responsibilities:
• Maintenance and Operations: 48% of total labor hours
• Programmers 31% of total labor hours
• Administration: 15% of total labor hours
• Other: 4% of total labor hours
• Capital Development: 2% of total labor hours
• Independence has 59.5 full time equivalents, indicating the park system is understaffed according to NRPA data about agencies nationwide.
• Independence, with 123,102 residents, has 4.83 park employees per 10,000 residents

• Lee’s Summit has 45 FTE, indicating the park system is understaffed according to NRPA data about agencies nationwide.
• Lee’s Summit, with 104,640 residents, has 4.30 park employees per 10,000 residents
• Springfield has 267 FTEs indicating the park system is overstaffed according to NRPA data about agencies nationwide.
• Springfield, with 169,176 residents, has 15.78 park employees per 10,000 residents
Park systems that hire contractors often do so to increase efficiency, reduce long-term costs, supplement internal staffing capacity, and offer programs and activities that are not in line with the skill set, experience or capacity of in-house programmers. The chart below (Table 8) shows that Independence, Lee’s Summit, and Springfield all use contractors in their park systems and the duties they perform.
Do you use Contractors?
If so, for what tasks or duties?
There is some overlap in the types of tasks contracted by Independence and Lee’s Summit. Both cities rely on contractors for maintenance work involving HVAC and electrical systems, which are technical services typically requiring licensed professionals. In addition, both cities outsource large tree removal, an infrequent but highly specialized task that demands heavy equipment and safety precautions. Independence and Springfield both use contractors for fitness instruction, showing that recreation programming for fitness is commonly supplemented by outside professionals rather than staffed in-house.
Springfield demonstrates the broadest use of contracted services for programming, employing contractors for not only fitness instruction but they also use contractors for other sports related programming including referees, athletics and aquatics lessons, personal training, ice skating, and hockey lessons. Springfield does not list contractor use for any maintenance tasks. Lee’s Summit utilizes sports contractors for youth and adult instruction as well as officials for those sports. Independence is unique in contracting out lake maintenance, a task that is not mentioned by the other cities, indicating a body of water may not be within their park systems.
Overall, while all three agencies contract for operational and programming support, Springfield’s use of contractors covers the most programming areas, whereas Independence and Lee’s Summit focus more on core operational and sports-related services along with a smaller need for maintenance tasks.
PROS Consulting classified programs into core programs in order to make a more viable reference to programs that each agency offers. Programs from all agencies that did not fit the classifications are listed on the next page. Names of these programs indicate why they may be individual programs based on a community request, or for a particular occasion, not a routine scheduled program that is fee based for the park system.
Independence should prioritize the core program areas that have been identified as important through the community engagement process and not necessarily what other communities are offering.
For reference: programs from Independence and Benchmark Agencies were classified into the 6 core program areas.
The graph below (Figure 15) shows core programming as identified by NRPA Park Metrics and the percentage of agencies that offer the programs.
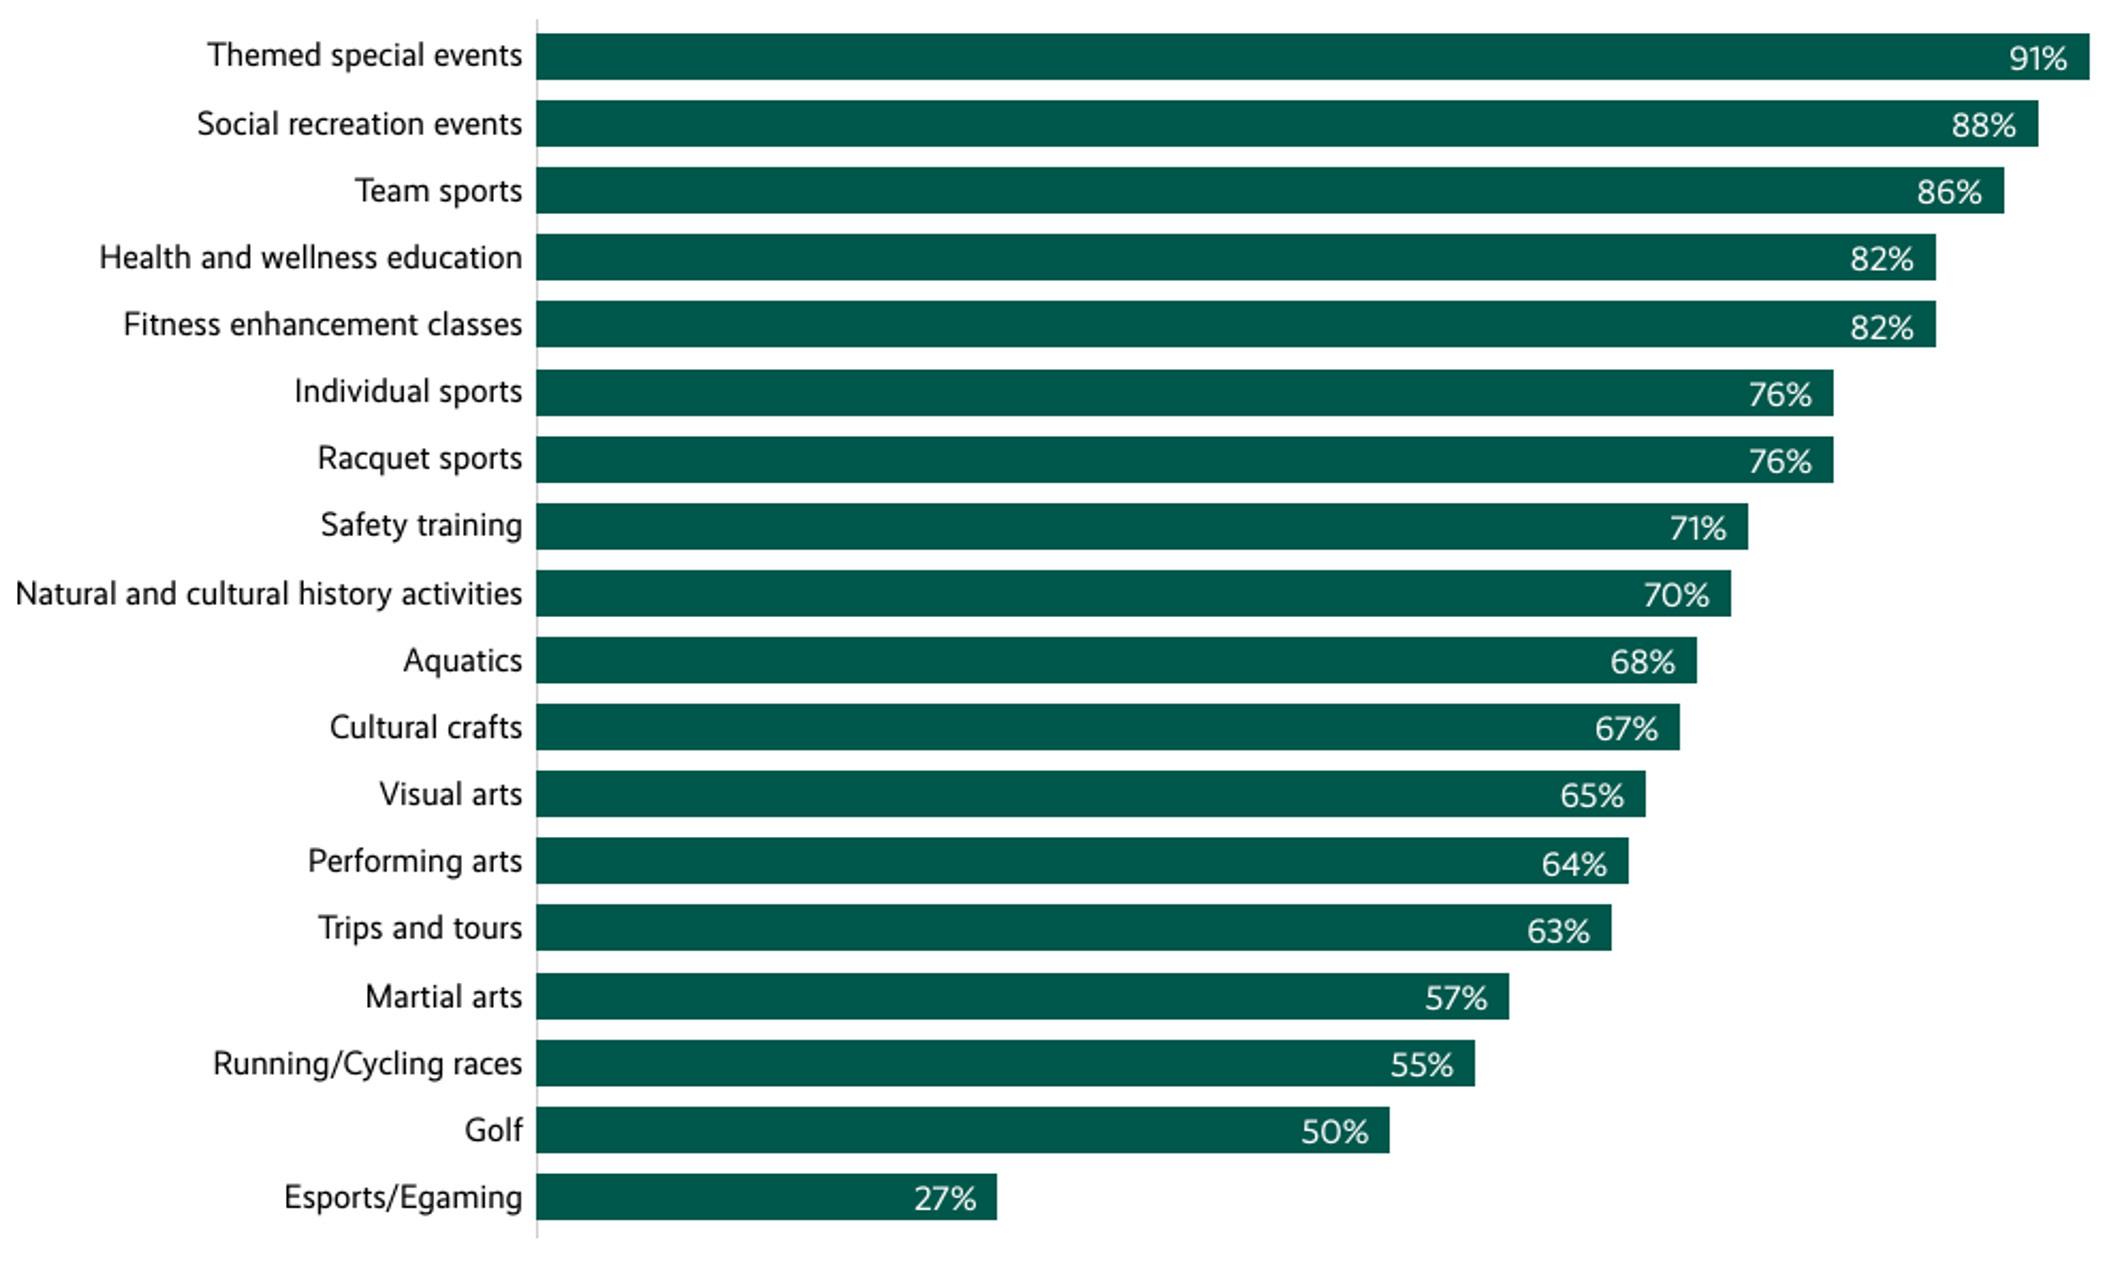
The benchmark findings highlight both strengths and opportunities for Independence’s strategic growth and investment in their system by referencing Lee’s Summit, Springfield, and NRPA data.
Independence operates a fiscally constrained park system that lacks the financial capacity to sustain staffing, provide adequate service levels, and properly maintain existing parkland and facilities. The system’s low membership fees promote affordability and access for low-income users but limits the revenue potential from subsidized memberships.
Cost recovery should be monitored as the City grows, demographics evolve, and operations adjust to accommodate additional users. While the park system faces ongoing challenges with funding, facility maintenance, potential expansion, and low staff-to-resident ratios, benchmarking provides valuable insight. Comparing Independence to other agencies reveals differences in system size, staffing levels, and program offerings by highlighting both the areas of strength and opportunities for improvement.
Overall, this benchmark analysis provides a reference point for Independence to assess its operations internally, learn from peer agencies, and guide decisions that will produce positive outcomes, enhance sustainability, and improve the park system.
Interviewing the key leaders of groups and organizations in the Independence community that are engaged in some level of recreation services offers valuable insight into the community’s needs and desires for indoor recreation space. The interviews consisted of one-on-one discussions with city officials and council members. Key leaders interviewed were actively involved in recreation services and provided a meaningful method of community engagement through their thoughts about the park system in Independence.
The interviewer interacted with participants in a casual and conversational manner when asking the questions to encourage each participant to provide their personal input. The community leaders were given an open opportunity to express their views of the existing park system as well as what recreational activities they felt the community needs and would enjoy the most. Interviewees were also asked about their thoughts about issues within the park system they felt needed improvement or experiences that did not meet their expectations.
The questions used in the interviews encouraged participants to provide informal answers with the flexibility to elaborate freely or ask the interviewer to further explain any of the questions. In general, participants were asked about their usage of the city’s facilities and other nearby recreational offerings, overall operations of the park system, if there are programs and facilities they feel should be added or expanded in the community, and their views on how parks and recreation can be financially supported.
There were several focus groups of multiple participants and also many individuals that were interviewed. Individuals chosen were from various backgrounds and are residents of Independence including:
• City Council Members
• Parks Organizations and Groups
• School Officials
• Chamber of Commerce
• Cultural Associations
• Residents
This report presents a summary of the interviews that were conducted individually and in person by PROS Consulting leadership staff. The participants were encouraged to be candid in their responses and were not required to answer any question they were uncomfortable with, unable to answer, or did not want to contribute to.
For reference, the actual questions asked during the interviews are listed below.
1. What types of parks and recreation opportunities are most needed in Independence? This could be something new that Independence does not have today, or something you feel is needed now.
2. Are there any barriers preventing some residents of Independence from using the parks, recreation facilities, and historic sites more frequently? If so, what are they?
3. Do you think most residents feel welcome when they visit an Independence park, recreation facility, or historic site? What can we do to make them feel more welcome?
4. Do you feel safe when you are using Independence parks and trails?
5. Do you feel the efforts by the Parks, Recreation and Historic Sites system to get out the information that citizens need about the services provided is effective in providing information through (social media, City Website, Program Guide, Advertisements, or other means)? How do you want to get information about the park, recreation, and historic site system to you personally?
6. What are the major challenges you foresee for Independence Parks, Recreation, and Historic Sites in the next 5 years? How should Independence Parks, Recreation and Historic Sites respond to those challenges?
7. How would you grade the parks, recreation facilities, and historic sites in terms of 1 being the lowest to 5 being the best in meeting your expectations for a quality experience?
8. What new partnership opportunities should Independence Parks, Recreation, and Historic Sites explore in the future?
9. Are there specific program types that are currently missing that you feel should be provided to residents? If so, what are they?
10. Is access to and preservation of natural areas and open space important for Independence? Do you feel that every resident in Independence should have close-tohome access to nature and open space opportunities in parks?
11. If you could change one thing about Independence Parks, Recreation, and Historic Sites in the next five years, what might that be?
12. If you have a question you would like to see included in the upcoming citizen survey this spring, what would it be?
13. Are there any other questions you have about our process or a comment you would like to make regarding the system or this master plan process?
Notes were taken during the interviews, and seven major themes emerged commonly among the responses. These themes were chosen as the main topics for this summary and are organized by key takeaways and high points. The more prevalent themes are presented as topics, followed by summarized answers. The answers aligning with these themes will be used in other parts of the Independence Parks and Recreation Master Plan to reflect community opinions about the park system.
The seven major themes that emerged throughout answers from the interview questions:
1. Community Priorities and Needs
2. Barriers to Access and Use
3. Equity, Access, and Inclusivity
4. Promotion, Visibility, and Branding
5. Maintenance and Long-Term Sustainability
6. Strategic and Capital Needs
7. Key Themes for the Master Plan
COMMUNITY PRIORITIES AND NEEDS
• Increased focus on youth sports programs and community gathering spaces on the east side of town.
• Greater access to waterways, splash pads, and the outdoor amphitheater for recreational and cultural events.
• Enhanced children's programming like Toddler Town at the Sermon Center, along with senior and teen activities.
• Expansion of disc golf, urban agriculture, and forestry management for underutilized spaces.
• Improved community health initiatives, including better healthy food options and workforce development.
• Emphasis on community pool and shelter houses to boost family and neighborhood engagement.
• More volunteer opportunities to foster community pride and engagement.
• Emphasis on creating multigenerational spaces that accommodate families, seniors, and youth.
• Accessibility improvements to parks and facilities to support a growing, diverse population.
• Limited communication make it hard to find information about available facilities and programs.
• Safety concerns, especially related to homeless individuals and drug use in certain parks.
• Lack of transportation options for youth to reach parks and trails.
• Underutilized parks, public spaces, and other vacant lots could be repurposed for community use.
• Historic sites require maintenance to be more welcoming and usable.
• Challenges for outside organizations to plan community events due to logistical and scheduling challenges.
• Limited public awareness of the historic sites and what they offer.
• Need for clearer signage and better wayfinding to improve navigation within larger parks, to amenities and facilities.
• Gaps in accessibility for individuals with disabilities and the elderly in older facilities.
• Need for more balanced distribution of sports programs across the community, especially for youth on the east side of the city.
• Calls for expanded programs for special needs and youth that are not currently offered.
• Desire for more affordable programming like late-night basketball and low-cost sports and activities.
• Suggestions for community focused urban agriculture and job training to improve community interaction, inclusivity, career awareness, and education.
• Enhanced accessibility standards for community projects and resident involvement including Boy Scout projects and special needs facilities.
• Cultural and arts programming to better represent the diversity of the community and cultural experiences.
• Enhanced outreach to underserved neighborhoods to increase participation and resident involvement.
• Calls for bilingual resources and multicultural events to better represent the community’s diversity and cultural experiences of people in the city.
• Need for a park guide to list all available services, facilities, and schedule of events.
• More effective use of social media platforms, newsletters, and community publications to promote events and the parks.
• Suggestions to collaborate and partner with local businesses and community centers for broader visibility and increased outreach.
• Historic sites need more consistent updates on social media and websites to notify potential visitors.
• Opportunities for cross-promotion with local events and festivals to highlight park amenities and facilities.
• Enhanced branding strategies to establish a recognizable and positive identity for Independence Parks.
• Digital marketing initiatives to reach younger demographics and tech-savvy residents.
• Strong need for consistent maintenance and safety improvements across all park buildings and amenities.
• Emphasis on long-term maintenance plans for playgrounds, splash pads, and community centers to keep the parks in good condition for all visitors.
• Enhanced trail system maintenance, and connections to natural areas that are heavily used.
• Focus on clean and safe environments for the enjoyment of all users, building community pride. and reducing vandalism.
• Participate in forestry management and better utilization of underused park areas.
• Infrastructure upgrades for aging facilities and historic sites to prevent further decline.
• Environmentally sustainable practices to minimize the ecological footprint of park operations.
• Emphasis on community-driven clean-up events to engage residents in park upkeep and create ownership.
• Need for upgraded sports fields to attract tournaments and increase economic opportunities.
• Calls for food truck partnerships and outdoor concert venues to enhance revenue and increase visitors attendance.
• Increase the emphasis on building a new community center and upgrade existing recreation facilities.
• Focus on improving sidewalks and parking lots to enhance accessibility and create additional parking.
• Public-private partnerships and grant opportunities need to be pursued as key funding mechanisms.
• Long-term capital planning to ensure sustainable growth, modernization, and provide funding to continue a welcoming look at all parks.
• Support for regional partnerships to share costs, expand services, demonstrate community support.
• Revenue diversification strategies, new sponsorships, event hosting, and research new funding opportunities.
• Community Engagement: Boosting awareness and involvement through better marketing.
• Safety and Maintenance: Creating clean, safe, and welcoming parks for all ages.
• Modernization and Growth: Upgrading facilities to match regional standards and resident wants.
• Equity and Access: Ensuring all visitors have equal opportunities to participate and enjoy the parks.
• Sustainability and Long-Term Planning: Maintaining quality facilities effectively for future generations.
• Promotion of Arts and Culture: Expanding amphitheaters, concert venues, and community arts.
• Collaborative Partnerships: Engaging local organizations for shared use, cost efficiencies, and user enjoyment.
• Data-Driven Decision Making: Utilizing community surveys and feedback to guide planning and effective decision making
• Strong desire for a new Community Center, both for sports and community events; some suggest it should include aquatics and indoor facilities for yearround use.
• Realize improved sports tourism opportunities and develop larger and well-maintained facilities, especially for baseball, soccer, and regional tournaments.
• Water recreation is highly desired, with many referencing the closure of Adventure Oasis and the limited access of public swimming pools in the city.
• Enhanced trails and walking paths are frequently mentioned and needed for community access and connectivity, including better maintenance.
• High demand for pickleball courts, especially as the sport continues to grow in popularity, and mention of indoor and outdoor courts.
• Suggestions for nature programming and improved camping facilities to encourage outdoor recreation.
• Upgrading tired and aging parks to modern standards, increase appeal, and make them more inviting and accessible.
• Emphasis on additional inclusive programming for teens and adults aged 18–55, who currently are restricted in the lack of dedicated recreational opportunities.
• Interest in regional park improvements to create destination parks that draw visitors from outside the community for programming, events, and activities.
• Safety concerns are a consistent barrier, particularly around certain trails and parks with homeless individuals.
• Some park locations are not easily accessible due to poor sidewalk infrastructure or busy highways limiting safe pedestrian use.
• Transportation limitations for low-income residents are known to restrict access to parks and facilities.
• Admission costs for certain programs and facilities may be a limiting factor for some residents.
• Outdated and poorly maintained facilities have discouraged people from visiting since some buildings are losing appeal and have unkept conditions, particularly at certain historic sites and playgrounds.
• Communication gaps in promoting park amenities and program availability prevents residents from being aware of what is offered.
• Seasonal accessibility issues like snow removal on trails and playground care during winter months limits year-round use.
• Some parks are located in remote or underdeveloped areas, making them less attractive for residents to visit.
• Limited restroom facilities and the cleanliness of existing ones that are nearly unusable for families.
• Calls for parks on the east side of the city, which is currently underserved compared to the west side.
• There is a desire for programs for all age groups, specifically for teens and adults aged 18–55, who currently have fewer recreational options.
• Improving ADA accessibility is important at historic sites and parks to ensure inclusive access for all community members.
• More attention toward future program offerings including health, wellness, and sports activities for the underserved and culturally diverse parts of the community.
• Ensuring that historic sites are both accessible and well-maintained to promote inclusivity in city history and promotion of tourism.
• Suggestions for free or discounted entry for low-income families and seniors to ensure equitable access.
• Expanding multi-language signage and program guides to reach non-English speaking residents.
• Emphasizing family-oriented activities and events to bring diverse groups together in community spaces.
• Community-based programs that celebrate cultural diversity, such as international festivals and themed community days.
• Stronger marketing efforts are needed, including better use of social media, city websites, and program guides.
• Suggestions for a more comprehensive strategy to communicate with seniors and new residents who may not be familiar with available services in the parks.
• Collaboration with tourism boards to promote historic sites and regional events.
• Some respondents felt that tourism and historic site promotion are disconnected and need a more unified strategy and outreach.
• Improved digital platforms that allow real-time updates on events, program availability, and facility reservations.
• Improved wayfinding signage in parks and along trails to help visitors navigate and explore more easily.
• Increased community outreach through local schools, libraries, and community centers to promote park programs and activities.
• More interactive community engagement, such as pop-up events, farmers markets, and community-led park clean-up days.
• Co-branding opportunities with local businesses and organizations to increase visibility and encourage sponsorships.
• Many parks are described as “tired” and in need of revitalization, with calls for better maintenance and safety improvements.
• Funding for upkeep is a major concern, with references to the aging system needs and budget constraints.
• Some respondents suggest closing underutilized parks to reallocate resources to more popular and well-kept sites.
• Historic site preservation is seen as critical, with funding and maintenance cited as ongoing challenges.
• Several interviewees mentioned the importance of quality over quantity, suggesting that fewer well-maintained parks might serve the community better.
• Trail maintenance is frequently cited as an area needing improvement, particularly bridges and trail surfaces.
• Better lighting and security measures in parks to ensure safety and deter vandalism.
• Sustainable landscaping and green infrastructure to reduce maintenance costs and improve environmental impact.
• Upgraded playground equipment and restroom facilities to enhance usability and resident experience.
• A new recreation/community center is identified as a top capital need, especially to host sports tournaments and large community events.
• Improve trail connectivity and expansion, particularly in underserved areas of the city.
• Calls for capital investment in historic sites to preserve and enhance their use for tourism and community engagement.
• Suggestions for public-private partnerships to fund new developments and improvements, particularly for developing sports complexes.
• Long-term funding strategies like municipal bonds and leveraging grants for site improvements were frequently mentioned.
• Calls for a strategic plan that clearly outlines priorities for park development, maintenance, and program expansion.
• Assessment of underused properties for potential sale or repurposing to fund new projects.
• Expansion of aquatic facilities, either with a new splash pad or renovated swimming pools.
• Development of a regional sports complex to attract tournaments and generate revenue.
• Focus on community connectivity through trails, green spaces, and gathering places.
• Shift towards regional tourism and sports tourism as a means of economic growth.
• Equitable distribution of park services, ensuring underserved areas have access to quality recreational opportunities.
• Emphasis on community safety and revitalization to make parks more inviting and welcoming.
• Prioritization of youth and adult programming to expand recreational offerings across all age groups.
• Developing public-private partnerships to sustain long-term projects without burdening the city budget.
• Commitment to sustainable practices in park maintenance and new development.
• Strategic assessment of existing parks to identify those that can be enhanced, repurposed, or decommissioned.
• Integration of historic site promotion as part of the broader parks system growth strategy.
• Historic Site Tourism: Opportunities for expanding cemetery tourism and regional marketing of existing historic assets.
• Cultural Programming: The rise in popularity of community theater and cultural events highlights a need for more cultural amenities and activities within the park system.
• Communication Gaps: Persistent lack of awareness about existing facilities and services indicates the need for improved outreach throughout the community.
• Economic Development through Sports Tourism: Strategic investments in sports facilities could bring economic gains through tournaments, field rentals, and regional events.
• Strong need for water recreation facilities, especially following the closure of the water park. Residents consistently mention a lack of aquatic options.
• Youth sports and family activities are highly requested, with calls for bettermaintained fields, turf upgrades, and more inclusive playgrounds.
• Interest in community centers with modern amenities for indoor recreation, fitness, and community events.
• Residents express concerns over the condition of sports fields, particularly dirt infields that are not competitive with nearby cities like Lee's Summit and Liberty Parks.
• The McCoy Park Variety-KC inclusive playground for physically challenged children is underutilized due to lack of promotion and community awareness.
• Calls for more activities for children and families that encourage local use rather than traveling to nearby communities.
• Inclusive park designs that support disabled and elderly community members, along with better maintained paths and accessible spaces.
• Enhanced playgrounds and modern equipment to keep children engaged and encourage outdoor play.
• Outdoor concerts and community events to increase community engagement and recreational opportunities for all residents.
• Safety concerns in certain parks, with mentions of vandalism, homelessness, and the presence of unsupervised teens.
• Transportation barriers are noted due to the lack of availability to bus lines, making access to certain parks difficult for lowincome families.
• Limited awareness of available parks and programs, with some residents unaware of facilities like McCoy Park Variety-KC inclusive playground.
• Lack of restroom facilities and proper maintenance discourage longer stays in parks.
• Vandalism and misuse of certain parks lead to community hesitancy to visit, especially after hours.
• Fields that remain unlocked and unmonitored after hours, resulting in damage and severe littering.
• Not enough walking-distance parks for those without transportation, highlighting a need for more neighborhood-centered green spaces.
• Operating hours and security concerns at facilities like Mill Creek Park are mentioned as barriers to safe and secure use.
• Marketing and communication gaps prevent residents from learning about parks and events.
• Emphasis on inclusive parks and playgrounds, ensuring spaces are accessible for disabled and elderly residents.
• Regional disparities are evident, with parks concentrated on the west side of town and limited access in the east.
• ADA accessibility improvements are suggested for historic sites and older playgrounds to allow all residents to enjoy the amenities.
• Suggestions for transportation options to connect underserved communities to larger regional parks and community centers.
• Calls for more multi-language communication and signage to ensure non-English speaking residents are informed about programming, events and activities.
• Community-oriented programs that cater to immigrants and marginalized groups for more cultural interaction.
• Enhanced pathway connectivity for safer pedestrian access to parks and recreation sites.
• Outreach to underserved communities to ensure equitable access to recreational programs and facilities.
• More park features for teenagers and adults, such as fitness zones and interactive activities.
• Residents feel that social media efforts are fragmented, with a heavy reliance on Facebook, leaving out non-users.
• Calls for better cross-platform marketing, including Nextdoor, email updates, and more interactive websites.
• Suggestions for improved digital engagement through interactive maps, live event updates, and mobile-friendly websites.
• Enhanced community outreach and education about existing parks, facilities, and historic sites to boost awareness.
• Better promotion of special amenities, such as the McCoy Park VarietyKC inclusive playground and certain historic sites.
• Increased visibility of community events that take place in parks to attract more local residents.
• Coordinated tourism and historic site marketing, with suggestions to create partnerships with local hotels and visitor centers.
• Community engagement at local events like farmers' markets and city fairs to spread park system awareness.
• Suggestions for park-specific branding to create a unique identity for each major park in the city.
• Community members are concerned about the maintenance of parks and fields, with many citing poor upkeep of playgrounds and athletic fields.
• Calls for better security and lighting in parks to prevent vandalism and ensure community safety.
• Suggestions for upgrading old playground equipment and improving restroom facilities.
• Closing underutilized parks and focusing on enhancing high-use areas for sustainability.
• Some parks, such as Mill Creek, are noted for vandalism and lack of proper management.
• Security measures are needed to reduce after-hours misuse of fields and prevent property damage.
• Regular maintenance schedules and increased staff training to ensure fields and playgrounds are in good condition for all users.
• Better funding for historic site preservation, with mentions of poor maintenance affecting community use.
• Emphasis on sustainable practices in maintenance and operations to reduce long-term repair/replacement costs.
• Residents express a strong desire for a new community center that includes a swimming pool, indoor recreation, and multi-purpose event spaces.
• Improved sports facilities, including turf fields and upgraded playgrounds, are identified as key investments by the community.
• Strategic partnerships with businesses, school districts, and local organizations to fund projects and share resources.
• Suggestions for public-private partnerships to support large-scale projects like regional sports complexes and aquatics centers.
• Long-term strategic planning to identify priority areas for development and focus resources effectively.
• Grant opportunities and sponsorships to help fund major capital improvements and park expansions.
• Modernizing existing recreation centers like the Sermon Center, which is currently in disrepair.
• Development of new aquatic facilities to replace the closed water park and an indoor aquatics center that would offer year-round swimming.
• Emphasis on public input and community surveys to guide future development and ensure alignment with residents' needs.
• Focus on safety, accessibility, and maintenance to improve community confidence and usage.
• Enhanced community engagement through more inclusive programs for all ages and demographics.
• Strategic investments in sports and aquatics to draw tourism and boost local recreational use.
• Better marketing and promotion strategies to increase awareness of park amenities and events.
• Sustainable maintenance practices to preserve parks for long-term community benefit.
• Equitable access to parks across all regions, ensuring underserved areas receive appropriate development.
• Strong emphasis on public-private partnerships to bridge funding gaps and expand services.
• Trail connectivity and pedestrian pathways to link neighborhoods to key parks and recreation centers.
• Expansion of cultural and community events that highlight local heritage and community pride.
Utilizing all answers from every group interviewed, certain topics emerged as underlying and common themes among many responses. These topics are shown below.
COMMUNITY ENGAGEMENT AND VOLUNTEERISM:
• Many respondents indicated a desire for more volunteer involvement in park maintenance and programming. Some mentioned the need for Boy Scout projects and community-led initiatives to enhance park facilities and promote a sense of ownership.
• There were multiple comments about the missed opportunities for sports tourism in Independence. Several interviewees pointed out that the city could benefit from better-maintained sports fields and larger sports complexes to host local practices, games, regional tournaments, and draw visitors to the parks and city.
CULTURAL PROGRAMMING AND ARTS INTEGRATION:
• A few responses highlighted the need for more cultural programming, such as outdoor concerts, theater productions, and music festivals.
• Communities like Blue Springs were referenced as successful models for integrating arts into parks and public spaces.
• Independence’s historical sites were seen as underutilized for tourism and economic development. Some participants suggested better marketing and strategic partnerships to promote the city's unique historical significance.
• The need for more inclusive parks that accommodate children with special needs and mobility challenges was mentioned. Improvements for ADA compliance and better transportation access to parks were also noted as critical for expanding use.
• Interviewees expressed interest in better trail connectivity, particularly linking parks and natural areas to residential neighborhoods. Expanding walking and biking paths to create a seamless network was seen as a major opportunity for community health and recreation.
• Several comments referred to issues with homelessness in parks, which was seen as a deterrent for park usage. Respondents suggested more consistent enforcement of park rules, as well as designated park rangers to address safety concerns.
• The closure of Adventure Oasis was frequently mentioned, and many saw the loss as a significant gap in water-based recreation. There were suggestions for either reopening it or replacing it with a more sustainable water attraction.
• Numerous responses pointed out the lack of recreation opportunities for teenagers and young adults. Programs like late-night basketball, expanded sports leagues, and workforce development activities were suggested to fill this gap.
• Several interviewees emphasized the need for improved marketing strategies to increase awareness of park programs and facilities. Suggestions included enhanced social media presence, community resource guides, and stronger partnerships with local schools and libraries.
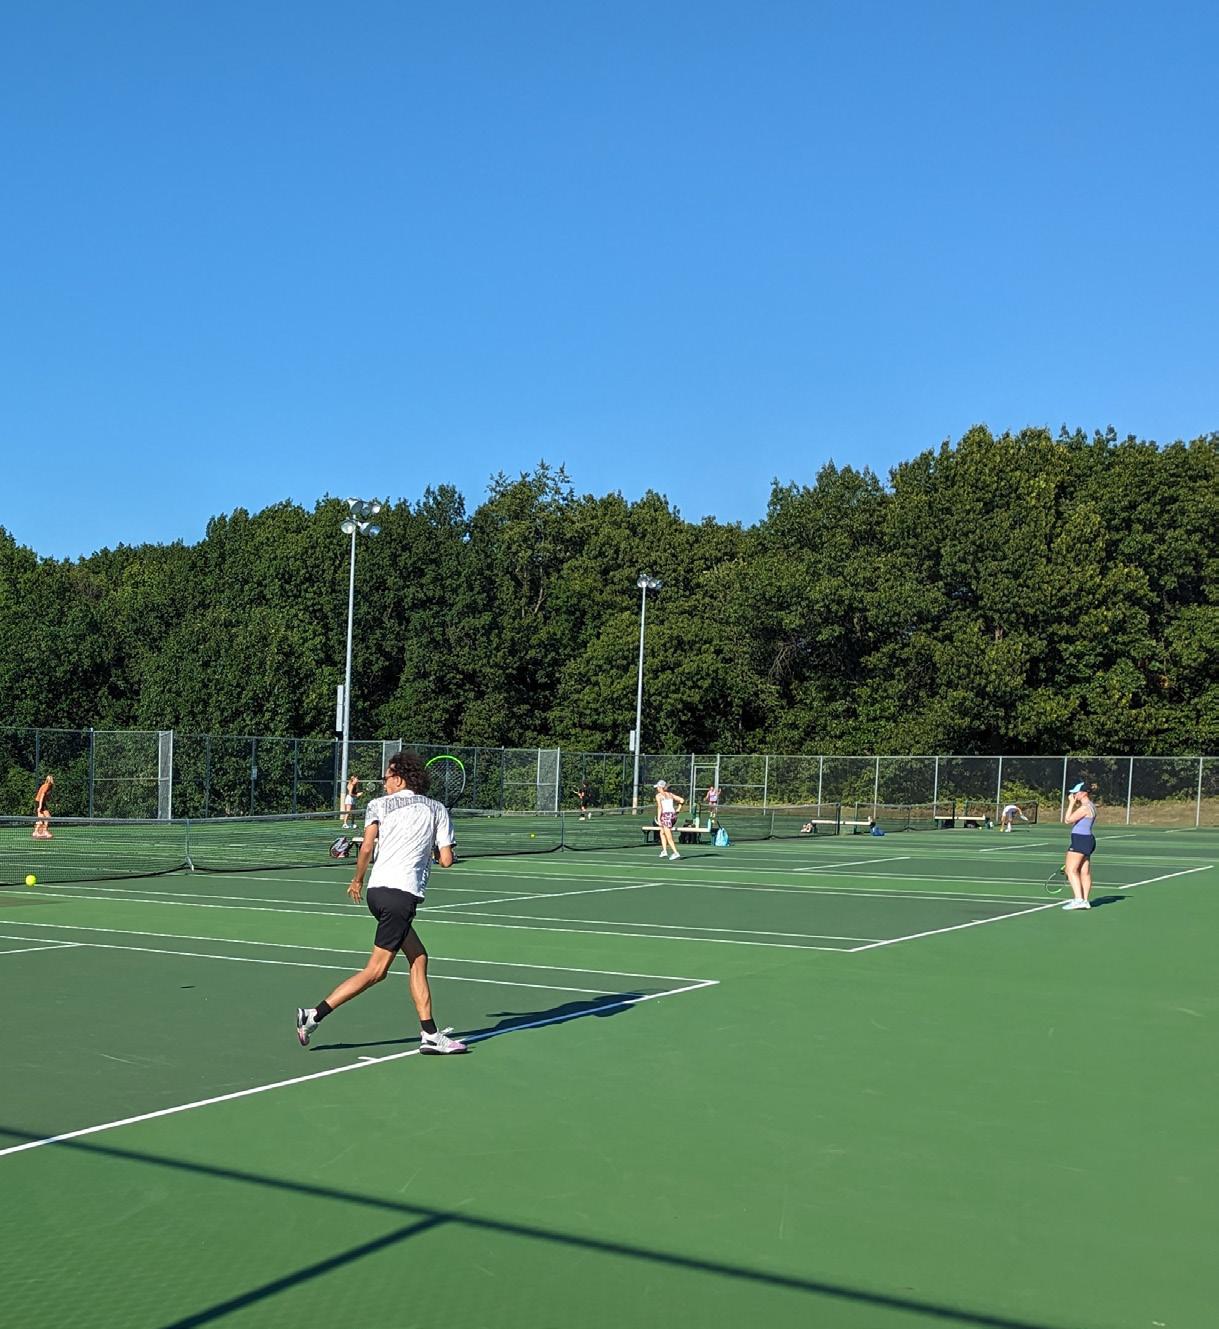
ETC Institute administered a needs assessment survey (Appendix A) for Independence during the summer of 2025. The purpose of the survey was to help determine park and recreation priorities for the community.
ETC Institute mailed a survey packet to a random sample of households throughout the City of Independence. Each survey packet contained a cover letter, a copy of the survey, and a postagepaid return envelope. Residents who received the survey were given the option of returning the survey by mail or completing it online.
After the surveys were mailed, the ETC Institute followed up with residents to encourage participation. To prevent people who were not residents of Independence from participating, everyone who completed the survey online was required to enter their home address prior to submitting their survey. ETC Institute then matched the addresses entered online with the addresses originally selected for the random sample. If the address from a survey completed online did not match one of the addresses selected for the sample, the online survey was not included in the final database for this report.
The goal was to receive 800 completed surveys from households within the City of Independence. This goal was exceeded, with 802 completed surveys collected. The overall results for the sample of 802 residents have a precision of at least +/-3.5% at the 95% level of confidence.
Use of Facilities: Eighty-two percent (82%) of respondents report visiting Independence parks and/or recreation facilities during the past 12 months. Most respondents (61%) rated those facilities as either “excellent” (10%) or “good” (51%).
Barriers to Facility Use: Respondents were asked to indicate all of the reasons that prevent them and members of their household from visiting Independence parks and recreation facilities more often. The top three barriers were they do not feel safe using parks/facilities (40%), lack of features they want to use (27%), and use of other City, State, private facilities (25%).
Program Participation: Thirty-five percent (35%) of respondents report participating in programs or events offered by Independence Parks and Recreation in the past 12 months. Most respondents (77%) rated these programs or events as either “excellent” (22%) or “good” (55%).
Barriers to Participation: Respondents were asked to identify why they do not participate in these programs or events more often. The top three barriers to participation they indicated were that they do not know what is offered (61%), too busy/not interested (20%), and lack of quality programs (11%).
Communication Methods: The three ways respondents most often learn about Independence’s parks and recreation facilities, programs, and events are social media (71%), city website (41%), and neighborhood mailer (40%). The three ways they would most prefer are social media (66%), neighborhood mailer (35%), and emails from the department (34%).
The Priority Investment Rating (PIR) was developed by ETC Institute to provide organizations with an objective tool for evaluating the priority that should be placed in recreation and parks investments. The Priority Investment Rating (PIR) equally weighs (1) the importance that residents place on amenities/facilities and (2) how many residents have unmet need for the amenity/facility.
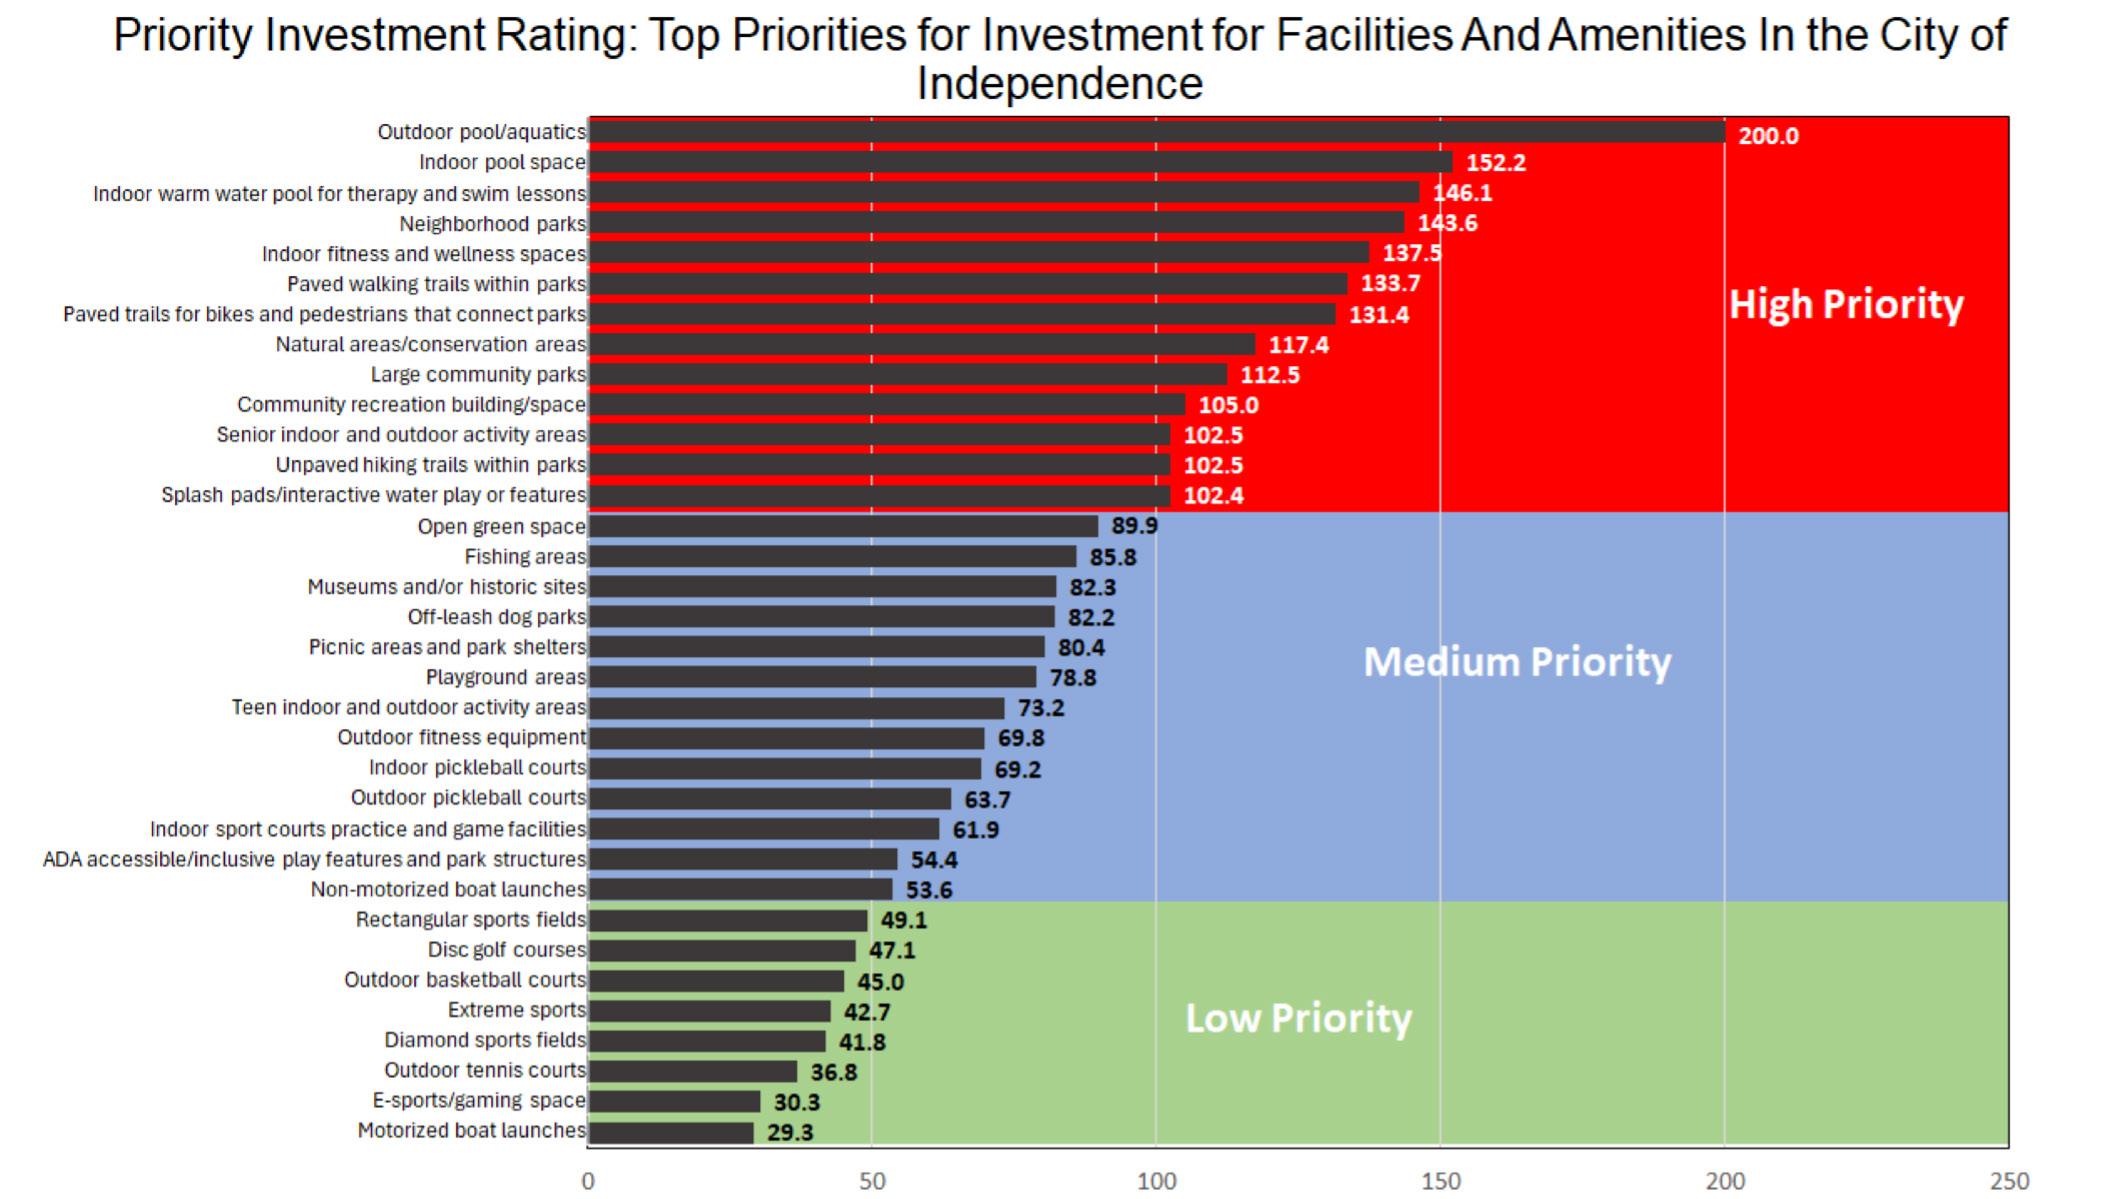
Based on the Priority Investment Rating (PIR), the following amenities/facilities were rated as high priorities for investments:
• Outdoor pool/aquatics (PIR=200)
• Indoor pool space (PIR=152.2)
• Indoor warm water pool for therapy and swim lessons (PIR=146.1)
• Neighborhood parks (PIR=143.6)
• Indoor fitness and wellness spaces (PIR=137.5)
• Paved walking trails within parks (PIR=133.7)
• Paved trails for bikes and pedestrians that connect parks (PIR=131.4)
• Natural areas/conservation areas (PIR=117.4)
• Large community parks (PIR=112.5)
• Community recreation building/space (PIR=105)
• Senior indoor and outdoor activity areas (PIR=102.5)
• Unpaved hiking trails within parks (PIR=102.5)
• Splash pads/interactive water play or features (PIR=102.5)
Based the Priority Investment Rating (PIR), the following activities/programs were rated as high priorities for investment:
• Special events (PIR=200)
• Adult fitness and wellness programs (PIR=187.5)
• Life skill programs (PIR=155.9)
• Water fitness programs (PIR=154.4)
• Nature programs/environmental education (PIR=146.6)
• Programs for seniors (PIR=144.3)
• Programs that promote local history (PIR=135.8)
• Adult art/dance/performing arts (PIR=110.8)
• Water-based recreation programs (PIR=107.5)
• Youth learn to swim programs (PIR=103.4)
• Dog park programs (PIR=100)
The chart below shows the Priority Investment Rating for each of the 28 programs assessed on the survey.
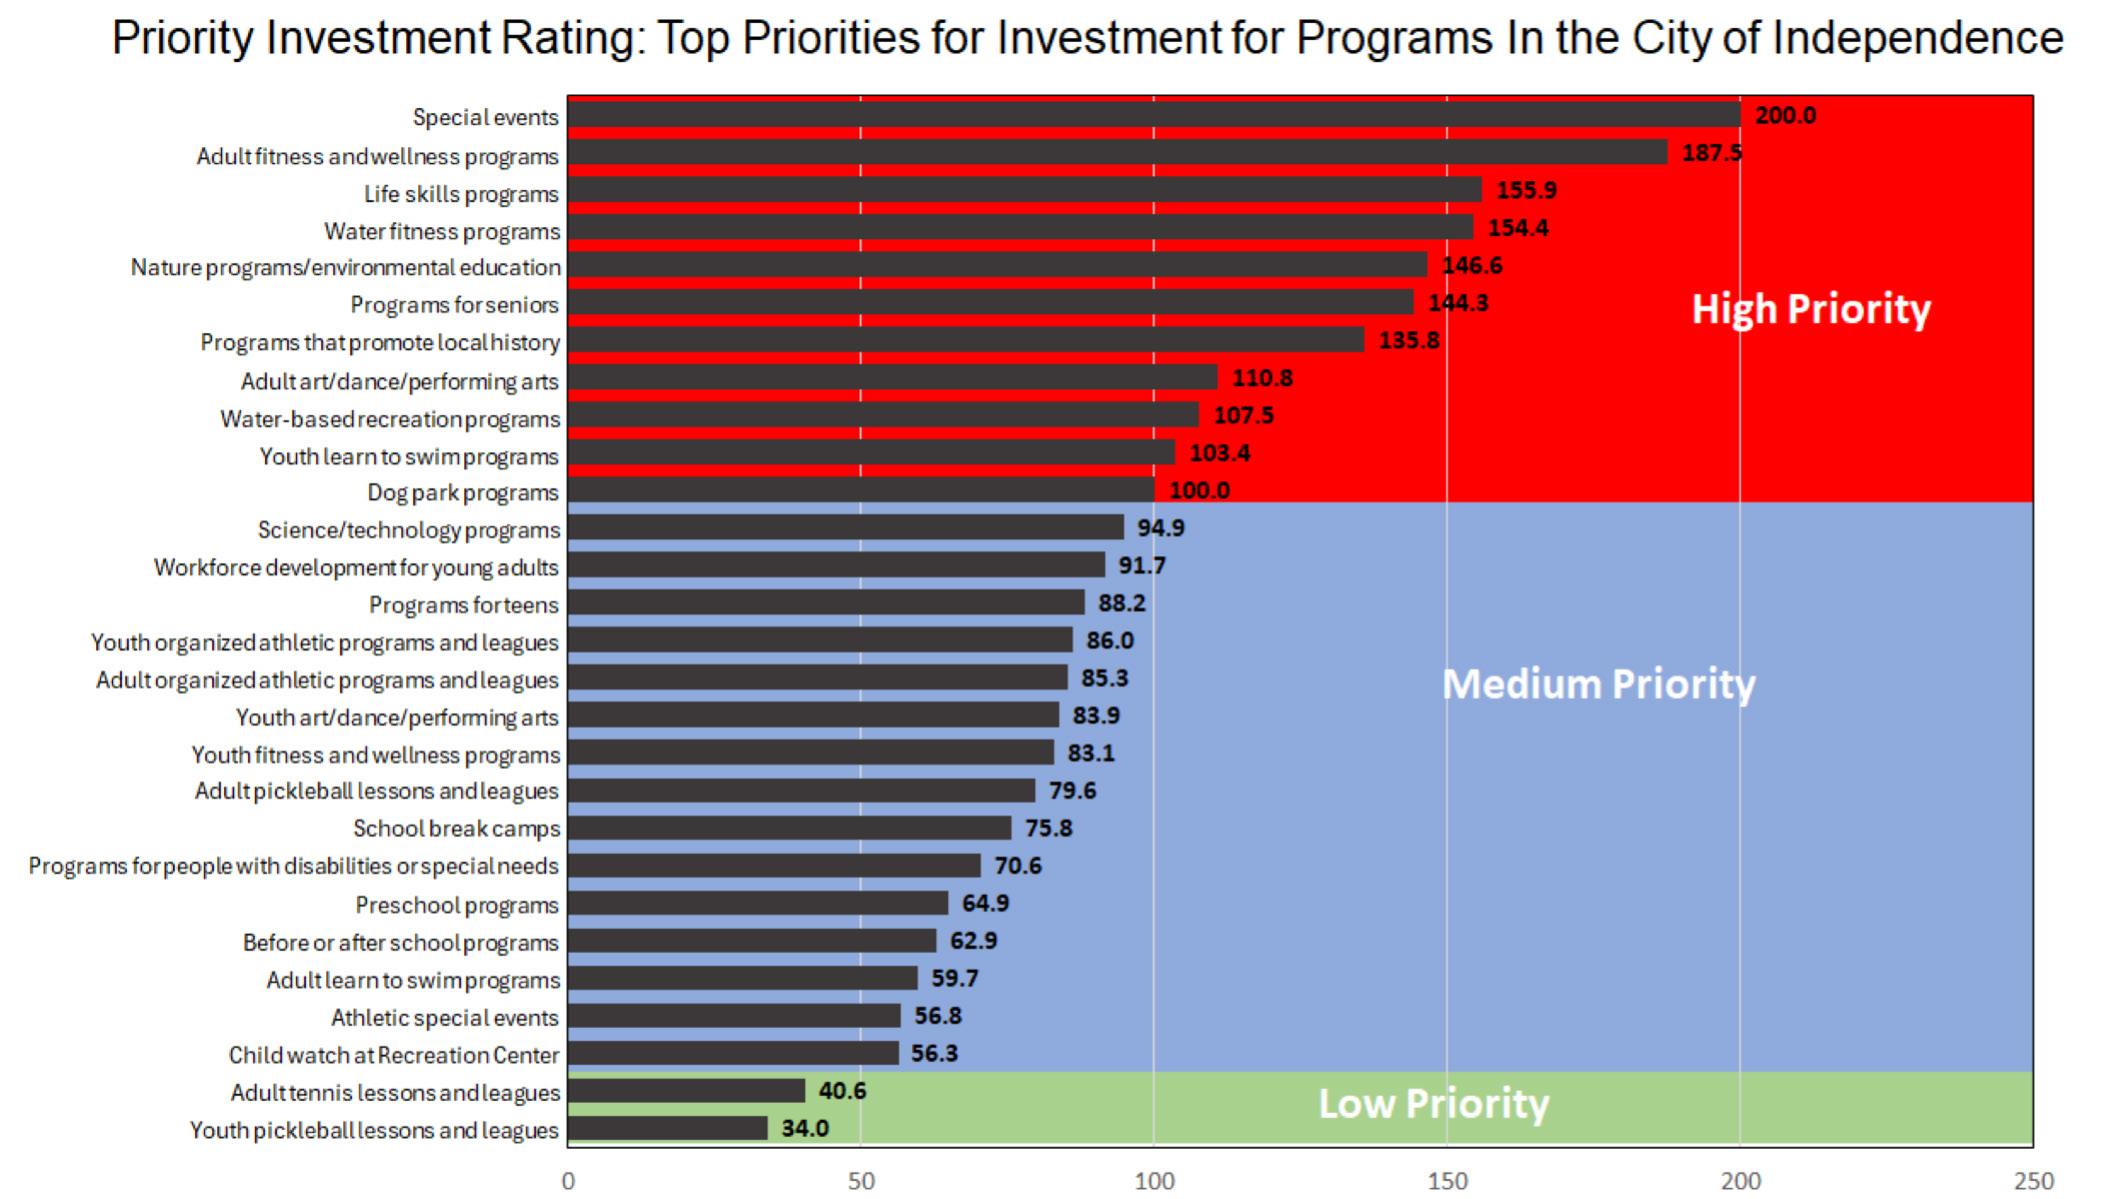
In April of 2025, Independence launched a project website for the master plan. The goal of the website, hosted through Social Pinpoint, was to provide ongoing updates to the community on the progress of the master plan and crowdsource input from the community on parks and recreation priorities. The website was “live” to the community through December of 2025 and also included features such as an online survey (available online from April – mid-November), an interactive social mapping activity, and a community vison board.
During this time, the website saw 1,092 total visits and had 288 total contributions to the survey, mapping activity and vision board.
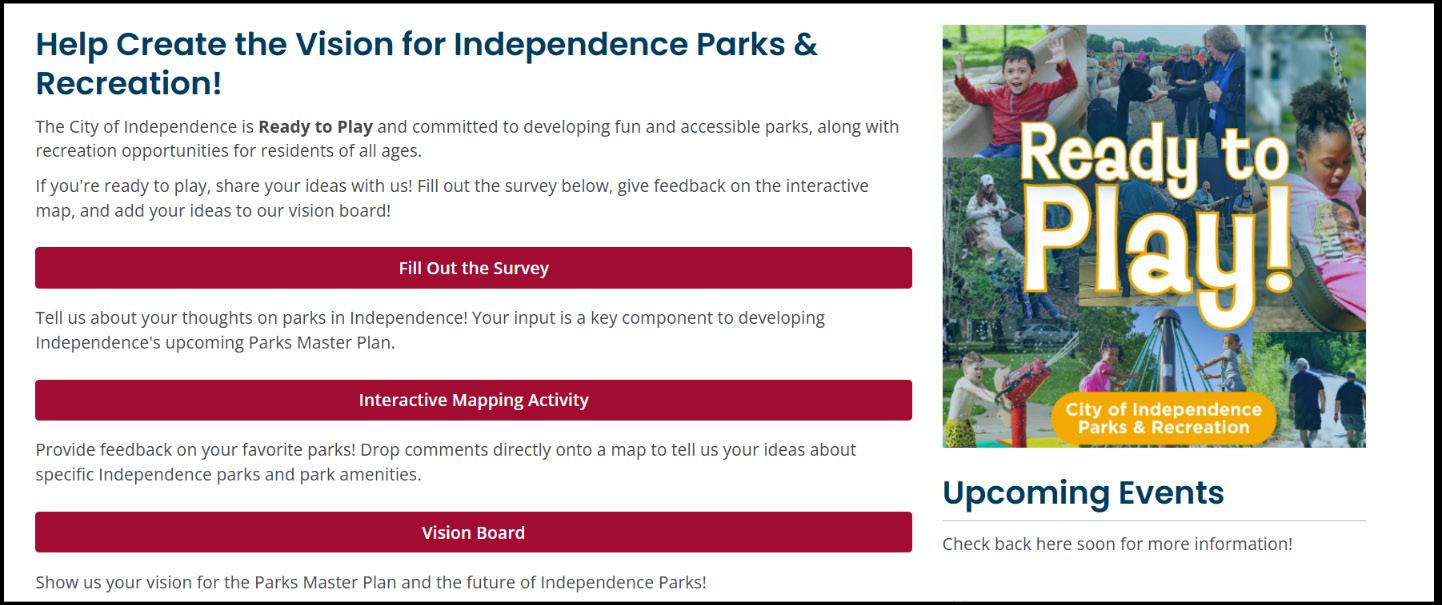
Both an online survey and in-person or handwritten surveys were collected in the summer of 2025 (Appendix B) to gain a better understanding of the characteristics, preferences, and satisfaction levels of Independence youth for the Independence Parks and Recreation Department’s (“Department”) 2025 Master Plan. The survey responses were able to give insight into what activities youth in and around the City participate in, why youth do not participate in Department services and how youth prefer to receive information about parks and recreation services.
There were a few key takeaways from the survey. Survey respondents had the most interest in learning more about activities geared towards food or cooking, video games, swimming, camping/outdoors, or the arts. Additionally, respondents expressed that their top three favorite things to do at a park are visiting the playground, relaxing, and swimming.
Finally, data was collected that may help the Department reach these youth participants. For example, 67% of respondents said that they have not participated in Department programs in the past. The main reason respondents have not participated is because they are not aware of the programs being offered (57% of respondents). To mitigate this, respondents clarified that they prefer social media and word of mouth to find out about these programs and activities.
Additionally, over half of respondents said they primarily attend parks or facilities when with their parents, indicating that participants may be easier to reach if you can reach their parents.
Survey responses were collected online through SurveyMonkey and in-person at various Independence events for just over six weeks, from August through September 2025 and the Department received a total of 107 responses.
At the same time, survey respondents had the option to skip certain questions, which led to some questions having a high number of skipped responses. However, each question was analyzed individually, meaning that skipped responses were not considered.
Please note the language used in this document is not always word for word with the survey. Some questions or responses were shortened for the sake of brevity.
Demographically, the survey was conducted by youth respondents ages 8 through 17. Ages 11 and 12 had the highest representation among survey respondents. More than 73% of respondents indicated that they live in Independence. Lastly, there was a wide range of responses for which school youth attend. The school that had the highest representation was Fort Osage High School, followed by Home School.
The top responses on how youth want to learn about future Department programs and activities included TikTok (20%), Word of Mouth (16%), Instagram (16%), and Facebook (16%). This indicates that the Department should enhance social media marketing to create engaging content that connects with Independence youth to improve awareness of services offered.
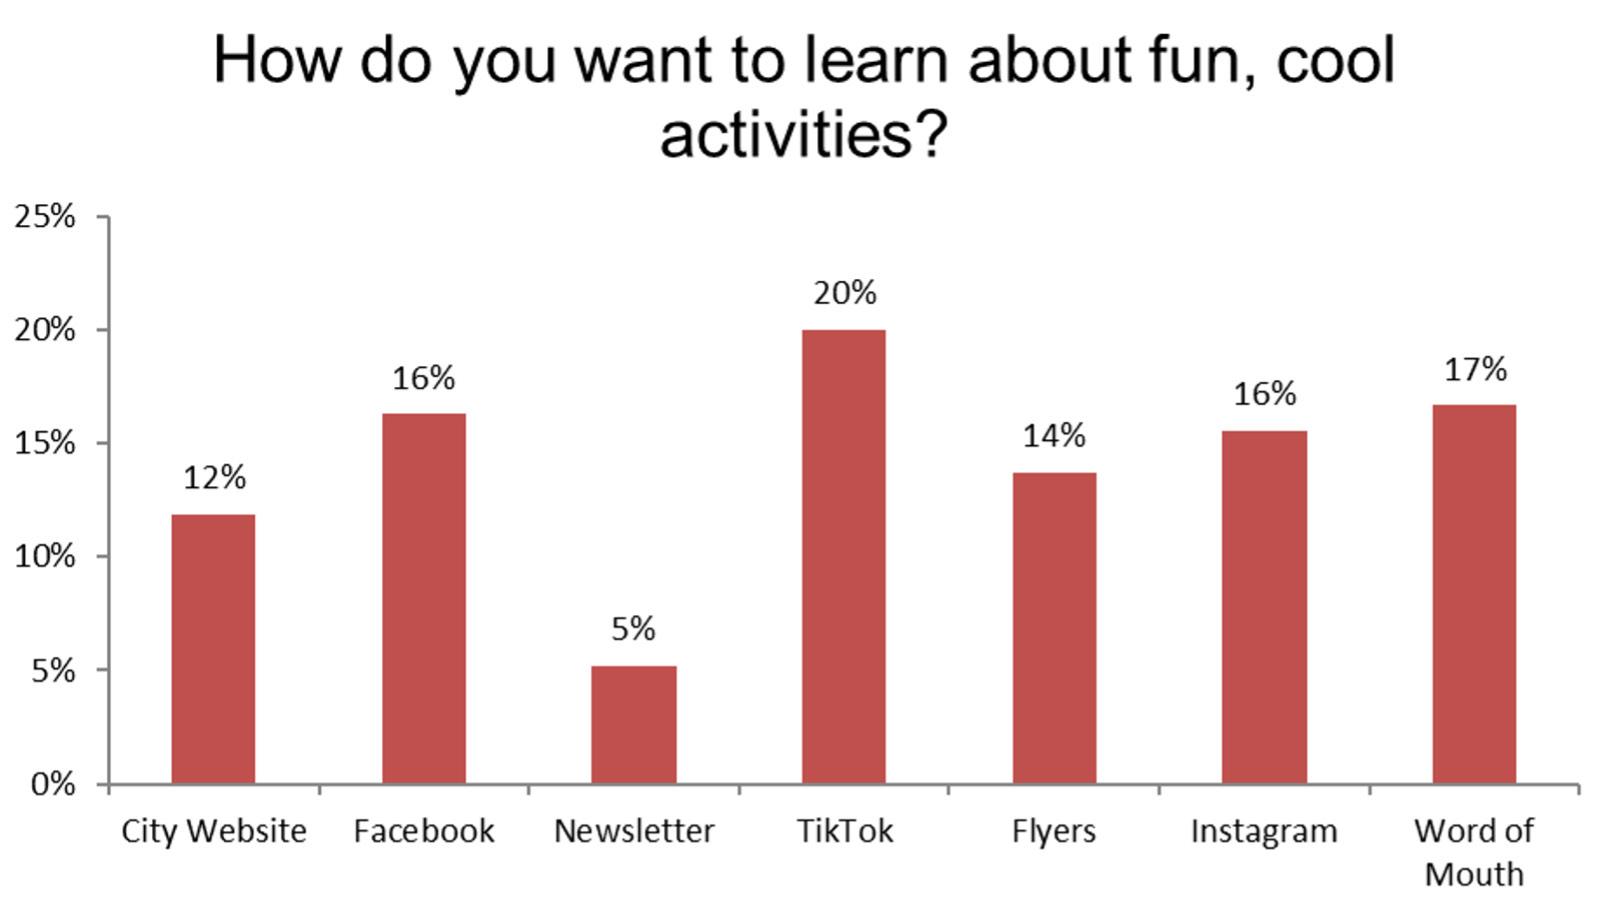
Also, 67% of respondents stated that they have not participated in Department programs or events in the past. More than half of respondents stated the main reason is because they are not aware of programs that the Department offers.
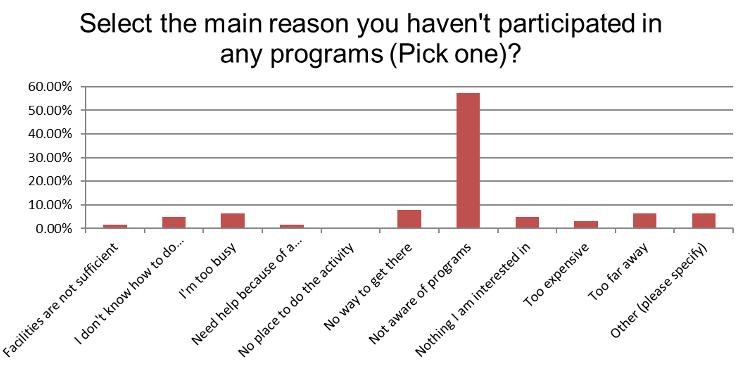
Independence youth were asked about activities that they participate in or wanted to learn more about. The top five activities were Food/Cooking, Video Games, Swimming, Camping/Outdoor Activities, and Watching Movies.
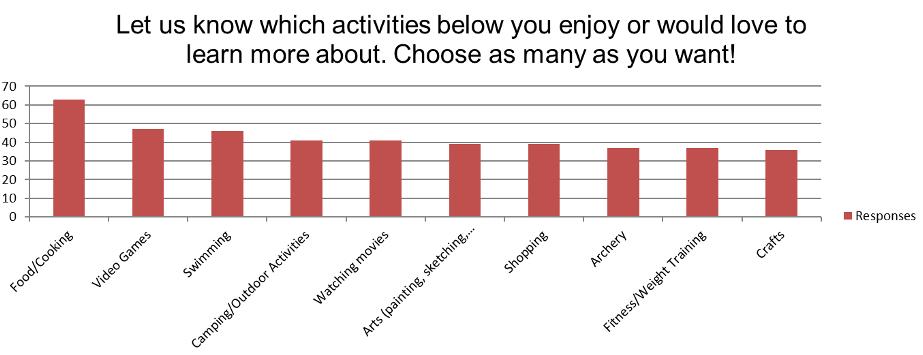
When asked about their top three favorite things to do at a park, youth responded with Playground Fun, Relax and Chill, and Swim.
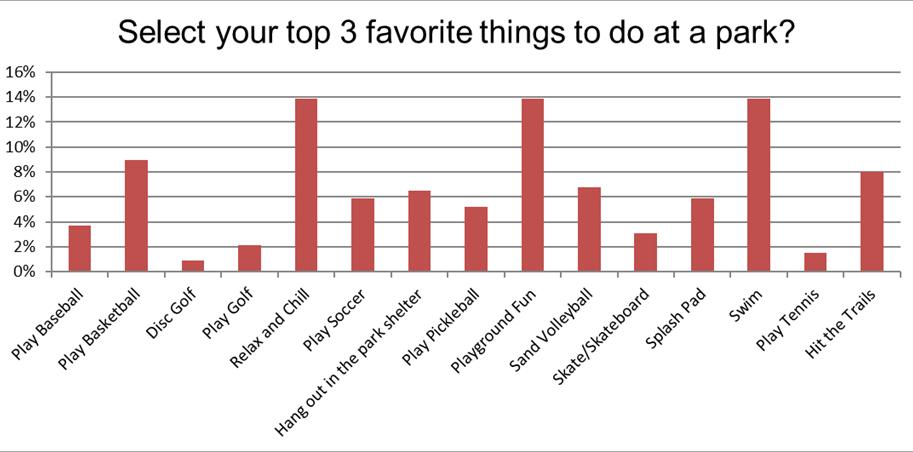
More than half of respondents selected “Parents drive me” as the top way that they get to a park or facility. And most youth are with parents or friends when visiting a park or facility.
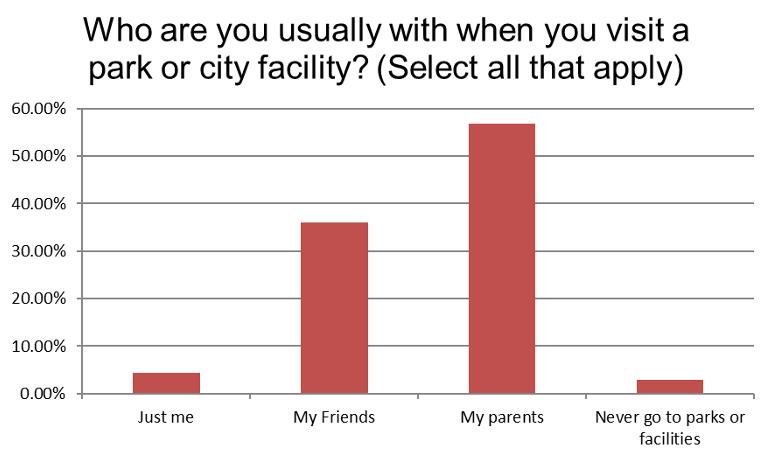
Overall, the results of the youth survey point to several opportunities for the Department. Strengthening marketing and outreach through youth-focused social media platforms, as well as parent and family communication channels, will help address the awareness gap. Program development should prioritize high-interest activities like cooking, gaming, outdoor recreation, swimming, and arts-based programming while creating low-barrier, drop-in opportunities to attract first-time participants. Continued youth engagement through surveys or focus groups will ensure that programs remain responsive to evolving interests, while investments in park amenities for play, relaxation, and family activities will help create welcoming spaces for youth and their families.
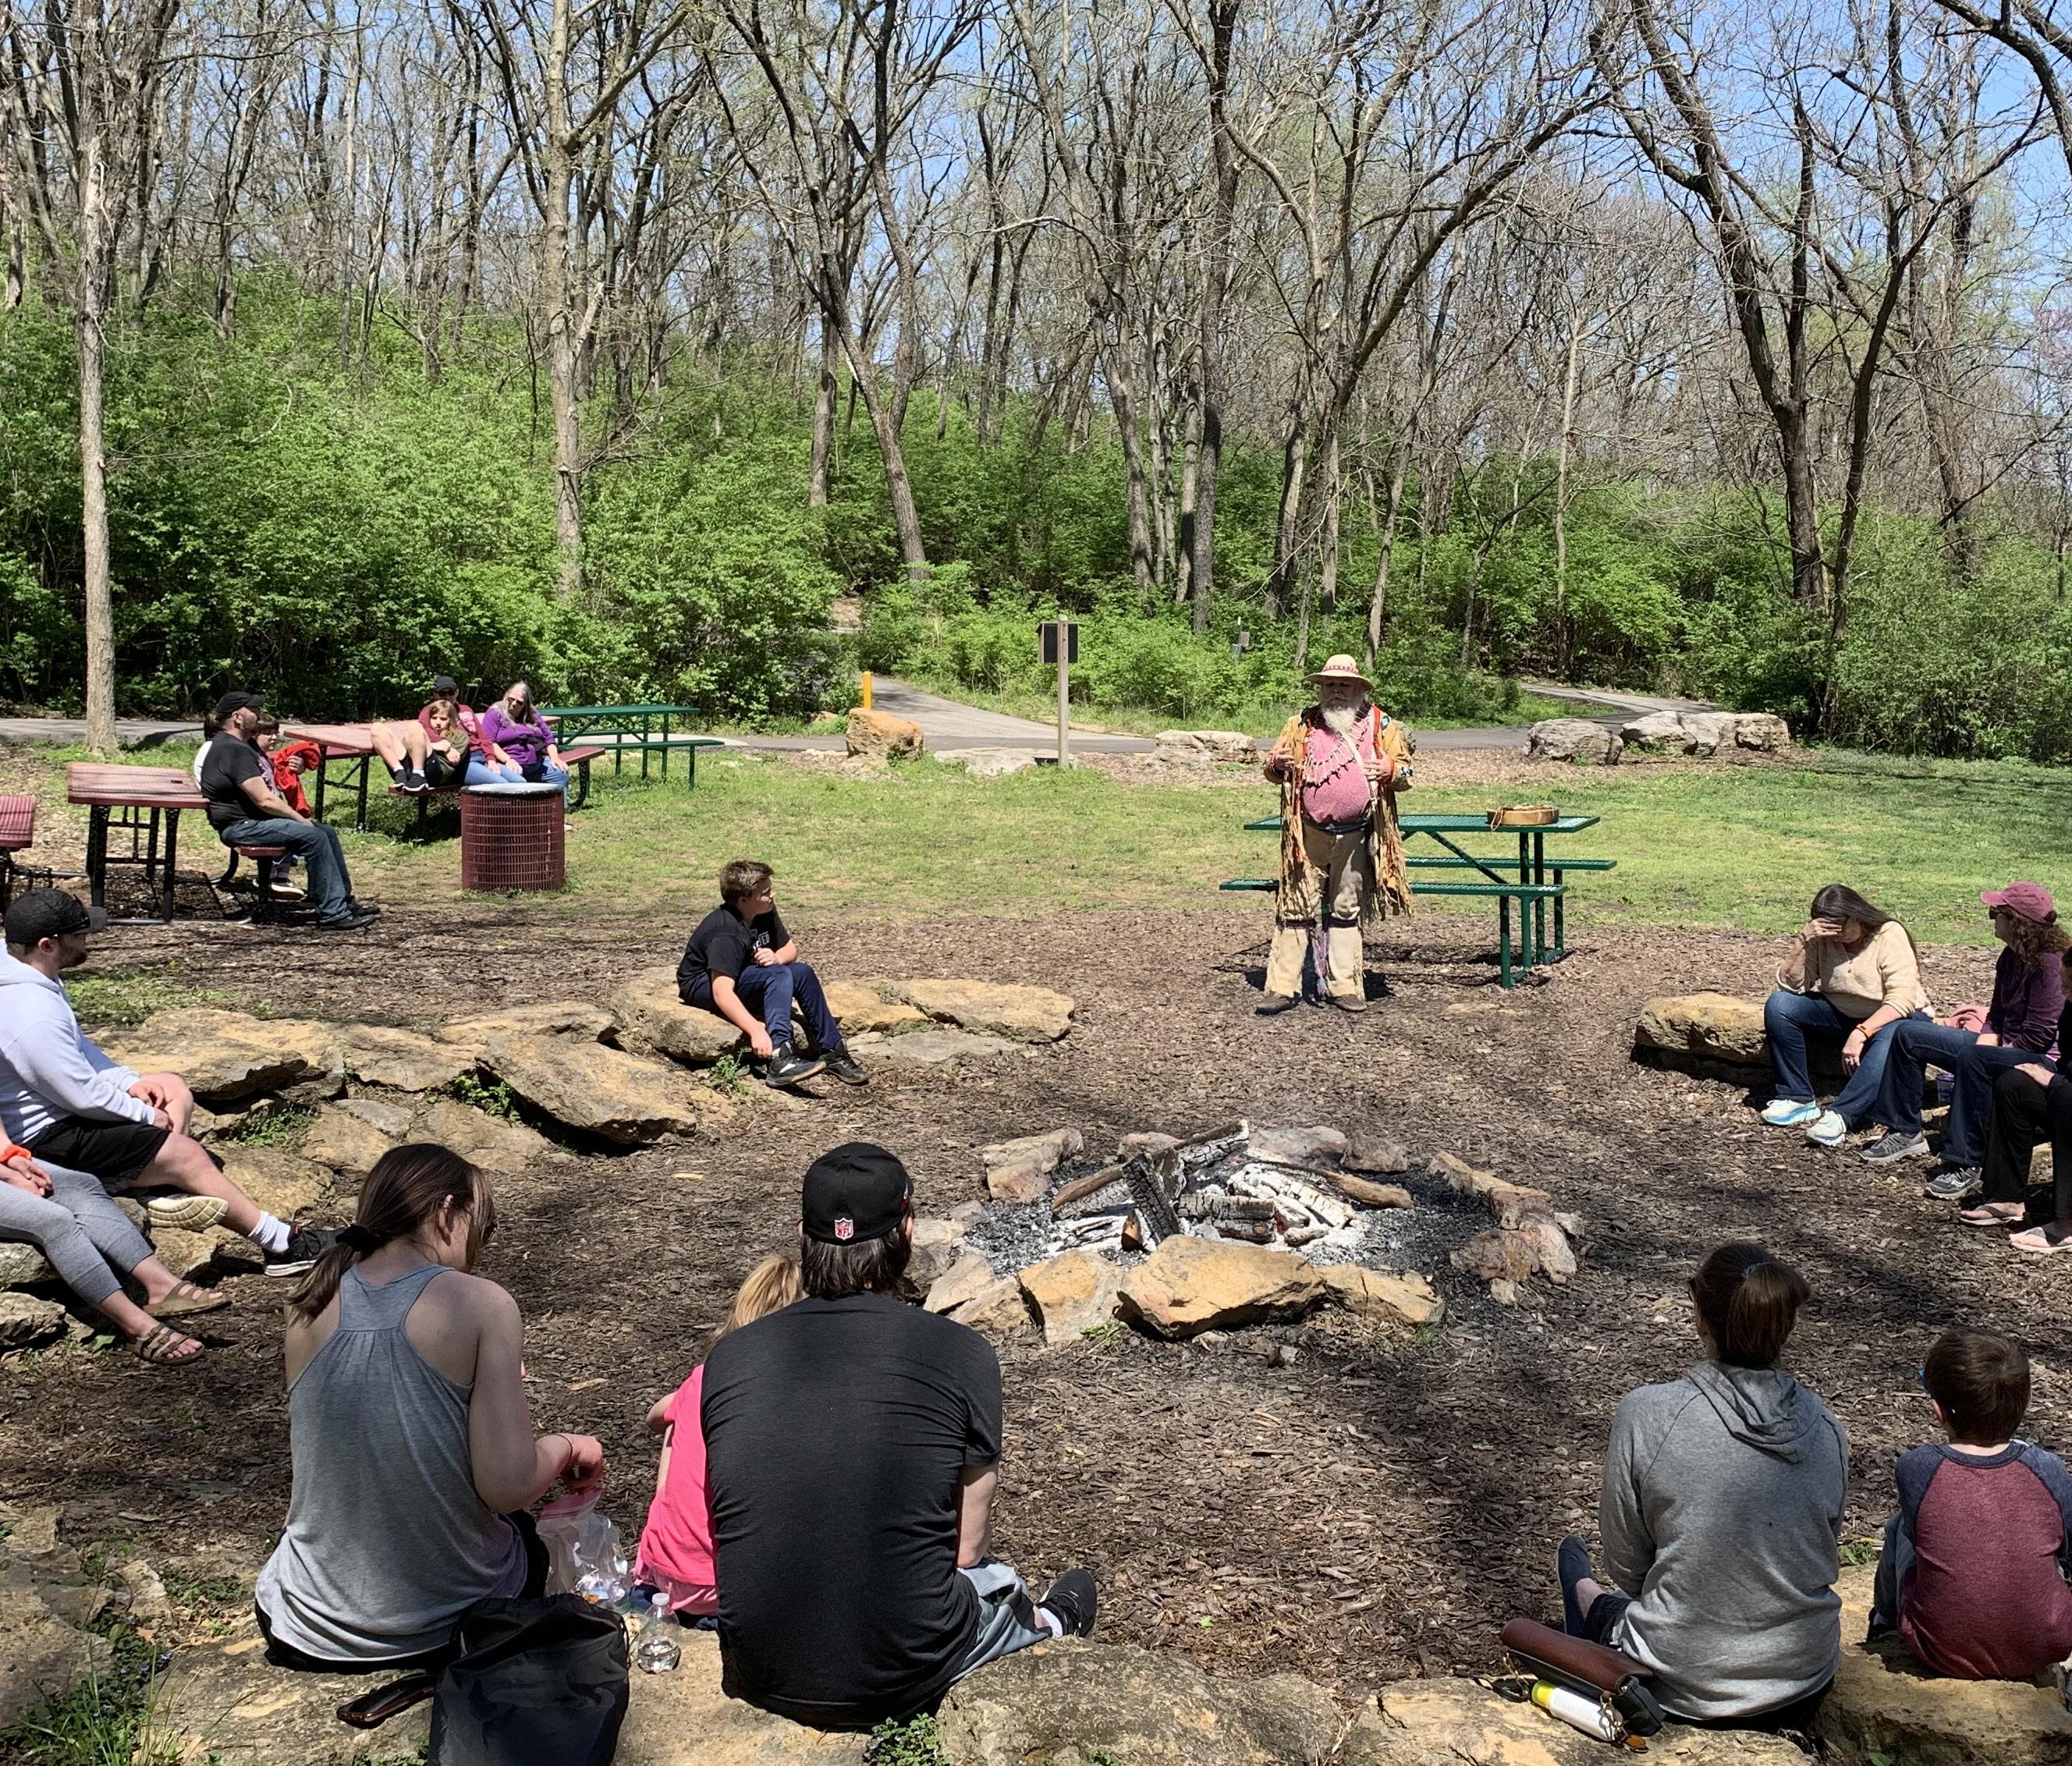
In March 2025, the consulting team assessed the City of Independence's parks and recreation facilities. The inventory list (Appendix C) shows all parks, green spaces, trails, and areas maintained by the Parks and Recreation Department. These assessments provided insight into the existing features, conditions, sizes, ages, and current maintenance levels of each park and facility.
The findings revealed a wide range in the age and condition of the playgrounds and equipment. Through this assessment, the team discovered that many parks and facilities have equipment that has exceeded its recommended lifespan. This facility inventory outlines the condition and age of each park, playground, feature, or facility, along with the status of its equipment.
Recommendations to renew and replace aging equipment annually will help maintain a safe and enjoyable park system. Park infrastructure, such as parking lots, trails, and recreational equipment, should also undergo regular maintenance and periodic updates to ensure optimal conditions for users.
Accessibility, as defined in this inventory, refers to physical locations or features that meet the requirements of the Americans with Disabilities Act (ADA). Listing accessibility for each park ensures that individuals with disabilities have equal access and opportunities. Examples include ramps at curbs, handrails, universally accessible equipment or structures, and properly graded parking lots and sidewalks.
Inventory and assessment of each park visited included evaluation of the conditions exhibited on the site of various program elements and site features. Park program elements and site feature conditions were rated using a differential scale of Good/Fair/Poor. The definition for each of these condition ratings is as follows:
Good – The park facility improvements are 10-years old or less and provide the user with safe facilities and equipment. The facility meets the ADA Guidelines in place at the time of development. Overall, the park provides the user with an enjoyable recreation experience.
Fair – The park facility improvements are 20-years old or less and most of the facilities and equipment are in a reasonable condition. Some equipment and facilities are dated and do not provide the user with an enjoyable experience. In addition, there are portions of the facility and equipment that do not meet the current ADA Guidelines. Overall portions of the park facilities need updating.
Poor – The park facility improvements are 20-years or older and do not provide the users with safe facilities and equipment. Most of the equipment and facilities have reached or surpassed their lifespan and the recreation value is minimal. There are numerous issues where the current facilities are not ADA compliant. Overall, the majority if not all the facilities need renovation and replacement.
Program elements and site features contained within individual assessments indicate various constructed elements or activities supported on site. Specific examples of program elements and features include picnic areas, playgrounds, shelters or pavilions, ball fields, sport courts, etc. Each facility was evaluated relative to amenities/activities offered, location, condition, accessibility, and potential for future improvements and/or expansion. Additional information was gathered pertaining to facility sizes, maintenance, and level of usage. A photographic inventory was assembled for each facility to document findings. The inventory and analysis for each facility are included in Appendix C
In 1996, the National Recreation and Park Association (NRPA) published the Park, Open Space, and Greenway Guidelines, which have since served as a national standard to help communities define their own level of service based on current and future population needs.
A system-wide level of service approach is used to inventory major park facilities and amenities also including indoor recreation square footage, creating measurable performance indicators. This approach supports benchmarking against peer communities and past performance, helping to track progress and identify needs over time.
Independence’s level of service may also include amenities not covered by national standards, reflecting local culture, demographics, and community priorities.
These classifications, combined with public input, guide the City and consulting team in aligning services with community needs and shaping recommendations based on existing assets and projected growth.
The following park classifications are based on NRPA standards and incorporate design best practices to ensure optimal use of newly developed properties.
A pocket park, also sometimes referred to as “mini park,” should be up to a half of an acre; however, some mini parks are determined by need and potential benefits, not just by size. Mini parks are also used to repurpose land, enhance landscaping/charm, and preserve a cultural heritage location. Mini parks typically serve up to a quarter-mile radius and predominantly passive use.
• Size of park: Up to one half of an acre (usable area measured)
• Service radius: 0.25-mile radius
• Site Selection: In densely populated areas, downtown districts, along greenways, and where opportunities exist to beautify or capture local cultural heritage
• Length of stay: One half of an hour experience or less
• Amenities: One amenity (e.g., playground, picnic area, gazebo, public art); no restrooms; play area for ages 2-5 with some shaded elements; no reservable shelters; no non-producing/unused amenities; benches next to small play area or enhanced landscaping. Amenities are ADA compliant
• Landscape Design: Appropriate design to enhance the park theme/use/experience
• Revenue facilities: none
• Land usage: 100 percent passive
• Programming: Typically, none
• Maintenance Standards: Provide the highest-level maintenance with available funding
• Signage: Interpretive; cultural heritage, historical
• Parking: Typically, not required
• Lighting: Security or landscape lighting
• Naming: Consistent with the City’s ordinances for naming of parks, or may be named after a prominent or historic person, event, or natural landmark
• Other: Customized to meet the needs of densely populated area; safety design meets established Crime Prevention through Environmental Design (“CPTED”) standards; integrated color scheme throughout
A neighborhood park should be 0.5 to 10 acres; however, some neighborhood parks are determined by use and facilities offered and not by size alone. The service radius for a neighborhood park is one half mile or six blocks. Neighborhood Parks should have safe pedestrian access for surrounding residents; parking may or may not be included but if included accounts for less than ten cars and provides ADA access. Neighborhood Parks serve the recreational and social focus of the adjoining neighborhoods and contribute to a distinct neighborhood identity.
• Size of park: one half to 10 acres (usable area measured). Preferred size is at least three acres
• Service radius: 0.5-mile radius
• Site Selection: On a local or collector street. If near an arterial street, provide natural or artificial barrier. Where possible, next to a school. Encourage location to link subdivisions and linked by trails to other parks
• Length of stay: One hour experience or less
• Amenities: One signature amenity (e.g., major playground, spray ground park, sport court, gazebo); no restrooms unless necessary for signature amenity; may include one non-programmed sports field; playgrounds for ages 2-5 and 5-12 with some shaded elements; no reservable shelters; loop trails; one type of sport court; no non-producing/unused amenities; benches, small picnic shelters next to play areas. Amenities are ADA compliant
• Landscape Design: Appropriate design to enhance the park theme/use/experience
• Revenue facilities: none
• Land usage: 85 percent active/15 percent passive
• Programming: Typically, none but a signature amenity may be included which is programmed
• Maintenance Standards: Provide the highest-level maintenance with available funding.
• Signage: Directional signage and facility/ amenity regulations to enhance user experience
• Parking: Design should include a widened on-street parking area adjacent to park. The goal is to maximize usable park space. As necessary, provide 5-10 spaces within the park including handicap spaces. Traffic calming devices encouraged next to park
• Lighting: Security or amenity only. Lighting on dual system with 50 percent of lights off at a set time and 50 percent on all night for security
• Naming: Consistent with the City’s ordinances for naming of parks, or may be named after a prominent or historic person, event, or natural landmark
• Other: Customized to demographics of neighborhood; safety design meets established CPTED standards; integrated color scheme throughout
Community Parks are intended to be accessible to multiple neighborhoods and should focus on meeting community-based recreational needs, as well as preserving unique landscapes and open spaces.
Community Parks are generally larger in scale than neighborhood parks, but smaller than regional parks and are designed typically for residents who live within a three-mile radius. When possible, the park may be developed adjacent to a school. Community Parks provide recreational opportunities for the entire family and often contain facilities for specific recreational purposes: athletic fields, swimming pool, tennis courts, extreme sports amenity, recreation center, loop trails, picnic areas, reservable picnic shelters, sports courts, permanent restrooms, large turfed and landscaped areas and a playground or spray ground. Passive outdoor recreation activities such as meditation, quiet reflection, and wildlife watching also take place at Community Parks.
Community Parks generally range from 10 to 100 acres depending on the size of a community. Community Parks serve a larger area – radius of one to three miles and contain more recreation amenities than a Neighborhood Park.
• Size of park: 10 to 70 acres normally. Can be up to 100 acres (usable area measured needs to be up to 70 acres).
• Service radius: One to three-mile radius
• Site Selection: On two collector streets minimum and preferably one arterial street. If near arterial street, provide natural or artificial barrier. Minimal number of residences abutting site. Preference is streets on four sides, or three sides with school or municipal use on fourth side. Encourage trail linkage to other parks
• Length of stay: Two to three hours experience
• Amenities: Four signature amenities at a minimum: (e.g., trails, sports fields, large shelters/ pavilions, community playground for ages 2-5 and 5-12 with some shaded elements, recreation center, pool or family aquatic center, sports courts, water feature); public restrooms, ample parking, and security lighting. Amenities are compliant with ADA. Sport Fields and Sport Complexes are typical at this park.
• Revenue facilities: One or more (e.g., pool, sports complex, pavilion)
• Land usage: 65 percent active and 35 percent passive
• Programming: Minimum of four essential program services (e.g., sports, day camps, aquatics)
• Maintenance Standards: Provide the highest-level maintenance with available funding
• Parking: Sufficient to support the amenities; occupies no more than 10 percent of the park. Design should include a widened on-street parking area adjacent to the park. The goal is to maximize usable park space. Traffic calming devices encouraged within and next to the park
• Lighting: Amenity lighting includes sport field light standards. Security lighting on dual system with 50 percent of lights off at a set time and 50 percent on all night for security
• Signage: Directional signage and facility/ amenity regulations to enhance user experience. May include kiosks in easily identified areas of the facility
• Landscape Design: Appropriate design to enhance the park theme/use/experience. Enhanced landscaping at park entrances and throughout park
• Naming: Consistent with the City’s naming right ordinance, may be named after a prominent or historic person, event, or natural landmark
• Other: Strong appeal to surrounding neighborhoods; integrated color scheme throughout the park; partnerships developed with support groups, schools and other organizations; loop trail connectivity; linked to Regional Park, trail or recreation facility; safety design meets established CPTED standards. Telephone/ Cable TV/Fiberoptics conduit.
A regional park serves a large area of several communities, residents within a city, city or county, or across multiple counties. Depending on activities within a regional park, users may travel as many as 60 miles for a visit. Regional parks include recreational opportunities such as soccer, softball, golf, boating, camping, conservation-wildlife viewing and fishing. Although regional parks usually have a combination of passive areas and active facilities, they are likely to be predominantly natural resource-based parks.
A common size for a regional park is 100 to 1,000 acres but some parks can be up to 5,000 acres in size. This depends upon the size of the community and land availability. A regional park focuses on activities and natural features not included in most types of parks and often based on a specific scenic or recreational opportunity. Facilities could include those found in a Community Park and have specialized amenities such as an art center, amphitheater, boating facility, golf course, or natural area with interpretive trails. Regional parks can and should promote tourism and economic development. Regional parks can enhance the economic vitality and identity of the entire region.
• Size of park: 70 to 1,000+ acres
• Service radius: Three mile and greater radius, depending upon experiences
• Site Selection: Prefer location which can preserve natural resources on-site such as wetlands, streams, and other geographic features or sites with significant cultural or historic features. A significantly large parcel of land. Access from public roads capable of handling anticipated traffic.
• Length of stay: All day experience
• Amenities: 10 to 12 amenities to create a signature facility (e.g., golf course, tennis complex, sports complex, lake, regional playground, 3+ reservable picnic shelters, camping, outdoor recreation/extreme sports, recreation center, pool, gardens, trails, zoo, specialty facilities); public restrooms, concessions, restaurant, ample parking, special event site. Sport Fields and Sport Complexes are typical at this park.
• Revenue facilities: More than two; park designed to produce revenue to offset operational costs
• Land usage: Up to 50 percent active/50 percent passive
• Programming: More than four recreation experiences per age segment with at least four core programs provided
• Maintenance Standards: Provide the highest-level maintenance with available funding
• Parking: Sufficient for all amenities. Traffic calming devices encouraged within and next to park
• Lighting: Amenity lighting includes sport field light standards. Security lighting on dual system with 50 percent of lights off at a set time and 50 percent on all night for security
• Signage: Directional signage and facility/ amenity regulations to enhance user experience, can include kiosks in easily identified areas of the facility
• Landscape Design: Appropriate design to enhance the park theme/use/experience. Enhanced landscaping at park entrances and throughout park
• Naming: Consistent with the City’s naming ordinance, may be named after a prominent or historic person, event, or natural landmark
• Other: Safety design may meet CPTED safety standards; integrated color scheme throughout the park; linked to major trails systems, public transportation available, concessions, food and retail sales available, dedicated site managers on duty. Telephone/Cable TV/Fiberoptics conduit.
Special Use facilities are those spaces that do not fall within a typical park classification. A major difference between a Special Use facility and other parks is that they usually serve a single purpose whereas other park classifications are designed to offer multiple recreation opportunities. It is possible for a Special Use facility to be located inside another park. Special Use facilities generally fall into three categories:
Historic/Cultural/Social Sites – unique local resources offering historical, educational, and cultural opportunities. Examples include historic downtown areas, commercial zones, plaza parks, performing arts parks, arboretums, display gardens, performing arts facilities, indoor theaters, churches, and amphitheaters. These sites are frequently located in Community or Regional Parks.
Golf Courses – nine and 18-hole complexes with ancillary facilities such as club houses, driving ranges, program space and learning centers. These facilities are highly maintained and support a wide age level of males and females. Programs are targeted for daily use play, tournaments, leagues, clinics and special events. Operational costs come from daily play, season pass holders, concessions, driving range fees, earned income opportunities and sale of pro shop items
Indoor Recreation facilities – specialized or single purpose facilities. Examples include community centers, senior centers and community theaters. These are frequently located in Community or Regional Parks.
Outdoor Recreation facilities – Examples include aquatic parks, disc golf, skateboard, BMX, and dog parks, which may be in a park.
• Size of park: Depends upon facilities and activities included. Their diverse character makes it impossible to apply acreage standards
• Service radius: Depends upon facilities and activities included. Typically serves special user groups while a few serve the entire population
• Site Selection: Given the variety of potential uses, no specific standards are defined for site selection. As with all park types, the site itself should be located where it is appropriate for its use.
• Length of stay varies by facility
• Amenities: varies by facility
• Revenue facilities: Due to nature of certain facilities, revenue may be required for construction and/or annual maintenance. This should be determined at a policy level before the facility is planned and constructed
• Land usage: varies by facility
• Programming: varies by facility
• Maintenance Standards: Provide the highest-level maintenance with available funding
• Parking: On-street or off-street parking is provided as appropriate. Design should include a widened on-street parking area adjacent to the park. The goal is to maximize usable park space. As necessary, provide five to 10 spaces within the park including handicap spaces. Traffic calming devices encouraged next to park
• Lighting: Security or amenity only. Lighting on dual system with 50 percent of lights off at a set time and 50 percent on all night for security
• Signage: Directional signage and facility/ amenity regulations to enhance user experience
• Landscape Design: Appropriate design to enhance the park theme/use/experience
• Naming: Follows City ordinance for naming or may be named after a prominent or historic person, event, or natural landmark
• Other: Integrated color scheme throughout the park; safety design meets established CPTED standards. Telephone/Cable TV/ Fiberoptics conduit as appropriate.
Greenbelts/Trails/Paseos are recognized for their ability to connect people and place and often include either paved or natural trails. Trails can also be loop trails in parks. Linking neighborhoods, parks, recreation facilities, attractions, and natural areas with a multi-use trail fulfills two guiding principles simultaneously: protecting natural areas along river and open space areas and providing people with a way to access and enjoy them. Multi-use trails also offer a safe, alternative form of transportation; provide substantial health benefits, habitat enhancements for plants and wildlife, and unique opportunities for outdoor education and cultural interpretation.
• Size: Typically, at least 30-foot width of unencumbered land for a Greenbelt or Paseo. May include a trail to support walk, bike, run, equestrian type activities.
Typically, an urban trail is 10-foot wide to support pedestrian and bicycle uses. In open space areas, trails include 2 feet of decomposed granite on both sides of the trail for walkers and cyclists. Trails incorporate signage to designate where a user is located and where the trails connect in the city.
• Equestrian uses can occur in both urban and open space settings by adding 10 more feet of space to separate equestrian usage from pedestrian/bike usage. In urban settings, equestrian use includes five foot of decomposed granite plus a five-foot landscaped separation from the pedestrian/bike trail. In open space settings, equestrian use includes five foot of harrowed soil plus a five-foot natural separation from the pedestrian/bike trail
• Site Selection: Located consistent with approved Trails Master Plan
• Amenities: Parking and restrooms at major trailheads. May include small parks along the trail
• Maintenance standards: Demand based maintenance with available funding
• Lighting: Security lighting at trailheads and high use areas. Lighting on dual system with 50 percent of lights off at a set time and 50 percent on all night for security
• Signage: Mileage markers at half mile intervals. Interpretive kiosks as deemed appropriate
• Landscape Design: Coordinated planting scheme in urban areas. Limited or no planting in open space areas
• Other: Connectivity to parks or other City attractions and facilities is desirable
Waterway Corridors are land adjacent to and including the course of a river or creek. Waterway corridors typically include the width in which the river meanders at a minimum. These corridors are mostly undeveloped due to being within a floodplain but may include natural or paved trails. In some instances, the corridor may have access points for public and/or private outfitters and individuals interested in traveling on the water. Corridors are also known within cities to include parks and open space that have been developed
as a destination with amenities and viewing areas. Grasslands under power line corridors are one example; creek areas are another. Open Space contain natural resources that can be managed for recreation and natural resource conservation values such as a desire to protect wildlife habitat, water quality and endangered species. Open Space also can provide opportunities for nature based, unstructured, low-impact recreational opportunities such as walking and nature viewing.
Conservation areas are land that is protected with defined purposes and/or limitations on development. Conservation areas can include land with architectural, historical or environmental interests that have been identified as important to preserve. Architectural conservation describes the material, historical, and/or design integrity of structures and the process by which the heritage is prolonged through carefully planned restoration and use. Historical conservation seeks to preserve buildings, landscapes, and artifacts that are of historical significance. Environmental conservation is the protection of land, resources, natural flora and fauna. Environmental conservation can also be the preservation of land for natural beauty, wildlife habitats and wildlife migration.
A level of service analysis has been conducted based on the park sites, trails, open space, amenities, and indoor and outdoor facilities offered by Independence.
Level of Service (LOS) standards serve as guidelines that delineate service areas based on population, which support investment decisions related to parks, facilities, and amenities. These standards are periodically updated to align with industry trends and changes in community demographics, as well as community needs.
The park facility standards are assessed by drawing from a variety of resources. These included market trends, demographic data, community input, stakeholder feedback, and general observations. The standards are based on population figures for 2025 and 2030, representing the latest estimates available during the analysis. The National Recreation and Park Association’s (“NRPA”) “Park Metrics” database, which collects parks and recreation inventory data from agencies across the county, has also been included in the analysis. Finally, the existing level of service was derived from an analysis of Independence offerings and does not include other types of providers that might be present in the City. This information enabled the customization of standards specifically for Independence. In certain instances, parks, trails, facilities, or amenities have the same number for current and recommended levels of service. This is due to Independence having a quantity that is higher than the regional benchmark.
Finally, these LOS standards should be regarded as a reference point. They should be supplemented by practical wisdom and context-specific judgment, considering the unique needs and circumstances of the community. By applying these standards to Independence’s population, any discrepancies or excesses in park and facility offerings become evident.
According to the Level of Service analysis (Appendix J), Independence has several current and 5-year forecasted needs for parkland, trails, outdoor facilities, and indoor recreation space. Based on the 2025 population (123,102), current needs exist in these categories:
Parkland: Currently, Independence has 6.88 acres per 1,000 residents. According to National Recreation and Park Association (“NRPA”) Park Metrics, the median average for populations between 100,000 and 250,000 is 9 acres per 1,000 people. To get to a recommended service level of 7.40 acres per 1,000 people, Independence currently needs 64.24 developed park acres.
Paved and Unpaved Trails: Independence has 25.30 paved trail miles and 4.35 unpaved trail miles, totaling 29.65 miles, in its current inventory. This is close to the NRPA median average (29) for populations between 100,000 and 250,000 people. Based on a recommended service level of .18 paved and .04 unpaved trail miles per 1,000 residents, Independence has a current need for .57 unpaved trail miles.
Outdoor Facilities: According to recommended levels of service, Independence has a need for outdoor pools (2).
Indoor Recreation Space: Independence has a current need of 56,867 square feet for indoor recreation/community space and 61,551 square feet for indoor aquatic space.
In addition to parkland, trails, and indoor and outdoor facilities and amenities, the Independence Parks and Recreation Department also manages several indoor special use facilities that include historic sites, Cable Dahmer Arena (through contracted management services), Woodlawn Cemetery offices and shop, George Owens Nature Park Dewitt Center and Park Lodge, as well as the Park Maintenance Shop. Below is an overview of the special use and support facilities that the Department currently operates.
According to the Statistically Valid 2025 Community Needs Survey, there are several “high” priority areas that residents identified. Among these are additional developed park acres, paved and unpaved trails, splash pads and outdoor pools, as well as indoor recreation and aquatic space.
Independence should consider adapting to current changing trends and demographics when strategically addressing investment into specific parks, trails, and facilities or amenities. These steps are recommended to develop a strategy on investing resources into current and future community priorities.
• Evaluate utilization trends and overall conditions of the facility or amenity: Identify how the facility is being used by tracking usage patterns including frequencies, peak times, and user demographics. Also, develop an annual cost to maintain for each facility and amenity type. Using this data, create a facility condition index that identifies facilities and amenities with low utilization, high maintenance costs, or those that are nearing the end of their life to prioritize for reassessment.
• Analyze community demand and market trends: Use this data to ensure that removal or repurposing specific facilities or amenities does not disproportionately impact underserved areas of the city.
• Consider using a more qualitative approach to the level of service analysis. Instead of achieving a specific standard for quantity, consider whether the community has the right level of access, or if the facility or amenity has the right functionality or relevance to that neighborhood’s needs. For example, underused ball diamonds could be converted to rectangular fields in specific parks.
• Engage the community and specific neighborhoods through surveys, focus groups, and onsite workshops to help build an understanding of
for specific parks,
and amenities.
• Finally, once all the necessary data has been collected, decide on one of three approaches:
• Upgrading or repurposing facilities and amenities to serve current and emerging priorities
• Converting underutilized assets into more flexible, multiuse spaces
• Removing unused or failing facilities and amenities and reinvest operational and capital funds on other park system needs
Independence’s level of service analysis evaluated the city’s parks, trails, and recreation facilities to understand how well they meet community needs now and in the future. The analysis used population projections for 2025 and 2030, along with input from residents, stakeholders, and market data, to set local standards for parks and amenities. These standards serve as flexible guidelines to help identify where the city may have too much or too little of certain facilities. Overall, Independence has several needs, particularly with developed park acreage, aquatic facilities and indoor recreation space.
To stay aligned with changing trends and demographics, Independence should evaluate facility use, analyze costs and conditions, and engage the community before deciding whether to upgrade, repurpose, or remove certain facilities and amenities. For indoor facilities, similar steps are recommended including tracking usage and rethinking underutilized spaces to accommodate changing recreation needs in the community.
3.4.1 10 MINUTE WALK TIME TO PARKS
K e n t u c k y R d
M t W a s h i n g t o n

B l u e S u m m i t
S u g a r C r e e k
C a r l i s l e
F a i r l a n d
H e i g h t s
O t t - C h r i s m a n
M c C o y B u n d s c h u
P r o c t e r
E 2 0 t h S t S
W e s t e r n B l u e
T o w n s h i p
T o w n H a l l
I n d e p e n d e n c e
E W a l n u t S t
B e n t o n
E 2 3 r d S t S E 2 3 r d S t S W 2 3 r d S t
S V e r m o n t A v e E 3 2 n d S t S
C u n n i n g h a m R i d g e
T r u m a n S p o r t s
C o m p l e x
S a n t a F e
S N o l a n d R d
E G u dg e l l A v e
D r u m m Fa r m
Go l f C o u r s e
A s h l a n d R i d g e
E 3 5 t h S t S S P hel psRd
R i s s L a k e
S t a y t o n M e a d o w s
E 56 t h S t
S t e r l i n g G a r d e n s
S t e r l i n g A c r e s
E 39th S t S
E 5 1 s t S t S
B l u e V u e H i l l s
S t e r i n g A v e
B l u
E 61 s t S t
C o u n t r y V a l l e y - H a w t h o r n S q u a r e
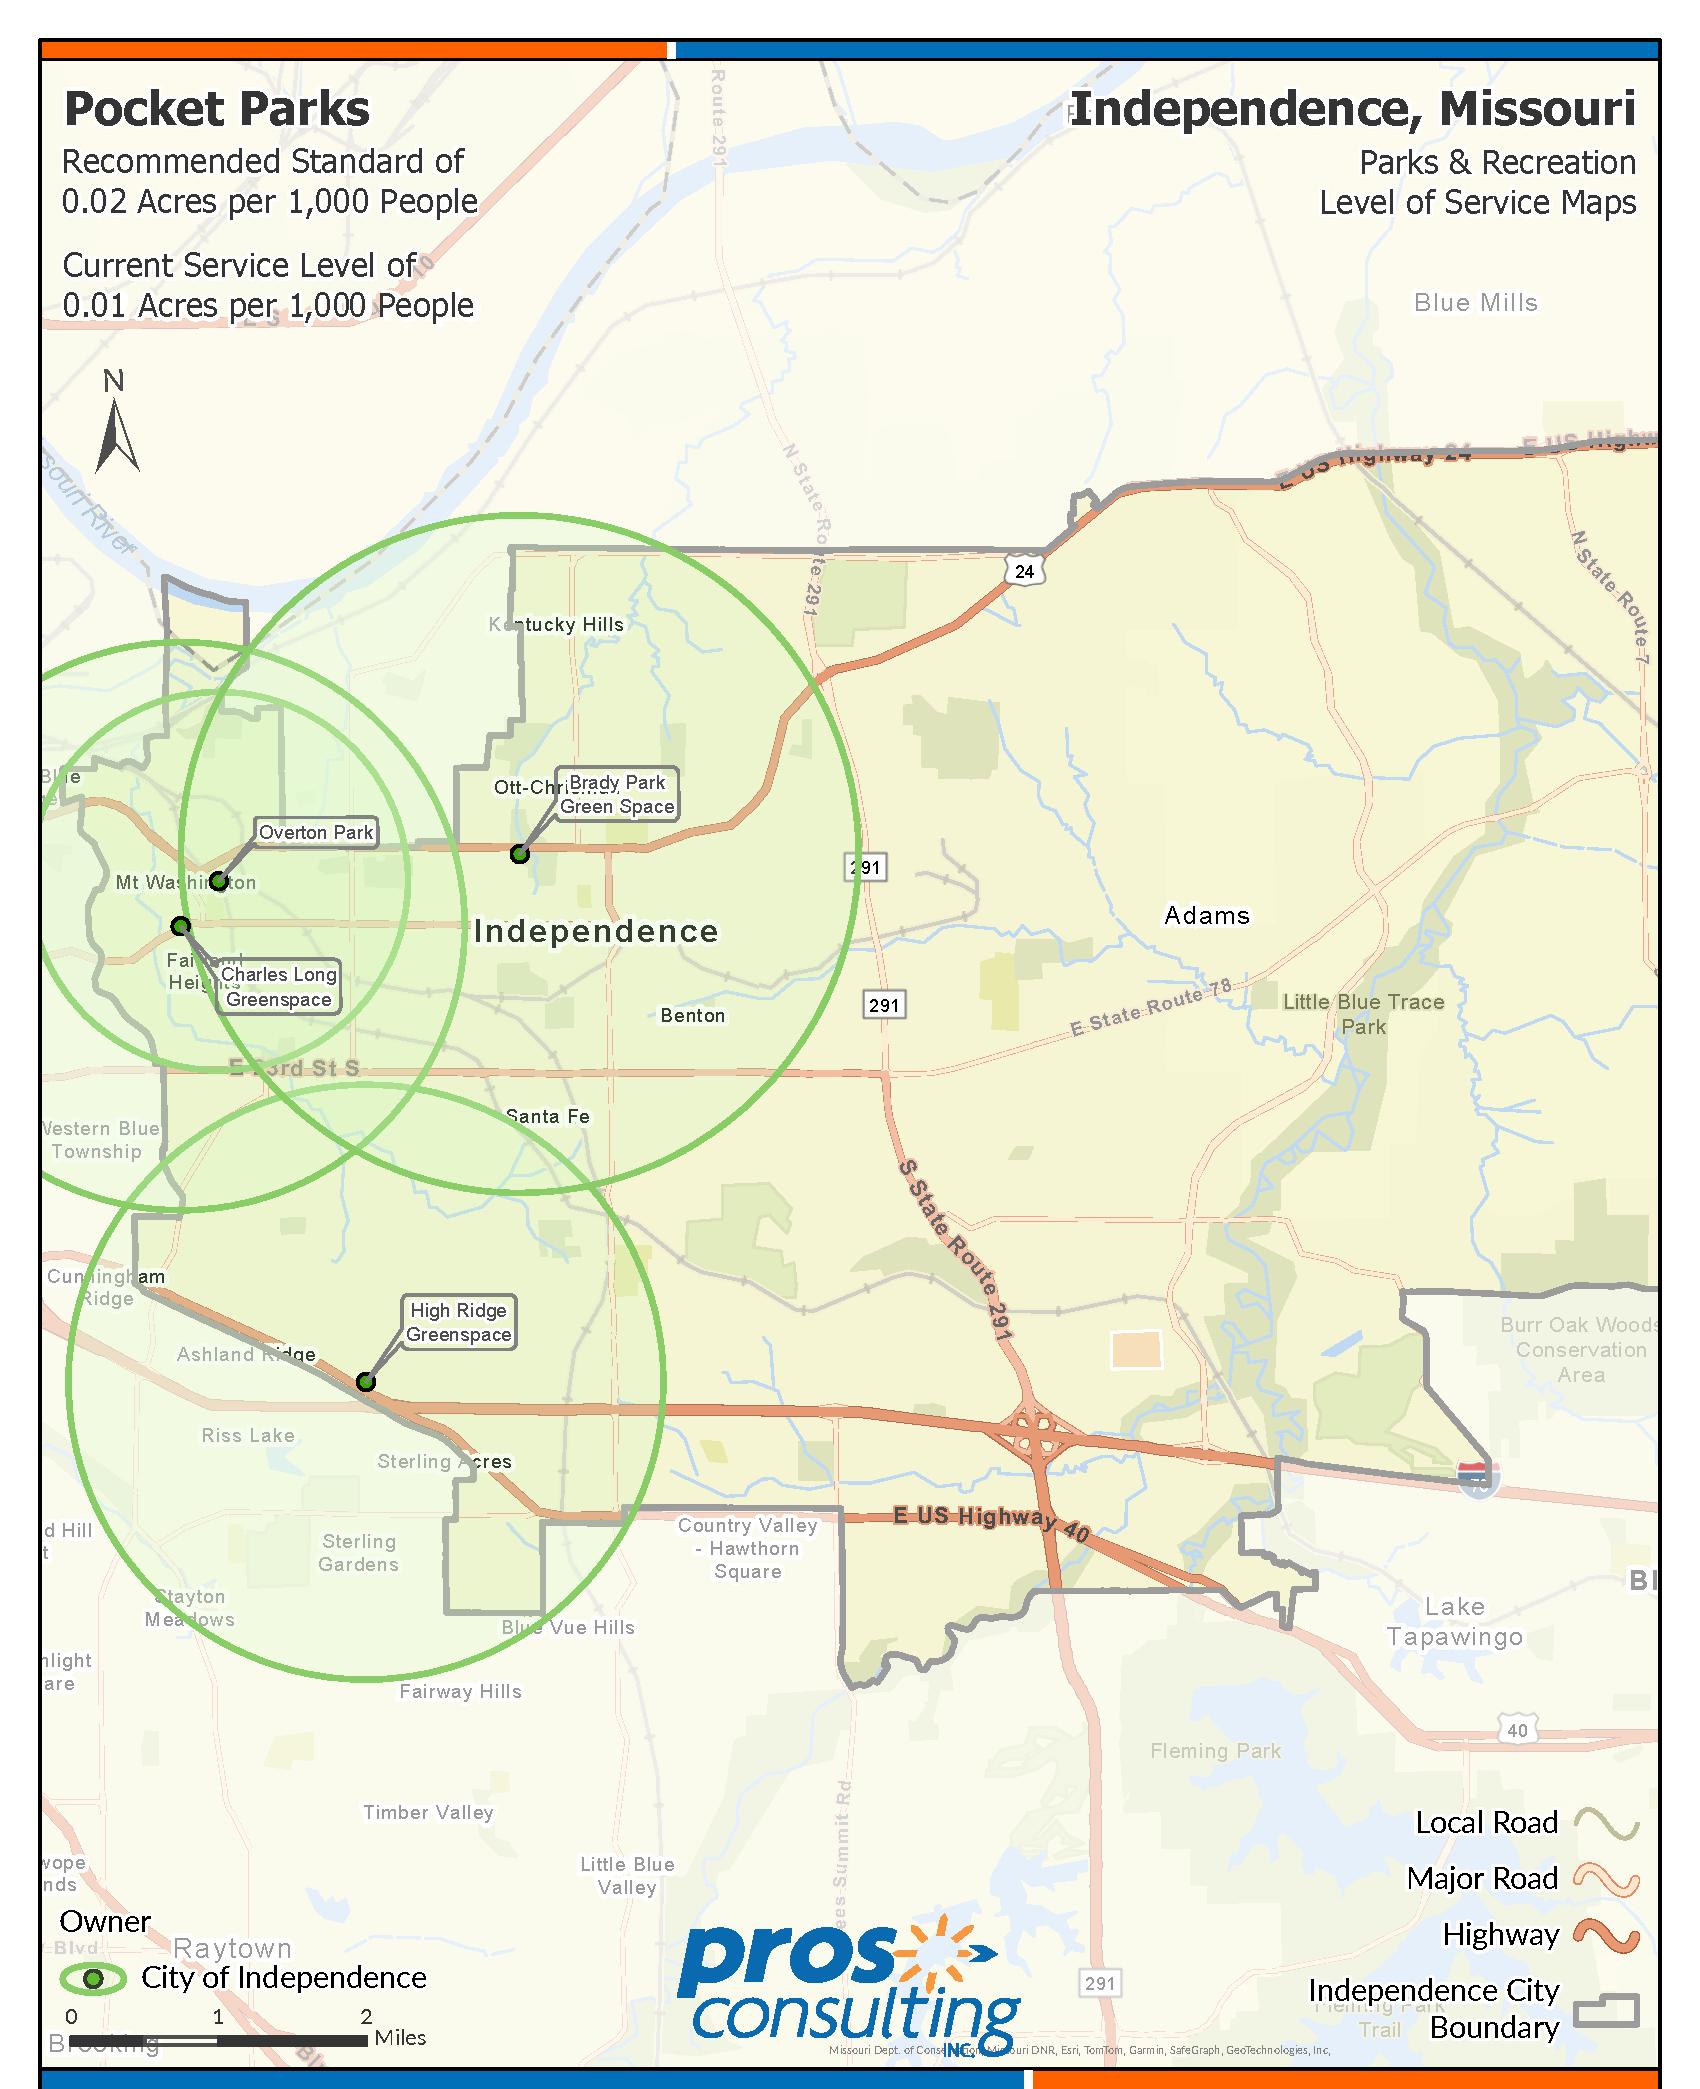
Independence’s current service level of 1.03 acres of neighborhood parks per 1,000 people has been established as the recommended standard for the City’s population projections and level of service needs.
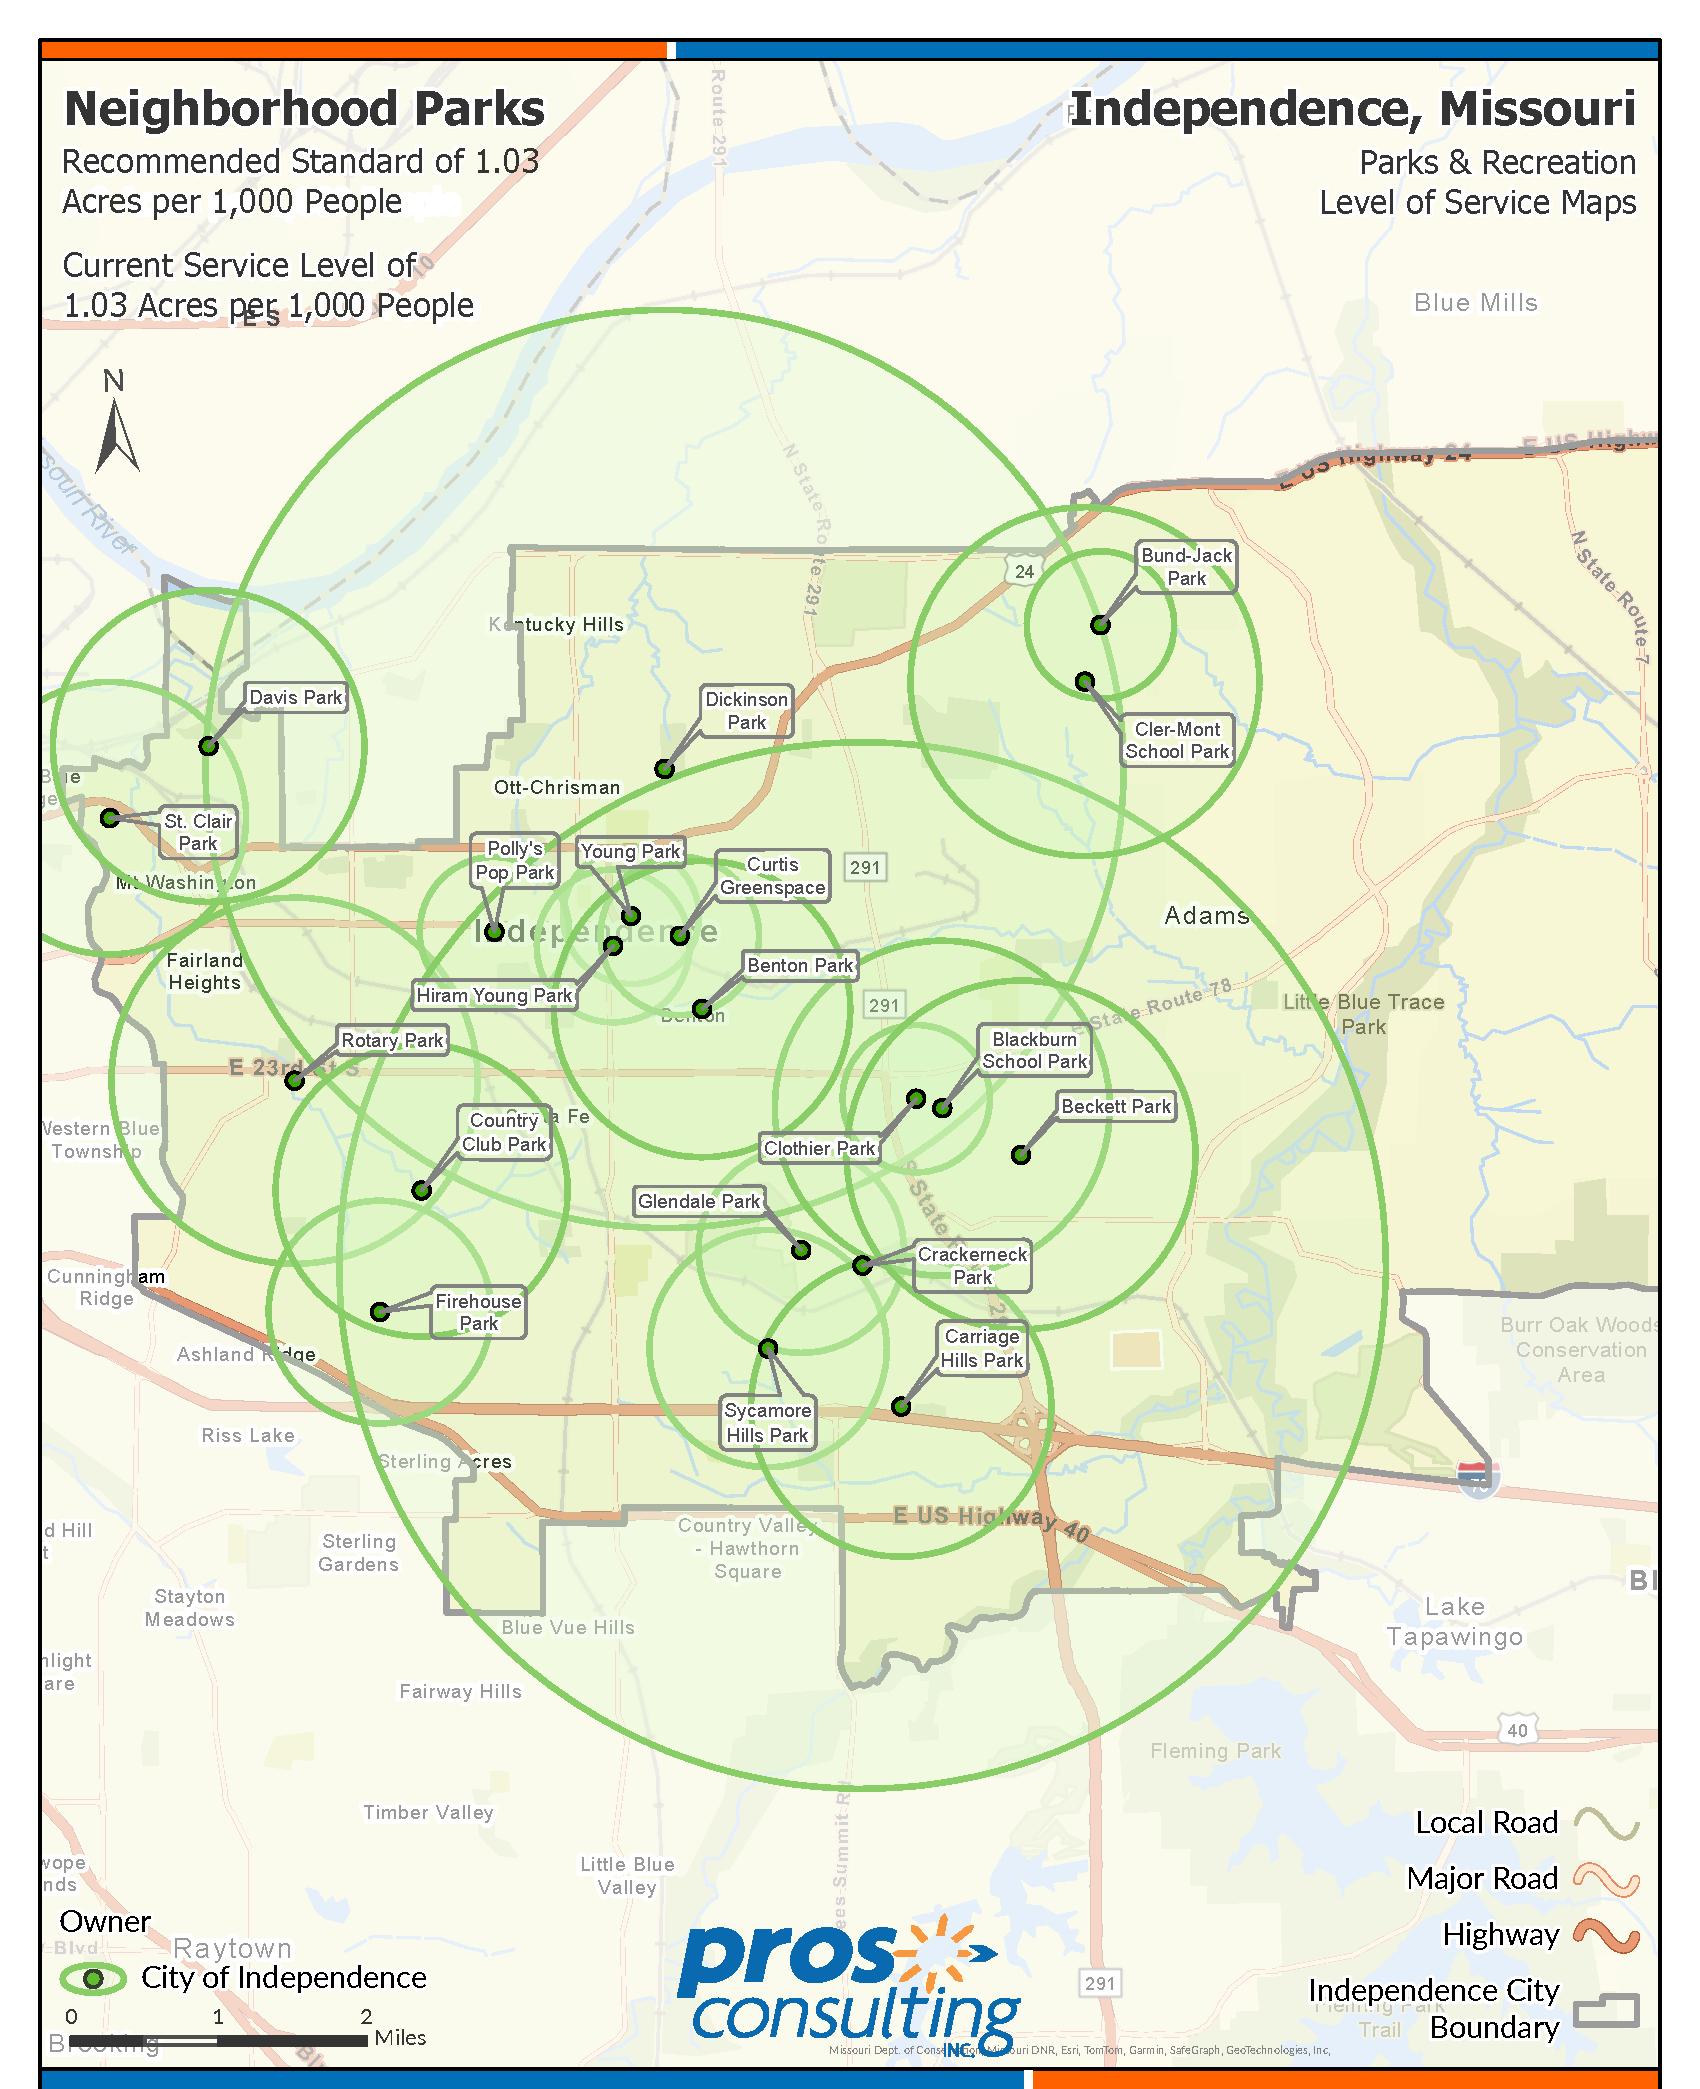
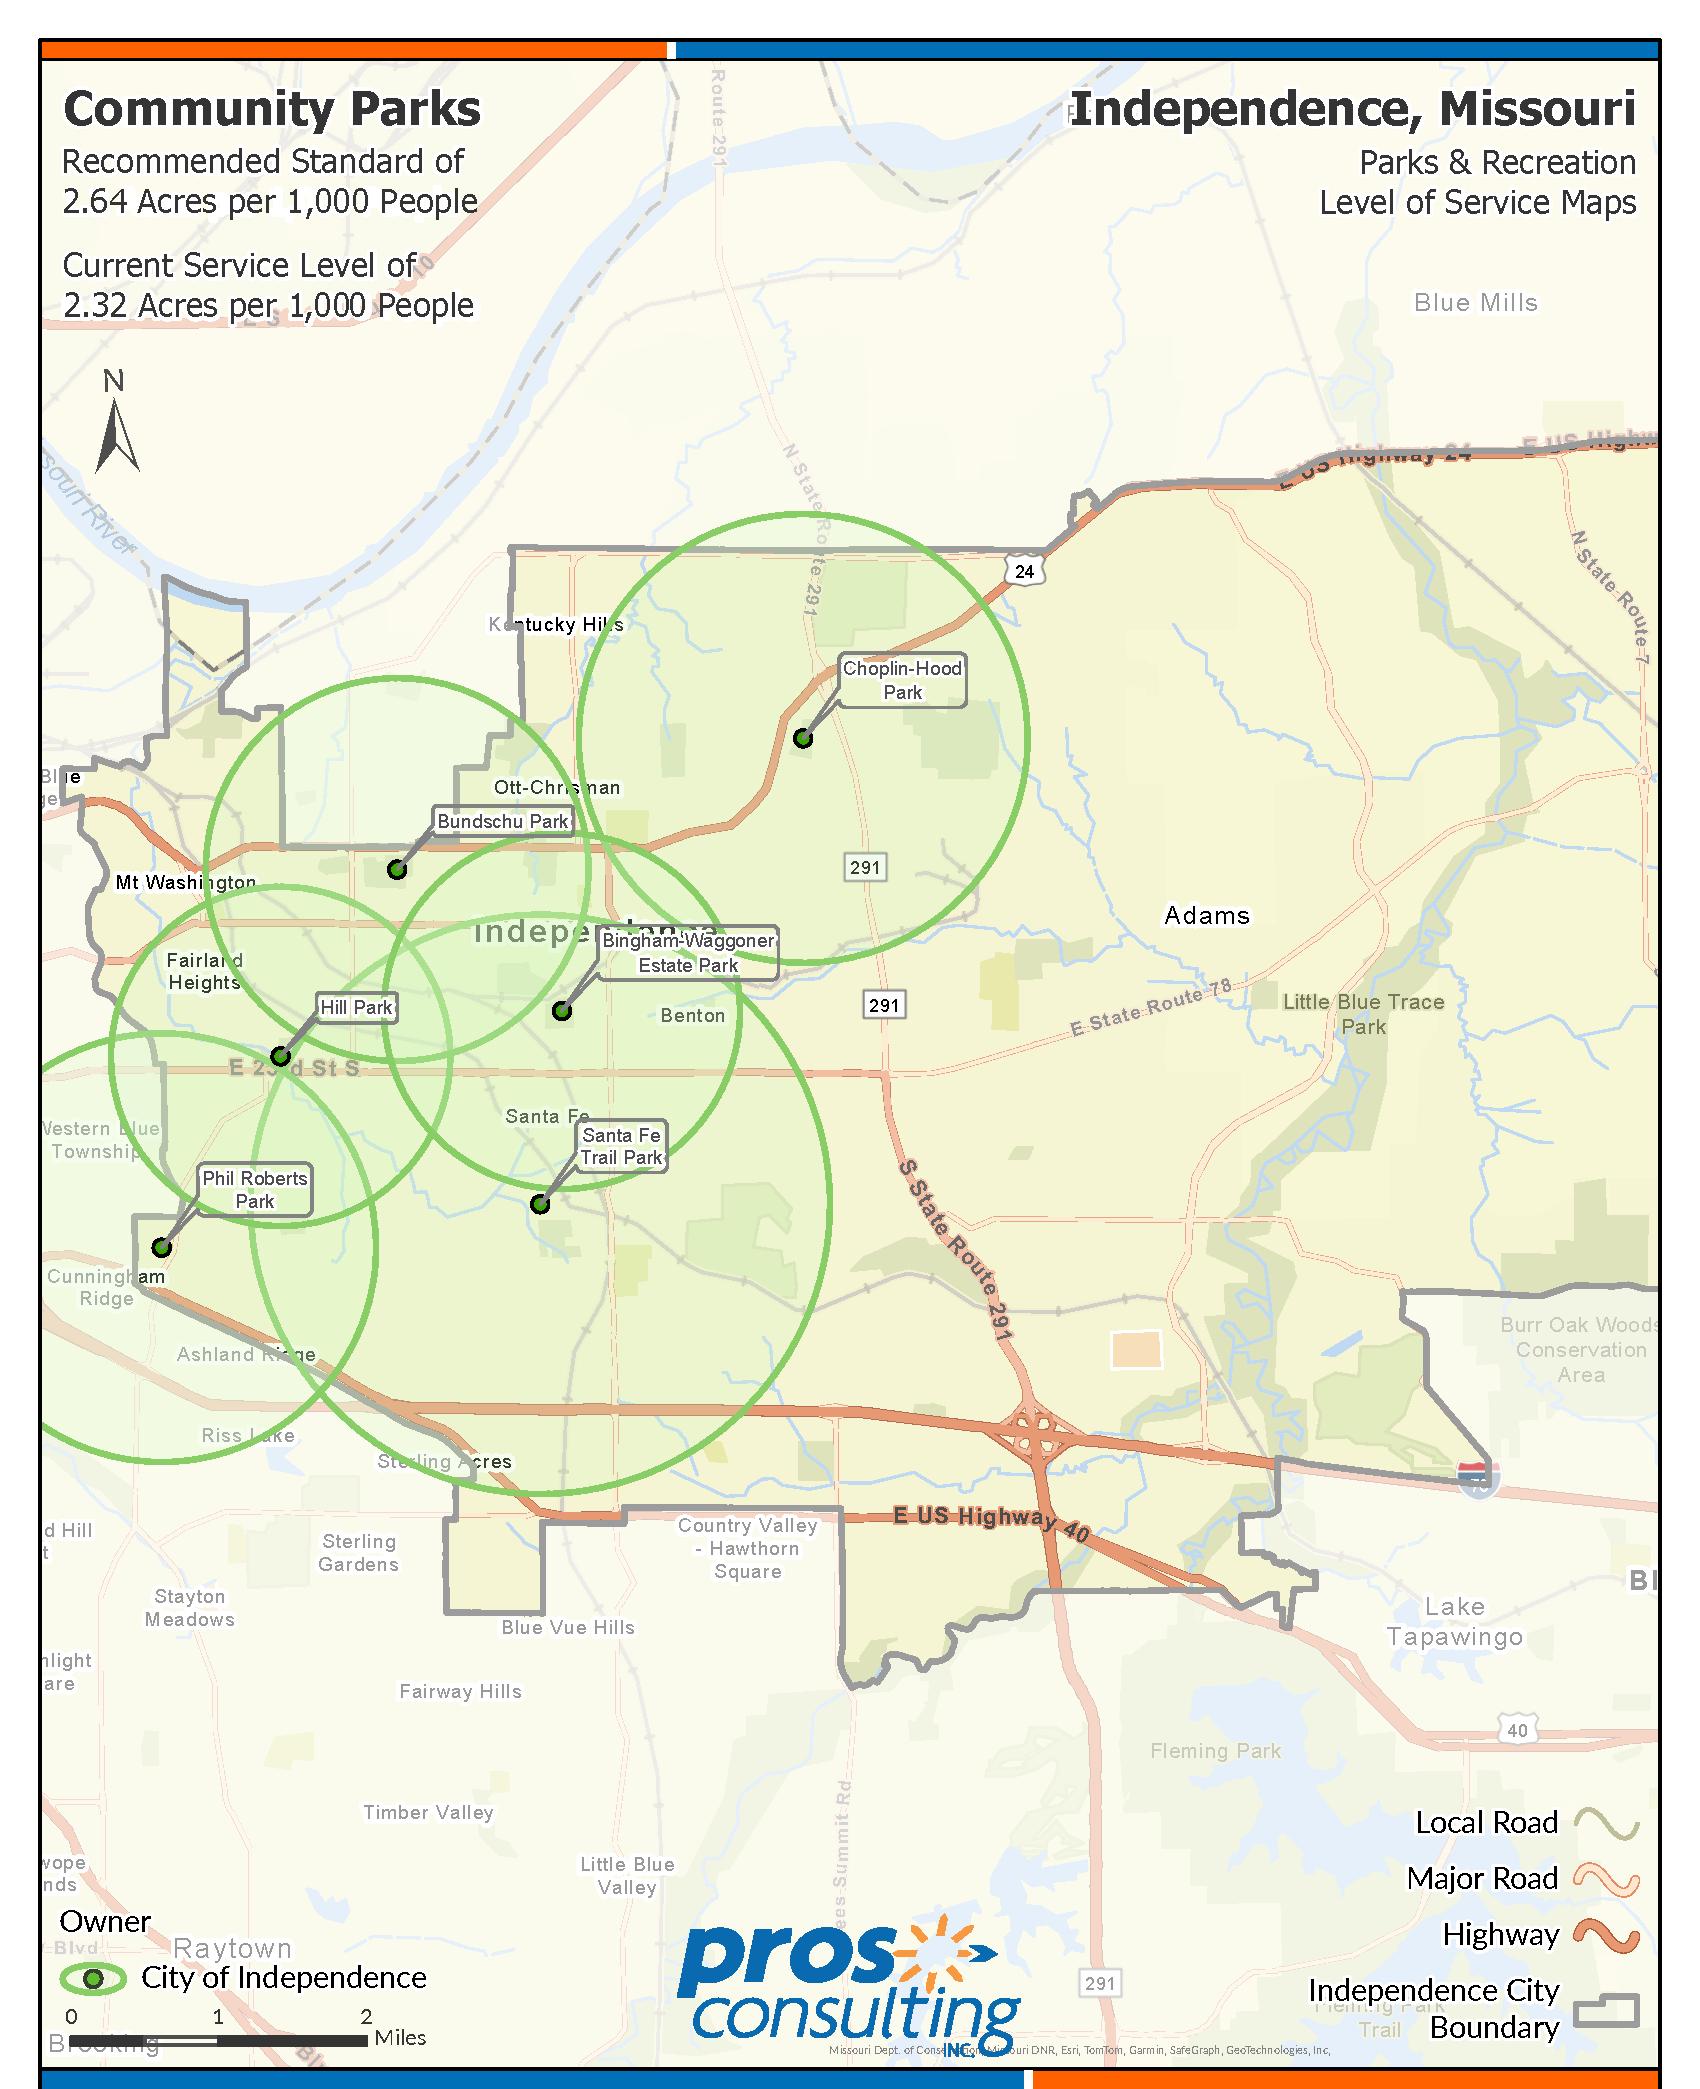
Independence’s current service level of 2.81 acres of regional parks per 1,000 people has been established as the recommended standard for the City’s population projections and level of service needs.
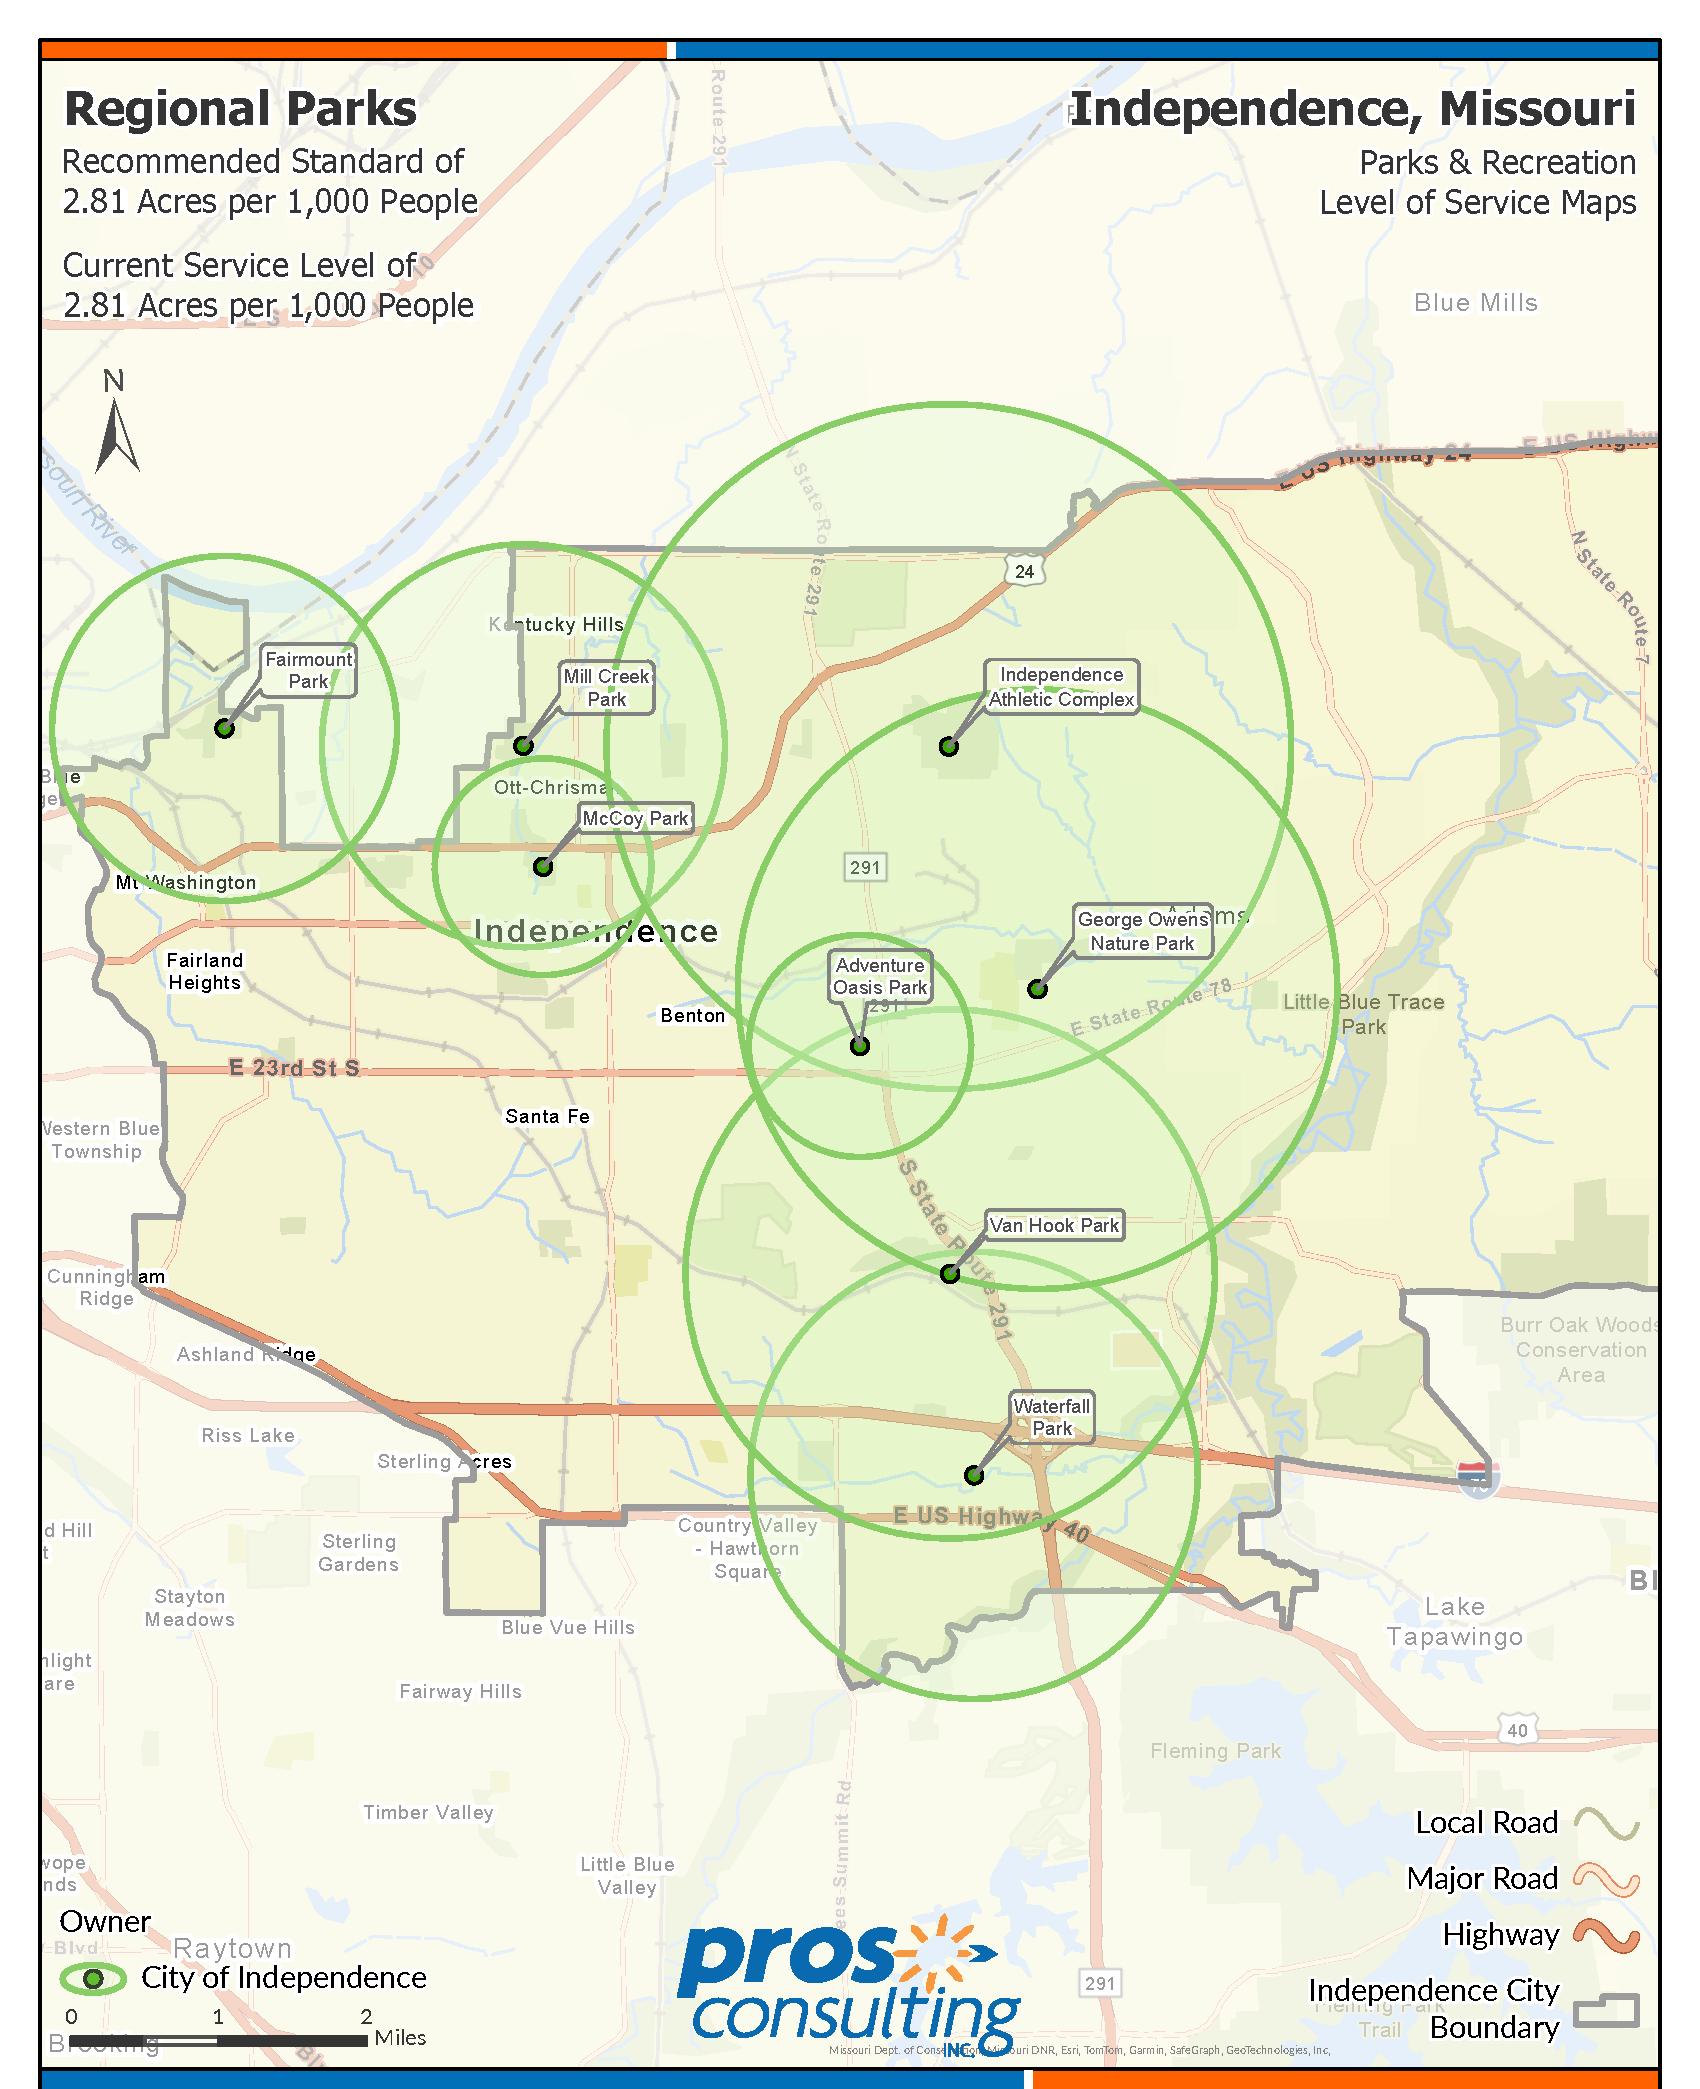
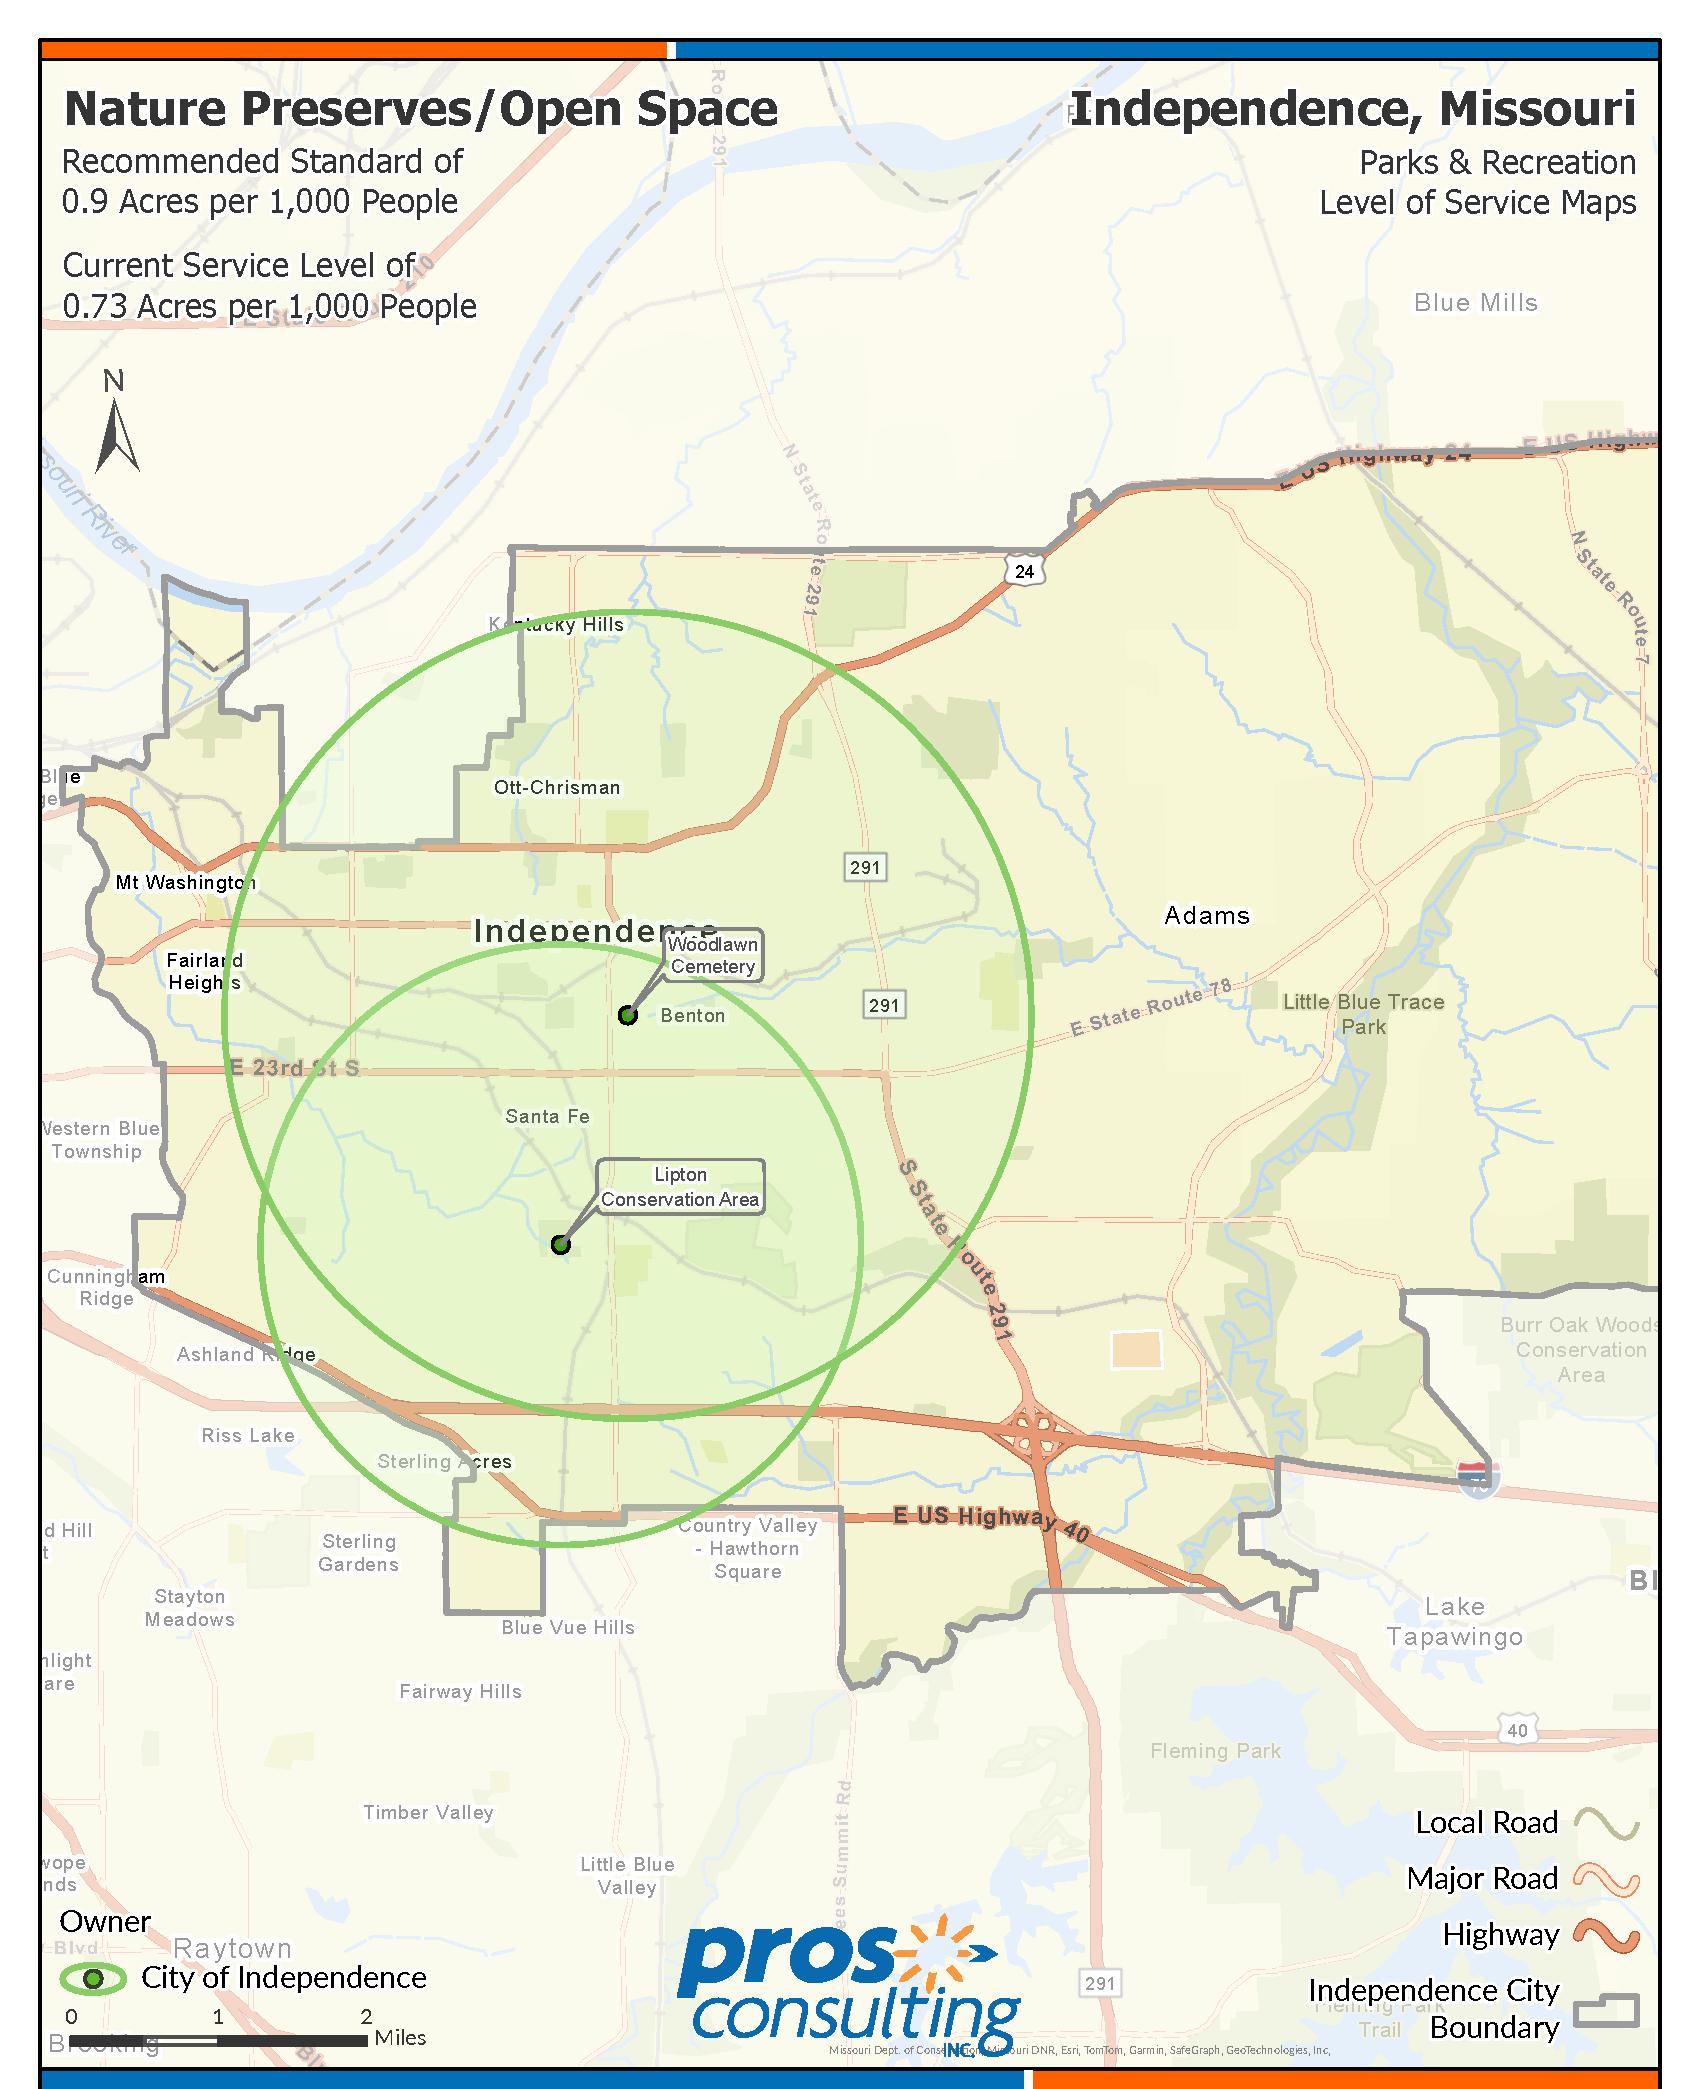
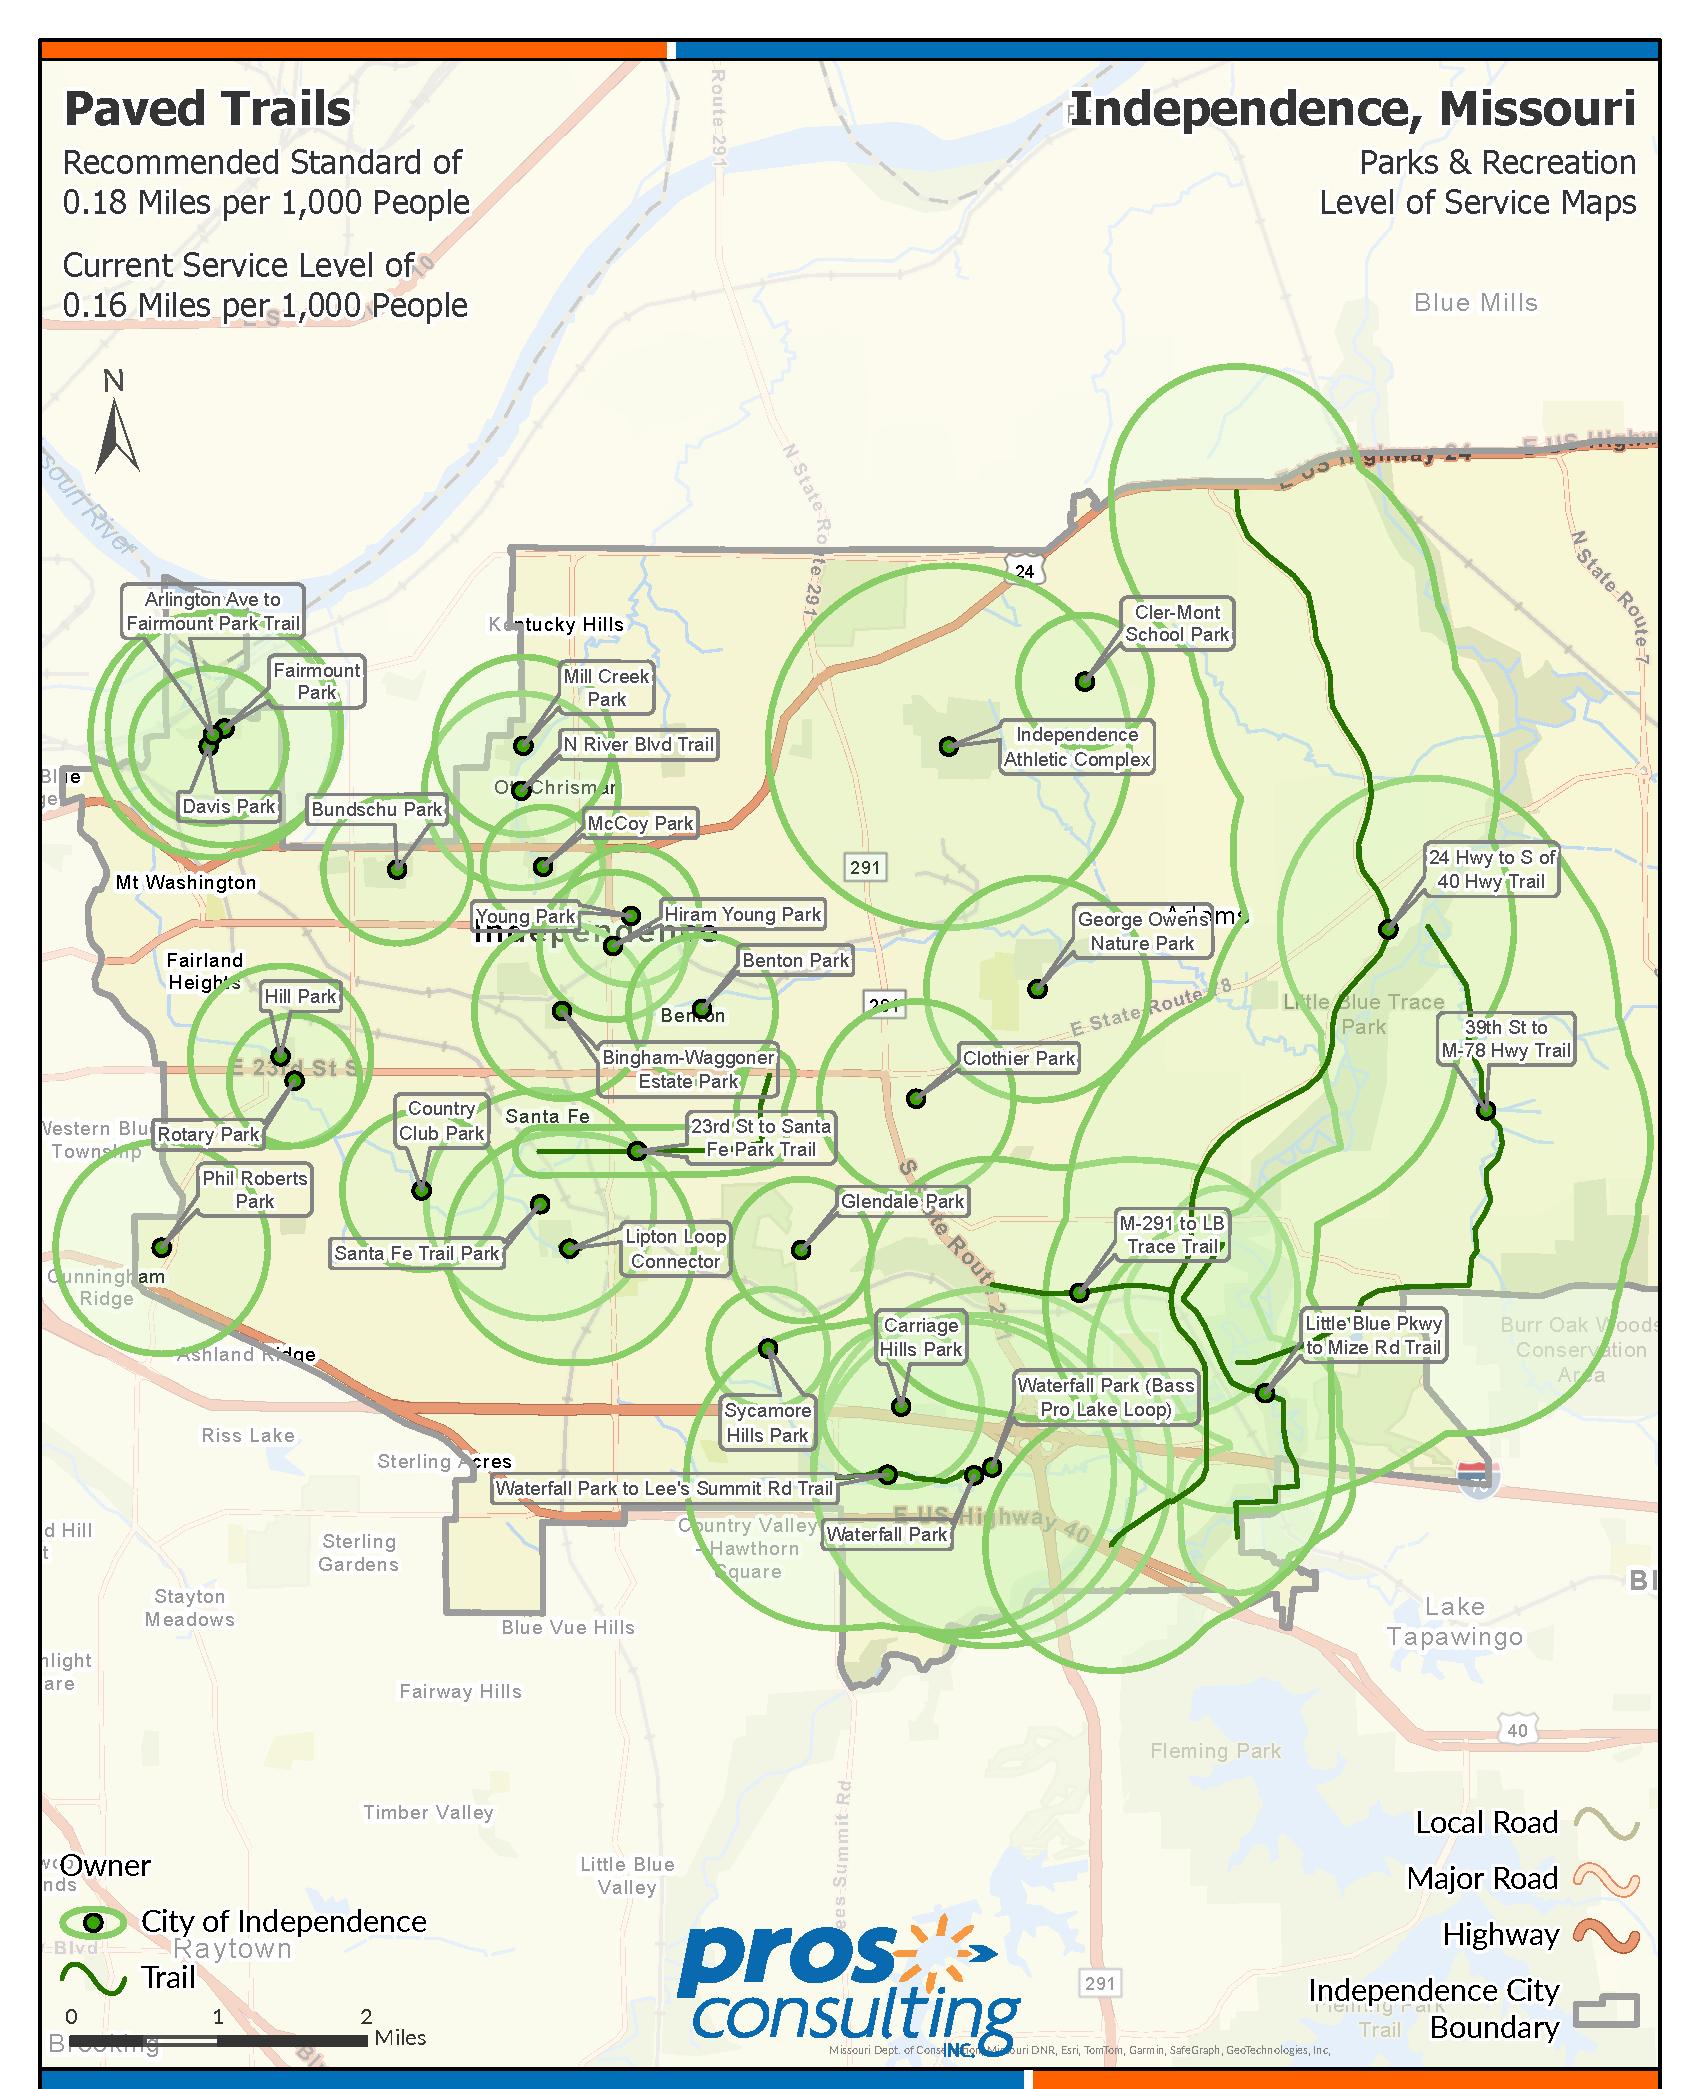
Independence’s current service level of .04 miles of unpaved trails per 1,000 people has been established as the recommended standard for the City’s population projections and level of service needs.
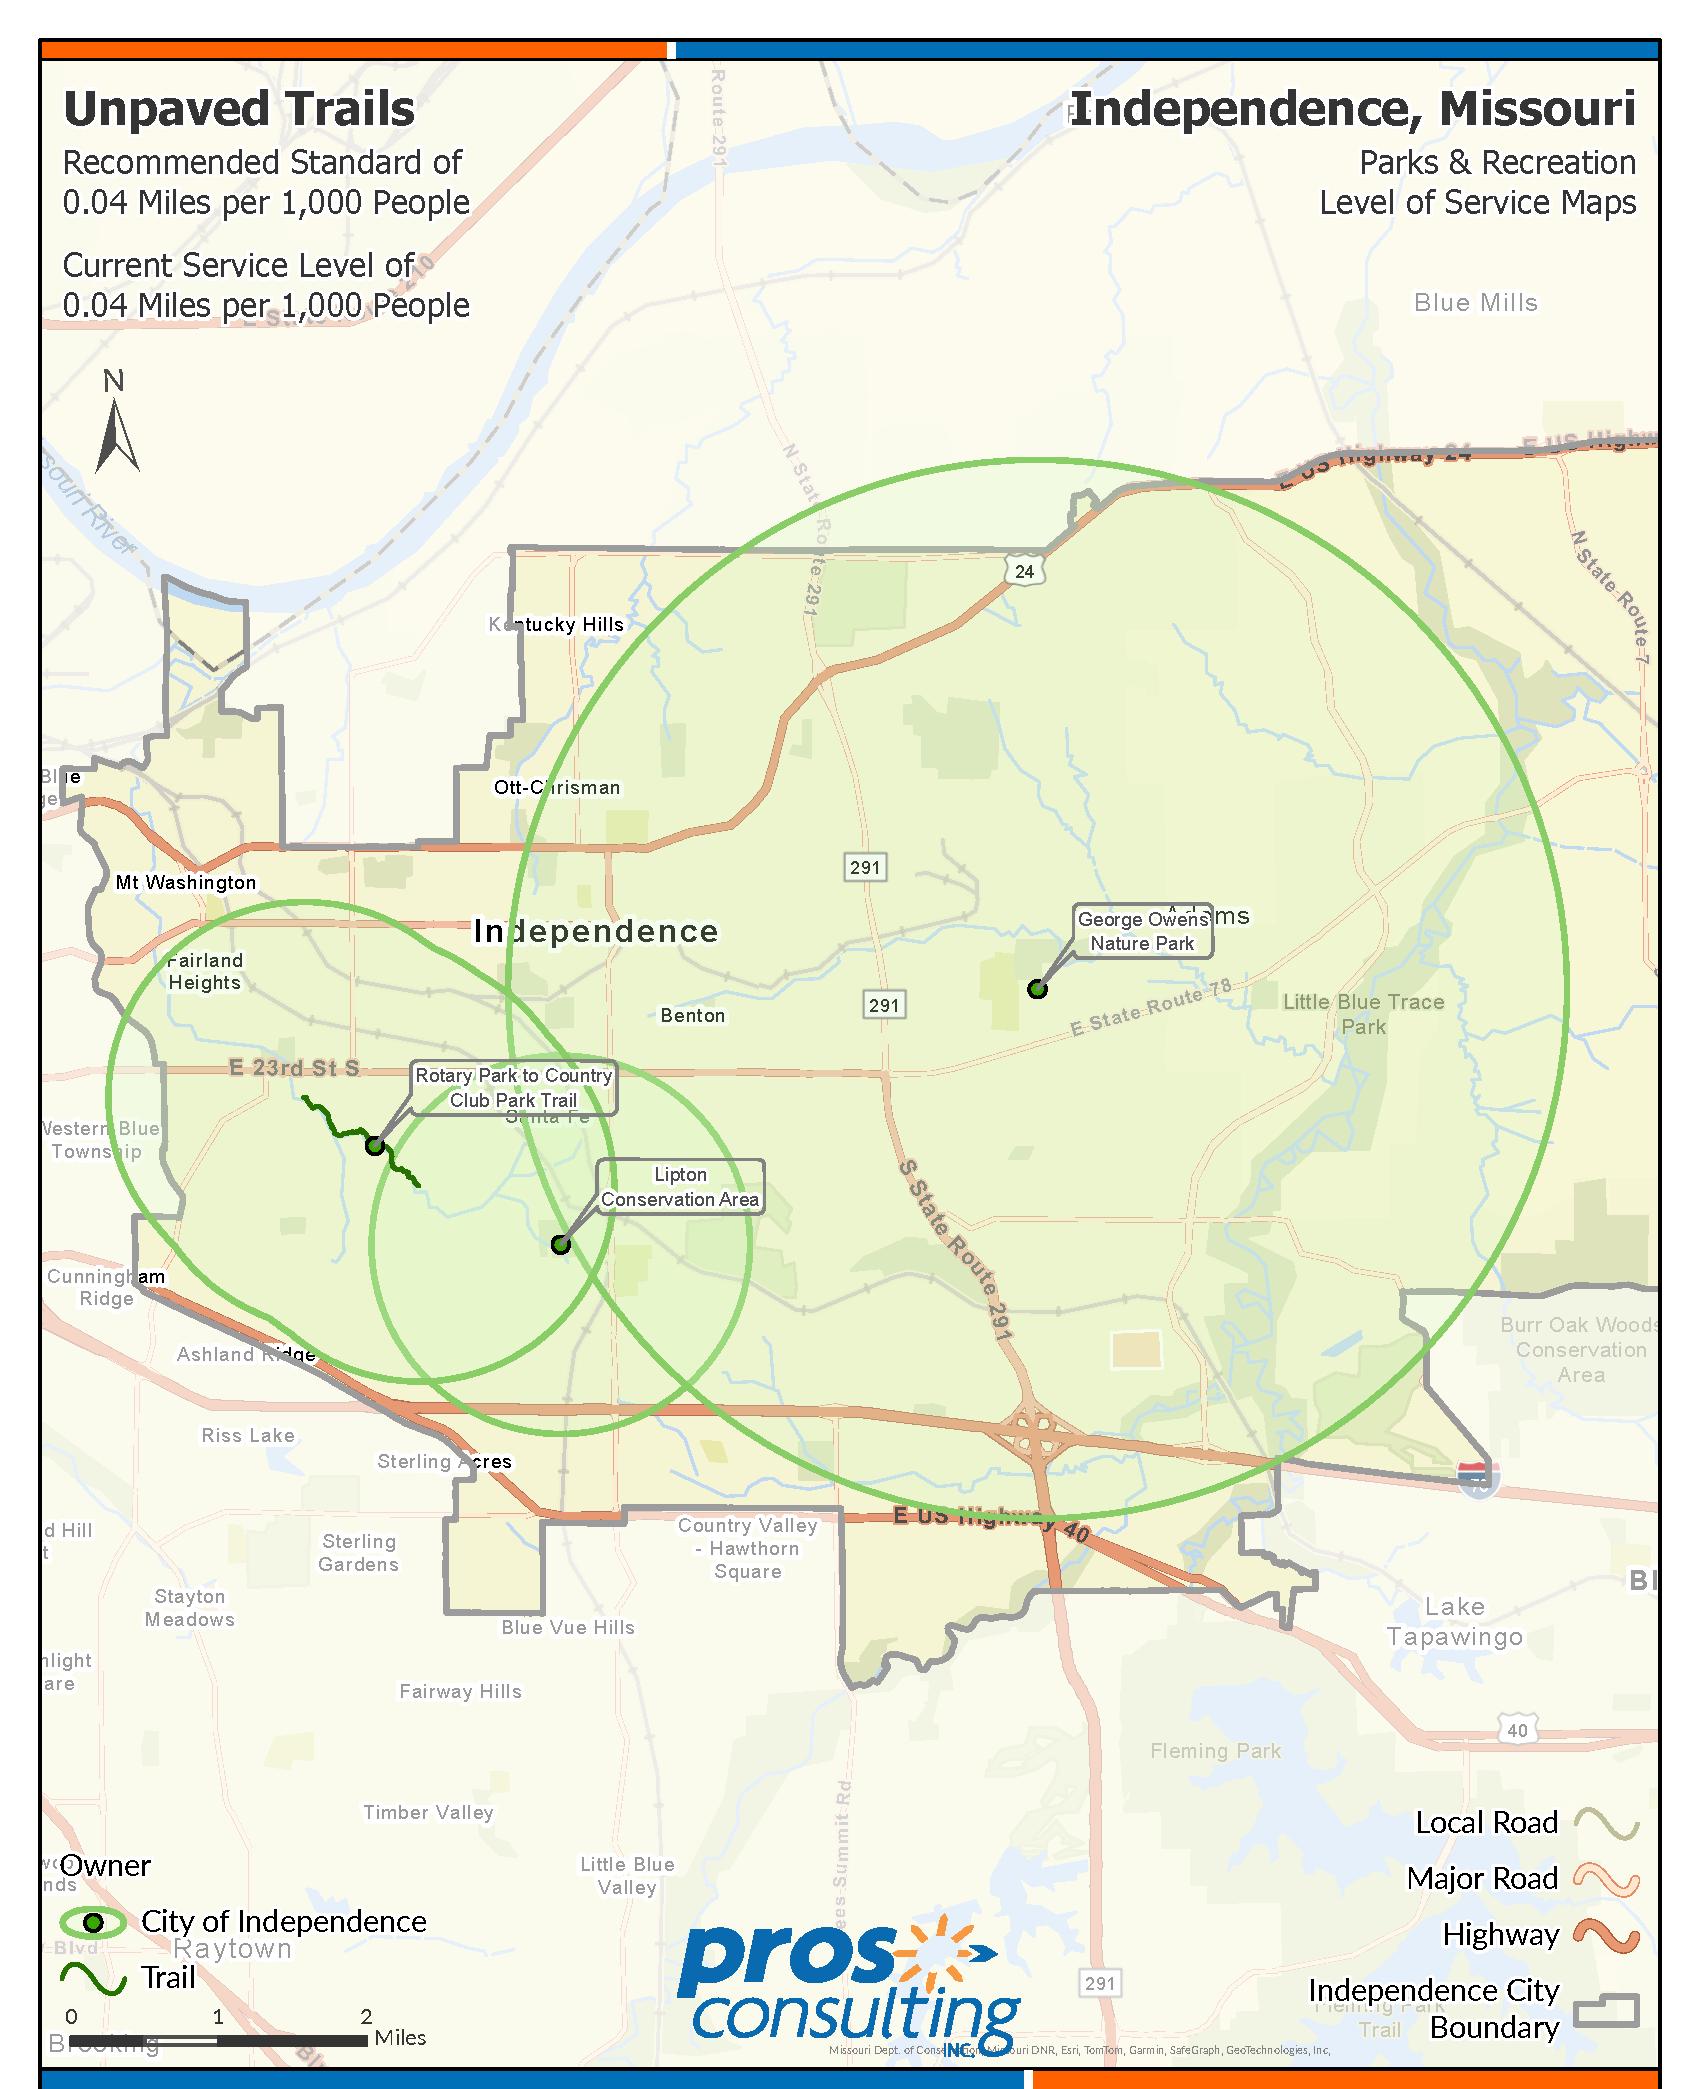
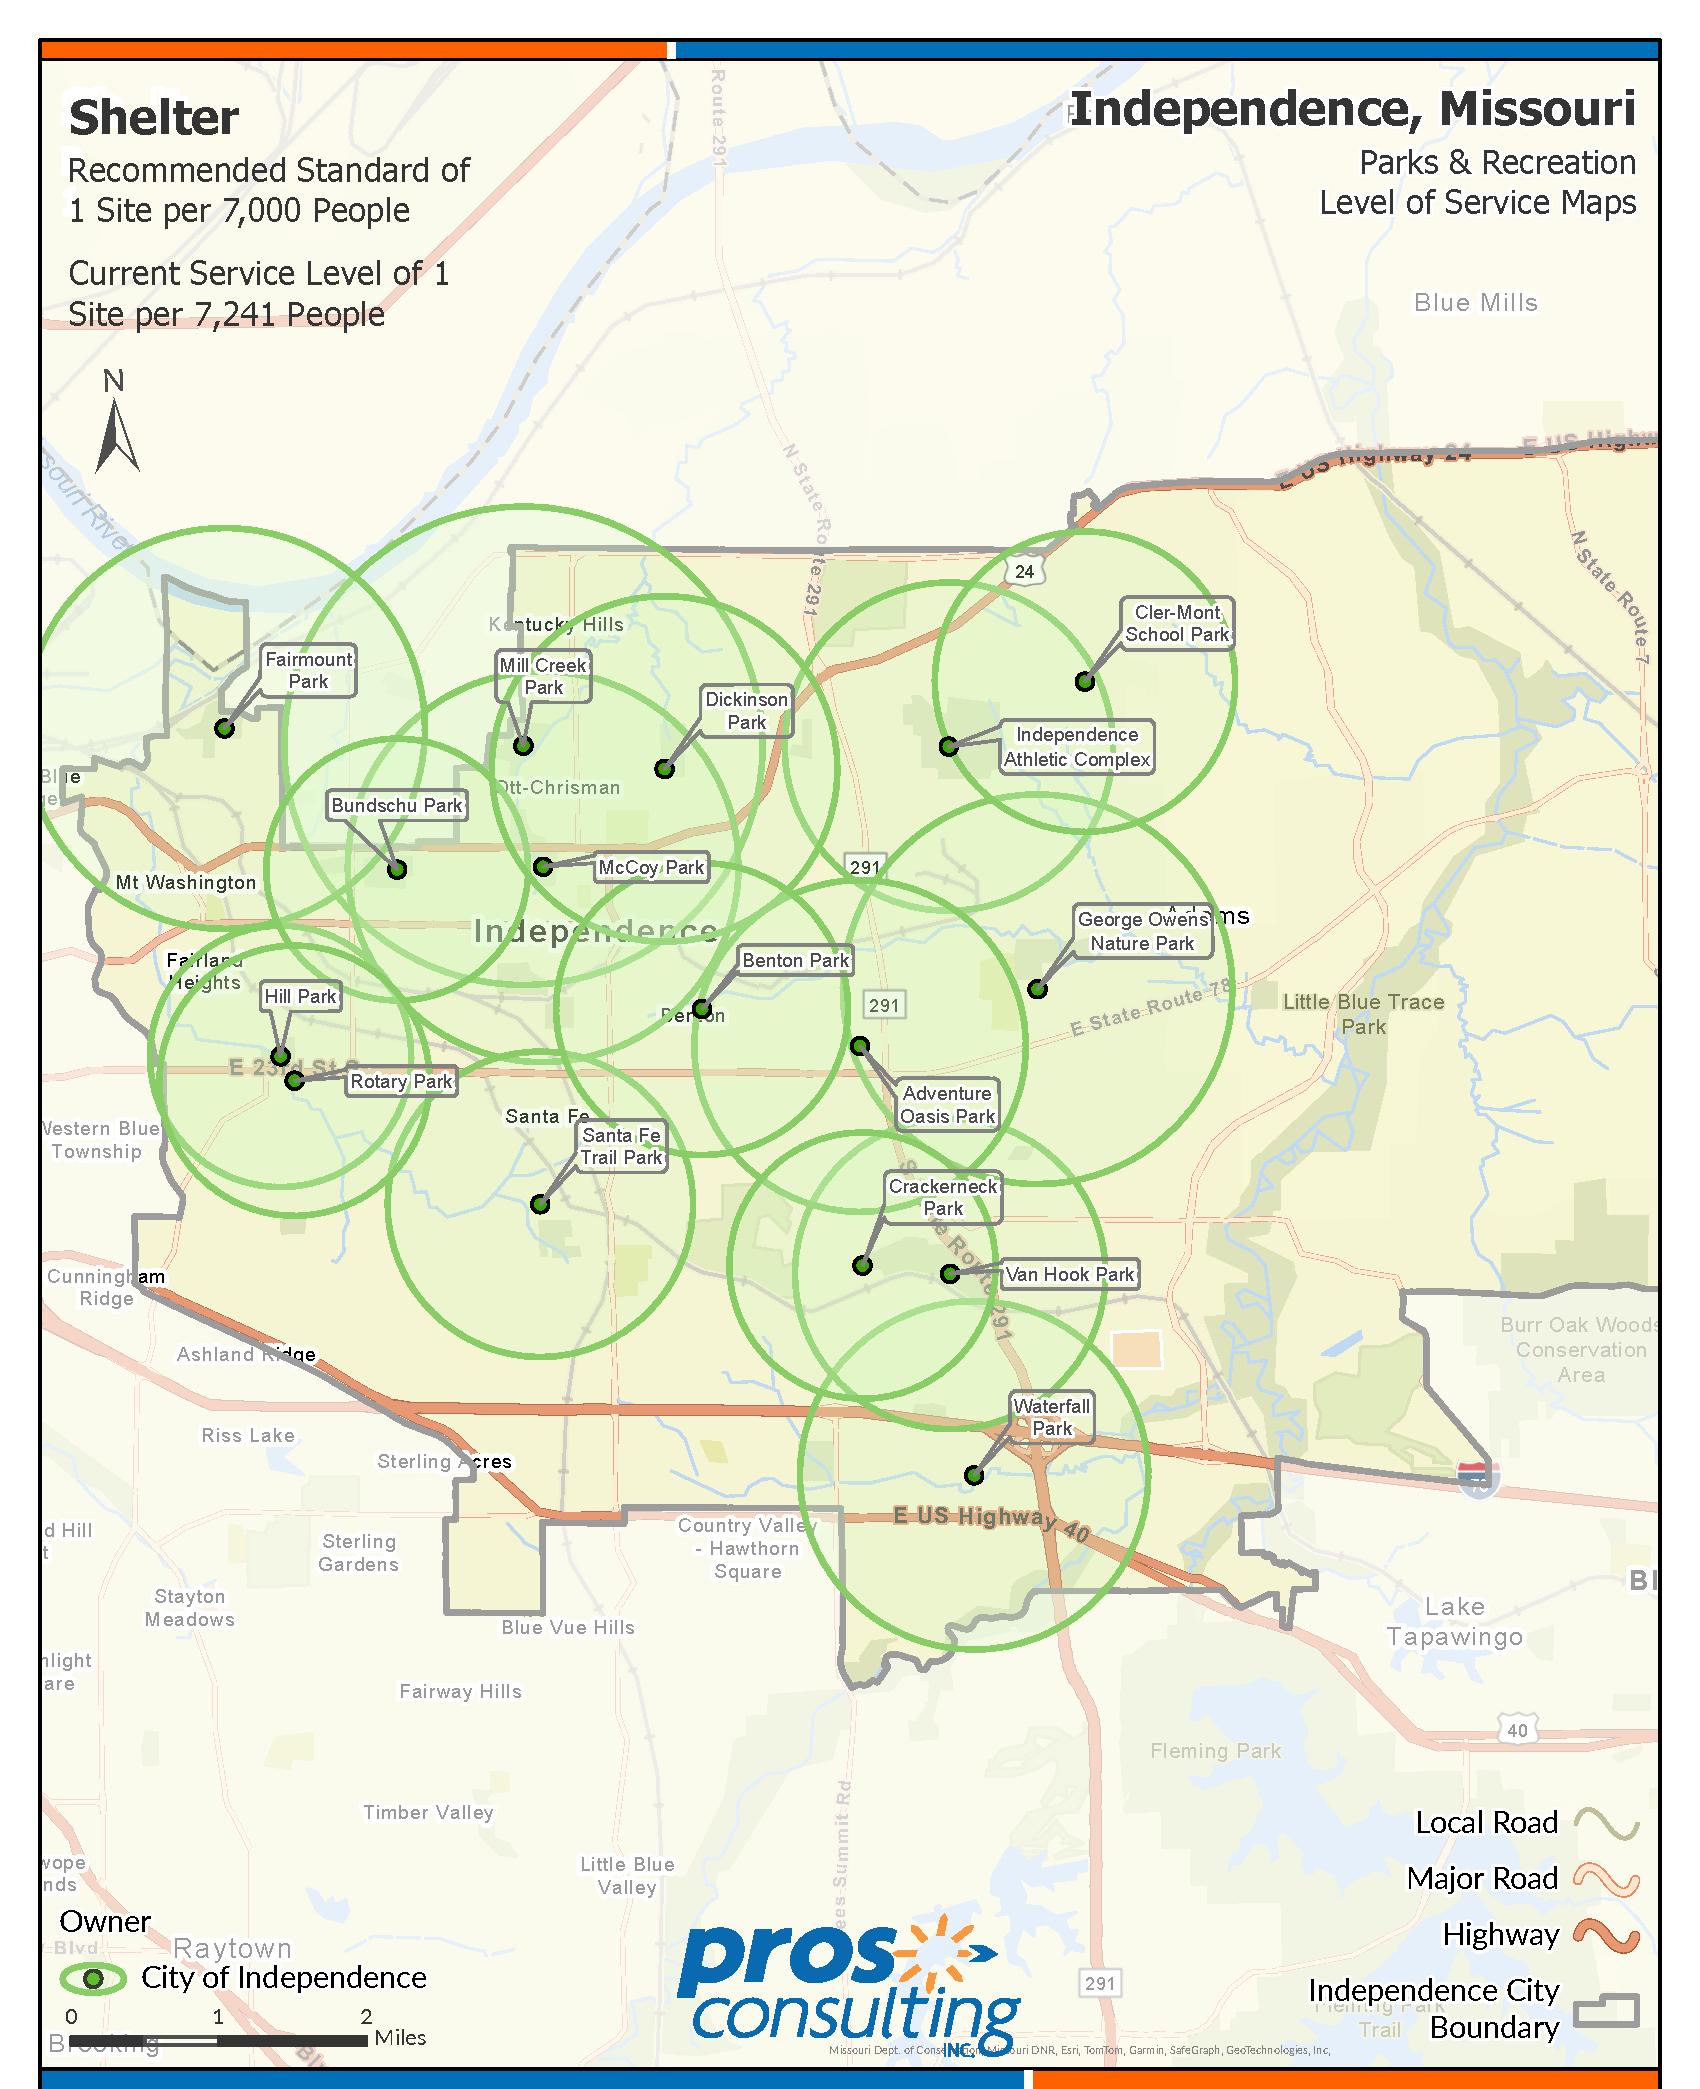
Independence’s current service level of 1 basketball court per 7,694 people has been established as the recommended standard for the City’s population projections and level of service needs.
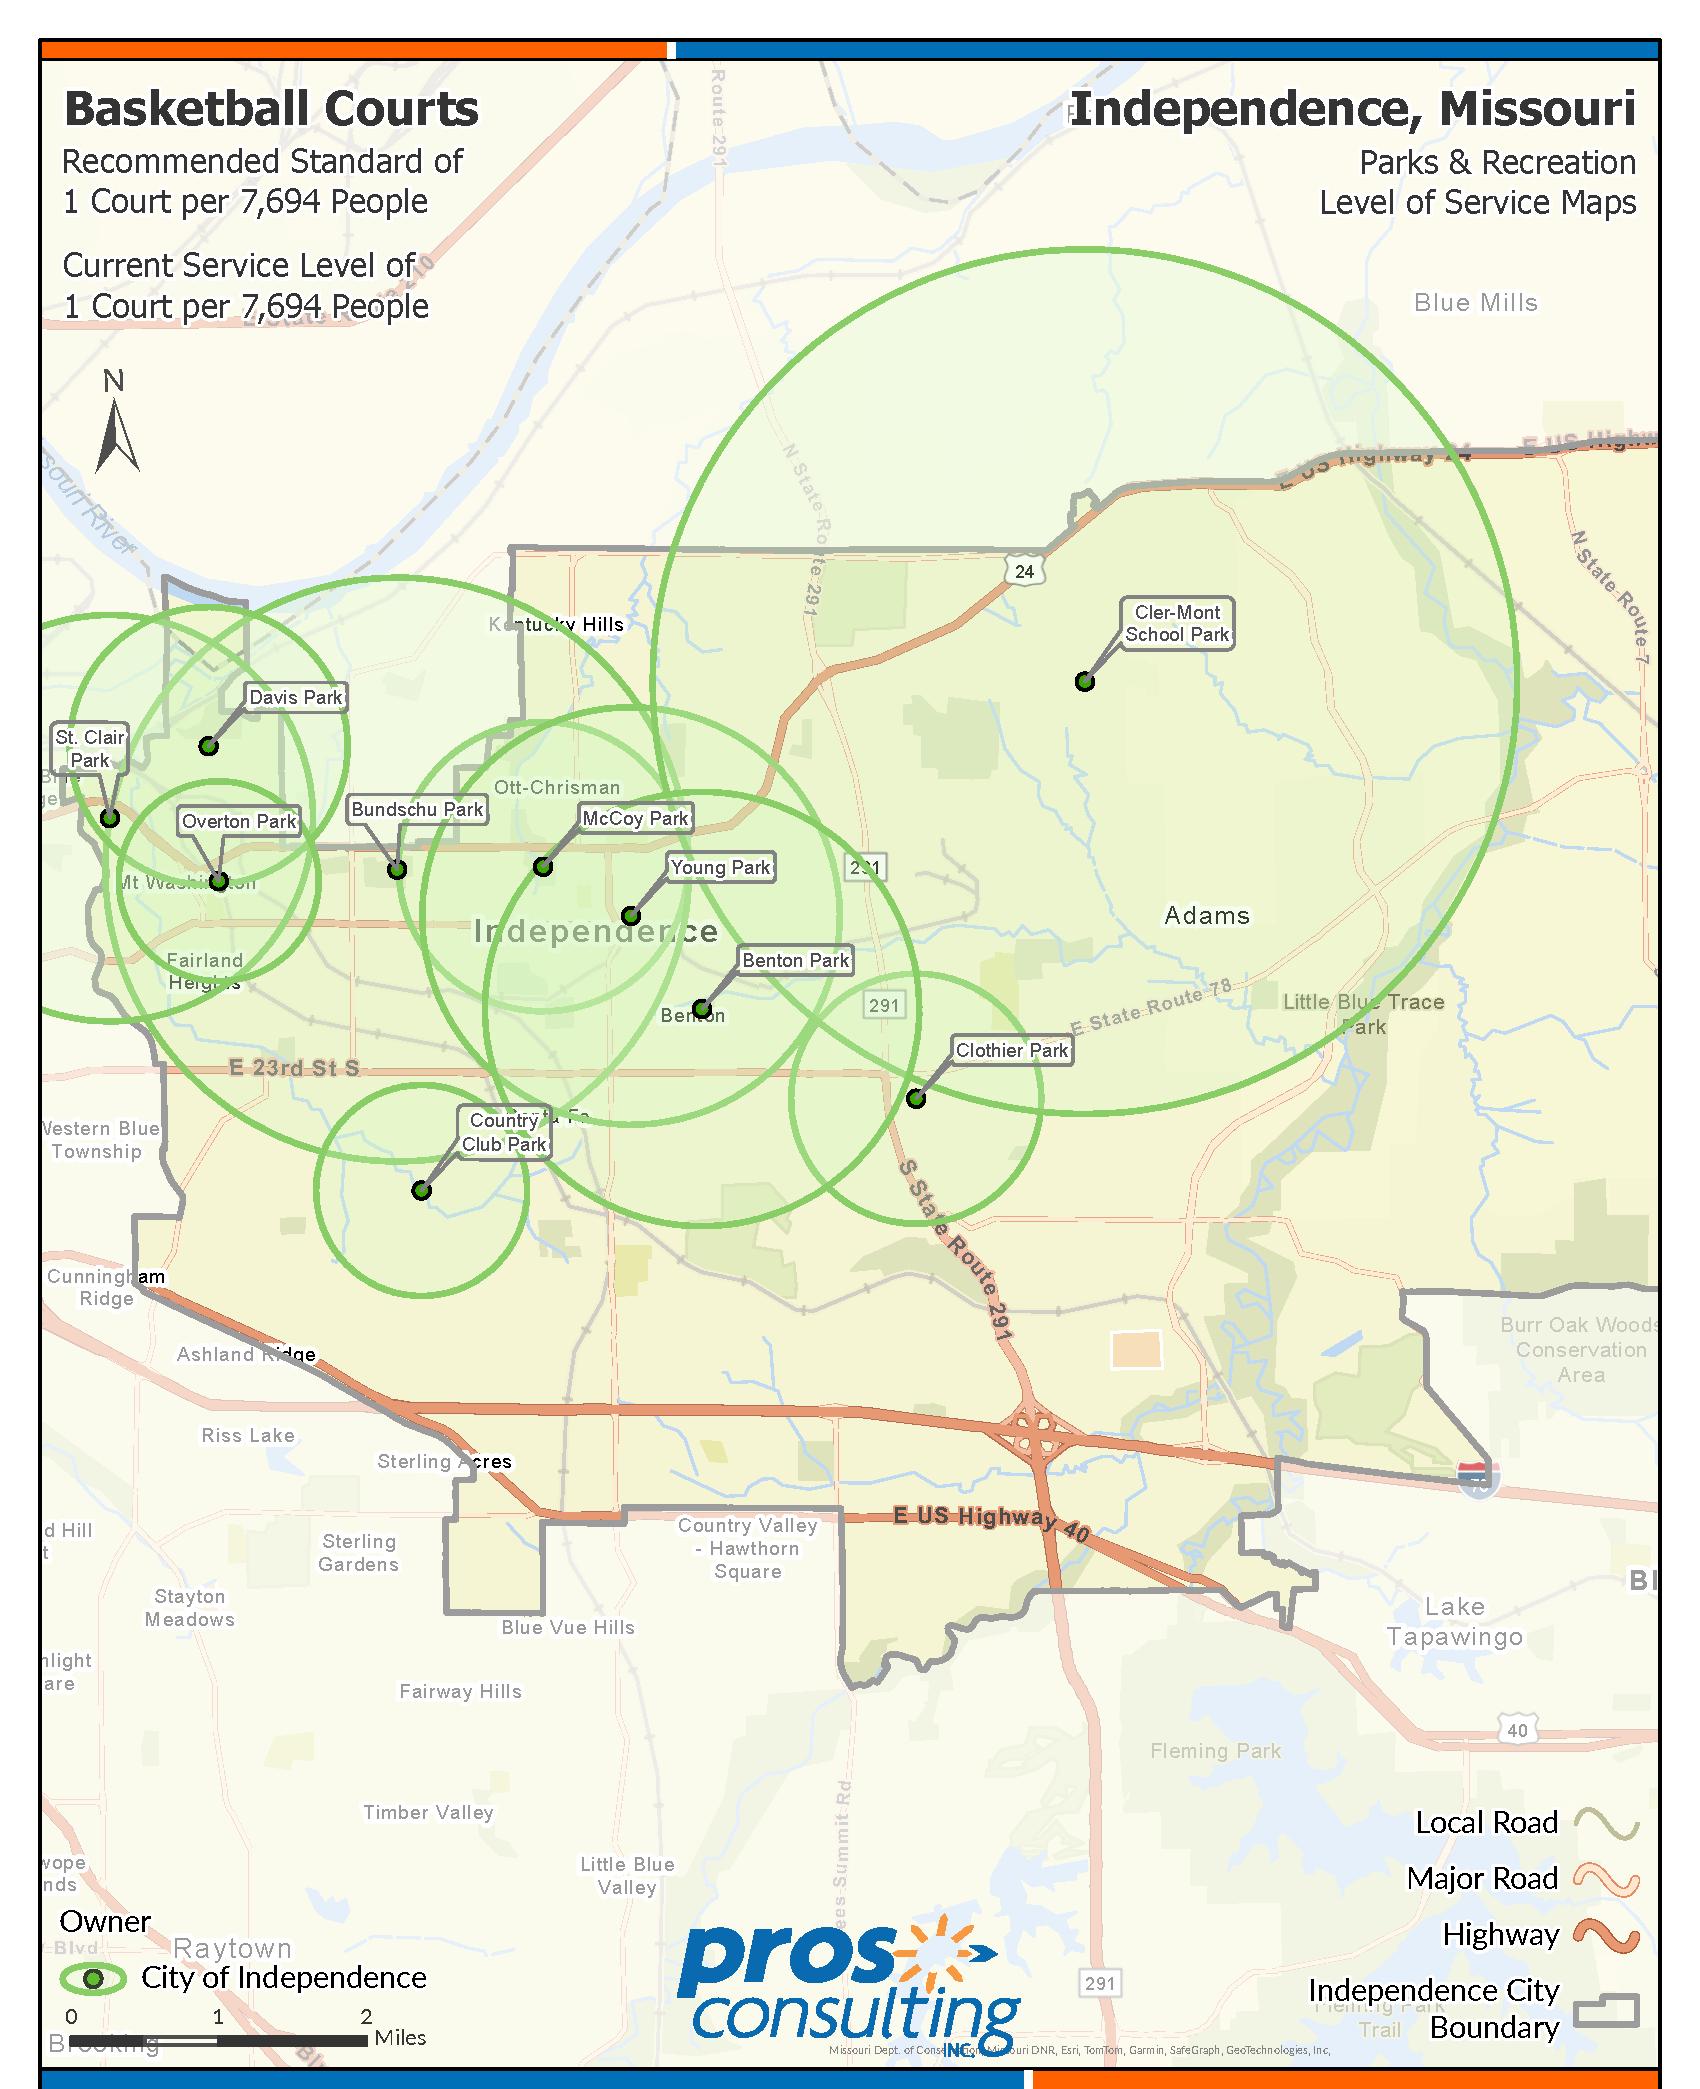
Independence’s current service level of 1 splash pad per 61,551 people has been established as the recommended standard for the City’s population projections and level of service needs.
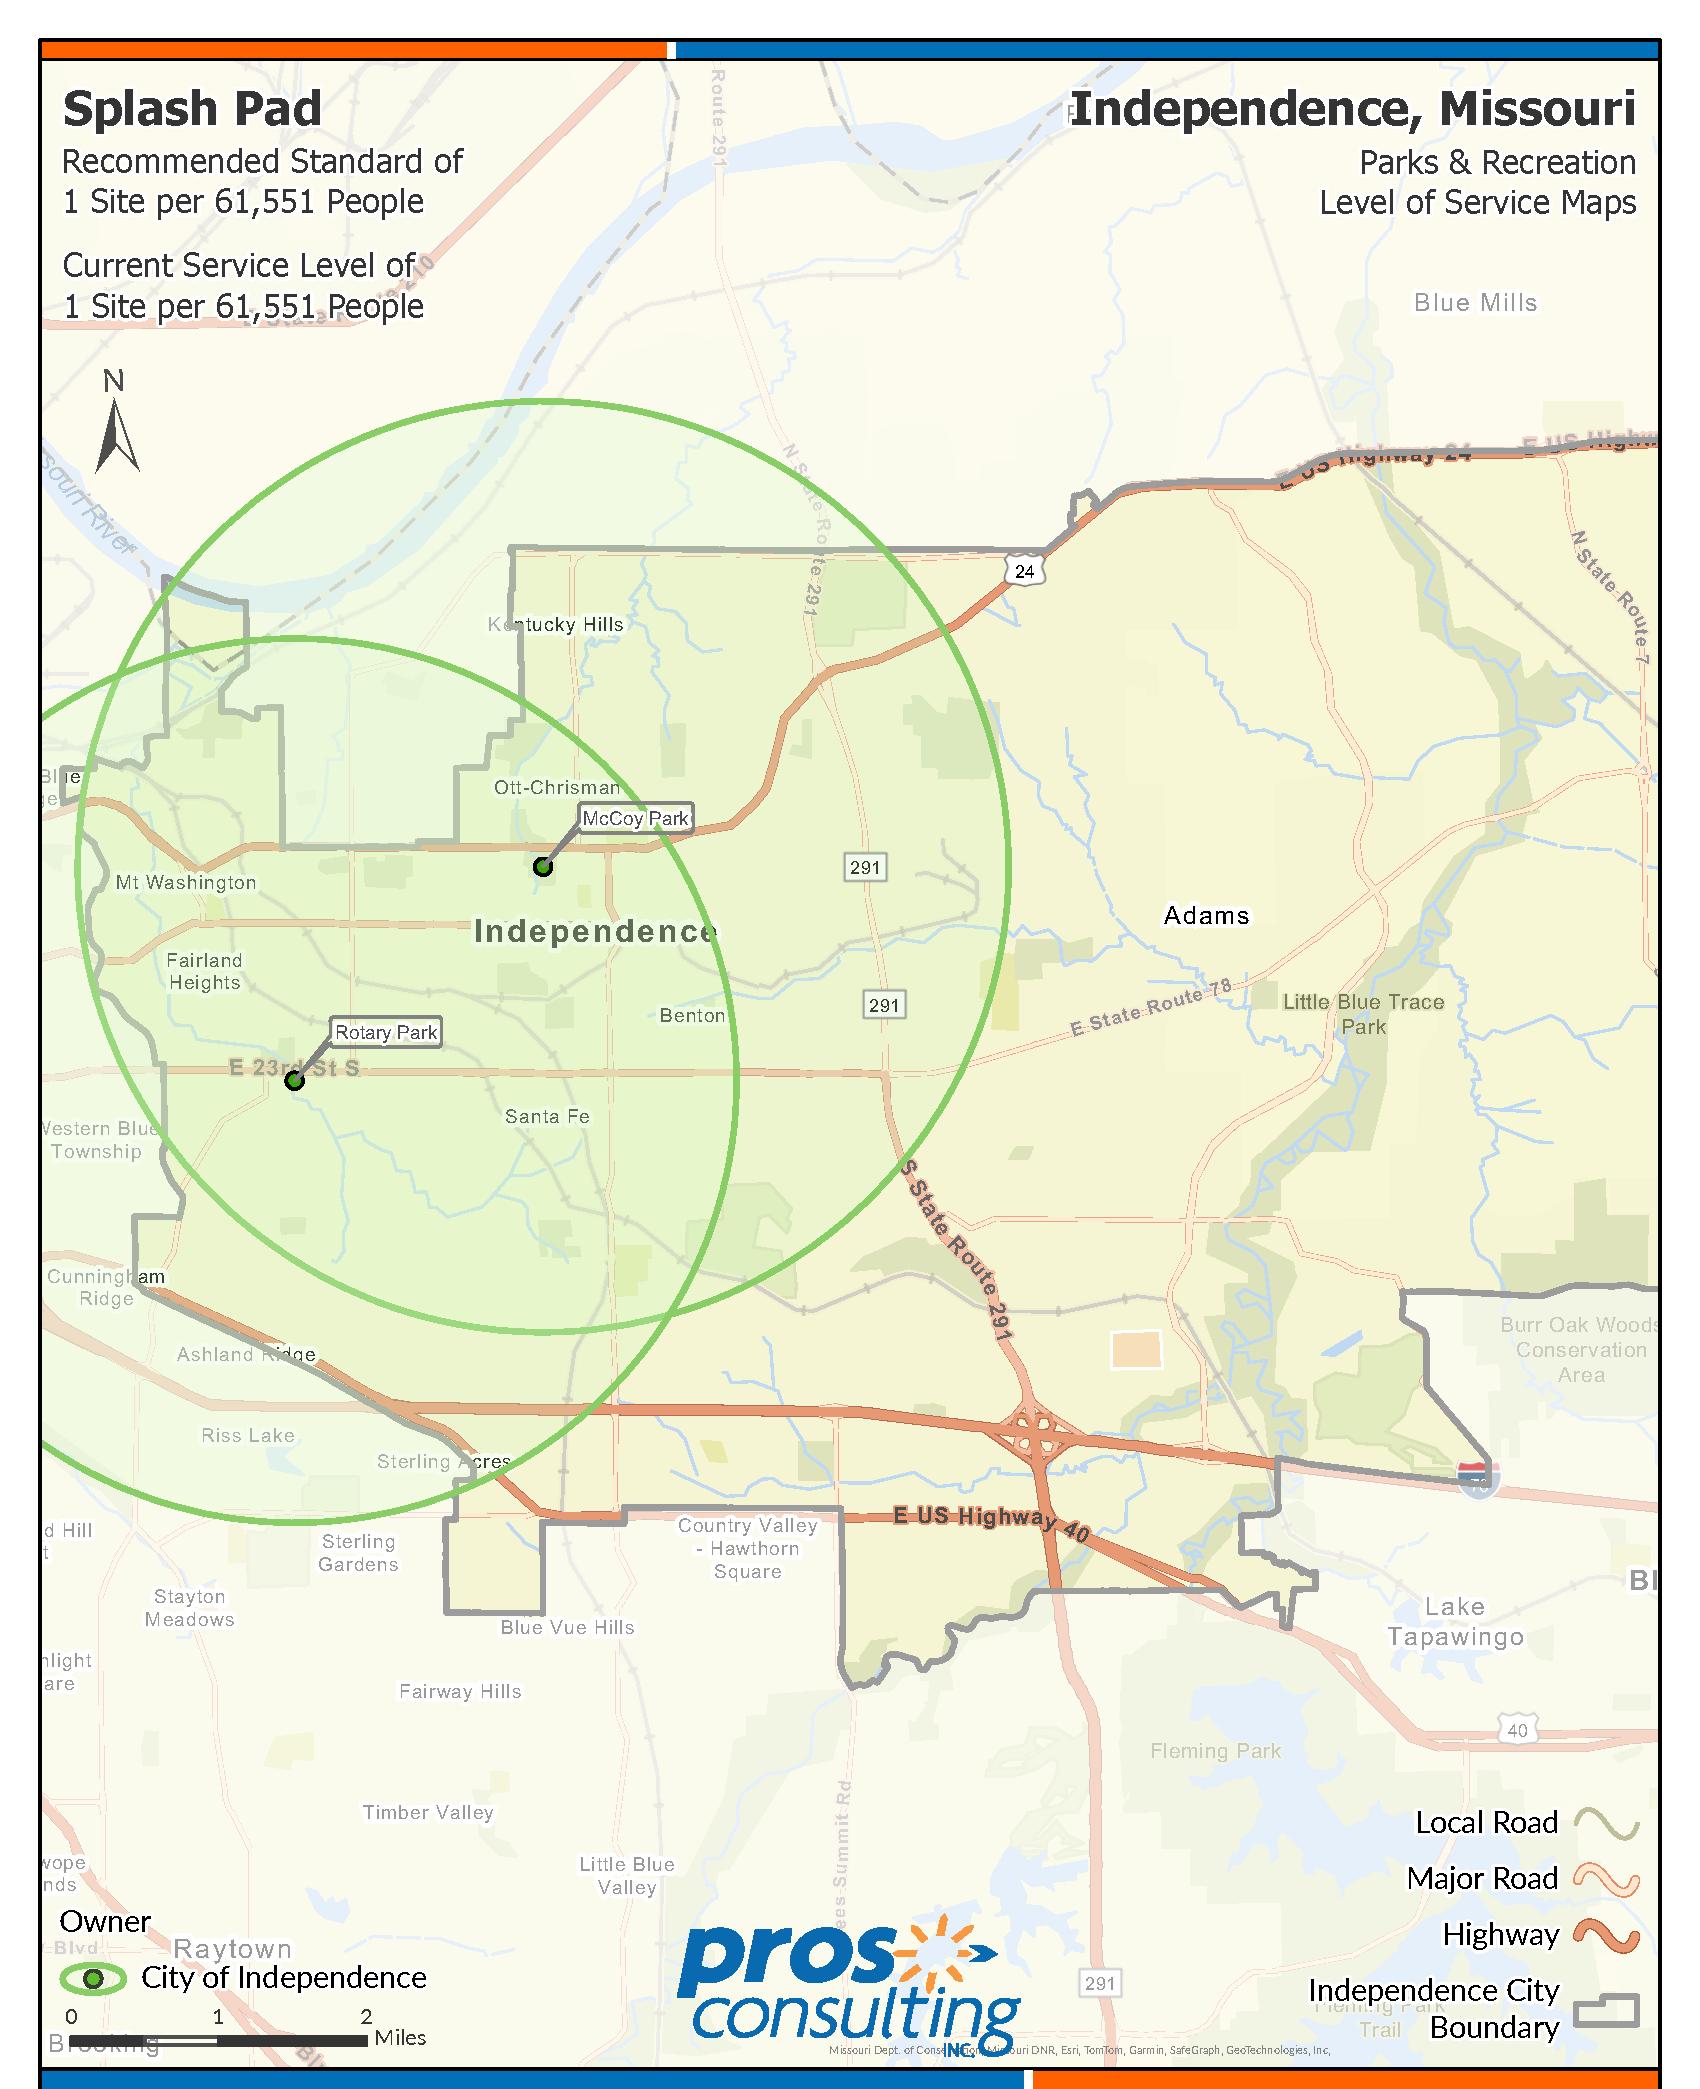
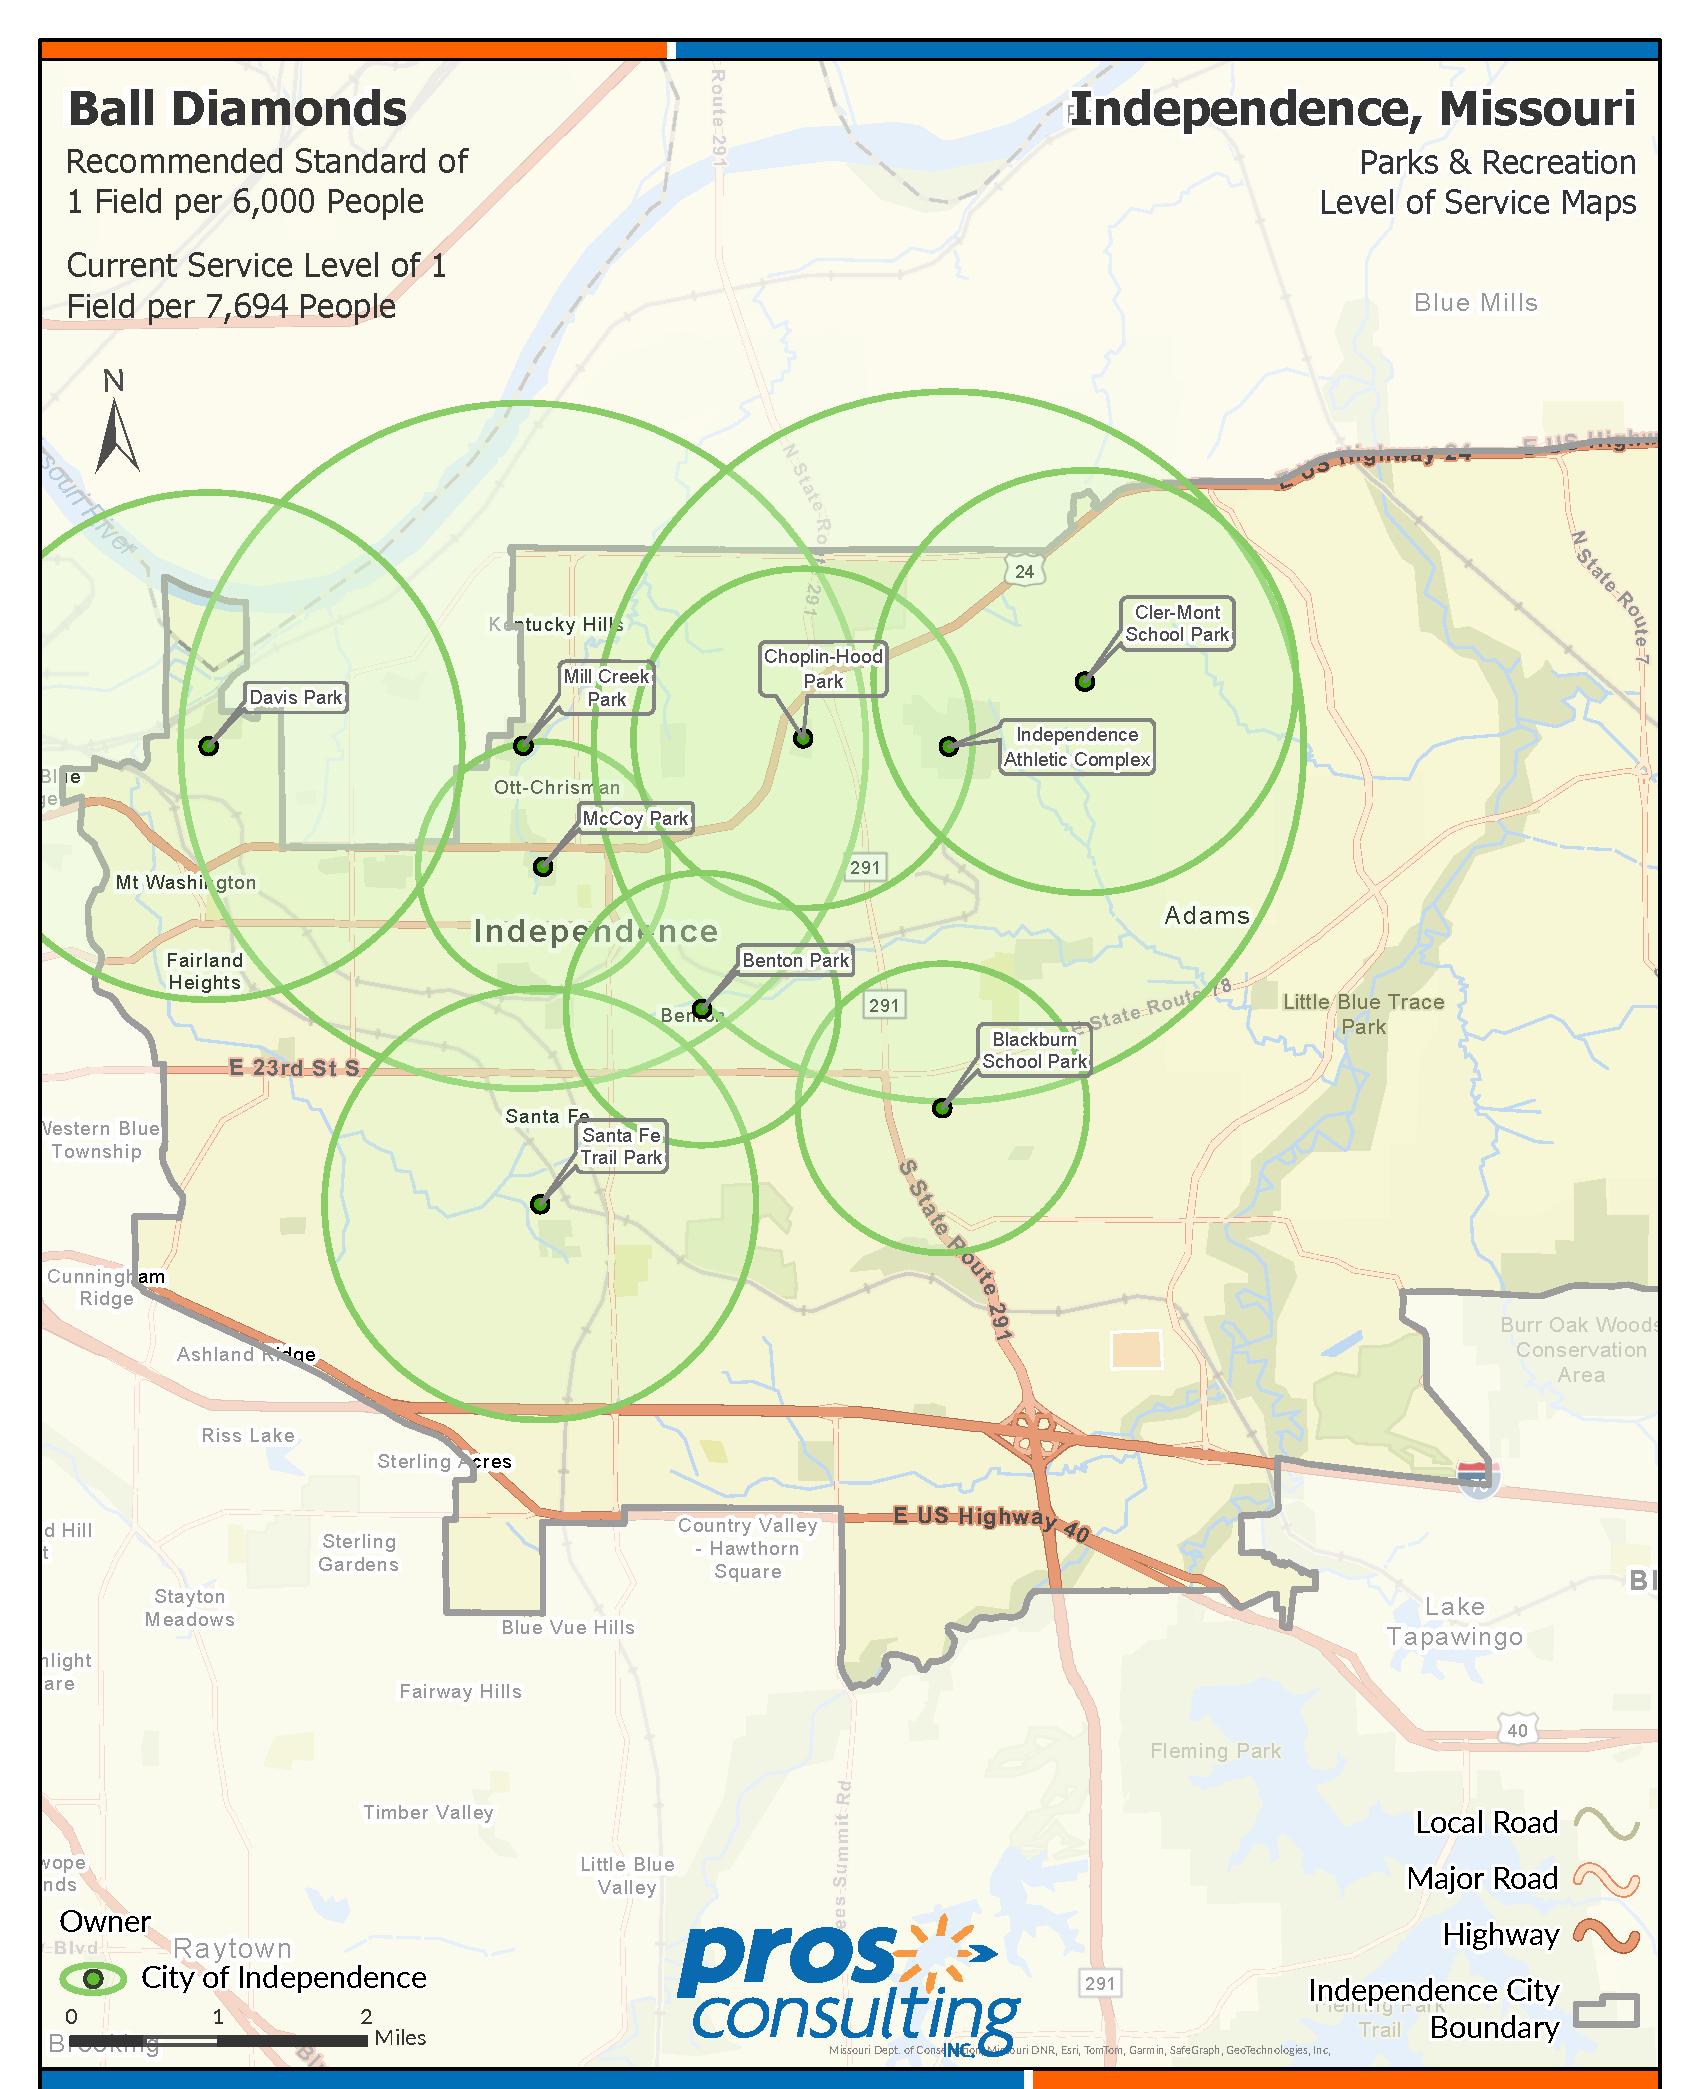
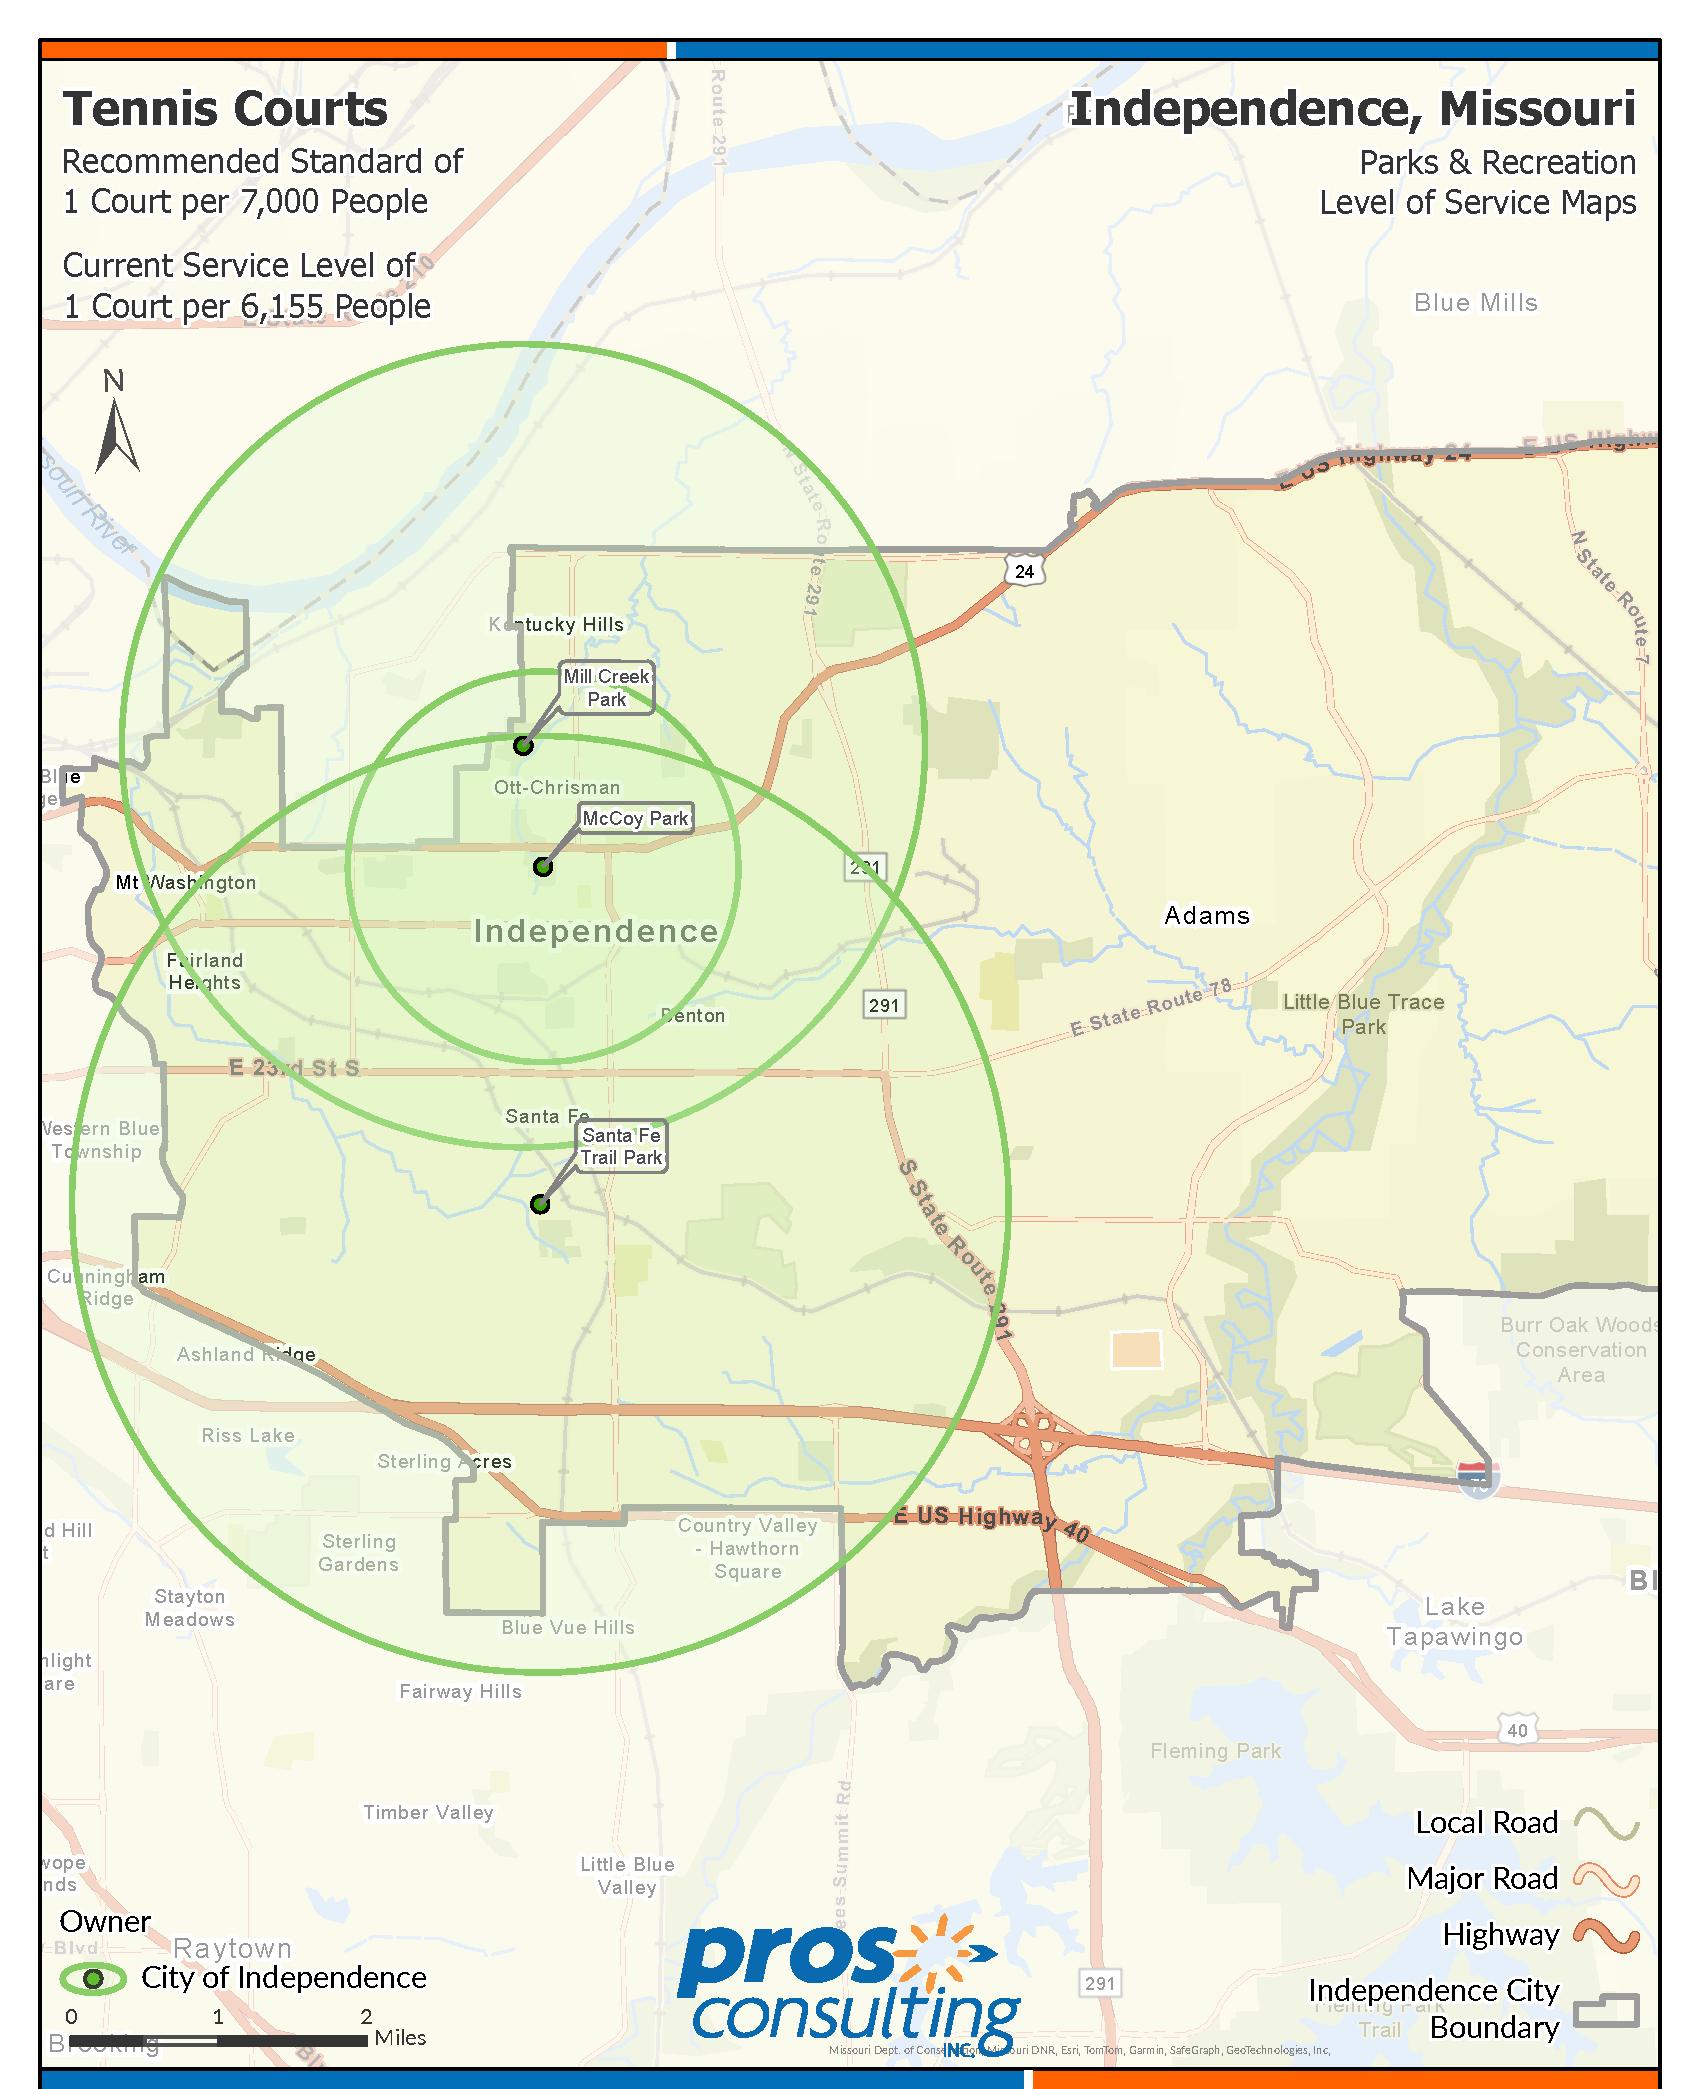
Independence’s current service level of 1 pickleball court per 20,517 people has been established as the recommended standard for the City’s population projections and level of service needs.
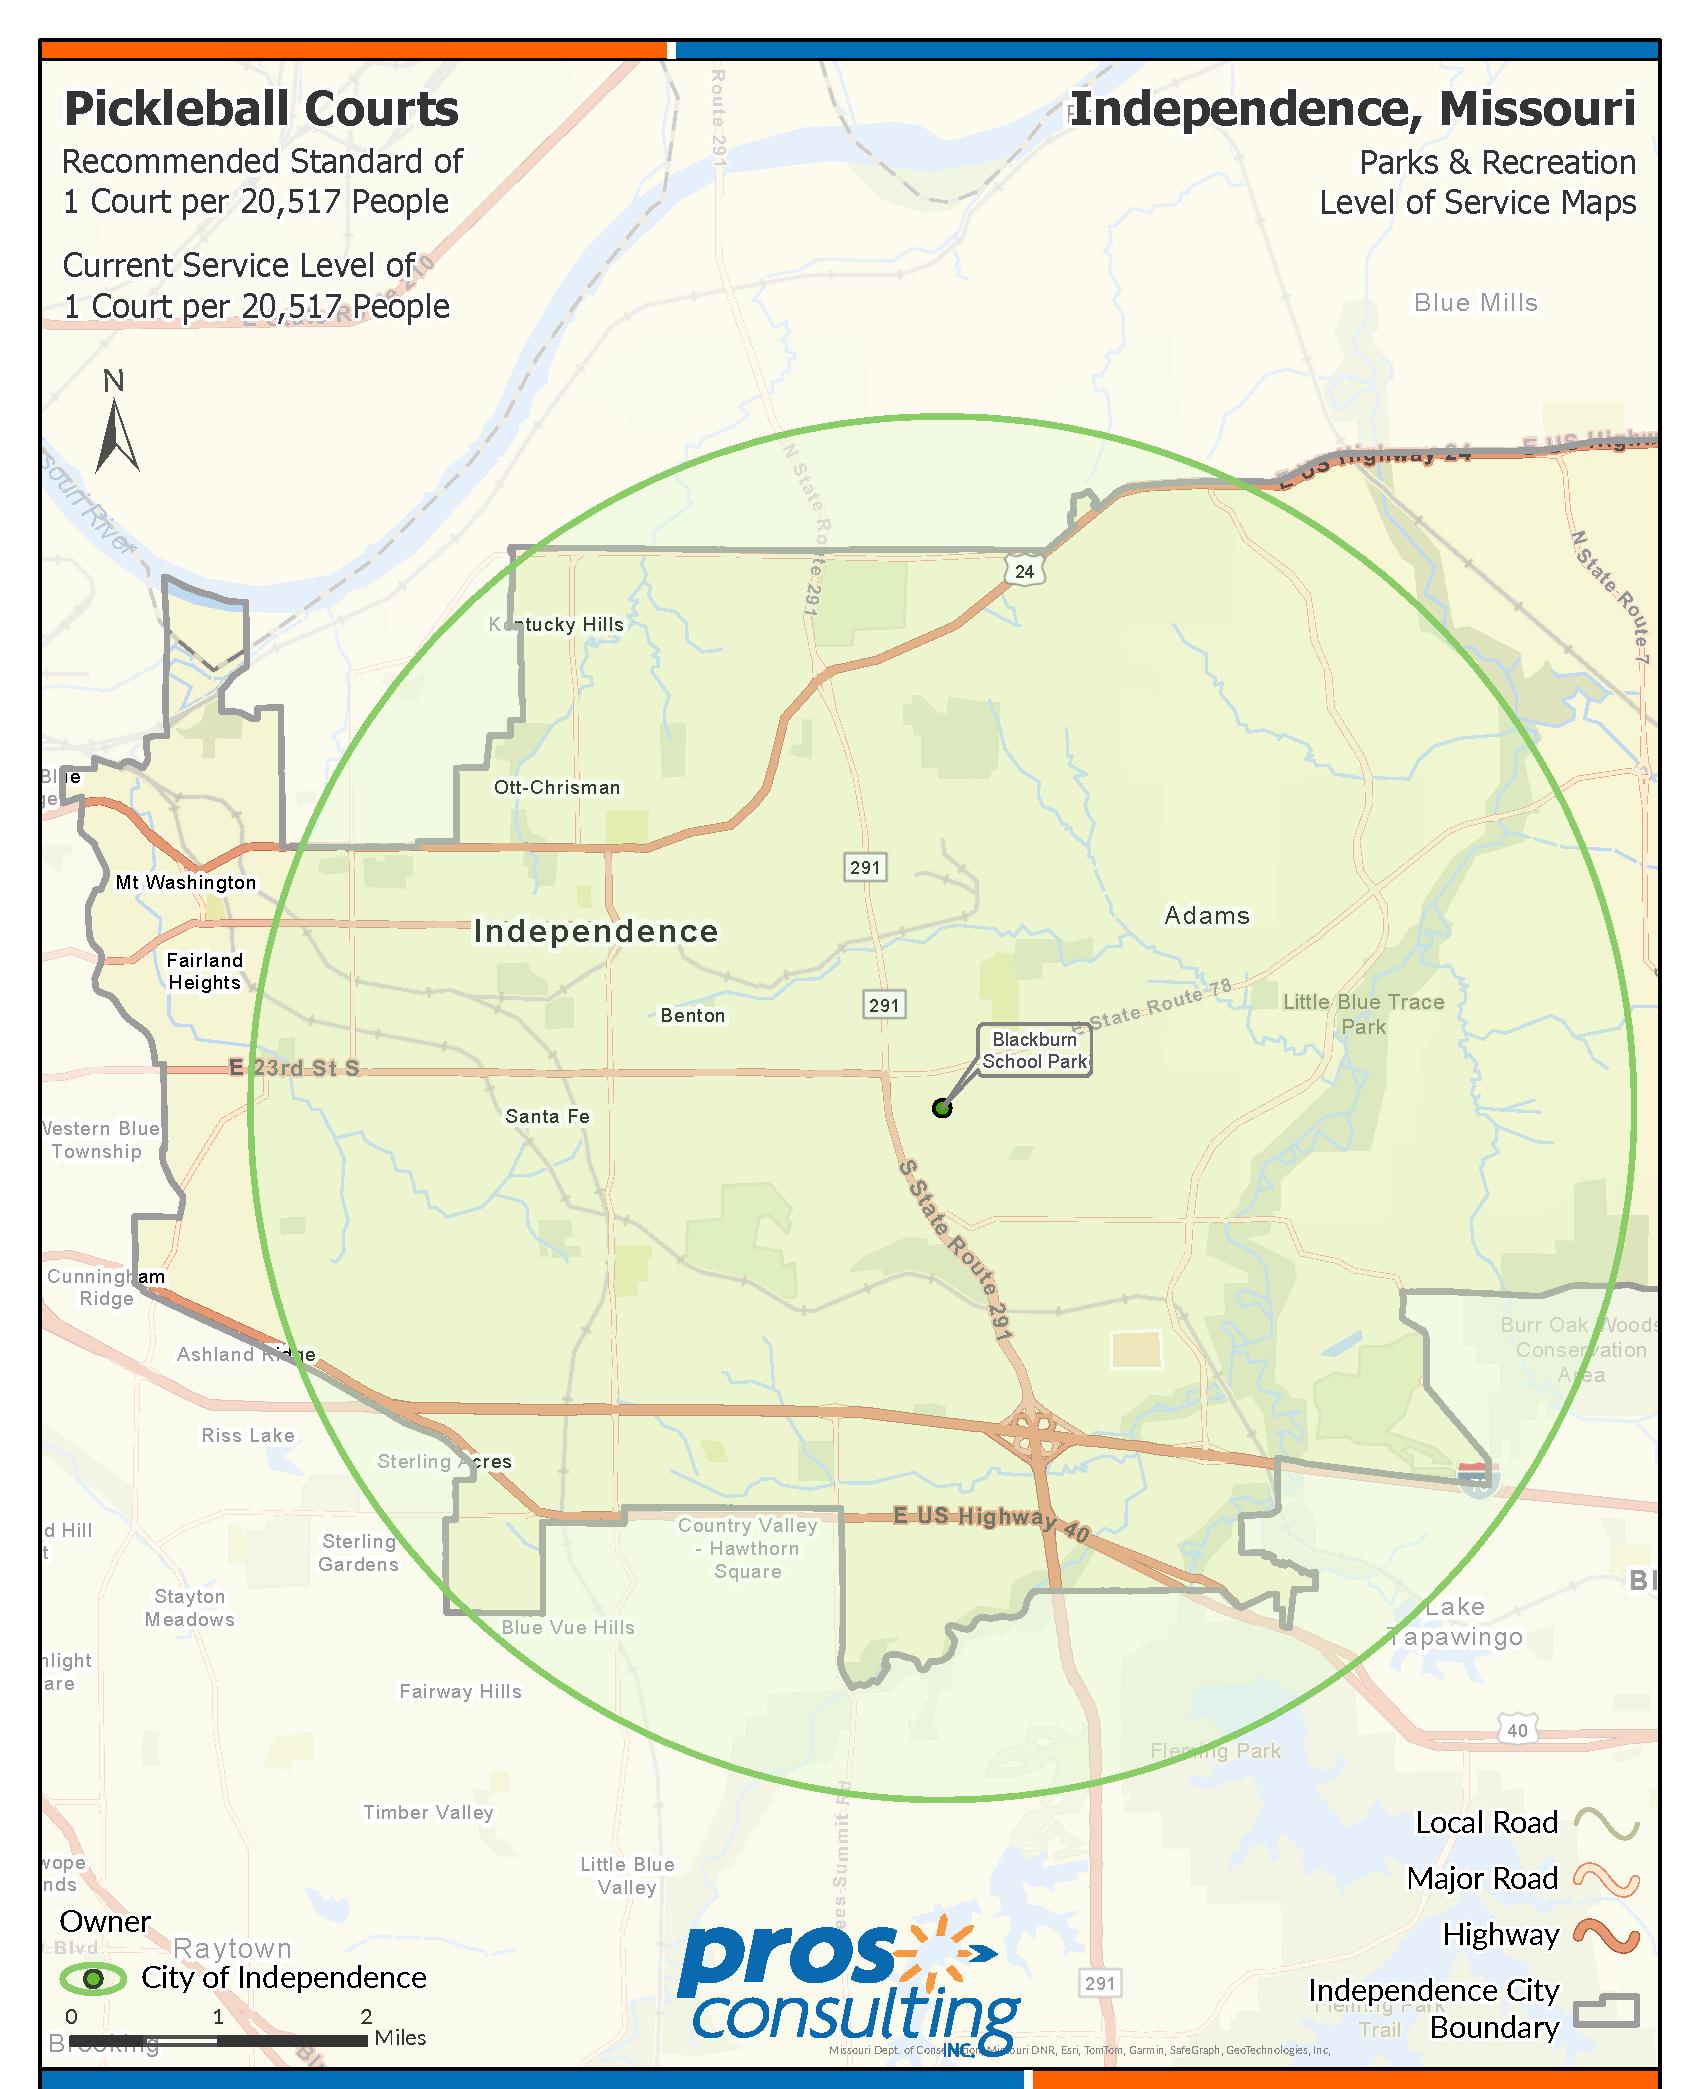
Independence’s current service level of 1 playground per 4,735 people has been established as the recommended standard for the City’s population projections and level of service needs.
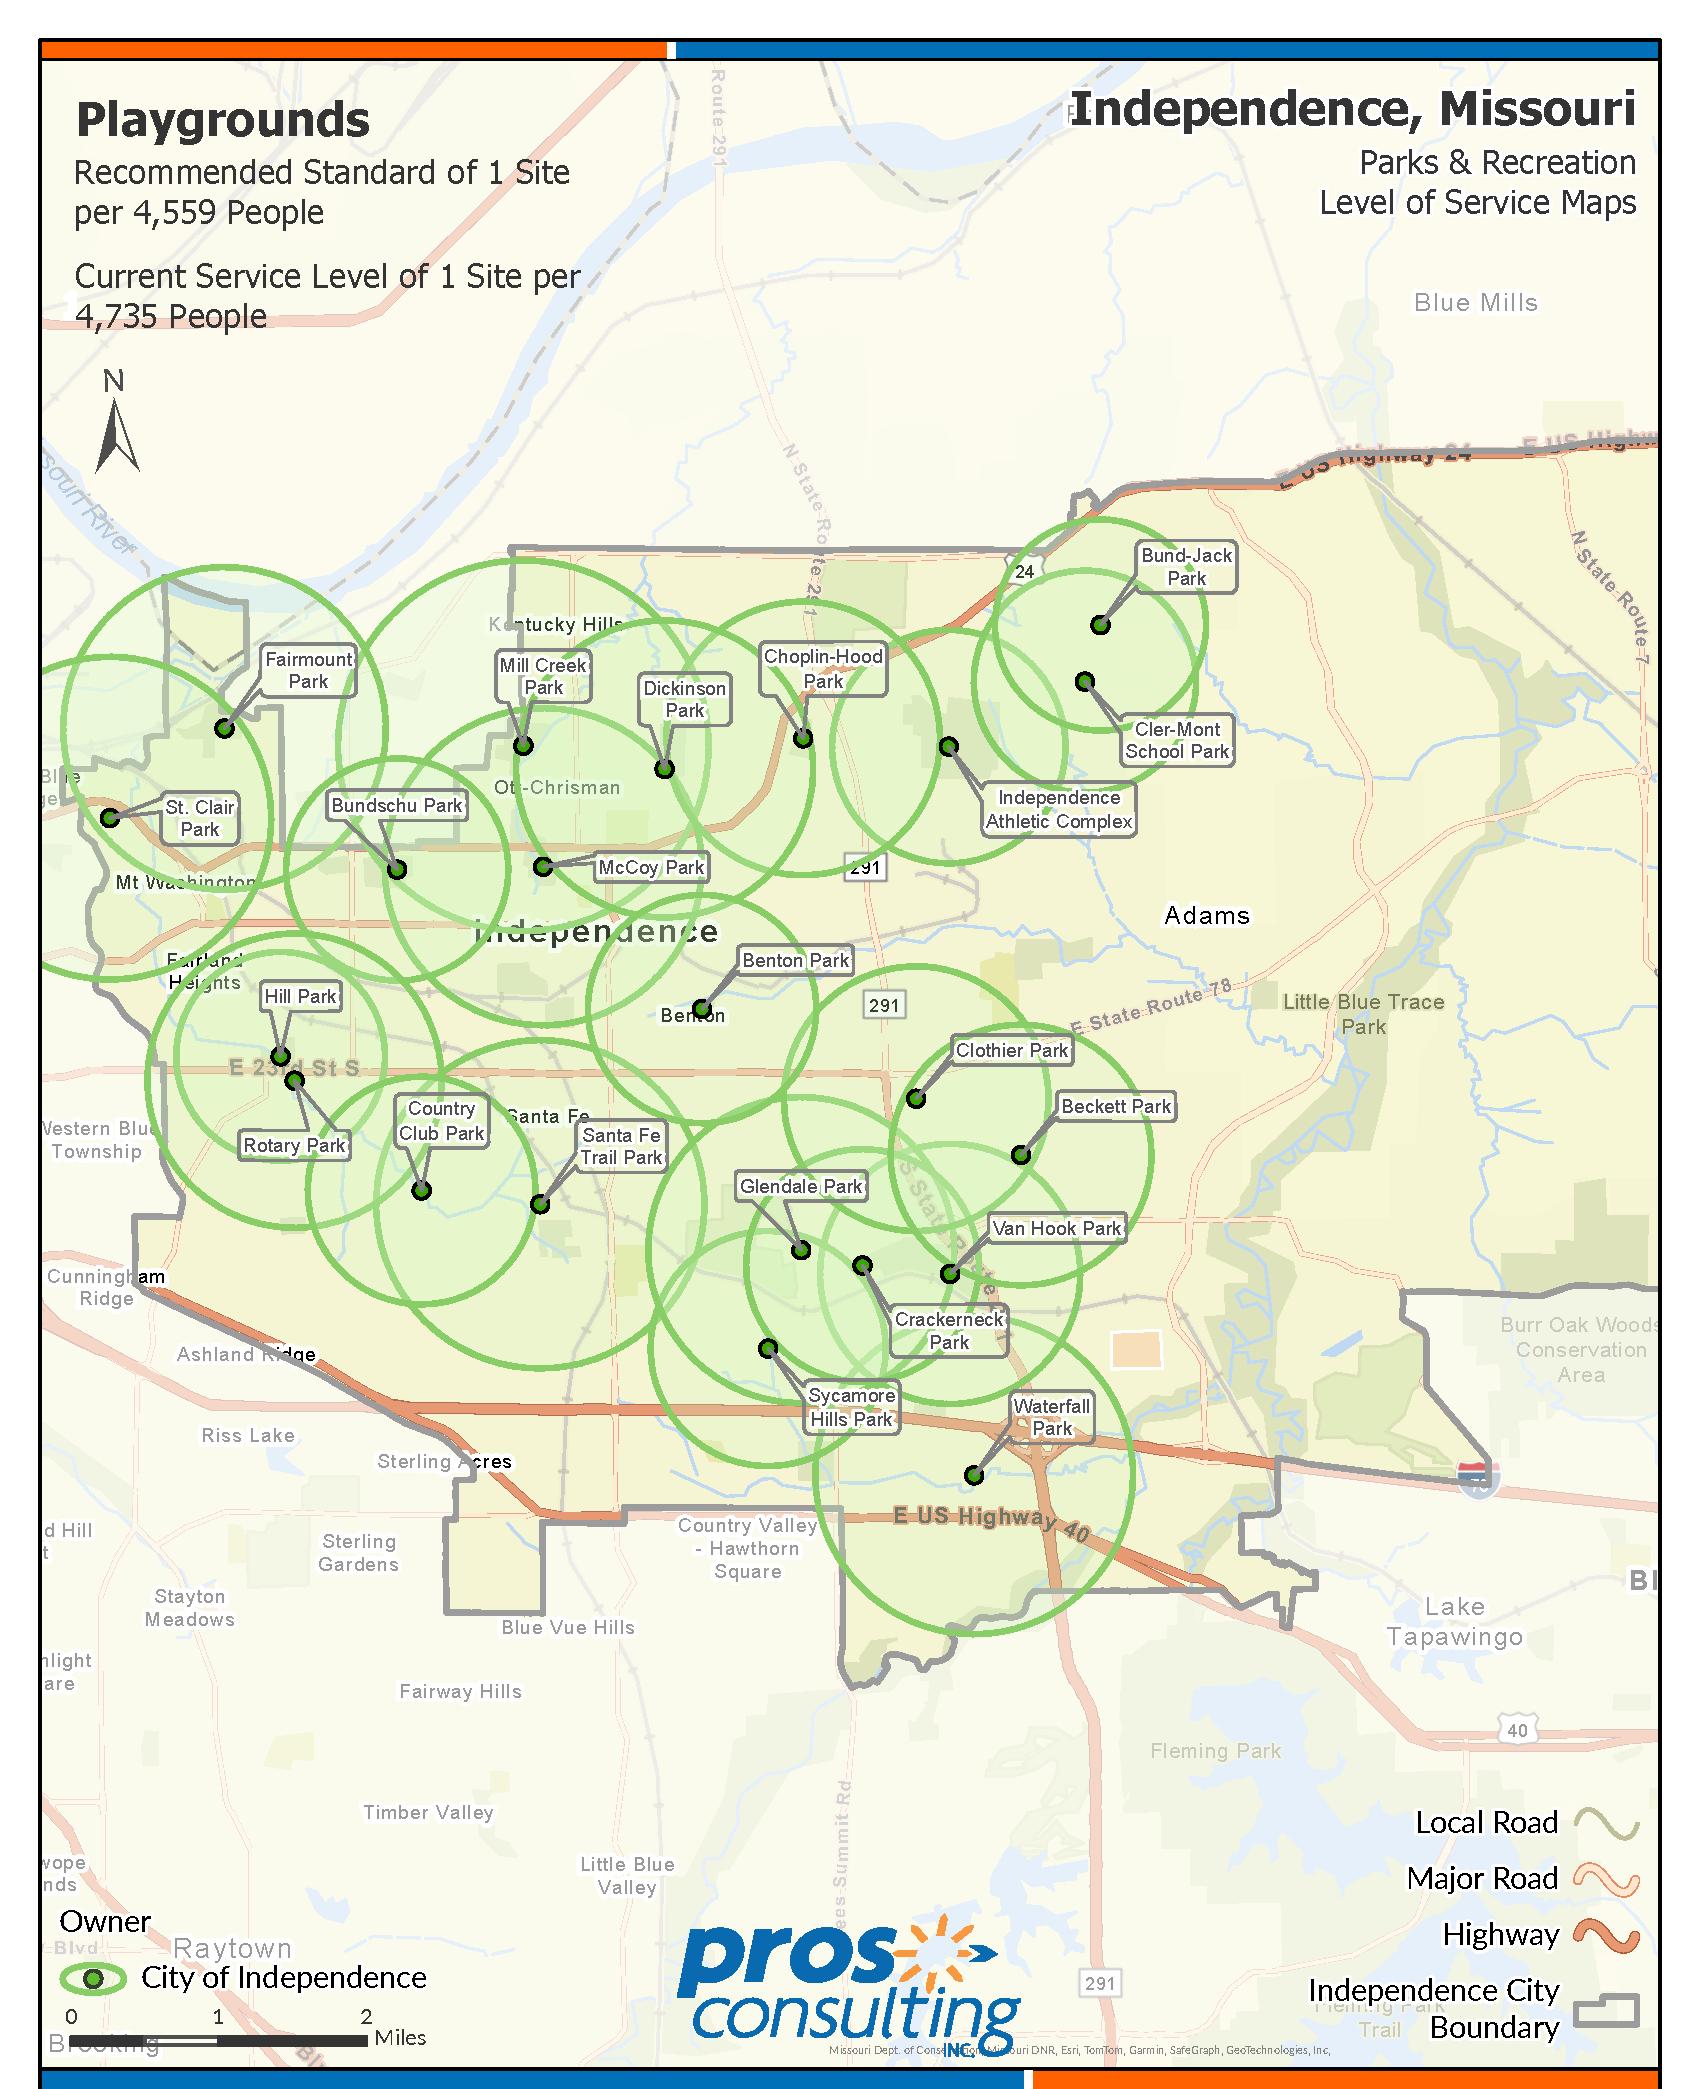
Independence’s current service level of 1 skateboard park per 61,551 people has been established as the recommended standard for the City’s population projections and level of service needs.
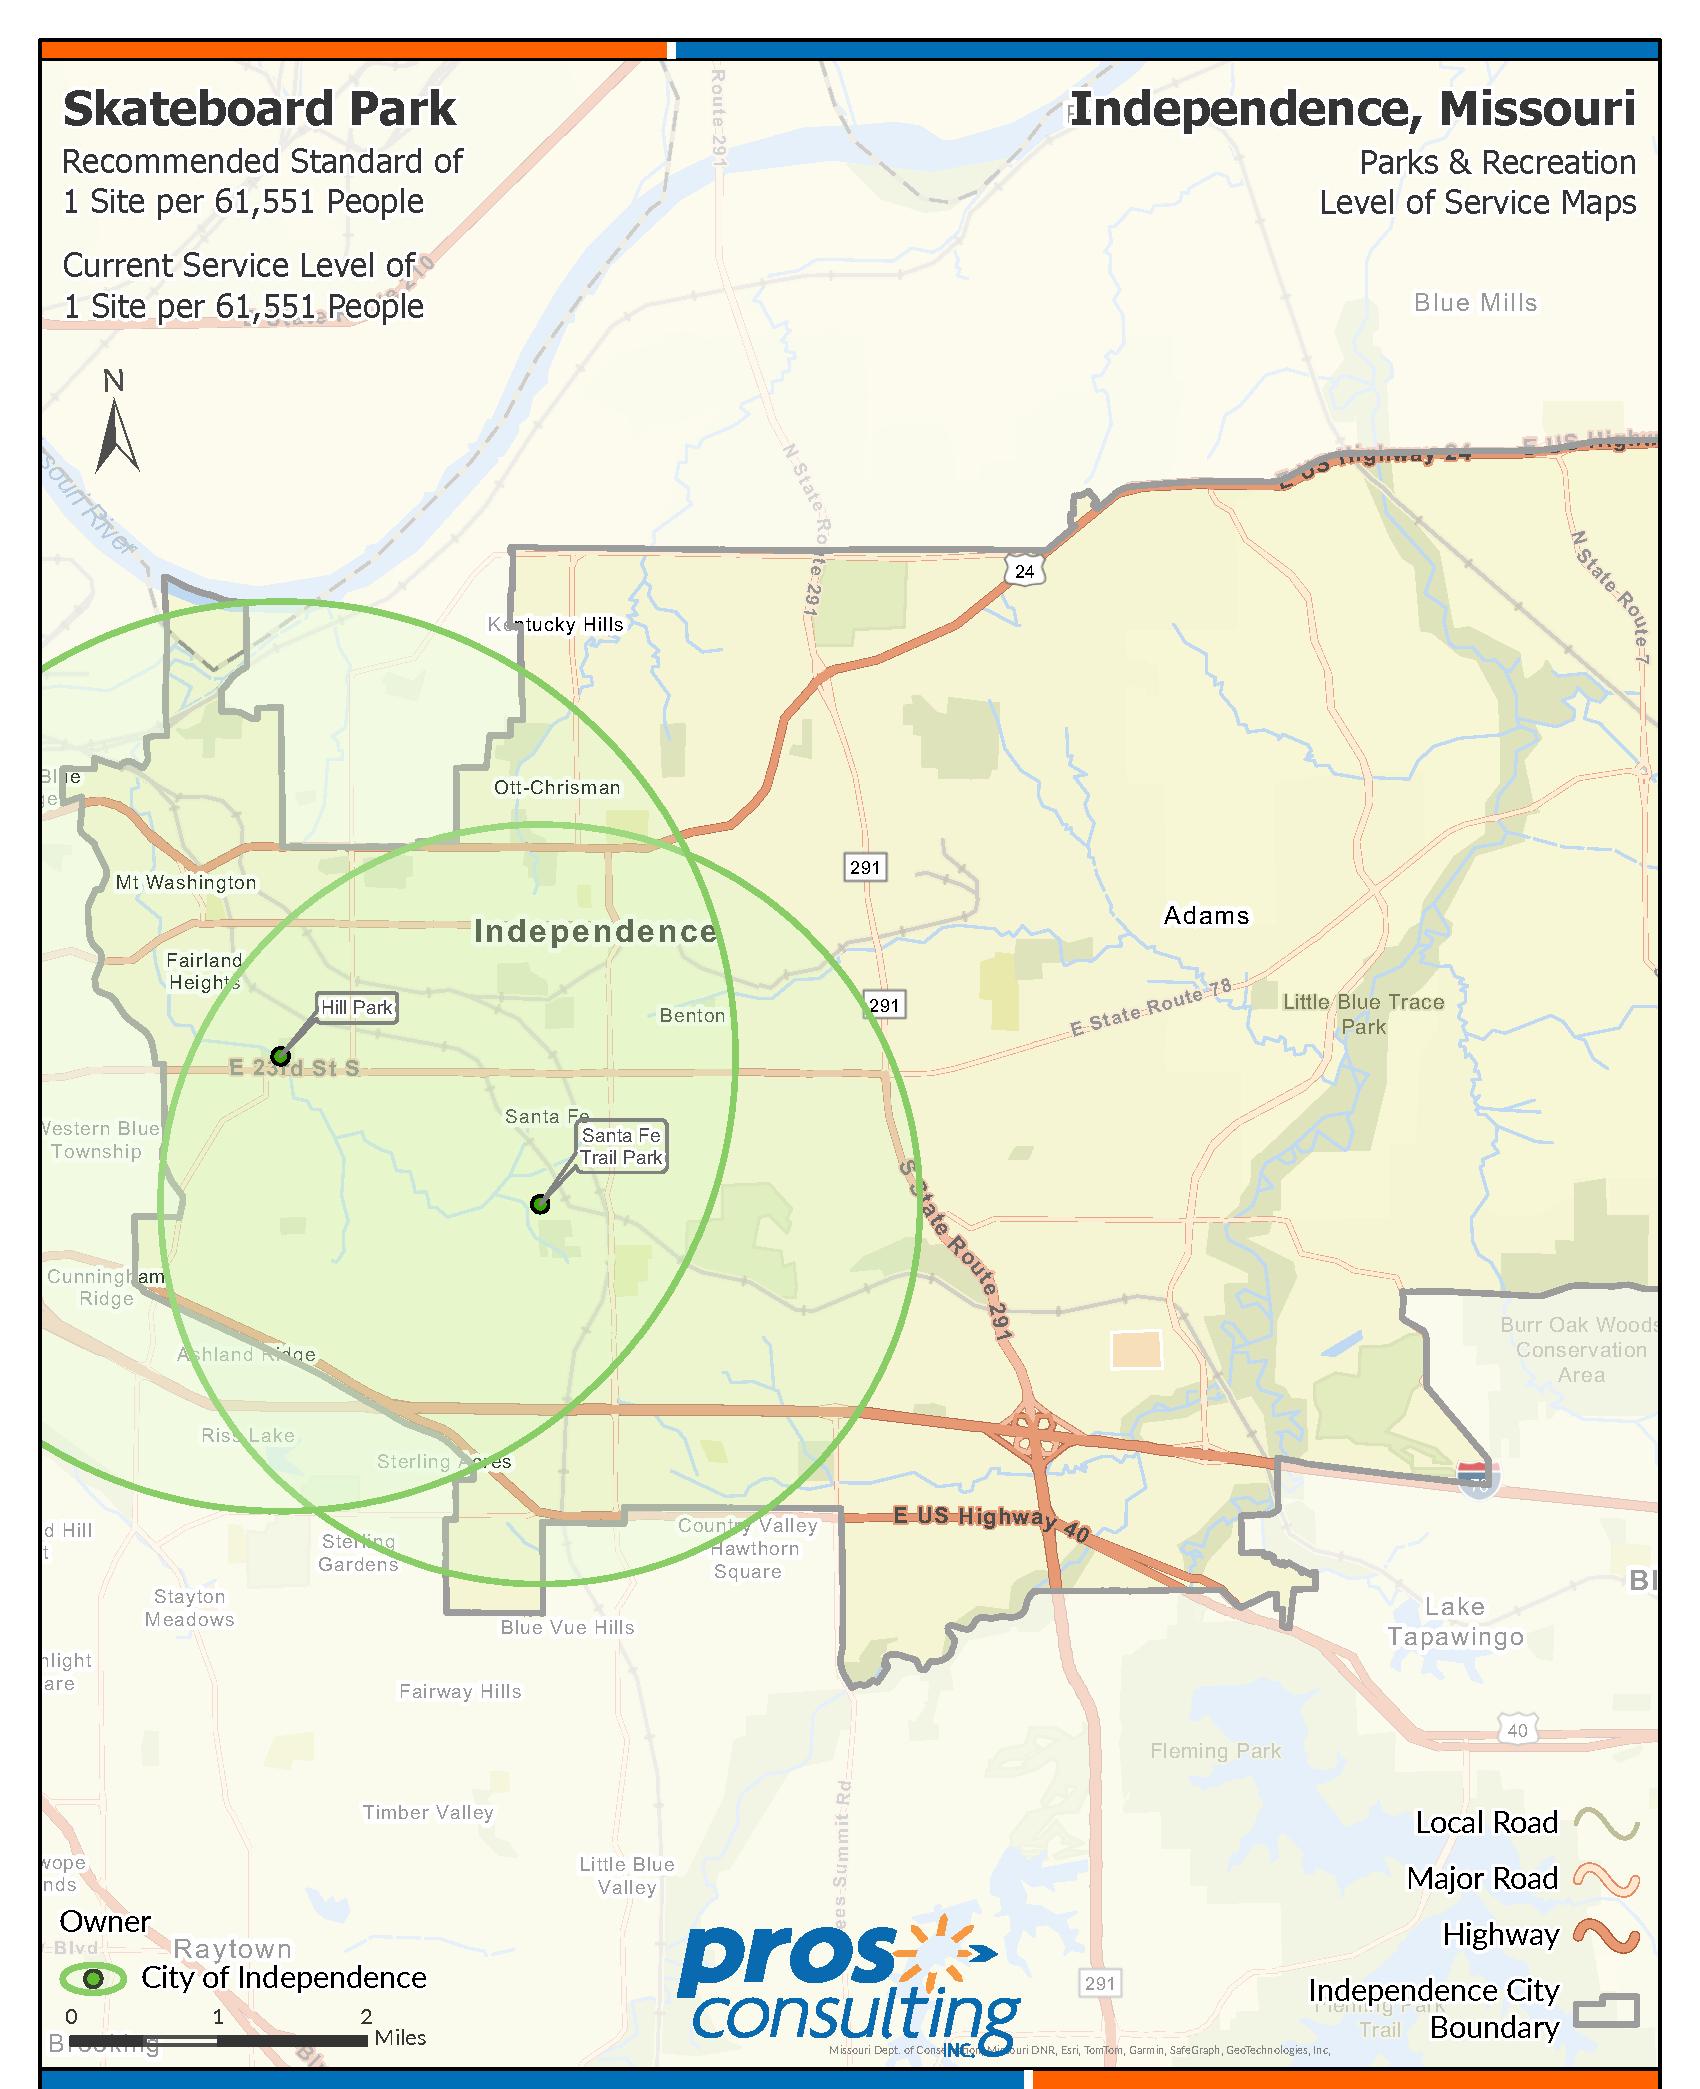
Independence’s current service level of 1 dog park per 61,551 people has been established as the recommended standard for the City’s population projections and level of service needs.
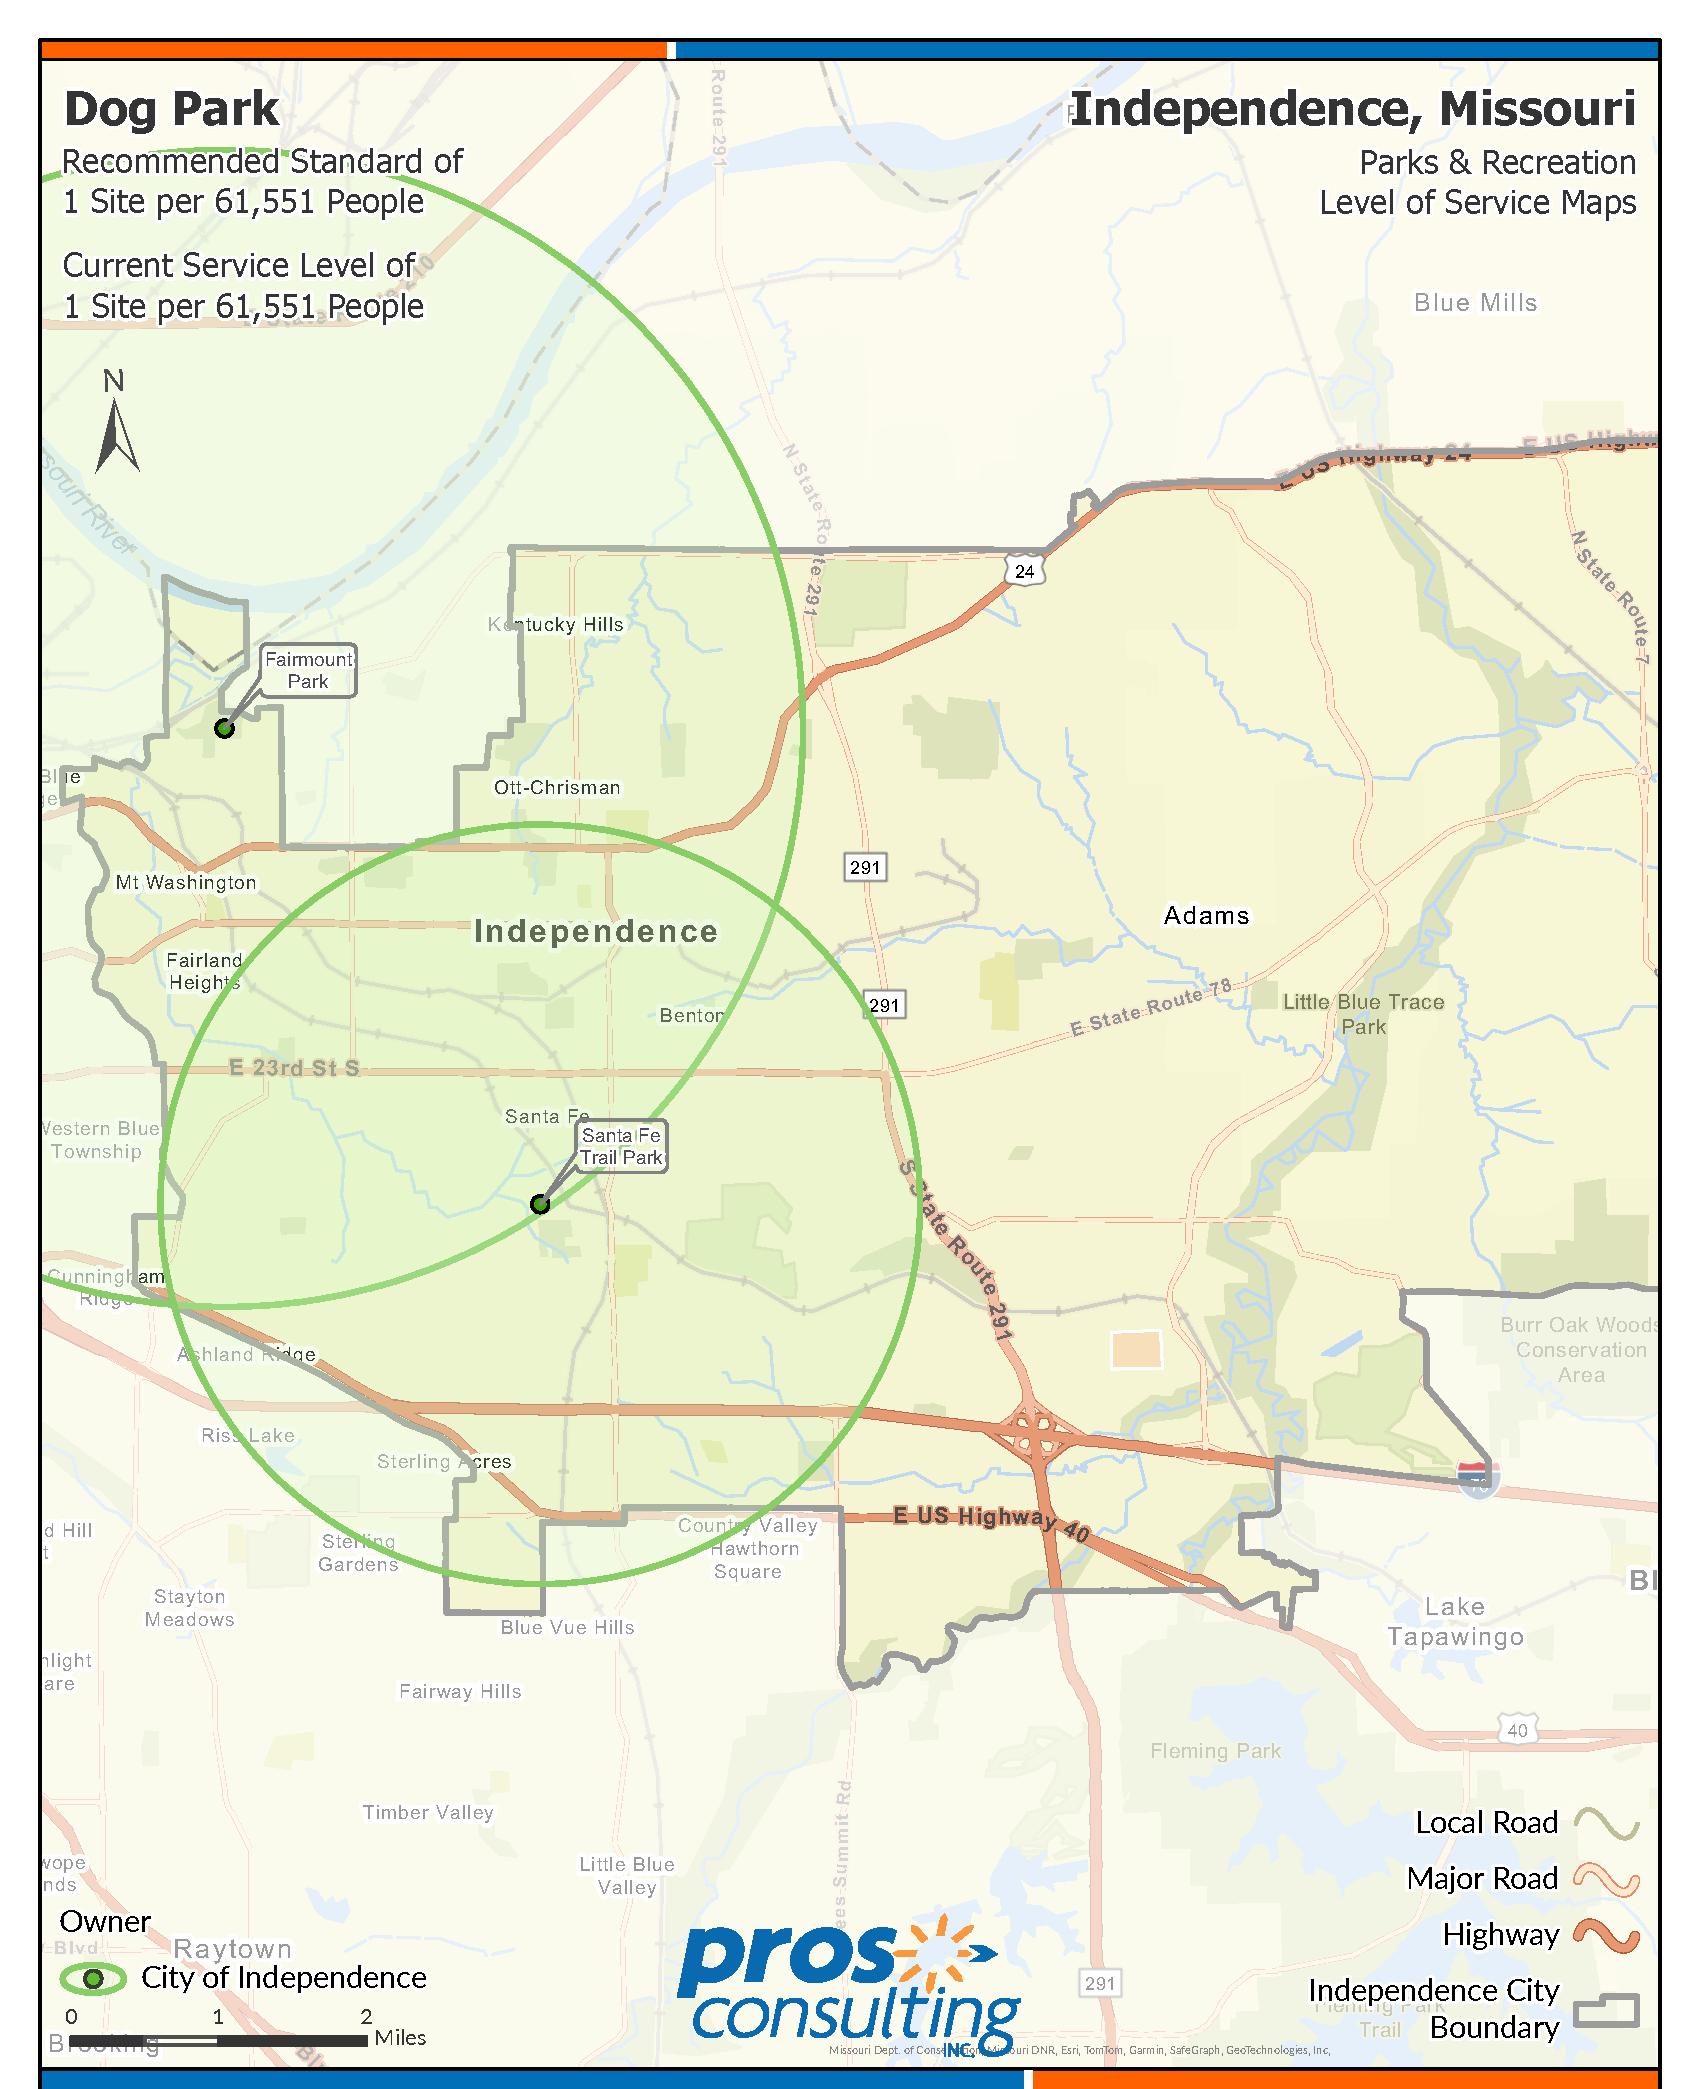
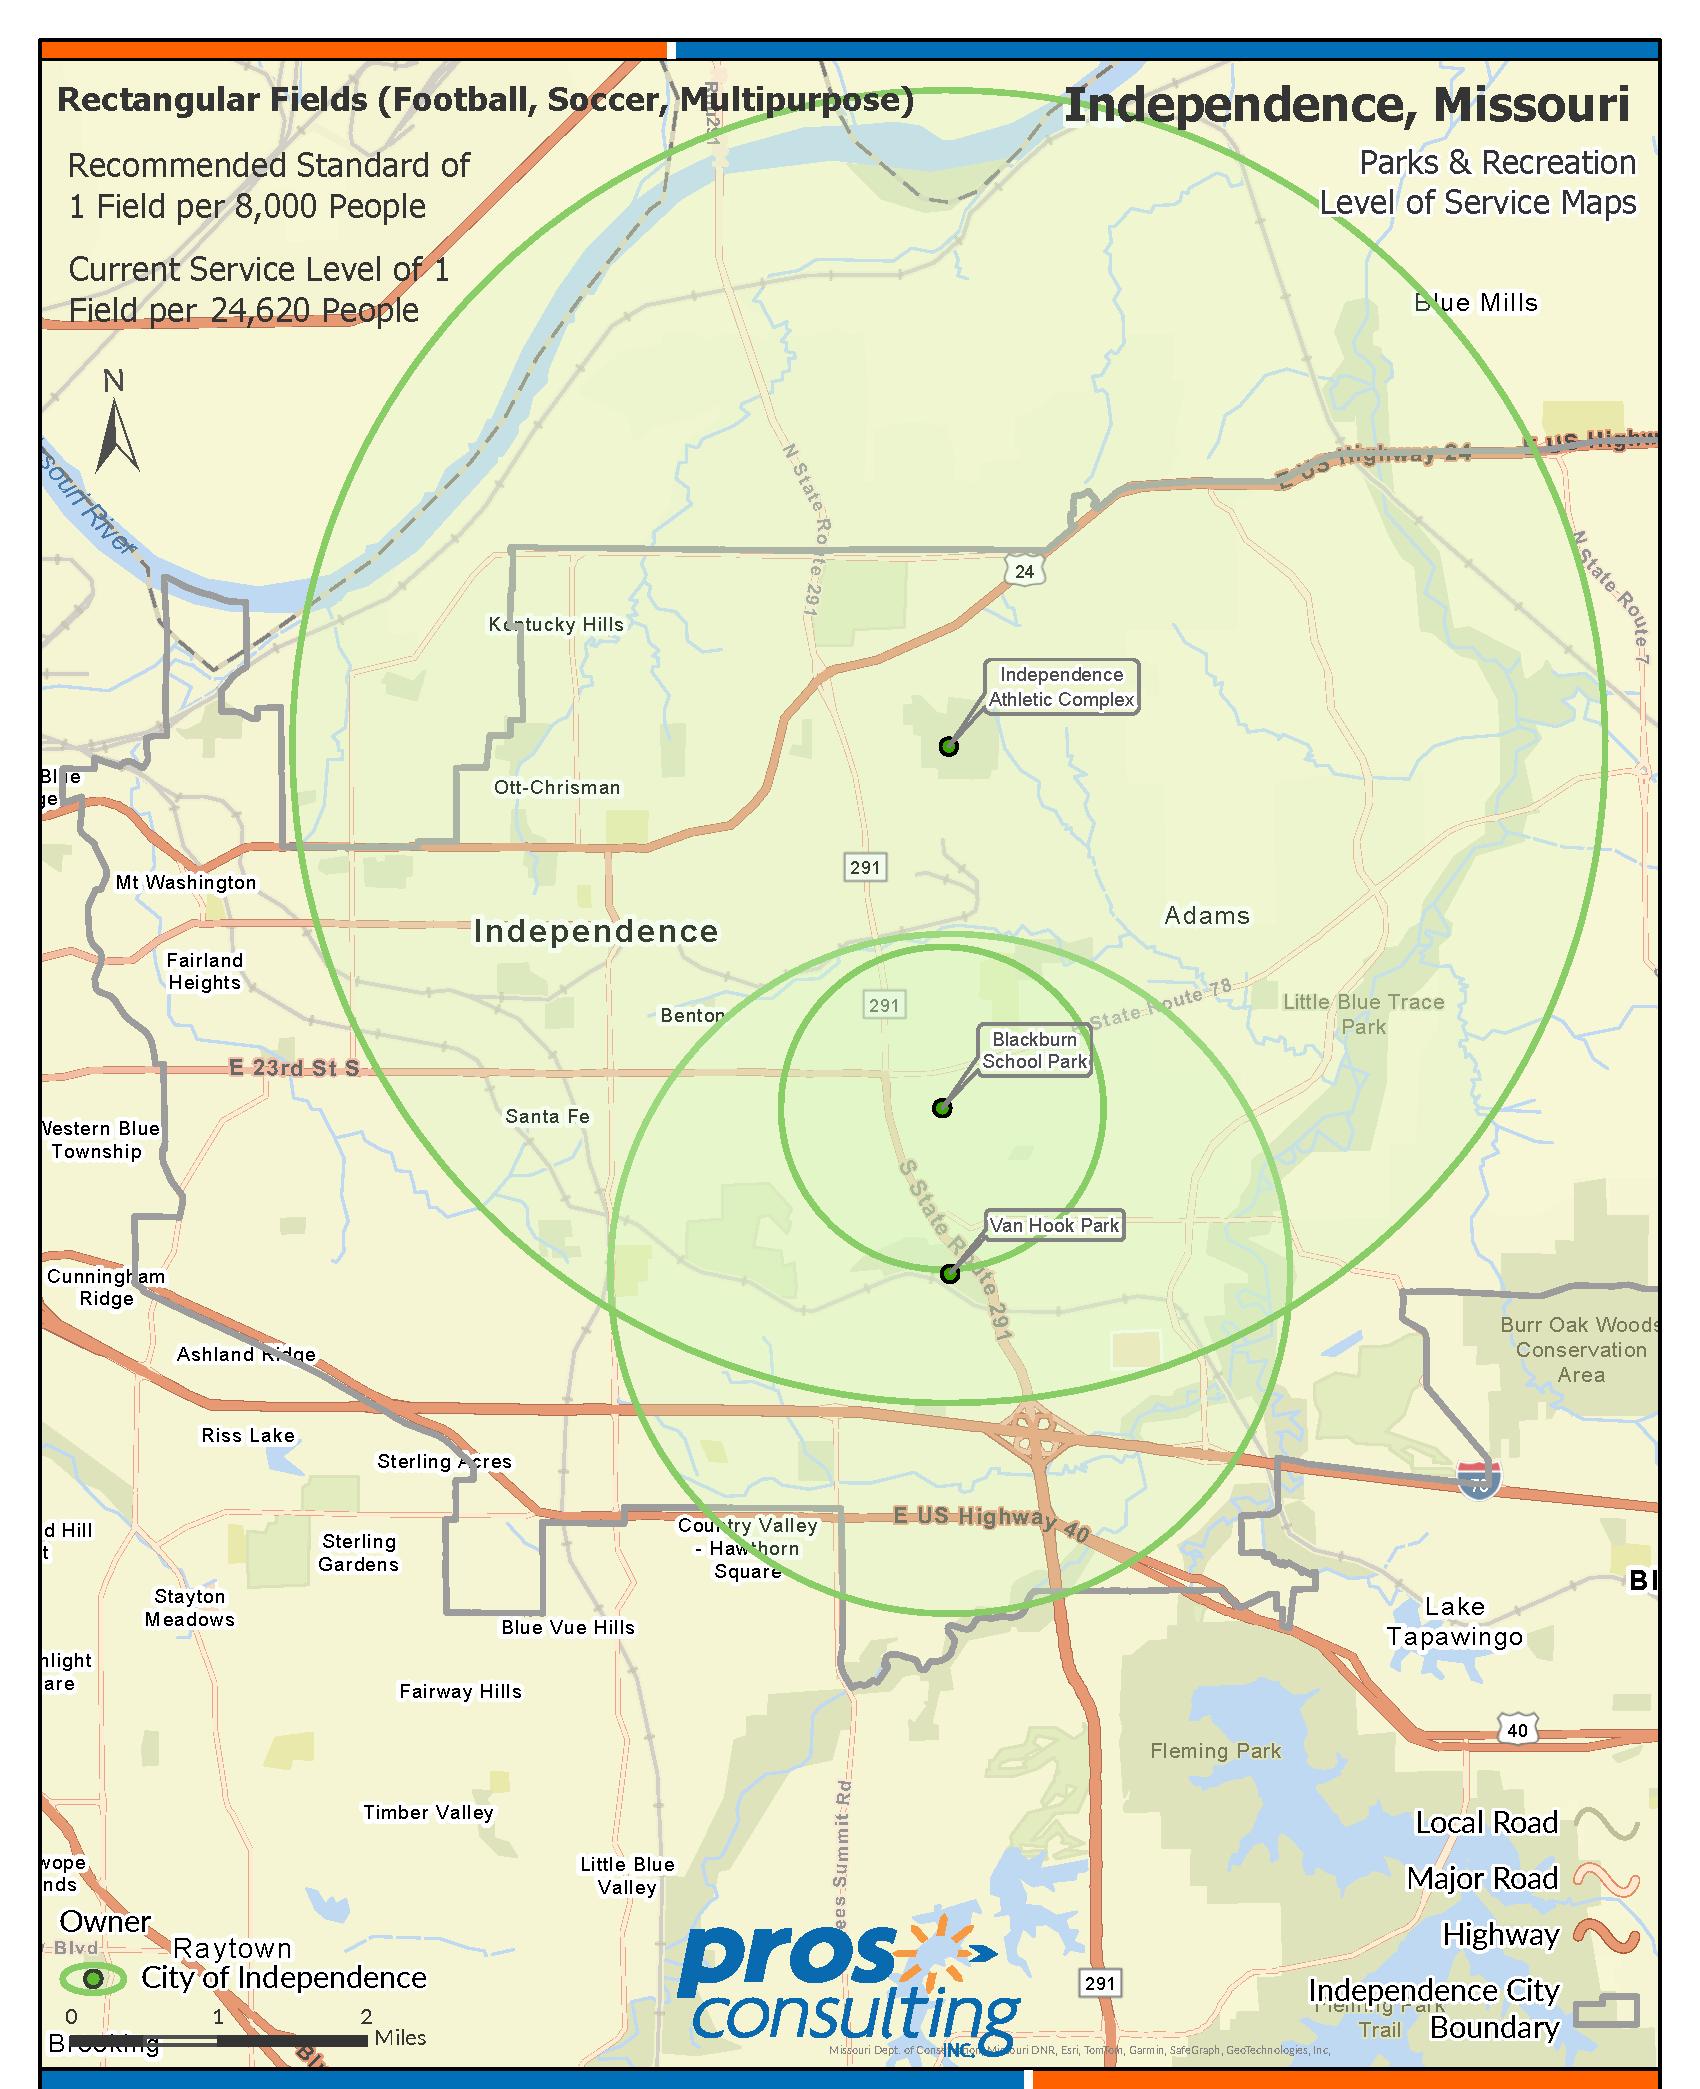
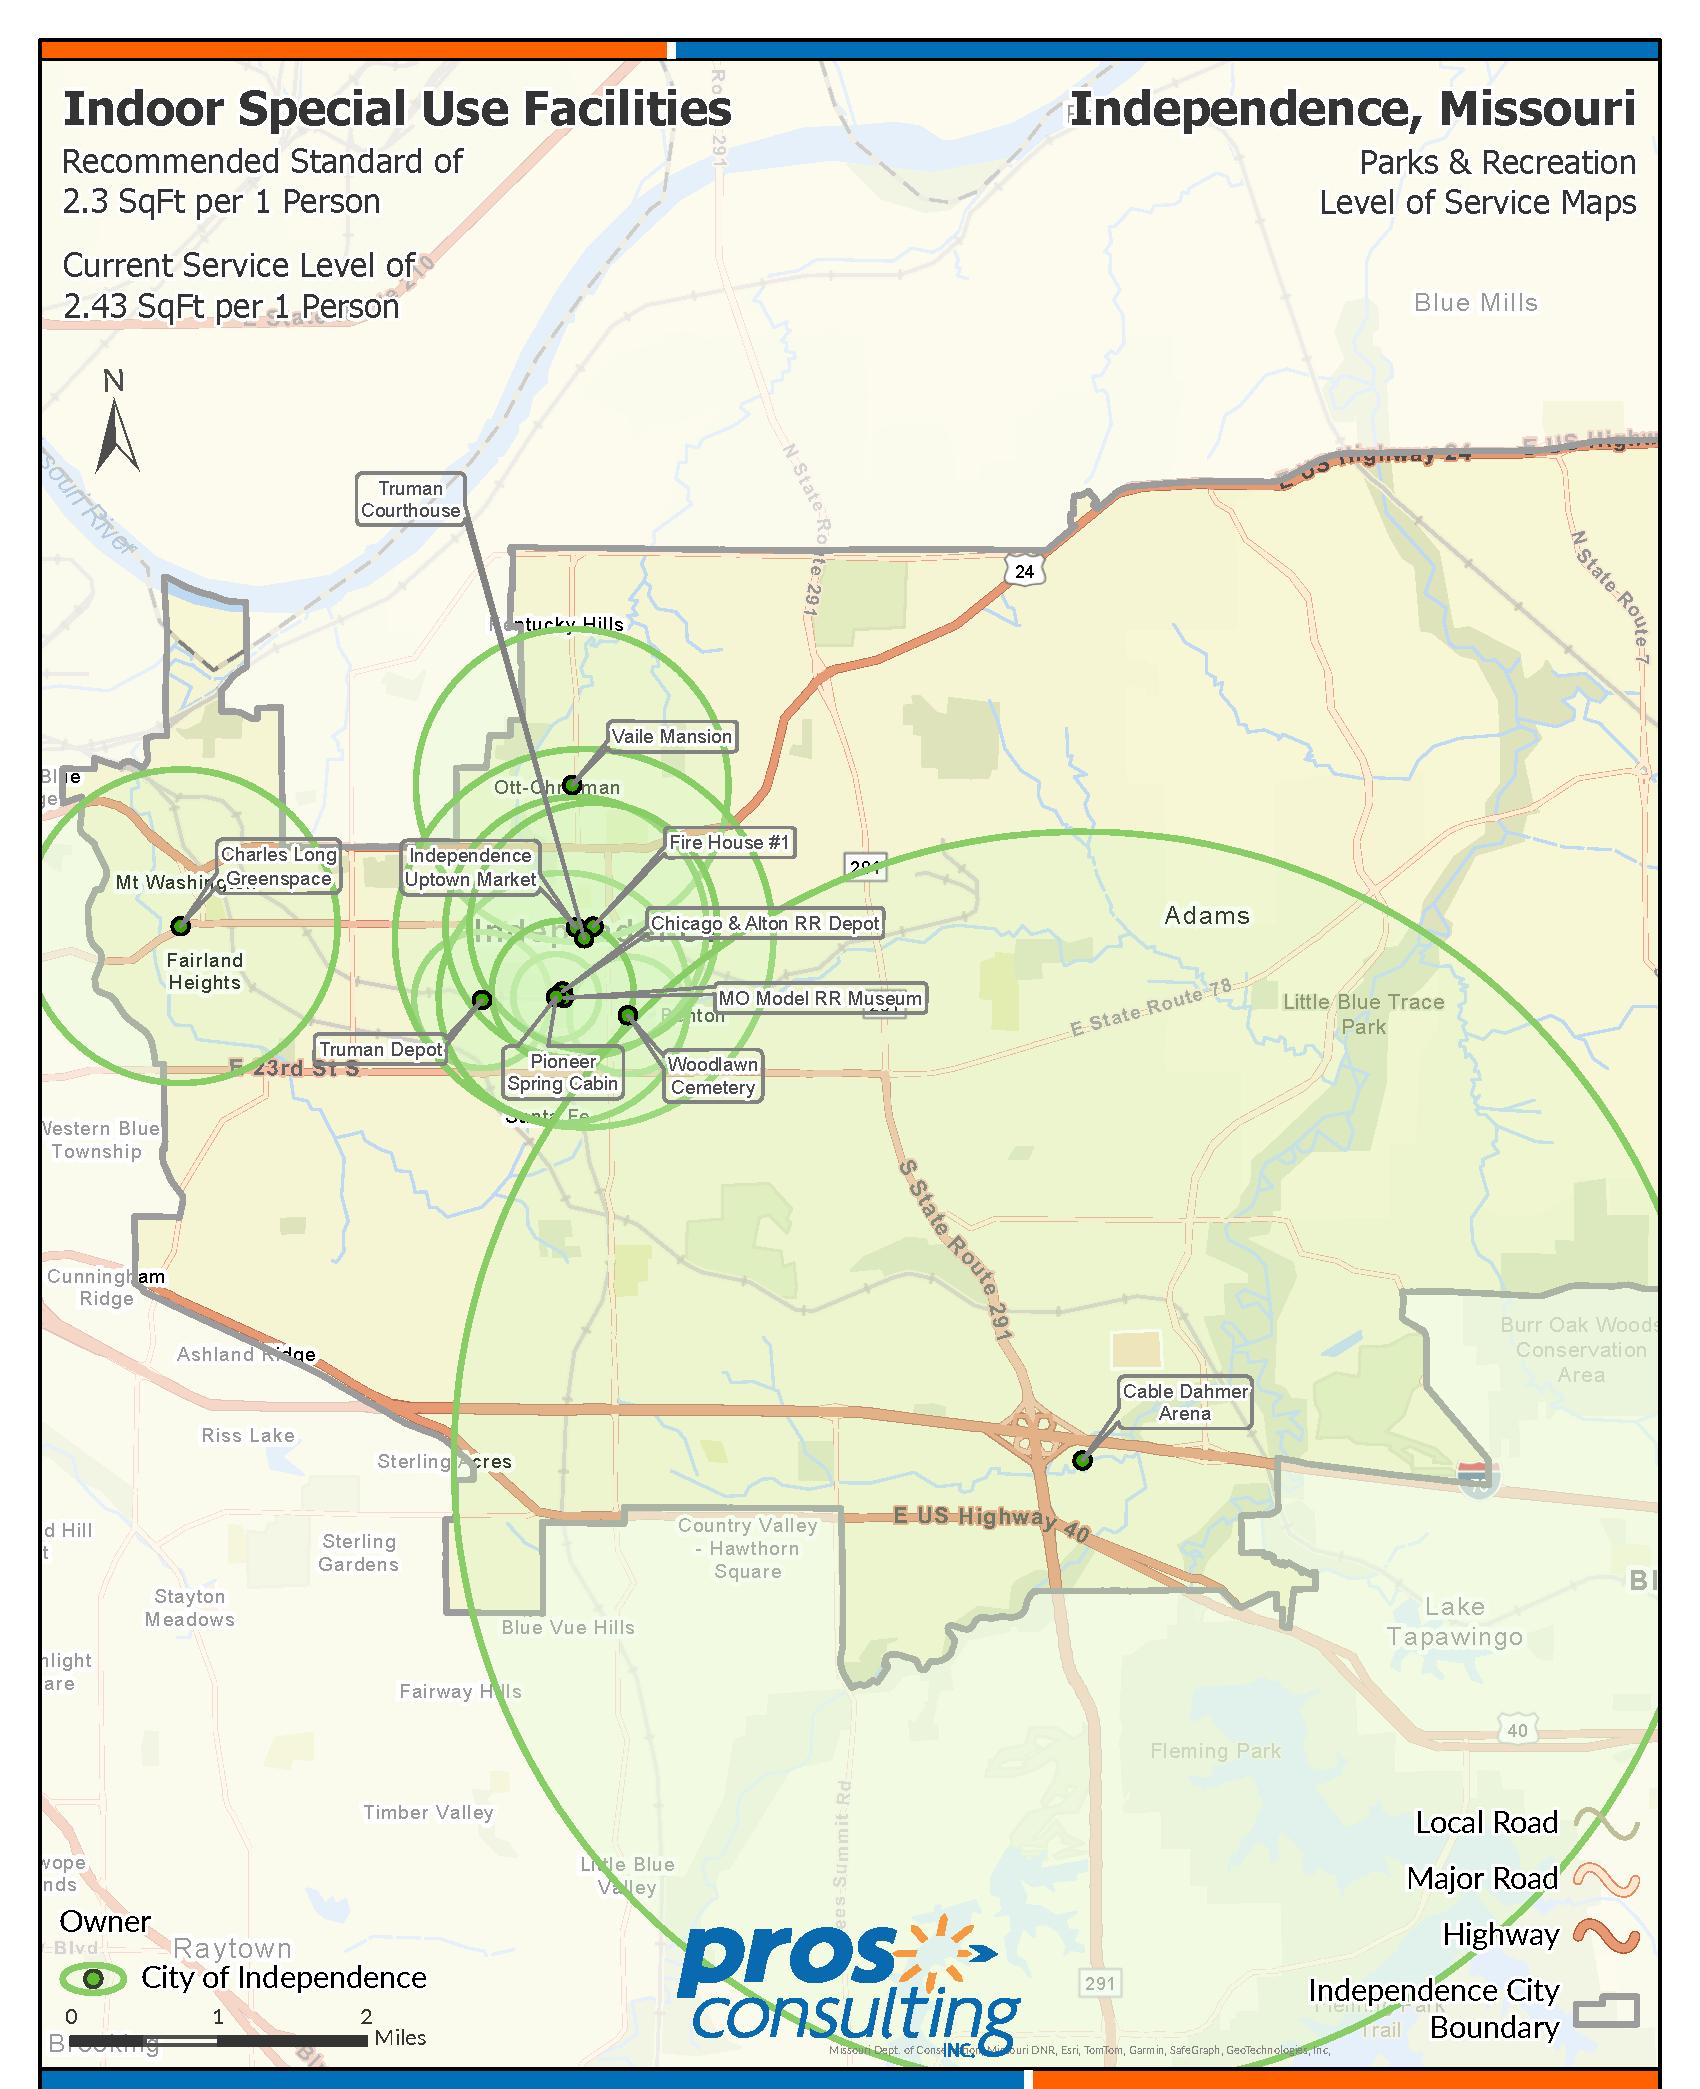
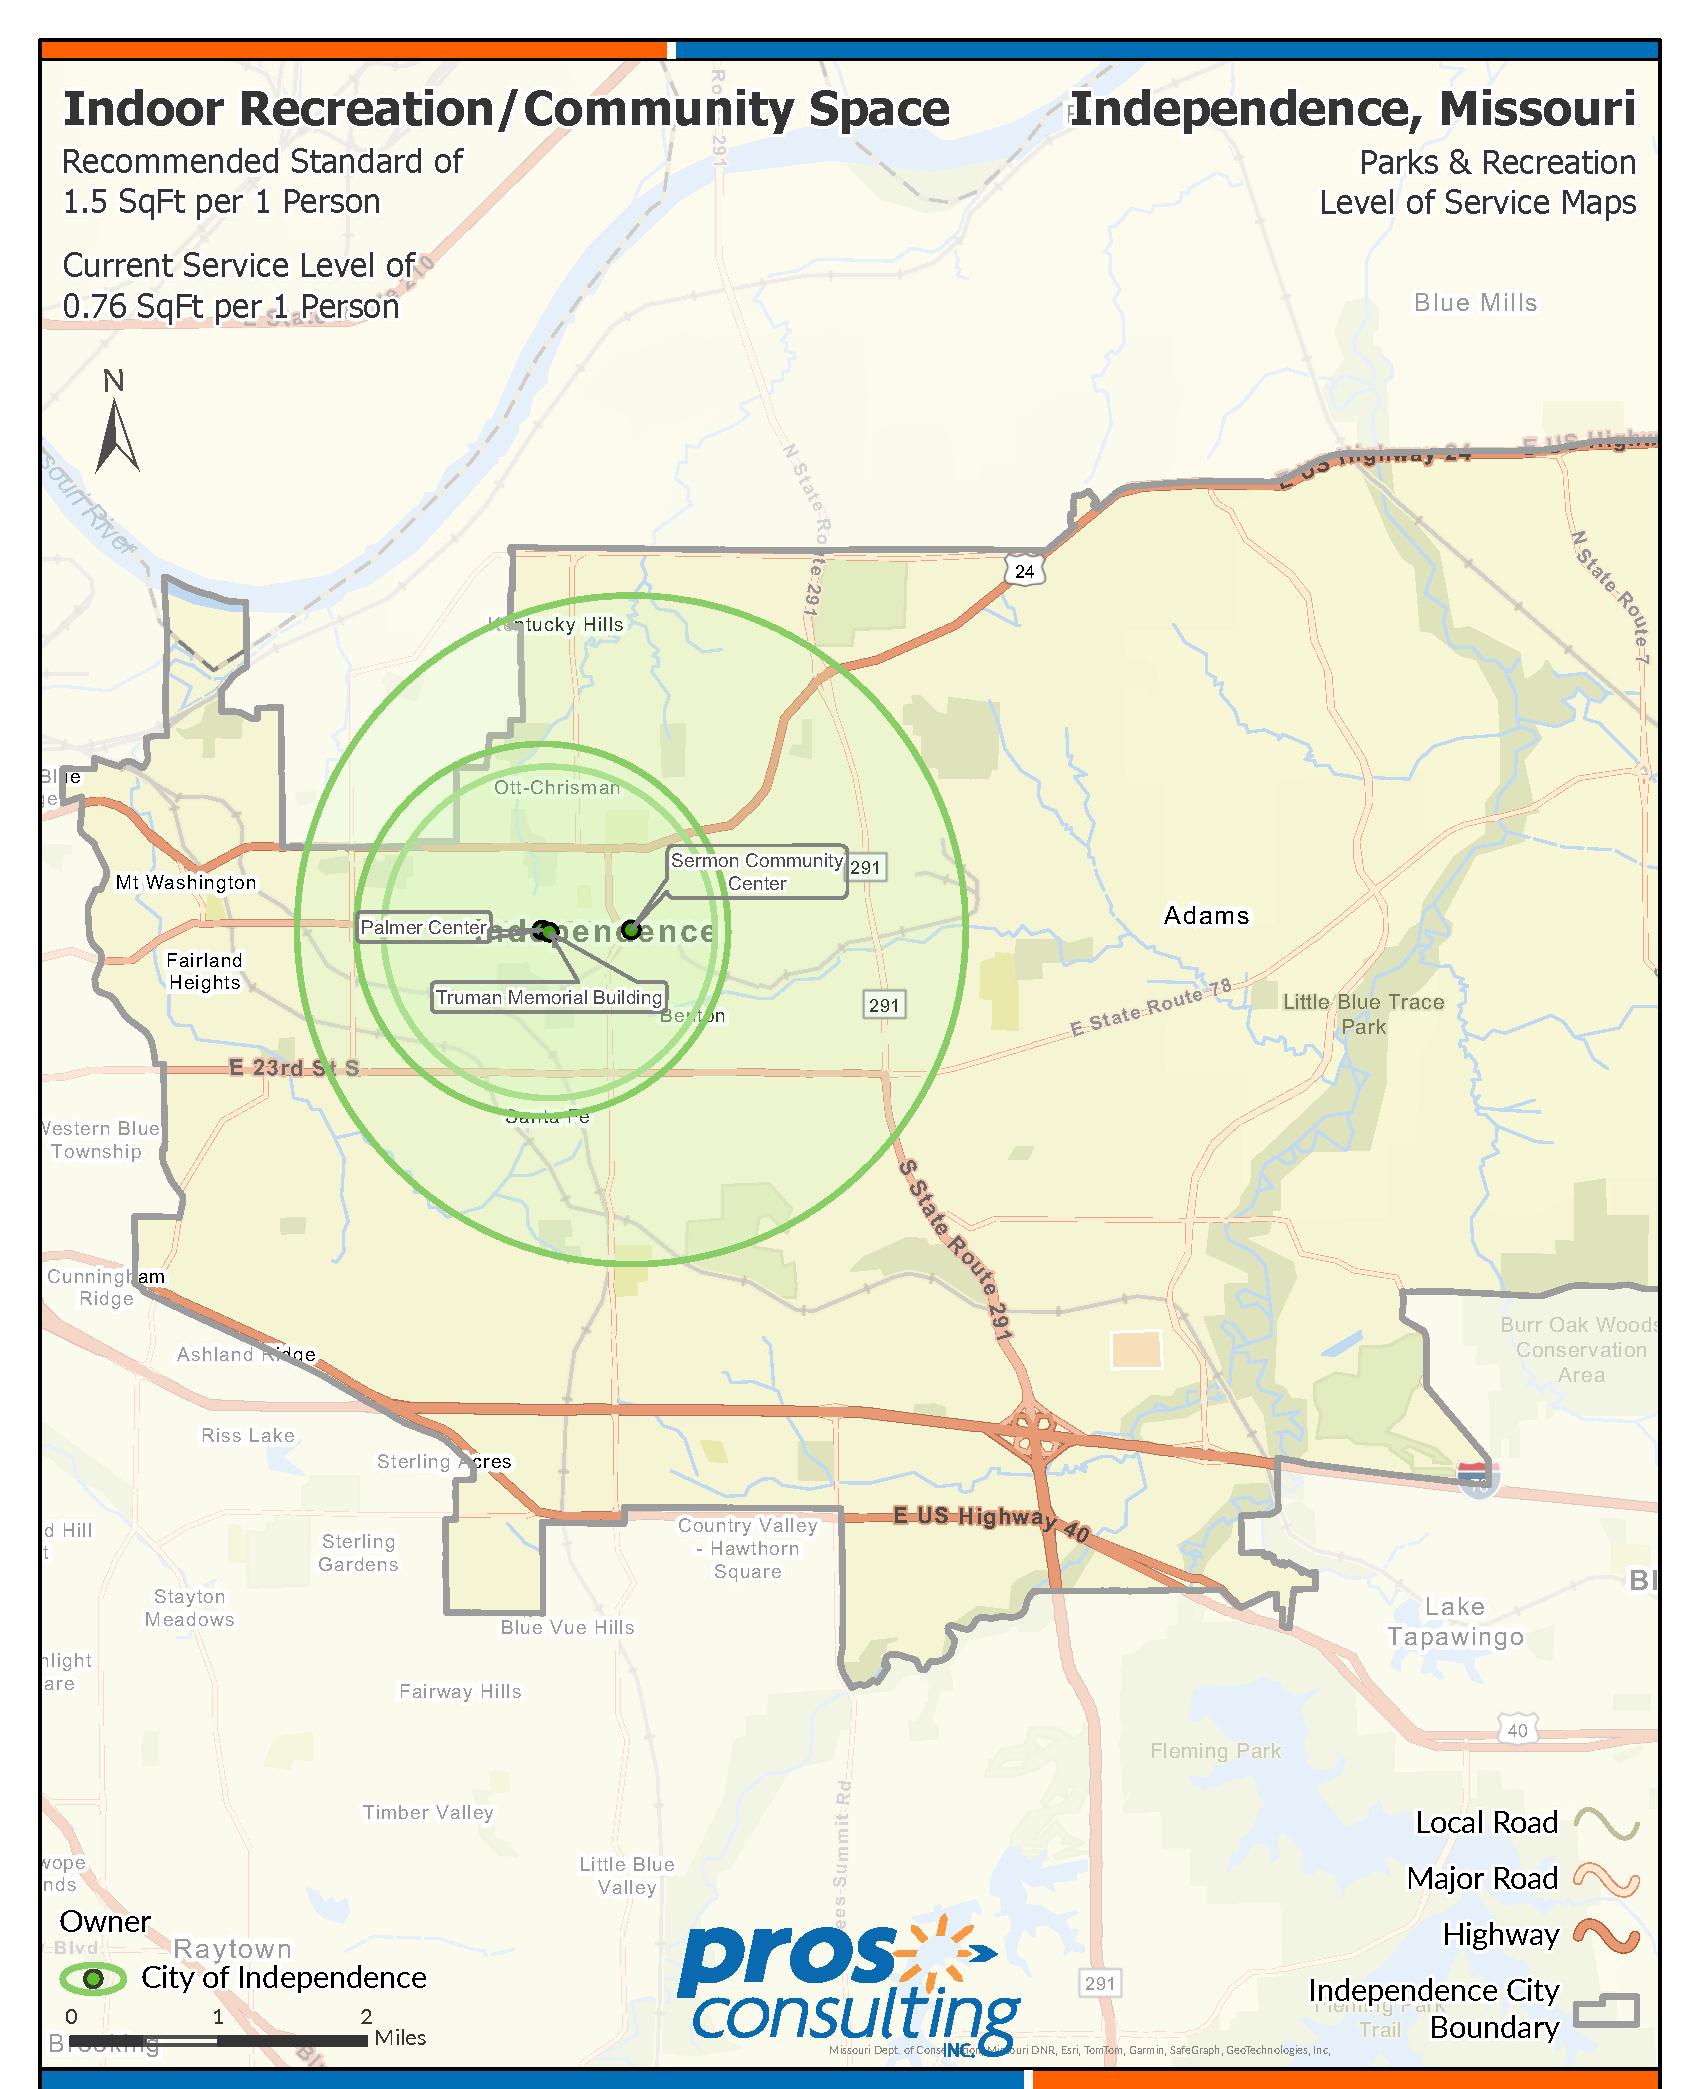
The following charts show the potential sports and leisure market data for the city of Independence service area, as provided by ESRI. A Market Potential Index (MPI) measures the probable demand for a product or service within the City. The MPI shows the likelihood that an adult resident of the target area will participate in certain activities when compared to the U.S. national average. The national average is 100; therefore, numbers below 100 would represent lower than average participation rates, and numbers above 100 would represent higher than average participation rates. The service area is compared to the national average in four categories: general sports, fitness, outdoor activity, and commercial recreation.
It should be noted that MPI metrics are only one data point used to help determine community trends; thus, programmatic decisions should not be based solely on MPI metrics.
As seen in the charts that follow, sport and leisure trends are most prevalent for residents within the area of Independence. The activities are listed in ascending order, from lowest to highest MPI score. High index numbers (100+) are significant because they demonstrate a greater potential that residents within the service area will actively participate in offerings provided by the city of Independence Parks and Recreation.
The MPI reveals a moderately engaged community with a broad but slightly below-average participation rate across most recreation categories when compared to national norms. While no single category demonstrates overwhelmingly high demand, several activities— such as freshwater fishing, canoeing/kayaking, swimming, walking for exercise, and golf— approach or exceed the national average, indicating strong pockets of interest. Conversely, lower MPI scores in areas like soccer, rock climbing, and certain cultural or niche activities suggest limited engagement or access. Overall, the data highlights a community with diverse recreational preferences, leaning toward accessible, low-impact, and family-friendly activities. The MPI provides a useful target for aligning recreation planning and programming with the likelihood of participation, helping the City identify both strengths to build on and gaps to address in its service offerings.
The General Sports MPI chart, comparing Independence to the state and national average, shows that local interest in most sports is slightly below the national average. Independence scores highest in Volleyball (MPI 101), nearly matching the national average, followed closely by Football (100), Softball (97), and Baseball (95). Lower MPI scores appear in Tennis (79), Soccer (84), and Pickleball (88), indicating less community engagement in these activities. Overall, the data suggests Independence has a market that aligns with national averages for a range of sports.
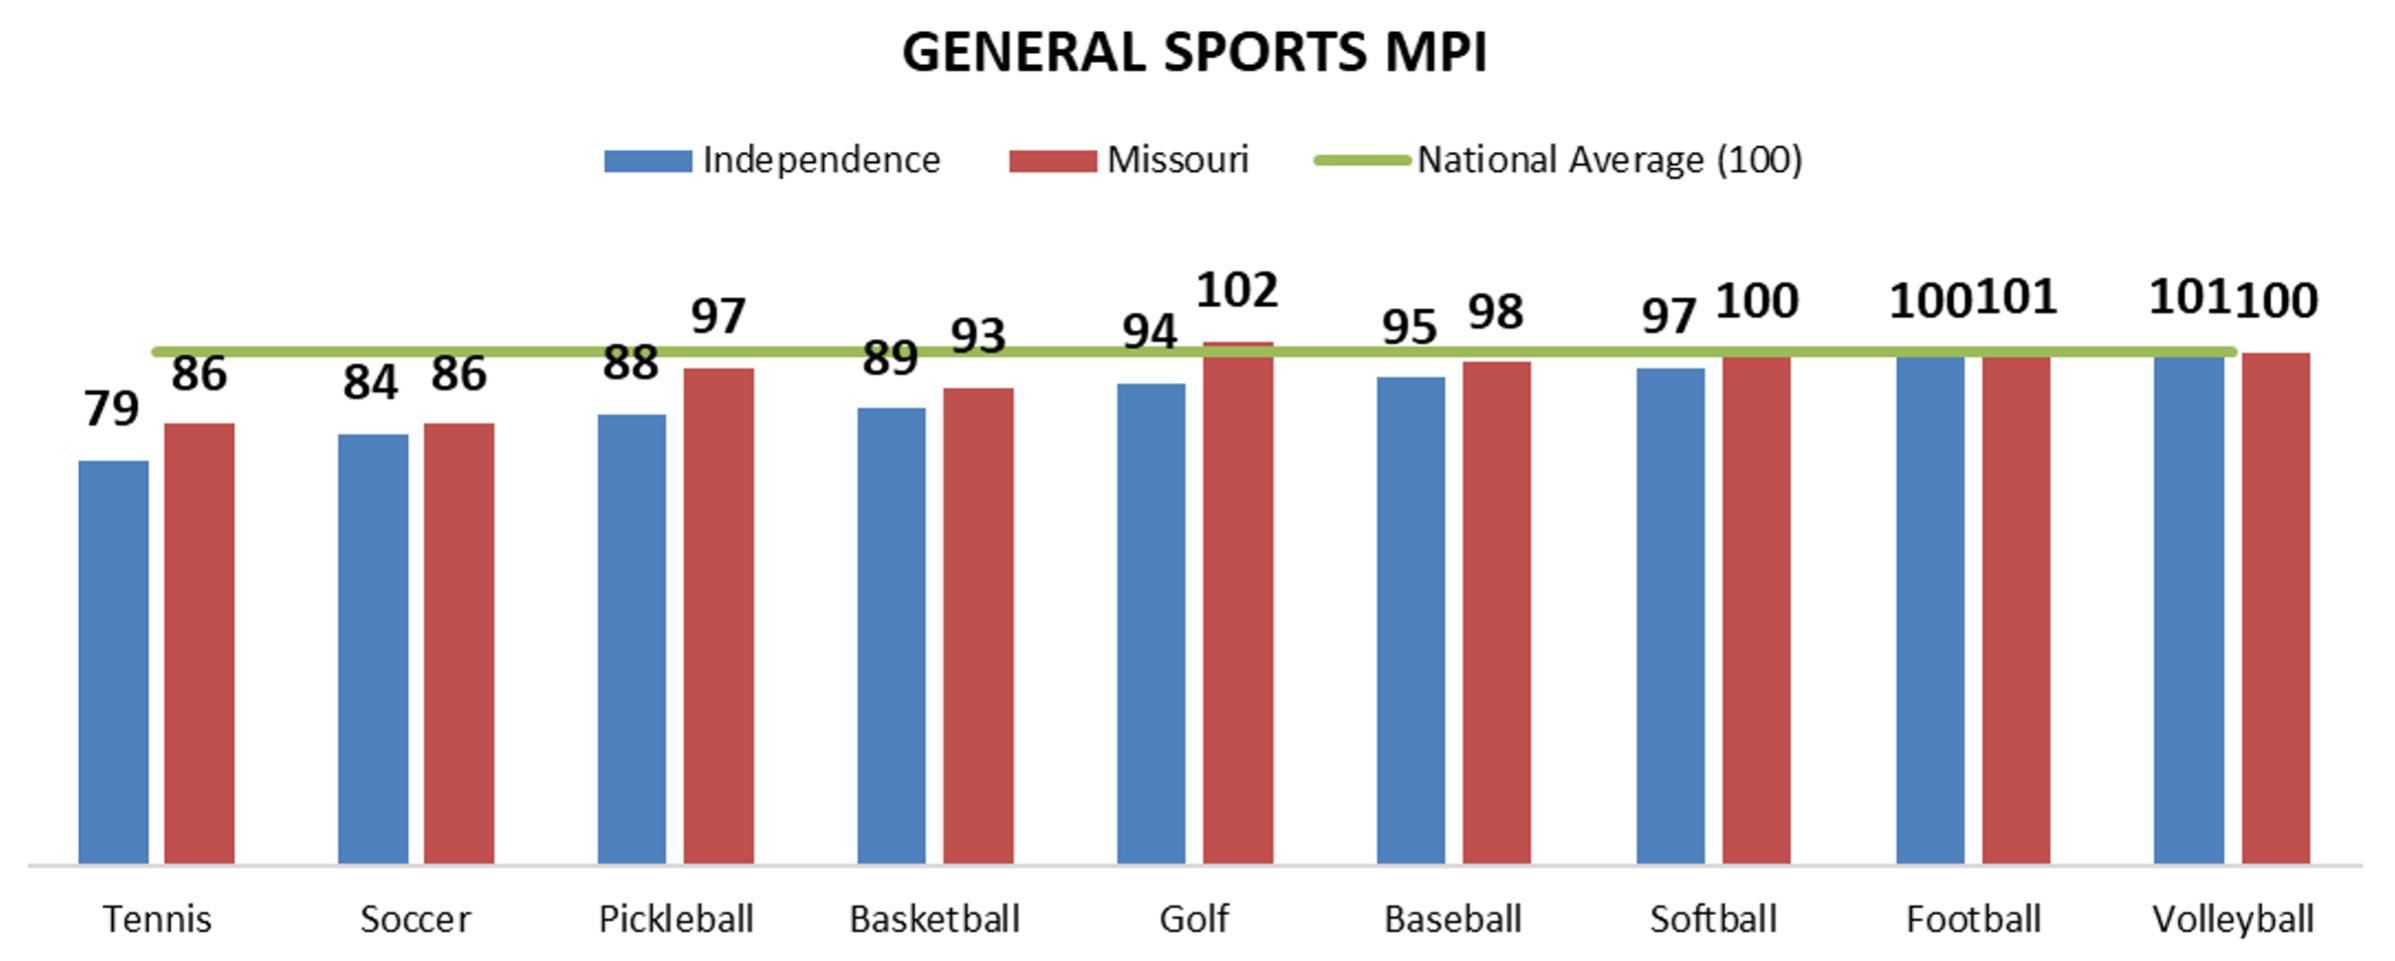
The Fitness MPI chart indicates that Independence residents engage in fitness activities at slightly below-average levels compared to the national average. The strongest participation is in Swimming (MPI 102). Other fitness pursuits such as Marathon/Triathlon (MPI 99) and Walking for Exercise (MPI 97) come close to national averages, while Pilates (MPI 80), Jogging/Running (MPI 83), Kickboxing (MPI 85), and Zumba (MPI 85) show scores well below national averages. Overall, the data reflects a community with a modest market for a variety of fitness activities.
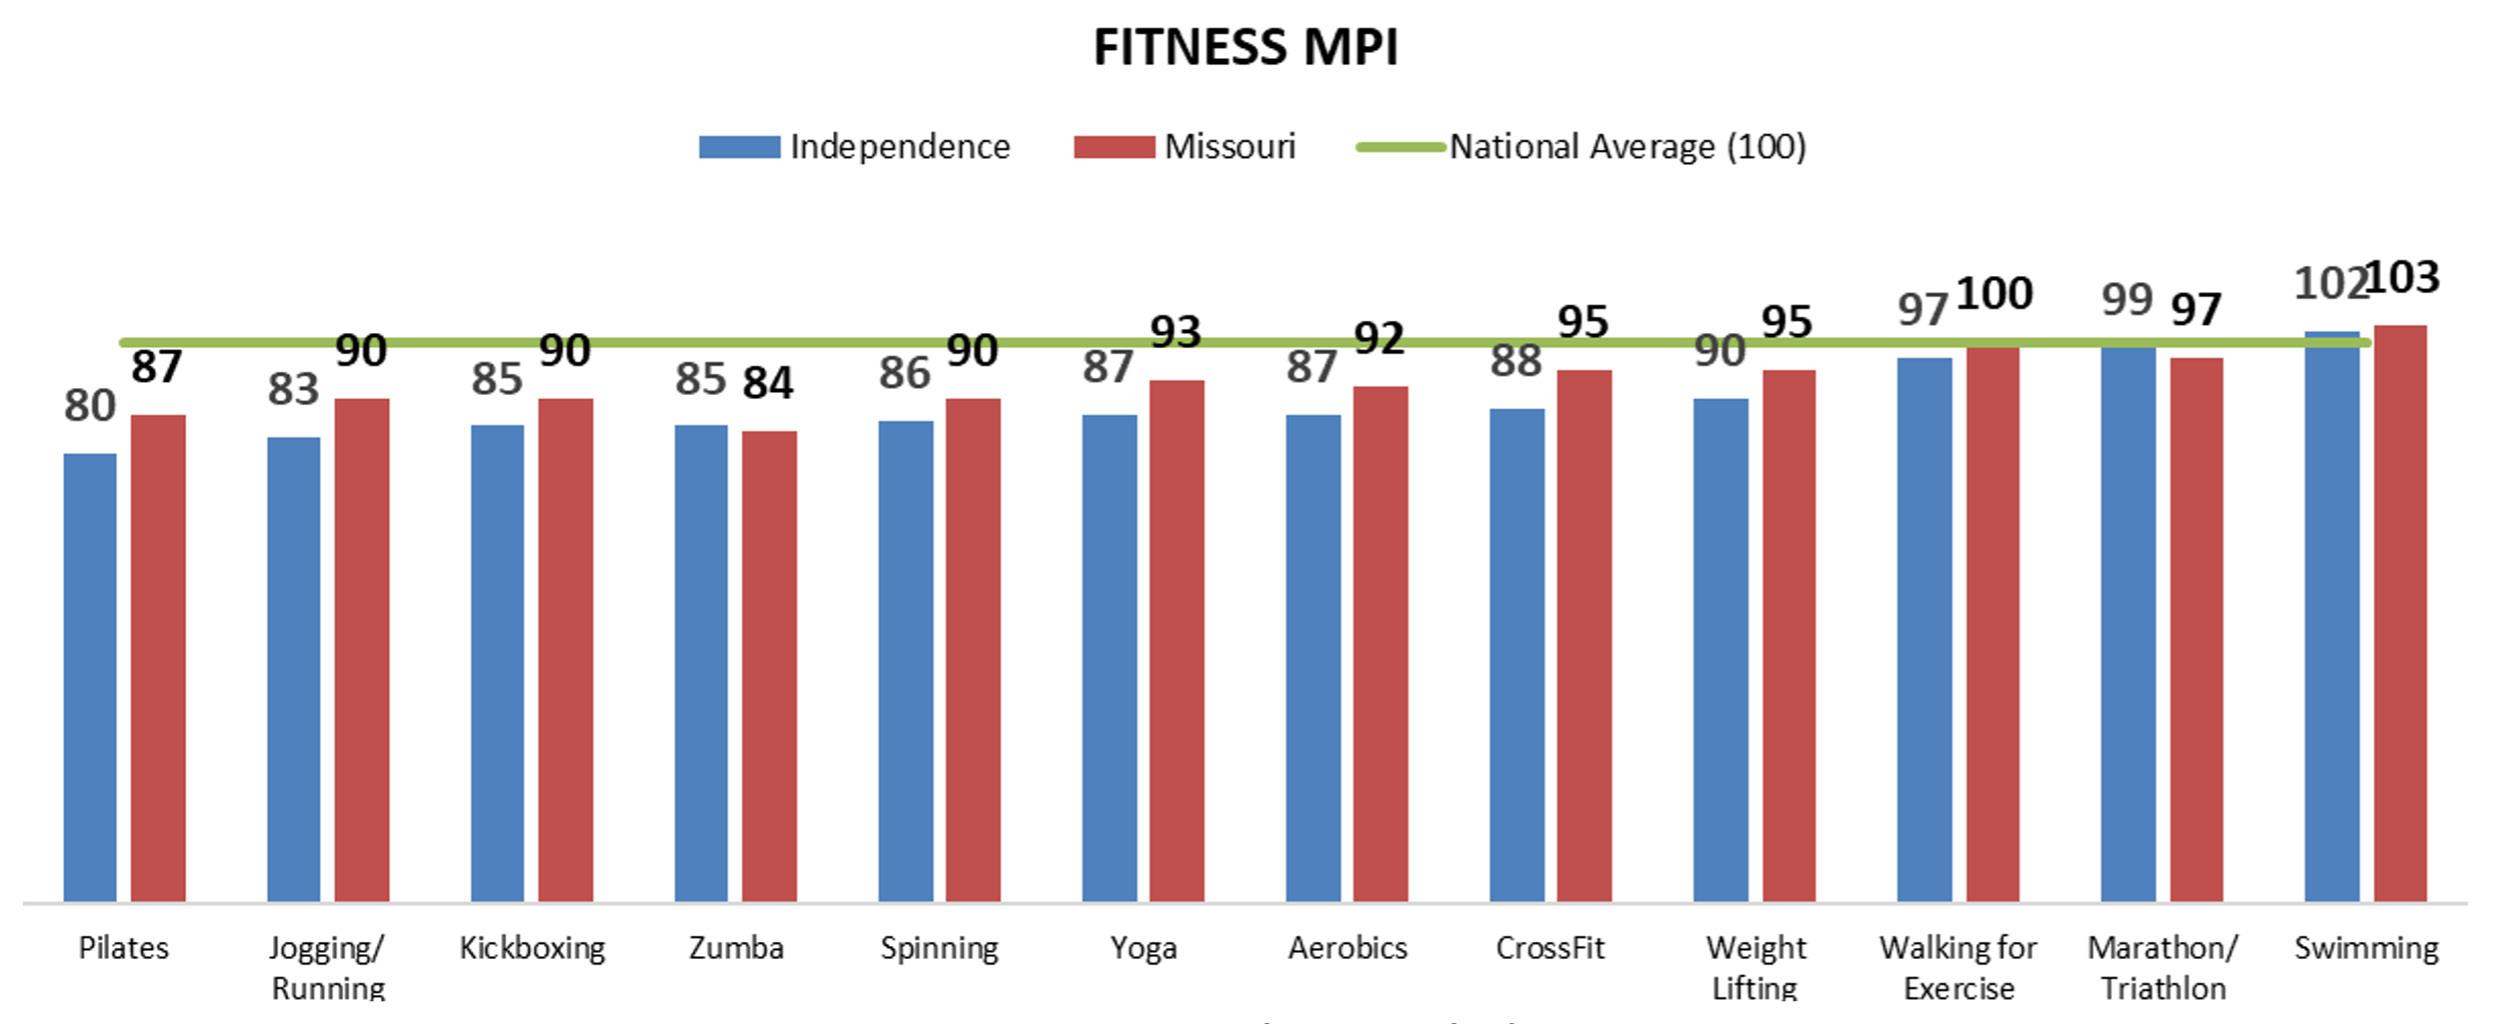
Independence’s market potential for outdoor activities shows several that are above national MPI averages including Fishing (MPI 122), Archery (MPI 116), Canoeing/Kayaking (MPI 108), and Horseback Riding (MPI 104). This indicates a strong interest in outdoor adventure related activities.
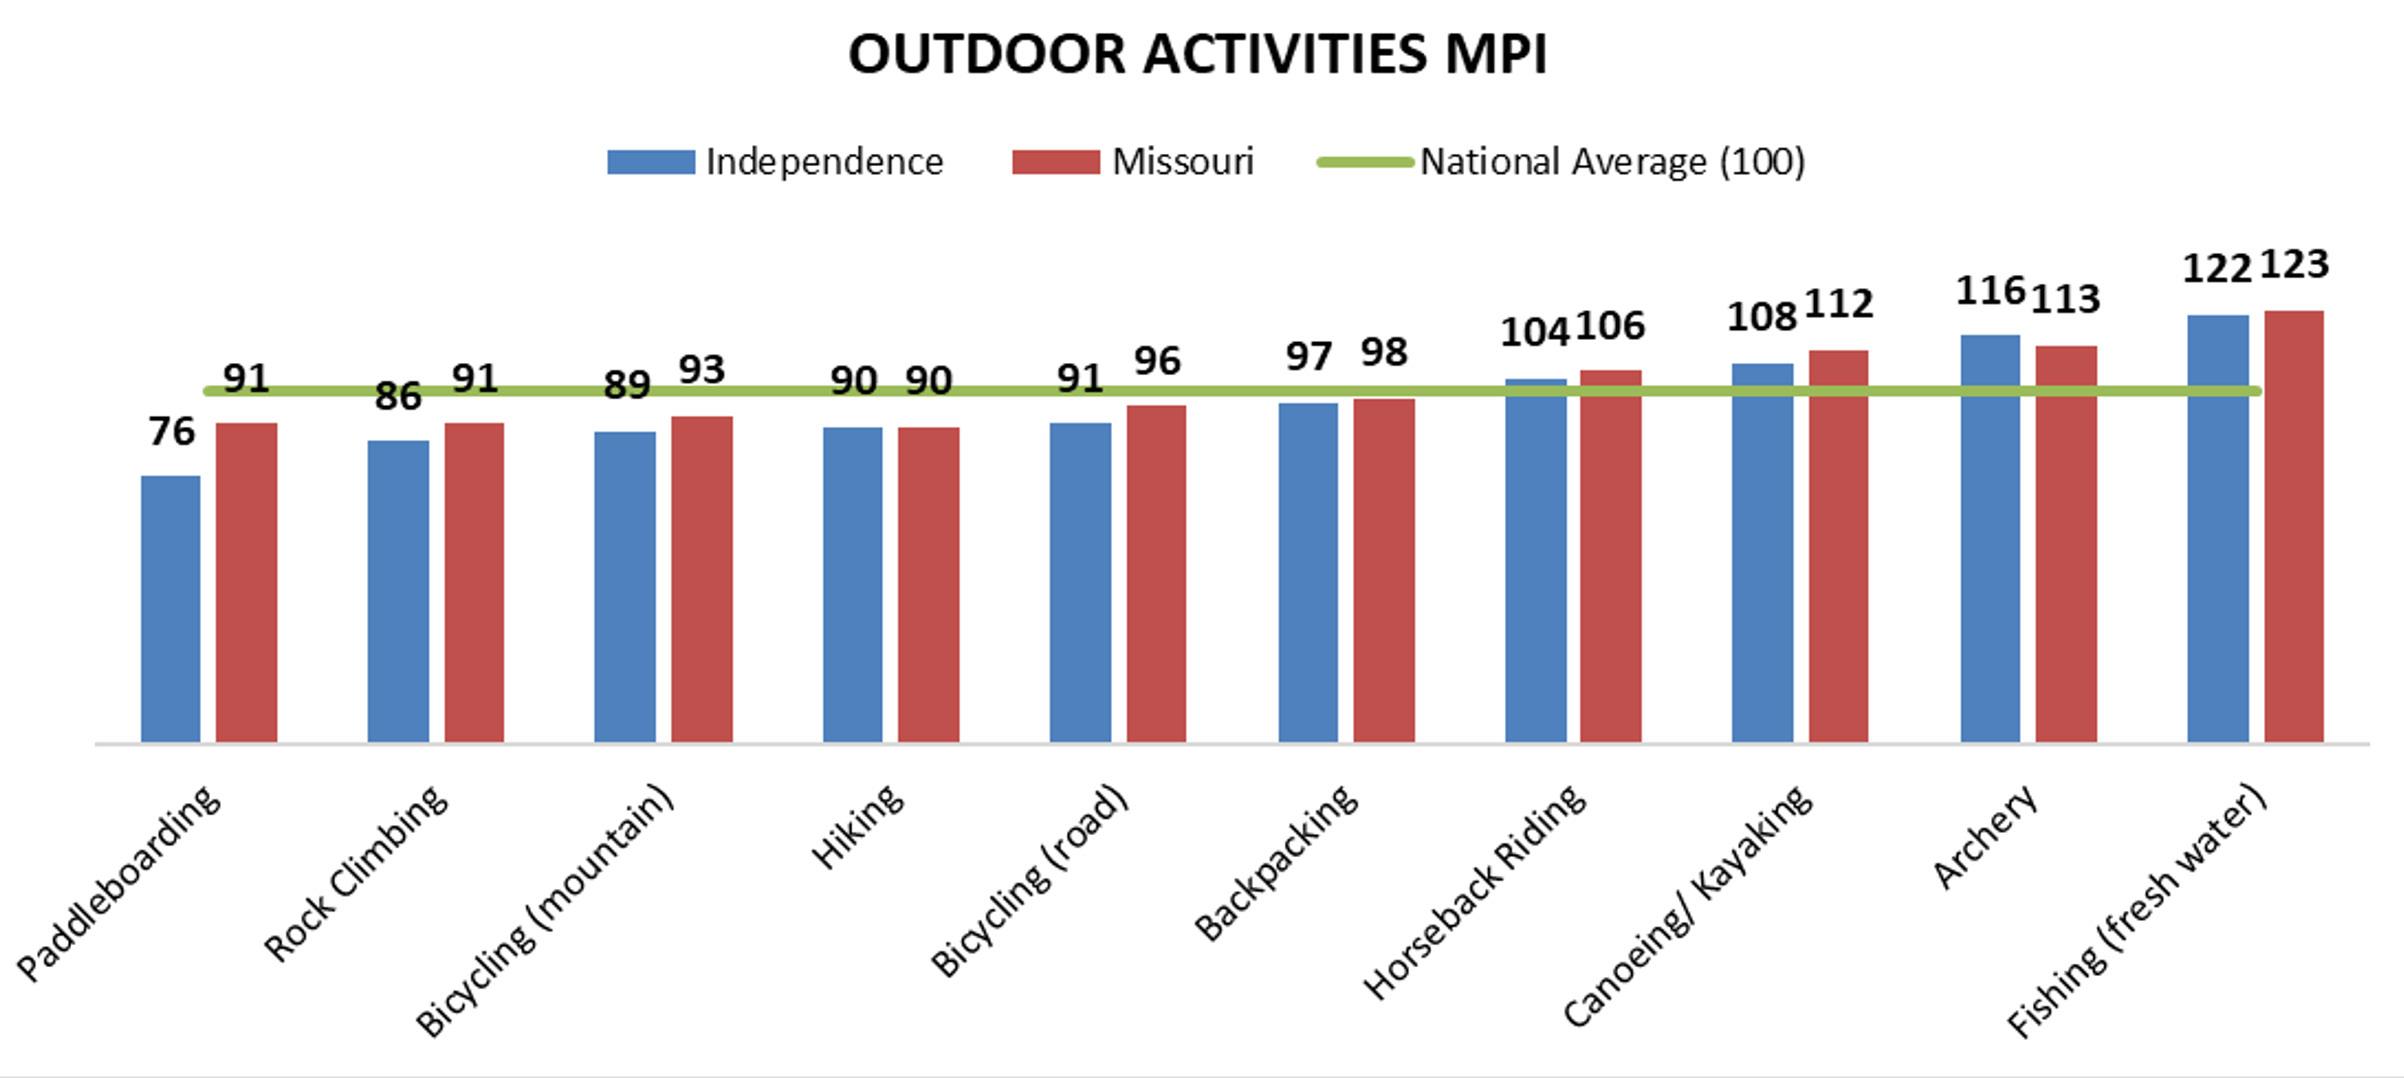
Independence also shows a strong interest in several commercial recreation options which sheds light on the other ways residents may spend their leisure time outside of opportunities offered by Independence Parks and Recreation. Did Photo Album/Scrapbooking (MPI 111), Played Video/ Electronic Game (Console) (MPI 107), Visited a Zoo (MPI 106), Visited an Indoor Water Park (MPI 104), and Went Overnight Camping (MPI 104) are the top scoring activities.
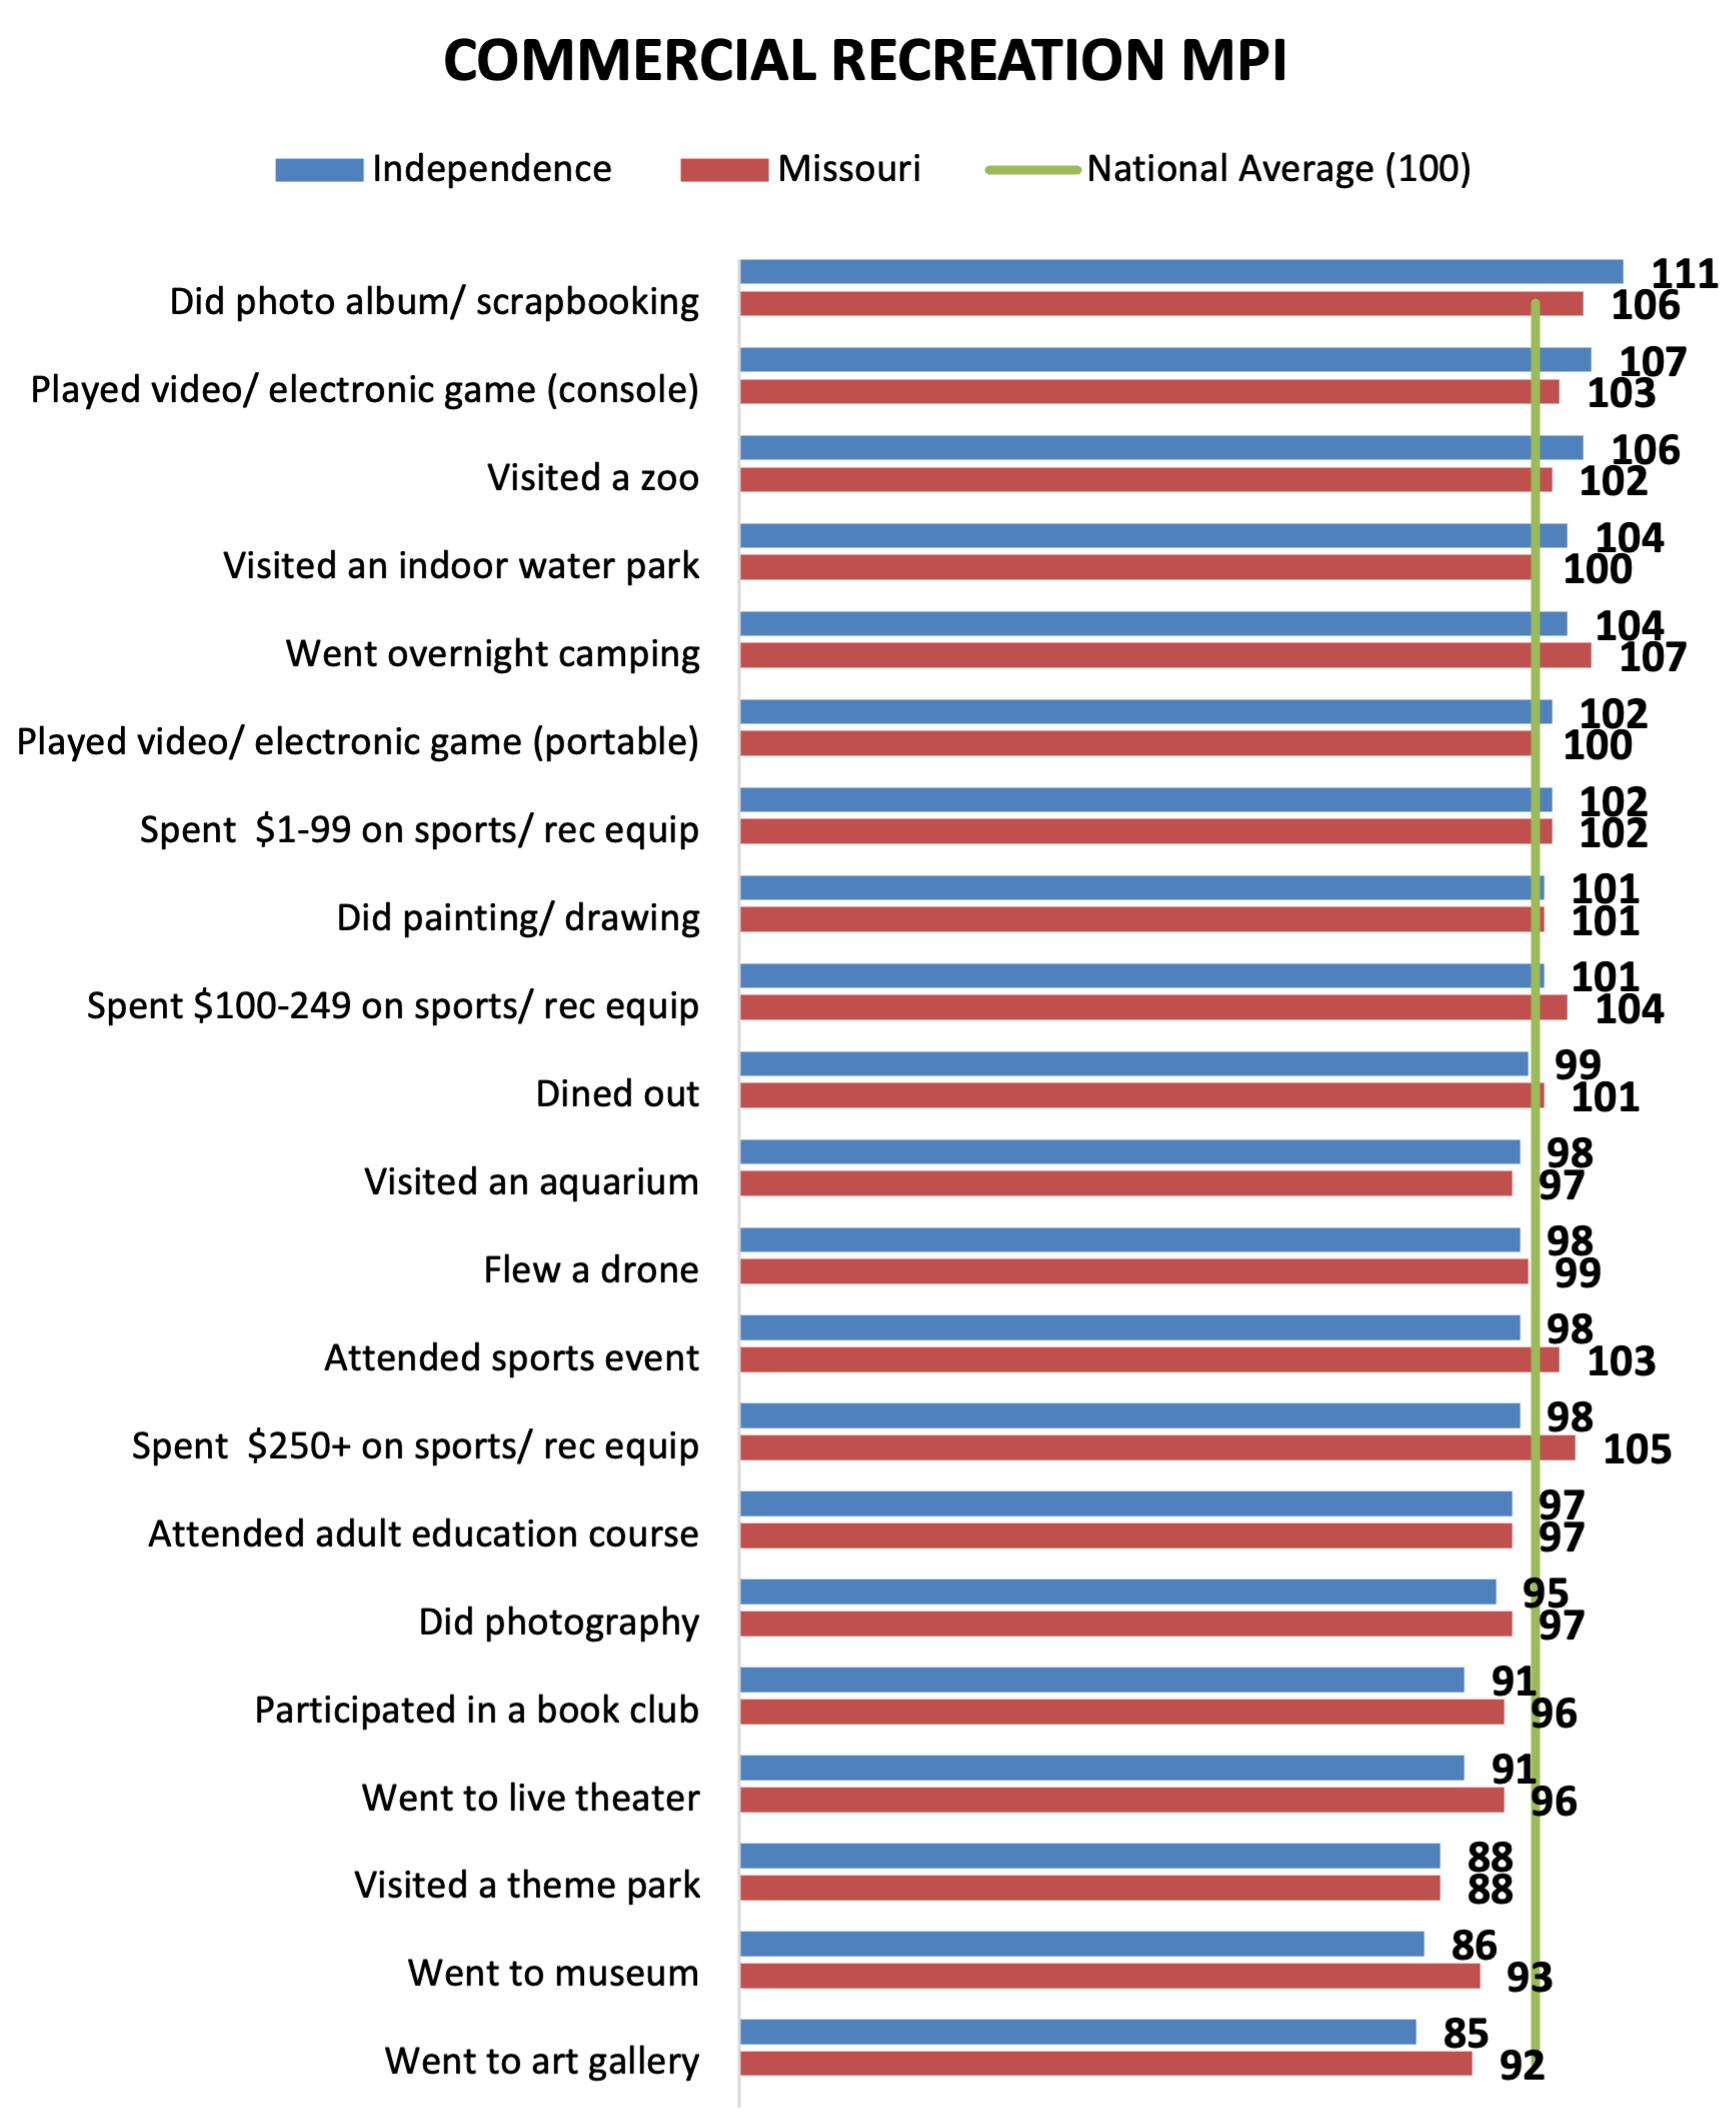
Additional national participation trends in recreation, as explained by the Sports & Fitness Industry Association can be found in Appendix E.
Recreation programs and services form the essential foundation of park and recreation systems. The goal of the program assessment is to understand current recreation program and activity offerings, as well as recommendations for additional programming to meet community needs and priorities identified throughout stakeholder engagement.
The recommendations within this report align with the Independence Parks and Recreation Department’s (“IPR”) overall mission and vision within the parks and recreation master plan update. These practices have been proven to lead to improved planning, better service delivery, and enhanced community satisfaction. Streamlining processes can make for smoother daily operations. Additionally, improved data analysis and strategic planning for recreation programming lead to more informed decision-making and better program execution.
The program findings and comments are based on a review of information provided by IPR staff, including program descriptions, pricing strategies, and cost recovery. The purpose of this assessment is to guide future program planning and help IPR align recreation offerings with community needs, priorities, operational capacity, and financial sustainability.
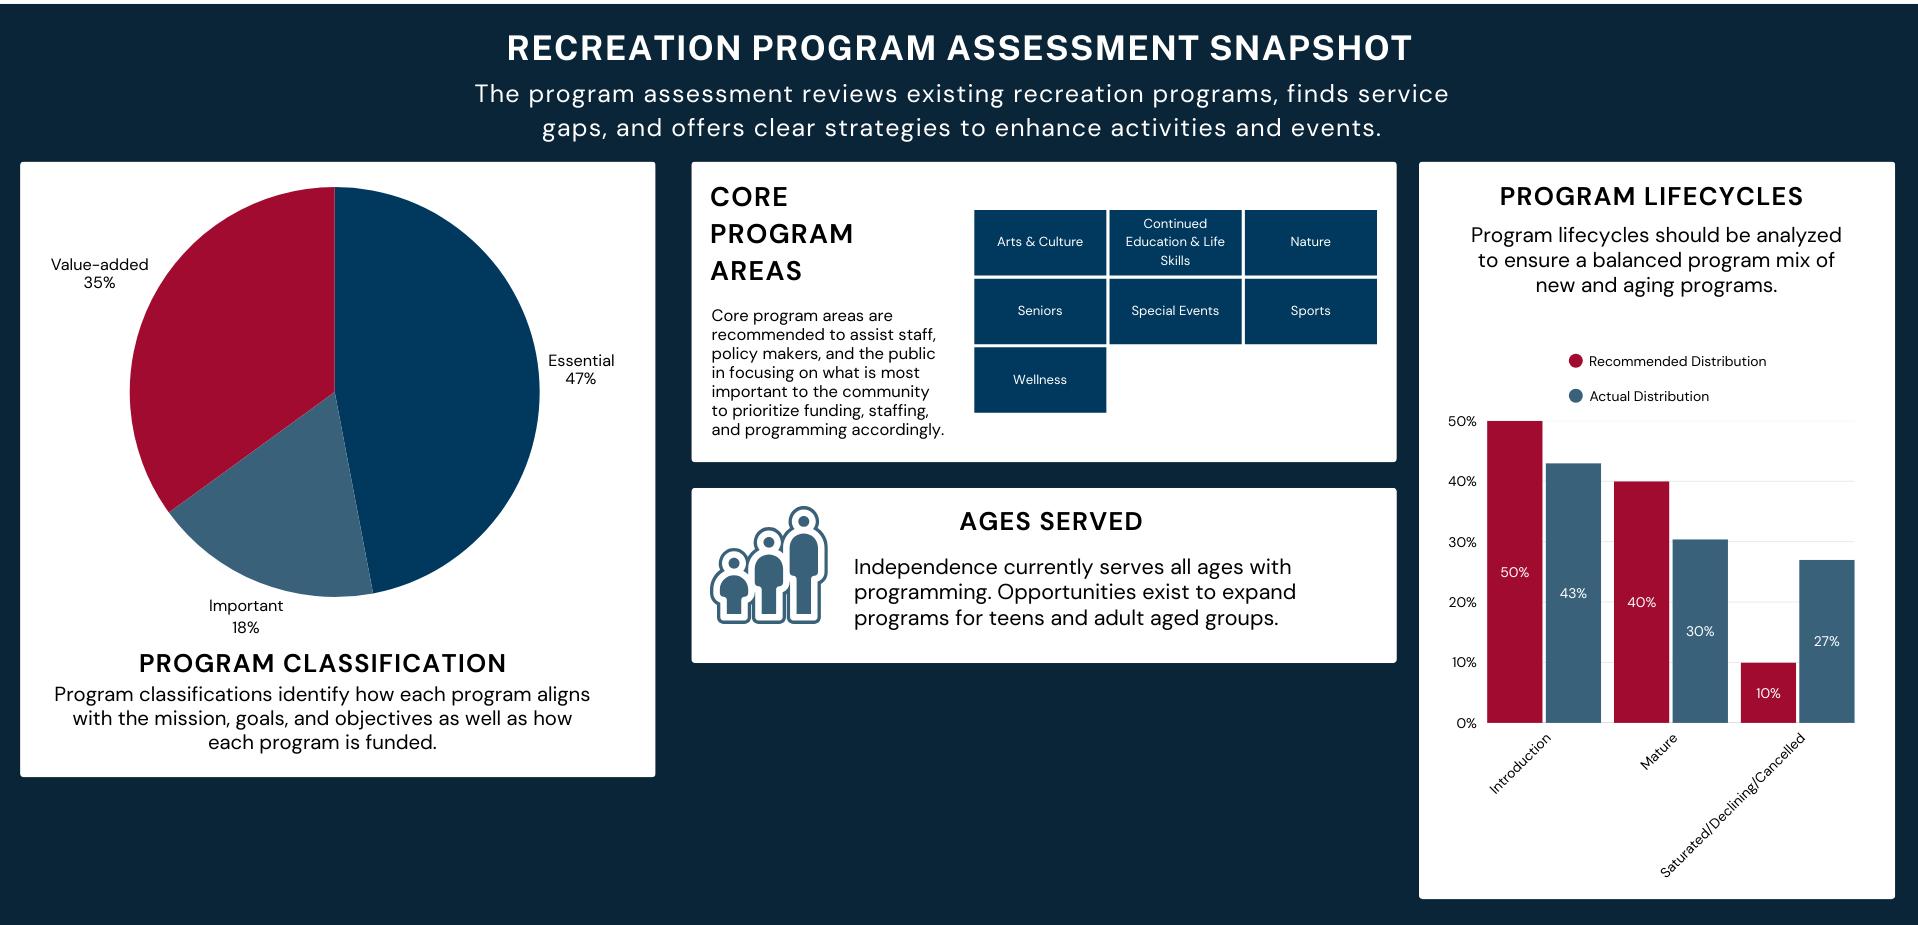
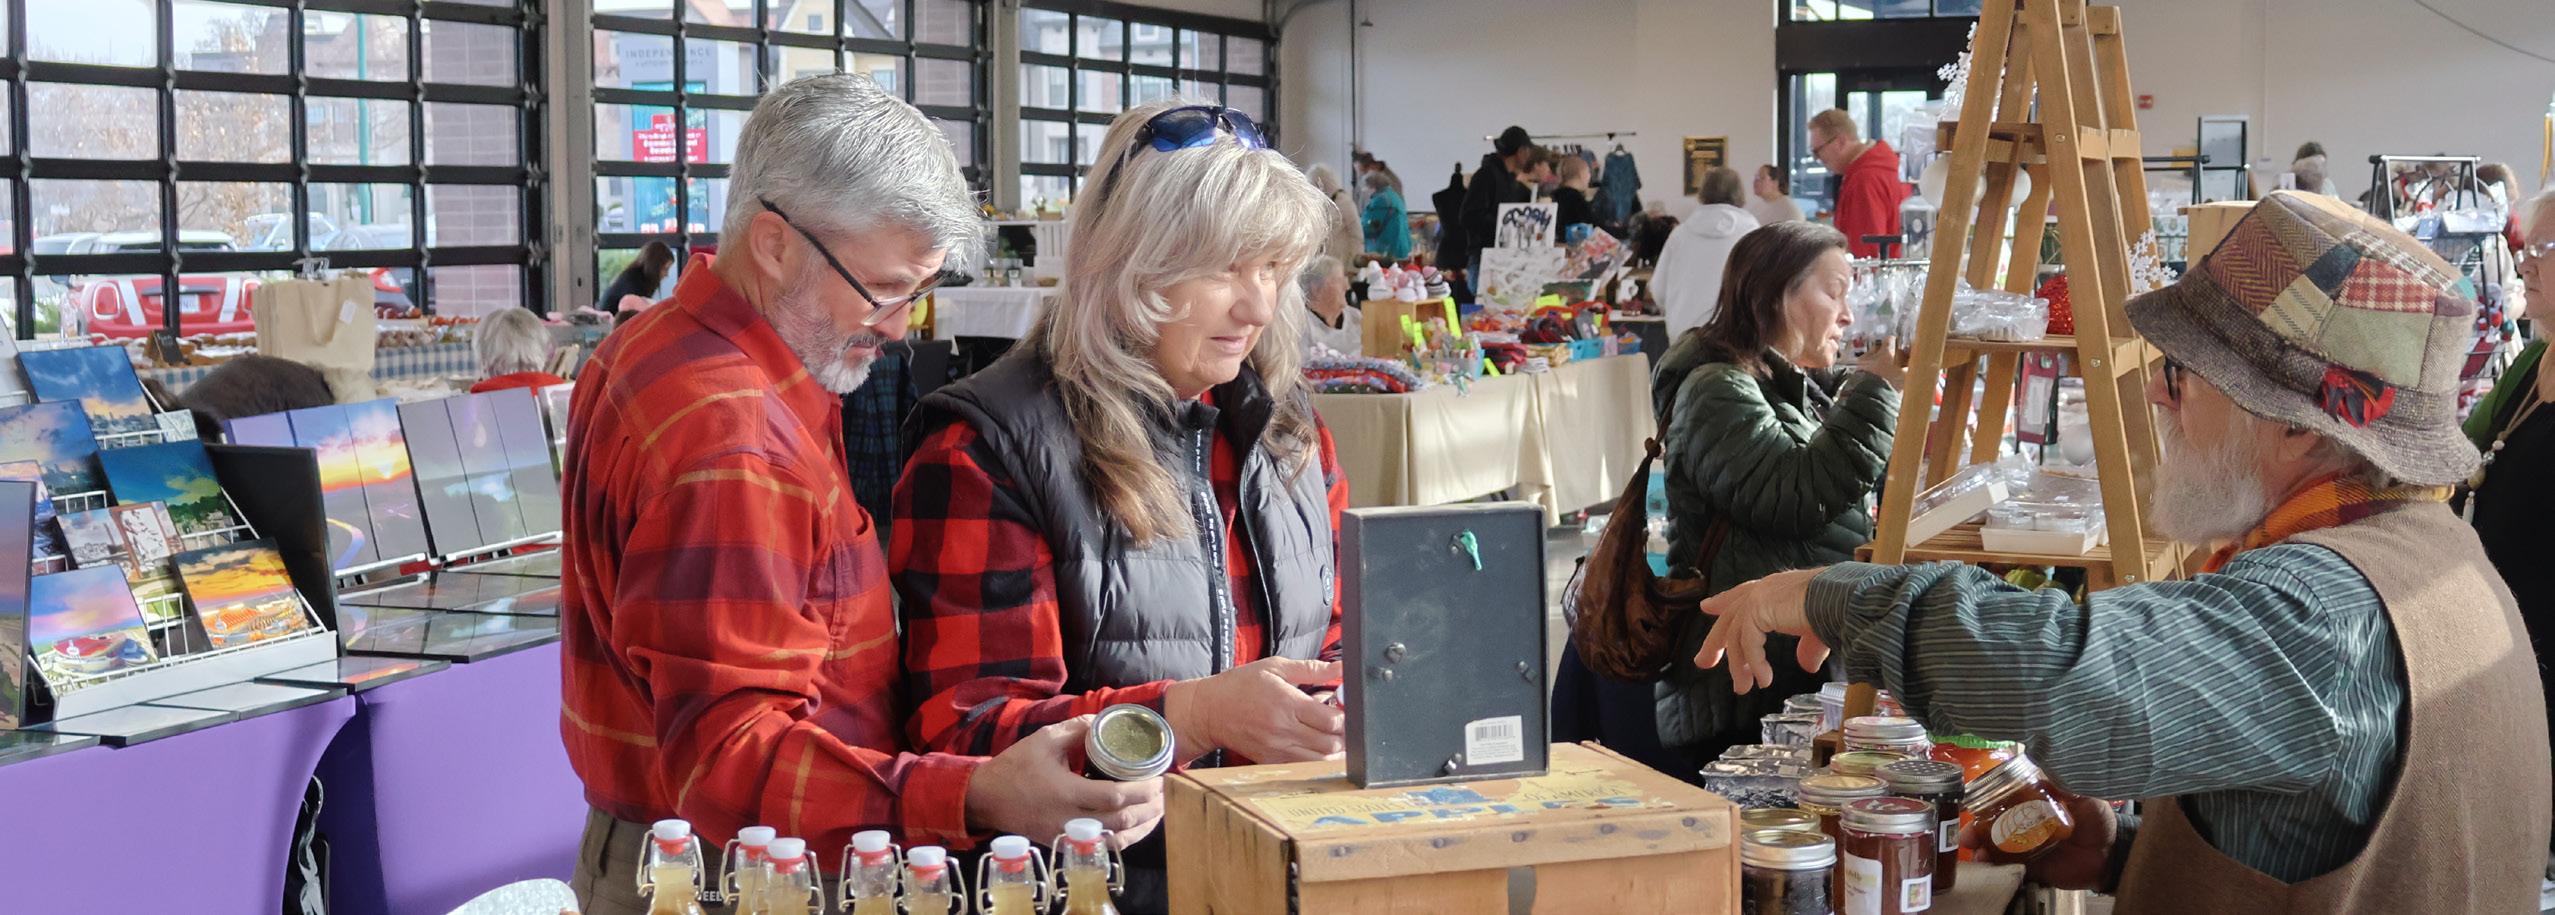
This snapshot provides a visual summary of key findings from the recreation program assessment data. Nearly half of Independence’s programming is classified as essential. Core program areas have a wide age segment appeal, however there are opportunities for IPR to expand programs for school aged children, teens and older adult age groups. Finally, the lifecycle analysis shows a moderate concentration of programs in the introduction stages, however, more than 25% of programs are classified in the saturated, declining, or cancelled stages which means several programs need to be analyzed to determine whether they are the right type of investment for the department going forward.
Independence, MO is projected to see very modest population and household growth through 2038, at a slower rate than surrounding communities and the U.S. overall. The city’s population will essentially remain stable, with minor dips and rebounds, while household counts will grow slightly faster due to smaller average household sizes. This means IPR may face slower demand growth for new facilities compared to nearby cities, but aging demographics and smaller households will drive demand for senior services, life skills programs, and intergenerational offerings.
Independence’s greatest growth will be in children and seniors, especially ages 65+. IPR should balance investments by expanding youth/family services while also scaling up senior-focused, accessible, and intergenerational programming to meet the needs of an aging population.
Additionally, Independence will continue to diversify in race and ethnicity over the next 10 plus years. IPR should ensure that offerings adapt to and match the community. IPR should look for ways to further engage diverse neighborhoods through partnerships that can expand recreation services to underserved areas of the City.
Finally, Independence has per capita and median household income levels that are below Missouri and US averages. IPR should develop a financial assistance program for critical or essential services to create more accessibility to health and wellness programming.
As a part of a workshop with the IPR team in the winter of 2025, several programming strengths, challenges, and opportunities were identified that have provided a foundation for recreation programming recommendations.
Opportunities to build on nature and senior programming and expand sports, wellness, and arts/culture programming.
Emerging partnership opportunities with schools, nonprofits, and community organizations
Dedicated staff and volunteers, especially at Palmer Center
Affordable, inclusive, and introductory recreation offerings
Strong history and identity with unique cultural and historic assets
Established system of trails and natural assets
Growing participation in select programs (e.g., youth sports, senior meals, homeschool programming)
Community pride in local theater, special events, and social activities
Challenges
Many facilities are outdated and require modernization
Communication gaps – residents struggle to find program information
Safety concerns with unhoused, drug use, and vandalism in parks
Equity gaps – underserved east side neighborhoods, low-income areas, and residents with special needs
Limited teen, young adult, and adaptive programming
Inadequate infrastructure: sidewalks, parking, and dated facilities
Heavy reliance on limited city funding and strained staff capacity
Perceptions of disparities in recreation services between east and west Independence
Modernize facilities and reinvest in underutilized spaces for flexible, multipurpose use
Build a stronger brand identity and expand outreach through digital, print, and partnerships
Create safer, more welcoming spaces with ambassadors, security improvements, and social service partnerships
Prioritize capital investments in underserved neighborhoods and expand ADA-friendly facilities
Develop more intergenerational, youth, and workforce-related programs
Expand trail connectivity, improve access to nature, and promote parks as health assets
Diversify funding through cost recovery, partnerships, sponsorships, and grants
Reinvest across neighborhoods and celebrate community identity through arts and history
Recreation program findings for IPR highlight several urgent priorities for strengthening service delivery and access across the community. Key needs include modernizing aging facilities, expanding inclusive and intergenerational programming, and addressing service gaps in youth, adaptive, and wellness offerings. To ensure access, the IPR must prioritize outreach and investment in underserved neighborhoods, particularly on the east side and in low-income areas. Addressing safety concerns, homelessness, and perceptions of unwelcomeness is critical to creating welcoming and inclusive public spaces.
Improving communication and branding is also essential; the department should invest in clearer messaging, stronger marketing efforts, and more intentional promotion of community identity and successes. Long-term sustainability requires a proactive lifecycle maintenance plan, stable community leadership, and diverse funding sources. Finally, strengthening partnerships with schools, libraries, nonprofits, and businesses, while shifting from a quantity-based model to one focused on program quality and impact, will be key to building a parks and recreation system that fosters community pride, resilience, and economic vitality.
Facilities & Modernization
Access
Teen & Young Adult Engagement
Youth Sports Strategy
Safety & Welcoming Spaces
Communication & Branding
Partnerships & Collaboration
Funding & Sustainability
Trails & Connectivity
Strategic Direction & Leadership
Many facilities are outdated; need upgrades, lifecycle maintenance, and reinvestment in underutilized spaces.
Gaps in service for east-side neighborhoods, low-income communities, and residents with special needs; call for more ADA-friendly design and inclusive programming.
Limited programs for teens, college-aged, and early 20s residents; desire for social, flexible, and culturally relevant offerings.
Growing competition with travel leagues; department’s strength lies in inclusive, introductory, and skill-based recreational sports.
Concerns about unhoused, drug use, and vandalism create unwelcoming environments; residents want safer, more inviting spaces.
There is a lack of marketing and visibility compared to peer cities; need for stronger outreach, storytelling, and promotion of assets and achievements.
Strong demand for collaboration with schools, libraries, nonprofits, and businesses to expand programming and support capital improvements.
Current reliance on limited city funds is unsustainable; need diversified funding sources, cost recovery strategies, and willingness-to-pay models.
Desire for improved trail connections, sidewalk access, and walkable neighborhood parks.
Community and staff want clearer priorities, stronger department identity, and consistent city leadership to guide long-term planning.
As detailed in the demographics and recreation trends analysis, IPR will experience shifts in its population’s age segments over the next fifteen years. In the next five years, older adults aged 55 and over are projected to increase to make up 35% of the population.
These age shifts will change the demand for certain types of recreation offerings. As detailed in the recreation trends analysis, Independence shows a strong market potential for outdoor recreation, including fishing, canoeing/kayaking, and archery. Independence also shows a market potential for electronic gaming, which scores above the national average. Other activities to note are swimming and golf which align with the national average.
A statistically valid community survey was administered by the ETC Institute in the spring of 2025. The survey analysis reveals top priorities for investment for programs and activities through a Priority Investment Rating (PIR). The top priorities for investment, based on the number of households that have a need for specific programming and how well their needs are currently being met, were special events, adult fitness and wellness programs, life skills programs, and water fitness programs. Also, close behind were nature programs/environmental education, programs for seniors, and programs that promote local history.
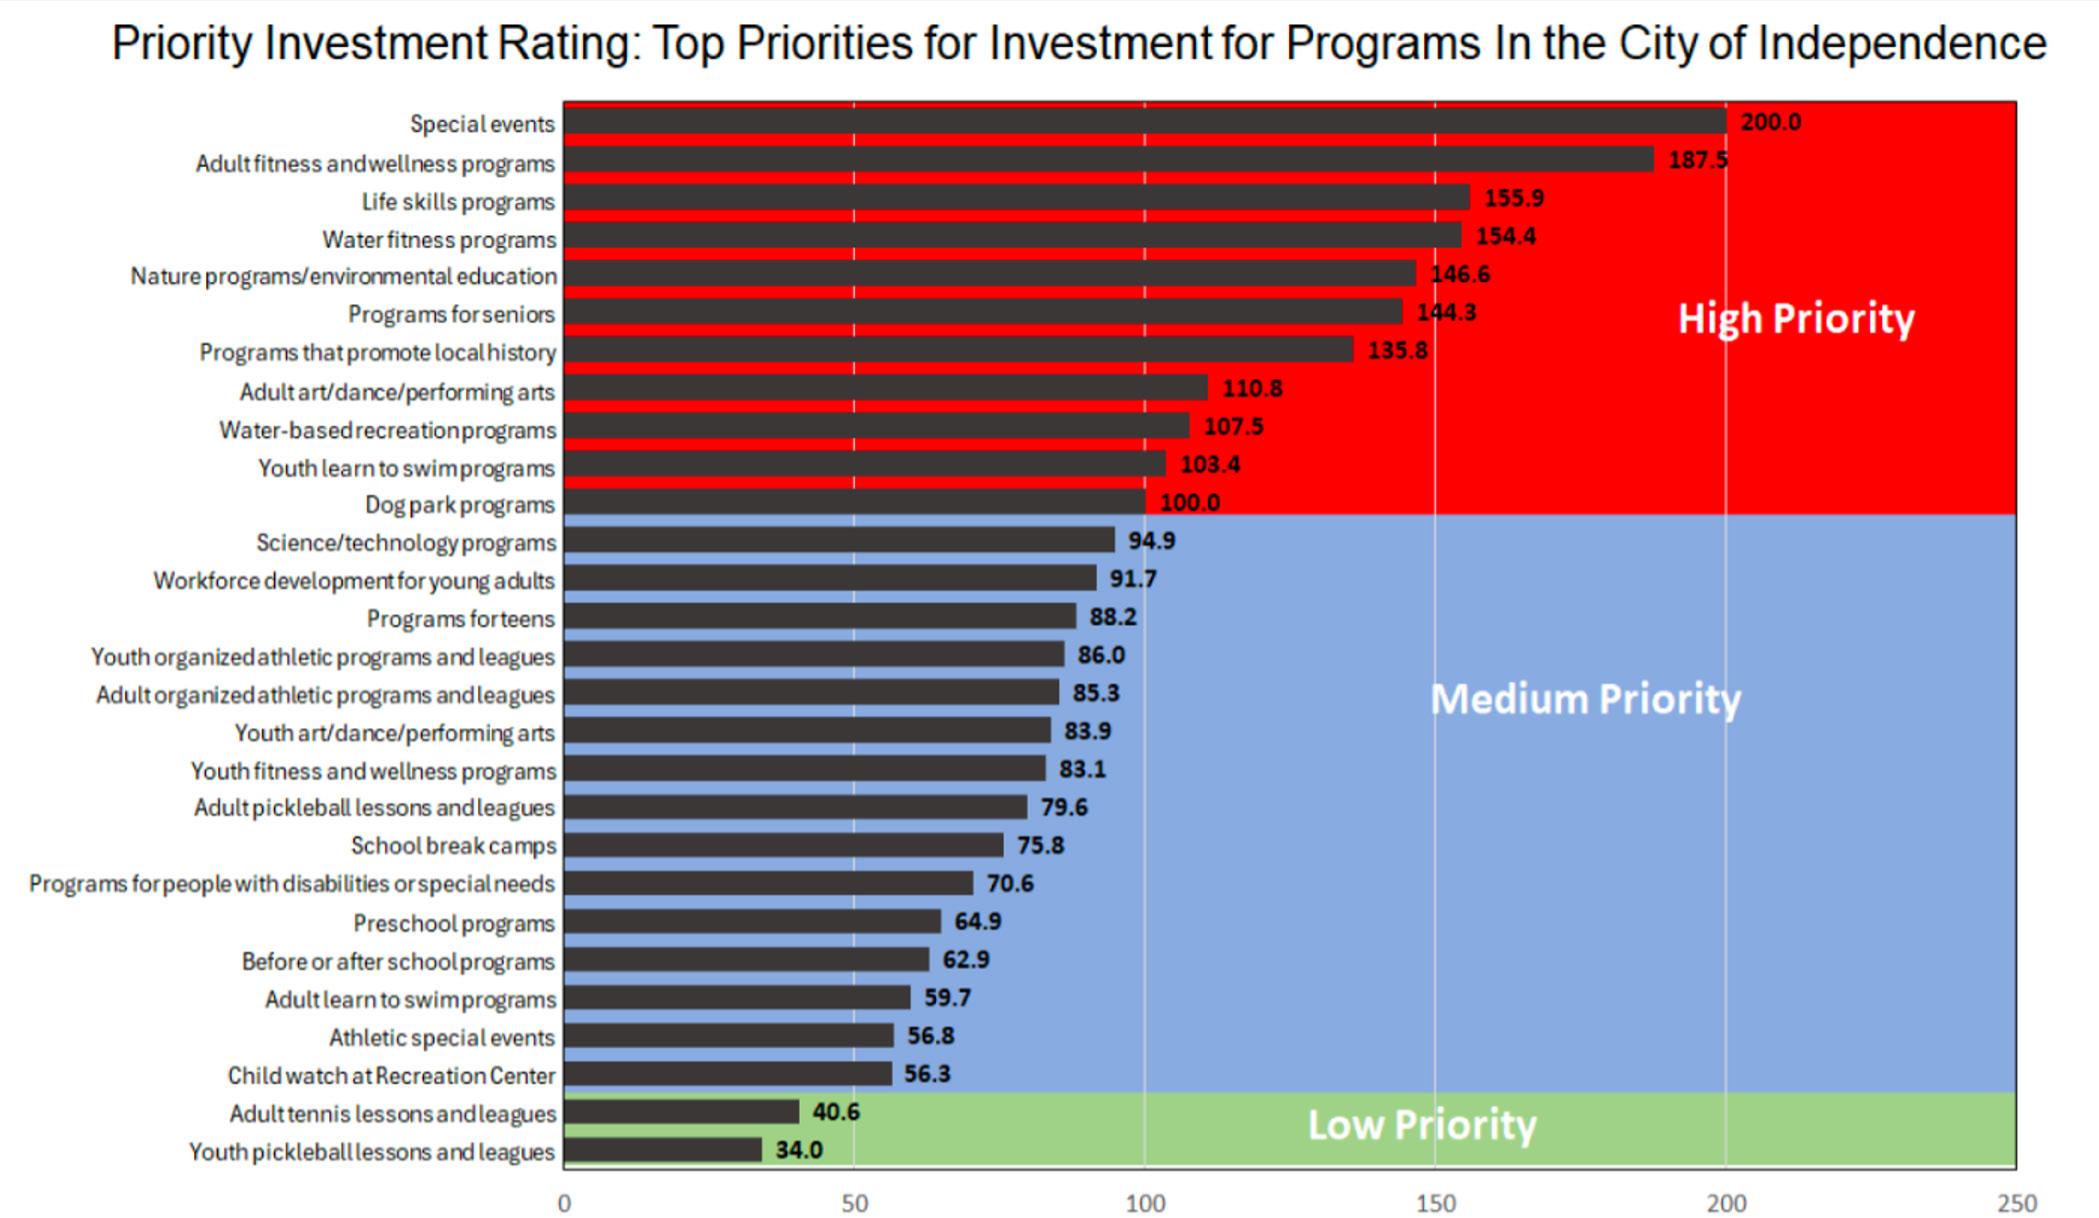
FIGURE 28 ETC INSTITUTE’S PRIORITY INVESTMENT RATINGS FOR PROGRAMS FROM THE 2025 COMMUNITY SURVEY
4.2.7 CORE PROGRAM AREAS
EXISTING CORE PROGRAM AREAS
The following core program areas, descriptions, and outcomes for IPR were identified during the data collection phase of the program assessment.
Arts & Culture A variety of planned activities and events focused on promoting, preserving, and celebrating artistic expression. Programs aim to engage diverse audiences, foster creativity, and enrich community life through various art forms, particularly performing arts, visual arts, music, and crafts.
Sports & Wellness A variety of fitness programs and services to enhance the physical, mental, social, and emotional health of individuals in the community. Supports well-being and fosters social connections within community spaces. Create recreational athletic opportunities for youth through retired adults in an indoor and outdoor park setting.
Special Events Large scale events to bring the larger community together as a whole and create opportunities to expand community with neighbors, businesses, non-profits and other community organizations for individuals that live or work in Independence. Events designed to engage the community and provide enriching experiences. Events are often seasonal or themed and can range from small gatherings to large-scale functions.
Continuing Education / Life Skills Continuing education refers to learning activities undertaken after initial education, either for professional development or personal enrichment, while life skills encompass a broader set of competencies needed for daily living and well-being.
Senior Programming Programs specifically for people 60 and over that promote health, wellbeing, and enriched quality of life through fitness, nutrition, social, education, and travel programs and activities.
Nature Programming Wide range of hands-on activities and programs with the goal of making children, adults and families comfortable in nature. Activities are not limited to environmental education, outdoor education but also activities not necessarily connected to nature and the outdoors.
Based on community feedback and trends, new and adapted core program areas of focus have been outlined below for IPR with some key, measurable outcomes for consideration.
The 55 and over, or older adult population, have a wide variety of interests and abilities that should be accounted for in future recreation program planning. Programs should focus on digital use and resources, social engagement, creative expression, and health and wellness. These age segments will be programmed for through the recommended core program areas including Aquatics, Arts and Culture, Community and Special Events, Continuing Education and Life Skills, Fitness and Wellness, Nature Education and Outdoor Adventure, Sports, and Youth and Family Out-of-school Enrichment.
Resources such as the National Recreation and Park Association’s “Healthy Aging Framework”1 or the AARP’s “Livable Communities”2 can provide ideas and structure on how to build this core program area with appropriate and relevant programming for Independence’s active and aging residents.
1 https://storymaps.arcgis.com/stories/7a552bba1dcd4172b6c566b5fa9d90af
2 https://www.aarp.org/livable-communities/archives/livable-communities-public-health/
Core Program Area Title Description
Aquatics
Arts and Culture
Community and Special Events
Continuing Education/ Life Skills
Provide safe, engaging, and inclusive aquatics programs that promote water safety, physical fitness, and recreational enjoyment for all ages and skill levels.
Provide diverse and accessible art and culture programs that celebrate creativity, heritage, and community engagement across all ages and backgrounds.
Create vibrant, inclusive, and memorable special events that strengthen community bonds, celebrate local culture, and provide diverse entertainment and recreational opportunities.
Continuing education refers to learning activities undertaken after initial education, either for professional development or personal enrichment, while life skills encompass a broader set of competencies needed for daily living and well-being.
• Ensure that swim lesson participants demonstrate improved water safety skills.
• Introduce at least three new aquatics programs annually.
• Number of programs offered annually
• Attendance by age group
• Participant satisfaction ratings
• Event attendance
• Economic impact (e.g., vendor revenue)
• Community satisfaction and participation surveys
• Number of programs offered annually
• Attendance by age group
• Participant satisfaction ratings
Fitness and Wellness
Nature Education and Outdoor Adventure
Promote a healthy and active community by offering diverse and accessible fitness and wellness programs that support physical, mental, and emotional wellbeing for all ages and fitness levels.
Inspire a deep connection to nature and foster personal growth through diverse outdoor education and adventure programs that promote environmental stewardship, physical activity, and lifelong learning.
Sports
Youth and Family Out-of-School Enrichment
Provide comprehensive and inclusive sports programs that foster physical development, teamwork, and a lifelong love of sports while promoting positive values such as sportsmanship, discipline, and respect.
Structured, engaging opportunities for children, youth, and families during out-of-school hours, including afterschool, evening, weekend, holiday break, and summer programs.
• Program attendance and frequency
• Percent of programs at capacity
• Fitness assessment or self-reported health
• Number of environmental/outdoor programs
• Youth participation in nature-based activities
• Pre/post program surveys
• Player registration and retention rates
• Number of volunteer coaches
• Participant skill or knowledge growth
• Program enrollment by age and season
• Access for low-income families
• Academic or social-emotional outcomes
TABLE 12 RECOMMENDED CORE PROGRAM AREAS AND OUTCOMES
Recreation programming plays a vital role in fostering an age-friendly community. By designing indoor and outdoor spaces that are accessible and welcoming, and by offering programs that promote health, wellness, lifelong learning, and social engagement, communities can better serve older adults across a range of interests, abilities, and age groups. It is also important to consider transportation options to ensure easy access to key gathering places and recreation facilities. Finally, reducing social isolation through inclusive gathering spaces, regular community events, and opportunities to connect can help strengthen community bonds and support healthy aging.
Even though IPR’s outdoor aquatic center has permanently closed, aquatics programming remains an essential long-term core program area for the community. Aquatic recreation supports multiple priority service outcomes including health and wellness, water safety, and family recreation, and continues to be one of the most consistently requested program types in national and local recreation trends. In the near term, IPR can continue meeting community needs by expanding partnerships. This includes coordinating learn-to-swim programs with adjacent municipal pools, school district facilities, and private swim schools.
Long-term, Independence has an opportunity to re-establish aquatics as a true anchor of its recreation system through the development of an indoor aquatic center that supports year-round programming. An indoor facility would dramatically expand IPR’s capacity to offer learn-toswim lessons, therapeutic and rehabilitation programs, aquatic fitness, lifeguard training, youth and adult swim teams, family recreation, and adaptive programs. It would also reduce weatherrelated cancellations, stabilize revenue, and extend reach to residents who rely on structured swim instruction or low-impact exercise as part of their health and wellness routines. Pairing an indoor aquatic center with a future community center would ultimately create a sustainable foundation for aquatics as a core program area.
According to the statistically valid survey, adult art, dance, and performing arts was identified as a high priority investment opportunity for Independence. Youth art, dance, and performing arts was identified as a medium priority in the same survey. IPR should add programs and classes using multiple mediums such as drawing, painting, sculpting, varied genres of music performance and appreciation, and differing styles of dance. Classes can be geared specifically toward adults, youth, or families. Also, IPR currently has partnership agreements with a few theater groups that provide programming in the Sermon Center. However, these agreements lack specific details and measurable outcomes for each side. Similar to other program areas, Independence should apply the partnership principles detailed in section 4.2.9 to all agreements that may or may not be fully developed or executed. Independence should use caution when making decisions on which specific user groups to provide additional resources to so that other core program areas are not forgotten or under-resourced.
Community and special events are a priority for the Independence community as evident in the community survey results. IPR provides special events that range from smaller, more targeted events to large-scale, community wide activities that require a significant amount of department resources and investment. This core program area should be further defined to allow staff and officials to make strategic decisions on how resources are allocated depending on the type of event and who it serves. This is particularly important to addressing outside or third party requests for event support from other organizations.
IPR should consider a tiered approach to decision making on how support is provided and events are planned in the future. This approach can help smaller, low-cost events move forward more quickly while larger, resource-heavy events will require more advanced planning.
Finally, IPR should consistently track department expenses and resources that are allocated to special events to ensure that future partnerships are mutually beneficial and that these outside requests do not negatively impact core recreation services that must be provided with limited funding.
The following page is an example of a tiered approach for decision-making on community events.
Continuing education refers to learning activities undertaken after initial education, either for professional development or personal enrichment, while life skills encompass a broader set of competencies needed for daily living and well-being.
Independence should expand this core program area to include different levels for skill progression and to reach underserved target audiences.
IPR should focus fitness and wellness programming on a growing wellness trend geared toward social workouts. Community centers are creating programming that integrates social, mental, and physical health in one total experience. Some strategies to enhance the social workout experience include:
• Creating individualized experiences through enhanced equipment and additional personal training opportunities.
• Developing a more comprehensive wellness experience that caters to a wide range of preferences from strength training to yoga, Pilates, and wellness coaching.
• Offering technology to participants for personalized health assessments and incorporating it into health and fitness programming.
• Add group-based programs that blend fitness with social interaction, such as yoga socials, wellness workshops, or fitness mixers for adults and active seniors.
• While technology enhances the wellness experience through automation and by providing ample data to improve wellness plans, maintaining strong relationships between trainers, program instructors and participants remains crucial for long-term engagement and accountability.
• Finally, park spaces provide flexible, low-cost opportunities to host:
• Pop-up fitness events, like boot camps, tai chi in the park, or seasonal walking/running clubs.
• Wellness trails that incorporate guided meditations, QR codes for mobile workouts, or outdoor fitness circuits.
• Drop-in or league-based sports programs for adults, such as pickleball, walking soccer, or ultimate frisbee, paired with social hours or wellness education.
Nature Education and Outdoor Adventure programming in Independence should be anchored by the George Owens Nature Park, serving as the hub for environmental education, outdoor exploration, and community-based stewardship initiatives. Through a coordinated mix of handson nature education, guided outdoor adventures, and experiential learning opportunities, this program area can inspire residents of all ages to build a deeper connection to the natural environment while supporting physical activity, curiosity, and lifelong learning.
Programming should leverage the Nature Park’s existing assets, trails, habitats, exhibits, and staff expertise, while expanding outward into parks, schools, neighborhoods, and community spaces to reach audiences who may not traditionally engage with nature-based programming. Mobile nature programs, school partnerships, and pop-up outdoor classrooms can extend the Nature Park’s reach, reduce barriers to participation, and strengthen community awareness of Independence’s natural resources. Positioned as both an educational destination and a community connector, the George Owens Nature Park can play a central role in advancing environmental stewardship, youth development, and inclusive outdoor recreation throughout the city.
IPR should enhance its current engagement with youth and teens or young adults. These activities should include out of school programming with added opportunities that could be housed within one of their community centers.
• An interactive game wall in the gym could help create gamified challenges for older youth and teens.
• IPR could explore adding a dedicated maker space with access to instruction, technology, equipment, and supplies for different skilled trades that are focused on tech, art and design, music, and carpentry.
• Partner with local media professionals, universities, or technology companies to offer workshops and training in video production, podcasting, social media management, and coding.
• Lastly, another partnership opportunity includes enrichment programming geared toward the various arts, which could be another draw for young adults.
Continuing Education and Life Skills programming is absent for preschool and elementary ages, leaving out critical years for enrichment and early development. For this reason, this core program area should have a more defined focus toward youth and family enrichment and introduce programs such as literacy and STEM or STEAM exploration, cooking basics, and school-break day camps, delivered in partnership with schools, libraries, and nonprofits.
Independence should clearly define its role in youth sports to ensure programs are consistent, inclusive, and accessible for youth across the community. This begins with establishing a citywide philosophy for recreational youth sports that emphasizes instruction, skill development, affordability, and broad participation rather than early specialization or exclusivity. A clear definition of this philosophy will help align City-run programs, partner organizations, and volunteers around shared goals and expectations for youth sports experiences in Independence.
As part of this approach, Independence should clarify where it serves as a direct provider versus a facilitator or partner. Independence should continue to function as the lead organizer for recreational leagues, ensuring equitable access, consistent quality, and safe play environments.
For more competitive pathways, Independence’s role should focus on coordination, facility support, and partnerships with independent leagues and regional organizations rather than direct management. In adaptive and inclusive sports, Independence should take a leadership role by convening partners, reducing barriers to participation, and ensuring programs are available to individuals of all abilities.
To support quality and consistency across all youth sports offerings, Independence should develop a coaching standards and training pipeline that applies to both City-run and partner programs. This pipeline should include volunteer onboarding, background checks and safety training, and sport-specific skill development, while reinforcing a shared philosophy focused on positive youth development. Over time, this structure will help create a consistent experience for participants regardless of sport or league.
Finally, Independence should establish clear developmental pathways that allow participants to progress from introductory and beginner programs to recreational leagues and competitive opportunities as interest and skill levels evolve. Ongoing evaluation of participation data should be used to identify and address gaps in service, particularly for girls’ sports, low-income youth, and underserved neighborhoods. By defining its role and expectations in youth sports, Independence can create a more cohesive system that supports lifelong participation, equity, and positive outcomes.
While IPR offers a wide range of parks, facilities, and programs, many facilities are aging, underutilized, or stretched thin for services. Rather than expanding the number of offerings, the department should prioritize reinvesting in existing spaces to modernize infrastructure, enhance accessibility, and improve the overall participant experience. This approach includes consolidating underperforming sites, upgrading high-impact facilities, and tailoring programs to align more closely with community needs and expectations. By emphasizing quality over quantity, IPR can create a more sustainable system that delivers meaningful, wellmaintained, and impactful recreation opportunities, building resident pride and ensuring long-term relevance.
Program standards should be established as a part of the program development process to ensure consistency of services. A focused approach should be applied to quality assurance for all services and how they are planned, implemented, and evaluated.
Quality standards should include expectations for staff training, staff performance evaluations, the condition of the program space, condition of supplies and equipment used for activities, and adhering to risk management policies and practices.
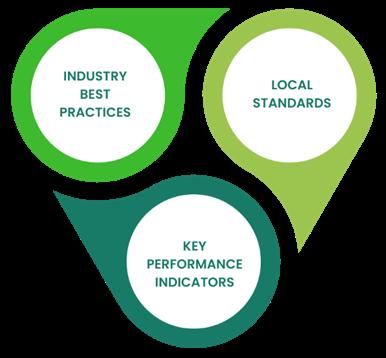
Also, defined and consistent customer service standards ensure that staff are maintaining a safe, quality, and positive experience for participants. Important standards are applied to the customer’s journey from the point of deciding to register for a program or activity, through the registration process, participation, and, finally, evaluation of the customer’s experience after the program or activity has been completed. Staff should always be mindful of consistent communication with the customer through the completion of the program or activity as well as ways that the customer experience can be enhanced.
IPR should create a Program Development and Resource Guide that outlines a consistent program development process that can assist programming staff with service delivery standards for both in-house and contracted programs. This includes a worksheet that staff would fill out when proposing a new program or update to a current program. The worksheet outlines critical program details including projected expenses that are used to establish the program fee. The worksheet also asks for information related to program outcomes, marketing tactics, and whether a similar program is offered elsewhere within the community. An example worksheet has been provided in Appendix D
Also, as a part of the program development process, IPR should consider comparing planned programs and prioritizing resources using additional data points, such as potential partnership or sponsorship opportunities, market competition, and the program’s priority investment ranking from the community needs assessment survey. This additional analysis will help staff make an informed, objective case to the public when a program that is in decline, but beloved by a few, is retired. A strong case is made for resources to be allocated to the program/ service if it has a high priority ranking, appropriate cost recovery, good age segment appeal, good partnership potential, and strong market conditions.
• Establish consistent standards for service delivery, staff training, program conditions, and risk management to ensure consistent quality.
• Apply customer service standards and maintain consistent communication to enhance the customer experience from registration to post-program evaluation.
• Use performance measures and HR standards, including training and reviews, to ensure effective program delivery and staff skill development.
IPR can streamline recreation program management data collection through their current recreation management software, RecTrac, by using a more automated workflow that minimizes staff time and produces key data for informed decision making.
• IPR should first determine the key data points that they would like to regularly analyze. Some best practices for metrics include program participation, financial performance such as the cost recovery percentage of each program, customer feedback, operational metrics such as instructor or staff hours per program, and key marketing insights including social media or email campaign effectiveness.
• RecTrac has features that can assist with the automated data collection for many of these key data points.
• Custom RecTrac reports can be automatically generated for program participation trends, waitlist to enrollment conversion, facility utilization, and revenue vs. cost recovery per program.
• RecTrac can also send post program surveys via email after program completion. Software such as SurveyMonkey or Google Forms linked through RecTrac can help capture satisfaction scores and feedback for reporting purposes.
• Finally, there are online dashboards, some that are free to use such as Google’s Looker Studio, which can be created using the data collected through RecTrac that can provide real-time updates on program performance for monthly or quarterly reports.
A program lifecycle analysis involves reviewing each program offered by IPR to determine the stage of growth or decline for each. This provides a way of informing strategic decisions about the overall mix of programs managed by IPR to ensure that an appropriate number of programs are “fresh” and that few programs, if any, need to be discontinued. This analysis is not based on strict quantitative data, but rather, it is based on staff members’ knowledge of their programs. Figure 30 shows the percentage distribution of the various lifecycle categories of the IPR’s programs. These percentages were obtained by comparing the number of programs in each individual stage with the total number of programs listed by staff members.
It is recommended to have fifty to sixty percent of all programs within the beginning stages because it provides IPR with an avenue to energize its programmatic offerings. These stages ensure the pipeline for new programs is there prior to programs transitioning into the Mature stage.
The Mature stage anchors a program portfolio, and it is recommended to have forty percent of programs within the Mature category to achieve a stable foundation.
It is a natural progression for programs to eventually evolve into saturation and decline stages. However, if programs reach these stages rapidly, it could be an indication that the quality of the programs does not meet expectations, or there is not as much of a demand for the programs. As programs enter the Decline Stage, they must be closely reviewed and evaluated for repositioning or elimination. When this occurs, IPR should modify these programs to begin a new lifecycle within the Introductory Stage or replace the existing programs with innovative programs based upon community needs and trends.
• Conduct an annual review of all programs to determine their stages of growth or decline and adjust the portfolio as needed to maintain balance and innovation.
• Aim for 50-60% of programs in the beginning stages to energize offerings and ensure a pipeline for future mature programs.
• Implement annual performance metrics for each core program area to track participation growth, customer retention, and the introduction of new programs, fostering innovation and alignment with community needs and trends.
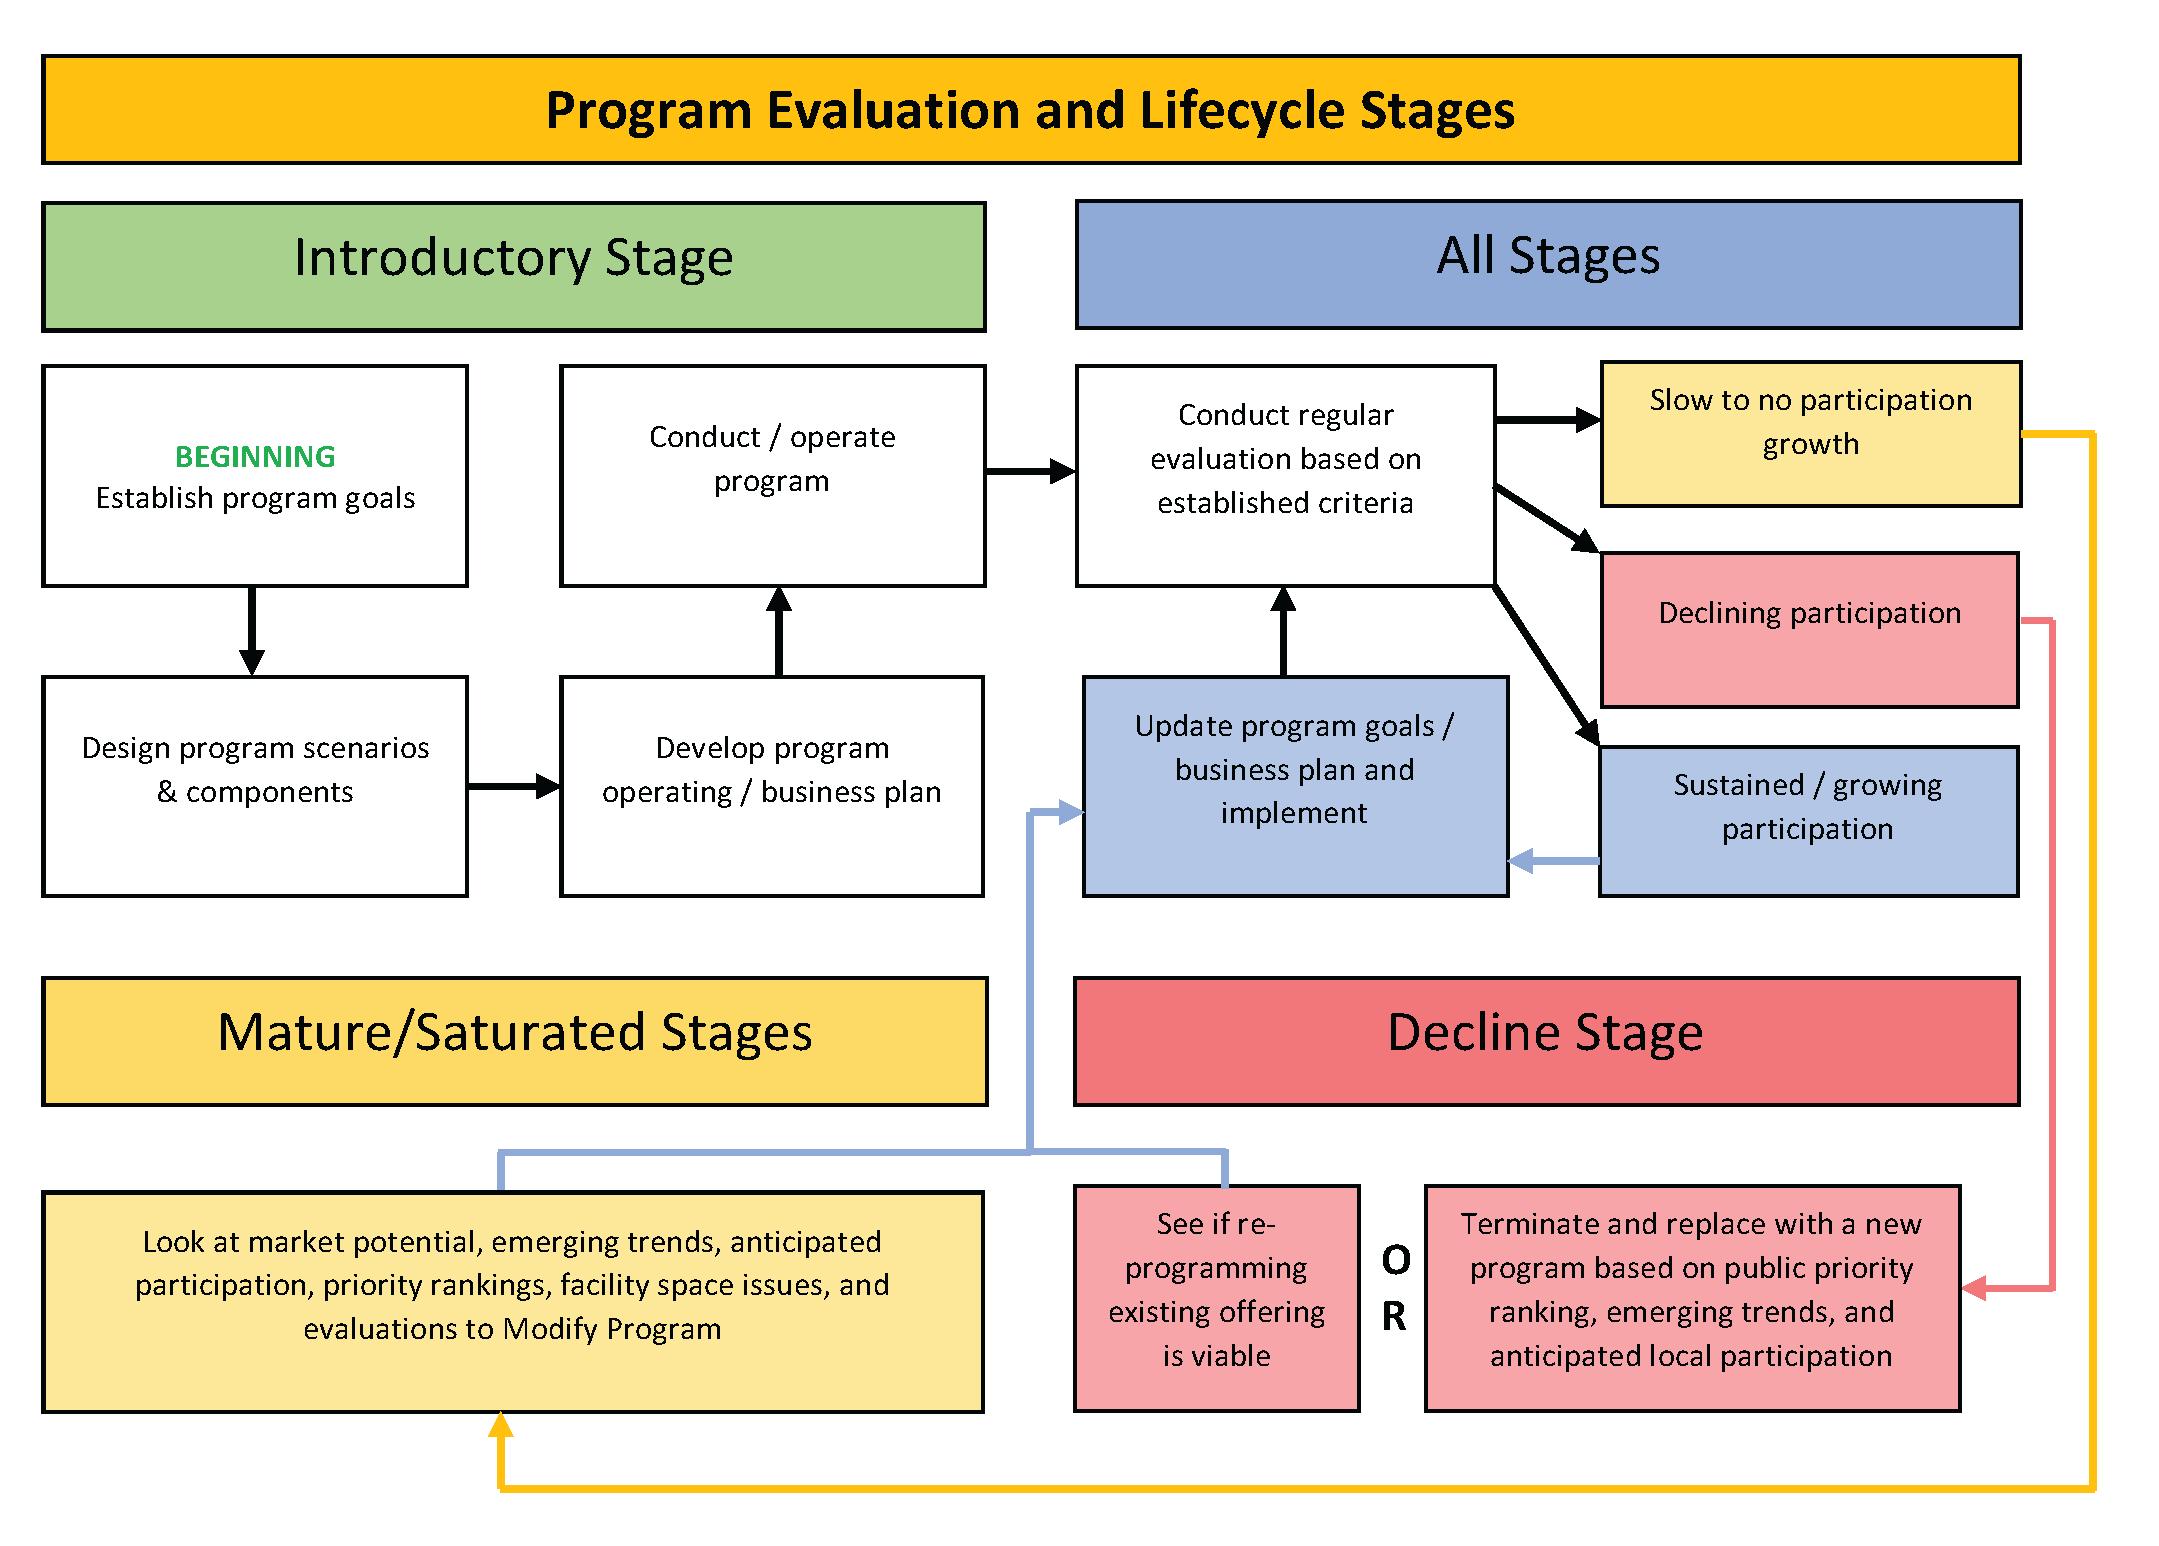
Staff should complete a Program Lifecycle Analysis, using the process in Figure 29, on an annual basis and ensure that the percentage distribution closely aligns with the desired performance. Furthermore, IPR could include annual performance measures for each core program area to track participation growth, customer retention, and percentage of new programs as an incentive for innovation and alignment with community trends.
Conducting a classification of services analysis informs how each program serves the overall organization mission, the goals and objectives of each core program area, and how the program should be funded with tax dollars and/or user fees and charges. Where a program or service is classified depends upon alignment with the organizational mission, how the public perceives a program, legal mandates, financial sustainability, personal benefit, competition in the marketplace, and access by participants. Program classifications can also help to determine the most appropriate management, funding, and marketing strategies.
With assistance from staff, a classification of programs and services was conducted for all the recreation programs offered by IPR. The results presented in Figure 31 represent the current classification distribution of recreation program services. All IPR programs should be assigned cost recovery goal ranges, through an IPR pricing policy, for the different classifications or core program areas.
Benefits (health, safety, protection of assets, etc.)
The program classification analysis shows that 47% of IPR’s offerings fall into the “Essential” category, 18% are considered “Important,” and 35% are “Value-Added.” The highest share of programs being Essential indicates that nearly half of all services are those with the strongest public expectation, substantial community benefit, and few, if any, alternative providers. These programs are generally open and accessible to all residents, supported by public funding, and provide critical health, safety, and quality-of-life benefits that would negatively impact the community if not offered. For community members, this means that IPR plays a vital role in ensuring equitable access to foundational services such as youth development, senior support, and safety-focused programs. For the department, it underscores the responsibility to sustain and protect these core offerings, even when cost recovery is limited, as they are central to its mission of serving the broad public good.
An age segment analysis examines the distribution of recreation programs across different age groups to determine which populations are being served and where gaps may exist. This analysis is an essential tool for program planning, as it helps align recreation offerings with community demographics, interests, and evolving needs. For IPR, this analysis supports informed decisionmaking about resource allocation, program development, and strategic outreach.
IPR’s age segment analysis was conducted across its core program areas to identify primary (P) and secondary (S) age markets for each category. While each core area, such as Nature Programming, Senior Programming, Arts & Culture and Special Events (et.al.), has the potential to engage multiple age groups, understanding the predominant users helps IPR evaluate whether its programming is balanced and inclusive. A more detailed analysis at the individual program level can provide deeper insight into specific participation trends and opportunities.
IPR’s programming has a wide age segment appeal, however there are opportunities for more programming to cater to preschool and elementary aged individuals.
Performing an alternative service provider and market definition analysis for recreational programming can offer several benefits to IPR to help the organization operate more efficiently, offer higher-quality programs, and best serve the needs of the community.
• Understanding the alternative service providers in the market allows IPR to identify gaps in existing services and potentially offer new or improved programs to meet the needs of the community more effectively.
• Identifying gaps in the market can also present opportunities for IPR to develop new revenue streams through innovative programs or partnering with private providers for mutually beneficial outcomes.
• By analyzing the market, IPR can identify potential cost-saving opportunities by either collaborating with existing providers or outsourcing certain services, thus optimizing resource allocation.
• Analyzing alternative providers helps the department benchmark its own programs against those offered by competitors, leading to the enhancement of program quality and diversity.
• Through consistent market analysis, IPR can prioritize its resources based on identified needs and demands, ensuring that investments are directed towards areas where they are most needed and likely to have the greatest impact.
• By offering programs that align with community interests and preferences, IPR can create greater engagement and satisfaction among residents, leading to increased utilization of recreational facilities and services.
• Insights gained from the analysis can inform the department's strategic planning process, helping to set clear objectives and priorities for future programming initiatives. Comparative
Blue Springs Fieldhouse 425 NE Mock Ave, Blue Springs, MO 64014
Burr Oak Woods Nature Center 1401 NW Park Rd, Blue Springs, MO 64015
DNA Community Center 17902 N Whitney Rd, Independence, MO 64058
Fairmount Community Center
County Shrine Club
Nature Center
Mallinson Vineyard and Hall
S Cedar Ave, Independence, MO 64053
S Crackerneck Rd, Independence, MO 64055
S Pleasant St, Independence, MO 64050
17201 E US 40 Hwy, Independence, MO 64055
N Main St, Independence, MO 64050
E Gregory Blvd, Kansas City, MO 64132
N River Blvd, Sugar Creek, MO 64050
Martha Lafite Thompson Nature Sanctuary 407 N La Frenz Rd, Liberty, MO 64068
Missouri Department of Conservation 200 Unity Circle North, Suite 2A, Lee's Summit, MO 64086
Fitness 4545 B South Noland Rd, Independence, MO 64055
Self-Propelled Fitness 109 W Lexington Ave, Independence, MO 64050
Storybook Theatre 14300 E US 40 Hwy, Independence, MO 64050 x Studio on Main
The Luxe Event Space
123 S Main St, Independence, MO 64050 x
200 N Liberty St, Independence, MO 64050
The City House 210 W Truman Rd, Independence, MO 64050
The Delaware Event Space 125 S Main St, Independence, MO 64050
The Farmhouse KC Venue 17221 E 32nd St S, Independence, MO 64055
The Higher Event Space
The Pavilion Event Space
The Rhapsody Wedding & Reception Venue
Vesper Hall
17601 E US 40 Hwy, Suite D, Independence, MO 64055
14831 E US 40 Hwy, Kansas City, MO 64136
2322 E R D Mize Rd, Independence, MO 64057
400 NW Vesper St, Blue Springs, MO 64014 x
Many alternative providers in and around Independence are private organizations. This further highlights the need for strong parks and recreation facilities that can offer alternative programming opportunities focused on inclusivity, affordability, and wide demographic appeal. For instance, IPR can support the need for youth sports programs by providing non-competitive, instructional programs that build skills for children in a variety of sports. This will continue to build interest in youth sports that eventually feeds into the more advanced programs that other organizations oversee within the community.
Other recommendations include:
• Avoid duplicating oversaturated private markets and shift toward unique experiences and educational programming.
• Expand arts, culture, and life skills offerings to serve all ages and strengthen community engagement.
• Develop age-targeted strategies such as creating more programs for seniors, teens, and those that create an intergenerational interest. These age segments are traditionally underserved and present major growth opportunities.
• Leverage city parks and facilities to host public-focused events rather than just rentals.
Finally, below is an overview of gaps and overlaps within current core program areas in and around the Independence community.
Program Area
Notes
Arts & Culture Primarily small venues or niche providers.
Continuing Education and Life Skills Limited large-scale or private sector involvement.
Facility Rentals Market is saturated; dominated by private event venues.
Nature Programs Strong presence by conservation and nature centers.
Senior Programs Services are limited and largely concentrated at Vesper Hall and Fairmount Community Center.
Sports and Wellness Highly saturated; most providers are private fitness or sports clubs.
Special Events Many venues support events, but programming-driven events may be lacking.
TABLE 14 GAPS AND OVERLAPS FOR CURRENT CORE PROGRAM AREAS
IPR has many leisure and recreation opportunities available to residents offered by IPR and other providers in the local government, non-profit, and private sectors. With limited resources, IPR cannot realistically provide all recreation opportunities at a high level. Leadership should continuously assess its services to ensure they are not duplicating a program or activity that is already addressing a need in the community.
The MacMillan Matrix (Figure 34) is a tool that can help staff determine if specific program areas are the right strategic investment for IPR.
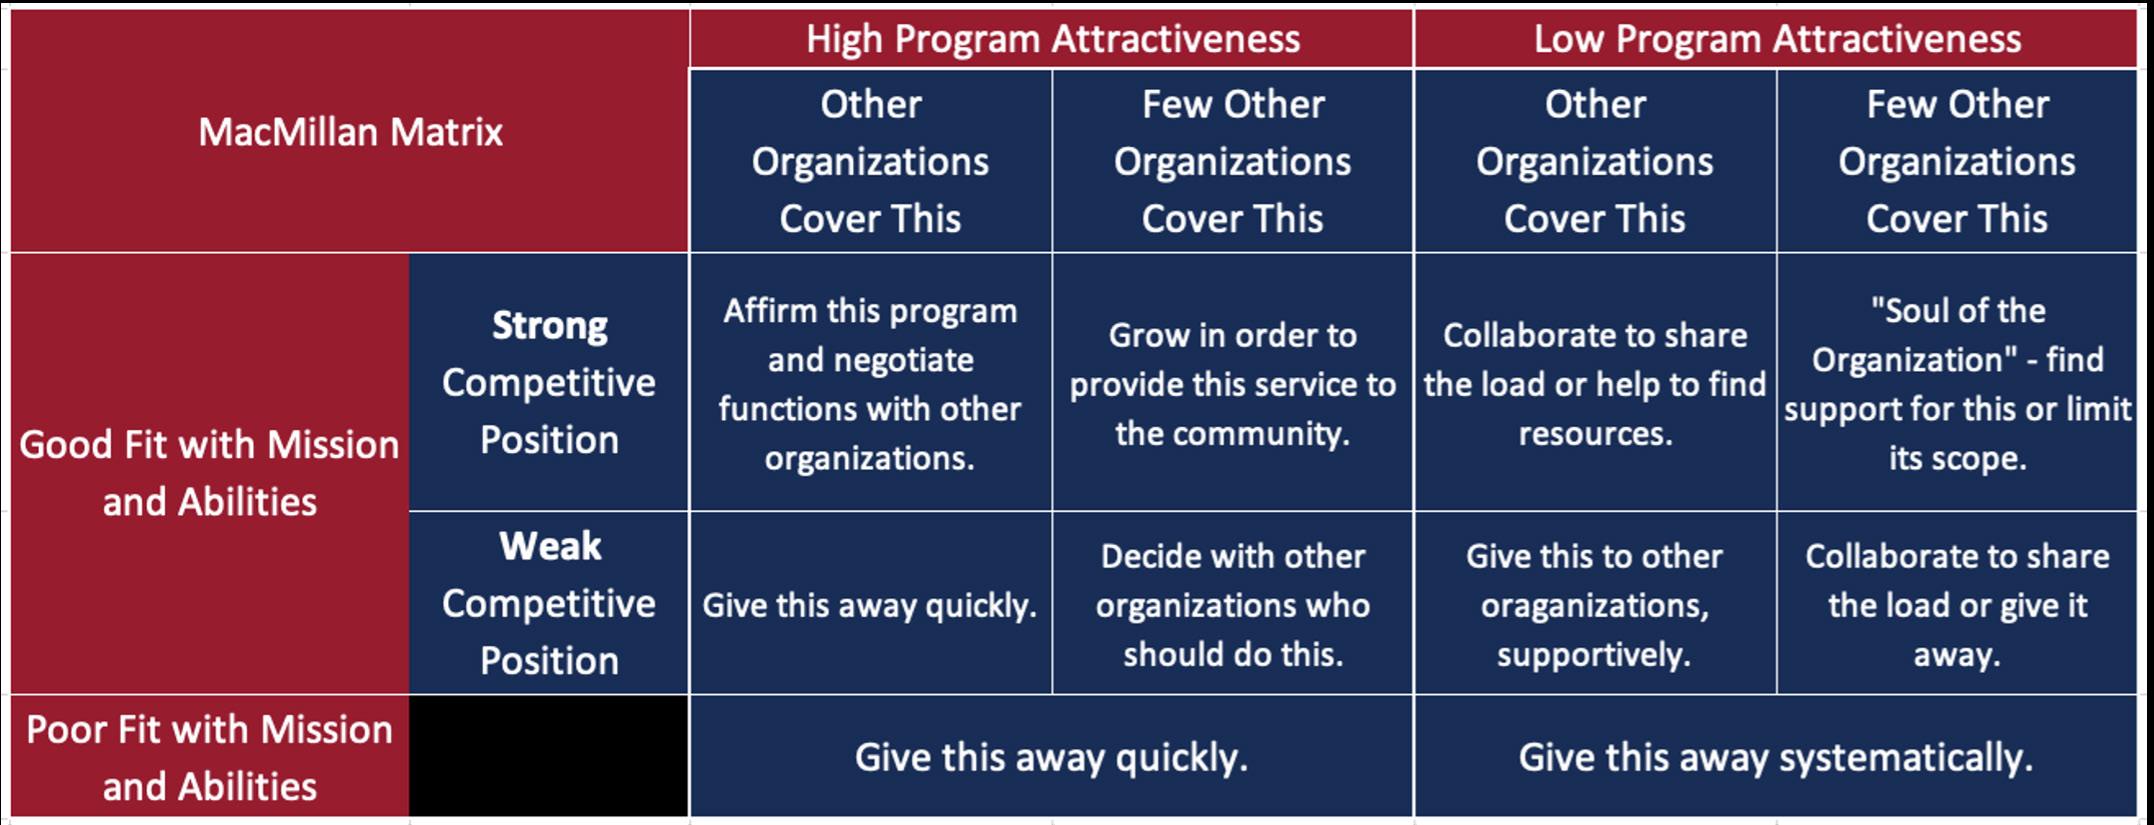
Based on the analysis of current program data, available facilities, recreation trends, similar recreation providers, and community input, Figure 33 provides an example of how the MacMillan Matrix can be used to determine the best investment for future recreation program resources.
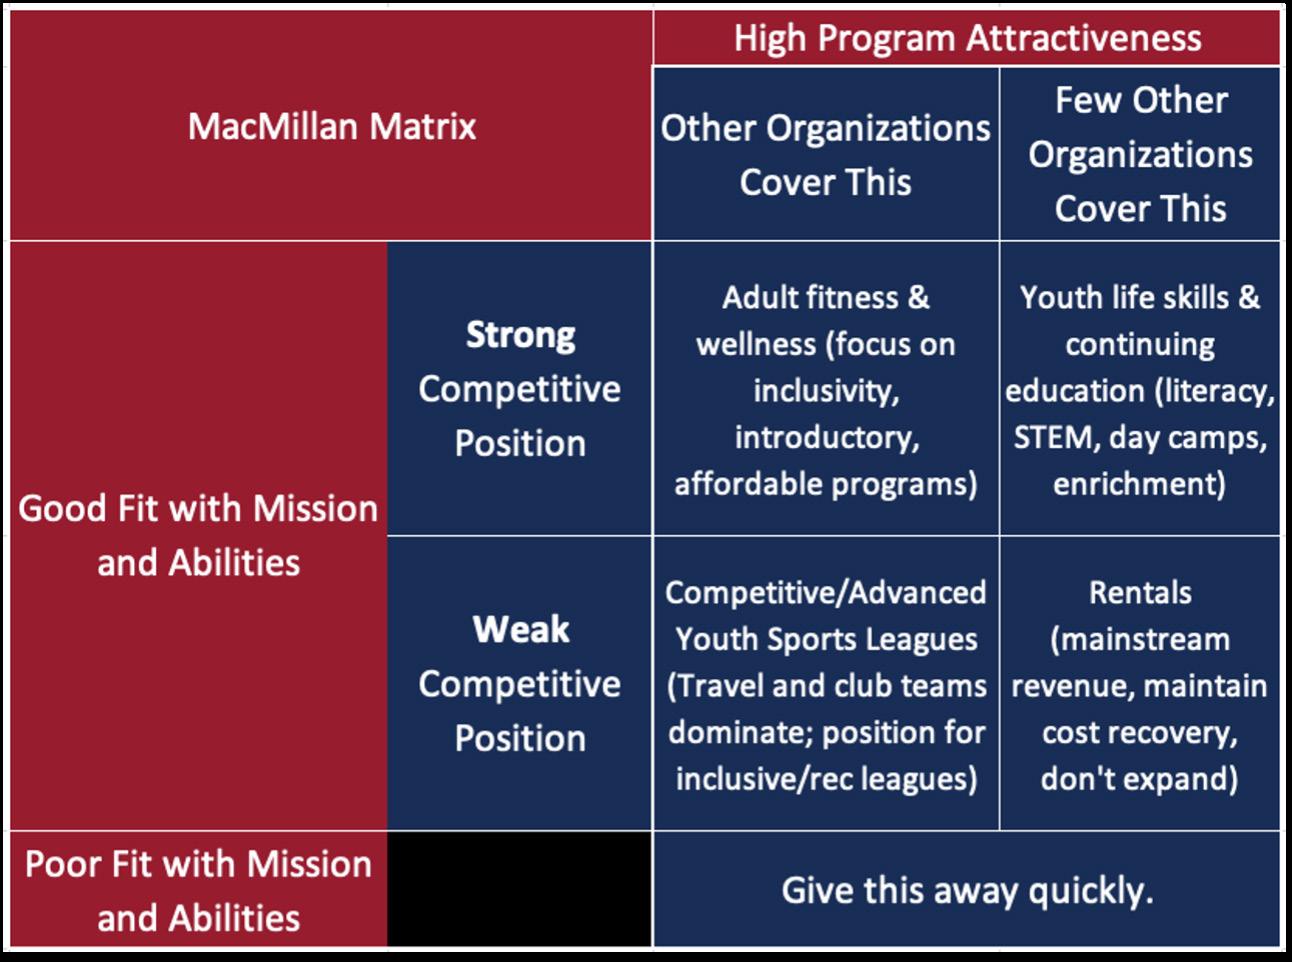
IPR and its programming will benefit from a sustained effort toward building capacity to address the limitations of space and staffing. There are five key operational areas crucial to a park and recreation department’s success.
Policy/Procedure: This involves establishing clear guidelines and protocols to achieve desired outcomes for park and recreation services, ensuring adherence to approved plans, policies, and standards.
Management: This focuses on effectively organizing, coordinating, and supervising all departmental activities to fulfill defined goals. It encompasses staff roles, responsibilities, and overall workflow.
Resources: This entails managing the department's resources, including finances, equipment, inventory, staff expertise, and information, to ensure their efficient utilization for optimal functioning.
Technology: This emphasizes leveraging technology like software, tools, and equipment to enhance efficiency in park operations. This can involve utilizing digital platforms for communication, work order tracking, or resource management.
Communications: This covers both internal and external communication strategies. It involves effectively disseminating information regarding park operations, promoting services and programs, and keeping the community informed about capital projects.
IPR can adopt several strategic approaches that help strengthen the preceding key operational areas.
• Ensure a staffing plan is established before planning additional programs. Falling short on staff will have a direct effect on program capacity and may leave some activities unsupervised or cancelled altogether.
• Consider partnering with additional community organizations to host programs. Leveraging partnerships with local schools, community and private organizations can provide access to additional volunteers and spaces for programming, which can extend the range and reach of recreational activities. Utilizing these external venues during off-peak hours or through collaborative agreements can help mitigate space constraints without significant capital investment. Also, volunteers with specific skills and interests can help fill a need for program instructors.
• The use of enhanced technology can help with staff efficiency through automated tasks and allow staff to be used in different, potentially more effective ways.
• Streamline operations such as recruitment, training, and employee management through cloud software that brings together all necessary human resources functions.
• Systems that tie together program registration and facility usage data with financial performance data, can make analysis more efficient for budgeting, and reporting with accuracy.
• Automate marketing campaigns, content creation, and audience engagement. Software that brings all marketing functions under one umbrella and that also provides real time engagement metrics can save staff a lot of time on this important recreational programming function.
• Design and manage recreational programs and events. For example, new technology can help with research and data analysis to determine participation trends to recognize adjustments or enhancements that need to be made to offerings.
• Lastly, new technology can help in counting visitors, monitoring building systems, surveilling facilities, providing security, planning building improvements, and saving energy. This can save valuable time while providing more data for informed operational decisions.
Build an efficient, front-line-focused organizational structure by streamlining internal processes, prioritizing resources for staff who directly serve residents, and aligning leadership support to strengthen day-to-day service delivery. This approach ensures that the department operates with greater clarity, responsiveness, and accountability, while putting community experience at the center of its operations.
In practice, this suggests:
• Efficiency: Reducing layers of bureaucracy, clarifying roles, and streamlining processes so staff spend less time on internal hurdles and more time serving the community.
• Front-line-focused: Prioritizing positions and support for the staff who interact directly with residents (program instructors, maintenance crews, customer service, event coordinators), ensuring they have the tools, training, and authority to deliver high-quality service.
• Organizational structure: Rebalancing or restructuring departments, divisions, or reporting lines so that leadership supports operations rather than pulling resources away from them, with clearer accountability and stronger communication channels.
In short, it is about creating a leaner, serviceoriented organization that puts communityfacing staff and resident experience at the center, while aligning management and support systems to back them up effectively.
Another way to expand capacity for additional recreation programming is through effective volunteer management and partnership strategies. Below are best practices for each.
In developing a volunteer policy, some best practices that the IPR should be aware of include:
• Involve volunteers in cross-training to expose them to various organizational functions and increase their skill. This can also increase their utility, allowing for more flexibility in making work assignments, and can increase their appreciation and understanding of the IPR.
• Ensure a Volunteer Coordinator (a designated program staff member with volunteer management responsibility) and associated staff stay fully informed about the strategic direction of the agency overall, including strategic initiatives for all divisions. Periodically identify, evaluate, or revise specific tactics the volunteer services program should undertake to support the larger organizational mission.
• A key part of maintaining the desirability of volunteerism in the agency is developing a good reward and recognition system. The consultant team recommends using tactics like those found in frequent flier programs, wherein volunteers can use their volunteer hours to obtain early registration at programs, or discounted pricing at certain programs, rentals or events, or any other department function. Identify and summarize volunteer recognition policies in a Volunteer Policy document.
• Regularly update volunteer position descriptions. Include an overview of the volunteer position lifecycle in the Volunteer Manual, including the procedure for creating a new position.
• Add end-of-lifecycle process steps to the Volunteer Manual to ensure that there is formal documentation of resignation or termination of volunteers. Also include ways to monitor and track reasons for resignation/termination and perform exit interviews with outgoing volunteers when able.
• In addition to the number of volunteers and volunteer hours, categorization and tracking volunteerism by type and extent of work, is important:
• Regular volunteers: Those volunteers whose work is continuous, provided their work performance is satisfactory and there is a continuing need for their services.
• Special event volunteers: Volunteers who help with a particular event with no expectation that they will return after the event is complete.
• Episodic volunteers: Volunteers who help with a particular project type on a recurring or irregular basis with no expectation that they will return for other duties.
• Volunteer interns: Volunteers who have committed to work for the agency to fulfill a specific higher-level educational learning requirement.
• Community service volunteers: Volunteers who are volunteering over a specified period to fulfill a community service requirement.
IPR should encourage employees to volunteer in the community. Exposure of staff to the community in different roles (including those not related to parks and recreation) will raise awareness of the agency and its volunteer program. It also helps staff understand the role and expectations of a volunteer if they can experience it for themselves.
The recommended policies and practices for public/private partnerships that may include businesses, private groups, private associations, or individuals who desire to make a profit from use of the IPR’s facilities or programs are detailed below. These can also apply to partnerships where a private party wishes to develop a facility on park property, to provide a service on publicly owned property, or who has a contract with the agency to provide a task or service on the agency’s behalf at public facilities. These unique partnership principles are as follows:
• Upon entering into an agreement with a private business, group, association or individual, the IPR staff and political leadership must recognize that they must allow the private entity to meet their financial objectives within reasonable parameters that protect the mission, goals and integrity of the IPR.
• As an outcome of the partnership, the IPR must receive a designated fee that may include a percentage of gross revenue dollars less sales tax on a regular basis, as outlined in the contract agreement.
• The working agreement of the partnership must establish a set of measurable outcomes to be achieved, as well as the tracking method of how those outcomes will be monitored by the agency. The outcomes will include standards of quality, financial reports, customer satisfaction, payments to the agency, and overall coordination with IPR for the services rendered.
• Depending on the level of investment made by the private contractor, the partnership agreement can be limited to months, a year or multiple years.
• If applicable, the private contractor will provide a working management plan annually that they will follow to ensure the outcomes desired by the IPR. The management plan can and will be negotiated, if necessary. Monitoring the management plan will be the responsibility of both partners. The agency must allow the contractor to operate freely in their best interest, if the outcomes are achieved, and the terms of the partnership agreement are adhered to.
• The private contractor cannot lobby agency advisory or governing boards for renewal of a contract. Any such action will be cause for termination. All negotiations must be with the IPR Director or their designee.
• The agency has the right to advertise for private contracted partnership services or negotiate on an individual basis with a bid process based on the professional level of the service to be provided.
• If conflicts arise between both partners, the highest-ranking officers from both sides will try to resolve the issue before going to each partner’s legal counsels. If none can be achieved, the partnership shall be dissolved.
IPR currently has a strong network of recreation program partners. Therefore, the following recommendations are both an overview of existing partnership opportunities available to the IPR, as well as a suggested approach to organizing partnership pursuits. This is not an exhaustive list of all potential partnerships that can be developed, but this list can be used as a reference tool for the agency to develop its own priorities in partnership development. The following five areas of focus are recommended:
1. Operational Partners: Other entities and organizations that can support the efforts of the IPR to maintain facilities and assets, promote amenities and park usage, support site needs, provide programs and events, and/or maintain the integrity of natural/cultural resources through in-kind labor, equipment, or materials.
2. Vendor Partners: Service providers and/or contractors that can gain brand association and notoriety as a preferred vendor or supporter of the IPR in exchange for reduced rates, services, or some other agreed upon benefit.
3. Service Partners: Nonprofit organizations and/or friends’ groups that support the efforts of the agency to provide programs and events, and/or serve specific constituents in the community collaboratively.
4. Co-Branding Partners: Private, for-profit organizations that can gain brand association and notoriety as a supporter of the IPR in exchange for sponsorship or co-branded programs, events, marketing and promotional campaigns, and/or advertising opportunities.
5. Resource Development Partners: A private, nonprofit organization with the primary purpose to leverage private sector resources, grants, other public funding opportunities, and resources from individuals and groups within the community to support the goals and objectives of the agency on mutually agreed strategic initiatives.
All partnerships developed and maintained by the IPR should adhere to common policy requirements. These include:
• Each partner will meet with or report to the IPR staff on a regular basis to plan and share activity-based costs and equity invested.
• Partners will establish measurable outcomes and work through key issues to focus on for the coming year to meet the desired outcomes.
• Each partner will focus on meeting a balance of equity agreed to and track investment costs accordingly.
• Measurable outcomes will be reviewed quarterly and shared with each partner, with adjustments made as needed.
• A working partnership agreement will be developed and monitored together on a quarterly or as-needed basis.
• Each partner will assign a liaison to serve each partnership agency for communication and planning purposes.
Performance measures are vital gauges for parks and recreation programs. They cut through guesswork, revealing what truly resonates with the community. For example, participation numbers paint a clear picture of program popularity, while satisfaction surveys illuminate areas for improvement with service delivery. By tracking outcomes linked to core programming, IPR can pinpoint their programs' impact and justify their value to stakeholders. Ultimately, performance measures guide data-driven decisions, ensuring resources are directed toward programs that bring the most benefit to the community.
For recreation staff and IPR leadership, key performance indicators (“KPIs”) foster accountability and transparency, facilitating a clear understanding of individual and team contributions towards IPR goals. Regular monitoring and reporting on KPIs create a culture of continuous improvement and performance excellence. Staff can align their efforts with strategic priorities, focusing on initiatives that yield the highest community benefits. Additionally, KPIs enable leadership to recognize and reward outstanding performance, promote professional development, and cultivate a motivated workforce dedicated to enhancing the quality of life of the community through exceptional recreation programming.
Human resource standards are crucial for park and recreation programs because they ensure qualified, trained staff. This means recreation programs are led by competent instructors who can deliver safe and effective activities. Standards also promote fair treatment of staff, fostering a positive work environment that attracts and retains skilled employees. Ultimately, strong HR practices underpin successful recreation programs, benefiting both staff and the community they serve.
Specific standards that were analyzed, such as training and performance reviews, contribute to this goal. For example, a variety of training courses ensures staff have the wide range of skills and knowledge necessary to lead programs effectively, while performance reviews help identify areas for improvement and promote accountability toward continuous improvement and IPR goals.
For instance, by understanding staff strengths and areas for improvement, IPR can tailor training and professional development to address specific needs within recreation programming. Continued learning is one of the main drivers for staff motivation and a positive work culture. Also, encouraging open communication between staff and management will help ensure constructive feedback on employee performance is directly applied to program planning, execution, and customer services.
Additionally, performing regular quality assurance observations of contracted programs ensures that these instructors align with IPR expectations and standards for community recreation.
Performance evaluations and quality assurance observations are in and of themselves time and resource intensive requirements. Further, they must be completed by senior staff or director level leadership. This requirement should be planned and accounted for accordingly in workload assessments and staffing. As the current IPR leadership staff is at capacity, additional staffing should be explored to free up leadership to fulfill expert level tasks such as this.
Enhance customer service and resident experience by building a culture of hospitality and accountability across all staff levels.
Strategies:
• Training & Standards: Implement ongoing customer service training focused on hospitality, inclusivity, and conflict resolution; establish clear service standards that staff are expected to meet.
• Empowerment: Provide front-line staff with the tools, information, and authority needed to resolve issues quickly and positively without unnecessary escalation.
• Feedback Loops: Create easy ways for residents to share feedback, both online and in person, and ensure that input is reviewed regularly to improve services and recognize staff successes.
• Visibility & Presence: Increase positive staff visibility in parks and facilities through ambassador programs, greeters, or on-site staff presence to create welcoming environments.
This shift not only strengthens trust and satisfaction among residents but also builds community pride and reinforces the value of Independence Parks and Recreation as a vital public service.
Pricing strategies are one mechanism that IPR can use to influence cost recovery and can help balance revenue generation with accessible pricing, allowing the Department to offset the added costs of expanding programming by adding staffing or third-party contractors without overwhelming existing staff resources. IPR currently uses a mixture of pricing strategies including pricing by Cost Recovery Goals but these are not consistent across the various core program areas. The most consistently used strategies include competition, by cost recovery goals, and by customer’s ability to pay.
Moving forward, IPR should consider researching any untapped pricing strategies and the impact they could have on cost recovery goals. For instance, IPR could build their marketing budget by adding a marketing fee that is built into the overall fee for those programs that require more extensive promotions. This fee can eventually help to offset the costs for supplies, services, and personnel required for marketing and promotions.
Also, differential pricing such as weekday/ weekend and prime time/non-prime time pricing could incentivize usage during offpeak times with lower prices and maximize revenue generation during periods of high demand. While this strategy is already being utilized by some core program areas, it is not consistently utilized across all.
These other pricing strategies can help balance revenue generation with accessible pricing, allowing IPR to expand programming without overwhelming existing staff resources.
• Offering different prices based on age (e.g., youth, adults, seniors) can encourage participation across demographics. Seniors may receive lower fees, which can boost overall participation, while certain youth and adult programs that are in higher demand typically have higher rates and can generate more revenue to subsidize other services.
• Providing discounts for group registrations (e.g., sports teams, classes) can encourage larger participation with minimal marketing or outreach, reducing per-user administrative efforts while increasing total revenue.
• Setting fees in line with local competition ensures that IPR remains competitive. This can maximize participation while aligning fees with what people are willing to pay, ensuring services are not being undervalued, thus increasing revenue to reinvest in staff and other resources.
IPR seeks to ensure that all members of the community can participate in recreation programs and activities, regardless of their financial circumstances.
Fundamental to increasing program access is providing and supporting programs and amenities that serve all ages, abilities, and interests in the community. Following the previously outlined program strategy objectives will help to better ensure programs are evenly distributed.
Establishing an IPR scholarship fund for discounted recreational programming and facility access can significantly enhance access to recreation offerings for the Independence community. Further, IPR should consider including the following measures in a scholarship policy:
• Identify specific populations in the city through demographic data to understand their needs and financial barriers. Where appropriate, tailor scholarship programming to specific populations such as youth, seniors, as well as low-income families.
• Provide income-based discounted rates for residents facing financial limitations. U.S. Federal Poverty Guidelines can be used to determine the appropriate percentage of fee discounts.
• Provide discounts for services for lowincome residents.
• Offer alternative payment options and alternative payment methods to accommodate different financial circumstances.
• Implement community outreach and education with residents to raise awareness of available programs and services and help with accessing services.
• Ensure that measures are implemented to guarantee the confidentiality of all applicant information.
• Ensure that partnerships with private or non-profit organizations that use facilities and do not have customers that qualify for need based assistance – such as private, non-profit sports associations- cover the full costs of park use accordingly.
Also, leveraging the resources of a non-profit or establishing a Park Foundation can create a conducive form of community support and philanthropic endeavors. IPR can tap into resources beyond its operational budget. A foundation can spearhead fundraising efforts, seeking donations from local businesses, individuals, and organizations committed to promoting wellness and community inclusivity. These contributions can be restricted funds specifically for a scholarship fund, ensuring that financial barriers do not hinder access to IPR offerings. Additionally, the foundation can manage the allocation and distribution of scholarships, ensuring transparency and fairness in the selection process.
IPR’s current implementation of cost recovery is inconsistent across all services. Cost recovery targets should be identified for each core program area at a minimum, and for specific programs or events when realistic. The previously identified core program areas would serve as an effective breakdown for tracking cost recovery metrics including administrative costs. Theoretically, staff should review how programs are grouped for similar cost recovery and subsidy goals to determine if current practices still meet management outcomes.
The following section provides more details on steps 2 & 3.
Determining cost recovery performance and using it to make informed pricing decisions involves a three-step process:
1. Classify all programs and services based on the public or private benefit they provide (as completed in the previous section).
2. Conduct a Cost-of-Service Analysis to calculate the full cost of each program.
3. Establish a cost recovery percentage, through IPR policy, for each program or program type based on the outcomes of the previous two steps and adjust program prices accordingly.
To develop specific cost recovery targets, full cost of accounting needs to be created for each class or program that accurately calculates direct and indirect costs. Cost recovery goals are established once these numbers are in place, and IPR’s program staff should be trained on this process. A Cost-of-Service Analysis should be conducted on each program, or program type, that accurately calculates direct (i.e., program-specific) and indirect (i.e., comprehensive, including administrative overhead) costs. Completing a Cost-of-Service Analysis not only helps determine the true and full cost of offering a program, but it also provides information that can be used to price programs based upon accurate delivery costs.
The methodology for determining the total Cost-of-Service involves calculating the total cost for the activity, program, or service, then calculating the total revenue earned for that activity. Costs (and revenue) can also be derived on a per unit basis. Program or activity units may include:
• Number of participants
• Number of tasks performed
• Number of consumable units
• Number of service calls
• Number of events
• Required time for offering program/service
Agencies use Cost-of-Service Analysis to determine what financial resources are required to provide specific programs at specific levels of service. Results are used to determine and track cost recovery as well as to benchmark different programs provided by the agency between one another. Cost recovery goals are established once Cost-ofService totals have been calculated. Program staff should be trained in the process of conducting a Cost-of-Service Analysis and the process should be undertaken on a regular basis.

PERSONNEL COSTS
BUILDING COSTS
VEHICLE COSTS CONTRACTED SERVICES
EQUIPMENT COSTS
INDIRECT COSTS
SUPPLY & MATERIAL COSTS
ADMINISTRATIVE COST ALLOCATION DEBT SERVICE COSTS
Overall, the department should rebalance cost recovery expectations by program area, ensuring that high-performing areas help sustain mission-driven but lower-return services. A transparent cost recovery policy will also build community understanding of where subsidies are intentional and where revenues are maximized.
Below are some strategic recommendations for ways in which IPR can improve their cost recovery performance, by core program area.
Cost recovery targets should reflect the degree to which a program provides a public versus individual good. Programs providing public benefits (i.e., Essential Services) should be subsidized more by IPR; programs providing individual benefits (i.e., Important or Value-Added Services) should seek to recover costs and/or generate revenue for other services.
The graphic below outlines potential cost recovery targets for IPR services based on how they are classified.
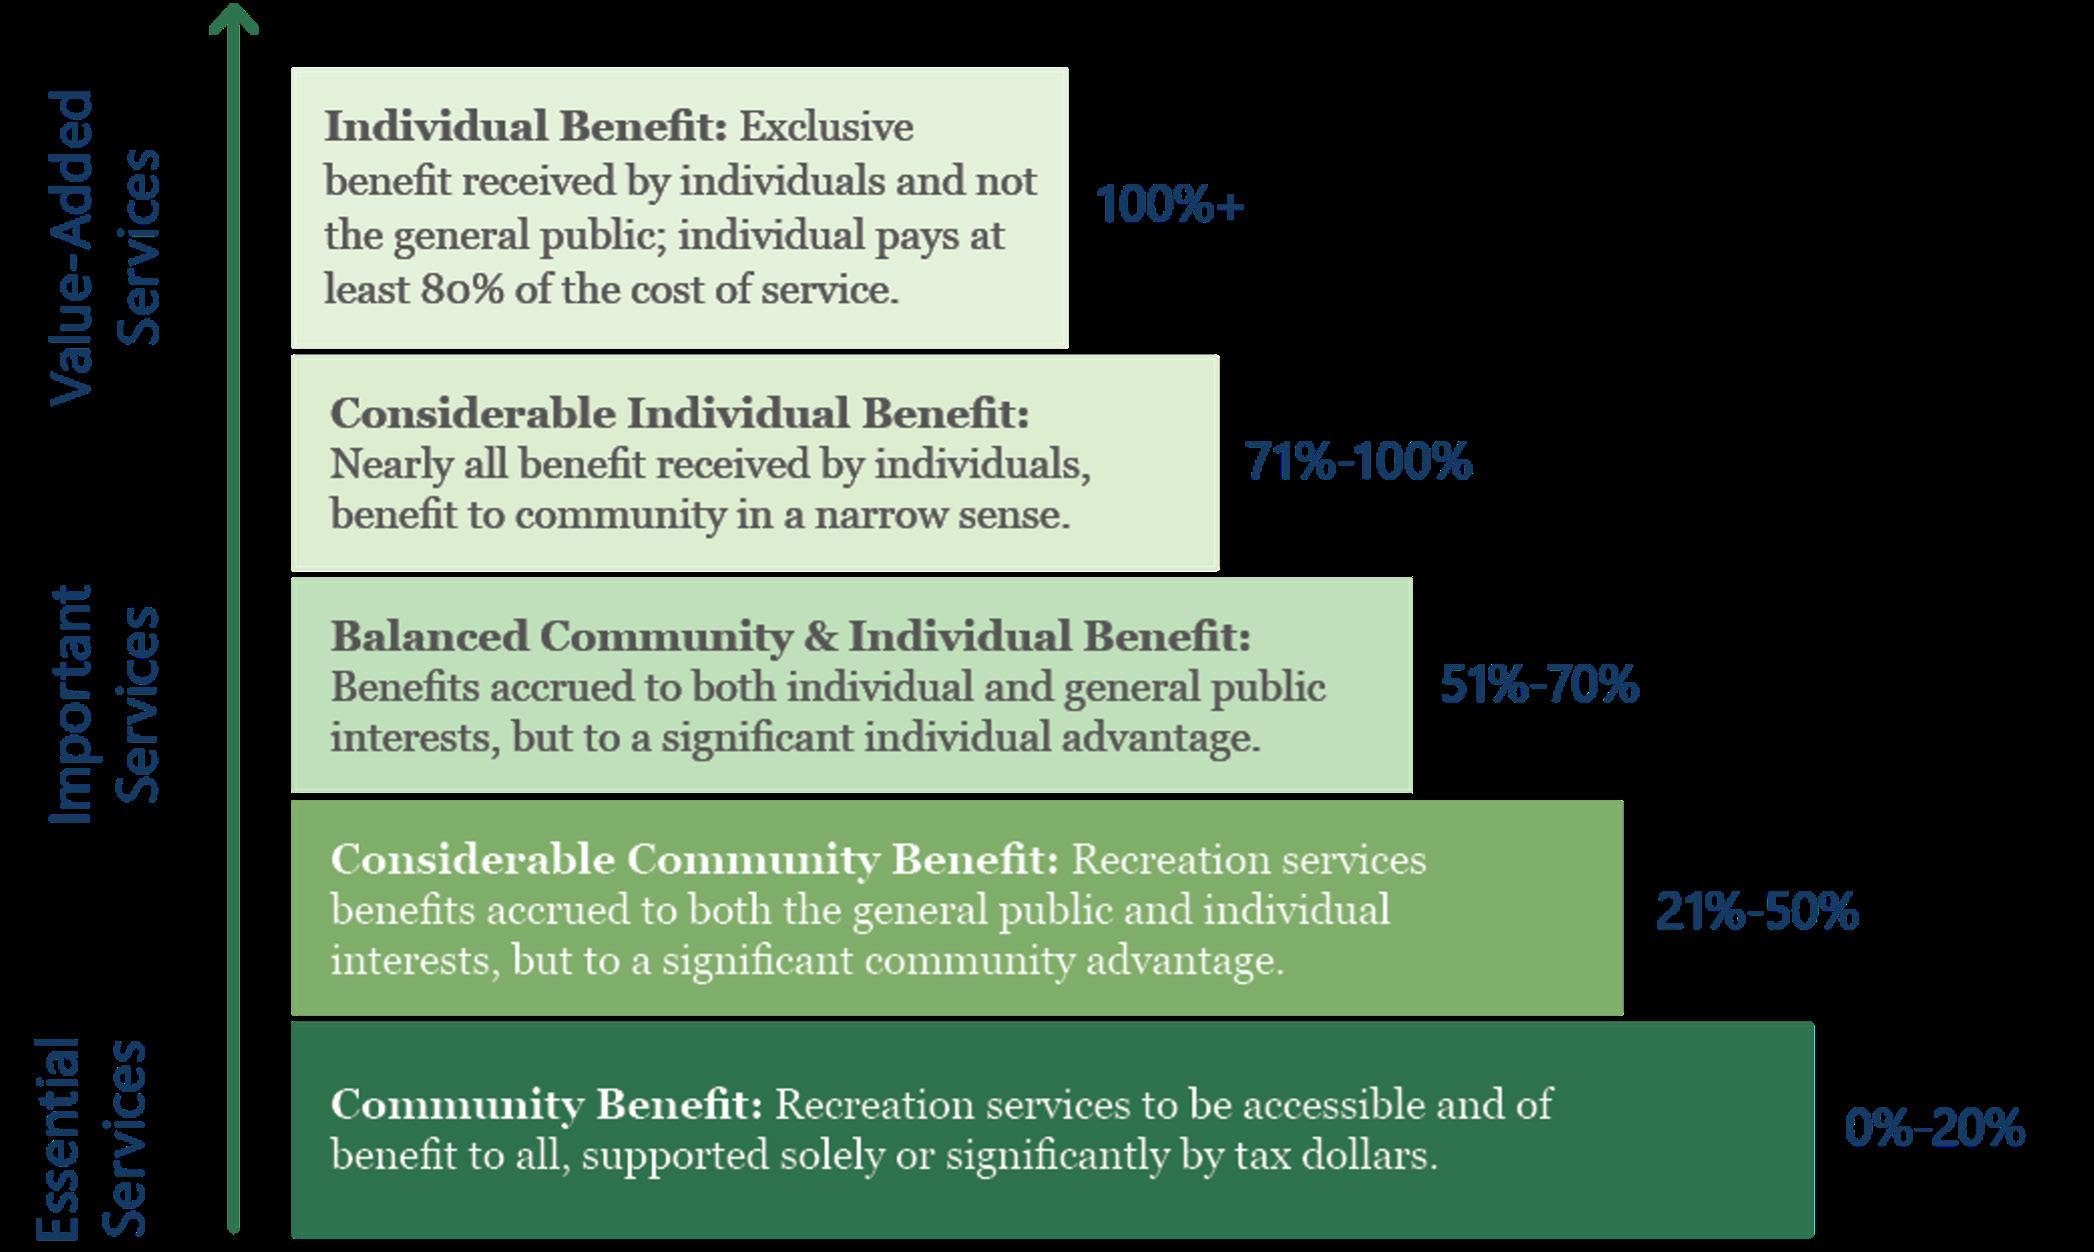
FIGURE 39 RECOMMENDED COST RECOVERY TARGETS BASED ON SERVICE CLASSIFICATIONS
Finally, the table below outlines strategic recommendations for pricing and cost recovery for the new core program areas as described in section 4.2.7.
Core Program Area
Aquatics
Arts & Culture
Community & Special Events
Continuing Education and Life Skills
Fitness & Wellness
Nature Education & Outdoor Adventure
Youth & Family Out of School Enrichment
Sports
Strategic Recommendations
Rebuild aquatics as a core program area for Independence by maintaining interim access to water-based programming through partnerships while planning a long-term aquatic programming solution that supports year-round community needs.
Introduce premium/ticketed events to capture additional earned revenue.
Continue leveraging sponsorships, vendor fees, and partnerships.
Expand programs to include skill progression and update program pricing and cost recovery goals accordingly.
Adjust pricing structures for classes based on skill level; expand revenue-generating programs (personal training, small-group fitness); explore partnerships with health providers/employers to subsidize access.
Expand fee-based programs (guided hikes, nature camps, workshops); increase rentals in natural areas; pursue conservation grants to offset costs while maintaining affordability.
Define recovery targets (e.g., 75-100%); charge modest fees for workforce/skill-based programs; subsidize foundational youth offerings through school, library, and employer partnerships.
Focus on instructional sports programming and lower fees for introductory sports programs. Leagues should align with market rate but provide scholarship opportunities.
Effective marketing and communication are essential to the success of recreation programs. They not only drive participation but also help build community awareness, foster trust, and promote the value of services offered. Analyzing these practices helps ensure that messaging strategies are efficient, inclusive, and aligned with both community needs and IPR’s mission. Strategic communication can amplify the impact of programming, strengthen partnerships, and increase customer satisfaction and engagement.
IPR has a solid foundation in traditional outreach and print-based communication, but the department should modernize and expand its digital strategies to better reach today’s residents. Streamlining program information into a centralized, easy-to-navigate online hub, increasing the frequency and quality of social media content, and restoring broader school-based outreach would significantly improve visibility. A unified marketing strategy, consistent across sites, integrated across channels, and supported by both print and digital, will help the department build stronger community connections, expand participation, and reinforce its identity as a resident-first service provider.
• Multi-channel communication: Use of newsletters (Palmer Post), flyers, printed calendars, and online postings ensures information reaches different demographics.
• Palmer Post newsletter: Distributed six times per year with both mailed and on-site copies, providing consistent communication with seniors and engaged community members.
• Event visibility: Flyers, occasionally boosted social media posts, and paid advertising for craft and special events provide promotional lift for specific programs.
• Recreation catalogue revival: Plans to bring back a recreation catalog will improve visibility by consolidating offerings and highlighting seasonal opportunities.
• Partnership-based advertising: Advertising through Ft. Osage Schools maintains some access to families despite the reduction in school-based promotion.
• Inconsistent digital presence: Social media activity is limited to occasional posts, with low engagement and reach; more consistent, interactive content is needed.
• Website navigation challenges: Residents struggle to find program information in one central, user-friendly location, reducing accessibility.
• Fragmented marketing approach: Marketing plans vary by site, leading to inconsistencies in tone, brand identity, and visibility across the system.
• Loss of school system advertising: Discontinuing ads in Independence schools reduces a key communication channel to families.
• Limited frequency of outreach: With Palmer Post only going out six times a year, many residents may miss time-sensitive opportunities.
• Past channels not leveraged: Advertising through utility bills, once a strong outreach tool, is no longer used, removing a direct way to reach households.
According to the Needs Assessment Survey, Social Media, the City Website, and the neighborhood mailer are the current methods by which people are learning about program and facility offerings. Meanwhile, the three ways they would most prefer are social media, neighborhood mailer, and emails from the department. The table below outlines several recommendations that can enhance program marketing in all the primary marketing areas.
Website & Online Calendar
Email & Mobile Alerts
Social Media (Facebook/Instagram)
Print (Palmer Post, Flyers, Catalog)
Recreation Catalog (Seasonal)
School-Based Advertising
Utility Bill Inserts (Past)
Paid Media & Partnerships
Hosts monthly calendars, menus, and class schedules; central location for program info
Provides timely updates for events and registrations (through website and social posts)
Occasional boosted posts for events and classes; broad potential reach
Palmer Post newsletter well-established; flyers effective for events; catalog relaunch will provide comprehensive overview
Returning as a comprehensive program guide for residents
Ft. Osage partnership still provides youth/ family outreach
Historically effective direct-to-household outreach
Used for craft events; past advertising in community venues
Redesign for easier navigation; add searchable filters by program type/age; ensure mobile optimization
Develop an opt-in e-newsletter; expand reach beyond Palmer Post to younger demographics
Increase posting frequency; use tailored content per platform; add interactive features like polls and stories
Expand Palmer Post digital distribution; include QR codes on flyers; integrate storytelling into catalog (staff highlights, impact stories)
Ensure both print and digital formats; distribute through schools, libraries, and community partners
Re-establish presence in Independence schools (explore non-paid content partnerships)
Reintroduce quarterly seasonal updates to reach all households
Expand paid promotion to high-demand programs; consider partnerships with local influencers, businesses, and media outlets
As IPR looks to make future enhancements to the website and overall user experience, staff should consider implementing accessibility guidelines and new technology to improve usability. Overall user experience looks at several factors including accessibility, customer experience, and usability. IPR should also regularly analyze website metrics that track user behavior and can identify areas for overall improvement.
In addition, as a part of overall updates to Title II of the Americans with Disabilities Act (“ADA”), the Department of Justice released updated regulations for all state and local government web and mobile content to meet Web Content Accessibility Guidelines (“WCAG”) Version 2.1, Levels A and AA. IPR should work with City communications and legal representatives to understand full digital compliance requirements for content, design, programming, and procedural updates that are necessary.
IPR should continue to utilize website analytics to track user behavior and regularly identify other areas for improvement.
Additionally, to enhance the customer experience and streamline recreation program administration, IPR should invest in improved software with automation features for repetitive tasks like program setup, pricing updates, and roster and waitlist management. Automation could also simplify communication with participants through customizable online forms, reminders, and confirmation emails. Using a single, integrated software platform is essential to avoid customer confusion and encourage program registration.
However, while automation reduces administrative time, staff oversight remains necessary. Designating one staff member to manage and optimize IPR’s software will help maximize the technology's potential, though additional staffing may be required to support these improvements.
Social media strategies play a critical role in telling the story of a recreation agency. The right content can increase program participation and overall community awareness of IPR services. IPR currently uses several platforms to promote programs and events, update the community on park planning efforts, and highlight staff and volunteer initiatives.
While this will be a challenge due to current staffing levels, IPR should work with city staff and partners to continue a focus on high-quality photos and videos that highlight parks, facilities, programs, and their users. IPR should consider online events and challenges, live video, and partnerships with local influencers to drive more traffic to its social media channels. Additionally, maintaining a consistent posting schedule can ensure that fresh content is always being pushed out to the community. A periodic social media audit is recommended to provide IPR with a sound understanding on how social media impacts its programming. The audit can also show insights on how IPR is engaging with their audiences and how effective the platforms are at raising awareness of recreation services.
There are several components and benefits to a social media audit that are highlighted below.
• Take inventory of the platforms that are in use and whether you need them by developing Key Performance Indicators.
• Define goals for each platform to ensure multiple platforms are not pushing out the same type of content.
• Ensure branding and messaging are consistent across all platforms.
• Understand how to use social media analytics to determine where your social media traffic is coming from. Google analytics is another tool to inform IPR about website and social media users.
• Understand the demographics and preferences on content type of IPR social media followers and tailor the messaging to the right audience.
• Identify the top performing social media posts and build on this success with future social media campaigns.
• Create a marketing plan aligned with IPR goals and annually update marketing strategies to reflect community needs. Focus on high-quality word-of-mouth, social media, and website enhancements, using inclusive and accessible communication methods.
• Enhance the online user experience by streamlining navigation and automate tasks to enhance customer satisfaction and operational efficiency.
• Ensure consistent branding and messaging across all platforms, regularly assess unmet community needs, and educate staff on marketing principles to boost program participation and community engagement.
The best practice is to have a specific recreation marketing plan that is in line with IPR goals and objectives in communications. A marketing plan must be built upon and integrated with supporting plans and directly coordinate with organization vision and priorities. The plan should also provide specific guidance as to how IPR’s identity and brand is to be consistently portrayed across the multiple methods and deliverables used for communication. Below are the essential pieces to an effective marketing plan:
• Know the audience: Understand the community demographics and who IPR is trying to reach along with their needs and interests and how they will best receive messaging. IPR should also regularly assess the unmet needs or gaps in recreation services throughout the community.
• Define the goals that will drive specific marketing strategies: Some goals can include increasing program participation, boosting IPR brand awareness, or improving community engagement for more informed decision making.
• Create the right message: Focus on the benefits and positive outcomes of the program. Emphasize the factors that make the program or service stand out from others in the community.
• Use the right tools and channels: Depending on the demographic and area, some channels may not resonate with community members. For instance, traditional media can reach a wider audience, but it may not be the main source for IPR’s target market. Additionally, partnerships with other community organizations can help IPR get messaging to the right audience by sharing resources. By ensuring the right method is used, IPR will maximize resources for marketing and communications and see positive results with engagement.
• Monitor goals and strategies regularly: IPR should build in methods to measure the impact of the marketing plan and specific strategies to ensure necessary adjustments can be made with communications.
Currently, IPR has two full time communications position that oversee parks communications and most of the marketing for recreation programming falls on the limited parks and recreation staffing. Enhancing marketing efforts will be a challenge with minimal staff time to allocate to the responsibilities. There are some approaches that will help maximize staff time.
• Identify the programs that bring the most value or have the highest participation and prioritize marketing efforts for these.
• Automate social media posts with low-cost content management platforms, such as Hootsuite.
• Use email marketing tools to automate regular program update emails to IPR’s customer database.
• Collaborate with local civic organizations to share marketing resources such as print materials or distribution lists.
• Use online design tools that can create professional-looking marketing materials with minimal design experience and in a fraction of the time it would take a printing or design vendor.
• Use larger programs and events or popular public spaces as an opportunity to crosspromote programs and events.
Educating program staff on marketing principles can lead to increased awareness of services and overall participation, a stronger connection with the community, and enhanced program partnerships. Simply put, marketing training empowers program staff to take more ownership over their programs. This is a time and resource intensive activity and should be planned accordingly in staffing projections.
IPR serves as a vital community asset, offering a diverse range of programs that promote health, wellness, cultural enrichment, and social connection. This assessment highlights many strengths, including strong senior programming, cost-effective services compared to peer providers, and programming that reflects community values. However, challenges remain in aligning offerings with shifting demographics, addressing facility needs, closing service gaps for underserved groups, and strengthening operational capacity.
Demographic trends point to simultaneous growth in youth and senior populations, reinforcing the need for expanded intergenerational, family, and wellness-oriented services. At the same time, a decline in young adults underscores the importance of flexible, socially relevant programming that retains engagement from this age group. Program and facility access is another critical issue, particularly for east-side neighborhoods, residents with special needs, and families with limited financial resources. Additionally, IPR’s current capacity is stretched due to aging infrastructure, staffing limitations, and inconsistent pricing policies, making sustainability and innovation difficult without strategic reinvestment.
Looking ahead, IPR must focus on modernizing facilities, enhancing access to core programs, building new partnerships, and implementing consistent quality assurance standards. By shifting from a quantity-driven model to one that emphasizes quality, sustainability, and alignment with community priorities, IPR can strengthen resident trust, broaden participation, and ensure its long-term role as a cornerstone of community well-being and pride.
By addressing these priorities through the recreation programming goals and actions outlined in section 6.1.5, IPR can foster a culture of continuous improvement, align program staff efforts with strategic priorities, and ultimately enhance the quality of program offerings for the community.
4.3.1
The operational review examines the Parks and Recreation system and services of current levels of service, maintenance, and staffing in relation to present goals, objectives, and directives. Findings from this analysis will be used in developing a vision to provide recommendations related to level of programs, services, maintenance, and staffing for an organizational alignment with community needs, future goals, and desired outcomes.
The process of the review began with a site tour and data review followed by a workshop with Independence staff representing all areas of services to obtain context and insights from the employees’ perspective.
The objective is to analyze and provide guidance on current practices, future staffing needs, improved operational efficiencies, policy development, technology improvements and marketing/ communication opportunities. This will help position Independence better to enhance internal operations and successfully implement the Plan.
A review of existing plans, policies and standards/procedures found that there are several areas within operations in which documented practices are needed. As part of the analysis, additional recommended plans, policies and standards that will assist the Department in achieving the outcomes identified from the planning process were identified.
The sections below detail the analysis of current operational and maintenance practices. The analysis is centered on sustainability, efficiency, and organizational alignment in the five areas of operation that can build capacity and effectiveness. The analysis was a high-level review that identifies the current internal operating strengths, challenges, and opportunities. Findings from this analysis are used to determine priorities for parks and recreation facilities and programming. Recommendations will be based on future goals, objectives, and desired outcomes from the plan to ensure Independence is positioned well to continue operations and implement the overall Master Plan.
Independence staff were asked to take an inventory of the plans, policies and procedures that were in place at the time of the analysis. The table below shows the recommended best practices, Independence’s practice, and where there is or is not alignment with essential plans, policies, and standards.
Business Plans for facilities and operations No
Develop business plans for major facilities and program areas to guide cost recovery, staffing, and long-term sustainability. Recreation
Marketing Plan No
Site Development Plans No
Maintenance Management Plan No
Trails and Greenways Plan
Emergency Action Plan
Park Rules & Regulations Yes – City Code (needs updates)
Land Acquisition & Use Policy Yes – Donation Policy
Land Management Policy No
Purchasing Policy Yes – Finance Dept Procurement
Update the recreation plan to reflect current trends, community needs, and program lifecycle assessments.
Create a marketing and communications plan to strengthen branding, outreach, and program participation.
Implement site-specific development plans to guide capital investments, phasing, and alignment with community priorities.
Establish a formal maintenance management plan with standards, staffing, and cost estimates to improve consistency across parks.
Update and expand trail/greenway plans to align with current connectivity, mobility, and recreation demand.
Ensure department-specific emergency procedures are clearly outlined and coordinated with citywide emergency management.
Update to address modern issues (e.g., metal detecting, drones, e-bikes) and ensure consistent enforcement.
Expand policy to include acquisition priorities, easements, conservation partnerships, and appraisal requirements.
Develop a policy to guide natural resource stewardship, invasive species control, and conservation practices.
Ensure Parks-specific purchasing thresholds and needs (seasonal, urgent repairs) are accommodated.
Pricing Policy No
Refund Policy Yes – only for rentals
Cost Recovery Policy No
Facility Use Policy Yes – but not standardized
Partnership Policy No – case by case
Sponsorship Policy No
Volunteer Policy No
Special Event Policy Yes – Citywide Permit
Memorial Policy Yes – Tree & Bench Program (needs updates)
Communications Policy Yes – City Communications Team
Naming Rights Policy No
Procedures/Standards
Develop a formal Cost Recovery & Pricing Philosophy tied to community benefit tiers.
Broaden to cover all programs and memberships for fairness and transparency.
Develop a cost recovery framework linked to pricing policy to balance affordability and sustainability.
Standardize across all facilities to improve fairness, transparency, and customer experience.
Create a standardized partnership framework with criteria for decision-making, risk-sharing, and performance evaluation.
Develop sponsorship guidelines and inventory to support funding diversification.
Create a structured volunteer program with orientation, risk management, and recognition practices.
Expand into a Parks-specific event policy with cost recovery, staffing, and risk guidelines.
Add language on long-term maintenance, removal, and replacement responsibilities.
Tailor a Parks-specific addendum for program promotion, branding, and lead time management.
Create a policy to leverage sponsorship and philanthropy opportunities while ensuring consistency and transparency.
Best Practice Independence Implementation Recommendations / Assessment
Recreation Program Development Standards No
Recreation Program Standards No
Employee Handbook/ Manual No – only partial for attendants
Maintenance Standards No
Facility Standards No
Marketing Standards & Brand Style Guide No
Office Standard Operating Procedures (SOPs) No
Marketing Procedures No
Performance Evaluation Procedure Yes – Citywide
Onboarding Procedure Yes – City HR
Training Standards No
Customer Print Materials No
Establish formal criteria for new program design, evaluation, and lifecycle management.
Implement quality standards for delivery, instructor ratios, accessibility, and evaluation.
Develop a comprehensive manual for all staff types (FT, PT, seasonal).
Develop clear maintenance standards by asset type (playgrounds, trails, athletic fields, restrooms) for consistency.
Establish facility standards for safety, accessibility, and service levels.
Create a style guide for branding, print, and digital communication.
Standardize office procedures to improve efficiency and consistency across staff.
Develop processes for program promotion, lead times, digital vs. print balance.
Ensure Parks staff evaluations include unique performance metrics tied to recreation outcomes.
Add Parks-specific onboarding elements (customer service, safety, community engagement).
Create an annual training calendar for certifications, customer service, and technical skills.
Establish guidelines for program guides, brochures, and signage. TABLE 17 PLANS, POLICIES, AND PROCEDURES
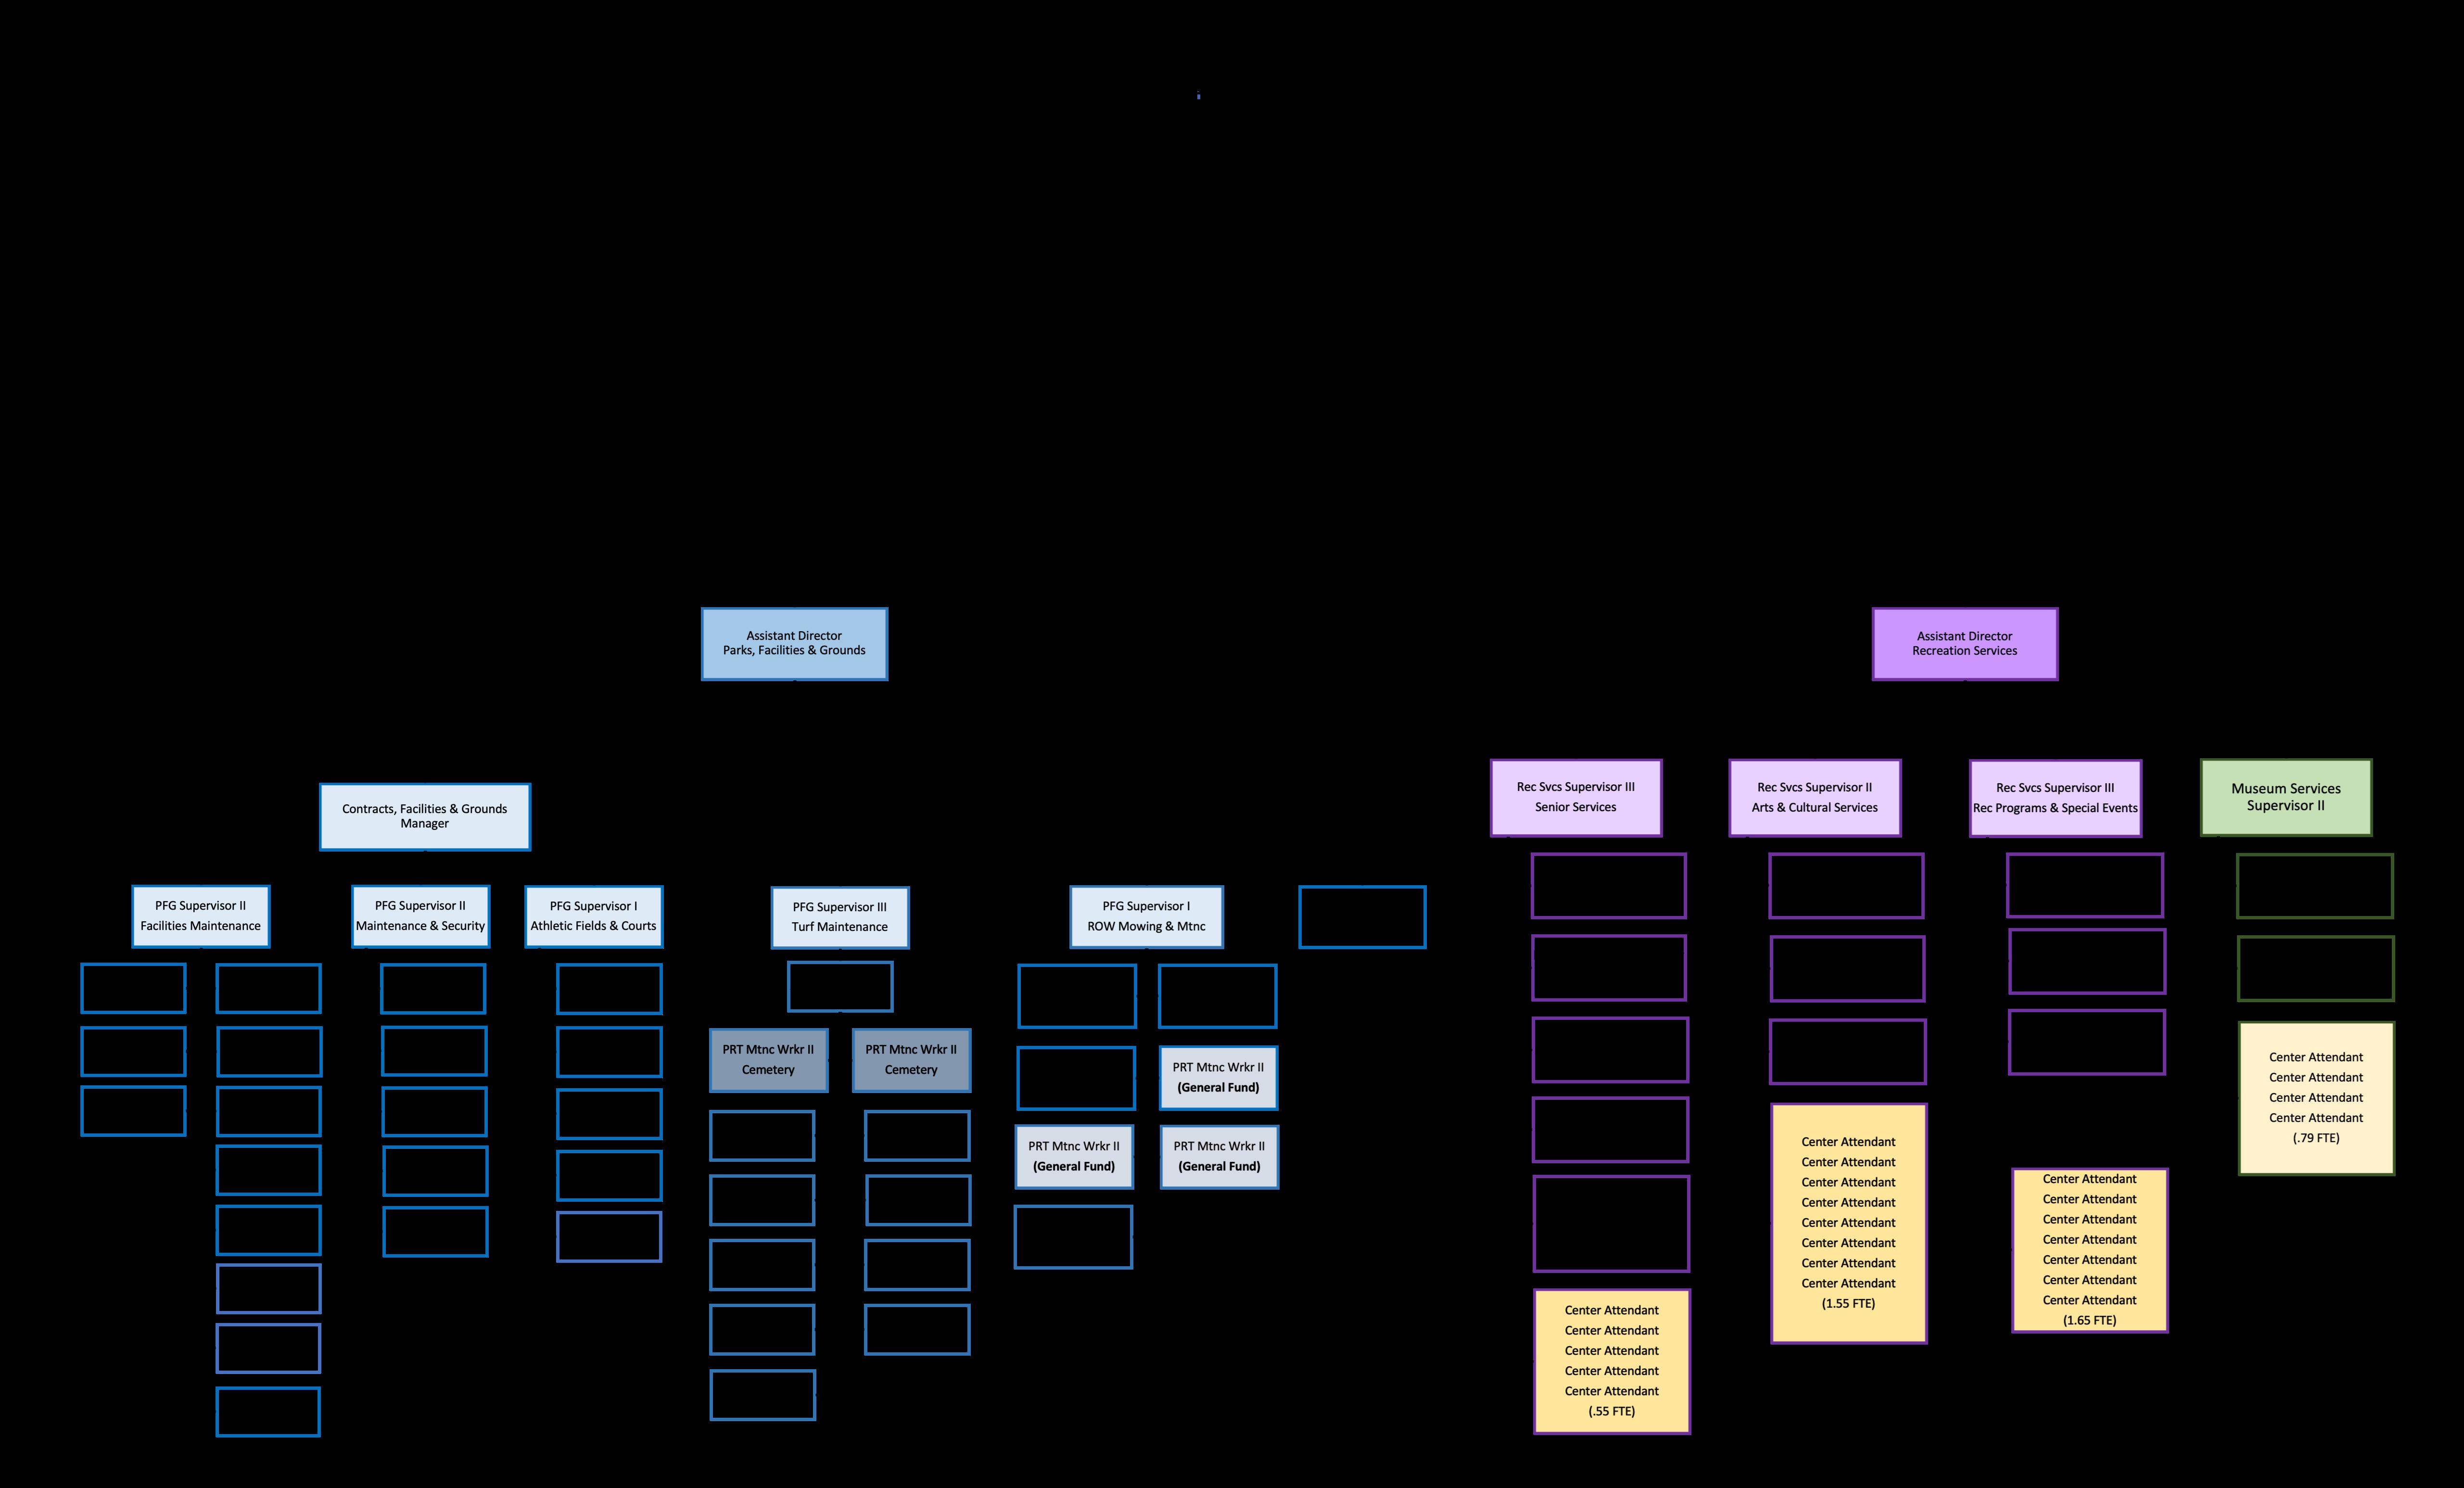
The Consulting Team conducted a workshop with staff in March of 2025 to establish context for the operational review through the employees’ perspective which included interviews, site tours, and document review. Employees were asked questions on operational strengths, challenges, and priorities. The discussions helped to identify key actions to build operational capacity and enhance service delivery.
• Modernization of Facilities: Many facilities are outdated and require significant investment in maintenance and upgrades.
• Clarity and Direction: Resolve questions surrounding the 2010 plan, the community center study, and the city’s long-term priorities.
• Equity and Inclusion: Ensure the plan addresses the diversity of the community (geographically and socioeconomically), especially across east and west Independence.
• Sustainable Funding and Cost Recovery: Establish clear policies for cost recovery and diversify funding sources beyond the general fund.
• Nature-Based and Sustainable Programming: Leverage natural areas with low-maintenance landscaping and expand nature programming.
• Trail Connectivity and Access: Emphasize a comprehensive trails plan and better park connectivity.
• Unique Park Identities: Move toward parks with individual character and amenities tailored to surrounding neighborhoods.
• Strategic Collaboration: Strengthen ties with the police department (e.g., addressing homelessness) and other partners.
• Staffing: Rebuild staffing levels, especially in programming and outreach roles; explore job shadowing and internship opportunities.
• Maintenance and Capital Planning: Reverse the trend of declining maintenance funding; prioritize planned and preventive maintenance.
• Youth and School-Based Programming: Increase out-of-school time programs (camps, afterschool), and partner more with schools and libraries.
• Business Planning for Programs: Assess programs for effectiveness and cost recovery; consider creating business plans for program areas.
• Current city policies and requirements create bottlenecks with service delivery and adapting to market and industry trends.
• There is a need for more consistent advocacy and relationship building from City leadership and community partnerships.
• Reduced staffing has made reporting and administrative work a significant challenge.
• Outdated technology and information systems such as RecTrac/WebTrac are not user-friendly.
• Communicate clearly how parks are funded (levy, sales tax, general fund); create visuals to explain trends and cost increases.
• Develop a strategy to highlight the value of parks and recreation to City leadership, including success stories and economic impact data.
• Consolidate department structures, improve efficiency, and define priorities between historic sites, museums, right of way and facilities and parks services.
• Shift to quality over quantity in facilities and services.
• Rebalance parks and recreation department focus away from historic sites, right of way, and facilities and more toward resident parks and recreation priorities.
• Build an efficient, front-line-focused organizational structure.
• Reinvest in underutilized spaces and identify key projects to drive visible change.
• Improve community experience through better customer service, quality programs and facility conditions.
• Manage more within a business mindset.
Policy and procedure management covers the operational systems and procedures to run facilities and programs effectively. Some of the key focus areas of this area include:
• Standard Operating Procedures should be updated and developed to ensure consistency and efficiency for facility scheduling, rentals, recreation programming and maintenance tasks.
• Use agreements should include clear requirements, termination clauses and performance standards. Agreements should be standardized for consistent legal, risk management, and operational terms.
• Develop consistent maintenance, program, and customer service standards.
• Develop clear maintenance standards by asset type (playgrounds, trails, athletic fields, restrooms) for consistency.
• Establish facility standards for safety, accessibility, and service levels.
• Create a standardized partnership framework with criteria for decision-making, risk-sharing, and performance evaluation.
• Develop sponsorship guidelines and inventory to support funding diversification.
• Update park use policies or ordinances to address modern issues (e.g., metal detecting, drones, e-bikes) and ensure consistent enforcement.
• Expand policy to include acquisition priorities, easements, conservation partnerships, and appraisal requirements.
• Develop a policy to guide natural resource stewardship, invasive species control, and conservation practices.
• Develop processes for program promotion, lead times for marketing materials, and establish a digital vs. print balance for the Department’s community engagement efforts.
Organizational management defines the staffing structure, roles, and workforce needs. Considerations have been developed to enhance efficiency and effectiveness for operations and management.
According to the National Recreation and Park Association’s (“NRPA”) Park Metrics for communities between 100,000 to 250,000, 48% of parks and recreation personnel are dedicated to operations and maintenance, 31% to recreation programming, 15% to administration, and 4% to other responsibilities. Independence currently allocates approximately 75% of its FTEs to parks, facility, and right of way maintenance responsibilities. The other 25% goes to recreation programming, administration, and other responsibilities. When comparing national benchmarks for similar size communities, Independence’s 2025 FTE allocation indicates a larger imbalance between maintenance and recreation responsibilities than is typical and will likely continue to limit parks and recreation’s ability to provide quality recreation programming to the community if this trend continues.
Additionally, NRPA Park Metrics show that 56% of parks and recreation operating budgets are allocated to personnel services. The remainder is divided amongst operating expenses (38%), capital expenses (4%), and others (2%). In fiscal year 2025, Independence allocated approximately 55% of its operating budget to personnel services and the remainder to internal services (Human Resources, Finance, Technology Services, etc.) (15%), professional services (7%), equipment (1%), and other operating expenses (22%). Independence’s operating budget is under the national benchmark and the attention to increasing the operational budget for personnel services should be prioritized.
Compared to adjacent regional communities as well as the National Recreation and Parks Association Park Metrics with similar population numbers, Independence is significantly understaffed in terms of Full Time Equivalents (“FTEs”) at 59.50 as of the last fiscal year 2025. Independence should put forward a sustained effort of closing this gap in FTEs over the next five years to make and maintain the necessary improvements to operations and service delivery that are recommended in the master plan.
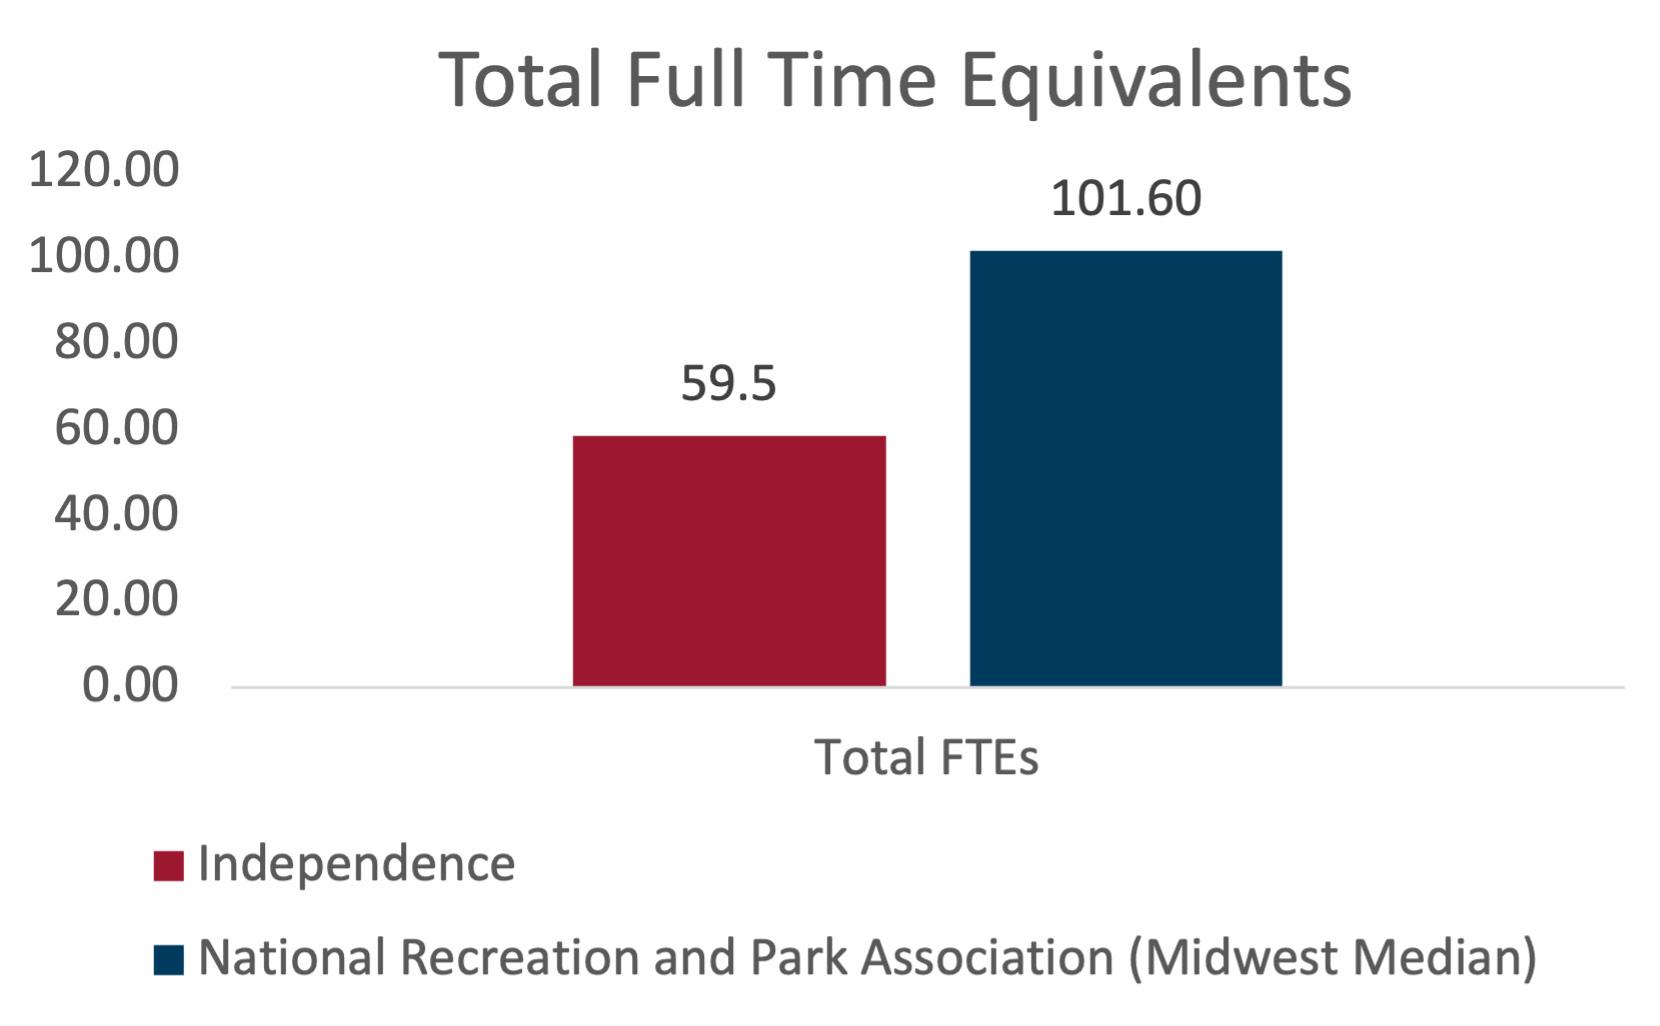
The Parks and Recreation Department is also responsible for right of way (ROW) maintenance including mowing and tree care, city-wide facility management including maintenance, repairs, and custodial services, and the management of the National Frontier Trails Museum and historic sites. These functions are supported by the General Fund for ROW maintenance and Facilities Management. The museum and historic sites are funded by the Tourism Fund. The Department is also responsible for oversight of Cable Dahmer Arena which is run by a separate management company. Funding for maintenance to the Arena comes from the Events Center Community Improvement District. Interestingly, Independence Parks and Recreation experienced a reduction of 8.7 FTEs in 2025 but was still taking on the other departmental responsibilities for the city.
• As explained in the following sections, Independence Parks and Recreation is drastically understaffed compared to peer agencies and the organizational structure and responsibilities need to be recalibrated to allow for parks and recreation to focus limited staffing on its core services. It is recommended that parks and recreation staffing be focused on parks and recreation properties, facilities, and amenities in the future such as what is within the parks, designated recreation facilities, as well as greenways. Responsibilities such as right of way mowing, tree maintenance and management of historic sites should be transitioned to other City departments better positioned to provide the necessary time and resources to care for these spaces.
A functional organizational structure can help Independence by creating clarity around roles and responsibilities and more efficiency and consistency with communication channels. The functional structure organizes staff by key areas such as administration, maintenance, and programming. It streamlines communication, decision-making and reduces a duplication of efforts. And, lastly, this type of a structure can reveal where full-time positions are needed and link staff directly to service delivery outcomes.
Currently, Independence has three divisions: Parks, Facilities, and Grounds; Recreation; and Administration. There are opportunities to make the Department’s structure more functional by refining clarity, efficiency, role alignment, and strategic capacity.
• Break down larger teams and create additional lead positions. For instance, there is likely cross-over between Building Maintenance Worker and Custodian responsibilities and more clarity can be provided on specific functions.
• Independence’s Right of Way Mowing and Maintenance and Turf Maintenance should be reconfigured to focus attention on Natural Resource Management including horticulture, landscaping, arboriculture, and turf maintenance for areas outside of athletic fields. The part-time horticulture position should be moved into this division and transitioned to full time reporting to the Natural Resources Supervisor. This division will require other specialized positions such as an Arborist who would oversee the park system’s tree inventory.
• Balance staffing levels and responsibilities: Independence can create crew leads or coordinators for field operations under each Maintenance Supervisor. Also, Independence should consider more full-time support roles for the Recreation Division that can serve under each Recreation Supervisor to increase year-round service consistency. Lastly, each division should have dedicated administrative and customer service support.
• Right of way mowing and tree care management responsibilities should be transitioned to Public Works and Power & Light as these departments are better positioned to regularly care for these particular public spaces. Parks and Recreation should focus on parks, facilities, and greenways that are better aligned with this department’s core services and mission for the City.
• Functional teams should be created based on current and not past needs. Independence should consider adding a planning and performance management role to help facilitate consistent performance measurement and improvement. This role can help collect and analyze necessary data from the various service areas of the Department to help with future strategic initiatives.
• Key performance indicators (KPIs) should be developed for all positions to ensure each team member understands the individual and team contributions that they are expected to make toward overall agency goals. These KPIs should be regularly reviewed and reported on to ensure they are aligned with strategic priorities and services that have the highest community benefit. KPIs also provide a way for agencies to reward outstanding performance, promote professional development, and create a culture of continuous improvement.
• A Leadership Team consisting of representation from each service area or division should meet regularly to plan major Department projects and initiatives.
• Independence should also consider a position that specifically oversees grants, alliances, partnerships, and sponsorships (GAPS) and serves within the administrative division but works with parks and recreation on specific opportunities.
• Lastly, administrative support should be centralized but provide specific support to all service areas. This area or division should focus on standardizing processes, data management and analysis, and enhancing customer service to the community.
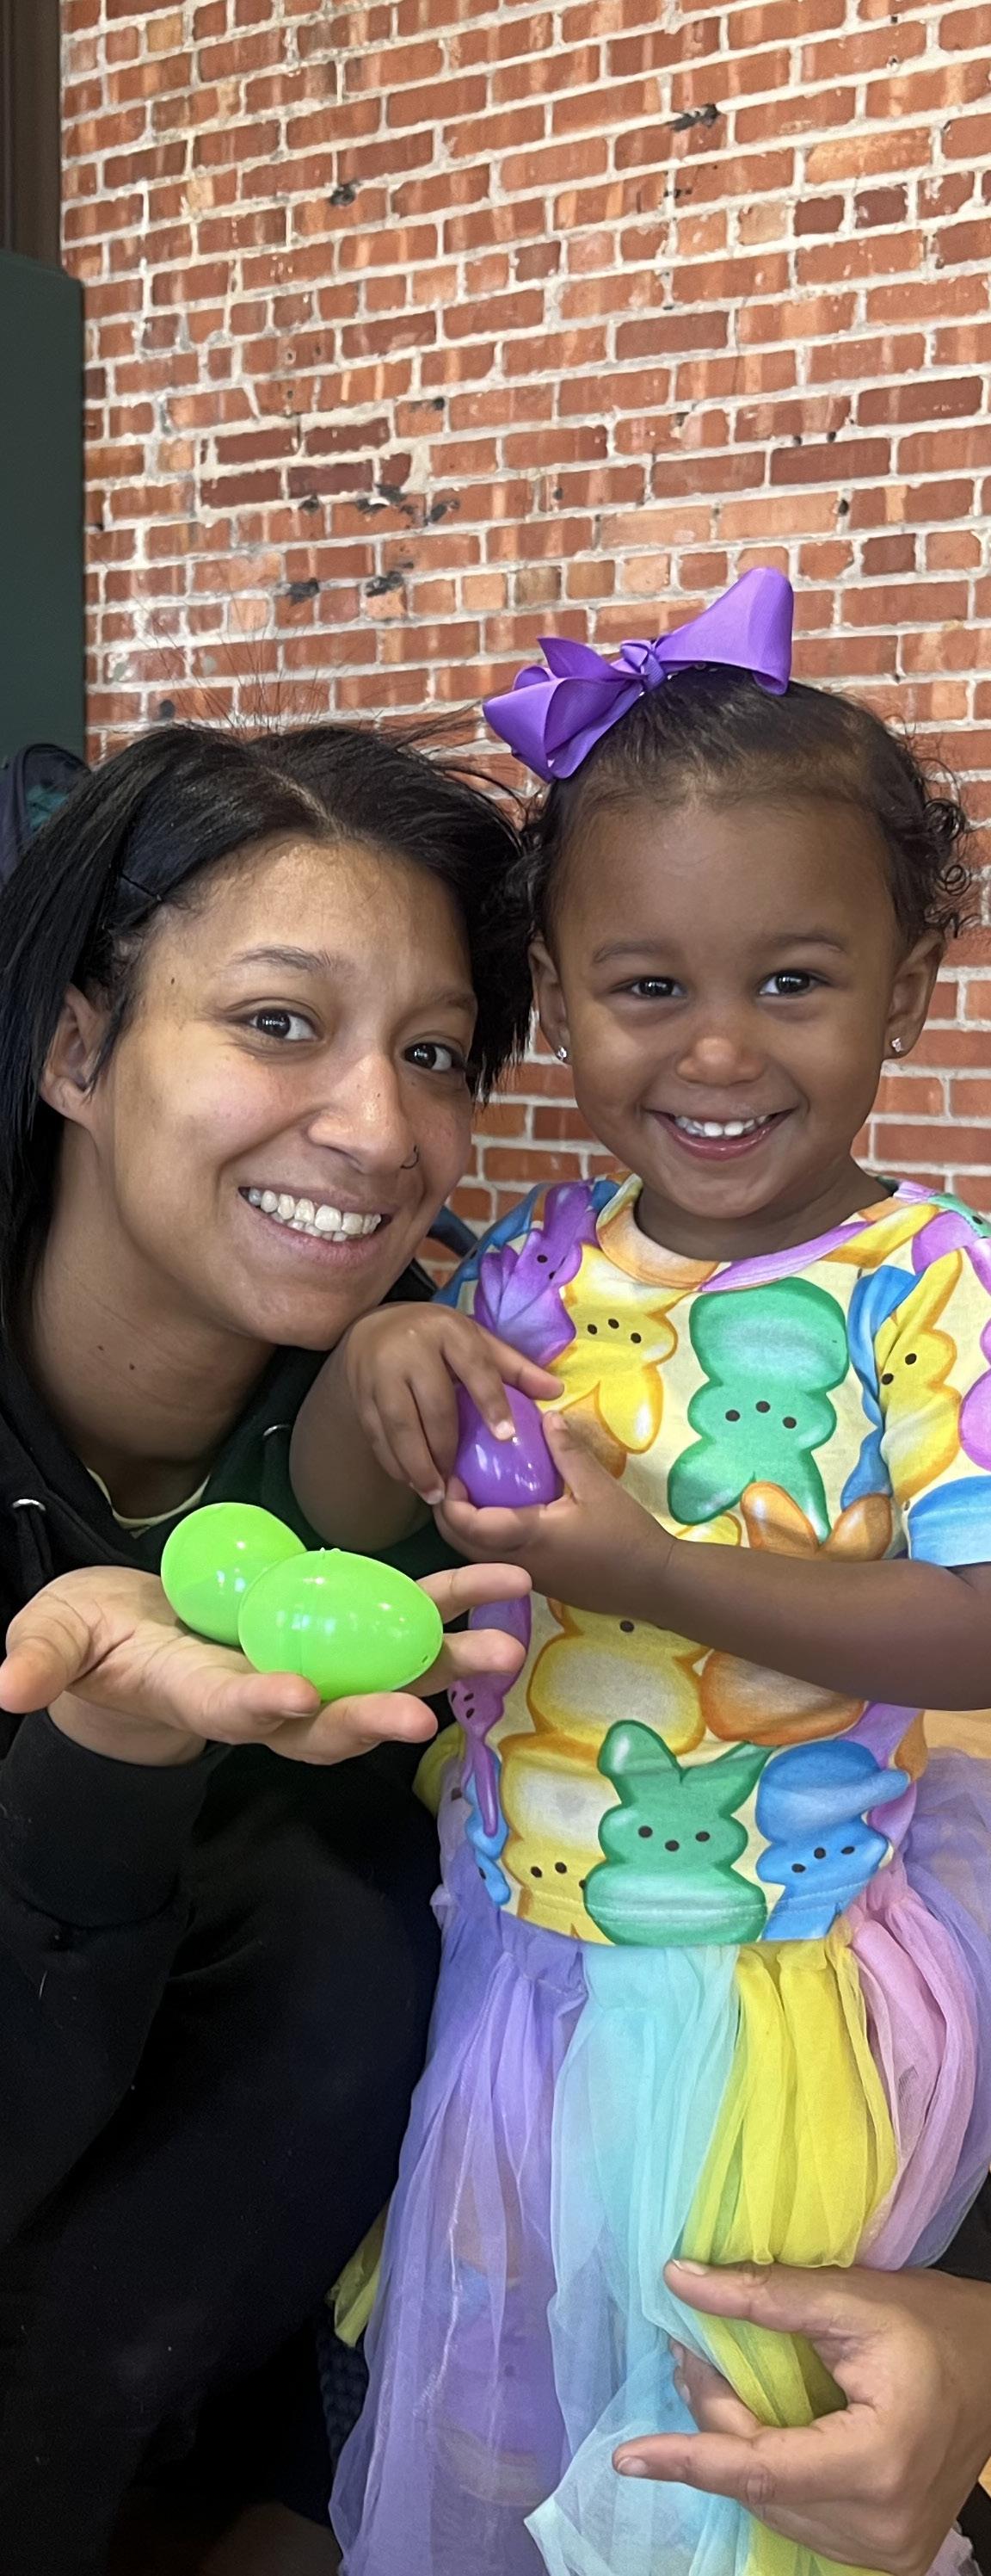
The following recommended organizational structure can fit within the current FTE count of 59.5 but be expanded as additional services are brought online, particularly for the front-line responsibilities.
ADMINISTRATION
12 FTEs
Customer Service & Registration Specialists
Administrative Services Manager
Data Analyst
Executive Assistant
Director of Parks and Recreation
Cable Dahmer Arena (Administration and oversight of contracted management)
Community Engagement Manager
Digital Content Specialists
Grants, Alliance, Partnerships and Sponsorships Specialist
Administrative AssistantContract Management
Financial Manager
Administrative Assistant - Accounts Receivable/ Payable
Planning and Capital Projects Manager
Assistant Director - Parks, Facilities, and Natural Resources
Assistant DirectorRecreation Services
Assistant DirectorParks, Facilities, and Natural Resources Administrative Assistant - Parks, Facilities, and Natural Resources
Positions funded through General Fund
Positions funded through Parks Improvement Sales Tax
PFNR Supervisor - City Facilities City Facilities
Maintenance Workers
PFNR Manager - Facilities
PFNR Supervisor - Park Facilities
Maintenance WorkersAquatic Facilities
Equipment Technician
PFNR Supervisor - Custodial Services Custodians
PFNR Supervisor - Right of Way Mowing
PFNR ManagerParks and Trails
PFNR Supervisor - Parks and Trails
Maintenance WorkersRight of Way Mowing
Maintenance WorkersParks and Grounds
PFNR ManagerNatural Resources
PFNR Supervisor - Natural Resources
Construction Manager
Maintenance WorkersAthletic Fields and Courts
Maintenance WorkersTrails and Greenways
Building Maintenance Workers Horticulturist/Arboriculture Specialist
Maintenance WorkersLandscaping/Cemetery
Maintenance WorkersNatural Areas
Community Center Manager
Community Center Assistant Manager
Positions funded through Tourism Fund
Assistant DirectorRecreation Services
Administrative AssistantRecreation Services
Recreation ManagerYouth and Family Services
Assistant Recreation Manager - Youth and Family Services
Front Desk Attendants
Rental/Membership Coordinators
Recreation Manager - Arts and Cultural Services
Museum Services Supervisor
Customer Services Assistant
Recreation Programmer - Out of School Services (Youth Camps)
Recreation Programmer - Nature Education and Outdoor Adventure
Recreation ProgrammerYouth Sports and Aquatics
Recreation ManagerActive Adults and Wellness
Assistant Recreation Manager - Active Adults and Wellness
Recreation ProgrammerMuseum Services Front Desk Attendants
Recreation ProgrammerArts and Culture
Recreation ProgrammerFarmers Market
Recreation ProgrammerCommunity and Special Events
Recreation ProgrammerSenior Services
Recreation Programmer - Fitness and Wellness (includes Adult Sports)
Resource management refers to the financial framework for sustaining and growing operations and the community. Independence should focus on the areas outlined below to ensure parks, facilities, and programming can adapt to growing demand.
• Prioritize facility upgrades at parks, facilities, and amenities with a focus on safety, infrastructure and user experience.
• Increase the Parks and Recreation Department’s operating budget to achieve $100 per capita by 2031. This equates to an operating budget of $12,162,900 or an increase of 49% from fiscal year 2025 ($8,152,428).
• Maximize facility use by consistently analyzing and adapting to utilization trends.
• Create a lifecycle replacement plan for equipment and infrastructure and prioritize attention on deferred maintenance items.
• Schedule preventive and reactive maintenance consistently across parks.
• Apply consistent design and maintenance standards (Appendix I) across all parks and facilities.
• Ensure Parks-specific purchasing thresholds and needs (seasonal, urgent repairs) are accommodated.
• Expand into a formal Cost Recovery & Pricing Philosophy tied to community benefit tiers.
• Broaden the Cost Recovery & Pricing Philosophy to cover all programs and memberships for fairness and transparency.
• Establish and maintain consistent, diversified funding sources for operations.
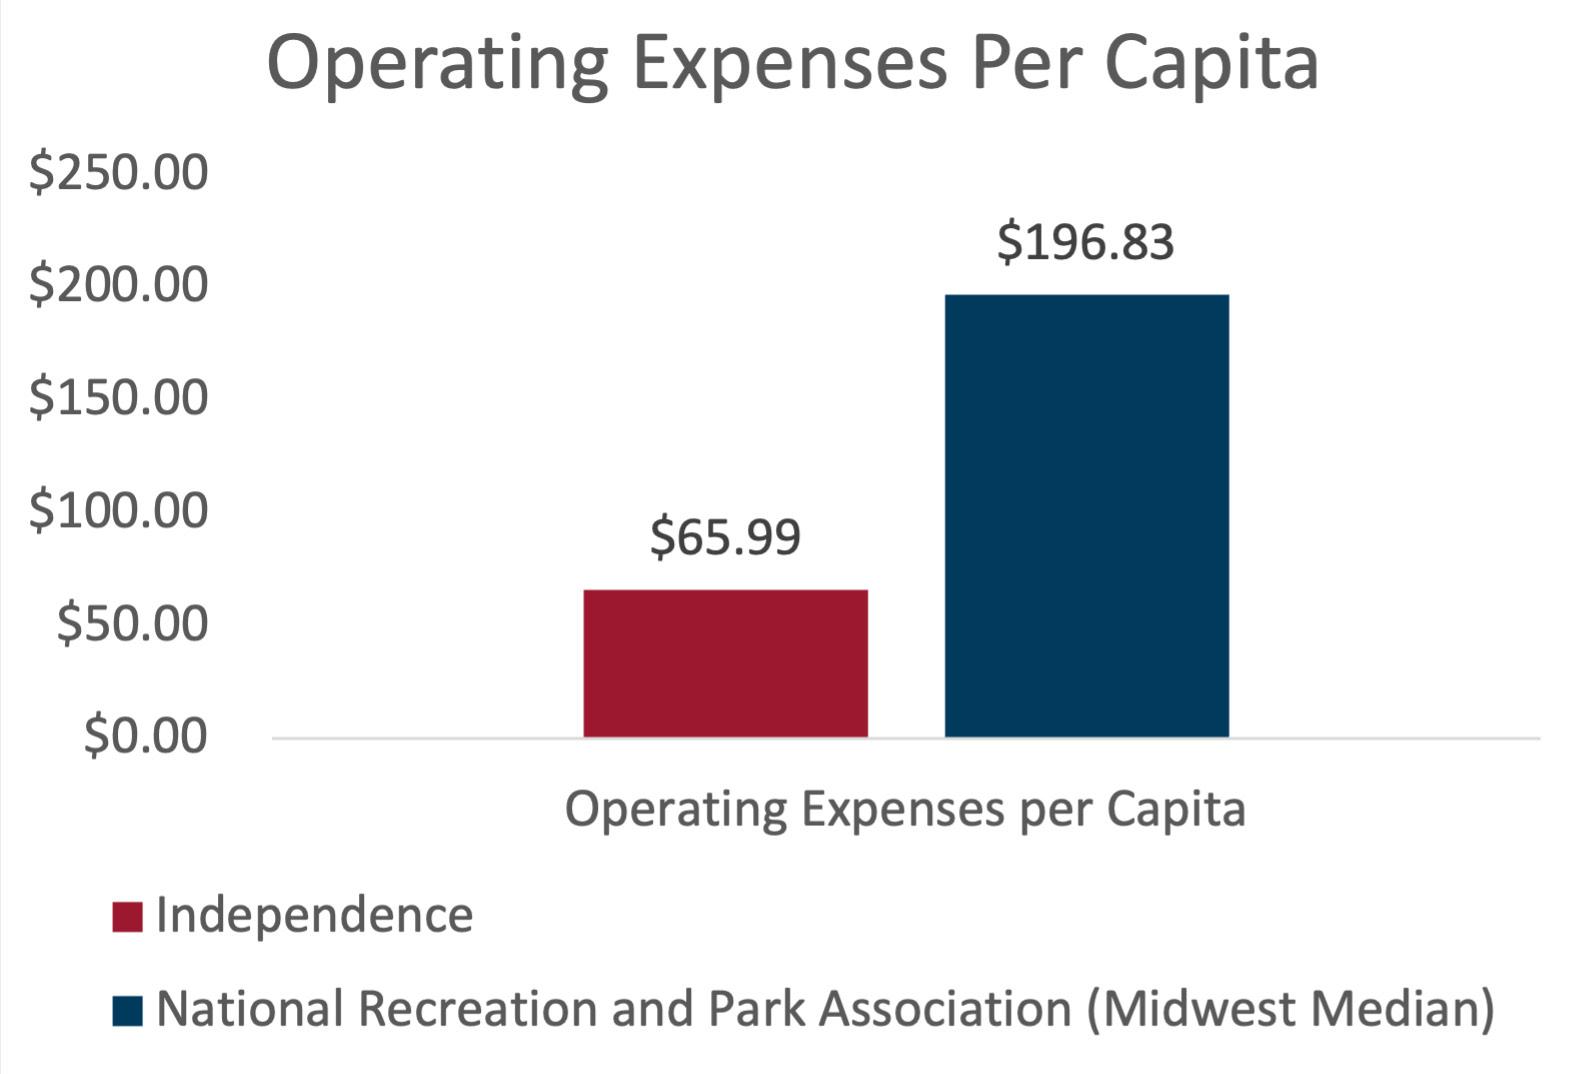
Independence has some systems in place that support operations and decision-making. However, implementation is inconsistent across the parks and recreation department and there are some improvements that should be made to improve internal coordination, data management, as well as service delivery that are described below.
• Independence should assess all current hardware and software that is used for maintenance and recreation management to identify gaps in service needs and define the outcomes that the Department wants to achieve from enhancing information systems. The assessment should look at both internal staffing and external customer needs. It should also map current workflows to identify bottlenecks.
• Future software should provide fully automated and cloud-based features for both recreation and maintenance management for optimal scheduling, data management, reporting, customer interaction, and internal and external coordination.
• Independence should provide the necessary staff training on any technology that is implemented and ensure at least one designated staff member becomes a “power user” of each software type to maximize the software’s capabilities.
• Staff should integrate data from maintenance and recreation management software for informed, data-driven decisions.
Communications management consists of the internal and external engagement with stakeholders that support parks and recreation services. Some ways that communications can be enhanced include:
• Develop internal communication protocols and cross-collaboration within the department for scheduling, maintenance, and project updates.
• Create a public engagement strategy to educate the community on the true cost of recreation services that will help with future fee increase discussions. Also, provide consistent, transparent updates on park planning and projects that educate the community about funding sources
• Collect and act on user feedback data regularly.
• Create a customer journey map to visualize and document the end to end experience that a customer has with parks and recreation facilities and programming from initial awareness, through registration and service delivery to post-engagement follow-up.
• Create a marketing and communications plan to strengthen branding, outreach, and program participation.
• Create a style guide for branding, print, and digital communication.
• Develop processes for program promotion, lead times, and a digital vs. print balance with marketing materials.
The operational and maintenance review for Independence highlights the need for modernized systems, sustainable funding, and a more efficient, structured approach to service delivery. The review identifies outdated or missing policies and limited staffing as barriers to success. Independence currently lacks many foundational plans and procedures which are essential to guide long-term growth and service improvements.
Key themes for operations and maintenance include the need for a functional organizational structure that aligns roles and responsibilities to service outcomes, increases staffing, particularly for maintenance management and recreation services, and provides clearer administrative support to all areas of the Department. Recommendations stress the importance of shifting the department’s focus from quantity of services offered to quality to improve the customer experience, reinvesting in underutilized spaces, and enhancing internal collaboration and communications.
5.1.1
Public recreation faces a constant challenge securing reliable funding for projects, programs, daily operations, and ongoing maintenance. While traditional funding sources exist, they can be subject to change. To ensure a sustainable future, it is crucial to diversify funding streams and actively seek new opportunities.
Developing a dynamic funding strategy is key. This strategy should consider different levels, from overall departmental needs to specific facilities and core programs. While the process of identifying and securing new funding can be time-consuming, the longterm benefits are significant. Additional and non-traditional sources can provide a critical boost for ongoing operational costs.
Independence Parks and Recreation currently relies on the following funding sources for operations and capital improvements.
Independence should position its fees and charges to be market-driven and based on surrounding public, private, and non-profit facilities. The potential outcome of revenue generation is consistent with national trends relating to public park and recreation sports facilities, which can generate a majority of all the operating expenditures. Fees include admissions, memberships, programs, rentals, etc.
Implications for Independence: This approach could cover a substantial portion of operating costs for specific value-added and individualized services. Independence will need to ensure inclusive access for lowincome visitors and this can be done through an enhanced scholarship or financial aid program. Also, Independence should take a policy-driven approach to establishing user fees that will provide staff and City officials with a basis for how fees are established and which groups should receive discounted rates or fee waivers. The policy should also determine the required cost recovery levels for various services, as suggested in the plan’s program assessment. Lastly, nonresident rates should be included in future pricing policy discussions for certain types of programs.
This revenue source comes from the right to reserve specific public spaces or property for a set amount of time. The reservation rates are usually set and apply to multipurpose rooms for various gatherings, hardcourts, sports fields, and other types of facilities for special activities.
Implications for Independence: Charging for space reservations (e.g., sports fields, multipurpose rooms) creates a dedicated revenue stream while managing usage efficiently. Clear policies and competitive pricing will be essential to balance revenue goals with public accessibility. Independence should take the same market and policy driven approach to reservations as suggested for fees and charges including non-resident rates.
This revenue-funding source allows corporations to invest in the development or enhancement of new spaces or renovation of existing amenities/facilities in park systems. Sponsorships are also universally used for programs and events.
Implications for Independence: Independence is currently implementing this strategy for recreation programs and events. Sponsorships can also provide significant funding for capital improvements and larger amounts could be overseen and managed by the Truman Heartland Community Foundation or a future Park Foundation.
However, care must be taken to align sponsors with the Independence mission and values to avoid a negative perception from the public. A sponsorship agreement should be created for each opportunity that protects all parties involved and clearly outlines terms.
Traditionally, these dollars are raised from taxexempt, non-profit organizations established with private donations in promotion of specific causes, activities, or issues. They offer a variety of means to fund capital projects, including capital campaigns, gifts catalogs, fundraisers, endowments, sales of items, etc. This funding source can be used for operations and capital costs.
Implications for Independence: Partnering with foundations can provide grants or endowments for operations and capital costs.
This funding source is versatile but requires strong grant-writing and fundraising efforts. Independence should explore a partnership with the Truman Heartland Community Foundation to ensure future success. The Community Foundation could be an option to manage gifts and large-scale donations as well as take the lead role in planning future special fundraisers.
Partnerships are joint development funding sources or operational funding sources between two separate agencies, such as two government entities, a non-profit and a governmental entity, or a private business and a governmental entity. Two partners jointly develop revenue producing park and recreation facilities and share risk, operational costs, responsibilities, and asset management, based on the strengths and weaknesses of each partner.
Implications for Independence: A partner could co-develop facilities and amenities such as a pickleball facility, play areas, or other rental facility upgrades, enhancing amenities without straining park resources and generating revenue for a reinvestment back into the park system. Partnerships should be regularly evaluated to ensure that they align with the Independence mission and priorities. Partnership agreements should be specific to private, public and non-profit organizations. The funding source could be used for either operations or capital development. The goal is to make partnerships as equitable as possible and not create a sense of entitlement. Agreement terms should focus on meeting the outcomes desired by both partners.
Private Donations may also be received in the form of funds, land, facilities, recreation equipment, art, or in-kind services. Donations from local and regional businesses as sponsors for tournaments, events or spaces should be pursued.
Implications for Independence: Donations from individuals or businesses can provide financial or in-kind support for events or specific projects. Regular communication with donors is critical to maintaining these relationships and ensuring long-term support.
The revenue source is an indirect revenue source in that people donate time to assist the organization in providing a product or service on an hourly basis. This reduces the organization’s cost in providing the service plus it builds advocacy into the system. According to independentsector.org the value of a volunteer hour is worth $33.49. This monetary value can be used for matching money for some state and federal grants.
Implications for Independence: Volunteer efforts reduce costs and build community support. Independence should develop a Volunteer Policy which provides a comprehensive framework for managing volunteers. The policy outlines volunteer management procedures and emphasizes volunteer support, recognition, and maintaining a respectful work environment.
Independence should create a volunteer coordinator position, either on-staff or in a volunteer role, which oversees several types of volunteers related to parks and recreation responsibilities including event management, invasive species removal, general park cleanup, and tree planting efforts. The program assessment outlines some other best practices with volunteer management that Independence can consider for enhancing its engagement with future volunteers.
An Irrevocable Remainder Trust allows a donor to place assets (e.g., cash, stocks, real estate) in a trust that generates income for the donor or designated beneficiaries during their lifetime or a specified term. After the income period ends, the remaining trust assets (the "remainder") are donated to a charitable organization, such as a city’s parks department or a nonprofit supporting local parks and natural resources.
Implications for Independence: This strategy can come in the form of land conservation, a park endowment for park maintenance and programming, or enhancements and expansion for park properties and a trail system.
Land Trust
Typically, a non-profit that acquires, holds, and stewards land for conservation, parks, recreation, or community use. Land trusts can acquire land outright through purchase or donation, accept conservation easements that protect land in perpetuity, partner with cities to manage parkland, and leverage philanthropy, grants and tax incentives to fund land acquisition and stewardship.
Implications for Independence: Independence could partner with an existing land trust in Missouri such as the Missouri Land Trust Coalition and some other regional trusts in the Kansas City area like the Heartland Conservation Alliance.
Advertising Sales
This revenue source is for the sale of tasteful and appropriate advertising on park and recreation related items such as print materials, on scoreboards, dasher boards and other visible products or services that are consumable or permanent and expose the product or service to many people.
Implications for Independence: Tasteful advertising on signage or within events and programs can provide a steady revenue stream without detracting from the park's aesthetic. This must be carefully managed to ensure public approval and brand alignment.
This is a license to allow caterers to work in the park and recreation system on a permit basis with a set fee or a percentage of food sales returning to Independence.
Implications for Independence: Allowing caterers to operate in the park under permit agreements provides revenue from events while supporting local businesses. This is particularly valuable for weddings or corporate events at pavilions or future facilities.
This funding source is from retail sales or rentals of soft goods, hard goods, or consumable items. There may be opportunities where Independence could either contract for the service and receive a set amount of the gross percentage or the full revenue dollars that incorporates a profit after expenses.
Implications for Independence: Concession sales, such as food, beverages, or equipment rentals, provide an opportunity for profit sharing or direct revenue. Contracting out services ensures consistent offerings without increasing park staff workload.
Contractual relationships entered between two or more local units of government and/ or between a local unit of government and a non-profit organization for the joint usage/ development of sports fields, regional parks, or other facilities.
Implications for Independence: These agreements could support funding, resource sharing, environmental conservation, recreational programming, and community engagement. Agreements could be explored with Independence’s school districts or Jackson County to enhance parks and recreation services.
This includes options where developers / agencies lease space from municipal-owned land through a subordinate lease that pays out a set dollar amount plus a percentage of gross dollars for recreation enhancements. These could include recreation centers and ice arenas.
Implications for Independence: Leasing land or facilities to private operators could generate revenue for specific enhancements. This reduces operational costs for the City while ensuring facility use. Leases can often require oversight of private operators.
Many municipalities have turned to selling the naming rights for new buildings or renovation of existing buildings and parks for the development cost associated with the improvement.
Implications for Independence: Selling naming rights for new or renovated amenities could fund significant capital costs. The naming right value is determined by impression points of the specific business or organization in a given period, such as a year.
Some private soft drink companies execute agreements with organizations for exclusive pouring rights within their facilities. A portion of the gross sales goes back to the organization. This comes from vending machines and soft drink serve stations.
Implications for Independence: Exclusive agreements with beverage companies could bring in consistent revenue from vending machines and concessions. This strategy is most viable for high-traffic facilities or events.
Grants can be an essential funding source as part of a greater overall funding strategy for capital projects and some for specific services. For most, grants are seen as an opportunity of free money, increased credibility of fiscal stewardship, increased access to valuable data, and the ability to point to past grants awarded in future applications.
Platforms such as Grant Gopher and Intrumentl provide databases that can be searched for national, regional, and state specific grants for parks and recreation. Also, Missouri has The Grant Portal for sports and recreation facility grants.
It is also suggested that Independence regularly track organizations such as the National Parks and Recreation Association, Missouri Department of Natural Resources, and Missouri Parks and Recreation Association for funding opportunities for park projects and recreation programming. Lastly, depending on the project and need certain types of infrastructure or transportation funding can support trails, pedestrian and bike infrastructure, greenways, or shared-use paths.
It is important for Independence to understand each grant’s requirements. In many instances, agencies look at the pros and cons of each individual grant to understand the cost-benefit ratio. Consider the following to determine Independence’s potential level of success:
• If it is a matching grant, are the necessary funds committed from the City for the match requirement?
• What is the overall time commitment expected from staff for grant administration, reporting, and implementation?
• What is the level of competition?
• How well does the Independence project or service meet the application requirements?
• Is there an opportunity to renew the grant or will Independence fund the project for the long term?
• What are the reporting requirements and length of time given for the overall project?
Below is a brief description of a few potentially impactful grant opportunities.
This provides funding for acquisition and development of public outdoor recreation facilities. There is a 50% local match that is required for grants up to $500,000.
MISSOURI RECREATIONAL TRAILS PROGRAM
Projects can include motorized and nonmotorized trail development and require a 20% local match for grants up to $250,000.
OUTDOOR RECREATION INFRASTRUCTURE GRANT PROGRAM
A reimbursement grant of up to $100,000 through the Missouri Department of Conservation for enhancing public access and opportunities for citizen engagement in conservation-related outdoor recreation.
This matching grant is funded through the U.S. Department of the Interior, National Park Service for cities with park projects in underserved communities. The grant helps to create new outdoor spaces or renovate existing parks with the goal of connecting people to outdoors.
Funding is received in accordance with the Community Development Block Grant (CDBG) Programs national objectives as established by the U.S Department of Housing and Urban Development. Funding may be applied to such programs as Infrastructure Improvements, Public Facility and Park Improvements, Human Service Enhancements, Lead-Based Paint Education and Reduction, Housing Education Assistance, and Economic Development and Anti-poverty strategies.
Voters can approve up to a one-half cent sales tax that is dedicated to funding parks.
Independence currently has a quarter-cent parks improvement sales tax for capital improvements. The City should strategically consider proposing an increase to this tax to address deferred maintenance, future capital improvements, as well as matching dollars for potential grants. The City will need to coordinate this alongside its other departmental needs.
The city can dedicate a portion of its property tax revenue to fund parks and natural resources, either through the general levy or a special parks levy.
Implications for Independence: An appropriate level of property taxes provide a reliable and recurring source of funding. Public approval will be required if structured as a special levy. This would require careful justification and transparency.
Park Dedication Fees or Park Impact Fees are governed locally through an impact fee ordinance. These fees are designed to ensure that as new development occurs, there are adequate parks, open spaces, and recreational facilities to serve the growing population.
Implications for Independence: The City has considered this funding source in the past but is not currently implementing it. Given the growth potential, particularly on the east side of the city, Independence should strongly consider implementing an ordinance that dedicates funding to park development needs in areas of new development. As an example, nearby Lee’s Summit requires developers to dedicate parkland or pay a fee, with a set standard of 6 park acres per 1,000 residents.
According to Missouri Law (Chapter 67; 67.1521), a city can create a CID where property owners in a defined area agree to additional property taxes to fund specific services or improvements, such as park enhancements.
Independence:
Service Districts could provide targeted funding for specific parks or natural areas; however, it requires property owner consent. It would also require defining the district, holding a public hearing, passing a city ordinance, and (for any tax) getting voter approval within the district. Other Missouri cities already use this tool successfully for parks, beautification, and public spaces.
This strategy provides tax incentives or abatements for landowners who place their property under conservation easements.
Implications for Independence: Encourages preservation of natural areas without an upfront city expenditure. Conservation easements require collaboration with landowners and conservation organizations.
Missouri law also allows cities to impose a lodging tax, with revenues used to promote local tourism, including improvements to parks and trails. These taxes range from 3-7%.
Implications for Independence: This strategy supports parks and recreation as part of tourism promotion and has a minimal impact on residents as the tax is paid by visitors. The revenue potential depends on the city’s lodging market size. The tax requires voter approval and could be a valid source of revenue for the park system since Independence currently markets itself as a tourist destination because of its historic assets and arena.
The City charges based on impervious surface area to fund stormwater management, which can include natural area preservation and park infrastructure improvements.
Implications for Independence: Stormwater utility fees encourage sustainable development while funding green infrastructure in parks. This strategy may face opposition if perceived as an additional tax on residents and businesses.
Lease land for fiber optics, utilities alongside trails to support trail operations.
Implication for Independence: As Independence adds trails to the system including connectivity trails, opportunities may develop. The City should look at these on a case-by-case basis. Should this funding source materialize, the City should develop a policy to direct city officials and staff.
Independence should focus on enhancing financial sustainability and meeting community recreational needs through a diverse set of funding strategies. Critical actions for successful implementation of the funding strategies include:
• Regularly assessing and aligning funding strategies with Independence's mission and community needs. Ensure that partnerships, sponsorships, and grants are in harmony with the organization's values and goals.
• Actively pursuing a mix of funding sources to reduce dependence on any single channel. Continuously explore new opportunities and adapt strategies to changing economic and community landscapes.
• Improving coordination and messaging with key community partners, such as a Community Foundation, to increase public awareness of fundraising initiatives and missions. Foster open communication with the community to build understanding and support for various funding mechanisms.
• Regularly evaluating the performance of partnerships, sponsorships, and other revenue-generating initiatives to ensure they remain effective and aligned with Independence's objectives. Adapt strategies based on the outcomes of evaluations to optimize financial outcomes.
• Streamlining processes and utilizing software tools for efficient management of sponsorships, volunteer programs, and grant applications. Implement sound policies and standards for volunteer programs, ensuring consistent oversight from operational staff.
• Developing formal policies that provide a foundation for direction to staff and drive pricing strategies as well as earned income and partnership development.
• Embracing innovation in funding models, such as exploring Public-Private Partnerships (P3), to finance large-scale projects without straining the city budgets. Stay abreast of industry trends and be prepared to adapt strategies based on emerging opportunities.
• Utilizing data and feedback to continuously improve funding strategies, ensuring they remain effective and responsive to the evolving needs of the community.
The successful implementation of these strategies will contribute to the longterm well-being of the community and the continued growth and improvement of Independence Parks and Recreation.
Independence has completed several recent park improvements over the past few years that have energized and activated their park system. However, there are still aging amenities that have reached their lifecycle and will need to be replaced. The projects identified in the Capital Improvement Plan (“CIP”) are beyond the scope of Independence’s normal maintenance and operating budget, covering non-routine major maintenance such as replacement, refurbishing, renovations, etc. While the period of focus is five years, in some cases an extended lookout for 10 years was used to identify larger projects to ensure Independence continues to keep pace by anticipating future needed improvements and development.
The approach to updating the CIP is a threetier plan that acknowledges the current fiscal realities, potential changes to current funding, acquiring alternative funding sources, and the importance of continued community support. Each tier is defined below and reflects different assumptions about available resources.
Sustainable Projects prioritize spending within existing needs that impact the safety, enjoyment, and increased access. The intention of this tier is to make the most of the existing resources with the primary goal being for the department to maintain the current level of service. The actions associated with this fiscally responsible approach address current maintenance needs and anticipated maintenance at existing parks and facilities and will be funded through existing funding sources and alternative funding when available.
Expanded Services Projects describes the extra services or capital improvement that should be undertaken when additional funding is available. This includes strategically enhancing existing capital assets that would require additional operational or capital funding. In coordination with the City Manager’s Office, Mayor, Council, and Park Commission, the Parks and Recreation Department should evaluate and analyze potential sources of additional revenue, including but not limited to partnerships, naming rights, increased recreation and program revenues, grants, and capital bond funding, if appropriate, when existing debt service is retired in the future.
Visionary Projects represents the complete set of services and facilities identified by the community. It is a long-range look at the level of service and lifecycle replacement to address future needs and deficiencies. In this Master Plan, the Visionary Projects address aging facilities to make improvements in operational effectiveness and the overall sustainability of the park and recreation system as well as new facilities. Funding for visionary projects would be derived from partnerships, private investments, and capital bond funding, if appropriate, when existing debt service is retired in the future.
This fiscally responsible approach to the Capital Improvement Projects comes from the City’s monitoring of existing financial and capital asset conditions. The Independence system has matured, and the city needs to replace older playgrounds, shelters, sports courts, and infrastructure throughout the park system. In addition, Independence’s population is expected to increase over the next ten years, placing more demand on the existing parks and recreation system and level of service. These factors have important budgetary implications. Over the past several years, Independence has experienced an increase in maintenance and operation demands. Once parks age, they will be more labor intensive by design and condition, and liability issues will become a significant maintenance and operation concern. Furthermore, as parks age, they may not meet the public’s expectations for recreational use or aesthetics. This will have a causal effect on the heavy use of new parks and facilities, requiring them to experience increased maintenance needs.

General Project Recommendations (For Community Parks At A Minimum)
• Park Lifecycle (Equipment and Infrastructure)
• Parking / Trails / Sidewalks (10-15 years)
• Playgrounds (20 years)
• Restrooms (20 years)
• Furniture (5-10 years)
• Furniture Standards (Re-furbish and Replacement)
• Benches
• Trash Receptacles
• Grills
• Lighting
• Drinking Fountains
• Security Lighting
• ADA Standards for all Incoming Projects/Retrofits
• Sidewalk Minimums (10-12' Width) Concrete
• Eliminating restrooms (Neighborhood Parks and Lower; Unless Splash pad present)
• Color Scheme For Parks
• Create Signage Standards (Re-furbish Signage)
General Trail Recommendations
• Maintain Walking Paths
• Trail System Connections
• Trailhead Amenities At Access Points
• Heart Health Trails With Equipment and Shade
or bi-annual basis to include performance standards and consistent operational terms and conditions.
General Fund budget for
specific
and
by .5-1% every year over the next five years.
1.11 Strategy: Increase operating budget per capita from $65.99 to $100 by 2031. (Equates to $12,162,900 for operating budget which is the national median average for similar size cities)
Strategy: Identify non-core functions for outsourcing and streamline operational planning.
Strategy: Establish a park impact fee and a land dedication ordinance on new development to help support the needs for neighborhood parks in underserviced areas of the city for acquiring new parks and making the improvements to the site once purchased.
1.17 Strategy: Formalize a sponsorship policy that allows for corporate sponsorship opportunities including naming
Strategy: Develop a Park and Heritage Foundation to maximize opportunities for additional funding through grants, private donations, and endowments.
1.19 Strategy: Revisit bond referendum for future major capital improvements including a downtown Community Center.
1.20 Strategy: Create business plans for all revenue generating facilities and amenities.
1.1 Strategy:
Vision for Operations and Management: Foster a high-performing and responsive team that is
Create a functional organizational chart to identify gaps in labor and further define roles/responsibilities. Maximize staffing structure and efficiencies to address underserved areas of operations with adequate funding (e.g., additional maintenance and programming staff).
1.2 Strategy:
Increase total FTEs for parks and recreation management from 58.50 to national median average 102 over the next five years.
1.3 Strategy: Consider the development of a five-year staffing plan to proactively plan for any staff changes that might happen in the future and update annually.
1.4 Strategy: Create dedicated administrative and customer service positions for parks and recreation divisions.
1.5 Strategy: Create a planning and performance management position to collect and analyze data to inform future strategies.
1.6 Strategy:
Increase staff proficiency in parks and recreation management and governmental business acumen.
1.7 Strategy:
Evaluate current technology systems through a needs assessment to identify areas for improvement, automation, and new customer services to improve the operational efficiencies and user experience.
1.8 Strategy:
Balance and expand volunteer opportunities throughout the community. Set up a grants, alliances, partnership, and sponsorship position or division to go after earned income opportunities.
Strategy: Develop a maintenance management plan that outlines park maintenance standards, frequencies, and workload allocation
2.5 Strategy: Analyze facility utilization for indoor spaces to identify facility capacity for future, additional services.
and
Goal 3.0: Expand partnerships to support year-round and affordable programming and generate supplemental funding for facility improvements and program growth.
3.1 Strategy: Develop and update interlocal agreements with schools to guide future use of facilities.
3.2 Strategy: Collaborate with private partners, nonprofits, and local businesses for programming, sponsorships and volunteers
4.3 Strategy: Create public engagement strategy to educate the community on the true cost of recreation services that will help with future fee increase discussions. Also, provide consistent, transparent updates on park planning and projects that educate the community about funding sources
4.4 Strategy:
Create a customer journey map to visualize and document the end to end experience that a customer has with parks and recreation facilities and programming from initial awareness, through registration and service delivery to postengagement follow-up.
Strategy: Create a style guide for branding, print, and digital communication.
5.2 Strategy:
Use agreements should include clear requirements, termination clauses and performance standards. Agreements should be standardized for consistent legal, risk management, and operational terms.
Strategy: Create a standardized partnership framework with criteria for decision-making, risk-sharing, and performance evaluation.
5.4 Strategy: Update park use policies or ordinances to address modern issues (e.g., metal detecting, drones, e-bikes) and ensure consistent enforcement.
5.5 Strategy:
Vision for Parks & Facilities: Build and maintain a high-quality park system that meets the evolving needs of the community through strategic reinvestment and visionary planning.
Goal 1.0: Address community priorities through consistent and sustained park, trail, and facility investments.
1.1 Strategy: Prioritize facility upgrades at parks, facilities, and amenities with a focus on safety, infrastructure and user experience.
1.2 Strategy: Maximize facility use by consistently analyzing and adapting to utilization trends.
1.3 Strategy: Create a lifecycle replacement plan for equipment and infrastructure and prioritize attention on deferred maintenance items.
1.4 Strategy: Schedule preventive maintenance consistently across parks, facilities and amenities through a computerized maintenance management system (CMMS).
1.5 Strategy: Apply consistent design and maintenance standards across all parks and facilities.
1.6 Strategy: Conduct facility condition assessments and develop a facility reinvestment plan based on return on investment, community priorities, and usage data.
1.7 Strategy: Eliminate deferred maintenance for high investment priorities first as identified in community survey.
1.8 Strategy: Invest in specific parks, facilities, and amenities as identified in park assessments based on the level of service needs, community priorities from statistically valid survey, usage trend data, recreation trend data, and service gaps.
1.9 Strategy: Transition right of way maintenance for roadside trails to public works.
1.10 Strategy: Repurpose underutilized indoor/outdoor spaces into flexible community use spaces.
Strategy: Prioritize investments and new amenities in underserved east-side neighborhoods.
1.13 Strategy: Install lighting, increase security patrols, and enhance visibility of staff in priority parks and facilities.
Strategy: Create signage standards and refurbish entry, wayfinding and regulatory signage throughout parks
1.15 Strategy: Manage inappropriate park use and encampments that deter the public from using parks and trails for the safety of all users of the parks.
1.16 Strategy: Redesign existing parks that are past their useful life with updated park equipment to re-establish use and safety in each park.
1.17 Strategy: Increase trail use, safety and links to neighborhoods that supports the health and wellness of users of the trails to make Independence residents more healthy.
1.18 Strategy: Implement remainder of Athletic Complex master plan and upgrade park facilities and amenities.
1.19 Strategy: Create recognition for City with upgraded playgrounds and spraygrounds - potential bond
Vision for Recreation Programming: Create experiences for Independence residents to maintain active, healthy, and connected lives through inclusive and innovative recreation programming and community events.
Goal 1.0: Expand programming to include a comprehensive range of new and enhanced activities in the areas of Aquatics, Arts and Culture, Active Adults, Fitness, Health, and Wellness; Community Special Events; Youth and Teen Services, Youth Sports, and Nature Education and Outdoor Adventure.
1.1 Strategy:
Introduce out of school camps and early learning, literacy, science, technology, engineering, arts, and math programs in partnership with schools and libraries.
1.2 Strategy: Launch flexible drop-in programs, social events, and senioryouth mentorship opportunities.
1.3 Strategy: Create customized rental packages (e.g., esports for teens, clubs for seniors); enhance multipurpose room design and access.
1.4 Strategy:
Define role in inclusive, skill-based youth sports; develop coaching pipeline and clear recreational-to-competitive pathways for girls, boys, and adults.
1.5 Strategy:
Create a coordinating structure for youth sports operations and partnerships. Consider forming a non-profit youth sports commission with a governing board to coordinate scheduling, policy alignment, and collaboration among leagues to maximize resource development and facility use.
1.6 Strategy:
Integrate sports facilities and programming in City's overall tourism plan. Develop a specific sports tourism strategy to promote use of Athletic Complex and any future facilities.
1.7 Strategy:
Expand fitness and wellness programming to create more experiences that integrate social, mental and physical health benefits. Prioritize programming for active adults.
1.8 Strategy:
Add a dedicated maker space with access to instruction, technology, equipment, and supplies for different skilled trades that are focused on tech, art and design, music, and carpentry.
1.9 Strategy:
Partner with local media professionals, universities, or technology companies to offer workshops and training in video production, podcasting, social media management, and coding.
1.1 Strategy:
Develop more events and programming that promote the arts and culture/historic programming, particularly for youth.
1.11 Strategy:
Regularly analyze the program strategy as outlined in recreation program assessment to position Independence to address community demand and maximize available resources.
1.12 Strategy:
Enhance program development, marketing, business development, and customer service program training for all recreation staff.
1.13 Strategy:
Rebuild aquatics as a core program area for Independence by maintaining interim access to water-based programming through partnerships while planning a long-term aquatic programming solution that supports year-round community needs.
1.14 Strategy:
Develop a tiered approach to decision making on how support is provided and community events are planned in the future. Make sure parks and recreation is recoginized.
Independence’s parks and recreation system stands at a defining moment. This Master Plan is not simply a vision for what could be, it is a practical roadmap for what must happen next to protect public assets, strengthen neighborhoods, and improve the quality of life for residents.
The plan prioritizes reinvestment in existing parks and facilities, expands access to programs that reflect today’s community, and positions parks and recreation as a visible, reliable, and valued public service that is integral to Independence’s infrastructure and economic development goals. Most importantly, it emphasizes action, connecting long-term goals to phased strategies, clear accountability, and measurable outcomes.
At the same time, this plan is clear about what it will take to achieve successful outcomes. Simply put, revitalization requires resources. Independence cannot achieve higher service quality, safer and more welcoming parks, modern facilities, or equitable access without a meaningful increase in funding, staffing, and overall organizational capacity. Continued underinvestment will limit progress, while continued strategic reinvestment will unlock it.
Ultimately, this Master Plan provides City leadership with a disciplined framework for making those strategic investments, emphasizing fiscal responsibility, transparency, and long-term sustainability. By phasing actions over time, prioritizing what matters most, and regularly measuring progress, Independence can move forward in a targeted direction that will benefit its residents.
Ultimately, with sustained leadership, community partnerships, and strategic investment, Independence Parks and Recreation can ascend over the next five years from simply trying to maintain what exists to delivering a revitalized system that reflects the pride, potential, and future of the community it serves.


The lowest rating is 0.00 and could be achieved under either of the following two situations:
• If 100% of the respondents were positively satisfied with the delivery of the service
• If none (0%) of the respondents selected the service as one for the three most important areas for the City to emphasize over the next two years.
• Definitely Increase Emphasis (IS>=0.20)
• Increase Current Emphasis (0.10<=IS<0.20)
• Maintain Current Emphasis (IS<0.10)
The results for the City of Independence are provided on the following pages.


Ratings that are greater than or equal to 0.20 identify areas that should receive significantly more emphasis over the next two years. Ratings from 0.10 to 0.20 identify service areas that should receive increased emphasis. Ratings less than 0.10 should continue to receive the current level of emphasis.

ETC Institute administered a needs assessment survey for the City of Independence during the Spring of 2025. This survey will be used to gather input to help determine amenities, facilities, programs, activities, parks, and recreation priorities in our community.
ETC Institute mailed a survey packet to a random sample of households in Independence. Each survey packet contained a cover letter, a copy of the survey, and a postage-paid return envelope. Residents who received the survey were given the option of returning the survey by mail or completing it online at independence.communitysurvey.us
After the surveys were mailed, ETC Institute followed up with residents to encourage participation. To prevent people who were not residents of Independence from participating, everyone who completed the survey online was required to enter their home address prior to submitting the survey. ETC Institute then matched the addresses that were entered online with the addresses that were originally selected for the random sample. If the address from a survey completed online did not match one of the addresses selected for the sample, the online survey was not included in the final database for this report.
The goal was to collect a minimum of 800 surveys from residents. The goal was met with 802 surveys collected. The overall results for the sample of 802 surveys has a precision of at least +/3.5 at the 95% level of confidence.
This report contains the following:
• Charts showing the overall results of the survey (Section 2)
• Priority Investment Rating (PIR) identifies priorities for facilities, amenities, programs, and activities (Section 3)
• Benchmarks comparing data from Independence to national averages (Section 4)
• Importance-Satisfaction analysis that sets priorities for City services (Section 5)
• Tabular data showing the overall results for all questions on the survey (Section 6)
• Survey instrument (Section 7)
The major findings of the survey are summarized in the following pages.
Use of Facilities. Eighty-two percent (82%) of respondents report visiting Independence parks and/or recreation facilities during the past 12 months. Most respondents (61%) rated those facilities as either “excellent” (10%) or “good” (51%).
Barriers to Facility Use. Respondents were asked to indicate all of the reasons that prevent them and members of their household from visiting Independence parks and recreation facilities more often. The top three barriers were they do not feel safe using parks/facilities (40%), lack of features they want to use (27%), and use of other City, State, private facilities (25%).
Program Participation Thirty-five percent (35%) of respondents report participating in programs or events offered by Independence Parks and Recreation in the past 12 months. Most respondents (77%) rated these programs or events as either “excellent ” (22%) or “good” (55%).
Barriers to Participation. Respondents were asked to identify why they do not participate in these programs or events more often. The top three barriers to participation they indicated were that they don’t know what is offered (61%), too busy/not interested (20%), lack of quality programs (11%).
Communication Methods. The three ways respondents most often learn about Independence’s parks and recreation facilities, programs, and events are social media (71%), city website (41%), and neighborhood mailer (40%). The three ways they would most prefer are social media (66%), neighborhood mailer (35%), and emails from the department (34%).
Amenity/Facility Needs: Respondents were asked to identify if their household had a need for 34 facilities/amenities and to rate how well their needs for each were currently being met. Based on this analysis, ETC Institute was able to estimate the number of households in the community that had the greatest “unmet” need for various facilities/amenities.
The three amenities/facilities with the highest percentage of households that have an unmet need:
1.Outdoor pool/aquatics
2. Indoor pool space
3. Indoor warm water pool for therapy and swim lessons
The number of households that have unmet needs for each of the 34 facilities/amenities assessed is shown in the chart below.
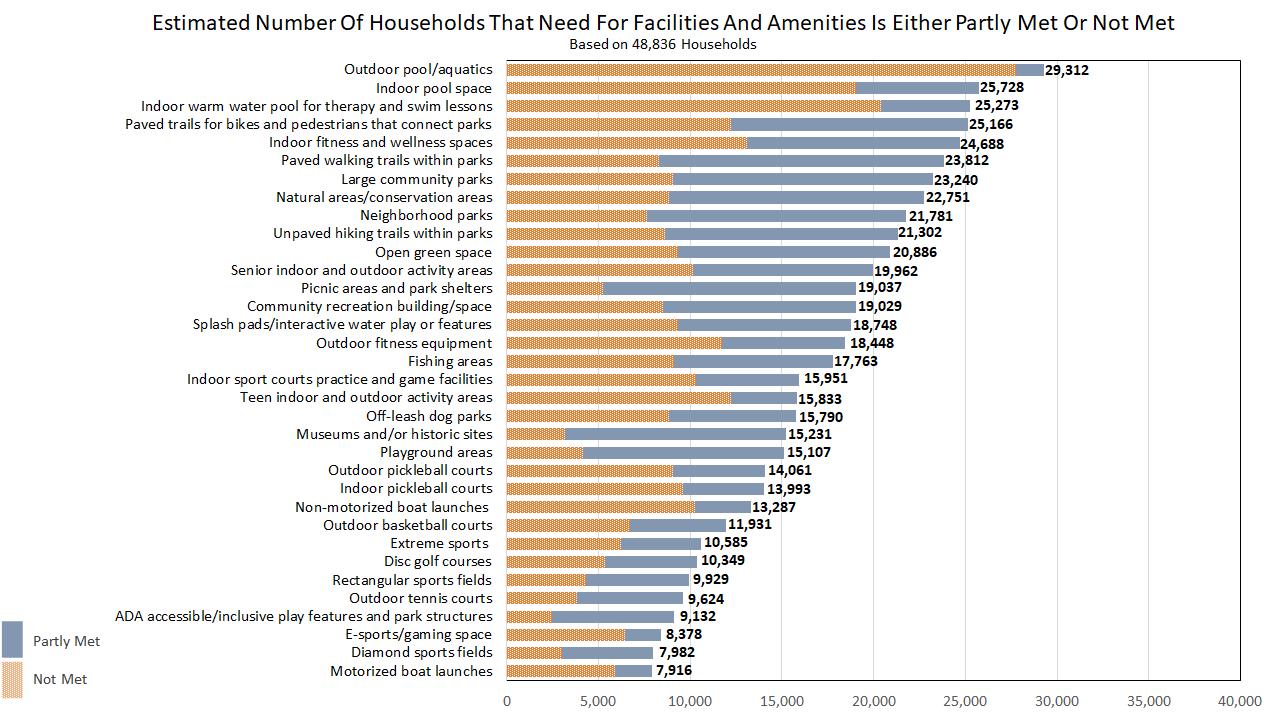
Amenities/Facilities Importance: In addition to assessing the needs for each amenity/facility, ETC Institute also assessed the importance that residence placed on each item. Based on the sum of respondents top four choices, these were the four amenities/facilities ranked most important to residents:
1.Outdoor pool/aquatics
2. Neighborhood parks
3. Indoor pool space
4. Indoor warm water pool for therapy and swim lessons
The percentage of residents who selected each amenity/facility as one of their top four choices is shown in the chart on the following page
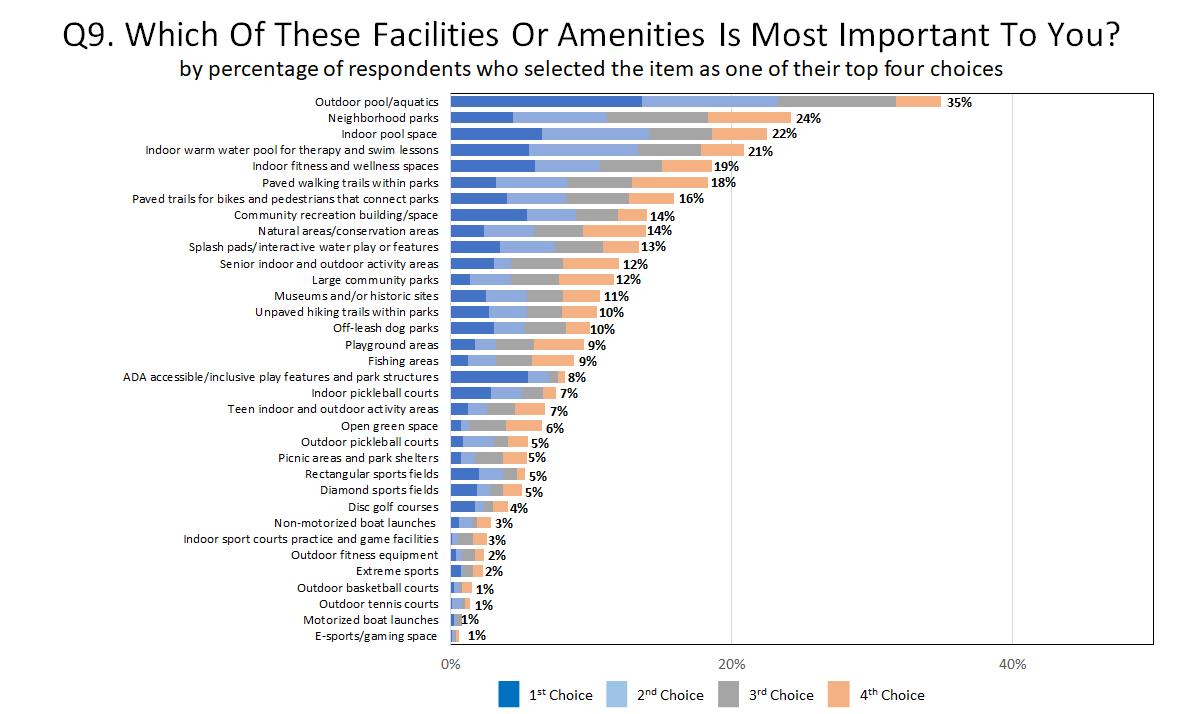
Priorities for Facility Investments: The Priority Investment Rating (PIR) was developed by ETC Institute to provide organizations with an objective tool for evaluating the priority that should be placed in recreation and parks investments. The Priority Investment Rating (PIR) equally weighs (1)the importance that residents place on amenities/facilities and (2) how many residents have unmet need for the amenity/facility. [Details regarding the methodology for this analysis are provided in Section 3 of this report.]
Based on the Priority Investment Rating (PIR), the following amenities/facilities were rated as high priorities for investments:
• Outdoor pool/aquatics (PIR=200)
• Indoor pool space (PIR=152.2)
• Indoor warm water pool for therapy and swim lessons (PIR=146.1)
• Neighborhood parks (PIR=143.6)
• Indoor fitness and wellness spaces (PIR=137.5)
• Paved walking trails within parks (PIR=133.7)
• Paved trails for bikes and pedestrians that connect parks (PIR=131.4)
• Natural areas/conservation areas (PIR=117.4)
• Large community parks (PIR=112.5)
• Community recreation building/space (PIR=105)
• Senior indoor and outdoor activity areas (PIR=102.5)
• Unpaved hiking trails within parks (PIR=102.5)
• Splash pads/interactive water play or features (PIR=102.5)
The chart below shows the Priority Investment Rating for each of the 34 amenities/facilities assessed on the survey.
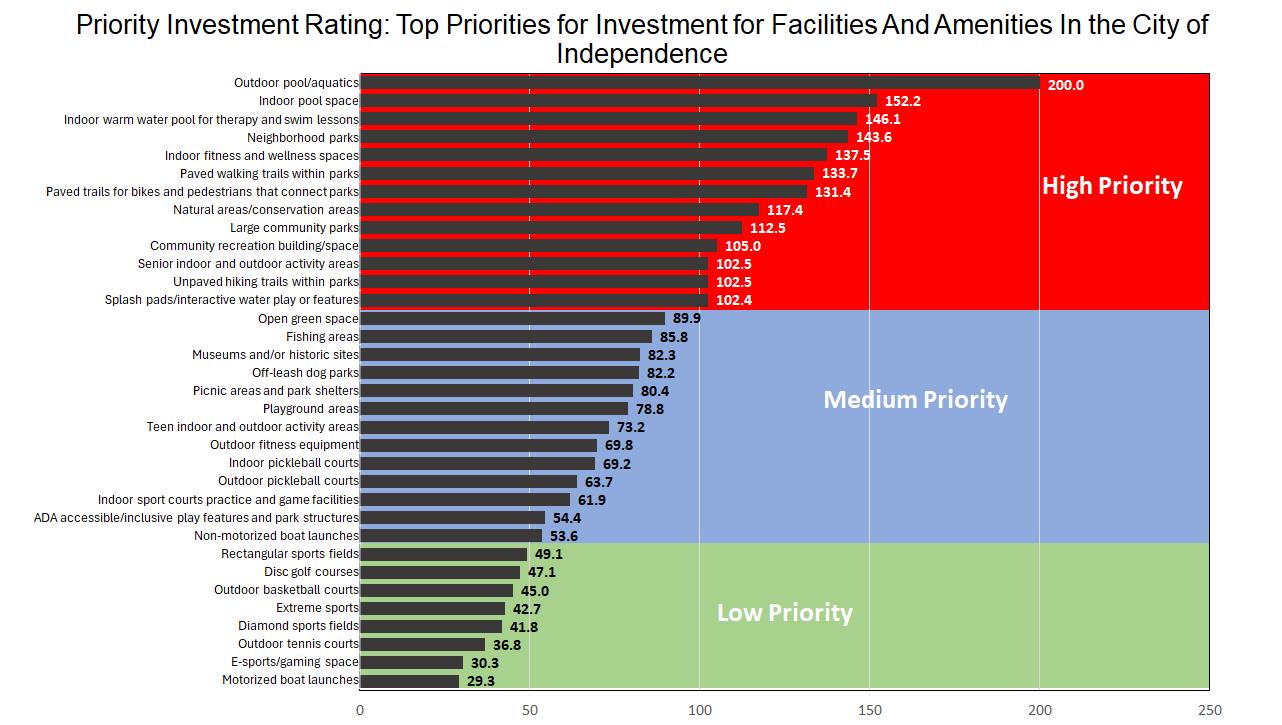
Program Needs: Respondents were asked to identify if their household had a need for 28 recreation programs and activities and to rate how well their needs for each were currently being met. Based on this analysis, ETC Institute was able to estimate the number of households in the community that had the greatest “unmet” need for various programs.
The three programs with the highest number of households that have an unmet need:
1. Special events
2. Adult fitness and wellness programs
3. Water fitness programs
The estimated number of households that have unmet needs for each of the 28 programs assessed is shown in the chart below.
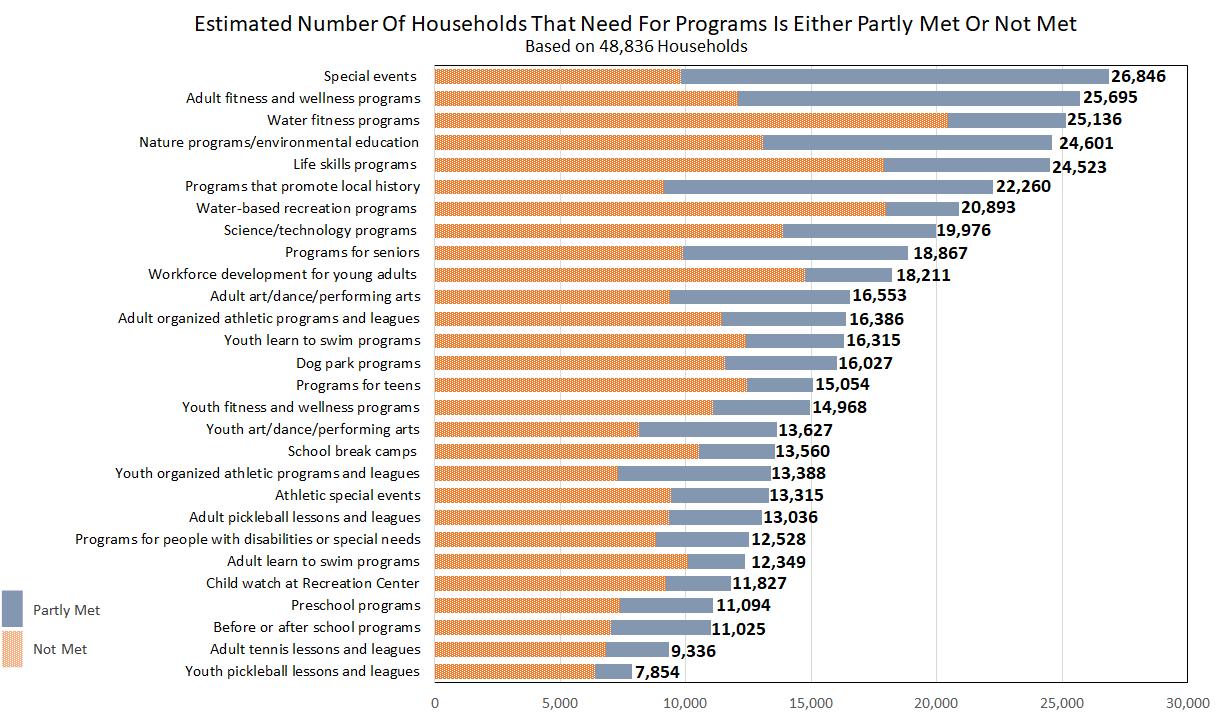
Programs Importance: In addition to assessing the needs for each program, ETC Institute also assessed the importance that residents placed on each item. Based on the sum of respondents’ top four choices, these were the four programs ranked most important to residents:
1. Special events
2. Adult fitness and wellness programs
3. Programs for seniors
4. Life skill programs
The percentage of residents who selected each program as one of their top four choices is shown in the chart below.
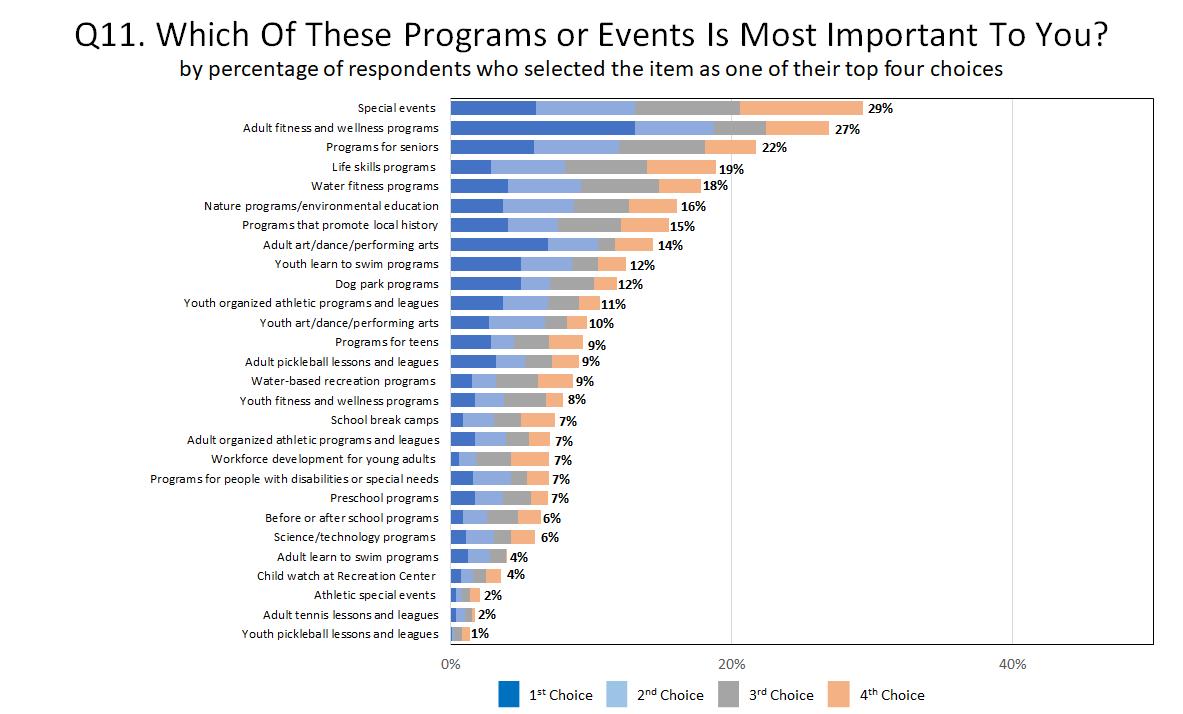
Based the Priority Investment Rating (PIR), the following activities/programs were rated as high priorities for investment:
• Special events (PIR=200)
• Adult fitness and wellness programs (PIR=187.5)
• Life skill programs (PIR=155.9)
• Water fitness programs (PIR=154.4)
• Nature programs/environmental education (PIR=146.6)
• Programs for seniors (PIR=144.3)
• Programs that promote local history (PIR=135.8)
• Adult art/dance/performing arts (PIR=110.8)
• Water-based recreation programs (PIR=107.5)
• Youth learn to swim programs (PIR=103.4)
• Dog park programs (PIR=100)
The chart below shows the Priority Investment Rating for each of the 28 programs assessed on the survey.
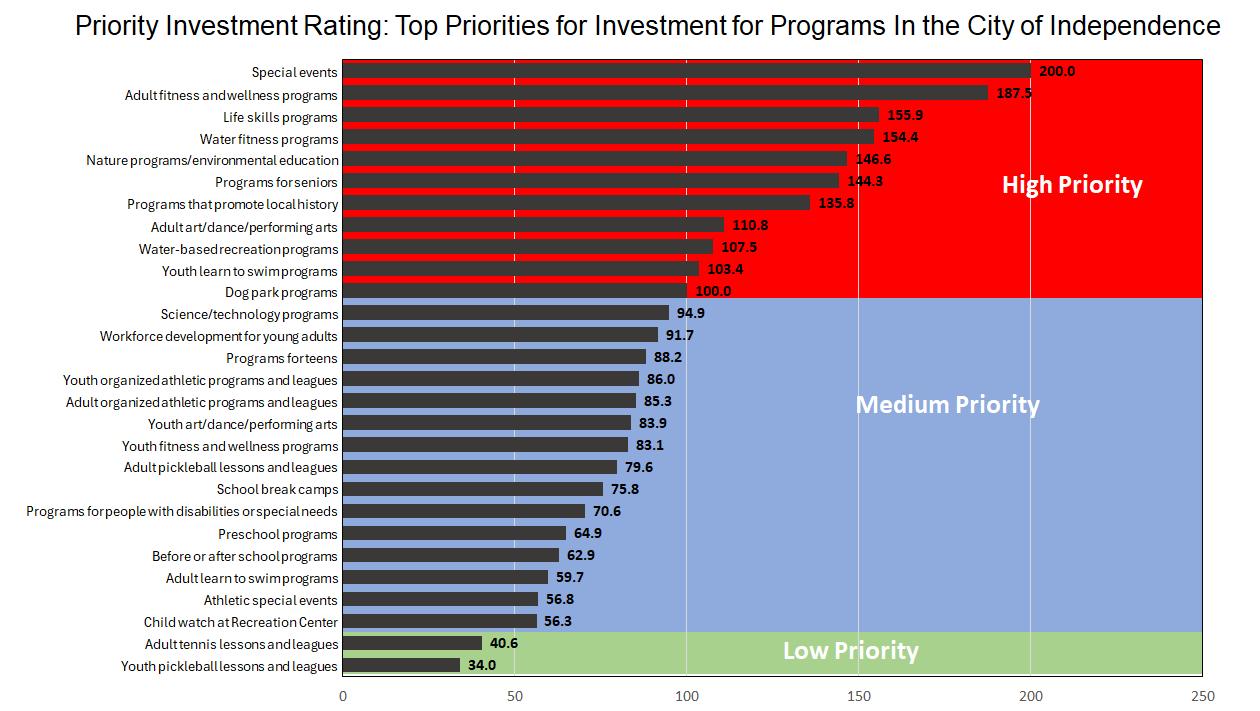
Counting yourself, how many people in your household are... by percentage of respondents
Ages 5-9
Ages 10-14
Today, City officials have limited resources which need to be targeted to activities that are of the most benefit to their citizens. Two of the most important criteria for decision making are (1) to target resources toward services of the highest importance to citizens; and (2) to target resources toward those services where citizens are the least satisfied.
Ages 15-19
Ages 20-24
Ages 25-34
Ages 35-44
Ages 45-54
Ages 55-64
The Importance-Satisfaction (IS) rating is a unique tool that allows public officials to better understand both of these highly important decision-making criteria for each of the services they are providing. The Importance-Satisfaction rating is based on the concept that public agencies will maximize overall customer satisfaction by emphasizing improvements in those areas where the level of satisfaction is relatively low, and the perceived importance of the service is relatively high.
Ages 65-79 Ages 80+
The rating is calculated by summing the percentage of responses for items selected as the first, second, and third most important services for the City to provide. The sum is then multiplied by 1 minus the percentage of respondents who indicated they were positively satisfied with the City’s performance in the related area (the sum of the ratings of 4 and 5 on a 5-p oint scale excluding “Don’t Know” responses). “Don’t Know” responses are excluded from the calculation to ensure the satisfaction ratings among service categories are comparable. [IS=Importance x (1-Satisfaction)].
Q2. Have you or any members of your household visited any parks or recreation facilities offered by the City of Independence in the last year? by percentage of respondents
Example of the Calculation: Respondents were asked to identify the city services they think are most important for the City to provide. Thirty-six percent (36.2%) of respondents selected availability of information about programs/facilities as one of the most important services for the City to provide.
With regard to satisfaction, 26.8% of respondents surveyed rated the City’s overall performance on availability of information about programs/facilities, as a “4” or “5” on a 5-point scale (where “5” means “Very Satisfied”) excluding “Don’t Know” responses. The I-S rating for availability of information about programs/facilities was calculated by multiplying the sum of the most important percentages by 1 minus the sum of the satisfaction percentages. In this example 36.2% was multiplied by 73.2% (1-0.268). This calculation yielded an I-S rating of 0.2650 which ranked first out of 15 major service categories.
The maximum rating is 1.00 and would be achieved when 100% of the respondents select an item as one of their top three choices to emphasize over the next two years and 0% indicate they are positively satisfied with the delivery of the service.
The lowest rating is 0.00 and could be achieved under either of the following two situations:
• If 100% of the respondents were positively satisfied with the delivery of the service
Q2a. Overall quality of the parks and recreation facilities you have visited.
by percentage of respondents (excluding “not provided”)
• If none (0%) of the respondents selected the service as one for the three most important areas for the City to emphasize over the next two years.
Ratings that are greater than or equal to 0.20 identify areas that should receive significantly more emphasis over the next two years. Ratings from 0.10 to 0.20 identify service areas that should receive increased emphasis. Ratings less than 0.10 should continue to receive the current level of emphasis.
• Definitely Increase Emphasis (IS>=0.20)
• Increase Current Emphasis (0.10<=IS<0.20)
• Maintain Current Emphasis (IS<0.10)
The results for the City of Independence are provided on the following pages.
Q2b. If your household has NOT visited any parks and recreation facilities in the last year, please CHECK ALL the following reasons why you did NOT visit.
Do not feel safe using parks/facilities
Lack of features we want to use
Use other City, State, private facilities
Not aware of park or facility locations
Parks/facilities are not well maintained
Old & outdated facilities
Lack of restrooms
Too far from home
Facility equipment doesn't meet my needs
Lack of parking to access parks/facilities
Do not feel welcomed/accommodated
Fees are too high/lack of financial assistance
Lack of transportation
Lack of ADA accessibility
Language/cultural barriers/age barriers
Q3. Have you or any members of your household visited any Cityowned museums and attractions in the City of Independence in the last year? by percentage of respondents
Today, City officials have limited resources which need to be targeted to activities that are of the most benefit to their citizens. Two of the most important criteria for decision making are (1) to target resources toward services of the highest importance to citizens; and (2) to target resources toward those services where citizens are the least satisfied.
The Importance-Satisfaction (IS) rating is a unique tool that allows public officials to better understand both of these highly important decision-making criteria for each of the services they are providing. The Importance-Satisfaction rating is based on the concept that public agencies will maximize overall customer satisfaction by emphasizing improvements in those areas where the level of satisfaction is relatively low, and the perceived importance of the service is relatively high.
The rating is calculated by summing the percentage of responses for items selected as the first, second, and third most important services for the City to provide. The sum is then multiplied by 1 minus the percentage of respondents who indicated they were positively satisfied with the City’s performance in the related area (the sum of the ratings of 4 and 5 on a 5-p oint scale excluding “Don’t Know” responses). “Don’t Know” responses are excluded from the calculation to ensure the satisfaction ratings among service categories are comparable. [IS=Importance x (1-Satisfaction)].
Please CHECK ALL the City-owned museums and attractions you or members of your household have visited. by
Example of the Calculation: Respondents were asked to identify the city services they think are most important for the City to provide. Thirty-six percent (36.2%) of respondents selected availability of information about programs/facilities as one of the most important services for the City to provide.
With regard to satisfaction, 26.8% of respondents surveyed rated the City’s overall performance on availability of information about programs/facilities, as a “4” or “5” on a 5-point scale (where “5” means “Very Satisfied”) excluding “Don’t Know” responses. The I-S rating for availability of information about programs/facilities was calculated by multiplying the sum of the most important percentages by 1 minus the sum of the satisfaction percentages. In this example 36.2% was multiplied by 73.2% (1-0.268). This calculation yielded an I-S rating of 0.2650 which ranked first out of 15 major service categories.
The maximum rating is 1.00 and would be achieved when 100% of the respondents select an item as one of their top three choices to emphasize over the next two years and 0% indicate they are positively satisfied with the delivery of the service.
The lowest rating is 0.00 and could be achieved under either of the following two situations:
• If 100% of the respondents were positively satisfied with the delivery of the service
Q3b. Overall quality of the historic sites you have visited. by percentage of respondents (excluding “not provided”)
• If none (0%) of the respondents selected the service as one for the three most important areas for the City to emphasize over the next two years.
Ratings that are greater than or equal to 0.20 identify areas that should receive significantly more emphasis over the next two years. Ratings from 0.10 to 0.20 identify service areas that should receive increased emphasis. Ratings less than 0.10 should continue to receive the current level of emphasis.
• Definitely Increase Emphasis (IS>=0.20)
• Increase Current Emphasis (0.10<=IS<0.20)
• Maintain Current Emphasis (IS<0.10) The results for the City of Independence
Q3c. If your household has NOT visited any of the City-owned museums and attractions in the last year, please CHECK ALL of the following reasons why you did NOT visit.
respondents
Q4. Have you or any members of your household participated in any parks and recreation programs or events offered in the past year? by percentage of respondents
Today, City officials have limited resources which need to be targeted to activities that are of the most benefit to their citizens. Two of the most important criteria for decision making are (1) to target resources toward services of the highest importance to citizens; and (2) to target resources toward those services where citizens are the least satisfied.
The Importance-Satisfaction (IS) rating is a unique tool that allows public officials to better understand both of these highly important decision-making criteria for each of the services they are providing. The Importance-Satisfaction rating is based on the concept that public agencies will maximize overall customer satisfaction by emphasizing improvements in those areas where the level of satisfaction is relatively low, and the perceived importance of the service is relatively high.
The rating is calculated by summing the percentage of responses for items selected as the first, second, and third most important services for the City to provide. The sum is then multiplied by 1 minus the percentage of respondents who indicated they were positively satisfied with the City’s performance in the related area (the sum of the ratings of 4 and 5 on a 5-p oint scale excluding “Don’t Know” responses). “Don’t Know” responses are excluded from the calculation to ensure the satisfaction ratings among service categories are comparable. [IS=Importance x (1-Satisfaction)].
by percentage of respondents (excluding “not provided”)
Example of the Calculation: Respondents were asked to identify the city services they think are most important for the City to provide. Thirty-six percent (36.2%) of respondents selected availability of information about programs/facilities as one of the most important services for the City to provide.
With regard to satisfaction, 26.8% of respondents surveyed rated the City’s overall performance on availability of information about programs/facilities, as a “4” or “5” on a 5-point scale (where “5” means “Very Satisfied”) excluding “Don’t Know” responses. The I-S rating for availability of information about programs/facilities was calculated by multiplying the sum of the most important percentages by 1 minus the sum of the satisfaction percentages. In this example 36.2% was multiplied by 73.2% (1-0.268). This calculation yielded an I-S rating of 0.2650 which ranked first out of 15 major service categories.
The maximum rating is 1.00 and would be achieved when 100% of the respondents select an item as one of their top three choices to emphasize over the next two years and 0% indicate they are positively satisfied with the delivery of the service.
The lowest rating is 0.00 and could be achieved under either of the following two situations:
• If 100% of the respondents were positively satisfied with the delivery of the service
Q4b. If your household has NOT participated in any parks and recreation programs or events during the past year, please CHECK ALL the following reasons why you have NOT participated. by percentage of respondents (excluding “not provided”)
• If none (0%) of the respondents selected the service as one for the three most important areas for the City to emphasize over the next two years.
I don't know what is offered
Too busy/not interested
Lack of quality programs
Program times are not convenient
Safety concerns
Fees are too high/lack of financial assistance
Ratings that are greater than or equal to 0.20 identify areas that should receive significantly more emphasis over the next two years. Ratings from 0.10 to 0.20 identify service areas that should receive increased emphasis. Ratings less than 0.10 should continue to receive the current level of emphasis.
Use programs of other agencies
Prefer individual activities
Program not offered
Lack of transportation
• Definitely Increase Emphasis (IS>=0.20)
Do not feel welcomed/accommodated
• Increase Current Emphasis (0.10<=IS<0.20)
Too far from home
Lack of quality instructors
• Maintain Current Emphasis (IS<0.10)
Registration is difficult
Prefer virtual programming
Language/cultural/age barriers
The results for the City of Independence are provided on the following pages.
Q5. Please CHECK ALL of the providers listed below that you or members of your household use for parks, recreation facilities, historic sites, recreation programs, or events. by
of respondents
Parks & Recreation
Jackson County Parks & Rec Blue Springs Parks & Recreation
Lee's Summit Parks & Recreation
Churches/religious organizations
KCMO
Local school/college/university
Q5a. Please CHECK ALL of the parks and recreation activities or amenities you take part in that are OUTSIDE of Independence. by percentage of respondents
Today, City officials have limited resources which need to be targeted to activities that are of the most benefit to their citizens. Two of the most important criteria for decision making are (1) to target resources toward services of the highest importance to citizens; and (2) to target resources toward those services where citizens are the least satisfied.
The Importance-Satisfaction (IS) rating is a unique tool that allows public officials to better understand both of these highly important decision-making criteria for each of the services they are providing. The Importance-Satisfaction rating is based on the concept that public agencies will maximize overall customer satisfaction by emphasizing improvements in those areas where the level of satisfaction is relatively low, and the perceived importance of the service is relatively high.
The rating is calculated by summing the percentage of responses for items selected as the first, second, and third most important services for the City to provide. The sum is then multiplied by 1 minus the percentage of respondents who indicated they were positively satisfied with the City’s performance in the related area (the sum of the ratings of 4 and 5 on a 5-p oint scale excluding “Don’t Know” responses). “Don’t Know” responses are excluded from the calculation to ensure the satisfaction ratings among service categories are comparable. [IS=Importance x (1-Satisfaction)].
Example of the Calculation: Respondents were asked to identify the city services they think are most important for the City to provide. Thirty-six percent (36.2%) of respondents selected availability of information about programs/facilities as one of the most important services for the City to provide.
With regard to satisfaction, 26.8% of respondents surveyed rated the City’s overall performance on availability of information about programs/facilities, as a “4” or “5” on a 5-point scale (where “5” means “Very Satisfied”) excluding “Don’t Know” responses. The I-S rating for availability of information about programs/facilities was calculated by multiplying the sum of the most important percentages by 1 minus the sum of the satisfaction percentages. In this example 36.2% was multiplied by 73.2% (1-0.268). This calculation yielded an I-S rating of 0.2650 which ranked first out of 15 major service categories.
The maximum rating is 1.00 and would be achieved when 100% of the respondents select an item as one of their top three choices to emphasize over the next two years and 0% indicate they are positively satisfied with the delivery of the service.
The lowest rating is 0.00 and could be achieved under either of the following two situations:
• If 100% of the respondents were positively satisfied with the delivery of the service
• If none (0%) of the respondents selected the service as one for the three most important areas for the City to emphasize over the next two years.
Q6. Please CHECK ALL the ways you currently learn or would like to learn about the Parks and Recreation Department programs, activities, and events. by percentage of respondents
Ratings that are greater than or equal to 0.20 identify areas that should receive significantly more emphasis over the next two years. Ratings from 0.10 to 0.20 identify service areas that should receive increased emphasis. Ratings less than 0.10 should continue to receive the current level of emphasis.
Emails from the department
Banners/signs at parks or facilities
• Definitely Increase Emphasis (IS>=0.20)
• Increase Current Emphasis (0.10<=IS<0.20)
• Maintain Current Emphasis (IS<0.10)
Friends & neighbors
Newspaper and/or community publication
Promotions at special events
The results for the City of Independence are provided on the following pages.
Handout materials at parks or recreation facilities
Conversations with recreation staff
Q7. Most preferred ways to learn about the Parks and Recreation Department programs, activities, and events. by percentage of respondents who selected the item as one of their top three choices
Today, City officials have limited resources which need to be targeted to activities that are of the most benefit to their citizens. Two of the most important criteria for decision making are (1) to target resources toward services of the highest importance to citizens; and (2) to target resources toward those services where citizens are the least satisfied.
Banners/signs at parks or facilities Flyers
Newspaper and/or community publication
The Importance-Satisfaction (IS) rating is a unique tool that allows public officials to better understand both of these highly important decision-making criteria for each of the services they are providing. The Importance-Satisfaction rating is based on the concept that public agencies will maximize overall customer satisfaction by emphasizing improvements in those areas where the level of satisfaction is relatively low, and the perceived importance of the service is relatively high.
The rating is calculated by summing the percentage of responses for items selected as the first, second, and third most important services for the City to provide. The sum is then multiplied by 1 minus the percentage of respondents who indicated they were positively satisfied with the City’s performance in the related area (the sum of the ratings of 4 and 5 on a 5-p oint scale excluding “Don’t Know” responses). “Don’t Know” responses are excluded from the calculation to ensure the satisfaction ratings among service categories are comparable. [IS=Importance x (1-Satisfaction)].
Q8. How Well Your Needs Are Being Met For Each Of These Facilities Or Amenities by percentage of respondents (excluding without “no need”)
Museums and/or historic sites
Diamond sports fields
Playground areas
Picnic areas and park shelters
Example of the Calculation: Respondents were asked to identify the city services they think are most important for the City to provide. Thirty-six percent (36.2%) of respondents selected availability of information about programs/facilities as one of the most important services for the City to provide.
Neighborhood parks
ADA accessible/inclusive play features
Outdoor tennis courts
Rectangular sports fields
With regard to satisfaction, 26.8% of respondents surveyed rated the City’s overall performance on availability of information about programs/facilities, as a “4” or “5” on a 5-point scale (where “5” means “Very Satisfied”) excluding “Don’t Know” responses. The I-S rating for availability of information about programs/facilities was calculated by multiplying the sum of the most important percentages by 1 minus the sum of the satisfaction percentages. In this example 36.2% was multiplied by 73.2% (1-0.268). This calculation yielded an I-S rating of 0.2650 which ranked first out of 15 major service categories.
Paved walking trails within parks
Community recreation building/space
Large community parks
Natural areas/conservation areas
Open green space
Unpaved hiking trails within parks
Disc golf courses
Paved trails for bikes and pedestrians that connect parks
Splash pads/interactive water play or features
Outdoor basketball courts
The maximum rating is 1.00 and would be achieved when 100% of the respondents select an item as one of their top three choices to emphasize over the next two years and 0% indicate they are positively satisfied with the delivery of the service.
The lowest rating is 0.00 and could be achieved under either of the following two situations:
Q8. How Well Your Needs Are Being Met For Each Of These Facilities Or Amenities: Cont. by percentage of respondents (excluding without “no need”)
• If 100% of the respondents were positively satisfied with the delivery of the service
• If none (0%) of the respondents selected the service as one for the three most important areas for the City to emphasize over the next two years.
Ratings that are greater than or equal to 0.20 identify areas that should receive significantly more emphasis over the next two years. Ratings from 0.10 to 0.20 identify service areas that should receive increased emphasis. Ratings less than 0.10 should continue to receive the current level of emphasis.
• Definitely Increase Emphasis (IS>=0.20)
• Increase Current Emphasis (0.10<=IS<0.20)
• Maintain Current Emphasis (IS<0.10)
The results for the City of Independence are provided on the following pages.
by
Today, City officials have limited resources which need to be targeted to activities that are of the most benefit to their citizens. Two of the most important criteria for decision making are (1) to target resources toward services of the highest importance to citizens; and (2) to target resources toward those services where citizens are the least satisfied.
The Importance-Satisfaction (IS) rating is a unique tool that allows public officials to better understand both of these highly important decision-making criteria for each of the services they are providing. The Importance-Satisfaction rating is based on the concept that public agencies will maximize overall customer satisfaction by emphasizing improvements in those areas where the level of satisfaction is relatively low, and the perceived importance of the service is relatively high.
The rating is calculated by summing the percentage of responses for items selected as the first, second, and third most important services for the City to provide. The sum is then multiplied by 1 minus the percentage of respondents who indicated they were positively satisfied with the City’s performance in the related area (the sum of the ratings of 4 and 5 on a 5-p oint scale excluding “Don’t Know” responses). “Don’t Know” responses are excluded from the calculation to ensure the satisfaction ratings among service categories are comparable. [IS=Importance x (1-Satisfaction)].
Paved walking trails within parks Neighborhood parks
Large community parks
Museums and/or historic sites
Picnic areas and park shelters
Paved trails for bikes and pedestrians that connect parks
Natural areas/conservation areas
Indoor
Example of the Calculation: Respondents were asked to identify the city services they think are most important for the City to provide. Thirty-six percent (36.2%) of respondents selected availability of information about programs/facilities as one of the most important services for the City to provide.
and wellness spaces
green
With regard to satisfaction, 26.8% of respondents surveyed rated the City’s overall performance on availability of information about programs/facilities, as a “4” or “5” on a 5-point scale (where “5” means “Very Satisfied”) excluding “Don’t Know” responses. The I-S rating for availability of information about programs/facilities was calculated by multiplying the sum of the most important percentages by 1 minus the sum of the satisfaction percentages. In this example 36.2% was multiplied by 73.2% (1-0.268). This calculation yielded an I-S rating of 0.2650 which ranked first out of 15 major service categories.
The maximum rating is 1.00 and would be achieved when 100% of the respondents select an item as one of their top three choices to emphasize over the next two years and 0% indicate they are positively satisfied with the delivery of the service.
The lowest rating is 0.00 and could be achieved under either of the following two situations:
Estimated Number Of Households That Need For Facilities And Amenities Is Either Partly Met Or Not Met Based on 48,836 Households
Outdoor pool/aquatics
• If 100% of the respondents were positively satisfied with the delivery of the service
Indoor pool space
Indoor warm water pool for therapy and swim lessons
Paved trails for bikes and pedestrians that connect parks
• If none (0%) of the respondents selected the service as one for the three most important areas for the City to emphasize over the next two years.
Indoor fitness and wellness spaces
Paved walking trails within parks
Large community parks
Natural areas/conservation areas
Neighborhood parks
Unpaved hiking trails within parks
Open green space
Senior indoor and outdoor activity areas
Picnic areas and park shelters
Community recreation building/space
Splash pads/interactive water play or features
Outdoor fitness equipment Fishing areas
Indoor sport courts practice and game facilities
Ratings that are greater than or equal to 0.20 identify areas that should receive significantly more emphasis over the next two years. Ratings from 0.10 to 0.20 identify service areas that should receive increased emphasis. Ratings less than 0.10 should continue to receive the current level of emphasis.
Teen indoor and outdoor activity areas
Off-leash dog parks
Museums and/or historic sites Playground areas
Outdoor pickleball courts
• Definitely Increase Emphasis (IS>=0.20)
Indoor pickleball courts
Non-motorized boat launches
• Increase Current Emphasis (0.10<=IS<0.20)
Outdoor basketball courts
Extreme sports Disc golf courses
• Maintain Current Emphasis (IS<0.10)
Rectangular sports fields
ADA accessible/inclusive play features and park structures
The results for the City of Independence are provided on the following pages.
by percentage of respondents (excluding without “no need”)
Adult art/dance/performing arts
Programs for seniors
Preschool programs
Youth art/dance/performing arts
Adult fitness and wellness programs
Nature programs/environmental education
Adult pickleball lessons and leagues
Dog park programs
Athletic special events
School break camps (fall/spring/summer)
Q10. How Well Your Needs Are Being Met For Each Of These Programs: Cont. by percentage of respondents (excluding without “no need”)
Programs for people with disabilities or special needs
Youth pickleball lessons and leagues
Adult learn to swim programs
Adult tennis lessons and leagues
Adult organized athletic programs and leagues
Today, City officials have limited resources which need to be targeted to activities that are of the most benefit to their citizens. Two of the most important criteria for decision making are (1) to target resources toward services of the highest importance to citizens; and (2) to target resources toward those services where citizens are the least satisfied.
Youth learn to swim programs
Youth fitness and wellness programs
Water fitness programs
Child watch at Recreation Center
Science/technology programs
The Importance-Satisfaction (IS) rating is a unique tool that allows public officials to better understand both of these highly important decision-making criteria for each of the services they are providing. The Importance-Satisfaction rating is based on the concept that public agencies will maximize overall customer satisfaction by emphasizing improvements in those areas where the level of satisfaction is relatively low, and the perceived importance of the service is relatively high.
Programs for teens
Life skills programs
development for young adults
recreation programs
The rating is calculated by summing the percentage of responses for items selected as the first, second, and third most important services for the City to provide. The sum is then multiplied by 1 minus the percentage of respondents who indicated they were positively satisfied with the City’s performance in the related area (the sum of the ratings of 4 and 5 on a 5-p oint scale excluding “Don’t Know” responses). “Don’t Know” responses are excluded from the calculation to ensure the satisfaction ratings among service categories are comparable. [IS=Importance x (1-Satisfaction)].
Which Of These Programs or Events Is Most Important To You? by percentage of respondents who selected the item as one of their top four choices
Example of the Calculation: Respondents were asked to identify the city services they think are most important for the City to provide. Thirty-six percent (36.2%) of respondents selected availability of information about programs/facilities as one of the most important services for the City to provide.
Youth learn to swim programs Dog park programs
Youth organized athletic programs and leagues
Youth art/dance/performing
With regard to satisfaction, 26.8% of respondents surveyed rated the City’s overall performance on availability of information about programs/facilities, as a “4” or “5” on a 5-point scale (where “5” means “Very Satisfied”) excluding “Don’t Know” responses. The I-S rating for availability of information about programs/facilities was calculated by multiplying the sum of the most important percentages by 1 minus the sum of the satisfaction percentages. In this example 36.2% was multiplied by 73.2% (1-0.268). This calculation yielded an I-S rating of 0.2650 which ranked first out of 15 major service categories.
Water-based recreation programs
Youth fitness and wellness programs
School break camps
Adult organized athletic programs and leagues
Workforce development for young adults
Programs for people with disabilities or special needs
Preschool programs Before or after school programs
programs
The maximum rating is 1.00 and would be achieved when 100% of the respondents select an item as one of their top three choices to emphasize over the next two years and 0% indicate they are positively satisfied with the delivery of the service.
The lowest rating is 0.00 and could be achieved under either of the following two situations:
• If 100% of the respondents were positively satisfied with the delivery of the service
• If none (0%) of the respondents selected the service as one for the three most important areas for the City to emphasize over the next two years.
Special events
Adult fitness and wellness programs
Programs that promote local history
Nature programs/environmental education
Water fitness programs
Life skills programs
Programs for seniors
Water-based recreation programs
Science/technology programs
Adult art/dance/performing arts
Workforce development for young adults
Adult organized athletic programs and leagues
Ratings that are greater than or equal to 0.20 identify areas that should receive significantly more emphasis over the next two years. Ratings from 0.10 to 0.20 identify service areas that should receive increased emphasis. Ratings less than 0.10 should continue to receive the current level of emphasis.
Dog park programs
Youth learn to swim programs
Youth organized athletic programs and leagues
Youth art/dance/performing arts
• Definitely Increase Emphasis (IS>=0.20)
Youth fitness and wellness programs
• Increase Current Emphasis (0.10<=IS<0.20)
Programs for teens
School break camps
• Maintain Current Emphasis (IS<0.10)
Adult pickleball lessons and leagues
Athletic special events
Before or after school programs
Programs for people with disabilities or special needs
Adult learn to swim programs
The results for the City of Independence are provided on the following pages.
Preschool programs
Child watch at Recreation Center
Adult tennis lessons and leagues
Youth pickleball lessons and leagues
events
Adult fitness and wellness
Programs that promote local history
Nature programs/environmental education
Water fitness programs
Life skills programs
Programs for seniors
Water-based recreation programs
Science/technology programs
Adult art/dance/performing arts
Workforce development for young adults
Adult organized athletic programs and leagues
Dog park programs
Youth learn to swim programs
Youth organized athletic programs and leagues
Youth art/dance/performing arts
Youth fitness and wellness programs
Programs for teens
School break camps
Adult pickleball lessons and leagues
Athletic special events
Before or after school programs
Programs for people with disabilities or special needs
Adult learn to swim programs
Preschool programs
Child watch at Recreation Center
Adult tennis lessons and leagues
Youth pickleball lessons and leagues
Estimated Number Of Households That Need For Programs Is Either Partly Met Or Not Met Based on 48,836 Households
Special events
Adult fitness and wellness programs
Water fitness programs
Nature programs/environmental education
Life skills programs
Programs that promote local history
Water-based recreation programs
Science/technology programs
Programs for seniors
Workforce development for young adults
Today, City officials have limited resources which need to be targeted to activities that are of the most benefit to their citizens. Two of the most important criteria for decision making are (1) to target resources toward services of the highest importance to citizens; and (2) to target resources toward those services where citizens are the least satisfied.
Adult art/dance/performing arts
Adult organized athletic programs and leagues
Youth learn to swim programs
Dog park programs
Programs for teens
Youth fitness and wellness programs
Youth art/dance/performing arts
School break camps
The Importance-Satisfaction (IS) rating is a unique tool that allows public officials to better understand both of these highly important decision-making criteria for each of the services they are providing. The Importance-Satisfaction rating is based on the concept that public agencies will maximize overall customer satisfaction by emphasizing improvements in those areas where the level of satisfaction is relatively low, and the perceived importance of the service is relatively high.
Youth organized athletic programs and leagues
Athletic special events
Adult pickleball lessons and leagues
Programs for people with disabilities or special needs
Adult learn to swim programs
Child watch at Recreation Center
Preschool programs
Before or after school programs
Adult tennis lessons and leagues
Youth pickleball lessons and leagues
The rating is calculated by summing the percentage of responses for items selected as the first, second, and third most important services for the City to provide. The sum is then multiplied by 1 minus the percentage of respondents who indicated they were positively satisfied with the City’s performance in the related area (the sum of the ratings of 4 and 5 on a 5-p oint scale excluding “Don’t Know” responses). “Don’t Know” responses are excluded from the calculation to ensure the satisfaction ratings among service categories are comparable. [IS=Importance x (1-Satisfaction)].
Example of the Calculation: Respondents were asked to identify the city services they think are most important for the City to provide. Thirty-six percent (36.2%) of respondents selected availability of information about programs/facilities as one of the most important services for the City to provide.
Fees
website
Ease of registering for classes offered by the city
Variety of different types of parks in the city
The days and times that recreation programs are offered
Quality of programs for adults
Quality of programs for families with children
Security in city parks and on trails
With regard to satisfaction, 26.8% of respondents surveyed rated the City’s overall performance on availability of information about programs/facilities, as a “4” or “5” on a 5-point scale (where “5” means “Very Satisfied”) excluding “Don’t Know” responses. The I-S rating for availability of information about programs/facilities was calculated by multiplying the sum of the most important percentages by 1 minus the sum of the satisfaction percentages. In this example 36.2% was multiplied by 73.2% (1-0.268). This calculation yielded an I-S rating of 0.2650 which ranked first out of 15 major service categories.
Availability of information about programs/facilities
Variety of programs offered by the city
The maximum rating is 1.00 and would be achieved when 100% of the respondents select an item as one of their top three choices to emphasize over the next two years and 0% indicate they are positively satisfied with the delivery of the service.
The lowest rating is 0.00 and could be achieved under either of the following two situations:
• If 100% of the respondents were positively satisfied with the delivery of the service
next five
by percentage of respondents who selected the item as one of their top three choices
• If none (0%) of the respondents selected the service as one for the three most important areas for the City to emphasize over the next two years.
Maintenance of parks
Availability of information about programs/facilities
Security in city parks and on trails
Maintenance of recreation centers
Quality of programs for adults
Variety of different types of parks in the city
Quality of programs for families with children
Ratings that are greater than or equal to 0.20 identify areas that should receive significantly more emphasis over the next two years. Ratings from 0.10 to 0.20 identify service areas that should receive increased emphasis. Ratings less than 0.10 should continue to receive the current level of emphasis.
Variety of programs offered by the city
Fees charged for city recreation programs
The days and times that recreation programs are offered
• Definitely Increase Emphasis (IS>=0.20)
User friendliness of city website
• Increase Current Emphasis (0.10<=IS<0.20)
Ease of registering for classes offered by the city
• Maintain Current Emphasis (IS<0.10)
Available parking spaces at parks
Lighting at sport courts and fields
of renting/reserving a city
The results for the City of Independence are provided on the following pages.
percentage of respondents
by percentage of respondents who selected the item as one of their top three choices
Today, City officials have limited resources which need to be targeted to activities that are of the most benefit to their citizens. Two of the most important criteria for decision making are (1) to target resources toward services of the highest importance to citizens; and (2) to target resources toward those services where citizens are the least satisfied.
The Importance-Satisfaction (IS) rating is a unique tool that allows public officials to better understand both of these highly important decision-making criteria for each of the services they are providing. The Importance-Satisfaction rating is based on the concept that public agencies will maximize overall customer satisfaction by emphasizing improvements in those areas where the level of satisfaction is relatively low, and the perceived importance of the service is relatively high.
The rating is calculated by summing the percentage of responses for items selected as the first, second, and third most important services for the City to provide. The sum is then multiplied by 1 minus the percentage of respondents who indicated they were positively satisfied with the City’s performance in the related area (the sum of the ratings of 4 and 5 on a 5-p oint scale excluding “Don’t Know” responses). “Don’t Know” responses are excluded from the calculation to ensure the satisfaction ratings among service categories are comparable. [IS=Importance x (1-Satisfaction)].
Q16. Would you be willing to support a General Obligation bond to support improvements to parks and recreation facilities and programs? by percentage of respondents (excluding “not provided”)
Example of the Calculation: Respondents were asked to identify the city services they think are most important for the City to provide. Thirty-six percent (36.2%) of respondents selected availability of information about programs/facilities as one of the most important services for the City to provide.
With regard to satisfaction, 26.8% of respondents surveyed rated the City’s overall performance on availability of information about programs/facilities, as a “4” or “5” on a 5-point scale (where “5” means “Very Satisfied”) excluding “Don’t Know” responses. The I-S rating for availability of information about programs/facilities was calculated by multiplying the sum of the most important percentages by 1 minus the sum of the satisfaction percentages. In this example 36.2% was multiplied by 73.2% (1-0.268). This calculation yielded an I-S rating of 0.2650 which ranked first out of 15 major service categories.
The maximum rating is 1.00 and would be achieved when 100% of the respondents select an item as one of their top three choices to emphasize over the next two years and 0% indicate they are positively satisfied with the delivery of the service.
The lowest rating is 0.00 and could be achieved under either of the following two situations:
Q16a. Check ALL improvements you would support. by percentage of respondents who answered “yes” to Question 16
• If 100% of the respondents were positively satisfied with the delivery of the service
New indoor rec/community center with aquatics
• If none (0%) of the respondents selected the service as one for the three most important areas for the City to emphasize over the next two years.
Ratings that are greater than or equal to 0.20 identify areas that should receive significantly more emphasis over the next two years. Ratings from 0.10 to 0.20 identify service areas that should receive increased emphasis. Ratings less than 0.10 should continue to receive the current level of emphasis.
• Definitely Increase Emphasis (IS>=0.20)
• Increase Current Emphasis (0.10<=IS<0.20)
• Maintain Current Emphasis (IS<0.10)
The results for the City of Independence are provided on the following pages.
Q17. Please rate your satisfaction with the overall value your household receives from the City of Independence Parks and Recreation Department. by percentage of respondents (excluding “don’t know”)
Q18. How would you want the City to fund future parks, recreation, trails and open space needs? by percentage of respondents (excluding “don’t know”)
Maintain existing funding levels
Today, City officials have limited resources which need to be targeted to activities that are of the most benefit to their citizens. Two of the most important criteria for decision making are (1) to target resources toward services of the highest importance to citizens; and (2) to target resources toward those services where citizens are the least satisfied.
The Importance-Satisfaction (IS) rating is a unique tool that allows public officials to better understand both of these highly important decision-making criteria for each of the services they are providing. The Importance-Satisfaction rating is based on the concept that public agencies will maximize overall customer satisfaction by emphasizing improvements in those areas where the level of satisfaction is relatively low, and the perceived importance of the service is relatively high.
The rating is calculated by summing the percentage of responses for items selected as the first, second, and third most important services for the City to provide. The sum is then multiplied by 1 minus the percentage of respondents who indicated they were positively satisfied with the City’s performance in the related area (the sum of the ratings of 4 and 5 on a 5-p oint scale excluding “Don’t Know” responses). “Don’t Know” responses are excluded from the calculation to ensure the satisfaction ratings among service categories are comparable. [IS=Importance x (1-Satisfaction)].
Q19. How important do you feel it is for the City of Independence to provide high quality parks and recreation programs and facilities? by
of respondents (excluding “don’t know”)
Example of the Calculation: Respondents were asked to identify the city services they think are most important for the City to provide. Thirty-six percent (36.2%) of respondents selected availability of information about programs/facilities as one of the most important services for the City to provide.
With regard to satisfaction, 26.8% of respondents surveyed rated the City’s overall performance on availability of information about programs/facilities, as a “4” or “5” on a 5-point scale (where “5” means “Very Satisfied”) excluding “Don’t Know” responses. The I-S rating for availability of information about programs/facilities was calculated by multiplying the sum of the most important percentages by 1 minus the sum of the satisfaction percentages. In this example 36.2% was multiplied by 73.2% (1-0.268). This calculation yielded an I-S rating of 0.2650 which ranked first out of 15 major service categories.
The maximum rating is 1.00 and would be achieved when 100% of the respondents select an item as one of their top three choices to emphasize over the next two years and 0% indicate they are positively satisfied with the delivery of the service.
The lowest rating is 0.00 and could be achieved under either of the following two situations:
Q20. How important are historic sites to the City of Independence? by percentage of respondents (excluding “don’t know”)
• If 100% of the respondents were positively satisfied with the delivery of the service
• If none (0%) of the respondents selected the service as one for the three most important areas for the City to emphasize over the next two years.
Ratings that are greater than or equal to 0.20 identify areas that should receive significantly more emphasis over the next two years. Ratings from 0.10 to 0.20 identify service areas that should receive increased emphasis. Ratings less than 0.10 should continue to receive the current level of emphasis.
• Definitely Increase Emphasis (IS>=0.20)
• Increase Current Emphasis (0.10<=IS<0.20)
• Maintain Current Emphasis (IS<0.10)
The results for the City of Independence are provided on the following pages.
Q21. Who do you believe should own and maintain historic sites in the City of Independence? by percentage of respondents (excluding “don’t know”)
by percentage of respondents (excluding not provided)
Today, City officials have limited resources which need to be targeted to activities that are of the most benefit to their citizens. Two of the most important criteria for decision making are (1) to target resources toward services of the highest importance to citizens; and (2) to target resources toward those services where citizens are the least satisfied.
The Importance-Satisfaction (IS) rating is a unique tool that allows public officials to better understand both of these highly important decision-making criteria for each of the services they are providing. The Importance-Satisfaction rating is based on the concept that public agencies will maximize overall customer satisfaction by emphasizing improvements in those areas where the level of satisfaction is relatively low, and the perceived importance of the service is relatively high.
Methodology
The rating is calculated by summing the percentage of responses for items selected as the first, second, and third most important services for the City to provide. The sum is then multiplied by 1 minus the percentage of respondents who indicated they were positively satisfied with the City’s performance in the related area (the sum of the ratings of 4 and 5 on a 5-p oint scale excluding “Don’t Know” responses). “Don’t Know” responses are excluded from the calculation to ensure the satisfaction ratings among service categories are comparable. [IS=Importance x (1-Satisfaction)].
by percentage of respondents (excluding
Example of the Calculation: Respondents were asked to identify the city services they think are most important for the City to provide. Thirty-six percent (36.2%) of respondents selected availability of information about programs/facilities as one of the most important services for the City to provide.
With regard to satisfaction, 26.8% of respondents surveyed rated the City’s overall performance on availability of information about programs/facilities, as a “4” or “5” on a 5-point scale (where “5” means “Very Satisfied”) excluding “Don’t Know” responses. The I-S rating for availability of information about programs/facilities was calculated by multiplying the sum of the most important percentages by 1 minus the sum of the satisfaction percentages. In this example 36.2% was multiplied by 73.2% (1-0.268). This calculation yielded an I-S rating of 0.2650 which ranked first out of 15 major service categories.
The maximum rating is 1.00 and would be achieved when 100% of the respondents select an item as one of their top three choices to emphasize over the next two years and 0% indicate they are positively satisfied with the delivery of the service.
The lowest rating is 0.00 and could be achieved under either of the following two situations:
by percentage of respondents (excluding not provided)
• If 100% of the respondents were positively satisfied with the delivery of the service
• If none (0%) of the respondents selected the service as one for the three most important areas for the City to emphasize over the next two years.
Ratings that are greater than or equal to 0.20 identify areas that should receive significantly more emphasis over the next two years. Ratings from 0.10 to 0.20 identify service areas that should receive increased emphasis. Ratings less than 0.10 should continue to receive the current level of emphasis.
• Definitely Increase Emphasis (IS>=0.20)
• Increase Current Emphasis (0.10<=IS<0.20)
• Maintain Current Emphasis (IS<0.10)
The results for the City of Independence are provided on the following pages.
Do you own or rent your current residence? by percentage of respondents (excluding not provided)
by percentage of respondents (excluding not provided)
Today, City officials have limited resources which need to be targeted to activities that are of the most benefit to their citizens. Two of the most important criteria for decision making are (1) to target resources toward services of the highest importance to citizens; and (2) to target resources toward those services where citizens are the least satisfied.
The Importance-Satisfaction (IS) rating is a unique tool that allows public officials to better understand both of these highly important decision-making criteria for each of the services they are providing. The Importance-Satisfaction rating is based on the concept that public agencies will maximize overall customer satisfaction by emphasizing improvements in those areas where the level of satisfaction is relatively low, and the perceived importance of the service is relatively high.
The rating is calculated by summing the percentage of responses for items selected as the first, second, and third most important services for the City to provide. The sum is then multiplied by 1 minus the percentage of respondents who indicated they were positively satisfied with the City’s performance in the related area (the sum of the ratings of 4 and 5 on a 5-p oint scale excluding “Don’t Know” responses). “Don’t Know” responses are excluded from the calculation to ensure the satisfaction ratings among service categories are comparable. [IS=Importance x (1-Satisfaction)].
Example of the Calculation: Respondents were asked to identify the city services they think are most important for the City to provide. Thirty-six percent (36.2%) of respondents selected availability of information about programs/facilities as one of the most important services for the City to provide.
With regard to satisfaction, 26.8% of respondents surveyed rated the City’s overall performance on availability of information about programs/facilities, as a “4” or “5” on a 5-point scale (where “5” means “Very Satisfied”) excluding “Don’t Know” responses. The I-S rating for availability of information about programs/facilities was calculated by multiplying the sum of the most important percentages by 1 minus the sum of the satisfaction percentages. In this example 36.2% was multiplied by 73.2% (1-0.268). This calculation yielded an I-S rating of 0.2650 which ranked first out of 15 major service categories.
The maximum rating is 1.00 and would be achieved when 100% of the respondents select an item as one of their top three choices to emphasize over the next two years and 0% indicate they are positively satisfied with the delivery of the service.
The Priority Investment Rating (PIR) was developed by ETC Institute to provide governments with an objective tool for evaluating the priority that should be placed on parks and recreation investments. The Priority Investment Rating was developed by ETC Institute to identify the facilities and programs residents think should receive the highest priority for investment. The priority investment rating reflects the importance residents place on items (sum of top 4 choices) and the unmet needs (needs that are only being partly or not met) for each facility/program relative to the facility/program that rated the highest overall. Since decisions related to future investments should consider both the level of unmet need and the importance of facilities and programs, the PIR weights each of these components equally.
Today, City officials have limited resources which need to be targeted to activities that are of the most benefit to their citizens. Two of the most important criteria for decision making are (1) to target resources toward services of the highest importance to citizens; and (2) to target resources toward those services where citizens are the least satisfied.
The Importance-Satisfaction (IS) rating is a unique tool that allows public officials to better understand both of these highly important decision-making criteria for each of the services they are providing. The Importance-Satisfaction rating is based on the concept that public agencies will maximize overall customer satisfaction by emphasizing improvements in those areas where the level of satisfaction is relatively low, and the perceived importance of the service is relatively high.
The PIR reflects the sum of the Unmet Needs Rating and the Importance Rating as shown in the equation below:
PIR = UNR + IR
The rating is calculated by summing the percentage of responses for items selected as the first, second, and third most important services for the City to provide. The sum is then multiplied by 1 minus the percentage of respondents who indicated they were positively satisfied with the City’s performance in the related area (the sum of the ratings of 4 and 5 on a 5-p oint scale excluding “Don’t Know” responses). “Don’t Know” responses are excluded from the calculation to ensure the satisfaction ratings among service categories are comparable. [IS=Importance x (1-Satisfaction)].
For example, suppose the Unmet Needs Rating for playgrounds is 26.5 (out of 100) and the Importance Rating for playgrounds is 52 (out of 100), the Priority Investment Rating for playgrounds would be 78.5 (out of 200).
How to Analyze the Charts:
• High Priority Areas are those with a PIR of at least 120. A rating of 100 or above generally indicates there is a relatively high level of unmet need and residents generally think it is important to fund improvements in these areas. Improvements in this area are likely to have a positive impact on the greatest number of households.
Example of the Calculation: Respondents were asked to identify the city services they think are most important for the City to provide. Thirty-six percent (36.2%) of respondents selected availability of information about programs/facilities as one of the most important services for the City to provide.
• Medium Priority Areas are those with a PIR of 60-119. A rating in this range generally indicates there is a medium to high level of unmet need or a significant percentage of residents generally think it is important to fund improvements in these areas.
With regard to satisfaction, 26.8% of respondents surveyed rated the City’s overall performance on availability of information about programs/facilities, as a “4” or “5” on a 5-point scale (where “5” means “Very Satisfied”) excluding “Don’t Know” responses. The I-S rating for availability of information about programs/facilities was calculated by multiplying the sum of the most important percentages by 1 minus the sum of the satisfaction percentages. In this example 36.2% was multiplied by 73.2% (1-0.268). This calculation yielded an I-S rating of 0.2650 which ranked first out of 15 major service categories.
The maximum rating is 1.00 and would be achieved when 100% of the respondents select an item as one of their top three choices to emphasize over the next two years and 0% indicate they are positively satisfied with the delivery of the service.
• Low Priority Areas are those with a PIR below 60. A rating in this range generally indicates there is a relatively low level of unmet need and residents do not think it is important to fund improvements in these areas. Improvements may be warranted if the needs of very specialized populations are being targeted. The following pages show the Unmet Needs Rating, Importance Rating, and Priority Investment Rating for facilities and programs.
The lowest rating is 0.00 and could be achieved under either of the following two situations:
• If 100% of the respondents were positively satisfied with the delivery of the service
• If none (0%) of the respondents selected the service as one for the three most important areas for the City to emphasize over the next two years.
Ratings that are greater than or equal to 0.20 identify areas that should receive significantly more emphasis over the next two years. Ratings from 0.10 to 0.20 identify service areas that should receive increased emphasis. Ratings less than 0.10 should continue to receive the current level of emphasis.
• Definitely Increase Emphasis (IS>=0.20)
• Increase Current Emphasis (0.10<=IS<0.20)
• Maintain Current Emphasis (IS<0.10)
The rating for the item with the most unmet need=100 The rating of all other items reflects the relative amount of unmet need for each item compared to the item with the most unm et need
The results for the City of Independence are provided on the following pages.
and/or historic sites Playground areas Outdoor pickleball courts Indoor pickleball courts
Non-motorized boat launches Outdoor basketball courts Extreme sports Disc golf courses
Rectangular sports fields Outdoor tennis courts
ADA accessible/inclusive play features and park structures E-sports/gaming space Diamond sports fields
Motorized boat launches
Today, City officials have limited resources which need to be targeted to activities that are of the most benefit to their citizens. Two of the most important criteria for decision making are (1) to target resources toward services of the highest importance to citizens; and (2) to target resources toward those services where citizens are the least satisfied.
The Importance-Satisfaction (IS) rating is a unique tool that allows public officials to better understand both of these highly important decision-making criteria for each of the services they are providing. The Importance-Satisfaction rating is based on the concept that public agencies will maximize overall customer satisfaction by emphasizing improvements in those areas where the level of satisfaction is relatively low, and the perceived importance of the service is relatively high.
The rating is calculated by summing the percentage of responses for items selected as the first, second, and third most important services for the City to provide. The sum is then multiplied by 1 minus the percentage of respondents who indicated they were positively satisfied with the City’s performance in the related area (the sum of the ratings of 4 and 5 on a 5-p oint scale excluding “Don’t Know” responses). “Don’t Know” responses are excluded from the calculation to ensure the satisfaction ratings among service categories are comparable. [IS=Importance x (1-Satisfaction)].
The rating for the item rated as the most important=100 The rating of all other items reflects the relative level of importance for each item compared to the item rated as the most im portant
Example of the Calculation: Respondents were asked to identify the city services they think are most important for the City to provide. Thirty-six percent (36.2%) of respondents selected availability of information about programs/facilities as one of the most important services for the City to provide.
With regard to satisfaction, 26.8% of respondents surveyed rated the City’s overall performance on availability of information about programs/facilities, as a “4” or “5” on a 5-point scale (where “5” means “Very Satisfied”) excluding “Don’t Know” responses. The I-S rating for availability of information about programs/facilities was calculated by multiplying the sum of the most important percentages by 1 minus the sum of the satisfaction percentages. In this example 36.2% was multiplied by 73.2% (1-0.268). This calculation yielded an I-S rating of 0.2650 which ranked first out of 15 major service categories.
The maximum rating is 1.00 and would be achieved when 100% of the respondents select an item as one of their top three choices to emphasize over the next two years and 0% indicate they are positively satisfied with the delivery of the service.
The lowest rating is 0.00 and could be achieved under either of the following two situations:
• If 100% of the respondents were positively satisfied with the delivery of the service
• If none (0%) of the respondents selected the service as one for the three most important areas for the City to emphasize over the next two years.
Ratings that are greater than or equal to 0.20 identify areas that should receive significantly more emphasis over the next two years. Ratings from 0.10 to 0.20 identify service areas that should receive increased emphasis. Ratings less than 0.10 should continue to receive the current level of emphasis.
• Definitely Increase Emphasis (IS>=0.20)
• Increase Current Emphasis (0.10<=IS<0.20)
• Maintain Current Emphasis (IS<0.10)
The results for the City of Independence are provided on the following pages.
Today, City officials have limited resources which need to be targeted to activities that are of the most benefit to their citizens. Two of the most important criteria for decision making are (1) to target resources toward services of the highest importance to citizens; and (2) to target resources toward those services where citizens are the least satisfied.
The Importance-Satisfaction (IS) rating is a unique tool that allows public officials to better understand both of these highly important decision-making criteria for each of the services they are providing. The Importance-Satisfaction rating is based on the concept that public agencies will maximize overall customer satisfaction by emphasizing improvements in those areas where the level of satisfaction is relatively low, and the perceived importance of the service is relatively high.
The rating is calculated by summing the percentage of responses for items selected as the first, second, and third most important services for the City to provide. The sum is then multiplied by 1 minus the percentage of respondents who indicated they were positively satisfied with the City’s performance in the related area (the sum of the ratings of 4 and 5 on a 5-p oint scale excluding “Don’t Know” responses). “Don’t Know” responses are excluded from the calculation to ensure the satisfaction ratings among service categories are comparable. [IS=Importance x (1-Satisfaction)].
The rating for the item with the most unmet need=100 The rating of all other items reflects the relative amount of unmet need for each item compared to the item with the most unm et need
Example of the Calculation: Respondents were asked to identify the city services they think are most important for the City to provide. Thirty-six percent (36.2%) of respondents selected availability of information about programs/facilities as one of the most important services for the City to provide.
With regard to satisfaction, 26.8% of respondents surveyed rated the City’s overall performance on availability of information about programs/facilities, as a “4” or “5” on a 5-point scale (where “5” means “Very Satisfied”) excluding “Don’t Know” responses. The I-S rating for availability of information about programs/facilities was calculated by multiplying the sum of the most important percentages by 1 minus the sum of the satisfaction percentages. In this example 36.2% was multiplied by 73.2% (1-0.268). This calculation yielded an I-S rating of 0.2650 which ranked first out of 15 major service categories.
The maximum rating is 1.00 and would be achieved when 100% of the respondents select an item as one of their top three choices to emphasize over the next two years and 0% indicate they are positively satisfied with the delivery of the service.
The lowest rating is 0.00 and could be achieved under either of the following two situations:
• If 100% of the respondents were positively satisfied with the delivery of the service
• If none (0%) of the respondents selected the service as one for the three most important areas for the City to emphasize over the next two years.
Ratings that are greater than or equal to 0.20 identify areas that should receive significantly more emphasis over the next two years. Ratings from 0.10 to 0.20 identify service areas that should receive increased emphasis. Ratings less than 0.10 should continue to receive the current level of emphasis.
• Definitely Increase Emphasis (IS>=0.20)
• Increase Current Emphasis (0.10<=IS<0.20)
• Maintain Current Emphasis (IS<0.10)
Rating for Programs in the City of Independence
The rating for the item rated as the most important=100 The rating of all other items reflects the relative level of importance for each item compared to the item rated as the most im portant
The results for the City of Independence are provided on the following pages.
Special events
Adult fitness and wellness programs Programs for seniors Life skills programs
Water fitness programs
Nature programs/environmental education Programs that promote local history
Adult art/dance/performing arts
Youth learn to swim programs Dog park programs
Youth organized athletic programs and leagues
Youth art/dance/performing arts Programs for teens
Adult pickleball lessons and leagues
Water-based recreation programs
Youth fitness and wellness programs School break camps
Adult organized athletic programs and leagues Workforce development for young adults Programs for people with disabilities or special needs Preschool programs
Before or after school programs
Science/technology programs
Adult learn to swim programs
Child watch at Recreation Center Athletic special events
Adult tennis lessons and leagues
Youth pickleball lessons and leagues
Today, City officials have limited resources which need to be targeted to activities that are of the most benefit to their citizens. Two of the most important criteria for decision making are (1) to target resources toward services of the highest importance to citizens; and (2) to target resources toward those services where citizens are the least satisfied.
The Importance-Satisfaction (IS) rating is a unique tool that allows public officials to better understand both of these highly important decision-making criteria for each of the services they are providing. The Importance-Satisfaction rating is based on the concept that public agencies will maximize overall customer satisfaction by emphasizing improvements in those areas where the level of satisfaction is relatively low, and the perceived importance of the service is relatively high.
The rating is calculated by summing the percentage of responses for items selected as the first, second, and third most important services for the City to provide. The sum is then multiplied by 1 minus the percentage of respondents who indicated they were positively satisfied with the City’s performance in the related area (the sum of the ratings of 4 and 5 on a 5-p oint scale excluding “Don’t Know” responses). “Don’t Know” responses are excluded from the calculation to ensure the satisfaction ratings among service categories are comparable. [IS=Importance x (1-Satisfaction)].
Example of the Calculation: Respondents were asked to identify the city services they think are most important for the City to provide. Thirty-six percent (36.2%) of respondents selected availability of information about programs/facilities as one of the most important services for the City to provide.
With regard to satisfaction, 26.8% of respondents surveyed rated the City’s overall performance on availability of information about programs/facilities, as a “4” or “5” on a 5-point scale (where “5” means “Very Satisfied”) excluding “Don’t Know” responses. The I-S rating for availability of information about programs/facilities was calculated by multiplying the sum of the most important percentages by 1 minus the sum of the satisfaction percentages. In this example 36.2% was multiplied by 73.2% (1-0.268). This calculation yielded an I-S rating of 0.2650 which ranked first out of 15 major service categories.
The maximum rating is 1.00 and would be achieved when 100% of the respondents select an item as one of their top three choices to emphasize over the next two years and 0% indicate they are positively satisfied with the delivery of the service.
The lowest rating is 0.00 and could be achieved under either of the following two situations:
• If 100% of the respondents were positively satisfied with the delivery of the service
• If none (0%) of the respondents selected the service as one for the three most important areas for the City to emphasize over the next two years.
Ratings that are greater than or equal to 0.20 identify areas that should receive significantly more emphasis over the next two years. Ratings from 0.10 to 0.20 identify service areas that should receive increased emphasis. Ratings less than 0.10 should continue to receive the current level of emphasis.
• Definitely Increase Emphasis (IS>=0.20)
• Increase Current Emphasis (0.10<=IS<0.20)
• Maintain Current Emphasis (IS<0.10)
The results for the City of Independence are provided on the following pages.
Have used in the past year
"Excellent" Rated "Excellent" or "Good"
Today, City officials have limited resources which need to be targeted to activities that are of the most benefit to their citizens. Two of the most important criteria for decision making are (1) to target resources toward services of the highest importance to citizens; and (2) to target resources toward those services where citizens are the least satisfied.
The Importance-Satisfaction (IS) rating is a unique tool that allows public officials to better understand both of these highly important decision-making criteria for each of the services they are providing. The Importance-Satisfaction rating is based on the concept that public agencies will maximize overall customer satisfaction by emphasizing improvements in those areas where the level of satisfaction is relatively low, and the perceived importance of the service is relatively high.
The rating is calculated by summing the percentage of responses for items selected as the first, second, and third most important services for the City to provide. The sum is then multiplied by 1 minus the percentage of respondents who indicated they were positively satisfied with the City’s performance in the related area (the sum of the ratings of 4 and 5 on a 5-p oint scale excluding “Don’t Know” responses). “Don’t Know” responses are excluded from the calculation to ensure the satisfaction ratings among service categories are comparable. [IS=Importance x (1-Satisfaction)].
Example of the Calculation: Respondents were asked to identify the city services they think are most important for the City to provide. Thirty-six percent (36.2%) of respondents selected availability of information about programs/facilities as one of the most important services for the City to provide.
Do not feel safe using parks/facilities Lack of features we want to use Use other City, State, private facilities Not aware of park or facility locations
Parks/facilities are not well maintained Old & outdated facilities Lack of restrooms Too far from home
Facility equipment doesn't meet my needs
Lack of parking to access parks/facilities Do not feel welcomed/accommodated Fees are too high/lack of financial assistance Lack of transportation Lack of ADA accessibility
With regard to satisfaction, 26.8% of respondents surveyed rated the City’s overall performance on availability of information about programs/facilities, as a “4” or “5” on a 5-point scale (where “5” means “Very Satisfied”) excluding “Don’t Know” responses. The I-S rating for availability of information about programs/facilities was calculated by multiplying the sum of the most important percentages by 1 minus the sum of the satisfaction percentages. In this example 36.2% was multiplied by 73.2% (1-0.268). This calculation yielded an I-S rating of 0.2650 which ranked first out of 15 major service categories.
Language/cultural barriers/age
The maximum rating is 1.00 and would be achieved when 100% of the respondents select an item as one of their top three choices to emphasize over the next two years and 0% indicate they are positively satisfied with the delivery of the service.
The lowest rating is 0.00 and could be achieved under either of the following two situations:
• If 100% of the respondents were positively satisfied with the delivery of the service
• If none (0%) of the respondents selected the service as one for the three most important areas for the City to emphasize over the next two years.
Ratings that are greater than or equal to 0.20 identify areas that should receive significantly more emphasis over the next two years. Ratings from 0.10 to 0.20 identify service areas that should receive increased emphasis. Ratings less than 0.10 should continue to receive the current level of emphasis.
• Definitely Increase Emphasis (IS>=0.20)
• Increase Current Emphasis (0.10<=IS<0.20)
• Maintain Current Emphasis (IS<0.10)
The results for the City of Independence are provided on the following pages.
Have used in the past year Rated "Excellent" Rated "Excellent" or "Good"
Overview
Today, City officials have limited resources which need to be targeted to activities that are of the most benefit to their citizens. Two of the most important criteria for decision making are (1) to target resources toward services of the highest importance to citizens; and (2) to target resources toward those services where citizens are the least satisfied.
The Importance-Satisfaction (IS) rating is a unique tool that allows public officials to better understand both of these highly important decision-making criteria for each of the services they are providing. The Importance-Satisfaction rating is based on the concept that public agencies will maximize overall customer satisfaction by emphasizing improvements in those areas where the level of satisfaction is relatively low, and the perceived importance of the service is relatively high.
The rating is calculated by summing the percentage of responses for items selected as the first, second, and third most important services for the City to provide. The sum is then multiplied by 1 minus the percentage of respondents who indicated they were positively satisfied with the City’s performance in the related area (the sum of the ratings of 4 and 5 on a 5-p oint scale excluding “Don’t Know” responses). “Don’t Know” responses are excluded from the calculation to ensure the satisfaction ratings among service categories are comparable. [IS=Importance x (1-Satisfaction)].
Independence 2025 National Average
Example of the Calculation: Respondents were asked to identify the city services they think are most important for the City to provide. Thirty-six percent (36.2%) of respondents selected availability of information about programs/facilities as one of the most important services for the City to provide.
I don't know what is offered Too busy/not interested
Lack of quality programs Program times are not convenient Safety concerns
Fees are too high/lack of financial assistance
Use programs of other agencies
Prefer individual activities Program not offered Lack of transportation
Do not feel welcomed/accommodated Too far from home
Lack of quality instructors Registration is difficult Prefer virtual programming Language/cultural/age barriers
With regard to satisfaction, 26.8% of respondents surveyed rated the City’s overall performance on availability of information about programs/facilities, as a “4” or “5” on a 5-point scale (where “5” means “Very Satisfied”) excluding “Don’t Know” responses. The I-S rating for availability of information about programs/facilities was calculated by multiplying the sum of the most important percentages by 1 minus the sum of the satisfaction percentages. In this example 36.2% was multiplied by 73.2% (1-0.268). This calculation yielded an I-S rating of 0.2650 which ranked first out of 15 major service categories.
The maximum rating is 1.00 and would be achieved when 100% of the respondents select an item as one of their top three choices to emphasize over the next two years and 0% indicate they are positively satisfied with the delivery of the service.
The lowest rating is 0.00 and could be achieved under either of the following two situations:
• If 100% of the respondents were positively satisfied with the delivery of the service
• If none (0%) of the respondents selected the service as one for the three most important areas for the City to emphasize over the next two years.
Ratings that are greater than or equal to 0.20 identify areas that should receive significantly more emphasis over the next two years. Ratings from 0.10 to 0.20 identify service areas that should receive increased emphasis. Ratings less than 0.10 should continue to receive the current level of emphasis.
• Definitely Increase Emphasis (IS>=0.20)
• Increase Current Emphasis (0.10<=IS<0.20)
• Maintain Current Emphasis (IS<0.10)
The results for the City of Independence are provided on the following pages.
Today, City officials have limited resources which need to be targeted to activities that are of the most benefit to their citizens. Two of the most important criteria for decision making are (1) to target resources toward services of the highest importance to citizens; and (2) to target resources toward those services where citizens are the least satisfied.
The Importance-Satisfaction (IS) rating is a unique tool that allows public officials to better understand both of these highly important decision-making criteria for each of the services they are providing. The Importance-Satisfaction rating is based on the concept that public agencies will maximize overall customer satisfaction by emphasizing improvements in those areas where the level of satisfaction is relatively low, and the perceived importance of the service is relatively high.
The rating is calculated by summing the percentage of responses for items selected as the first, second, and third most important services for the City to provide. The sum is then multiplied by 1 minus the percentage of respondents who indicated they were positively satisfied with the City’s performance in the related area (the sum of the ratings of 4 and 5 on a 5-p oint scale excluding “Don’t Know” responses). “Don’t Know” responses are excluded from the calculation to ensure the satisfaction ratings among service categories are comparable. [IS=Importance x (1-Satisfaction)].
Example of the Calculation: Respondents were asked to identify the city services they think are most important for the City to provide. Thirty-six percent (36.2%) of respondents selected availability of information about programs/facilities as one of the most important services for the City to provide.
With regard to satisfaction, 26.8% of respondents surveyed rated the City’s overall performance on availability of information about programs/facilities, as a “4” or “5” on a 5-point scale (where “5” means “Very Satisfied”) excluding “Don’t Know” responses. The I-S rating for availability of information about programs/facilities was calculated by multiplying the sum of the most important percentages by 1 minus the sum of the satisfaction percentages. In this example 36.2% was multiplied by 73.2% (1-0.268). This calculation yielded an I-S rating of 0.2650 which ranked first out of 15 major service categories.
The maximum rating is 1.00 and would be achieved when 100% of the respondents select an item as one of their top three choices to emphasize over the next two years and 0% indicate they are positively satisfied with the delivery of the service.
The lowest rating is 0.00 and could be achieved under either of the following two situations:
• If 100% of the respondents were positively satisfied with the delivery of the service
• If none (0%) of the respondents selected the service as one for the three most important areas for the City to emphasize over the next two years.
Ratings that are greater than or equal to 0.20 identify areas that should receive significantly more emphasis over the next two years. Ratings from 0.10 to 0.20 identify service areas that should receive increased emphasis. Ratings less than 0.10 should continue to receive the current level of emphasis.
• Definitely Increase Emphasis (IS>=0.20)
• Increase Current Emphasis (0.10<=IS<0.20)
• Maintain Current Emphasis (IS<0.10)
The results for the City of Independence are provided on the following pages.
Note: The I-S Rating is calculated by multiplying the "Most Important" % by (1-'Satisfaction' %)
Most Important %:
Satisfaction %:
© 2025 DirectionFinder by ETC Institute
The "Most Important" percentage represents the sum of the first, second, and third most important responses for each item. Respondents were asked to identify the items they thought should be the City's top priorities.
The "Satisfaction" percentage represents the sum of the ratings "5" and "4" excluding 'don't knows.' Respondents ranked their level of satisfaction with each of the items on a scale of 5 to 1 with "5" being Very Satisfied and "1" being Very Dissatisfied.
Q1. Counting yourself, how many people in your household are...
Mean Sum
Under age 5 0.1 114
Ages 5-9 0.2 140
Ages 10-14 0.2 152
Ages 15-19 0.2 131
Ages 20-24 0.1 83
Ages 25-34 0.3 238
Ages 35-44 0.4 328
Ages 45-54 0.4 280
Ages 55-64 0.4 310
Ages 65-79 0.4 277
Ages 80+ 0.1 45
Q2. Have you or any members of your household visited any parks or recreation facilities offered by the City of Independence in the last year?
Q2. Have your household members visited any City parks or recreation facilities in last year
Q2a. Please rate the overall quality of the parks or facilities you have visited.
Q2a. Overall quality of parks or facilities you have visited
Q2a. Please rate the overall quality of the parks or facilities you have visited. (without "not provided")
Q2a. Overall quality of parks or facilities you have visited
Q2b. If your household has NOT visited any parks and recreation facilities in the last year, please CHECK ALL the following reasons why you did NOT visit.
Q2b. Reasons why your household members have not visited any parks & recreation facilities in last year
City, State,
Q3. Have you or any members of your household visited any City-owned museums and attractions in the City of Independence in the last year?
Q3. Have your household members visited any City-owned museums & attractions in last year
Q3a. Please CHECK ALL the City-owned museums and attractions you or members of your household have visited.
Q3a. City-owned museums & attractions your household members have visited
Q3b. Please rate the overall quality of the historic sites you have visited.
Q3b. Overall quality of historic sites you have
Q3b. Please rate the overall quality of the historic sites you have visited. (without "not provided")
Q3b. Overall quality of historic sites you have
Q3c. If your household has NOT visited any of the City-owned museums and attractions in the last year, please CHECK ALL of the following reasons why you did NOT visit.
Q3c. Reasons why your household members have not visited City-owned museums & attractions in last year
Q4. Have you or any members of your household participated in any parks, and recreation programs or events offered in the past year?
Q4. Have your household members participated in any parks & recreation programs or events offered in past year
Q4a. Please rate the overall quality of the programs or events you have participated in.
Q4a. Overall quality of programs or events you have participated in
Q4a. Please rate the overall quality of the programs or events you have participated in. (without "not provided")
Q4a. Overall quality of programs or events you have participated in
Q4b. If your household has NOT participated in any parks and recreation programs or events during the past year, please CHECK ALL the following reasons why you have NOT participated.
Q4b. Reasons why your household members have not participated in any parks & recreation programs or events during past year
I don't know what is offered
Q5. Please CHECK ALL of the providers listed below that you or members of your household use for parks, recreation facilities, historic sites, recreation programs, or events.
Q5. All providers your household members use for parks, recreation facilities, historic sites, recreation programs, or events
Q5. Please CHECK ALL of the providers listed below that you or members of your household use for parks, recreation facilities, historic sites, recreation programs, or events. (without "none")
Q5. All providers your household members use for parks, recreation facilities, historic sites, recreation programs, or events
Q5a. Please CHECK ALL of the parks and recreation activities or amenities you take part in or use that are OUTSIDE of Independence.
Q5a. All parks & recreation activities or amenities you take part in or use that are outside of Independence
Q6. From the following list, please CHECK ALL the ways you currently learn or would like to learn about the Parks and Recreation Department programs, activities, and events.
Q6. Ways you currently learn or would like to learn about Parks & Recreation Department programs, activities, & events
Q7. Which THREE of the sources of communication from the list in Question 6 do you MOST PREFER TO get information about the Parks and Recreation Department programs, activities, and events? Q7. Top choice
Q7. Which THREE of the sources of communication from the list in Question 6 do you MOST
Q7. Which THREE of the sources of communication from the list in Question 6 do you MOST PREFER TO get information about the Parks and Recreation Department programs, activities, and events?
Q7. 3rd choice
Q7. Which THREE of the sources of communication from the list in Question 6 do you MOST PREFER TO get information
Q8. A variety of recreation facilities and amenities are listed below that are already offered in the community or may be offered in the future. Please indicate how well your needs for each facility or amenity are met on a scale of 4 to 1, where 4 means your needs are "Fully Met" and 1 means your needs are "Not Met" at all.
(N=802)
Q8-1. ADA accessible/inclusive play features & park
Q8-2. Community recreation building/ space
Q8-3. Diamond sports fields (e.g., baseball, softball)
Q8-4. Rectangular sports fields (e.g., soccer, football, lacrosse)
Q8-5.
Q8-6. Extreme sports (e.g., skate/bike parks/pump
Q8-8.
Q8-10. Indoor
Q8-11. Indoor sport courts practice & game facilities
Q8-13.
Q8-14.
Q8-16. Splash pads/interactive water play or features
Q8-17. Outdoor tennis courts
Q8. A variety of recreation facilities and amenities are listed below that are already offered in the community or may be offered in the future. Please indicate how well your needs for each facility or amenity are met on a scale of 4 to 1, where 4 means your needs are "Fully Met" and 1 means your needs are "Not Met" at all.
Q8-20. Off-leash dog parks
Q8-22. Motorized boat launches
Q8-23. Non-motorized boat launches (e. g., paddleboards,
Q8-24. Fishing areas
Q8-28. Paved
Q8-32.
Q8-35.
Q8. A variety of recreation facilities and amenities are listed below that are already offered in the community or may be offered in the future. Please indicate how well your needs for each facility or amenity are met on a scale of 4 to 1, where 4 means your needs are "Fully Met" and 1 means your needs are "Not Met" at all. (without "no need")
(N=802)
Q8-1. ADA accessible/inclusive play features & park structures
Q8-2. Community recreation building/ space
Q8-3. Diamond sports fields (e.g., baseball, softball)
Q8-4. Rectangular sports fields (e.g., soccer, football, lacrosse)
Q8-5.
Q8-6. Extreme sports (e.g., skate/bike parks/pump tracks)
Q8-7.
Q8-8. Indoor pickleball courts
Q8-9.
Q8-10. Indoor warm water pool for therapy & swim lessons
Q8-11. Indoor sport courts practice & game facilities
Q8-12. Outdoor fitness equipment
Q8-13.
Q8-14.
Q8-15. Outdoor pool/aquatics
Q8-16. Splash pads/interactive water play or features
Q8-17. Outdoor tennis courts
Q8. A variety of recreation facilities and amenities are listed below that are already offered in the community or may be offered in the future. Please indicate how well your needs for each facility or amenity are met on a scale of 4 to 1, where 4 means your needs are "Fully Met" and 1 means your needs are "Not Met" at all. (without "no need")
Q8-20. Off-leash dog parks
Q8-21. Open green space
Q8-22. Motorized boat launches
Q8-23. Non-motorized boat launches (e. g., paddleboards, canoes, kayaks)
Q8-24. Fishing areas
Q8-25.
Q8-27. Paved trails for bikes & pedestrians
Q8-28. Paved walking trails within parks
Q8-29. Unpaved hiking trails within parks
Q8-30. Picnic areas & park shelters
Q8-31. Playground
Q8-32.
Q8-34. Senior indoor & outdoor activity areas
Q8-35. Other
Q9. Which FOUR facilities/amenities from the list in Question 8 are MOST IMPORTANT to your household? Q9. Top choice
Q9. Which FOUR facilities/amenities from the list in Question 8 are MOST IMPORTANT to your household?
2nd choice
Rectangular
Q9. Which FOUR facilities/amenities from the list in Question 8 are MOST IMPORTANT to your household?
3rd choice
Q9. Which FOUR facilities/amenities from the list in Question 8 are MOST IMPORTANT to your household?
4th choice
Q9. Which FOUR facilities/amenities from the list in Question 8 are MOST IMPORTANT to your household? (top 4)
Q9. Top choice
Diamond sports fields (e.g., baseball, softball)
Rectangular sports fields (e.g., soccer, football, lacrosse)
boat launches (e.g., paddleboards, canoes, kayaks)
Q10. A variety of recreation programs and activities are listed below that are already offered in the community or may be offered in the future. Please indicate how well your needs for each program or activity are met on a scale of 4 to 1, where 4 means your needs are "Fully Met" and 1 means your needs are "Not Met" at all.
(N=802)
Q10-4. Adult
Q10-15.
Q10-18. Dog park programs
Q10. A variety of recreation programs and activities are listed below that are already offered in the community or may be offered in the future. Please indicate how well your needs for each program or activity are met on a scale of 4 to 1, where 4 means your needs are "Fully Met" and 1 means your needs are "Not Met" at all.
Q10-19. Life skills programs (e.g., culinary, sewing, crocheting, public speaking, car repair)
Q10-20. Nature programs/environmental education
Q10-21. Programs that promote local history
Q10-22. Science/technology programs (i. e., kids outdoor science programs, computer classes)
Q10-24. Water-based recreation programs (e.g.,
Q10-25. Workforce development for young adults (e.g. financial literacy, environmental stewardship, job readiness, youth development & leadership)
Q10-26. Athletic special events (e.g., cross-country or running races)
Q10-27. Special events (e.g., concerts, movies, farmers market & cultural events)
Q10-28. Child watch at Recreation Center (while working out in center)
Q10-29. Other
Q10. A variety of recreation programs and activities are listed below that are already offered in the community or may be offered in the future. Please indicate how well your needs for each program or activity are met on a scale of 4 to 1, where 4 means your needs are "Fully Met" and 1 means your needs are "Not Met" at all. (without "no need")
(N=802)
Q10-4.
Q10-5.
Q10-10.
Q10-13.
Q10-14. School break camps (fall/spring/
Q10-15.
Q10-16. Programs
Q10-17. Programs for people with disabilities or special needs
Q10-18. Dog park programs
Q10. A variety of recreation programs and activities are listed below that are already offered in the community or may be offered in the future. Please indicate how well your needs for each program or activity are met on a scale of 4 to 1, where 4 means your needs are "Fully Met" and 1 means your needs are "Not Met" at all. (without "no need")
Q10-19. Life skills programs (e.g., culinary, sewing, crocheting, public speaking, car repair)
Q10-20. Nature programs/environmental education
Q10-21. Programs that promote local history
Q10-22. Science/technology programs (i. e., kids outdoor science programs, computer classes)
Q10-24. Water-based recreation programs (e.g., sailing, kayaking)
Q10-25. Workforce development for young adults (e.g. financial literacy, environmental stewardship, job readiness, youth development & leadership)
Q10-26. Athletic special events (e.g., cross-country or running races)
Q10-27. Special events (e.g., concerts, movies, farmers market & cultural events)
Q10-28. Child watch at Recreation Center (while working out in center)
Q10-29. Other
Q11. Which FOUR programs from the list in Question 10 are MOST IMPORTANT to your household? Q11. Top choice
Life skills programs (e.g., culinary, sewing, crocheting, public speaking, car repair)
programs (i.e., kids outdoor science programs, computer classes)
recreation programs (e.g., sailing, kayaking)
Workforce development for young adults (e.g. financial literacy, environmental stewardship, job readiness, youth development & leadership)
Athletic special events (e.g., cross-country or running races)
Special events (e.g., concerts, movies, farmers market & cultural events)
Child watch at Recreation Center (while working out in center)
Q11. Which FOUR programs from the list in Question 10 are MOST IMPORTANT to your household?
Q11. 2nd choice
Life skills
(e.g., culinary, sewing, crocheting,
kids outdoor
recreation programs (e.g., sailing, kayaking)
Workforce development for young adults (e.g. financial literacy, environmental stewardship, job readiness, youth development & leadership)
Athletic special events (e.g., cross-country or running races)
Special events (e.g., concerts, movies, farmers market & cultural events)
Child watch at Recreation Center (while working out in center)
Q11. Which FOUR programs from the list in Question 10 are MOST IMPORTANT to your household?
3rd choice
Life skills programs (e.g., culinary, sewing, crocheting, public speaking, car repair)
programs (i.e., kids outdoor science programs, computer classes)
recreation programs (e.g., sailing, kayaking)
Workforce development for young adults (e.g. financial literacy, environmental stewardship, job readiness, youth development & leadership)
Athletic special events (e.g., cross-country or running races)
Special events (e.g., concerts, movies, farmers market & cultural events)
Child watch at Recreation Center (while working out in center)
Q11. Which FOUR programs from the list in Question 10 are MOST IMPORTANT to your household?
Q11. 4th choice
sewing, crocheting,
recreation programs (e.g., sailing, kayaking)
Workforce development for young adults (e.g. financial literacy, environmental stewardship, job readiness, youth development & leadership)
Athletic special events (e.g., cross-country or running races)
Special events (e.g., concerts, movies, farmers market & cultural events)
Child watch at Recreation Center (while working out in center)
Q11. Which FOUR programs from the list in Question 10 are MOST IMPORTANT to your household? (top 4)
Q11. Top choice
Life skills programs (e.g., culinary, sewing, crocheting, public speaking, car repair)
Science/technology programs (i.e., kids outdoor science programs, computer classes)
Water-based recreation programs (e.g., sailing, kayaking)
Workforce development for young adults (e.g. financial literacy, environmental stewardship, job readiness, youth development & leadership)
Athletic special events (e.g., cross-country or running races)
Special events (e.g., concerts, movies, farmers market & cultural events)
Child watch at Recreation Center (while working out in center)
Q12. Please rate your satisfaction on a scale of 5 to 1, where 5 means "Very Satisfied" and 1 means "Very Dissatisfied," with the following recreation and parks services provided by the Parks and Recreation Department.
(N=802)
Q12-1. Availability of information about programs/ facilities
Q12-2. Available parking
Q12-3. Ease of registering for classes offered by City
Q12-4. Ease of renting/ reserving a City facility
Q12-5. Fees charged for City
Q12-6. Lighting at sport courts & fields
Q12-7. Maintenance
Q12-8. Maintenance of recreation centers (Palmer Center, George Owens Nature Park, Independence Uptown Market, & Sermon Center)
Q12-9. Quality of programs for adults
Q12-10. Quality of programs
Q12-11. Security in City parks & on trails
Q12-12. Days & times that recreation programs are offered
Q12. Please rate your satisfaction on a scale of 5 to 1, where 5 means "Very Satisfied" and 1 means "Very Dissatisfied," with the following recreation and parks services provided by the Parks and Recreation Department.
Q12-13. User friendliness of City website
Q12-14. Variety of different types of parks
Q12-15. Variety of programs offered by City
Q12. Please rate your satisfaction on a scale of 5 to 1, where 5 means "Very Satisfied" and 1 means "Very Dissatisfied," with the following recreation and parks services provided by the Parks and Recreation Department. (without "don't know/not applicable")
(N=802)
Q12-1. Availability of information about programs/facilities
Q12-2. Available parking
Q12-3. Ease of registering for classes offered by City
Q12-4. Ease of renting/ reserving a City facility
Q12-5. Fees
Q12-6. Lighting at sport courts & fields
Q12-7. Maintenance of parks
Q12-8. Maintenance of recreation centers (Palmer Center, George Owens Nature Park, Independence Uptown Market, & Sermon Center)
Q12-9. Quality of programs
Q12-10. Quality of programs for families with children
Q12-11. Security in City parks & on trails
Q12. Please rate your satisfaction on a scale of 5 to 1, where 5 means "Very Satisfied" and 1 means "Very Dissatisfied," with the following recreation and parks services provided by the Parks and Recreation Department. (without "don't know/not applicable")
Q12-12. Days & times that recreation programs are offered
Q12-13. User friendliness of City
Q12-14. Variety of different types of parks in City
Q12-15. Variety of programs offered by City
Q13. Which THREE of the items from the list in Question 12 should receive the MOST EMPHASIS over the next five years?
Top choice
Q13. Which THREE of the items from the list in Question 12 should receive the MOST EMPHASIS over the next five years? Q13. 2nd choice
Q13. Which THREE of the items from the list in Question 12 should receive the MOST EMPHASIS over the next five years?
3rd choice
Q13. Which THREE of the items from the list in Question 12 should receive the MOST EMPHASIS over the next five years? (top 3) Q13. Top choice
Q14. The following is a list of actions the department could take to improve its parks and recreation system. Please indicate your support for each potential action below.
(N=802)
Q14-1. Develop new multiuse recreation facilities (Community Center)
Q14-2. Develop fieldhouse (indoor sports fields facility)
Q14-3. Improve existing parks infrastructure (e.g., benches, shade structures, water fountains, picnic tables, grills, wi-fi)
Q14-4. Improve/add playgrounds
Q14-5.
Q14-6. Develop new bike park facility, pump track
Q14-7. Improvements at athletic fields such as bleachers/seating & amenities
Q14-8. Improve existing trail system (increasing connectivity/accessibility)
Q14-9. Improve inclusion services or accessibility to programs & facilities
Q14-10. Other
Q14. The following is a list of actions the department could take to improve its parks and recreation system. Please indicate your support for each potential action below. (without "not provided")
(N=802)
Q14-1. Develop new multiuse recreation facilities (Community Center)
Q14-2. Develop fieldhouse (indoor sports fields facility)
Q14-3. Improve existing parks infrastructure (e.g., benches, shade structures, water fountains, picnic tables, grills, wi-fi)
Q14-4. Improve/add playgrounds
Q14-5. Improve/add restroom facilities
Q14-6. Develop new bike park facility, pump track
Q14-7. Improvements at athletic fields such as bleachers/seating & amenities
Q14-8. Improve existing trail system (increasing connectivity/accessibility)
Q14-9. Improve inclusion services or accessibility to programs & facilities
Q15. Which THREE improvements from the list in Question 14 are MOST IMPORTANT to your household?
Q15. Top choice
Develop
Q15. Which THREE improvements from the list in Question 14 are MOST IMPORTANT to your household?
Q15. 2nd choice
Q15. Which THREE improvements from the list in Question 14 are MOST IMPORTANT to your household? Q15. 3rd choice
Q15. Which THREE improvements from the list in Question 14 are MOST IMPORTANT to your household? (top 3)
Q15. Top choice
Q16. Would you be willing to support a General Obligation bond to support improvements to parks and recreation facilities and programs?
Q16. Would you be willing to support a General Obligation bond to support improvements to parks & recreation facilities & programs
Q16. Would you be willing to support a General Obligation bond to support improvements to parks and recreation facilities and programs? (without "not provided")
Q16. Would you be willing to support a General Obligation bond to support improvements to parks & recreation facilities & programs
Q16a. If "yes" to Question 16, please check ALL the improvements you would support:
Q16a. Improvements to parks & recreation facilities & programs you would support
Q17. Please rate your satisfaction with the overall value your household receives from the City of Independence Parks and Recreation Department.
Q17. Your satisfaction with overall value your household receives from City Parks & Recreation Department
Don't know
Q17. Please rate your satisfaction with the overall value your household receives from the City of Independence Parks and Recreation Department. (without "don't know")
Q17. Your satisfaction with overall value your household receives from City Parks & Recreation Department
Q18. Based on your perception of value in Question 17, how would you want the City to fund future parks, recreation, trails and open space needs?
Q18. How would you want City to fund future parks, recreation, trails & open space needs
Q19. How important do you feel it is for the City of Independence to provide high quality parks and recreation programs and facilities?
Q19. How important is it for City to provide high quality parks & recreation programs & facilities
Q20. How important are historic sites to the City of Independence?
Q20. How important are historic sites to City of Independence
Q21. Who do you believe should own and maintain the historic sites in the City of Independence?
Q21. Who should own & maintain historic sites in City of Independence
Q22. What is your age?
Q22. Your
Q22. What is your age? (without "not provided")
Q22. Your
Q23. Which of the following best describes your race/ethnicity?
Q23-7. Self-describe your race/ethnicity:
Q23-7. Self-describe your race/ethnicity
Q24. Which of the following best describes your total annual household income?
Your total annual household income
Q24. Which of the following best describes your total annual household income? (without "not provided")
Your
Q25. Do you own or rent your current residence?
Q25. Do you own or rent your current residence
WITHOUT “NOT PROVIDED”
Q25. Do you own or rent your current residence? (without "not provided")
Q25. Do you own or rent your current residence
Q26. Your gender:
Q26. Your gender: (without "not provided")
Q26. Your gender
Dear Resident,
We want to hear from you. The Parks and Recreation Department is conducting a survey to help determine priorities for parks, trails, recreation facilities and programming, and cityowned museums and historic sites over the next several years. These contribute significantly to the quality of life in Independence, and your opinions are very important.
We appreciate your time and realize this survey will take approximately 15-20 minutes to complete. Each question is important. The time you invest in completing this survey will aid the City of Independence in taking a resident-driven approach to recreation planning to enhance our community for all residents.
You have been randomly selected.
Your responses will remain confidential and be reported in group form only. Please return your completed survey within the next two weeks using the enclosed postage-paid envelope addressed to ETC Institute, 725 W. Frontier Circle, Olathe, KS 66061.
If you prefer, you can take the survey online at independence.communitysurvey.us.
If you have any questions, please contact ETC Institute’s project manager Ryan Murray at ryan.murray@etcinstitute.com or at 913-254-4598.
Please don’t miss this opportunity to have your voice heard and help us meet the recreational needs of all community members.
Sincerely,
Morris Heide, CPRP, AFO Director of Parks and Recreation City of Independence, Missouri PRT@indepmo.org
The City of Independence would like your input to help determine parks and recreation priorities for the city. This survey will take 15-20 minutes to complete. When you are finished, please return your survey in the enclosed postage-paid, return-reply envelope. If you prefer, you can complete the survey online at independence.communitysurvey.us. We greatly appreciate and value your time!
1. Please complete this survey with all household members in mind. Counting yourself, how many people in your household are...
Under age 5:
Ages 5-9:
Ages 10-14:
Ages 15-19:
Ages 20-24:
Ages 25-34:
Ages 35-44:
Ages 45-54:
Ages 55-64:
Ages 65-79: Ages 80+:
2. Have you or any member of your household visited any parks or recreation facilities offered by the City of Independence in the last year?
____(1) Yes [Answer Q2a.] ____(2) No [Go to Q2b.]
2a. Please rate the overall quality of the parks or facilities you have visited.
____(4) Excellent ____(3) Good ____(2) Fair ____(1) Poor
2b. If your household has NOT visited any parks and recreation facilities in the last year, please CHECK ALL the following reasons why you did NOT visit. [Check ALL that apply.]
____(01) Use other city, state, private facilities
____(02) Too far from home
____(03) Not aware of park or facility locations
____(04) Parks/Facilities are not well maintained
____(05) Old and outdated facilities
____(06) Lack of features we want to use
____(07) Lack of parking to access parks/facilities
____(08) Do not feel safe using parks/facilities
____(09) Facility equipment doesn't meet my needs
____(10) Lack of ADA accessibility
____(11) Do not feel welcomed/accommodated
____(12) Lack of transportation
____(13) Lack of restrooms
____(14) Language/Cultural barriers/age barriers
____(15) Fees are too high/lack of financial assistance
____(16) Other:
3. Have you or any member of your household visited any City-owned museums and attractions in the City of Independence in the last year?
____(1) Yes [Answer Q3a-b.]
____(2) No [Go to Q3c.]
3a. Please CHECK ALL the City-owned museums and attractions you or members of your household have visited. [Check ALL that apply.]
____(1) National Frontier Trails Museum
____(2) MO Model Railroad Museum
____(3) Bingham-Waggoner Estate
____(4) 1827 Log Courthouse
____(5) Vaile Mansion
____(6) Chicago-Alton Depot
____(7) Other:
3b. Please rate the overall quality of the historic sites you have visited.
____(4) Excellent ____(3) Good ____(2) Fair ____(1) Poor
3c. If your household has NOT visited any of the City-owned museums and attractions in the last year, please CHECK ALL of the following reasons why you did NOT visit. [Check ALL that apply.]
____(01) Lack of parking
____(02) Limited accessibility for people with disabilities
____(03) Inadequate signage or directions
____(04) High admission fees
____(05) Limited hours of operation
____(06) Lack of interest
____(07) Lack of other attractions nearby to justify the trip
____(08) I don't know what is offered
____(09) Safety concerns
____(10) Do not feel welcomed
____(11) Lack of transportation
____(12) Too busy
4. Have you or any member of your household participated in any parks, and recreation programs or events offered in the past year?
____(1) Yes [Answer Q4a.] ____(2) No [Answer Q4b.]
4a. Please rate the overall quality of the programs or events you have participated in. ____(4) Excellent ____(3) Good ____(2) Fair ____(1) Poor
4b. If your household has NOT participated in any parks and recreation programs or events during the past year, please CHECK ALL the following reasons why you have NOT participated. [Check ALL that apply.]
____(01) I don't know what is offered
____(02) Use programs of other agencies
____(03) Lack of quality instructors
____(04) Lack of quality programs
____(05) Prefer individual activities
____(06) Too far from home
____(07) Program times are not convenient
____(08) Classes are full
____(09) Safety concerns
____(10) Prefer virtual programming
____(11) Fees are too high/lack of financial assistance
____(12) Do not feel welcomed/accommodated
____(13) Program not offered
____(14) Registration is difficult
____(15) Lack of transportation
____(16) Too busy/not interested
____(17) Language/Cultural/Age barriers
____(18) Parking issues
____(19) Lack of new program offerings
5. Please CHECK ALL of the providers listed below that you or members of your household use for parks, recreation facilities, historic sites, recreation programs, or events. [Check ALL that apply.]
____(01) Independence Parks and Recreation
____(02) KCMO Parks and Recreation
____(03) Blue Springs Parks and Recreation
____(04) Lee's Summit Parks and Recreation
____(05) Raytown Parks and Recreation
____(06) Jackson County Parks + Rec
____(07) Other neighboring city/county
____(08) Private sports clubs
____(09) Private fitness centers
____(10) Local school/college/university
____(11) YMCA
____(12) Churches/religious organizations
____(13) Other:
____(14) None of these
5a. Please CHECK ALL of the parks and recreation activities or amenities you take part in or use that are OUTSIDE of Independence. [Check ALL that apply.]
____(1) Parks
____(2) Playgrounds
____(3) Trails
____(4) Fitness centers
____(5) Indoor pools
____(6) Outdoor pools
____(7) Spraygrounds
____(8) Recreation programming
____(9) Other:
6. From the following list, please CHECK ALL the ways you currently learn or would like to learn about the Parks and Recreation Department programs, activities, and events. [Check ALL that apply.]
____(01) Banners/signs at parks or facilities
____(02) Conversations with recreation staff
____(03) Emails from the department
____(04) Flyers
____(05) Friends and neighbors
____(06) Handout materials at parks or recreation facilities
____(07) Newspaper and/or community publication
____(08) Promotions at special events
____(09) Activities Guide
____(10) Social media
____(11) City Website
____(12) Neighborhood mailer
____(13) Other:
7. Which THREE of the sources of communication from the list in Question 6 do you MOST PREFER TO get information about the Parks and Recreation Department programs, activities, and events?
[Write in your answers below using the numbers from the list in Question 6.]
1st: ____ 2nd: ____ 3rd: ____
8. A variety of recreation facilities and amenities are listed below that are already offered in the community or may be offered in the future. Please indicate how well your needs for each facility or amenity are met on a scale of 4 to 1, where 4 means your needs are "Fully Met" and 1 means your needs are "Not Met" at all. If you do not have a need for one of the items listed, please circle "9" for "No Need."
9. Which FOUR facilities/amenities from the list in Question 8 are MOST IMPORTANT to your household? [Write in your answers below using the numbers from the list in Question 8, or circle "NONE."] 1st: ____ 2nd: ____ 3rd: ____ 4th: ____
10. A variety of recreation programs and activities are listed below that are already offered in the community or may be offered in the future. Please indicate how well your needs for each program or activity are met on a scale of 4 to 1, where 4 means your needs are "Fully Met" and 1 means your needs are "Not Met" at all. If you do not have a need for one of the items listed, please circle "9" for "No Need."
11. Which FOUR programs from the list in Question 10 are MOST IMPORTANT to your household? [Write in your answers below using the numbers from the list in Question 10, or circle "NONE."] 1st: ____ 2nd: ____ 3rd: ____ 4th: ____ NONE
12. Please rate your satisfaction on a scale of 5 to 1, where 5 means "Very Satisfied" and 1 means "Very Dissatisfied," with the following recreation and parks services provided by the Parks and Recreation Department.
13. Which THREE of the items from the list in Question 12 should receive the MOST EMPHASIS over the next five years? [Write in your answers below using the numbers from the list in Question 12, or circle "NONE."]
14. The following is a list of actions the department could take to improve its parks and
system. Please indicate your support
number to the right.
15. Which THREE improvements from the list in Question 14 are MOST IMPORTANT to your household? [Write in your answers below using the numbers from the list in Question 14, or circle "NONE."]
16. Would you be willing to support a General Obligation bond to support improvements to parks and recreation facilities and programs?
Yes [Answer Q16a.]
16a. If yes, please check ALL the improvements you would support:
____(1) Ballfield improvements
____(2) Trail expansion and connections
____(3) Park and playground improvements
____(4) New large community park
____(5) New indoor rec/community center with aquatics
____(6) New indoor rec/community center without aquatics
____(7) Improvements to existing nature park
____(8) Funds for historic site maintenance
____(9) Something else:
17. Please rate your satisfaction with the overall value your household receives from the City of Independence Parks and Recreation Department.
____(5) Very Satisfied
____(4) Somewhat Satisfied
____(3) Neutral ____(2) Somewhat Dissatisfied
____(1) Very Dissatisfied ____(9) Don't Know
18. Based on your perception of value in Question 17, how would you want the City to fund future parks, recreation, trails and open space needs?
____(4) Increase funding ____(3) Maintain existing funding levels ____(2) Reduce funding ____(1) Not sure
19. How important do you feel it is for the City of Independence to provide high quality parks and recreation programs and facilities?
____(4) Very Important ____(3) Somewhat Important ____(2) Not Important ____(1) Not Sure
20. How important are historic sites to the City of Independence?
____(4) Very Important ____(3) Somewhat Important ____(2) Not Important ____(1) Not Sure
21. Who do you believe should own and maintain the historic sites in the City of Independence?
____(1) National Park Service
____(2) State of Missouri
____(3) Jackson County
____(4) City of Independence
____(5) Private/non-profit organizations
____(6) Other:
DEMOGRAPHICS: To ensure that the people who respond to this survey accurately represent the residents, please provide the demographic information listed below.
22. What is your age? ______ years
23. Which of the following best describes your race/ethnicity? [Check all that apply.]
____(01) Asian or Asian Indian
____(02) Black or African American
____(03) American Indian or Alaska Native
____(04) White
____(05) Native Hawaiian or other Pacific Islander
____(06) Hispanic
____(99) Other:
24. Which of the following best describes your total annual household income?
____(1) Under $35,000
____(2) $35,000 to $59,999
____(3) $60,000 to $99,999 ____(4) $100,000 or more
25. Do you own or rent your current residence? ____(01) Own ____(02) Rent
26. Your gender: ____(1) Male____(2) Female ____(3) I prefer to self-identify:
27. Would you be willing to participate in future surveys sponsored by the City of Independence?
____(1) Yes [Please answer Question 27a.] ____(2) No
27a. Please provide your contact information.
Mobile Phone Number:
Email Address:
This concludes the survey. Thank you for your time!
Please return your completed survey in the enclosed postage-paid envelope addressed to: ETC Institute, 725 W. Frontier Circle, Olathe, KS 66061
Your responses will remain completely confidential. The information to the right will ONLY be used to help identify the level of need in your area. Thank you!
Hey there! If you are between the ages of 10-17 - we need your help!
The Independence Parks and Recreation Department wants to improve its parks, programs, and facilities for kids, tweens, and teens in our community. ]ust fill out the questions below and help us shape the future of your parks department.
1.Do you live in Independence? Yes No
2.Which school do you attend?
3.How old are you?
4.How do you want to learn about fun, cool activities?
a.City Website
b.Facebook
e.Newsletter f.TikTok c.Flyers d.Instagram g.Word of Mouth Circle your top 3 options
5.Let us know which activities below you enjoy or would love to learn more about. Choose as many as you want!
a.Archery
b.Arts (painting, sketching, etc.)
c.Baseball
d.Basketball
e.Biking
f.BMX Biking
g.Board Games
h.Camping/Outdoor Activities
i.Choir/Singing
j.Church Youth Group
k.Computer Games/Internet
l.Crafts
m.Cross Country/Running/Track
n.Dance (show choir, tap, ballet, etc.)
o.Disc Golf
p.Drama (Theatre/Musicals)
q.Esports
r.Food/Cooking
s.Football/Flag Football
t.Golf
u.Hiking/Nature Hikes
v.Hockey
w.Ice Skating
x.Kayaking/Canoeing/Paddleboarding
y.Lacrosse
z.Martial Arts
aa. Mountain Biking
bb. Pickleball
cc.Playground
dd.Playing an instrument
ee. Remote Control Cars/Boats
ff. Rock Climbing
gg. Rugby
hh. Shopping
ii.Softball
jj. Swimming
kk. Tennis
ll.Video Games
mm.Volleyball
nn. Walking
uu. Watching movies
vv.Fitness/Weight Training
ww. Other: ________________
6.What are your top four activities from the list above? (use the letter from above)
7.Have you participated in any Independence Parks & Recreation programs/events in the past? Yes No
8.If you haven't participated in any programs, why not (Pick one)?
• Facilities are not sufficient
• I don't know how to do the activity
• I'm too busy
• Need help because of a disability
• No place to do the activity
• No way to get there
• Not aware of programs
• Nothing I am interested in
• Too expensive
• Too far away
• Other: _______
9.How do you get to a park or city facility? (Choose all that apply)
• Bike
• Uber/Lyft
• Carpool with friends
• Drive by myself
• Parents drive me
• Skateboard/Roller Blade
• Walk
• Teleport (Just kidding)
10. Who are you usually with when you visit a park or city facility?
• Just me
• My Friends
• My parents
• Never go to parks or facilities
11.Circle your top 3 favorite things to do at a park?
• Play Baseball
• Play Basketball
• Disc Golf
• Play Golf
• Relax and Chill
• Play Soccer
• Hang out in the park shelter
• Play Pickleball
• Playground Fun
• Sand Volleyball
• Skate/Skateboard
• Splash Pad
• Swim
• Play Tennis
• Hit the Trails
12.Please check all of the following you have at home.
Internet (Wi-Fi)

In March 2025, the team conducted an assessment of the City of Independence's parks and recreation facilities. The following inventory list showcases all parks, green spaces, trails, and areas maintained by the Parks and Recreation Department. These assessments provided insight into the existing features, conditions, sizes, ages, and current maintenance levels of each park and facility.
The findings revealed a wide range in the age and condition of the playgrounds and equipment. Through this assessment, our team discovered that many parks and facilities have equipment that has exceeded its recommended lifespan. This facility inventory outlines the condition and age of each park, playground, feature, or facility, along with the status of its equipment.
Recommendations to renew and replace aging equipment annually will help maintain a safe and enjoyable park system. Park infrastructure—such as parking lots, trails, and recreational equipment—should also undergo regular maintenance and periodic updates to ensure optimal conditions for users.
Accessibility, as defined in this inventory, refers to physical locations or features that meet the requirements of the Americans with Disabilities Act (ADA). Listing accessibility for each park ensures that individuals with disabilities have equal access and opportunities. Examples include ramps at curbs, handrails, universally accessible equipment or structures, and properly graded parking lots and sidewalks.
Good – The park facility improvements are 10-years old or less and provide the user with safe facilities and equipment. The facility meets the ADA Guidelines in place at the time of development. Overall, the park provides the user with an enjoyable recreation experience.
Fair – The park facility improvements are 20-years old or less and most of the facilities and equipment are in a reasonable condition. Some equipment and facilities are dated and do not provide the user with an enjoyable experience. In addition, there are portions of the facility and equipment that do not meet the current ADA Guidelines. Overall portions of the park facilities need updating.
Poor – The park facility improvements are 20-years or older and do not provide the users with safe facilities and equipment. Most of the equipment and facilities have reached or surpassed their lifespan and the recreation value is minimal. There are numerous issues where the current facilities are not ADA compliant. Overall, the majority if not all the facilities need renovation and/ or replacement.
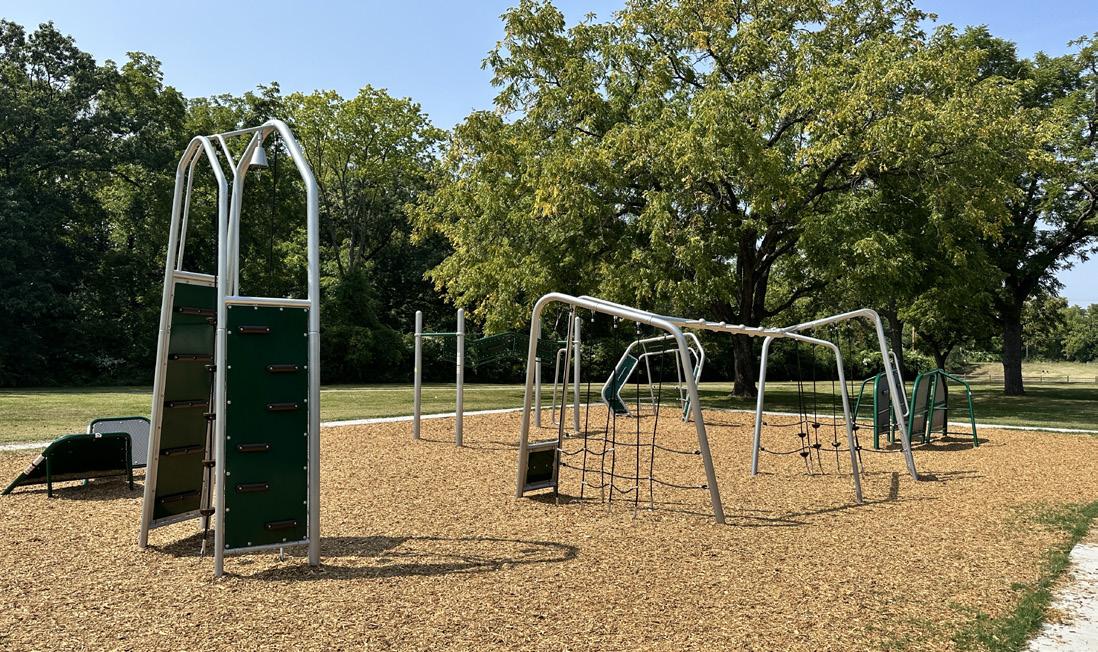
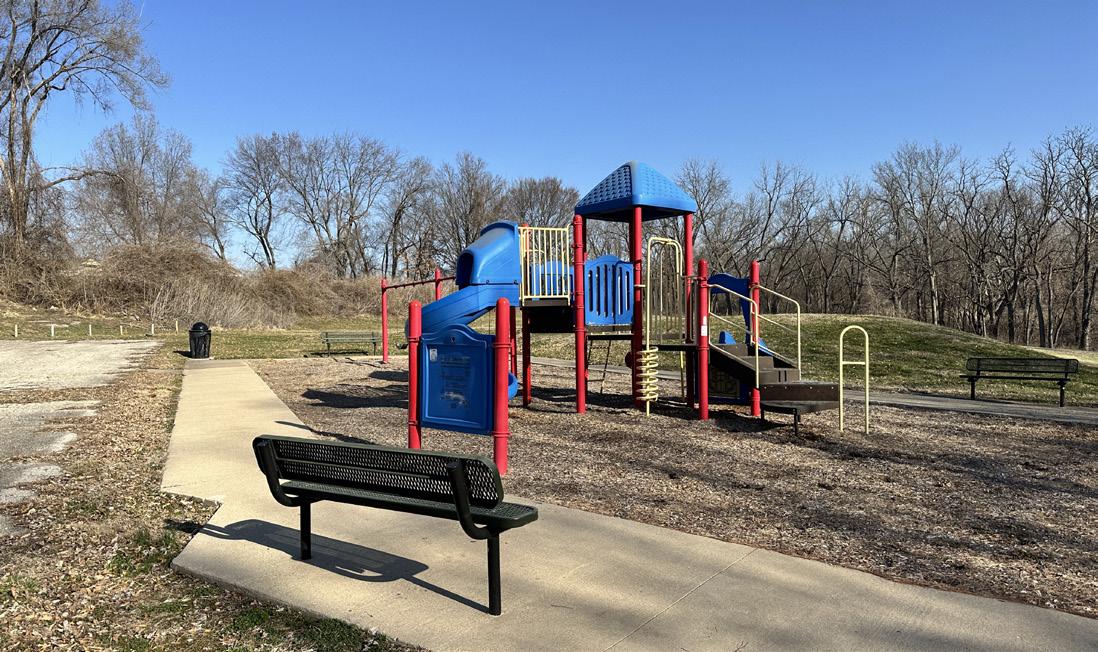
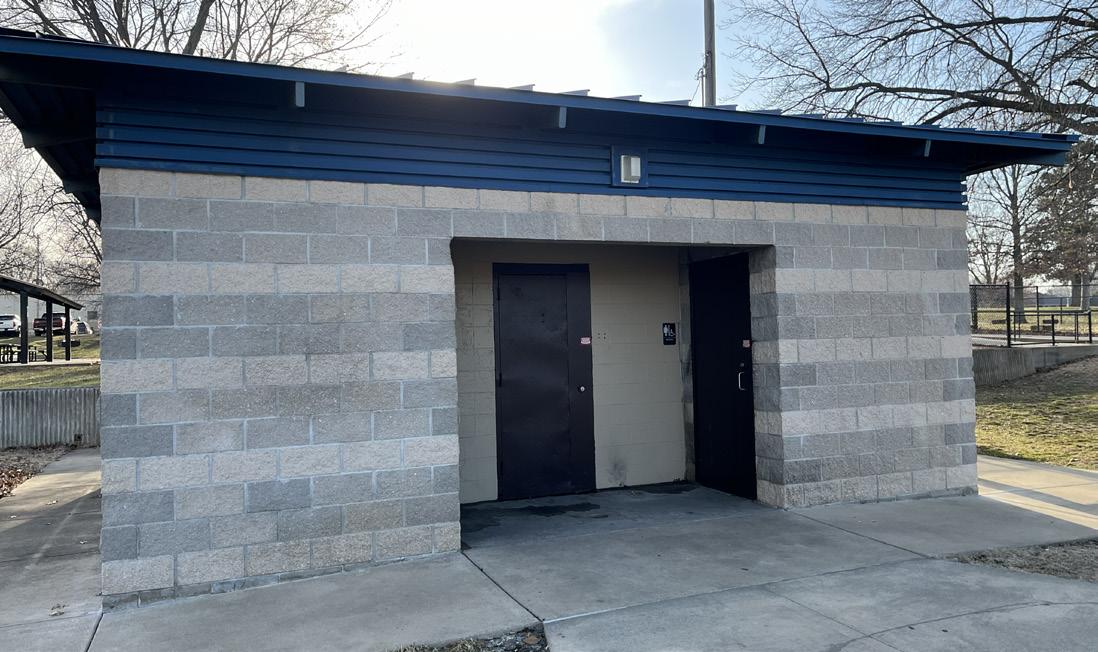
Name of Site: Adventure Oasis Waterpark
Date Completed: March, 2025
Completed By: Avery Nichols and Bennet McCoy
2100 S. Hub Dr. Independence, MO 64050
This water attraction is located near East 23rd Street and M-291 Highway, close to downtown Independence.
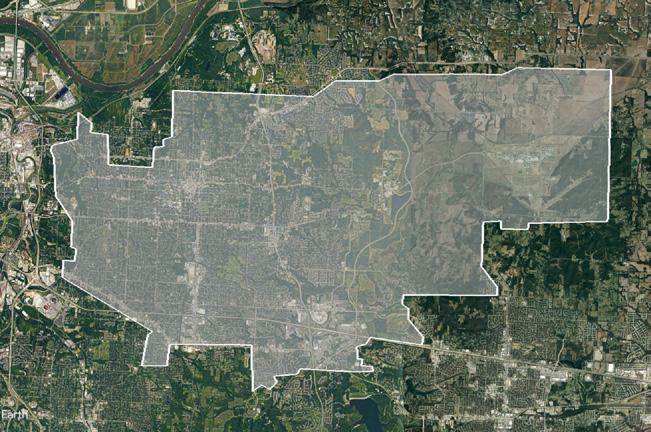
Size: 9.5 acres
Classification: Regional Park (Closed)
Restrooms (Poor Condition)
Signage (Good Condition)
Walking Path (Fair Condition)
Pool Facilities (Poor Condition)
Strengths: The water park is centrally located within Independence and has signage and walkways from the parking lot.
Opportunities: The now closed waterpark has an opportunity to develop a new indoor/outdoor aquatics facility or utilize this area for new park development. The large parking lot and building could be used for an alternative use.
Rating:
1 (High Accessibility)
- The site has a parking lot that is accessible with a ramp and stairs up to the main entrance.
Active/Passive: Active
7. PHOTO INVENTORY:
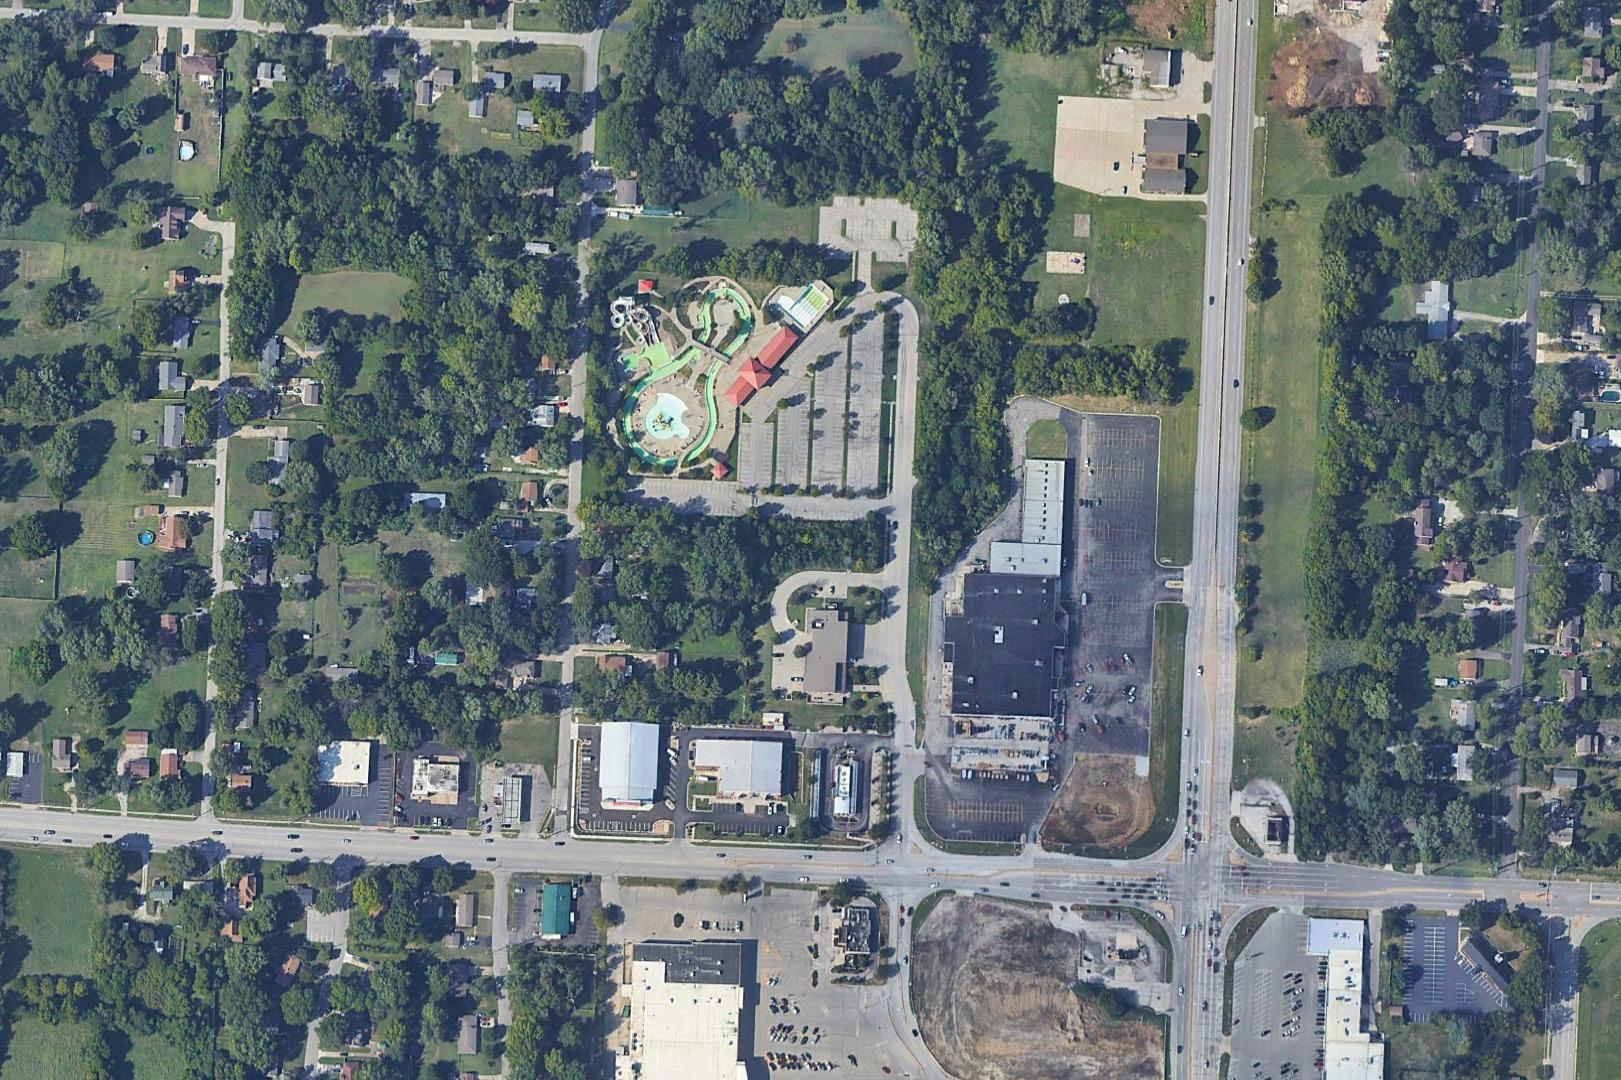
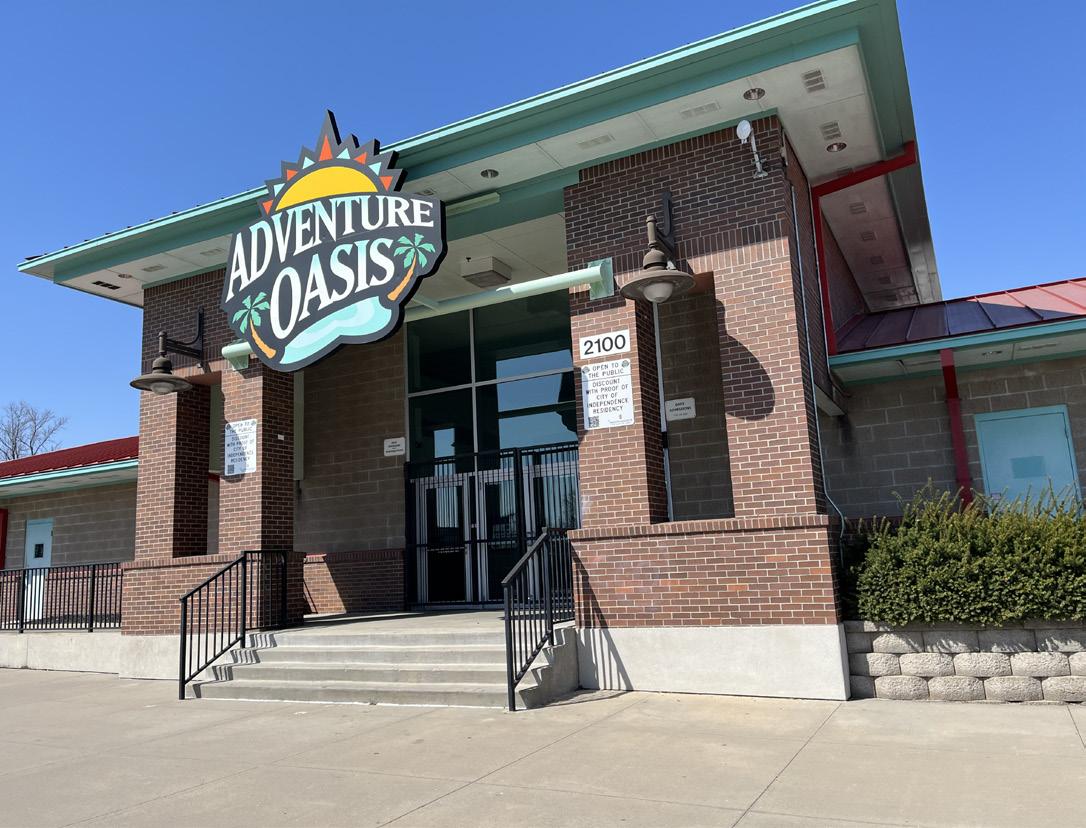
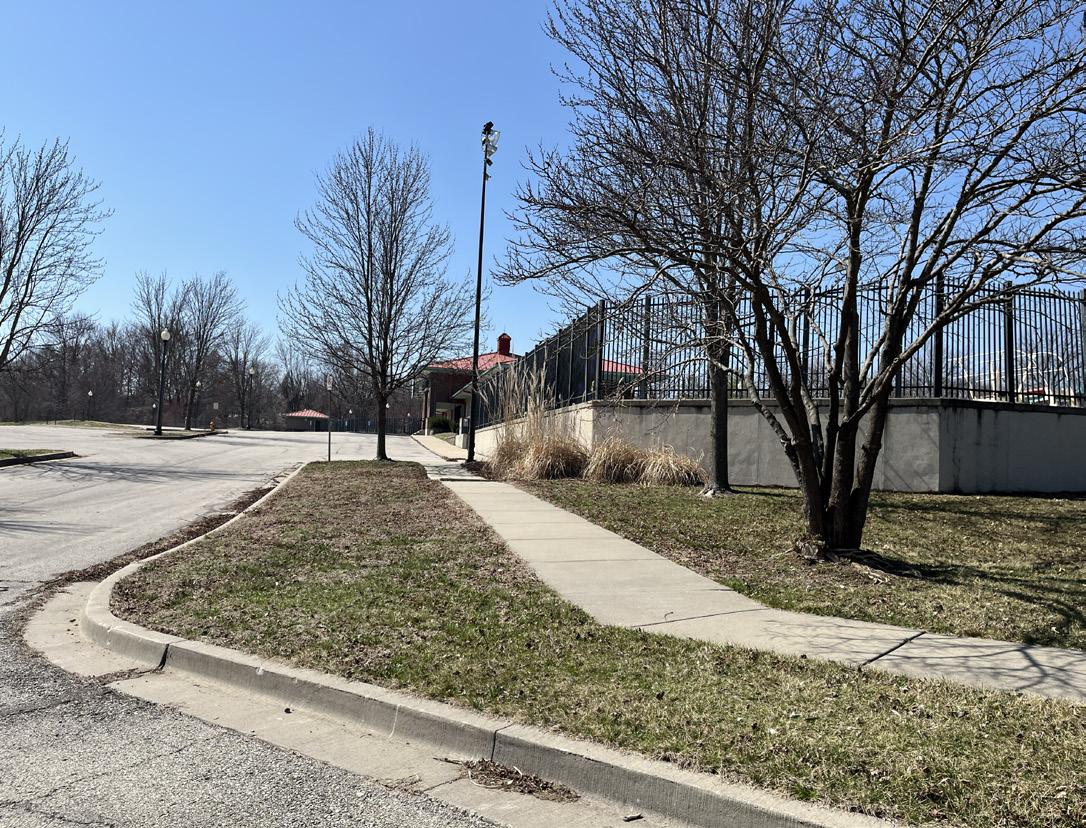
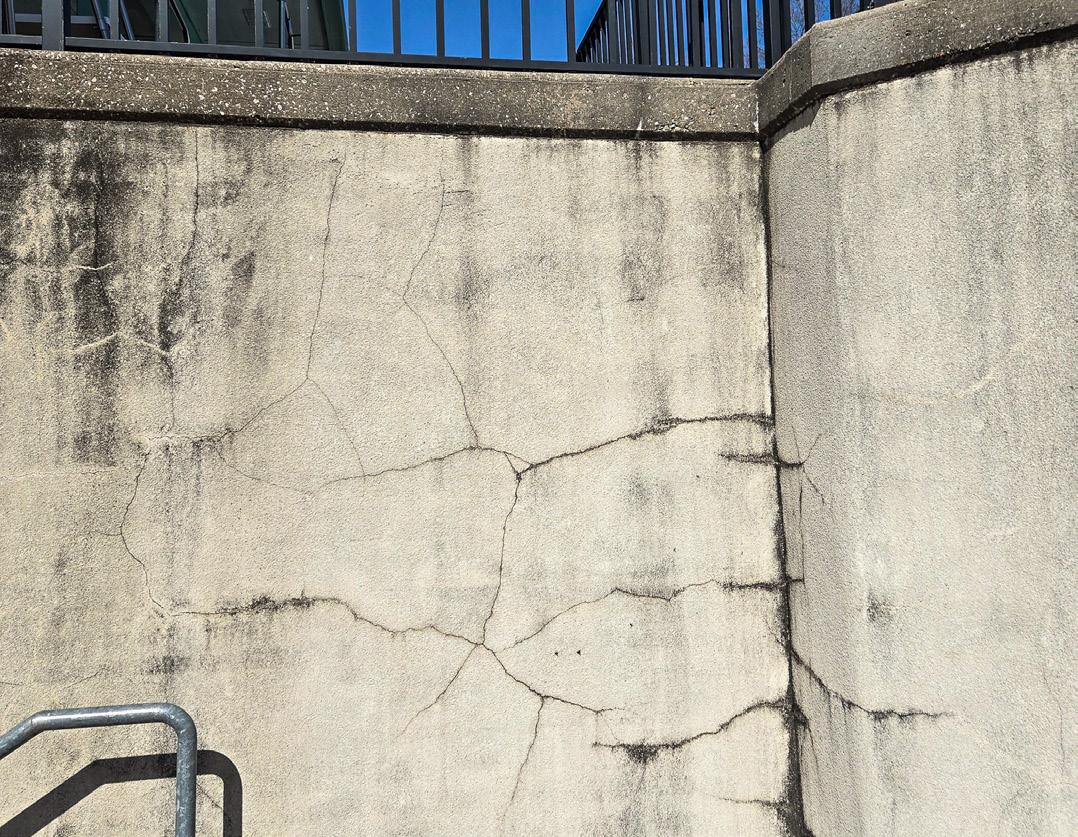
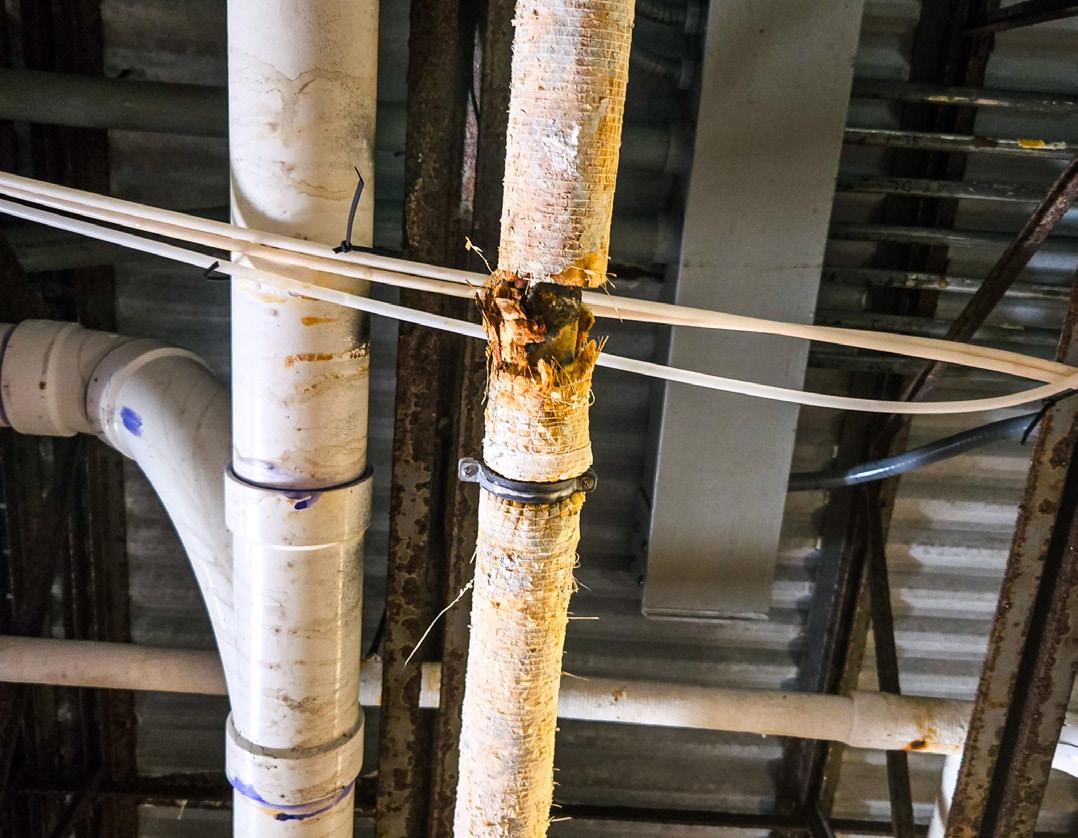
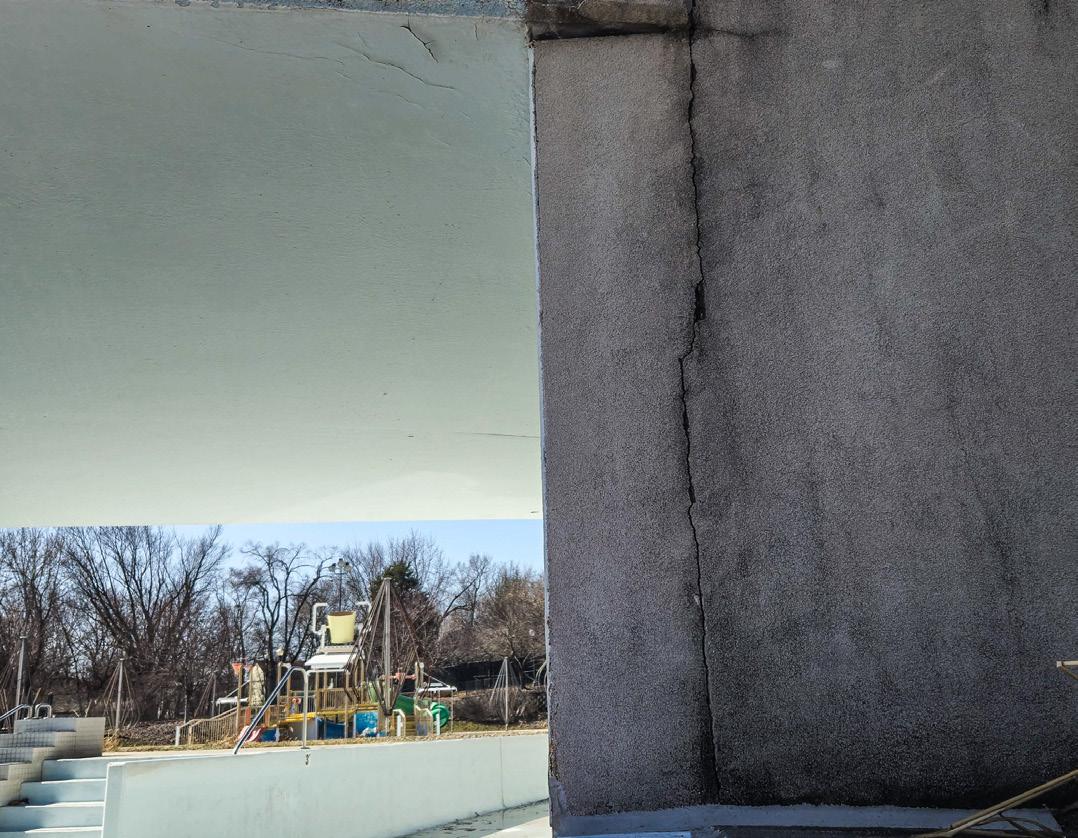
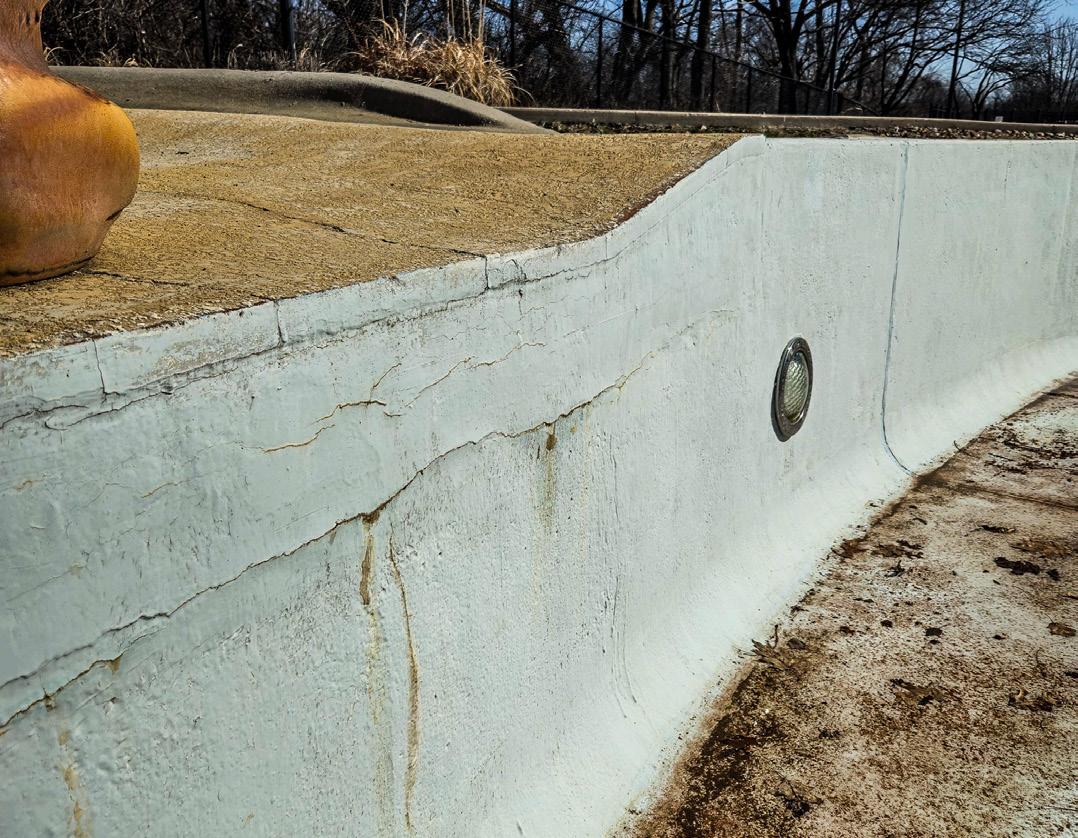
Name of Site: Beckett Park
Date Completed: March, 2025
Completed
By: Avery Nichols and Bennet McCoy
2701 S. Cherokee St. Independence, MO 64057
This park is located east of M-291 Highway and just north of Interstate 70.
Size: 6.9 acres
Classification: Neighborhood Park
3. INVENTORY OF FACILITY AMENITIES AND CONDITIONS:
Playground (Good Condition)
Signage (Fair Condition)
Walking Path (Fair Condition)
(2) Picnic Tables (Fair Condition)
(2) grills (Poor Condition)
4. STRENGTHS AND OPPORTUNITIES:
Strengths: The amenities in Beckett Park are well-kept, there is an ample amount of space for flexible programming.
Opportunities: There is a need for an accessible entry, as currently there is only a steep staircase to the park directly from the street. There is also a need for better pedestrian walkways along the street.
Rating:
4 (Low Accessibility)
- The park is accessed only by stairs along the road. Once in the park there is a sidewalk around the playground but no other accessible paths around the park or amenities.
6. GENERAL NOTES:
Active/Passive: Passive
7. PHOTO INVENTORY:
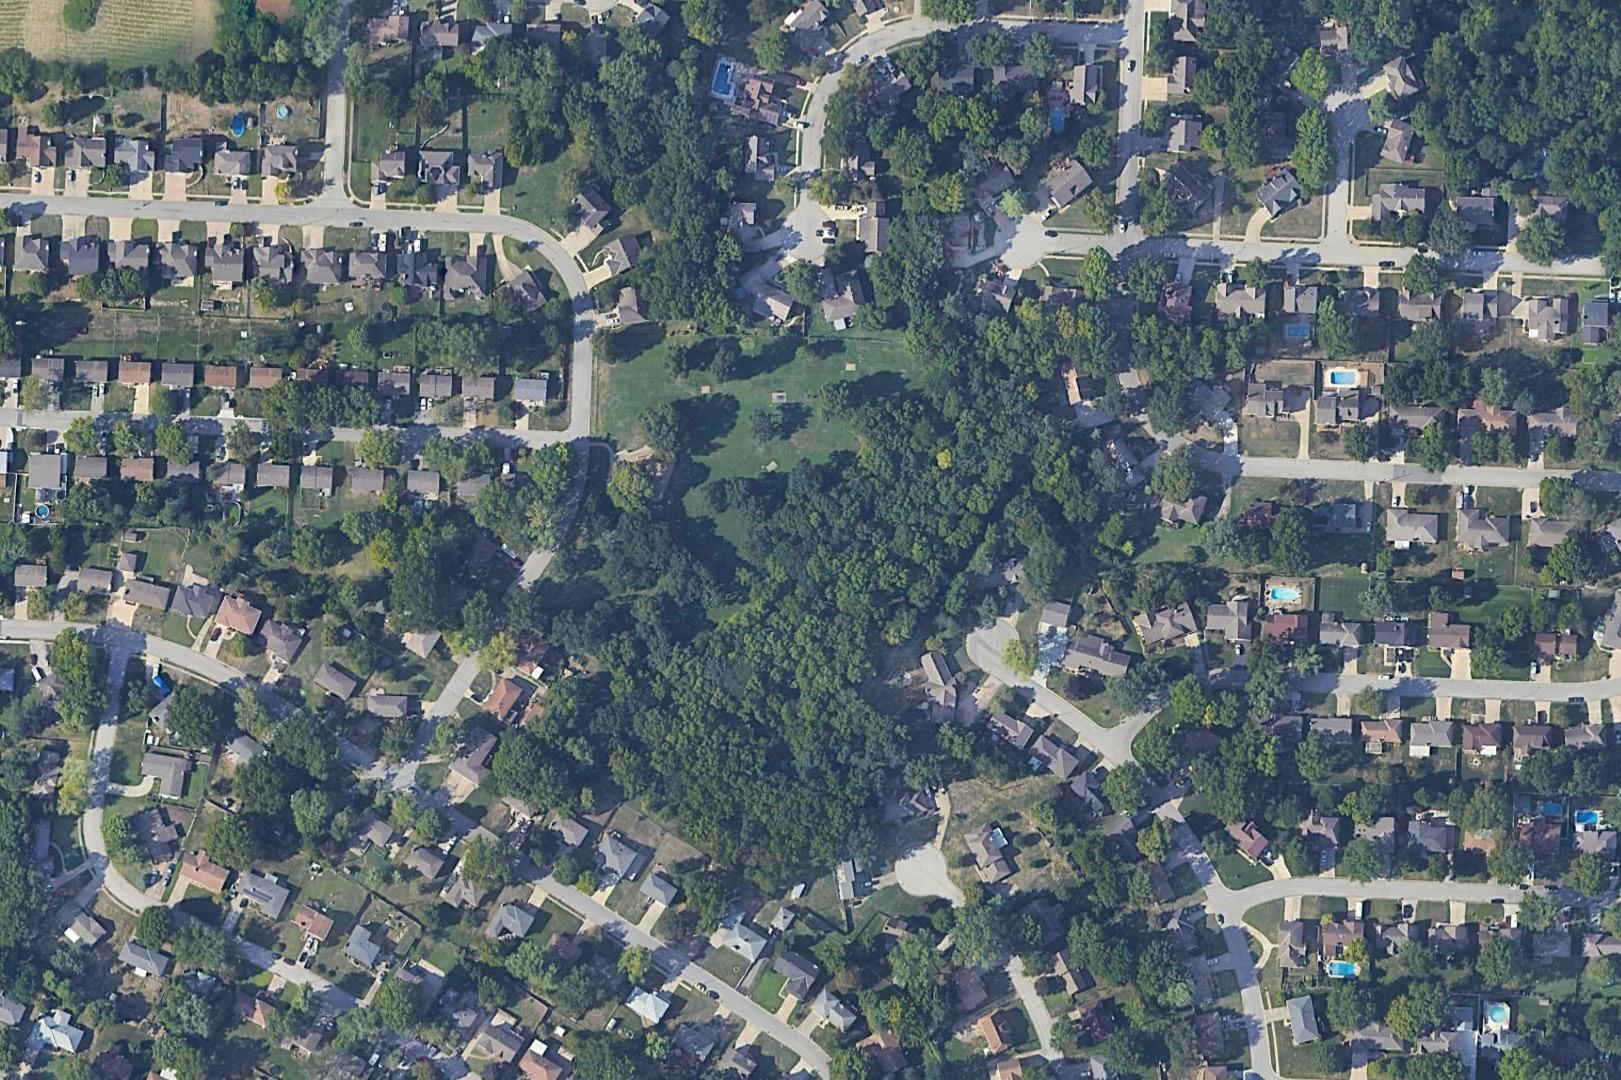
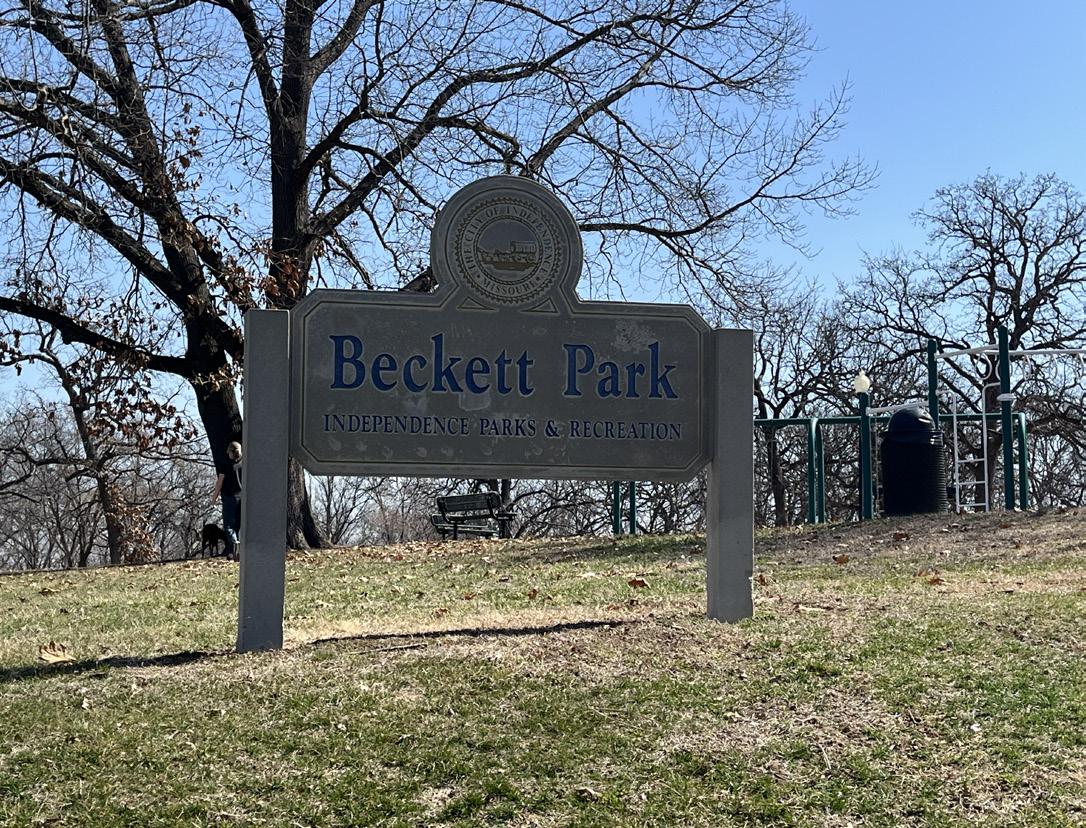
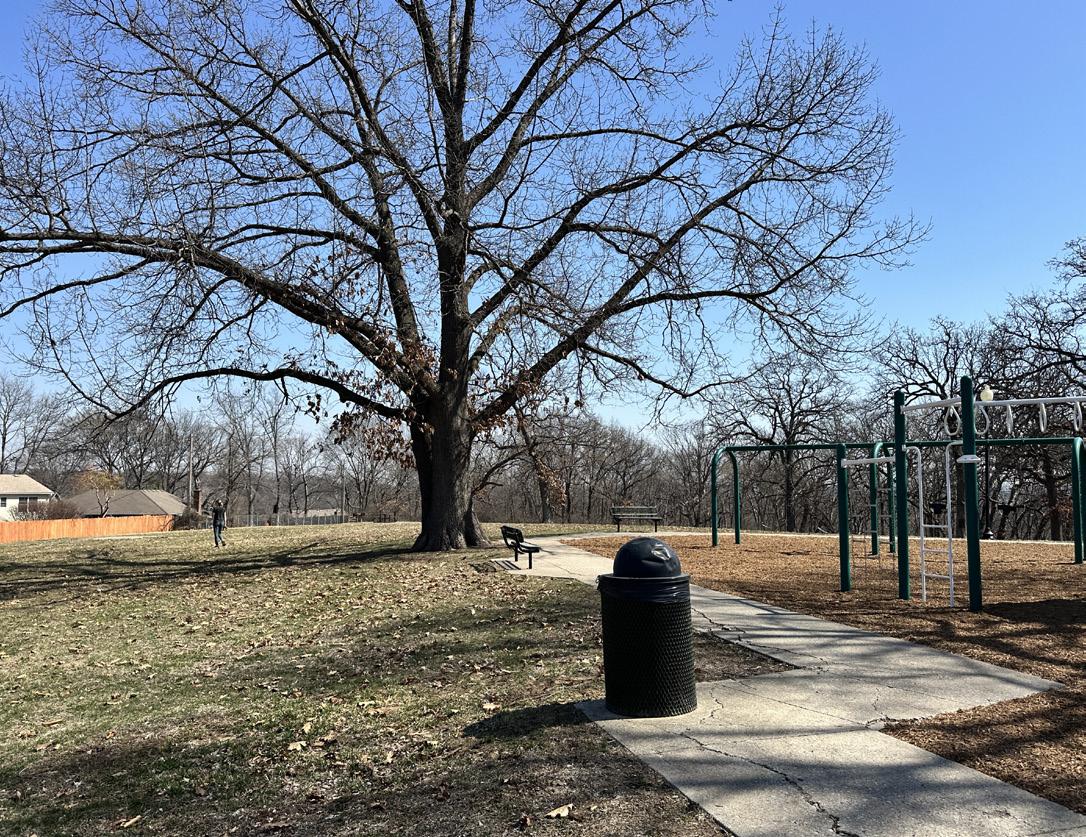
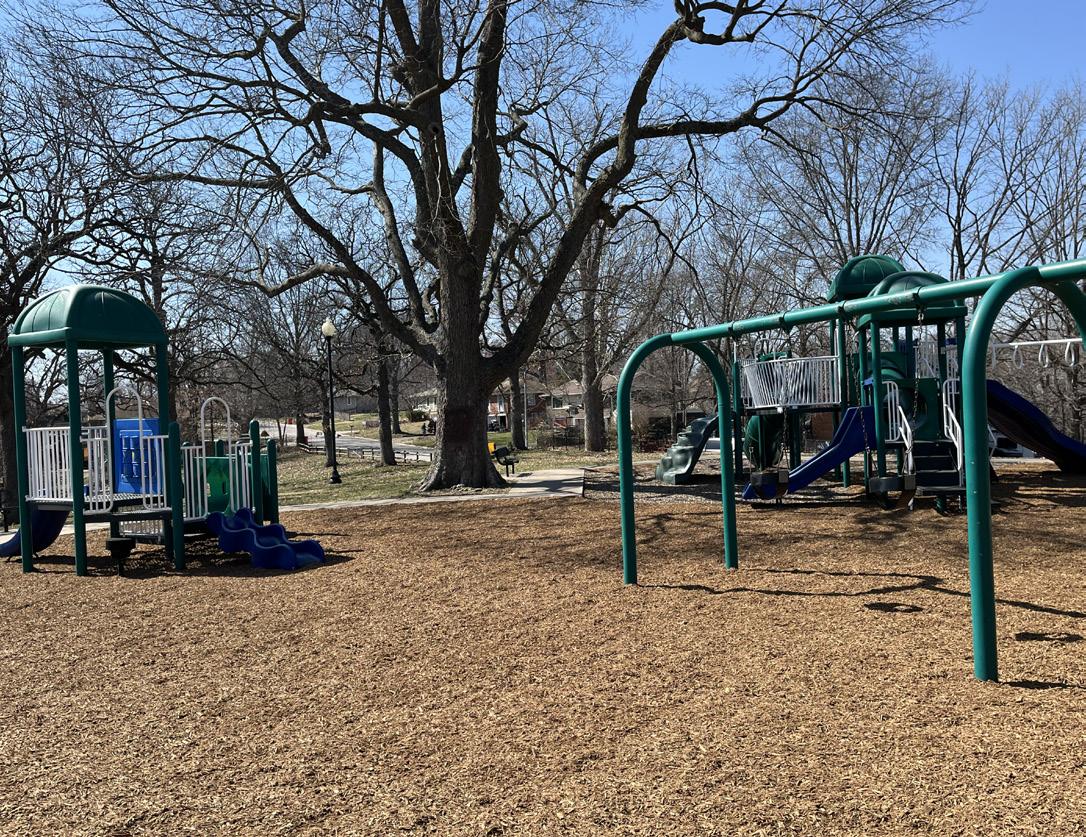
Playground structures with mulch surfacing material.
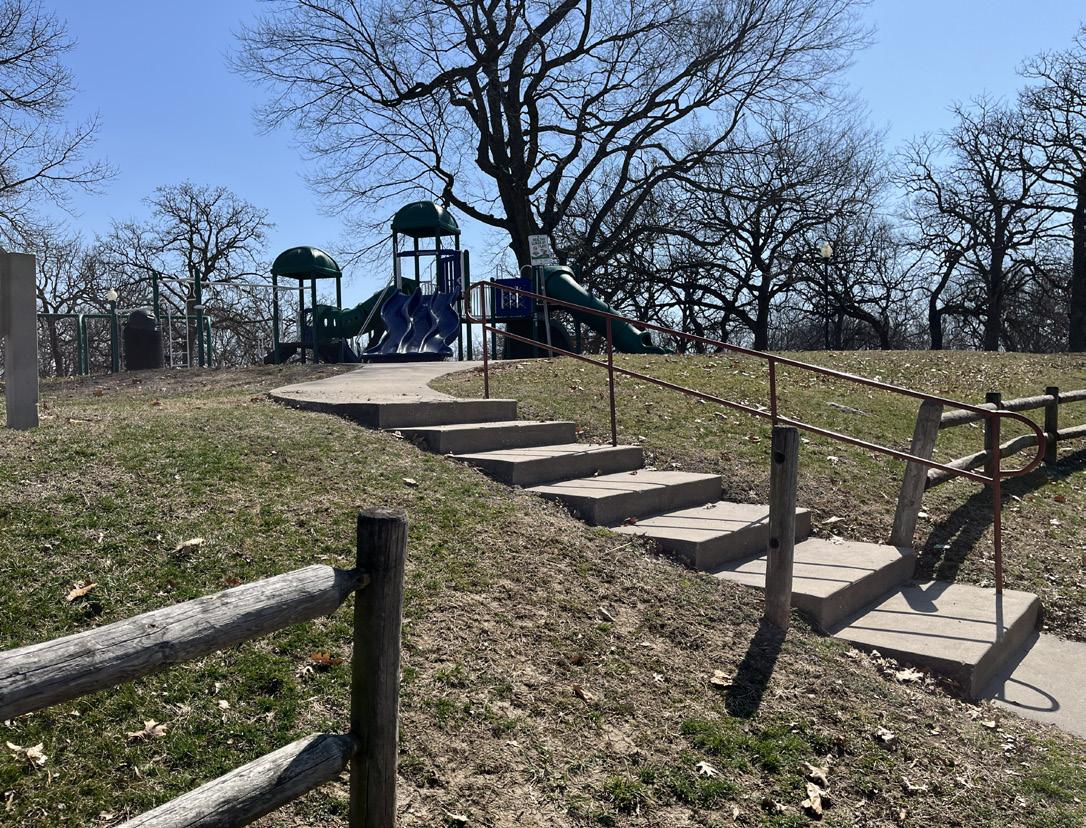
Typical benches in fair condition.
Name of Site: Benton Park
Date Completed: March, 2025
Completed By: Avery Nichols and Bennet McCoy
707 S Crane St, Independence, MO 64050
This neighborhood park sits just west of M-291 Highway near Woodlawn Cemetery.
Size: 6.5 acres
Classification: Neighborhood Park
Basketball Courts (2 Full Size) (Fair Condition)
Shelter (Poor Condition)
Playgrounds (Poor Condition)
Signage (Fair Condition)
Walking Path (.3 Miles) (Poor Condition)
Strengths: The park has fair connectivity to the surrounding neighborhoods.
Opportunities: Pedestrian walkways need improvements as some of them are cracked or overgrown. There is also ample space for more amenities.
Rating:
2 (Moderate Accessibility)
- The park has accessible paths navigating higher elevations by the playground down to the baseball field. The elevation change in this park makes universal accessibility challenging to navigate all areas in the park. Access to the park is from on street parking and is connected by one ramp off of Crane street, connecting the asphalt trail.
Active/Passive: Passive
7. PHOTO INVENTORY:
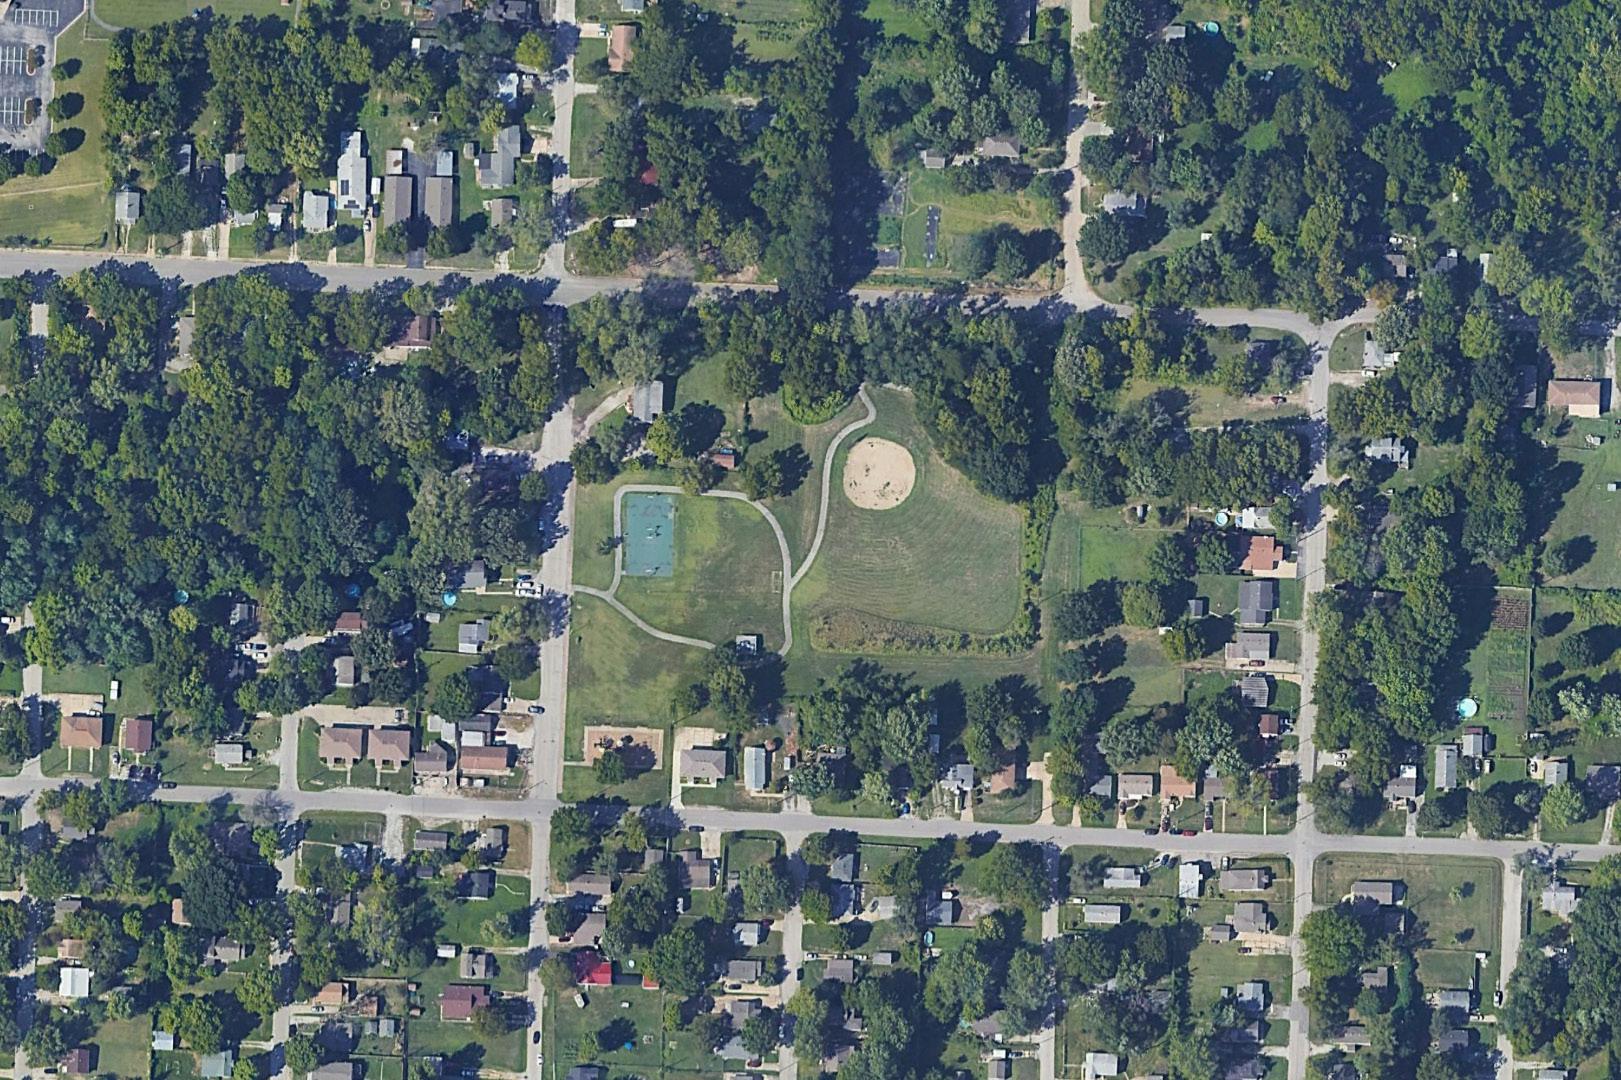
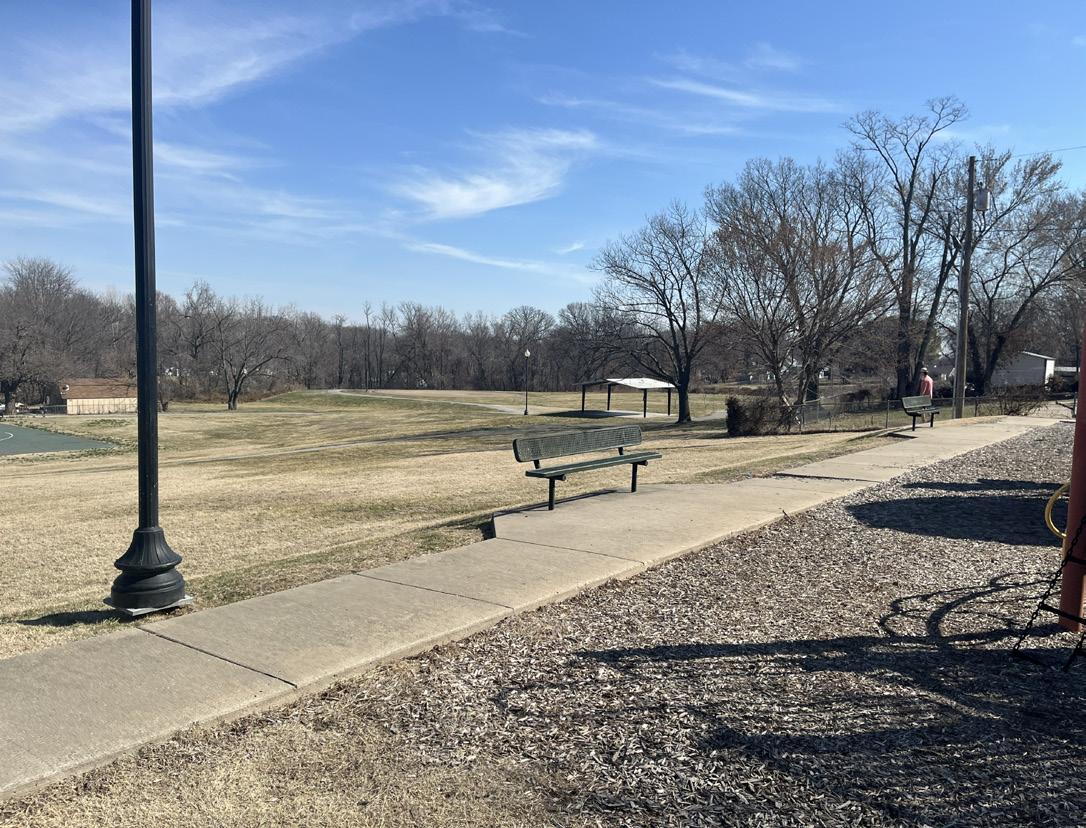
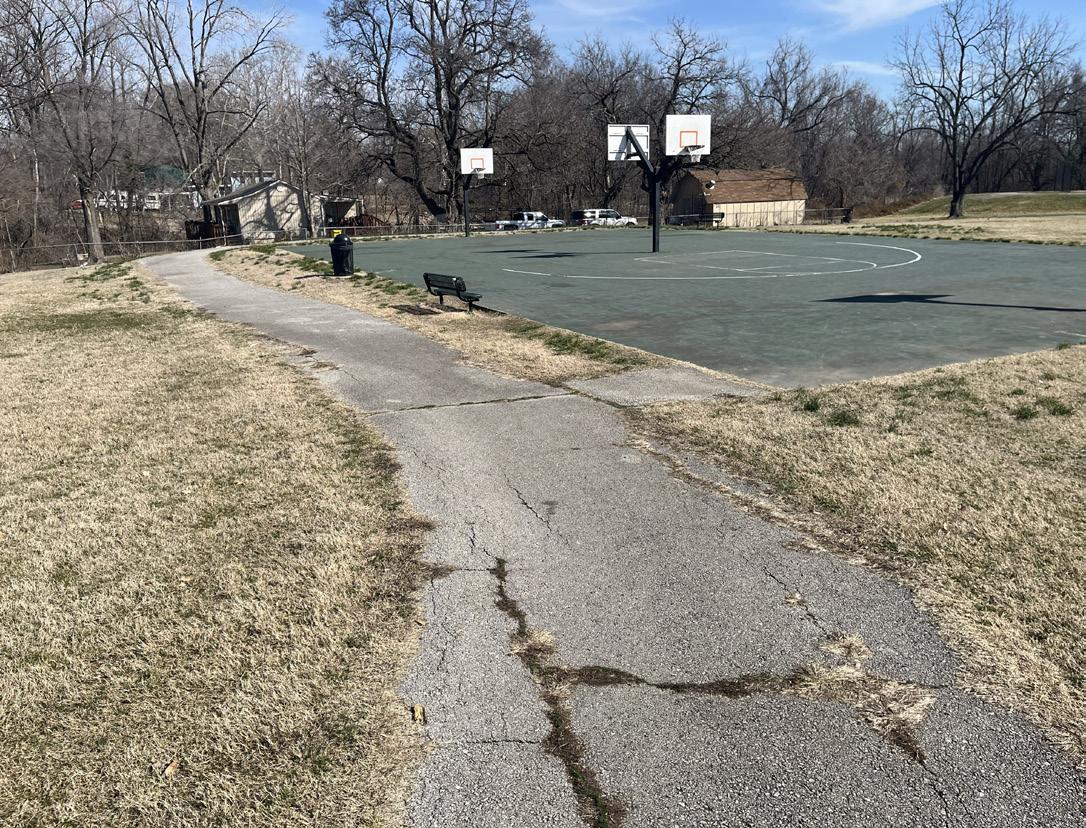
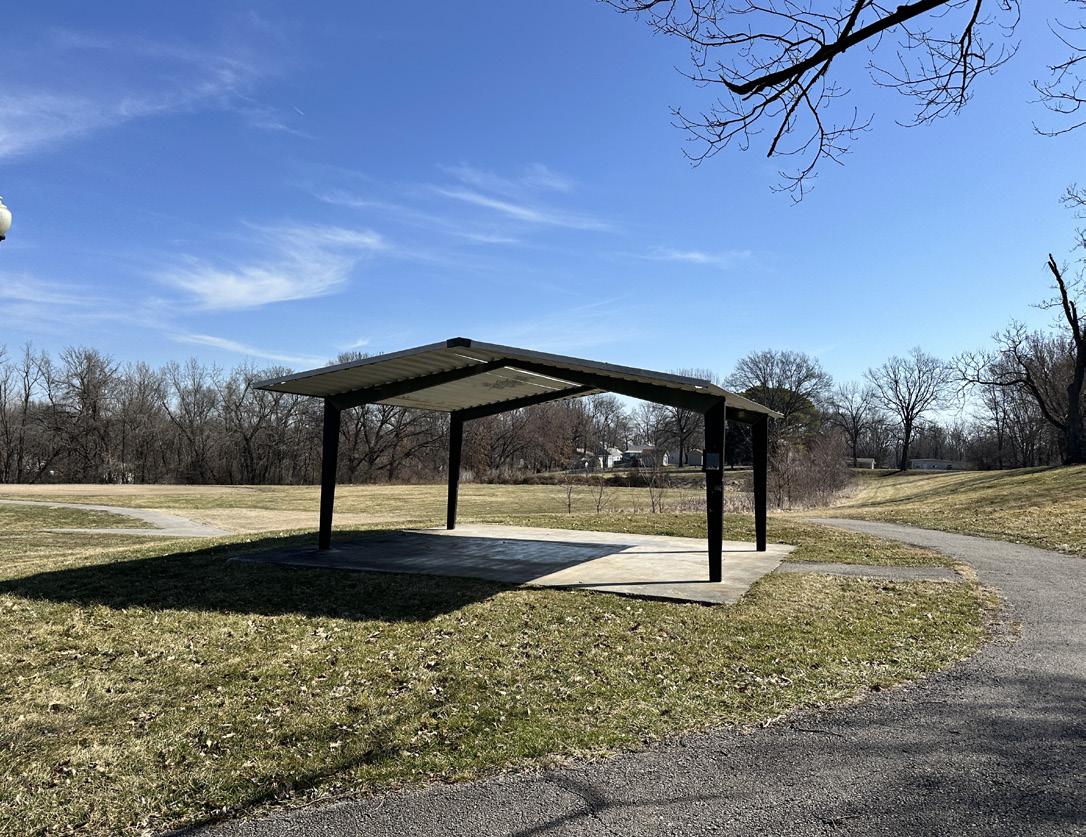
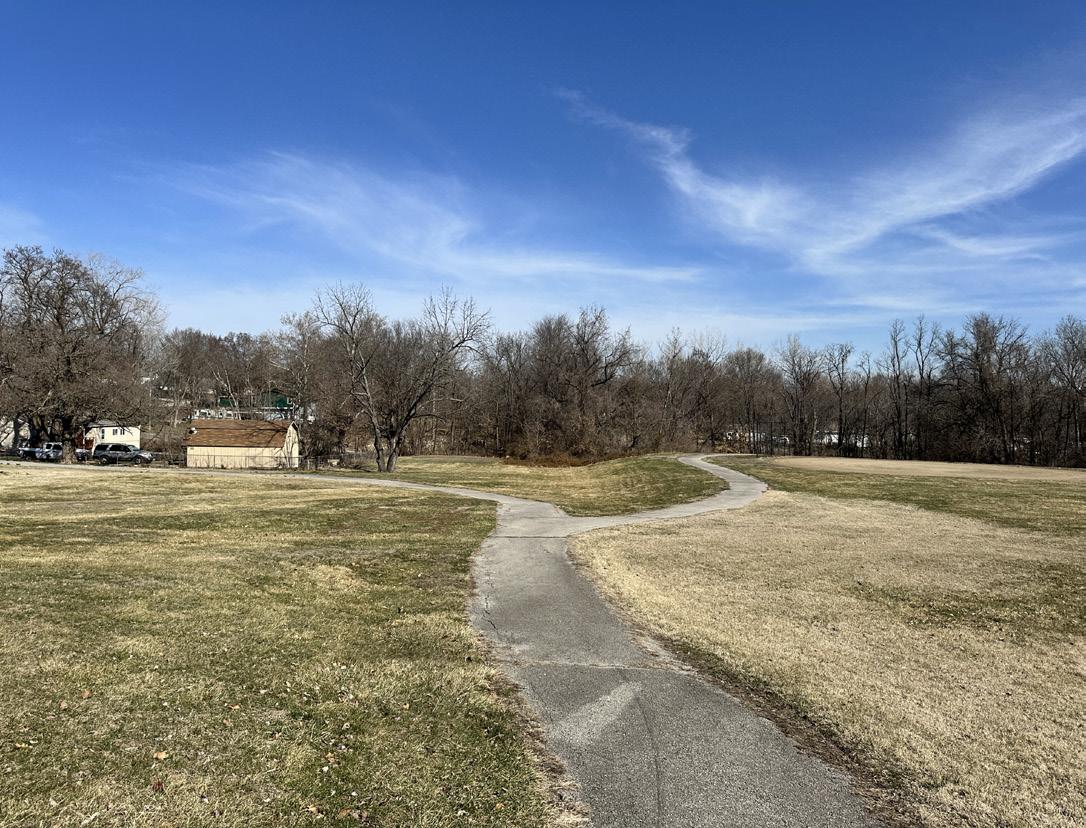
Name of Site: Bingham-Waggoner Park
Date Completed: March, 2025
Completed By: Avery Nichols and Bennet McCoy
313 W Pacific Ave, Independence, MO 64050
This park is located just south of downtown Independence.
Size: 15.5 acres
Classification: Community Park
3. INVENTORY OF FACILITY AMENITIES AND CONDITIONS:
Signage (Poor Condition)
Walking Path (Poor Condition)
4.
Strengths: At the Bingham-Waggoner Estate, walking paths provide easy access to the estate, museum, and information building. There is ample tree canopy coverage providing shade along the walking trail.
Opportunities: There is an opportunity to refurbish the walking trail and plaques (National Park Service Plaques) as they are in poor condition or missing information.
Rating:
3 (Moderate Accessibility)
- The park space on the southern side of the site is accessible from a sidewalk off of Linden Ave and from the parking lot in the center of the park. The loop path is accessible with elevation change that makes access challenging in areas.
Active/Passive: Passive
7. PHOTO INVENTORY:
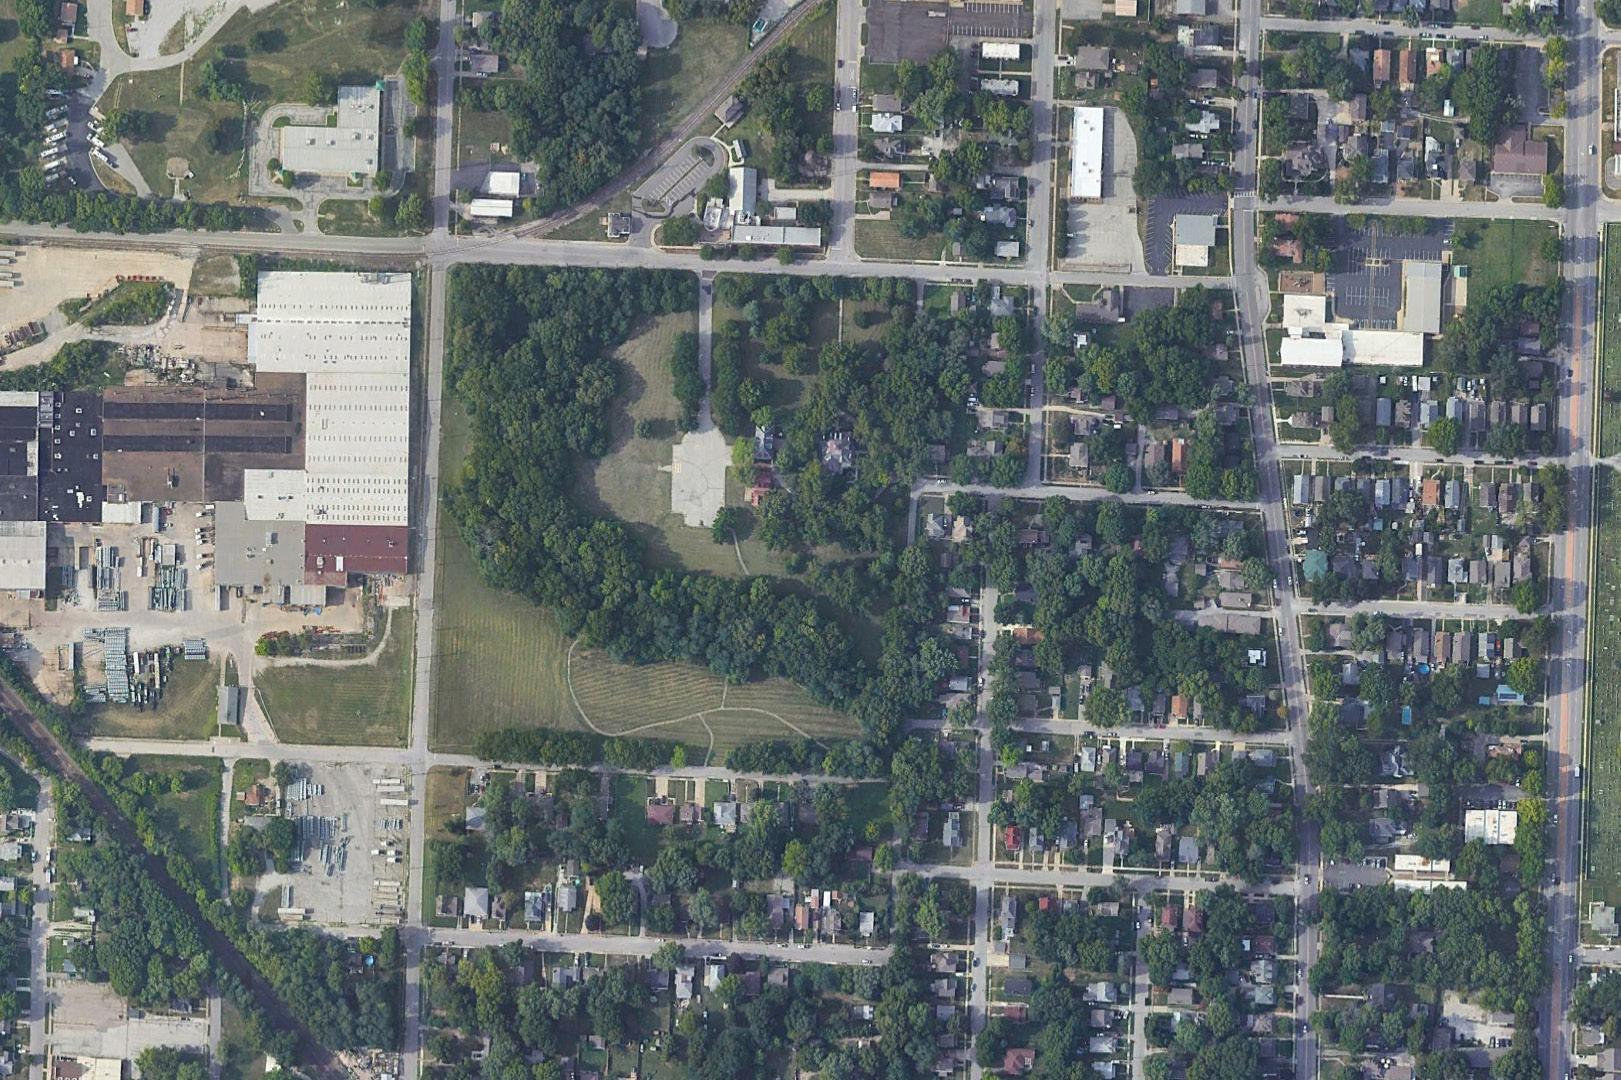
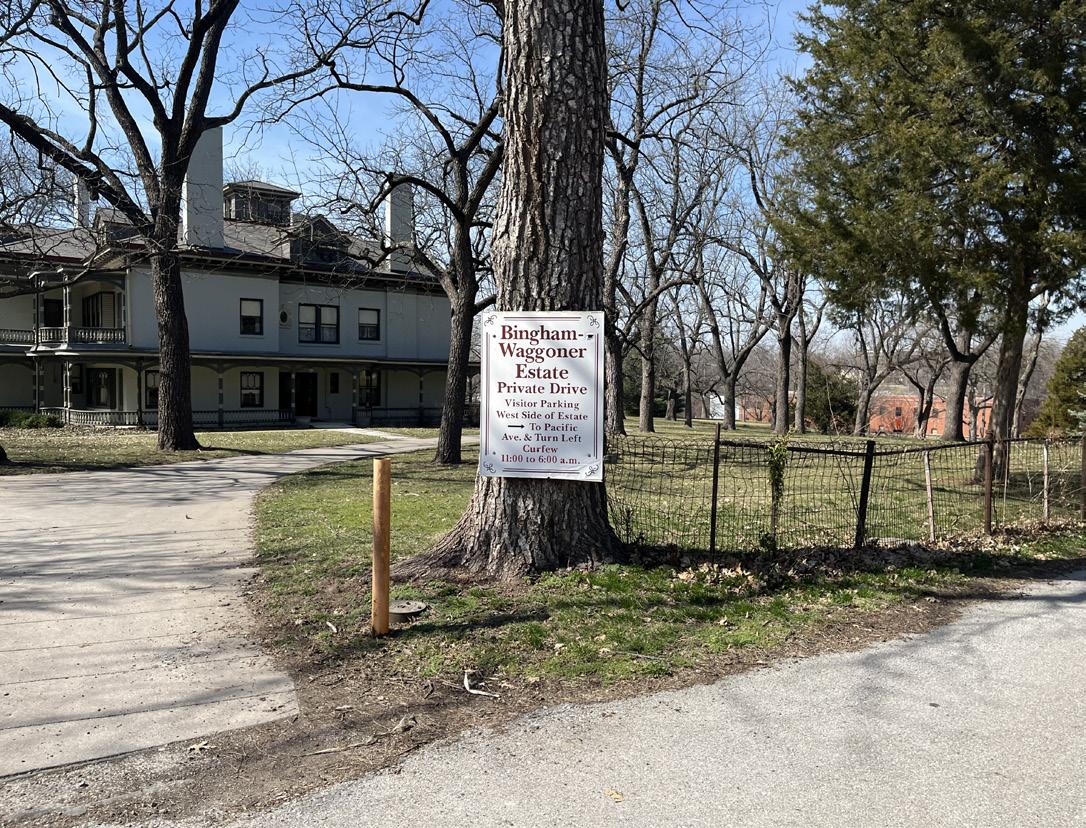
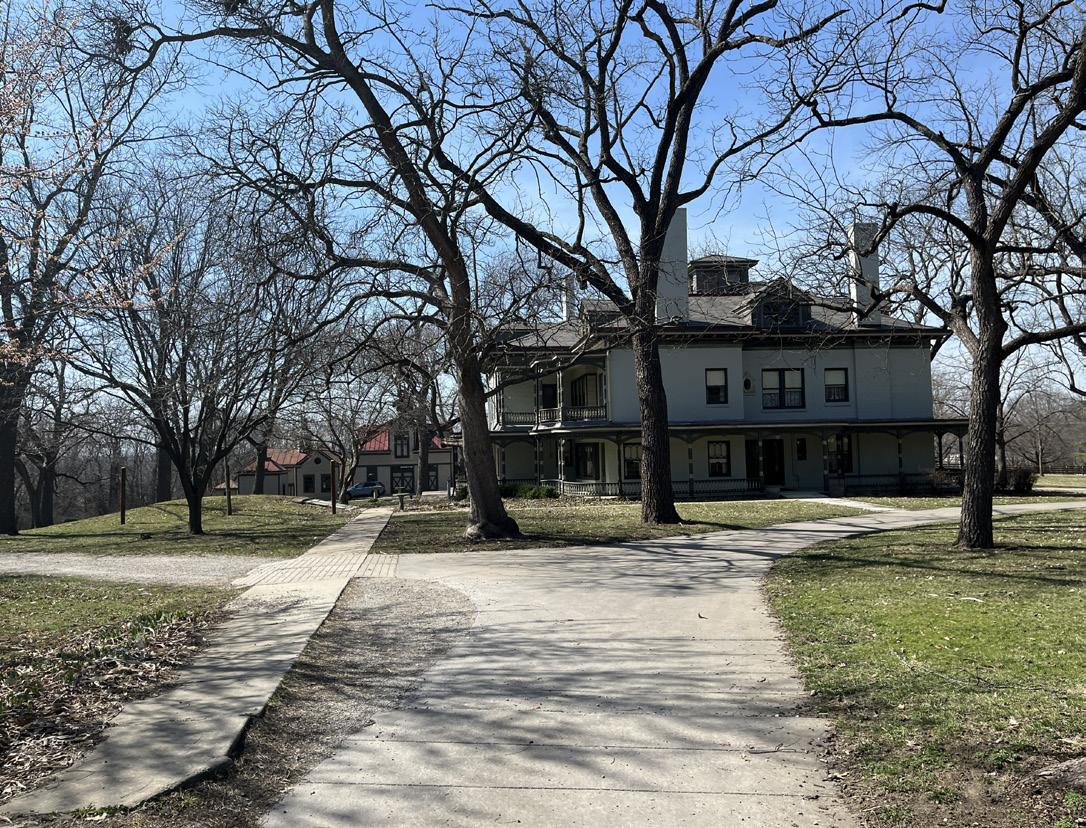
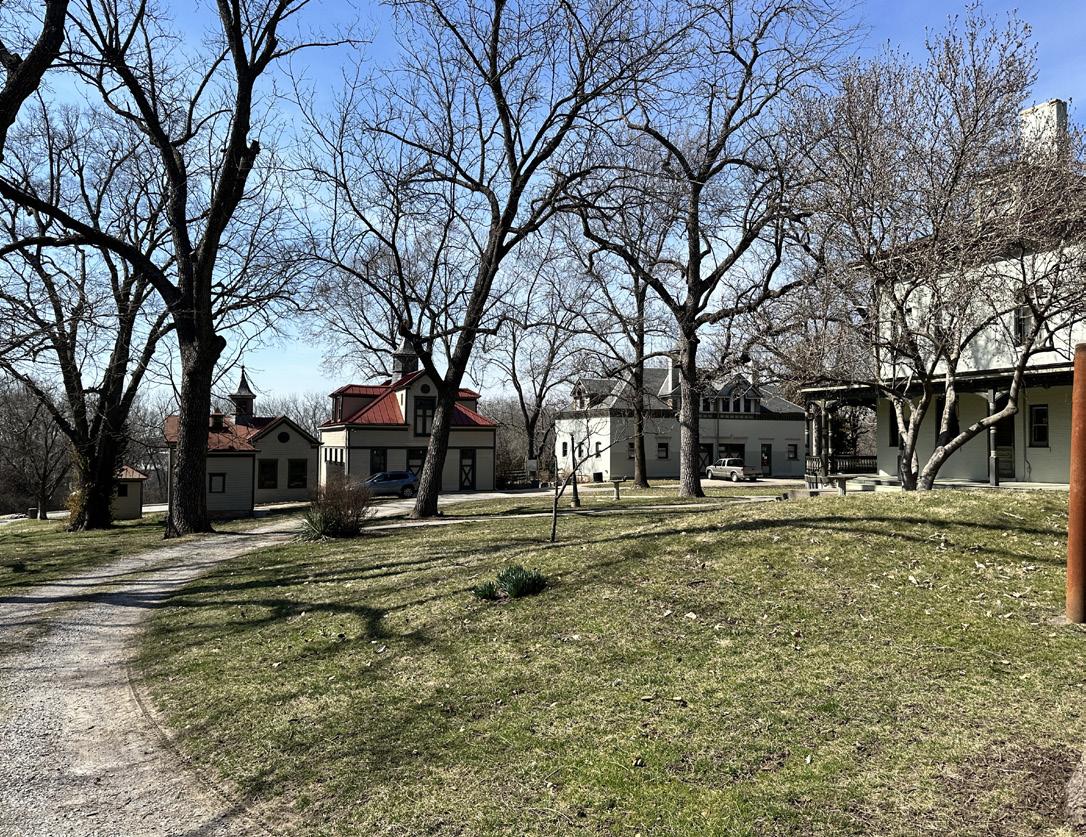
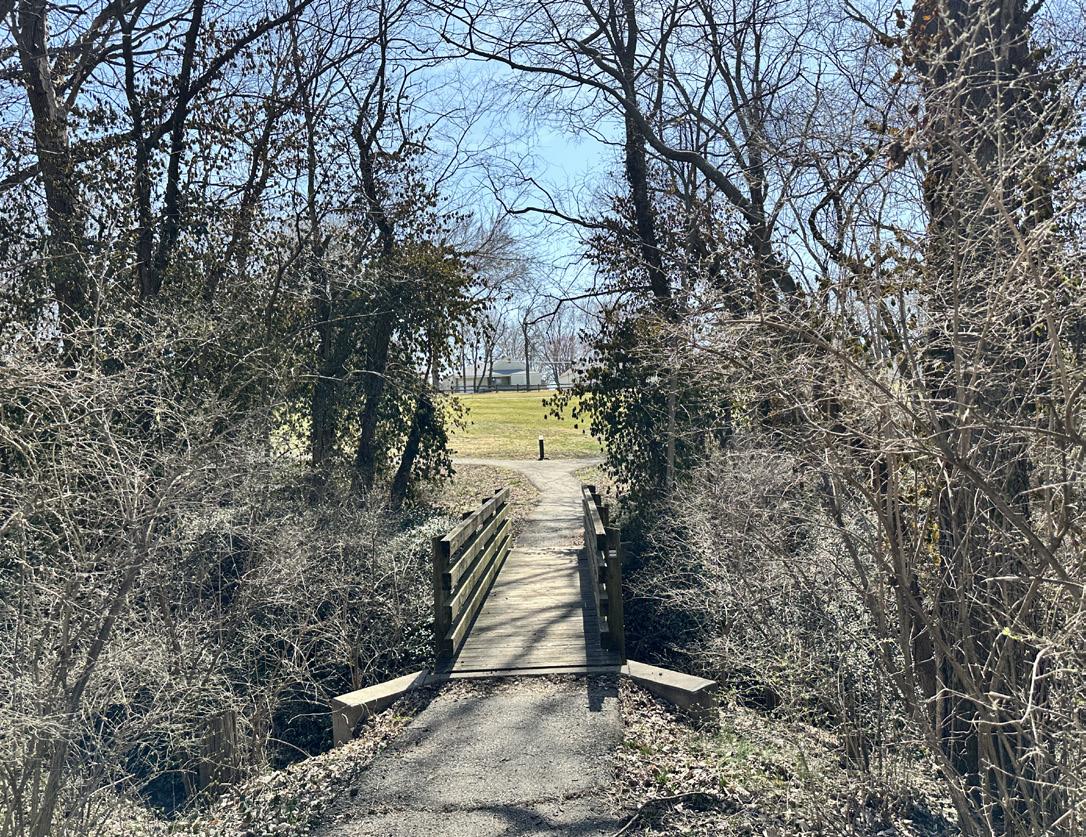
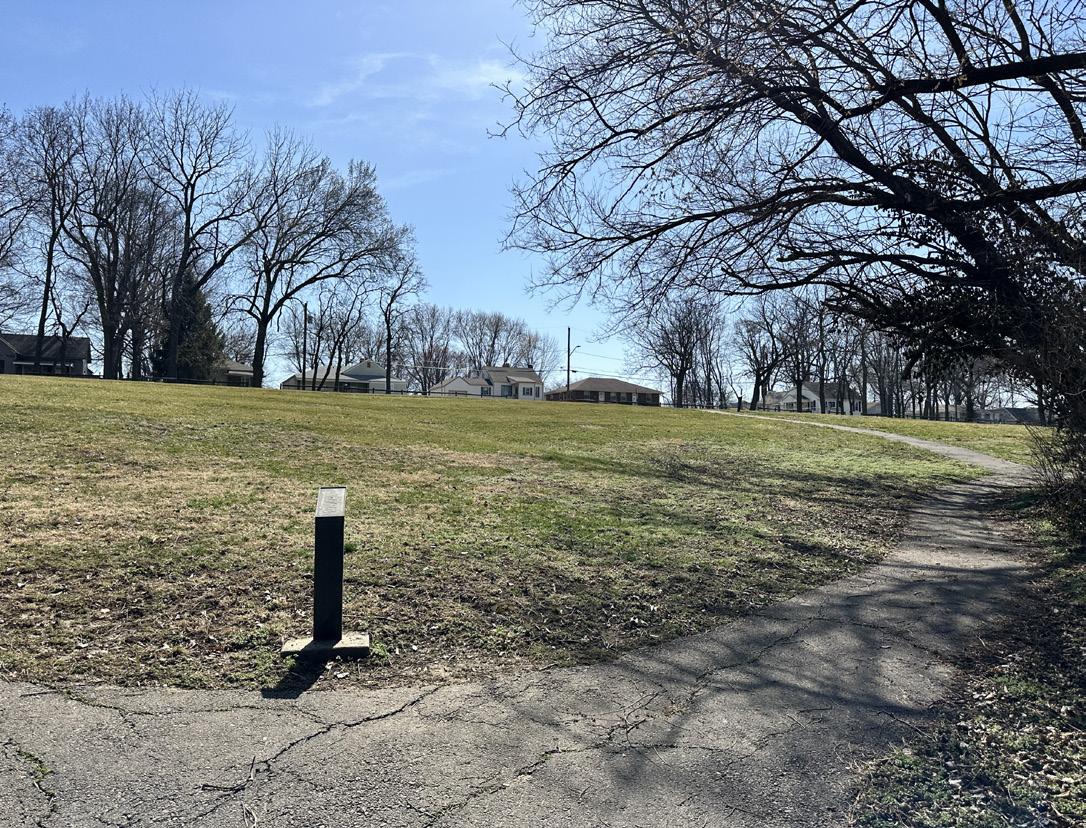
Signage/trail markers.
Name of Site: Blackburn School Park
Date Completed: March, 2025
Completed By:
Avery Nichols and Bennet McCoy
17302 E. Rd Mize Rd, Independence, MO 64057
This park is located on school property near the intersection of M-78 and M-291 Highway.
Size: 7.1 acres
Classification: Special-Use (School)
Baseball Field (Fair Condition)
Pickleball Courts (Poor Condition)
Signage (Fair Condition)
Walking Path (Poor Condition)
Sport field (Poor Condition)
4.
Strengths: The park has an ample amount of open lawn space for soccer or other open programming.
Opportunities: There is an opportunity to provide more seating options, especially around the loop trail. The condition of the walking trail and pickleball courts are poor and could use some improvements/ updates. There is an opportunity to return this area to the school district for maintenance.
Rating:
2 (Moderate Accessibility)
- The park is accessed by parking lots and sidewalks with ramps. Sidewalks lead to all amenities but the practice field, with some elevation change from the parking lots down to the pickleball courts and field.
-Walking trail is maintained by the school district.
Active/Passive: Passive
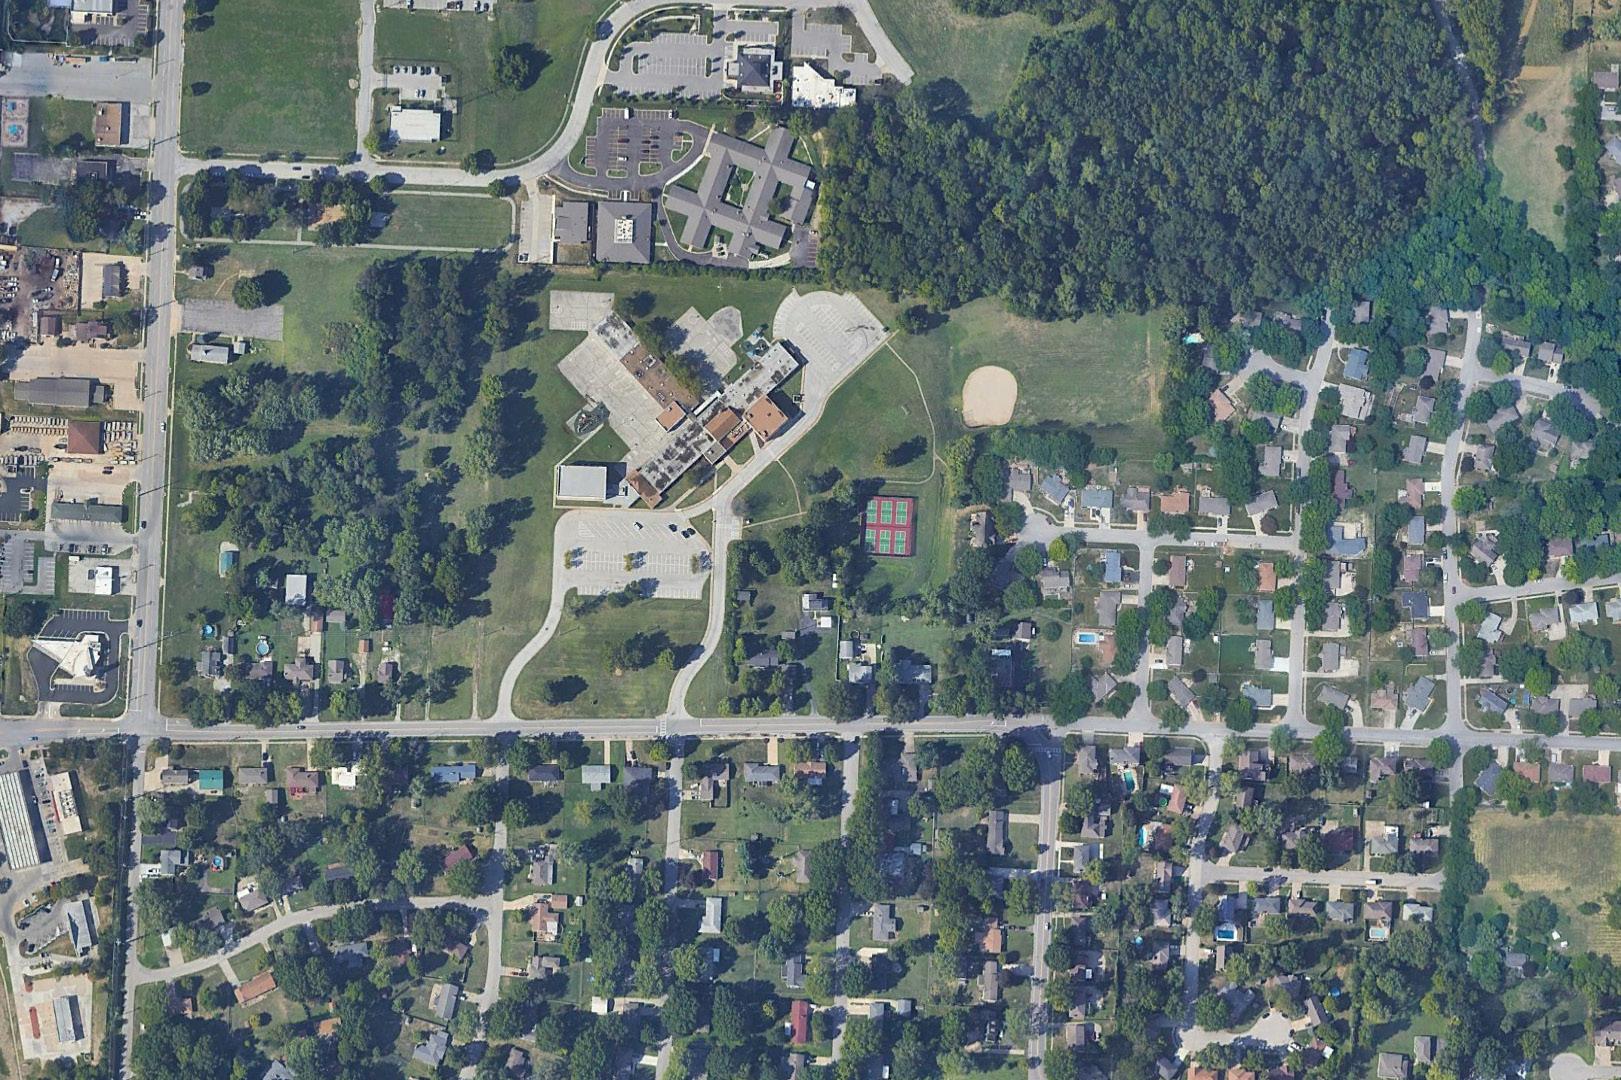
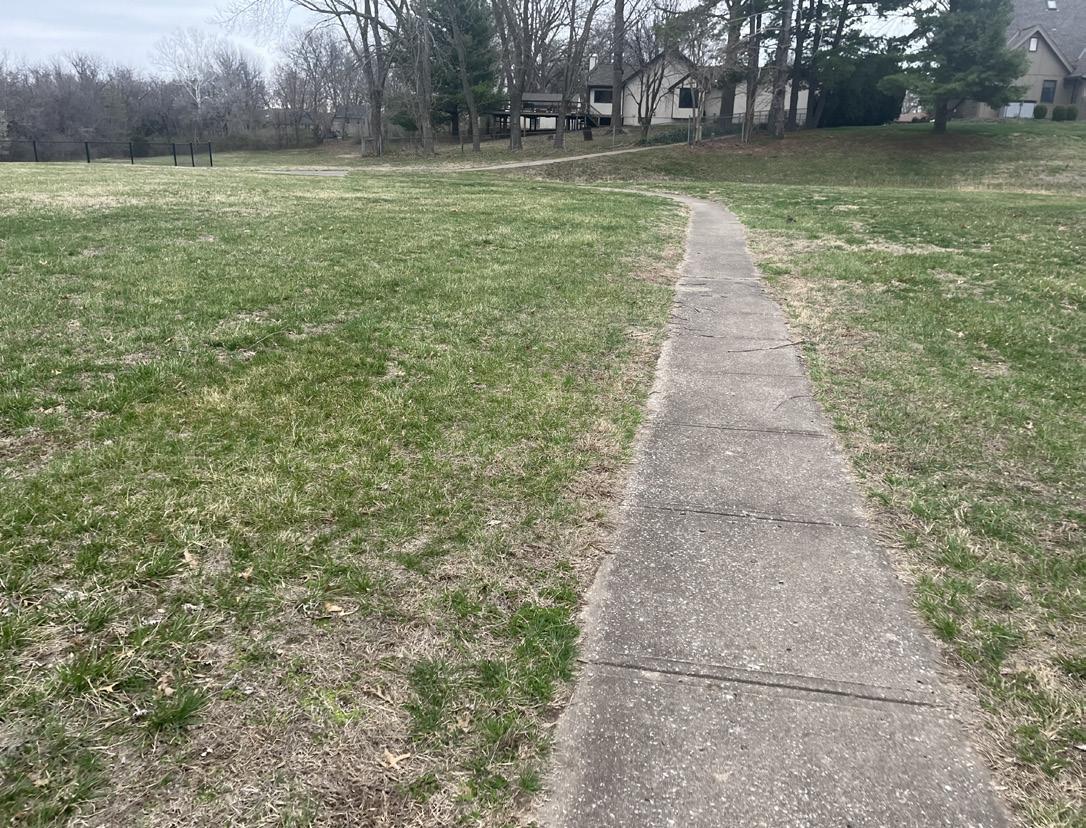
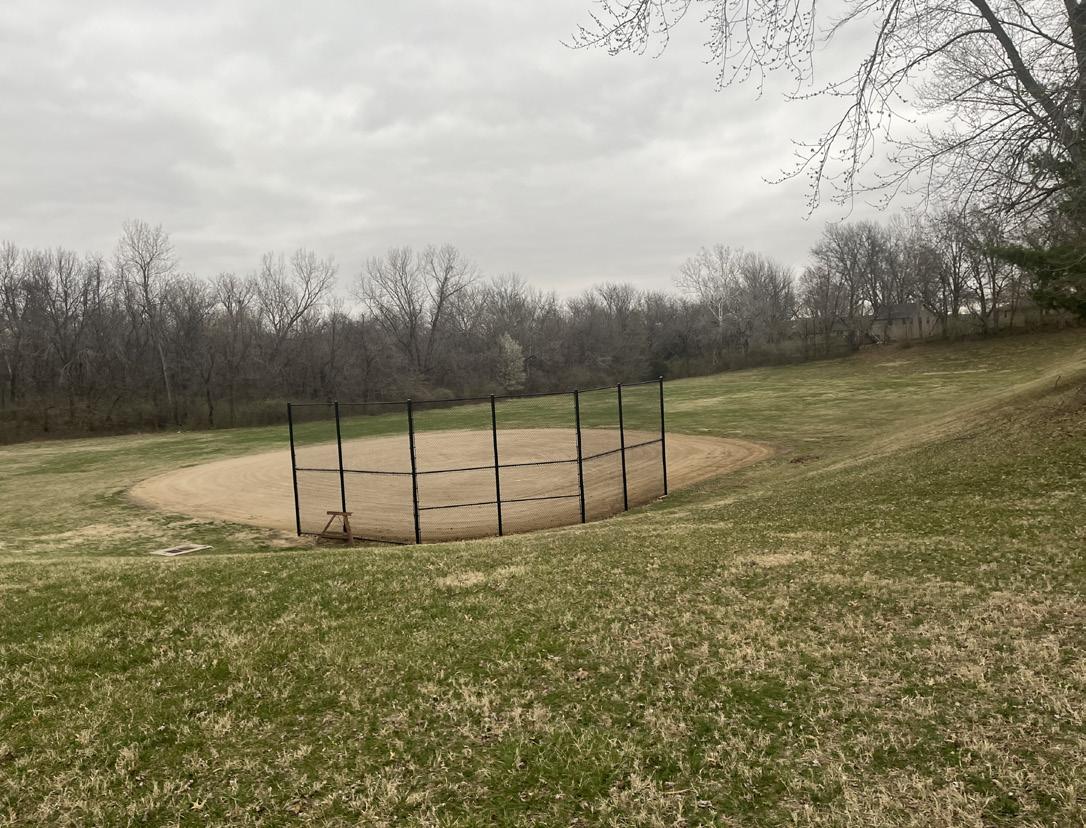
Name of Site: Brady Park Greenspace
Date Completed: March, 2025
Completed By: Avery Nichols and Bennet McCoy
900 N. Delaware Ave, Independence, MO 64050
This site is located near McCoy Park along US-24 Highway.
Size: 3.8 acres
Classification: Neighborhood Park (Greenspace)
3. INVENTORY OF FACILITY AMENITIES AND CONDITIONS:
Signage (Fair Condition)
4. STRENGTHS AND OPPORTUNITIES:
Strengths: The greenspace has connections to adjacent park and neighborhoods.
Opportunities: The space is in need of improvements including a trail, seating, lighting, etc.
Rating:
4 (low Accessibility)
- The site has no dedicated parking, other than on-street parking. There is a sidewalk along Charles Street and Delaware Street with no other circulation access in the greenspace.
6. GENERAL NOTES:
Active/Passive: Passive
7. PHOTO INVENTORY:
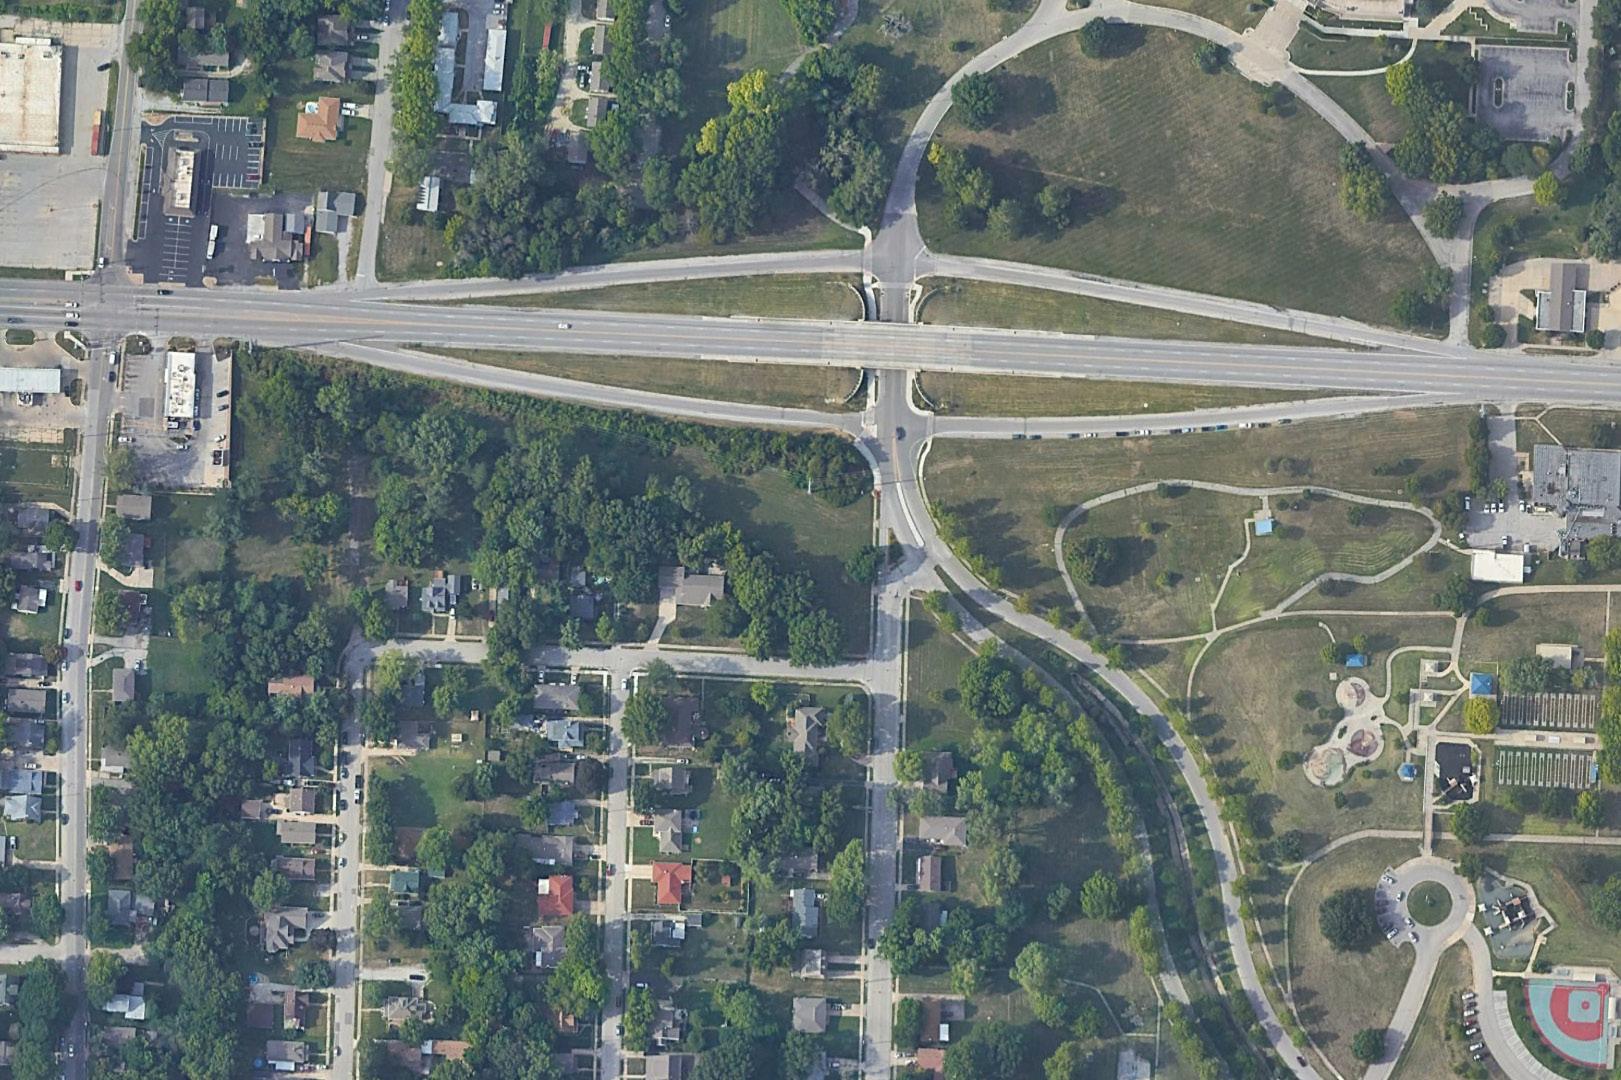
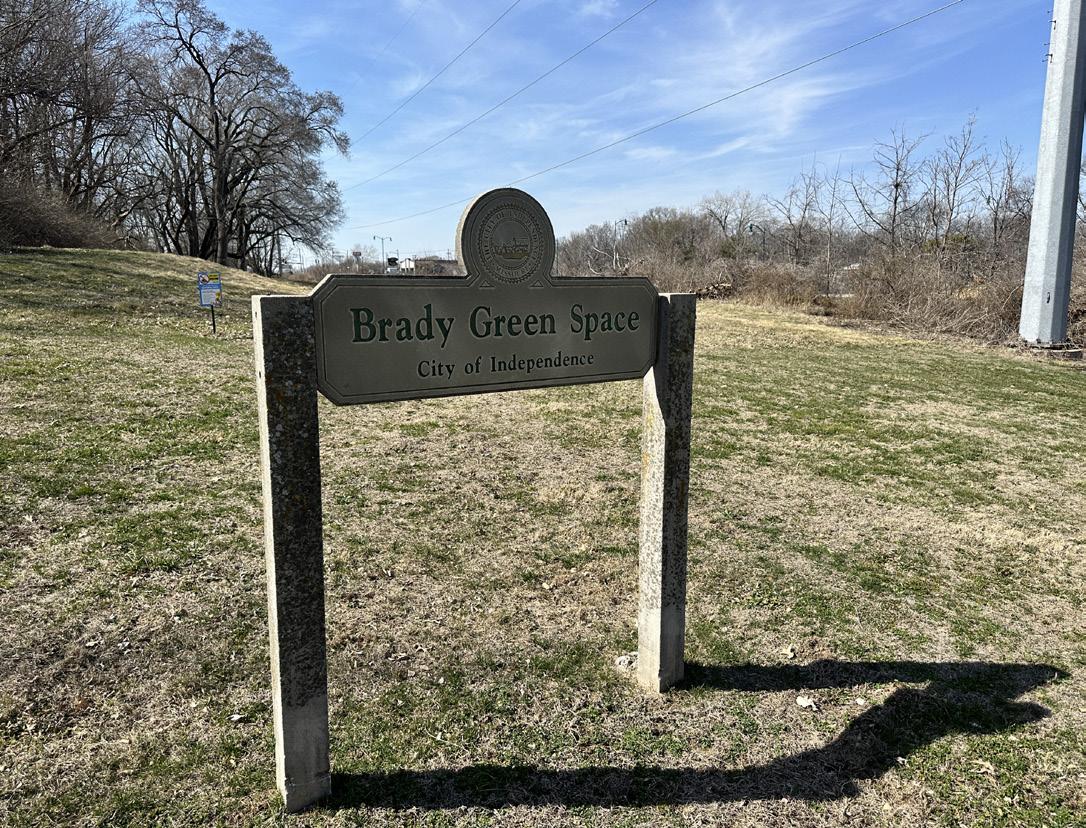
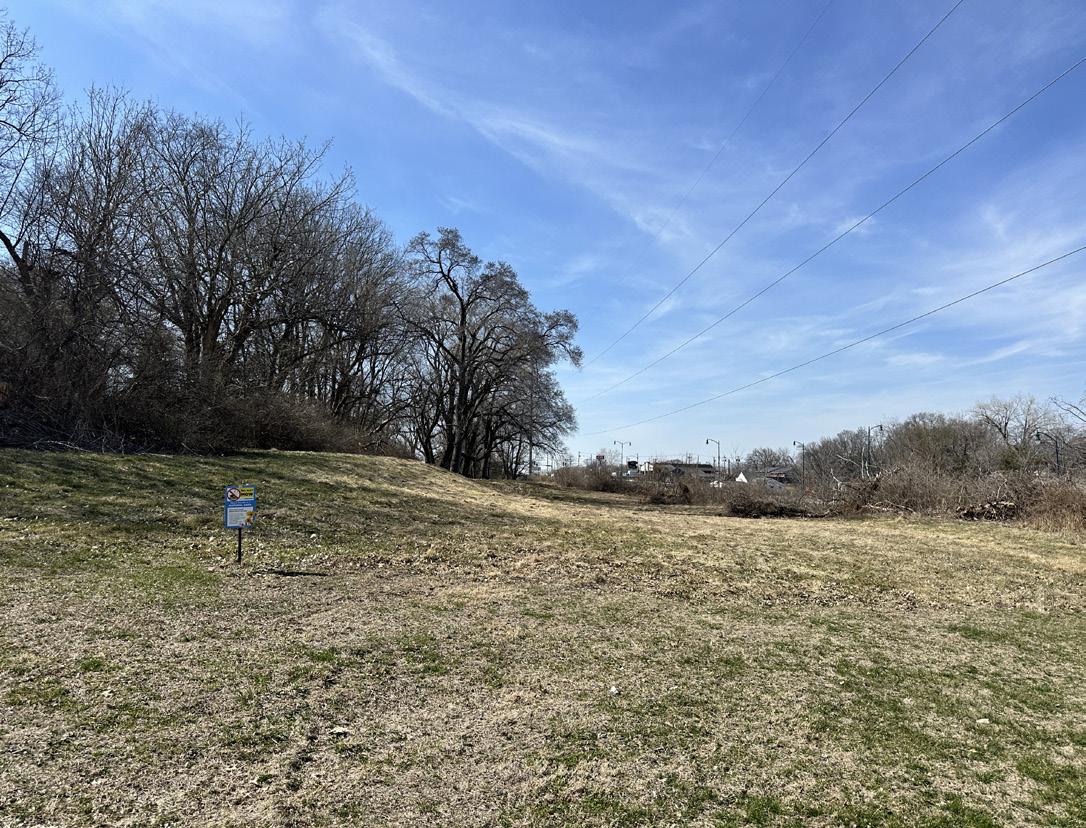
Additional view of open space.
Name of Site: Bund-Jack Park
Date Completed: March, 2025
Completed By: Avery Nichols and Bennet McCoy
1001 N. Jackson Dr, Independence, MO 64056
This site is located in northeast Independence along Bundschu Road.
Size: 1.23 acres
Classification: Neighborhood Park
Picnic Tables (Fair Condition) Playgrounds (Good Condition) Walking Path (Good Condition)
Strengths: The amenities are relatively new and the location is quiet and does not see much traffic.
Opportunities: There is opportunity to add sidewalks closer to street and add on-street parking. In addition, accessibility options could be considered to accommodate for the grade change between the park and street.
Rating:
4 (Low Accessibility)
- The park has no dedicated parking, making access difficult. There is sidewalk access off of N Jackson Drive with a sloped sidewalk down to a playground and picnic spaces.
GENERAL NOTES:
Active/Passive: Passive
7. PHOTO INVENTORY:
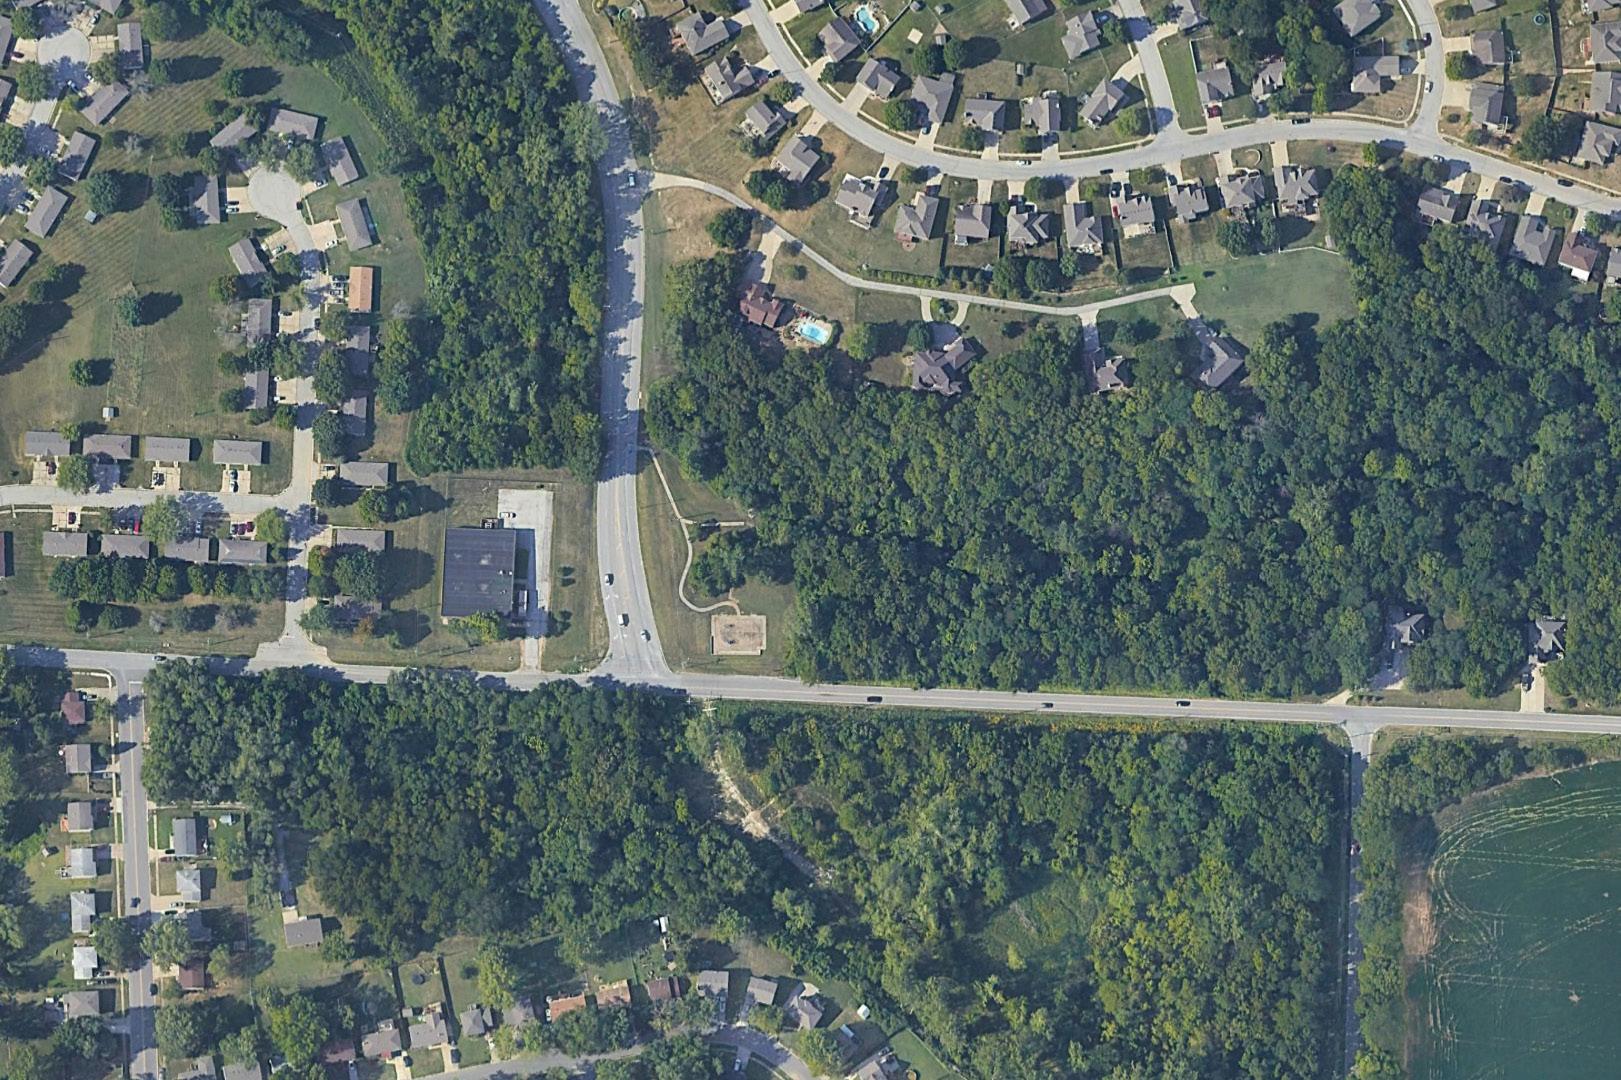
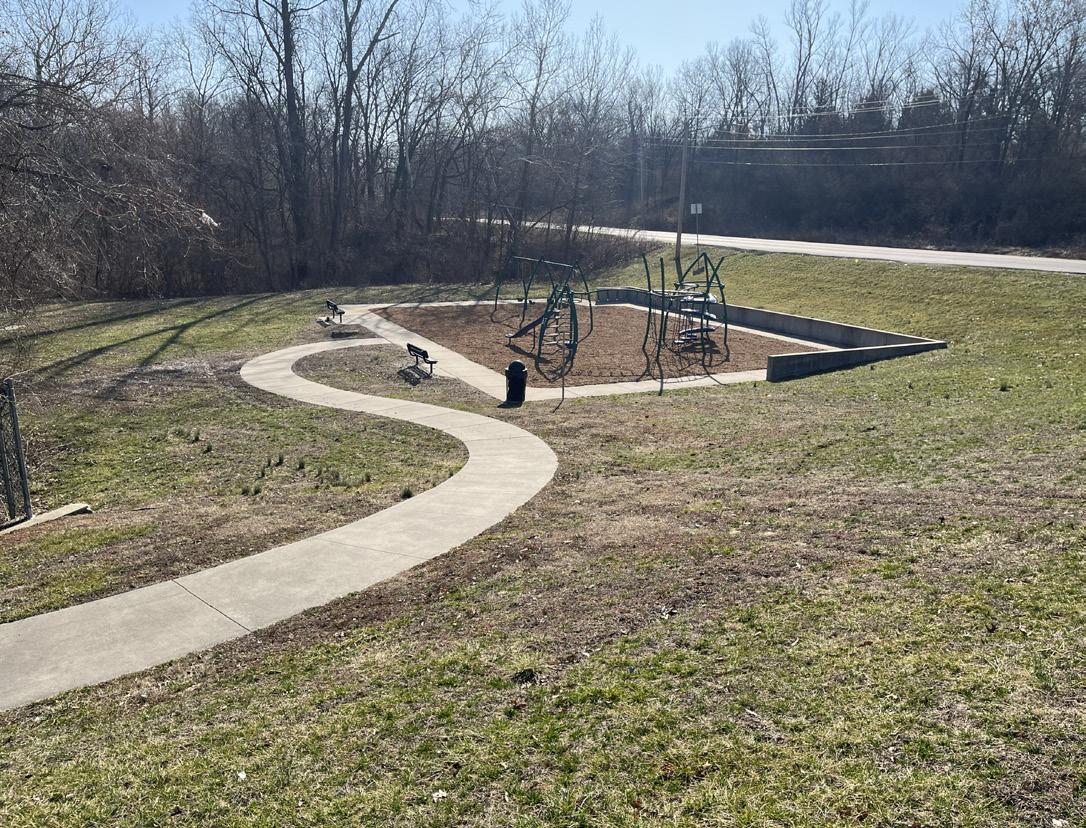
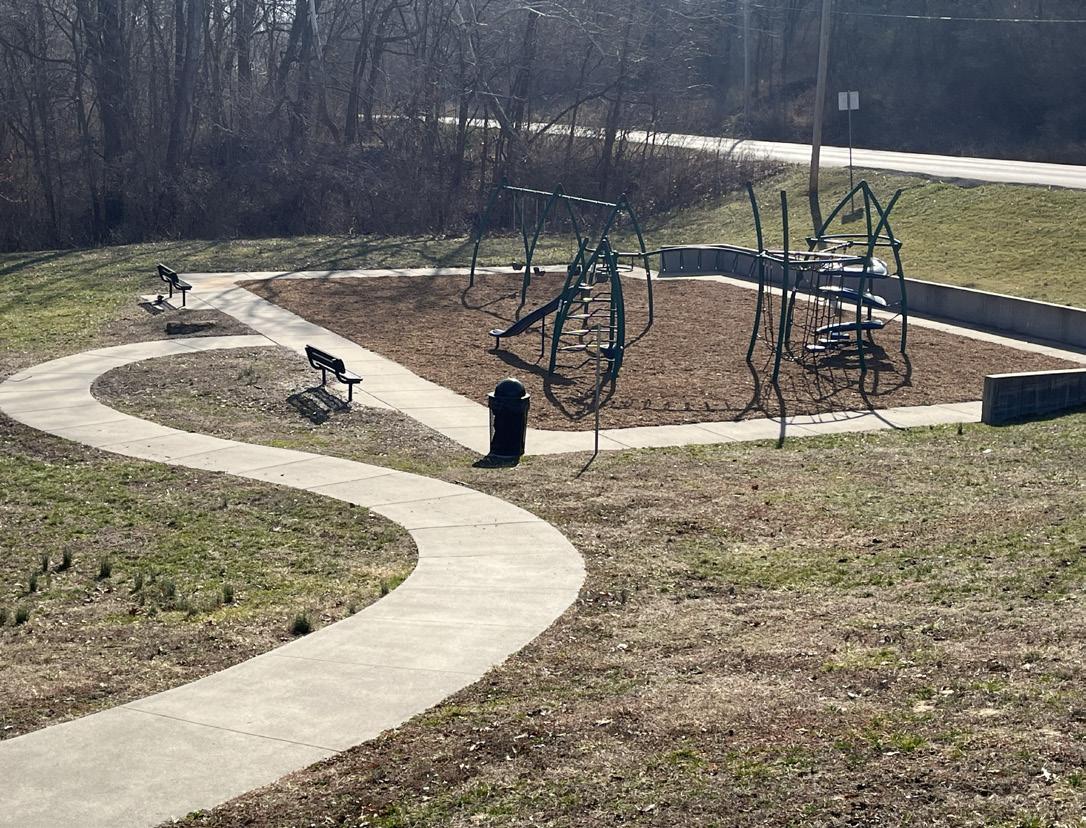
Playground structure.
No sidewalk or on-street parking stalls, makes access difficult.
Name of Site: Bundschu Park
Date Completed: March, 2025
Completed By: Avery Nichols and Bennet McCoy
11400 E 9th St S, Independence, MO 64054
The park sits near the NW corner of the Independence city limit. The park shelter can be accessed via E 9th St. and sits just south of US-24 Highway.
Size: 19 acres
Classification: Community Park
3. INVENTORY OF FACILITY AMENITIES AND CONDITIONS:
Basketball Courts (4 Full Size)(Fair Condition)
BBQ Grills (2) (Poor Condition)
Picnic Shelter (Fair Condition)
Picnic Tables (6) (Fair Condition)
Playground (Fair Condition)
Signage (Fair Condition)
4. STRENGTHS AND OPPORTUNITIES:
Walking Path (.2 miles) (Poor Condition)
Strengths: Bundschu Park has an ample amount of parking, in addition to a long and wide loop trail connecting the playground, picnic shelter, and basketball courts.
Opportunities: There are opportunities to improve accessible routes and refurbish pavement sections in the trail.
Rating: 3 (Moderate Accessibility)
- The park has a parking lot with ramp access into the site from sidewalks. It has a wide loop trail around a playground, pavilion, and green space. There is also a sidewalk with stair access down to basketball courts, with a wooded area in the northern area of the park.
Active/Passive: Passive
7. PHOTO INVENTORY:
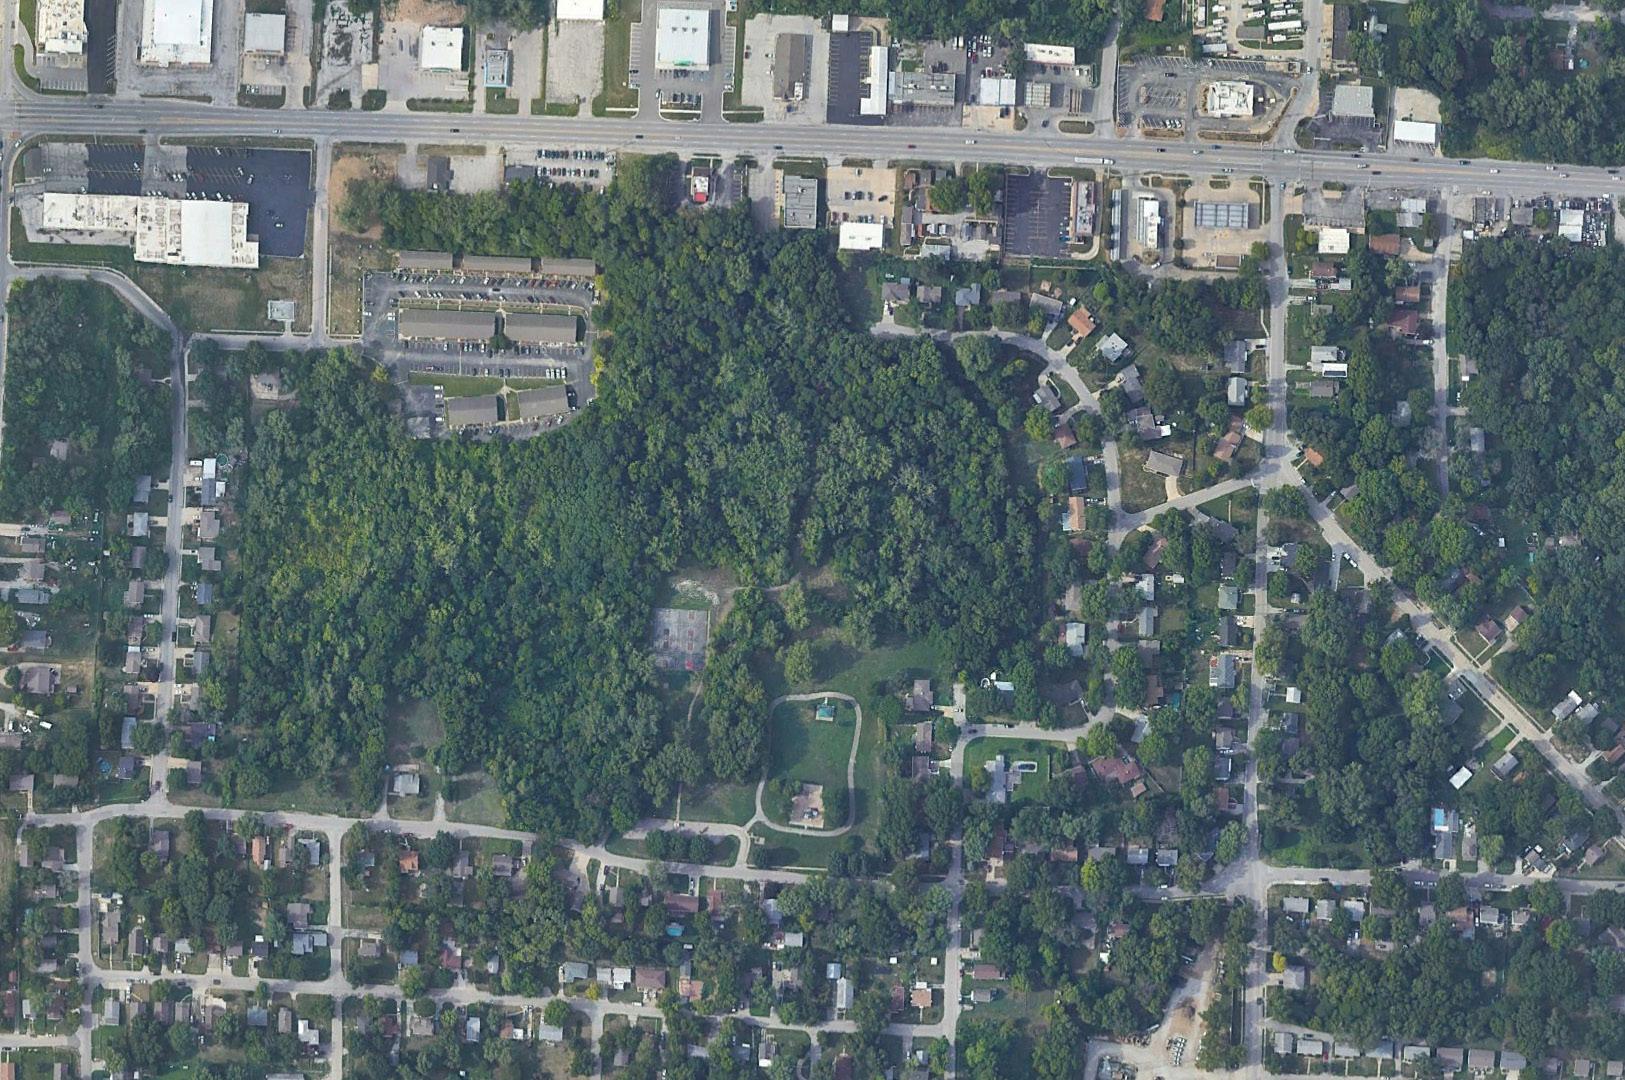
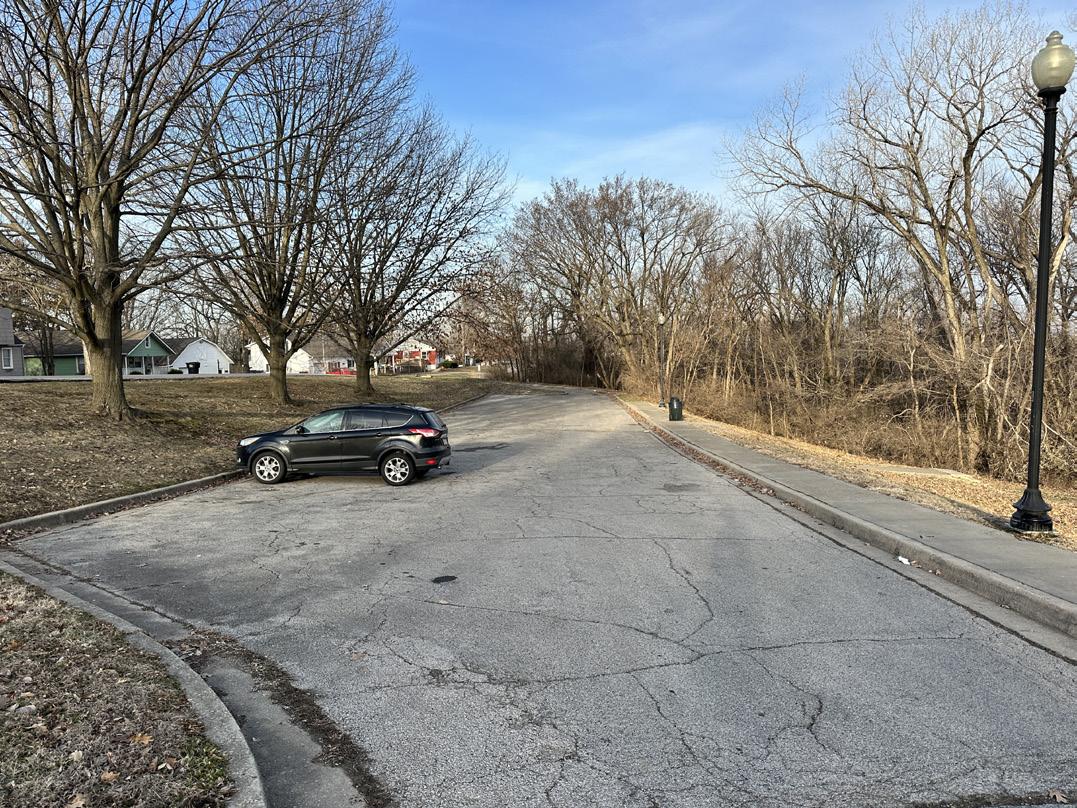
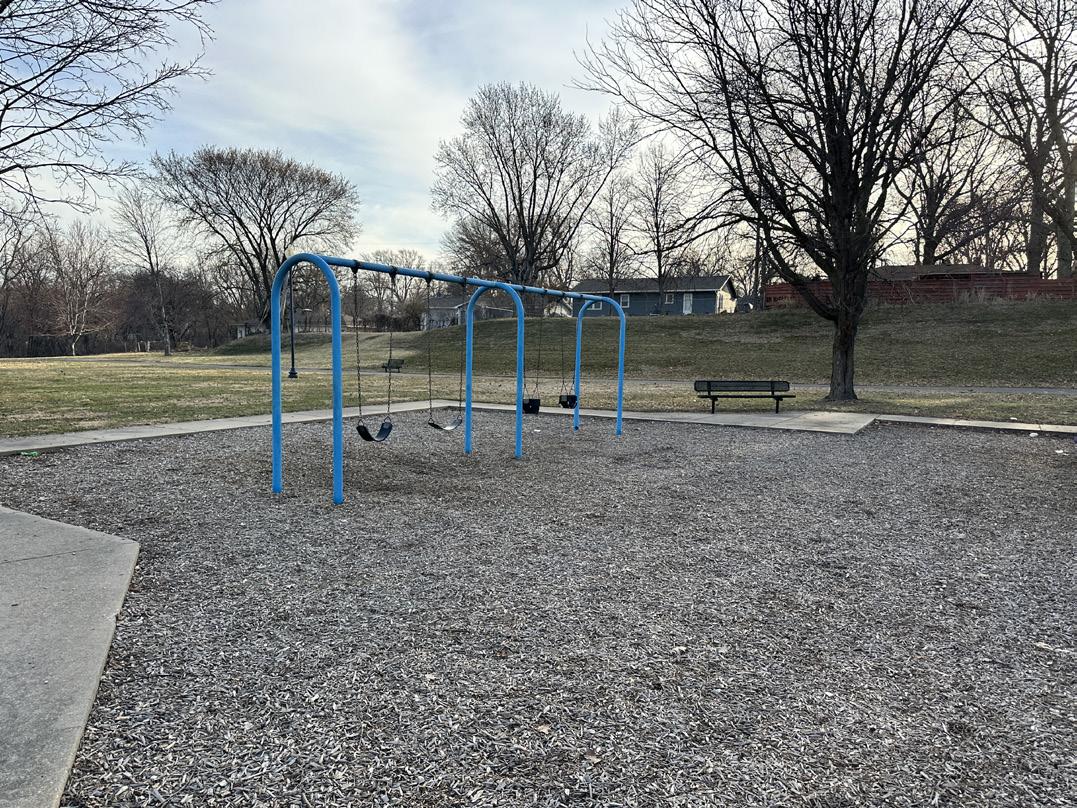
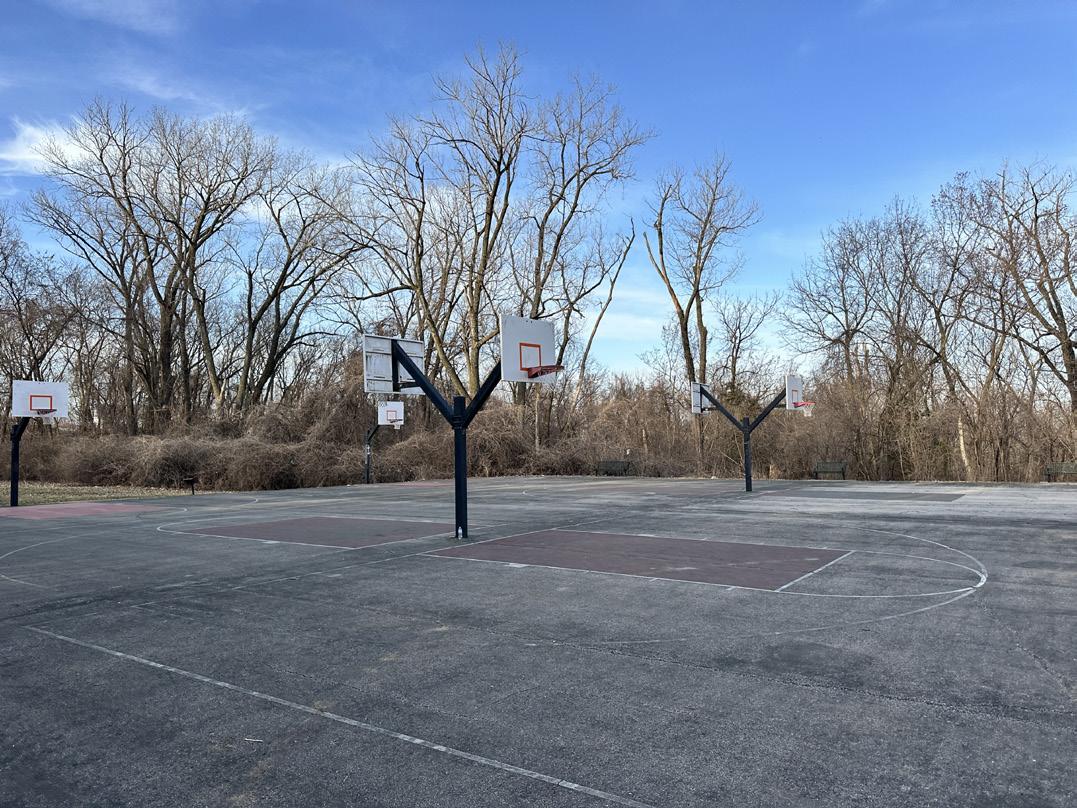
Name of Site: Carriage Hills Park
Date Completed: March, 2025
Completed By: Avery Nichols and Bennet McCoy
16841 E. 41st St. Independence, MO 64055
16900 E. 40th Ter. S. Independence, MO 64055
This park is located in south Independence and is near Interstate 70. With a smaller greenspace across the street and closer to the Interstate.
Size: 9.2 acres
Classification: Neighborhood Park
3.
Signage (Fair Condition)
Walking Path (Fair Condition)
4.
Strengths: The park contains an asphalt walking trail surrounded by trees and greenspace making for a nice neighborhood amenity.
Opportunities: There is opportunity for additional programming elements for either passive or active use, and a trail connection between the park space and separate greenspace.
Rating:
1 (High Accessibility)
- The park is accessed from on-street parking and has a wide asphalt loop trail.
(Separate greenspace) Rating: 5 (low Accessibility)
- No sidewalk or park access
Active/Passive: Passive
7. PHOTO INVENTORY:
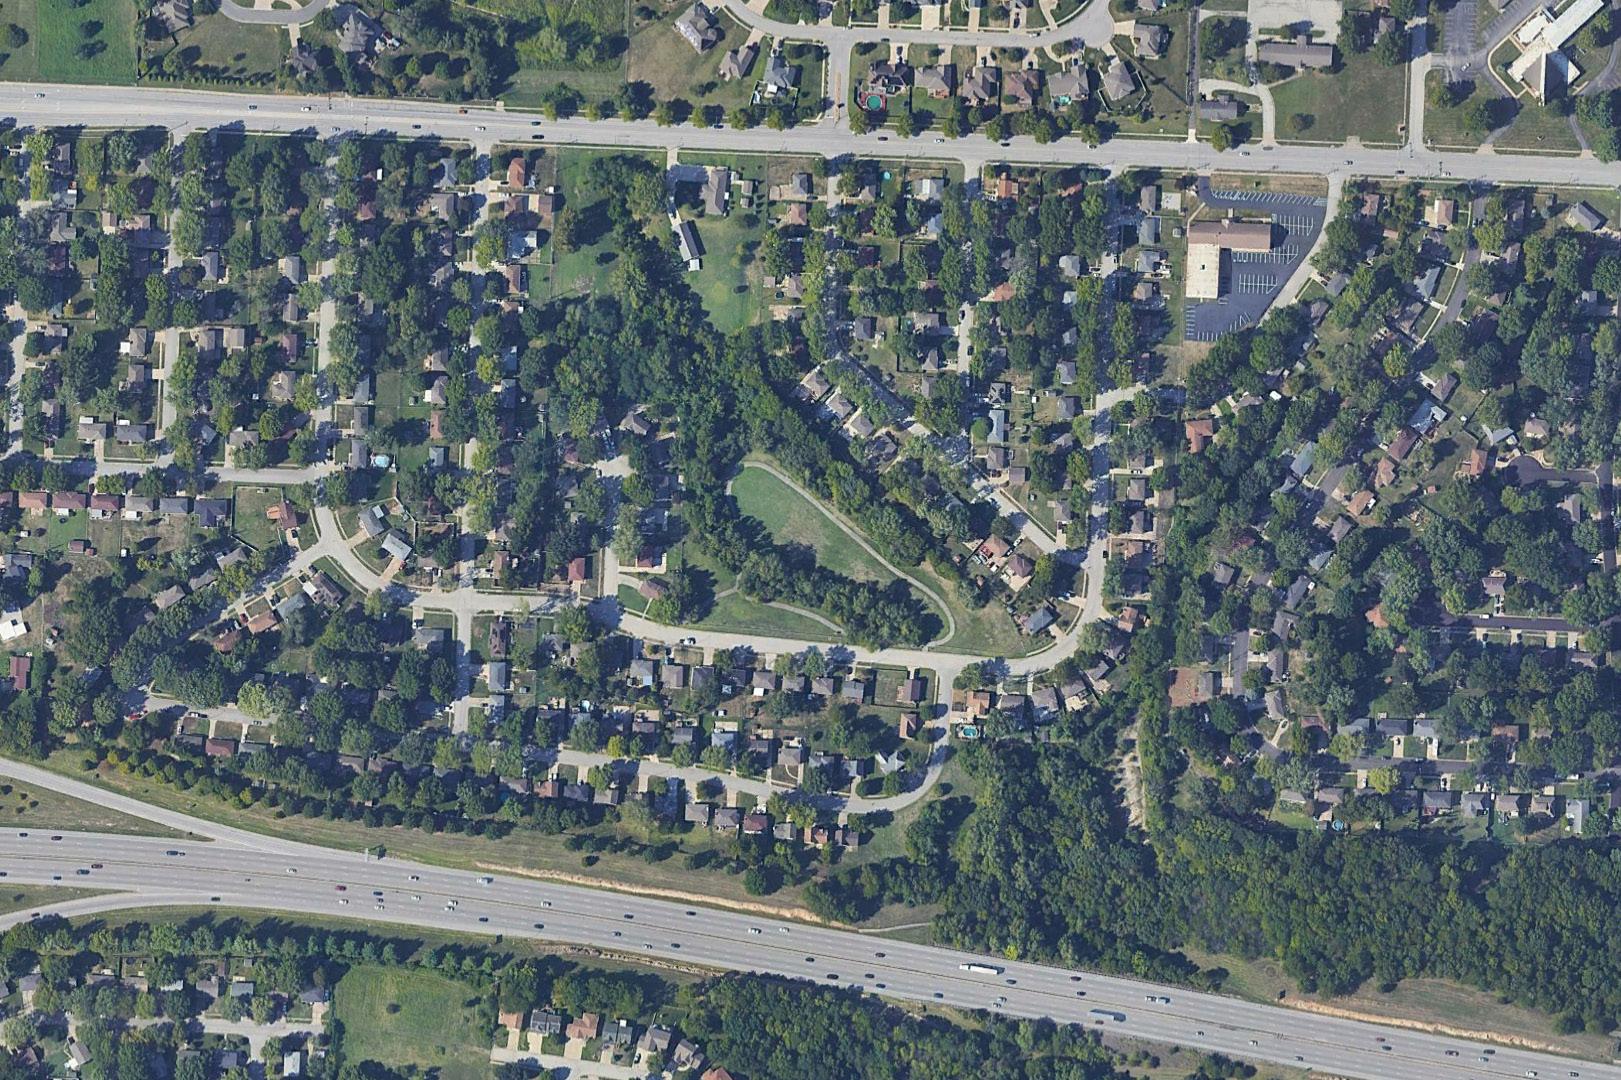
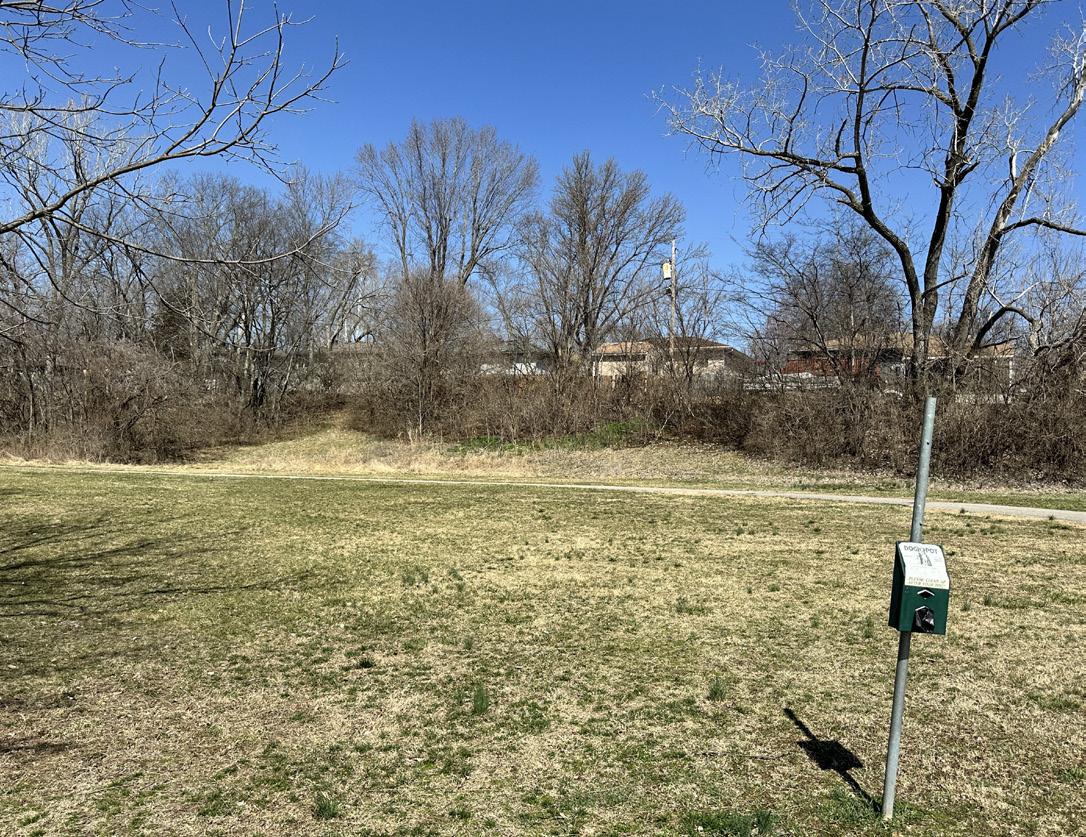
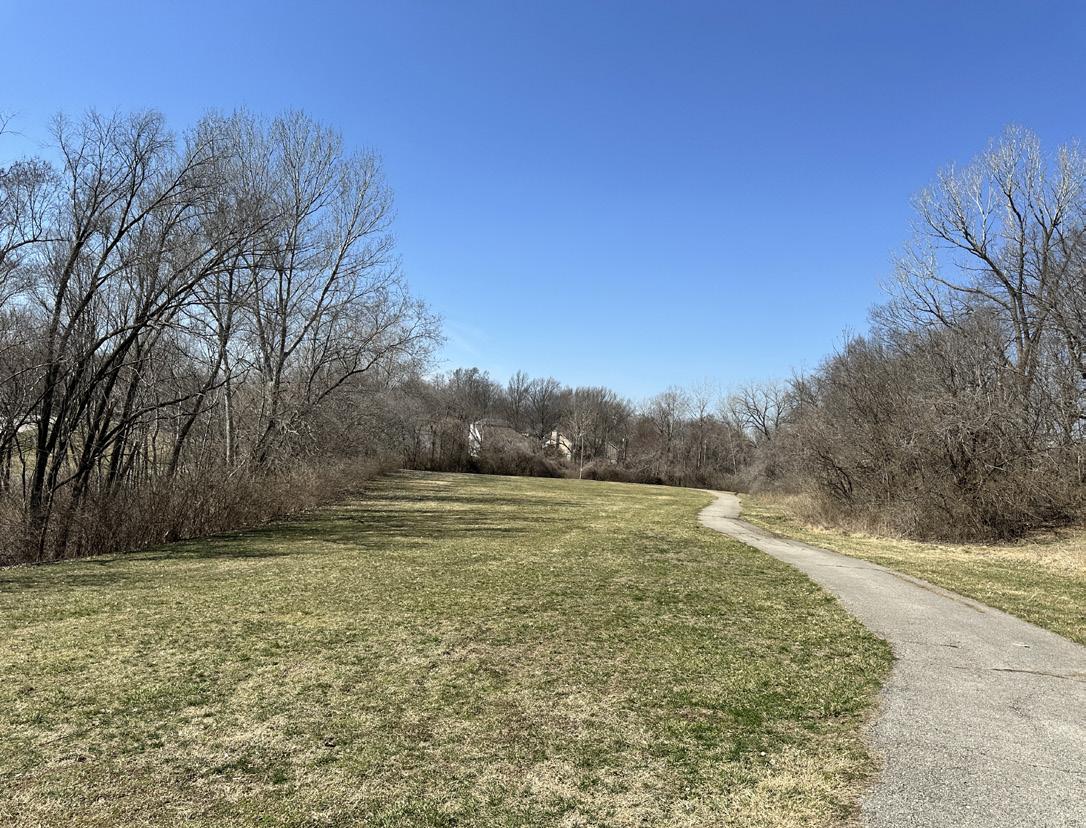
Name of Site: Charles Long Greenspace
Date Completed: March, 2025
Completed By: Avery Nichols and Bennet McCoy
9300 E. Truman Rd, Independence, MO 64053
The site sits at the intersection of S Brookside Ave and E Truman Rd.
Size: .45 acres
Classification: Pocket Park (Greenspace)
3. INVENTORY OF FACILITY AMENITIES AND CONDITIONS:
Picnic Tables (Poor Condition) Signage (Poor Condition)
4. STRENGTHS AND OPPORTUNITIES:
Strengths: The space is quaint and easily accessible. It has some picnic tables and a few stone half walls that could be used as seating.
Opportunities: There is a need to refurbish concrete amenities, in addition to pavement and walkways.
Rating:
5 (Low Accessibility)
- There is parallel parking on site with a sidewalk that leads to stairs.
6. GENERAL NOTES:
Active/Passive: Passive
7. PHOTO INVENTORY:
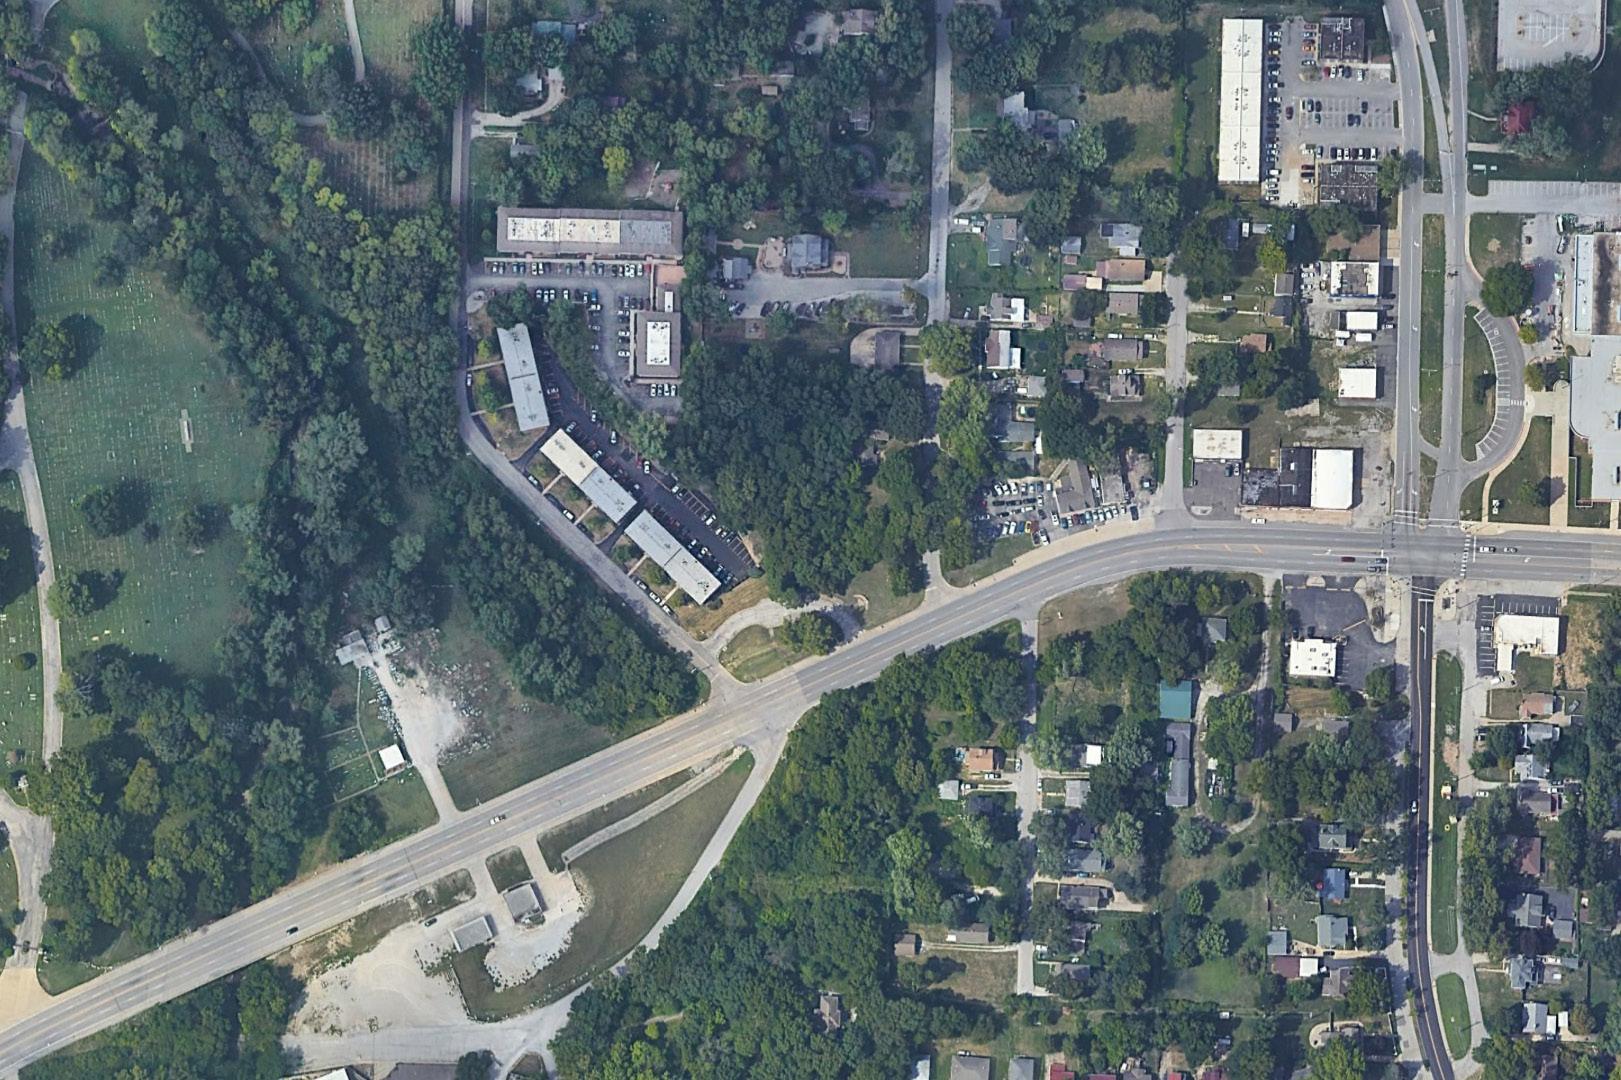
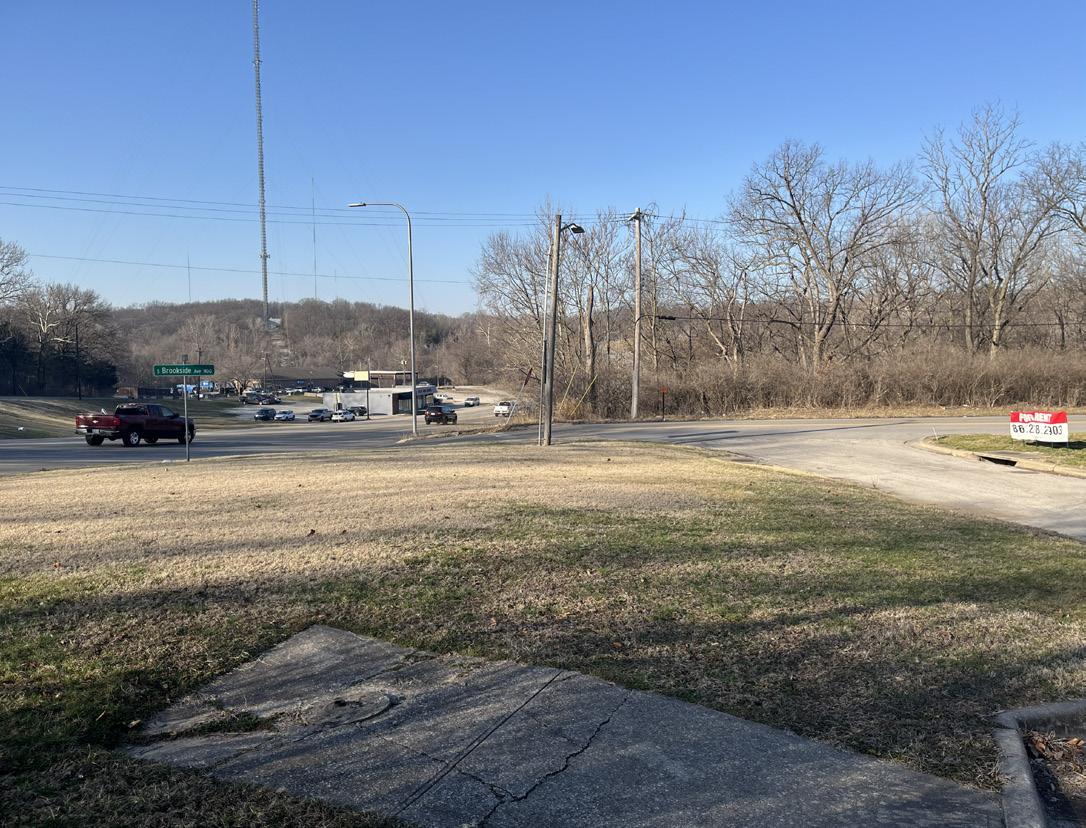
Non-connecting sidewalk/walkway.
Name of Site: Choplin-Hood Park
Date Completed: March, 2025
Completed By: Avery Nichols and Bennet McCoy
15919 N. Trail Ridge Dr., Independence, MO 64050
16068 E. Cogan Ln, Independence, MO 64050
This site is located near the intersections of US-24 and M-291 Highways with entrances located off of Trail Ridge Road and 291 highway.
Size: 17 acres
Classification: Community Park
Baseball field (Poor Condition)
Playground (Poor Condition)
Signage (Fair Condition)
Walking Path (Poor Condition)
4.
Strengths: The park is located directly next to a neighborhood cul-de-sac and has a trail connecting a baseball field, basketball court, and playground.
Opportunities: There is a fence and gate limiting access to the park. There is also an opportunity to add more benches or seating elements along the trail.
Rating:
3 (Moderate Accessibility)
- There is a parking lot with ramp access into the site from sidewalks. It has an aging sidewalk that runs from the parking area to the practice baseball field.
GENERAL NOTES:
Active/Passive: Passive
7. PHOTO INVENTORY:
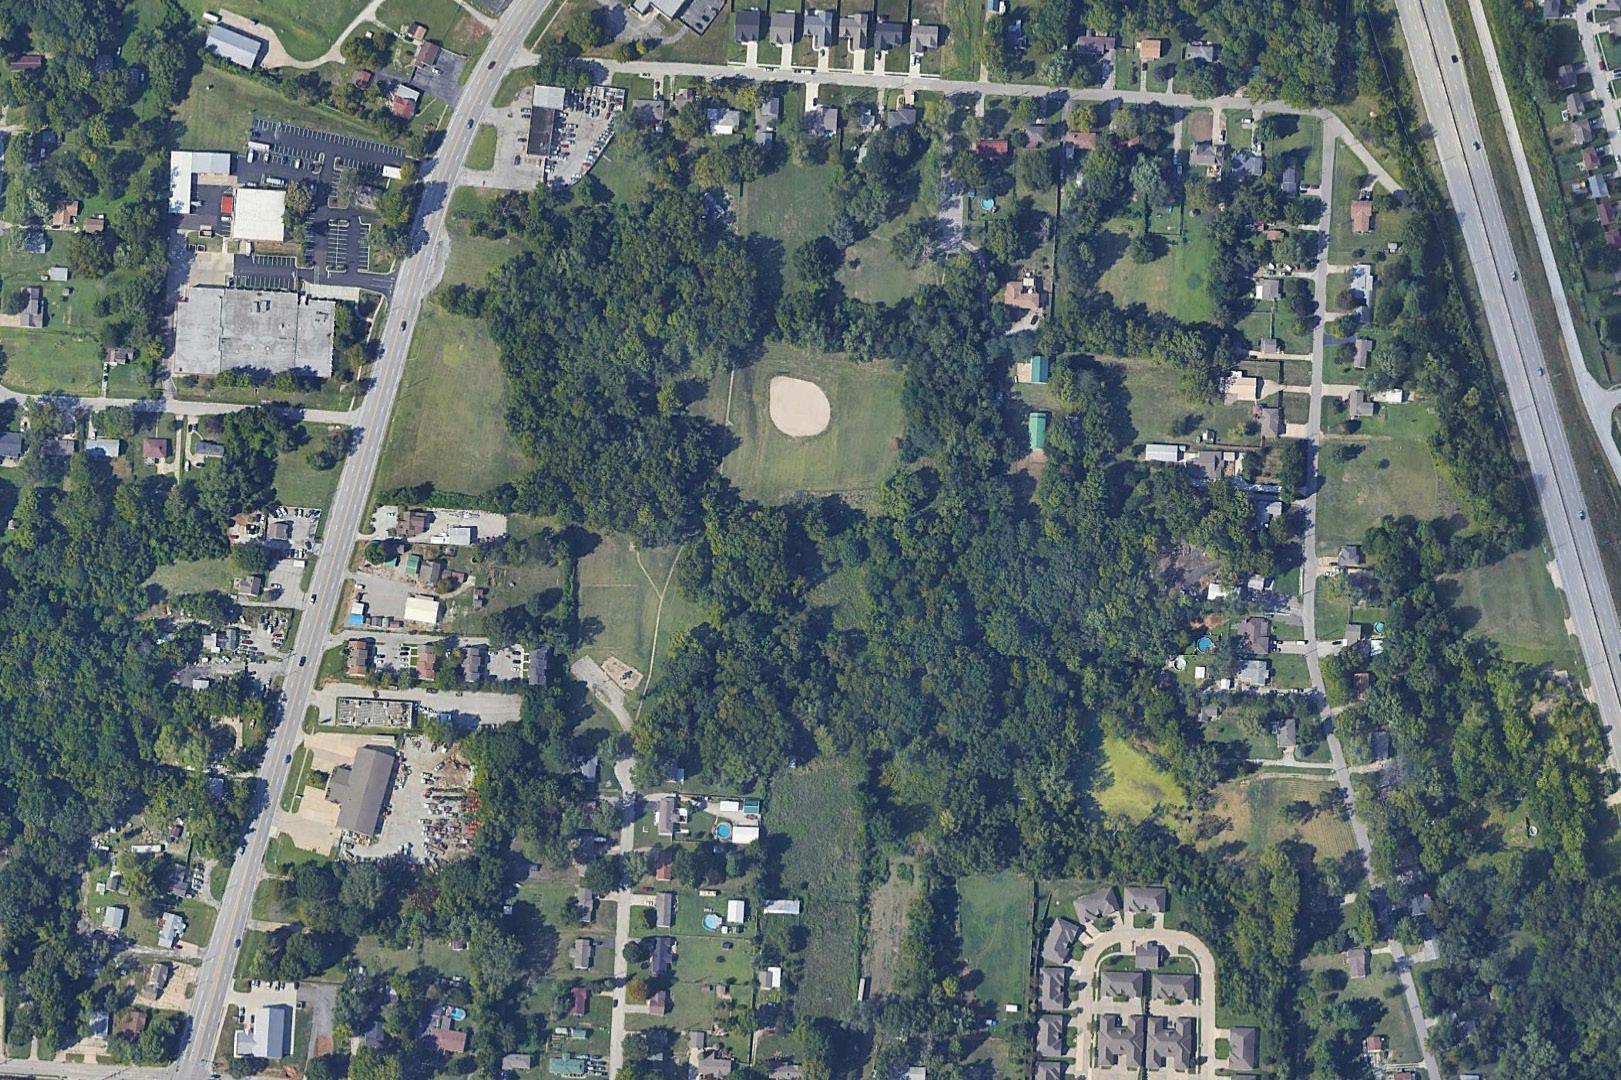
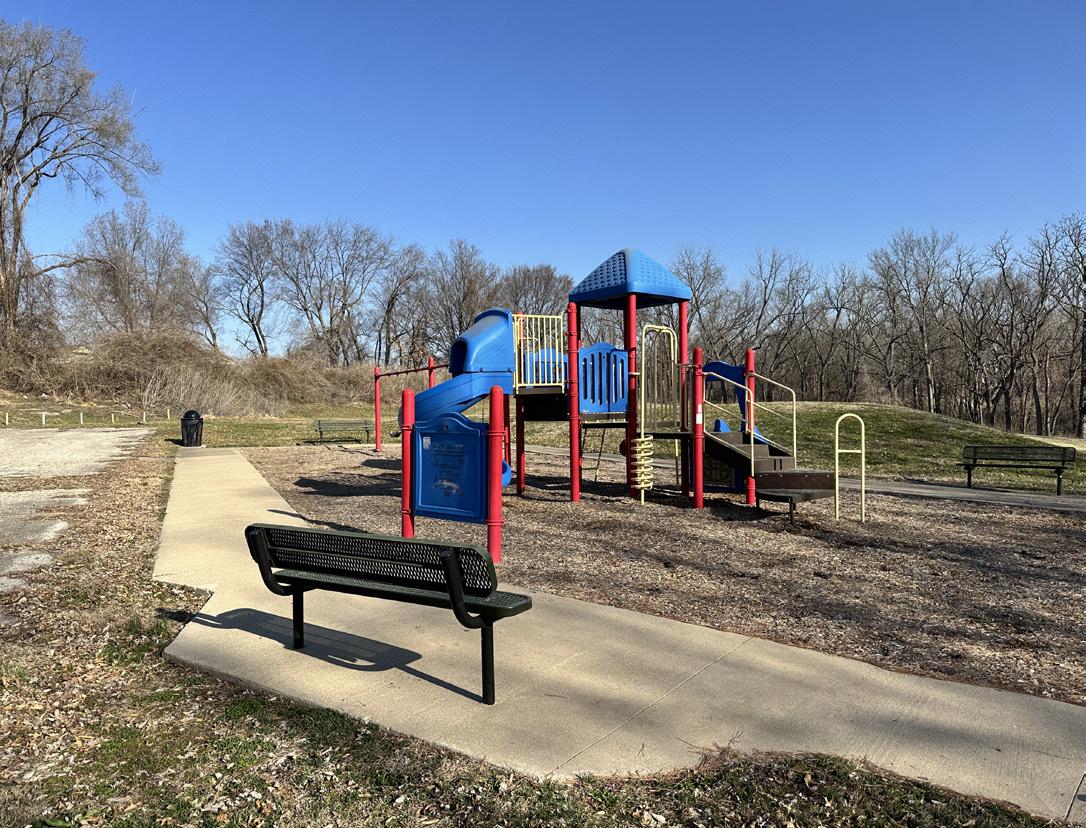
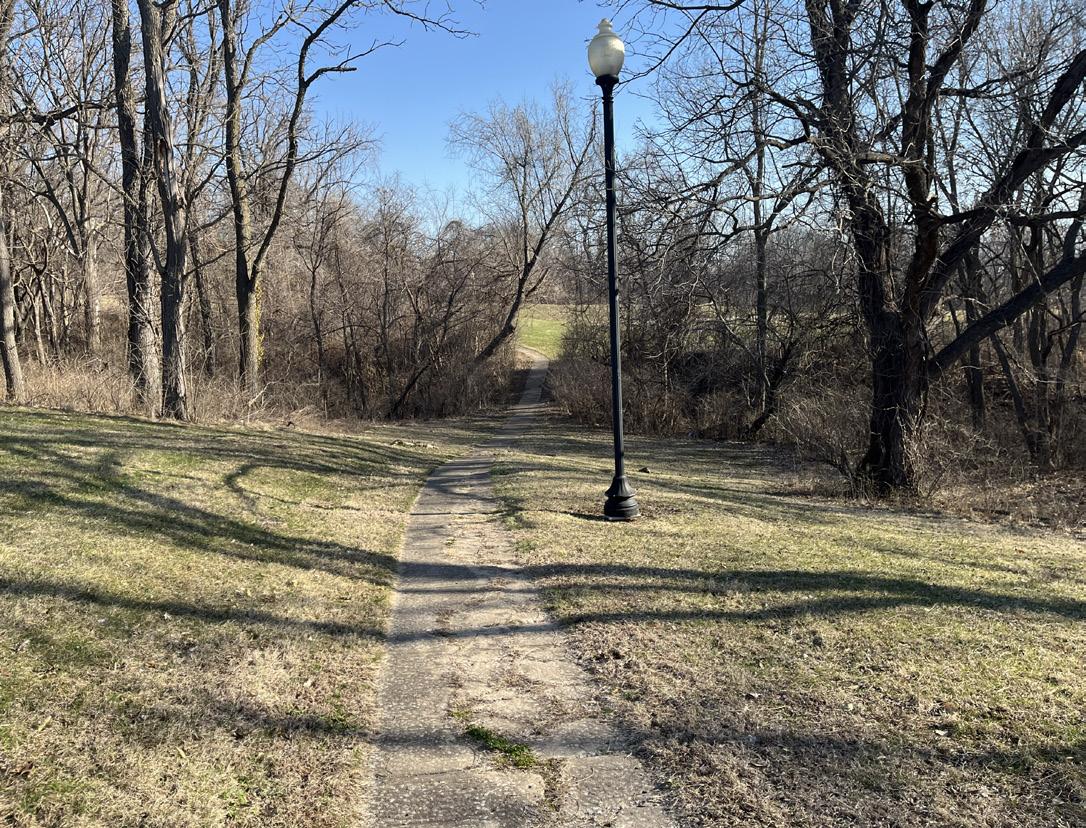
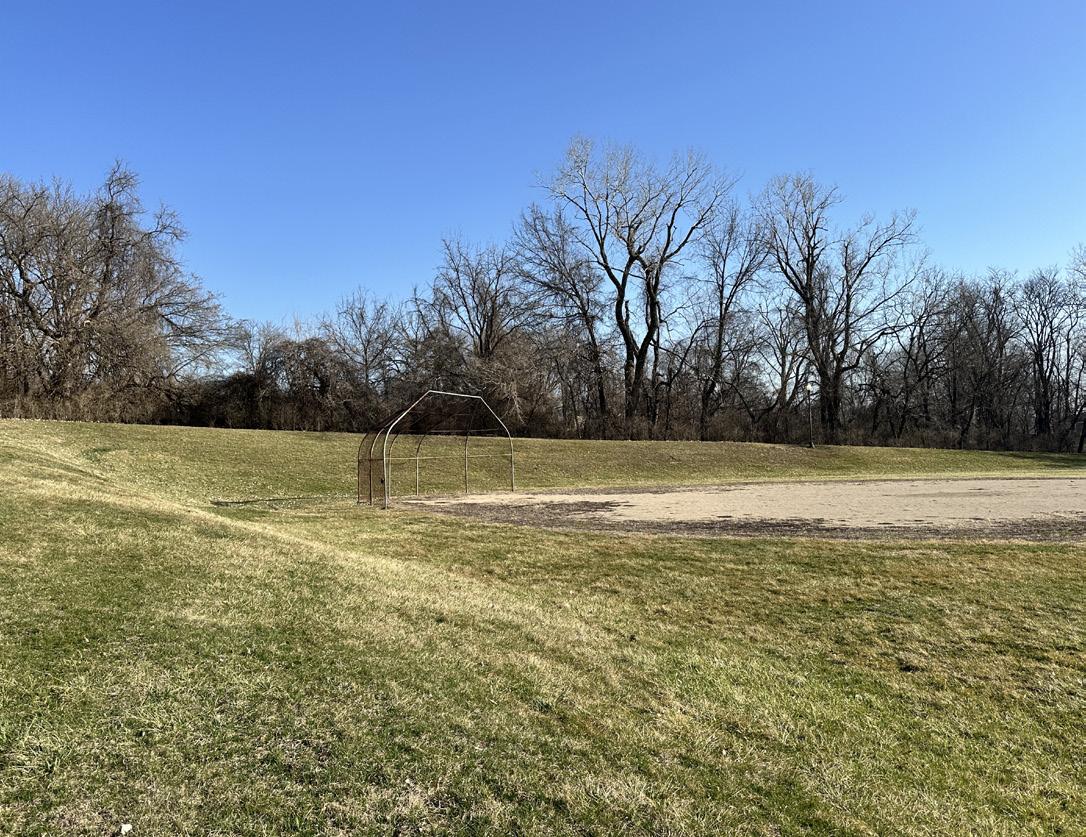
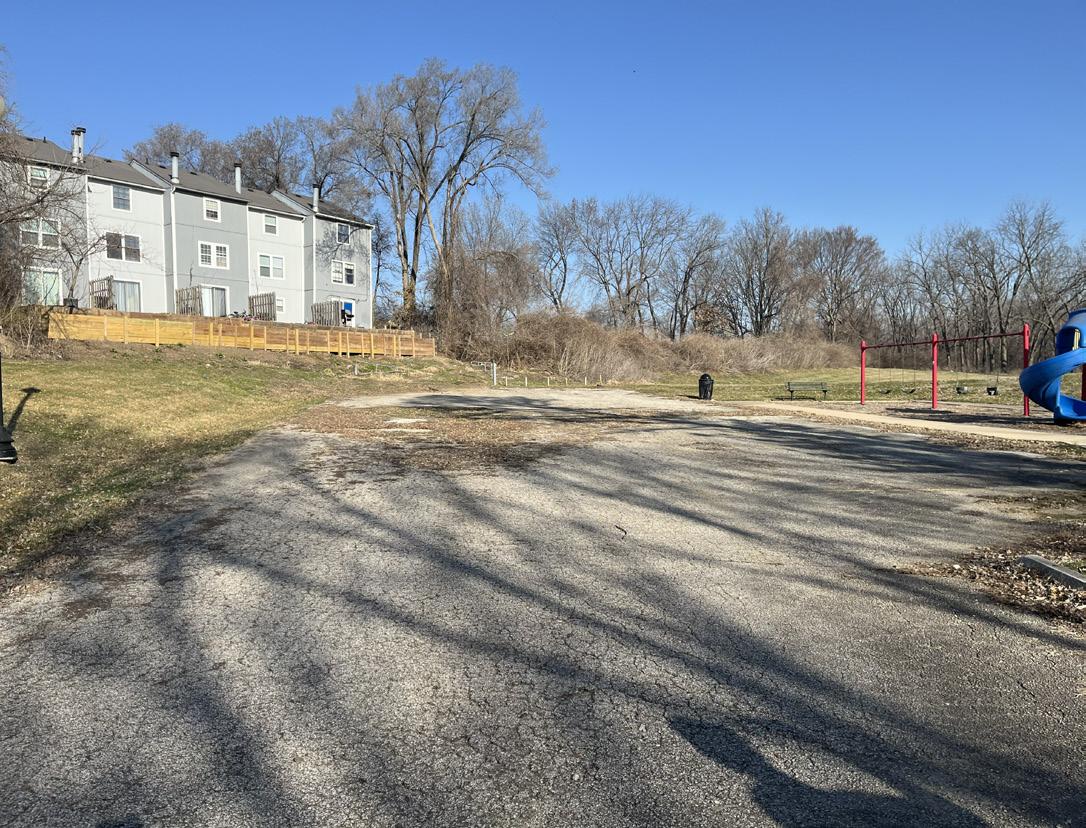
Name of Site: Cler-Mont School Park
Date Completed: March, 2025
Completed By: Avery Nichols and Bennet McCoy
19009 E. Susquehanna Ridge, Independence, MO 64056
This park is located in the northeast area of Independence, off of Susquehanna Ridge Road.
Size: 6.8 acres
Classification: Special-Use Park (School)
3. INVENTORY OF FACILITY AMENITIES AND CONDITIONS:
Basketball Court (4) (Poor Condition)
Baseball field (Poor Condition)
Shelters (Fair Condition)
Picnic Tables (Fair Condition)
Playground (Fair Condition)
Signage (Fair Condition)
4. STRENGTHS AND OPPORTUNITIES:
Walking Path (Poor Condition)
Strengths: The park has recreation amenities and serves the school and surrounding residential area.
Opportunities: This park has opportunities to update its equipment and amenities to continue to serve the surrounding area. There is an opportunity to return this area to the school district for maintenance.
Rating:
2 (Moderate Accessibility)
- The school parking lot gives access to this park with sidewalks to the courts and a loop trail around the practice fields.
Active/Passive: Passive
7. PHOTO INVENTORY:
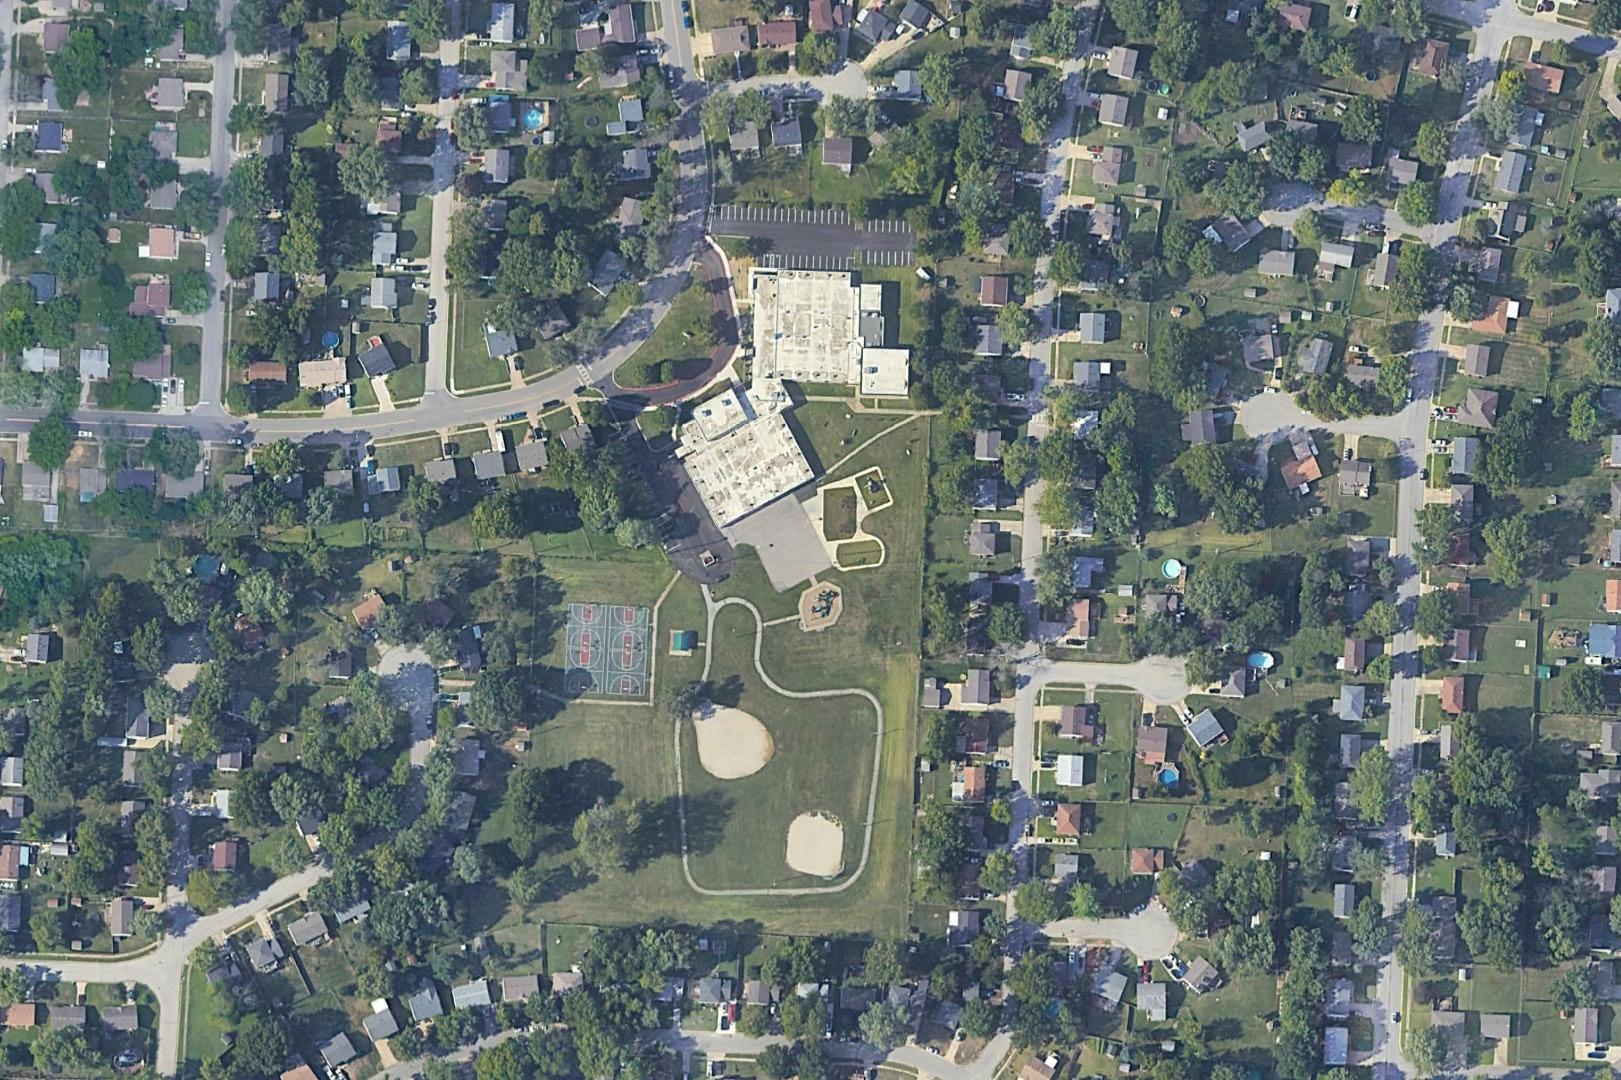
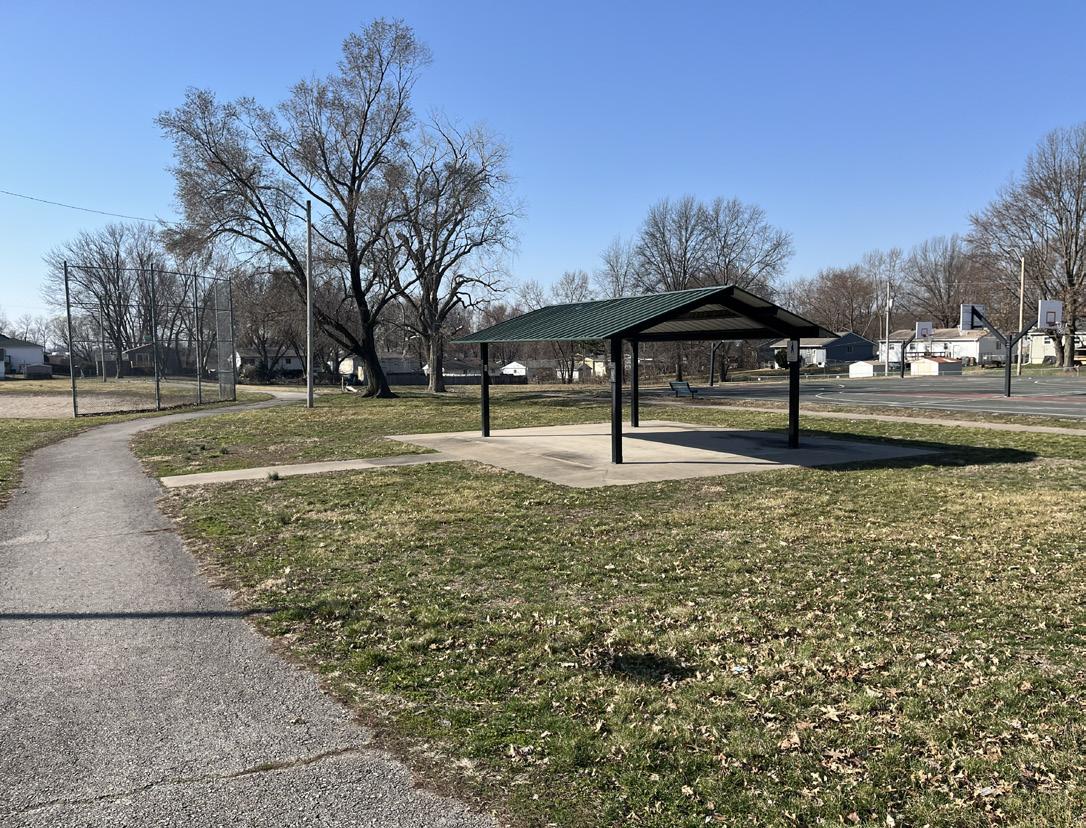
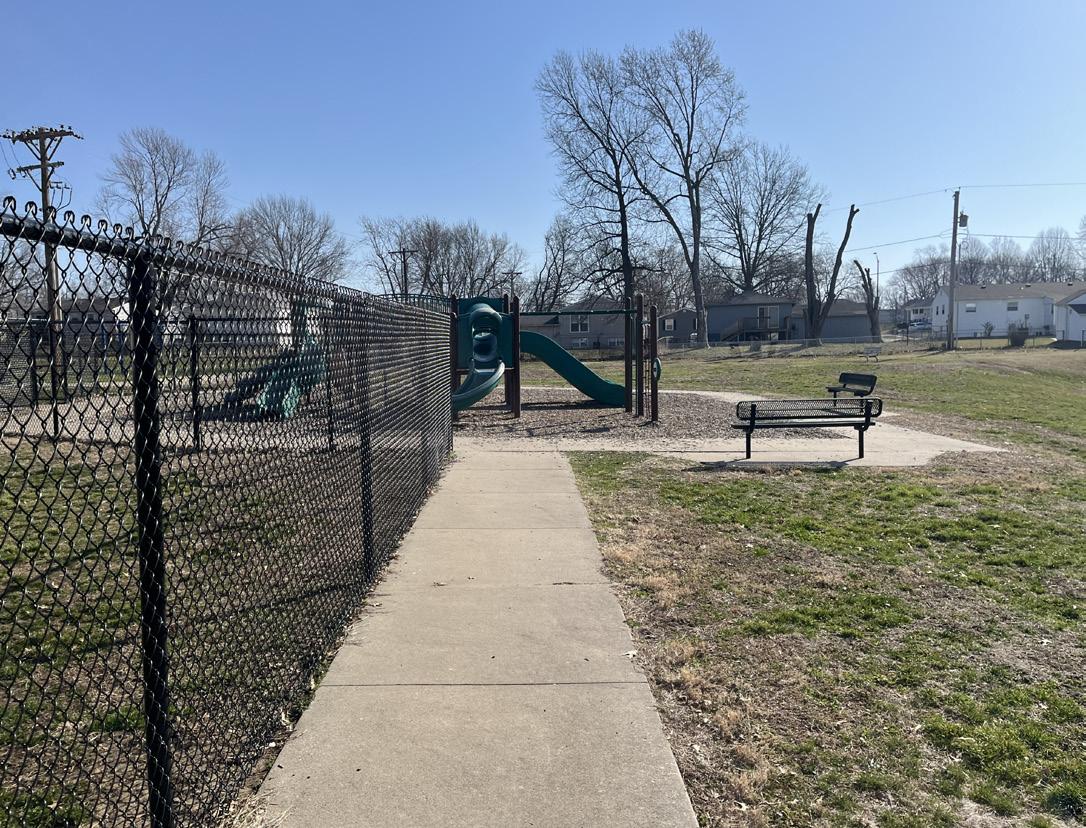
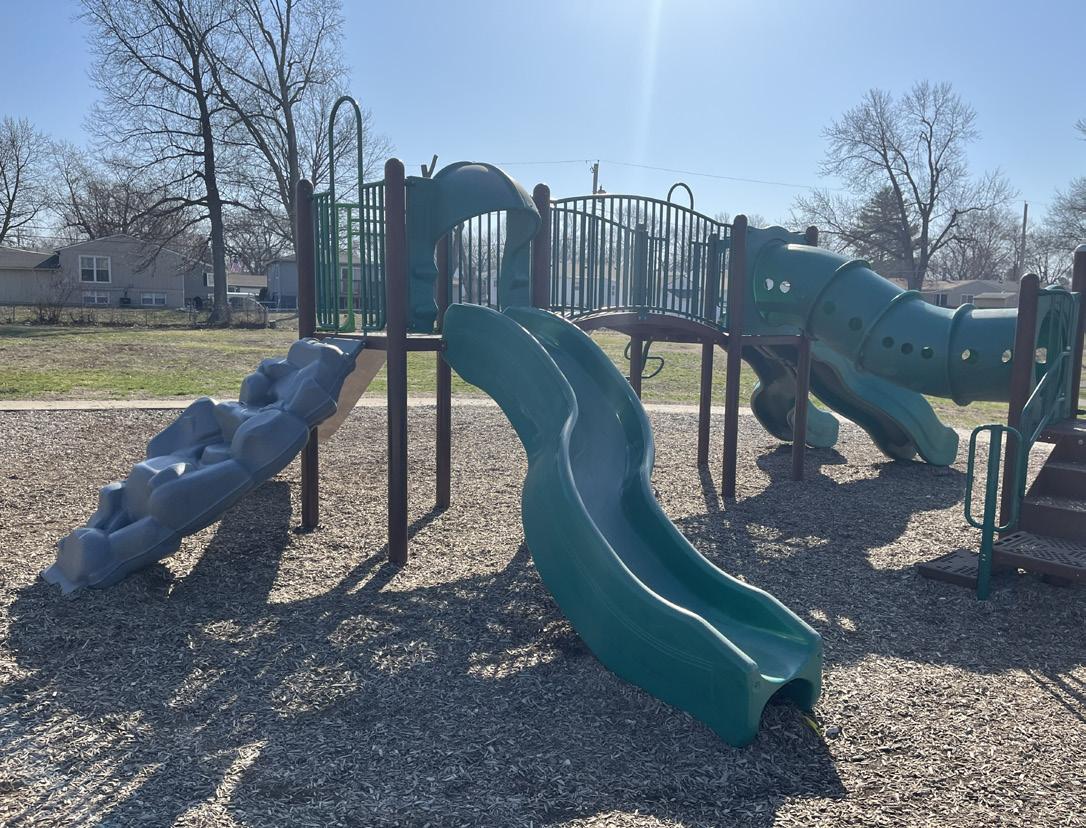
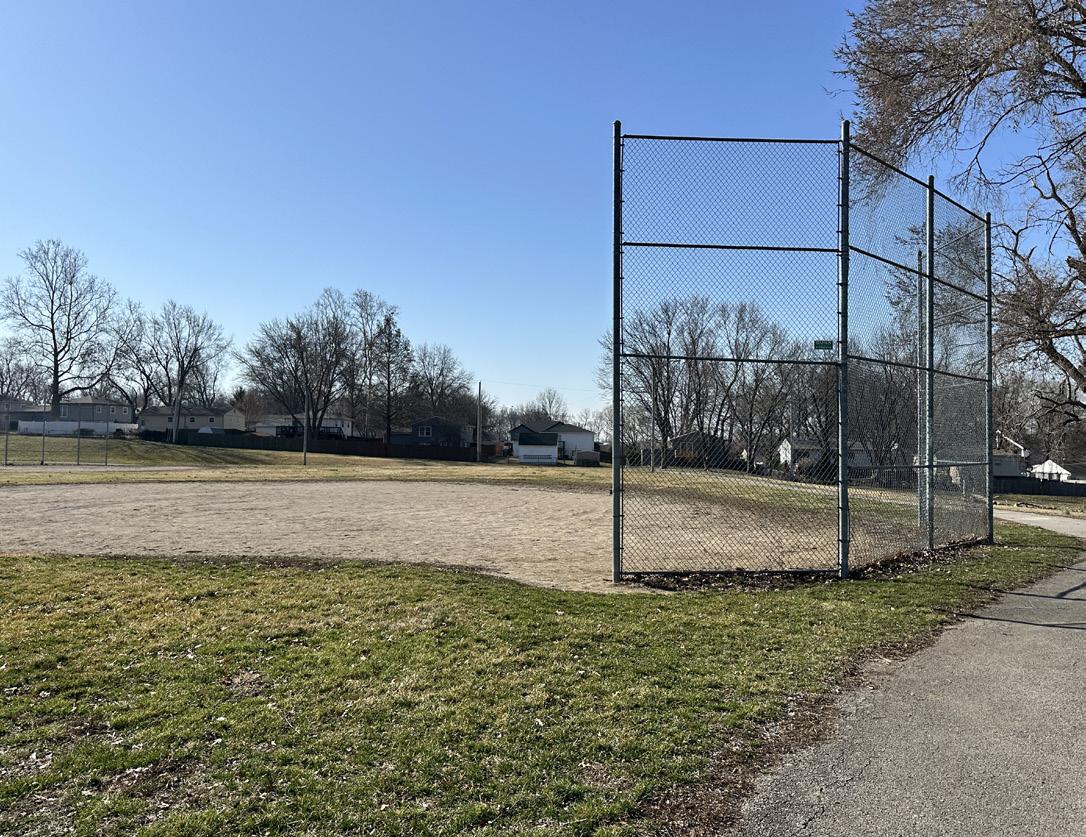
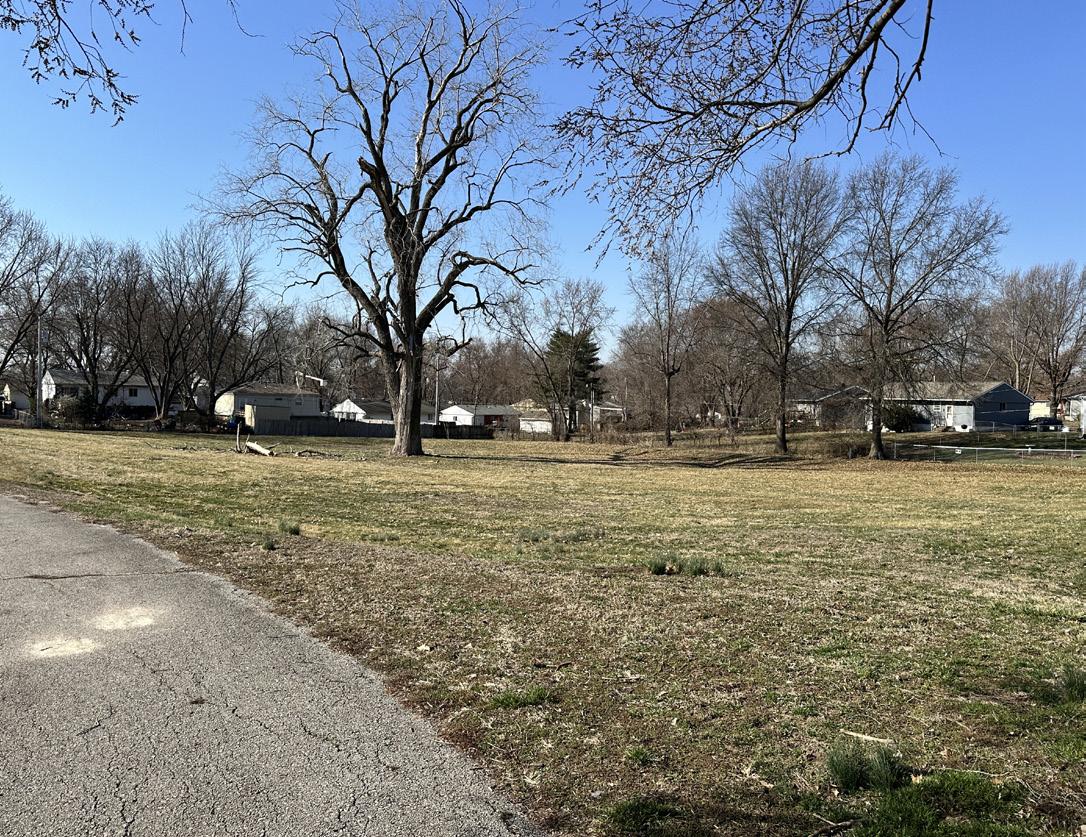
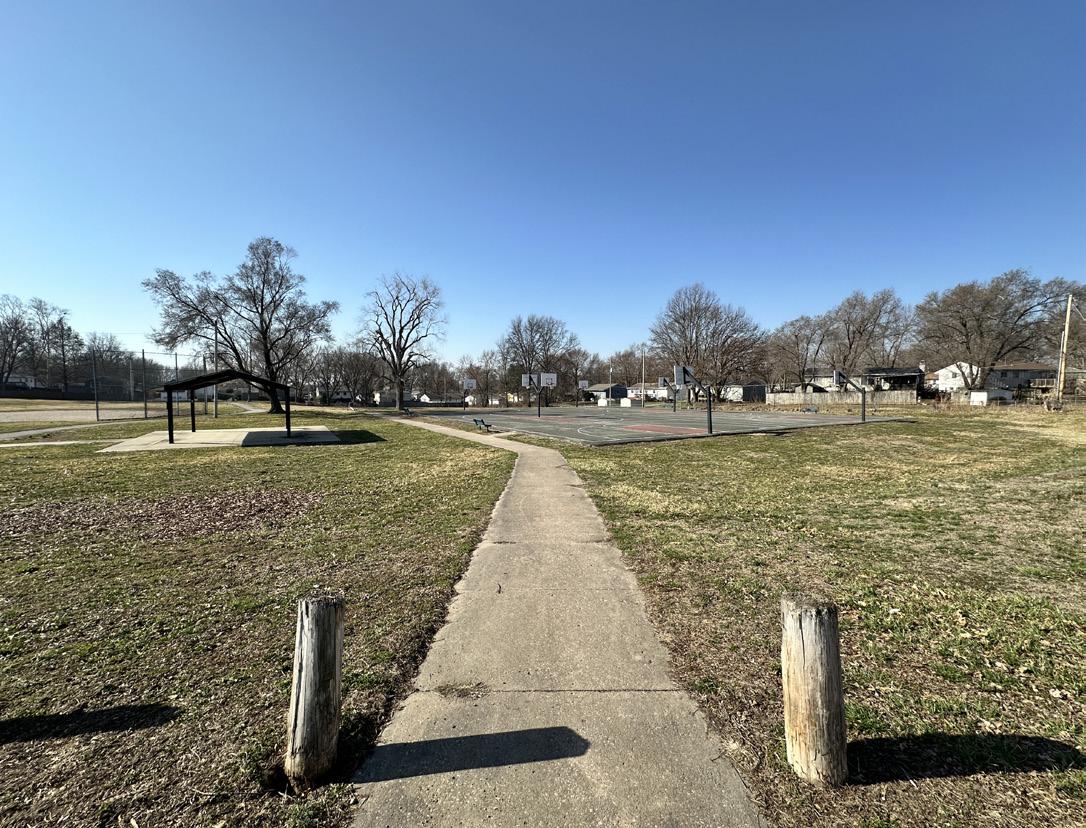
Name of Site: Clothier Park
Date Completed: March, 2025
Completed By: Avery Nichols and Bennet McCoy
17201 E Medical Center Pkwy, Independence, MO 64057
This park is located near M-78 and M-291 Highway, sitting just south of 23rd Street.
Size: 2.2 acres
Classification: Neighborhood Park
3.
Basketball Half-Court (Fair Condition)
Picnic Tables (Fair Condition)
Playgrounds (Fair Condition)
Restrooms (Porta-Potty) (Poor Condition)
Signage (Fair Condition)
Walking Path (Fair Condition)
4.
Outdoor Gym (Good Condition) Cornhole (Fair Condition)
Strengths: The park has a wide array of amenities like the outdoor gym, and is easily accessible by car and easy to park parallel on the street.
Opportunities: Improvement of trail quality/conditions could be considered, and connections to dedicated seating areas.
Rating:
1 (High Accessibility)
- There is a parking lot with ramp access into the site from sidewalks. It has loop trail that connects the park amenities.
Active/Passive: Passive
7. PHOTO INVENTORY:
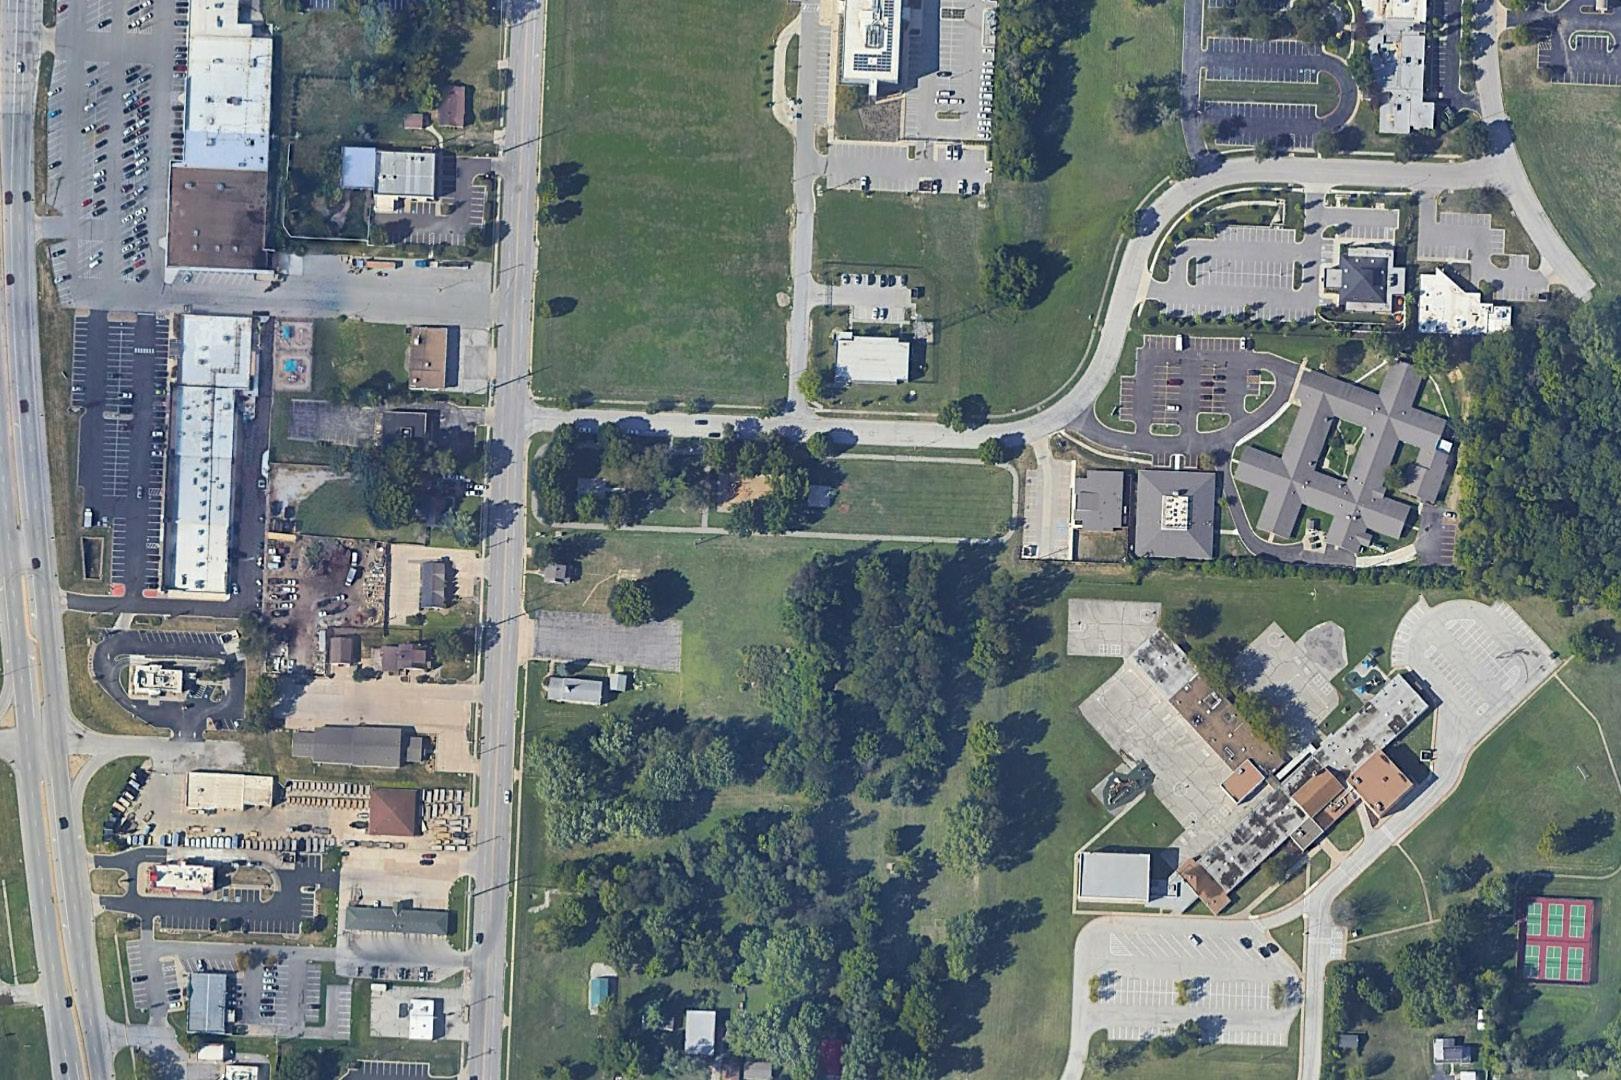
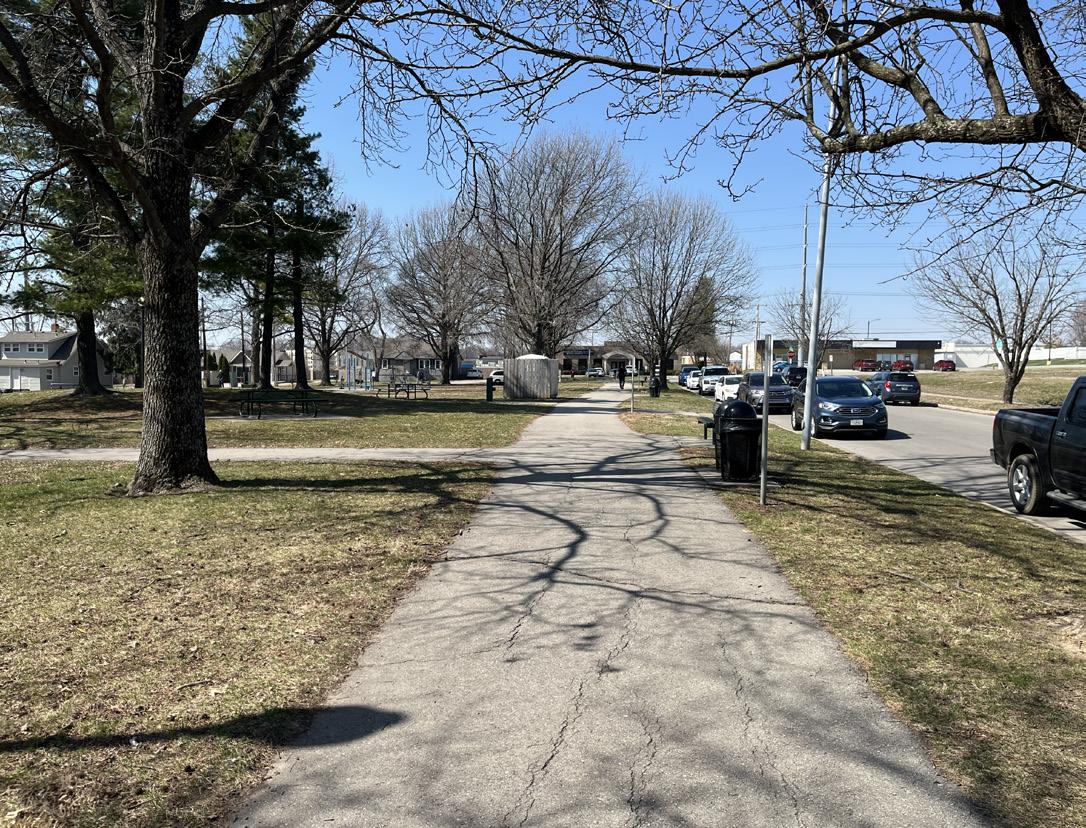
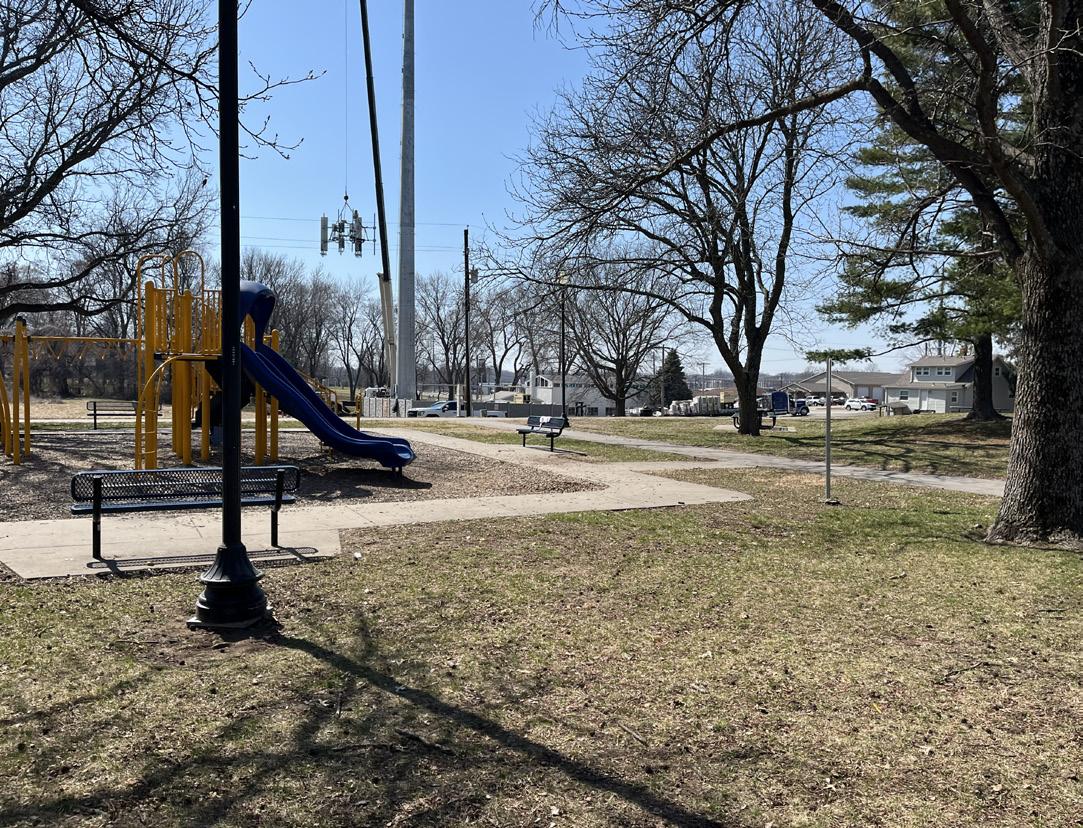
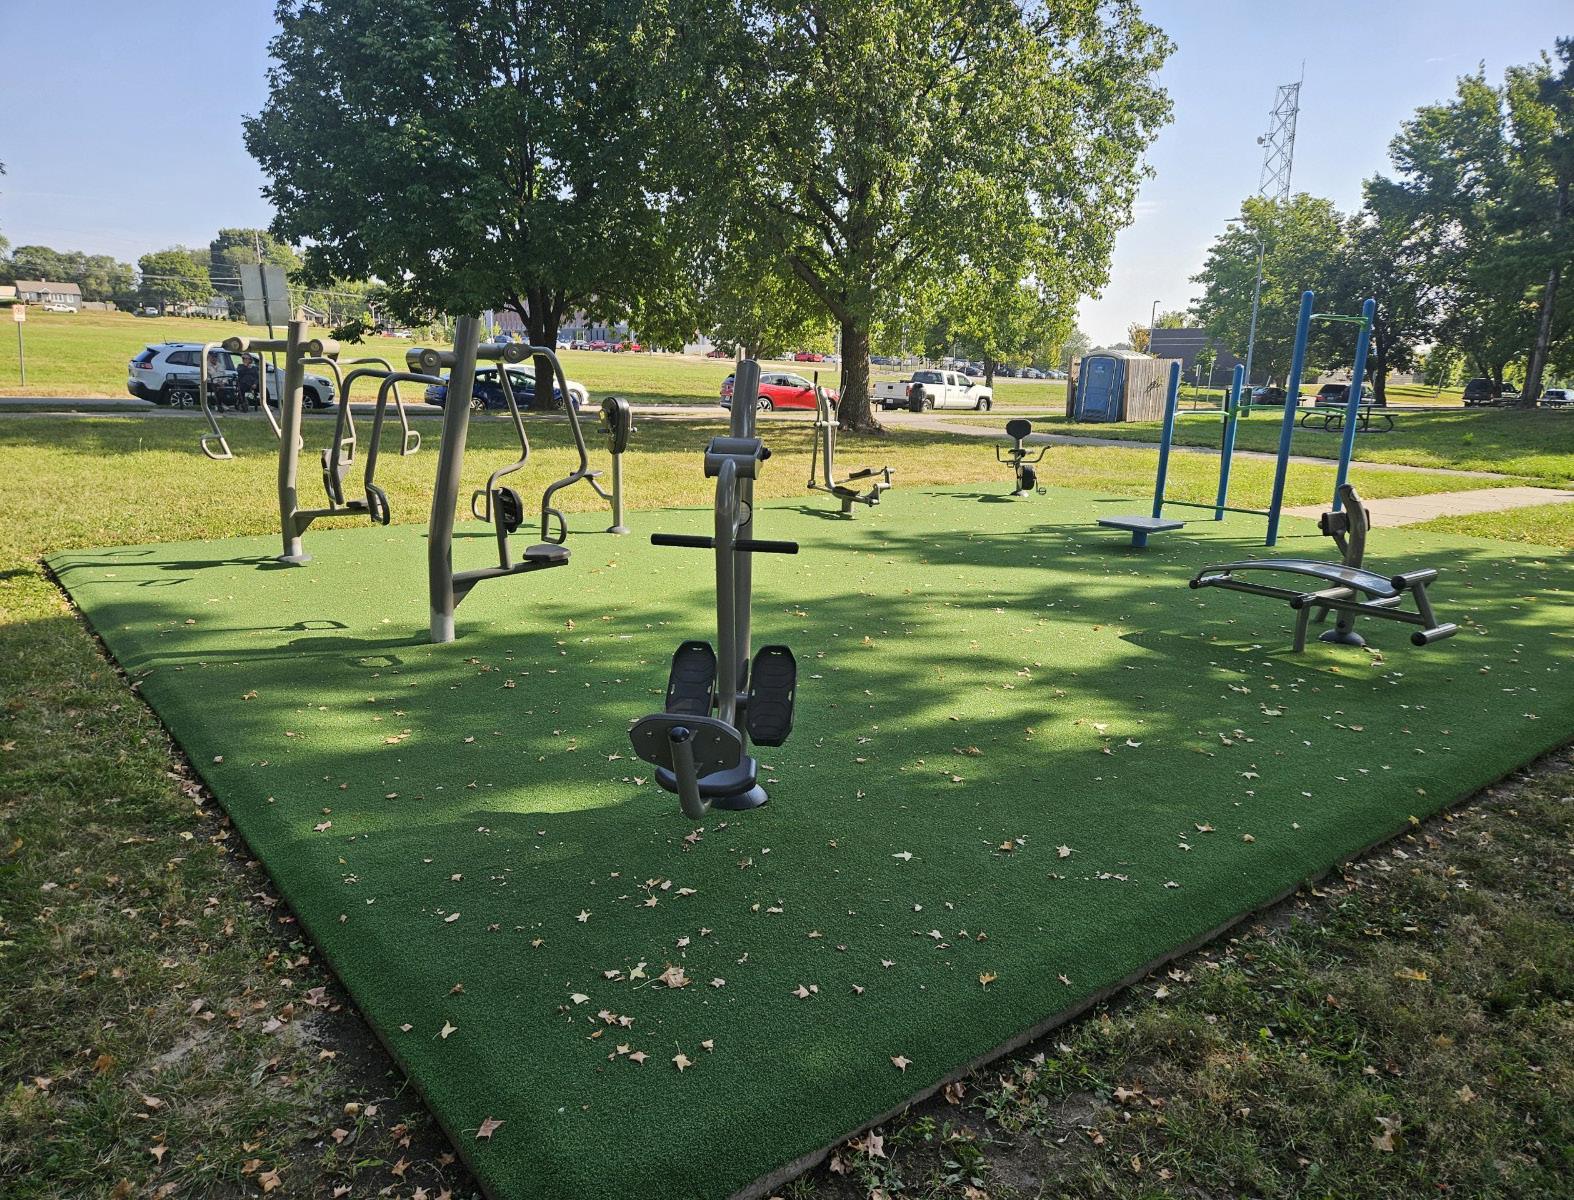
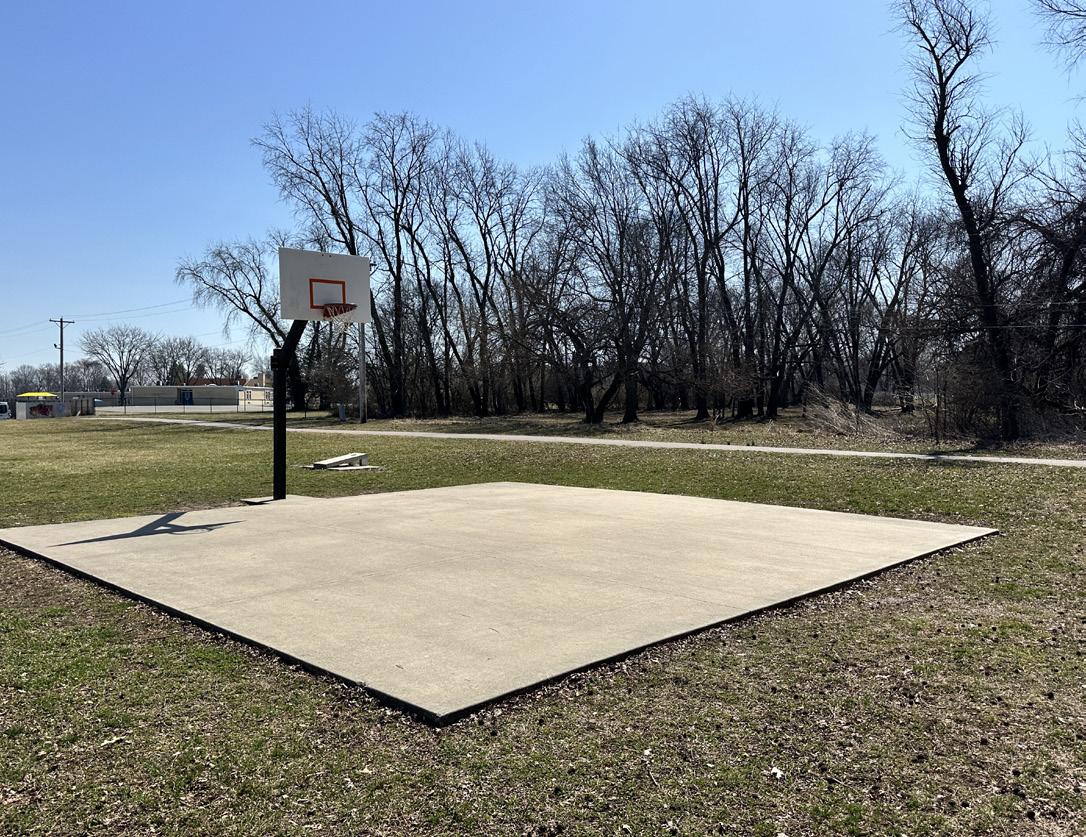
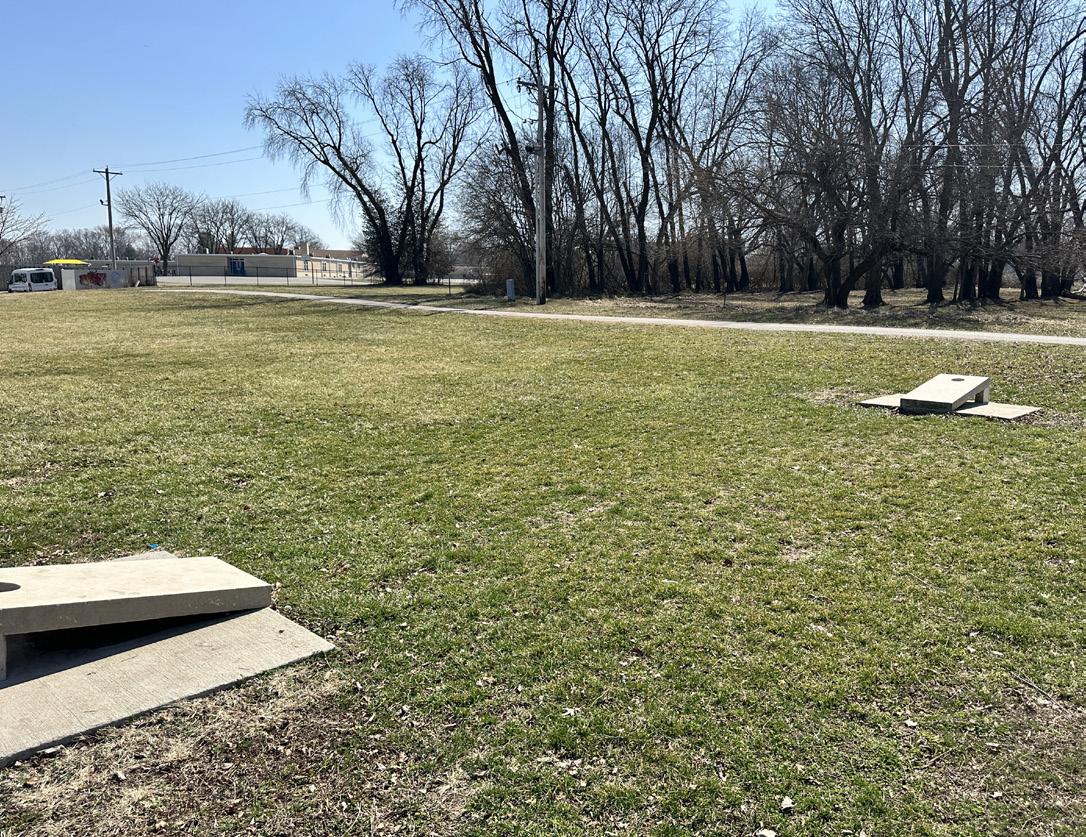
Name of Site: Country Club Park
Date Completed: March, 2025
Completed By: Avery Nichols and Bennet McCoy
2930 S. Norton Ave, Independence, MO 64052
This park is situated is the middle of a residential area with a parking lot and entrance off of Norton Avenue, and a walking path connecting to Rotary Park.
Size: 6.5 acres
Classification: Neighborhood Park
3. INVENTORY OF FACILITY AMENITIES AND CONDITIONS:
Playground (Fair Condition)
Signage (Fair Condition)
Walking Path (Poor Condition)
4. STRENGTHS AND OPPORTUNITIES:
Strengths: The park has a lot of healthy vegetation and a welcoming entry bridge.
Opportunities: There is an opportunity to refurbish the loop trail and make better access to the playground space.
Rating:
2 (Moderate Accessibility)
- There is a parking lot with bridge access into the site with a loop trail. The park is lacking a sidewalk from the loop trail to the playground sidewalk.
6. GENERAL NOTES:
Active/Passive: Passive
7. PHOTO INVENTORY:
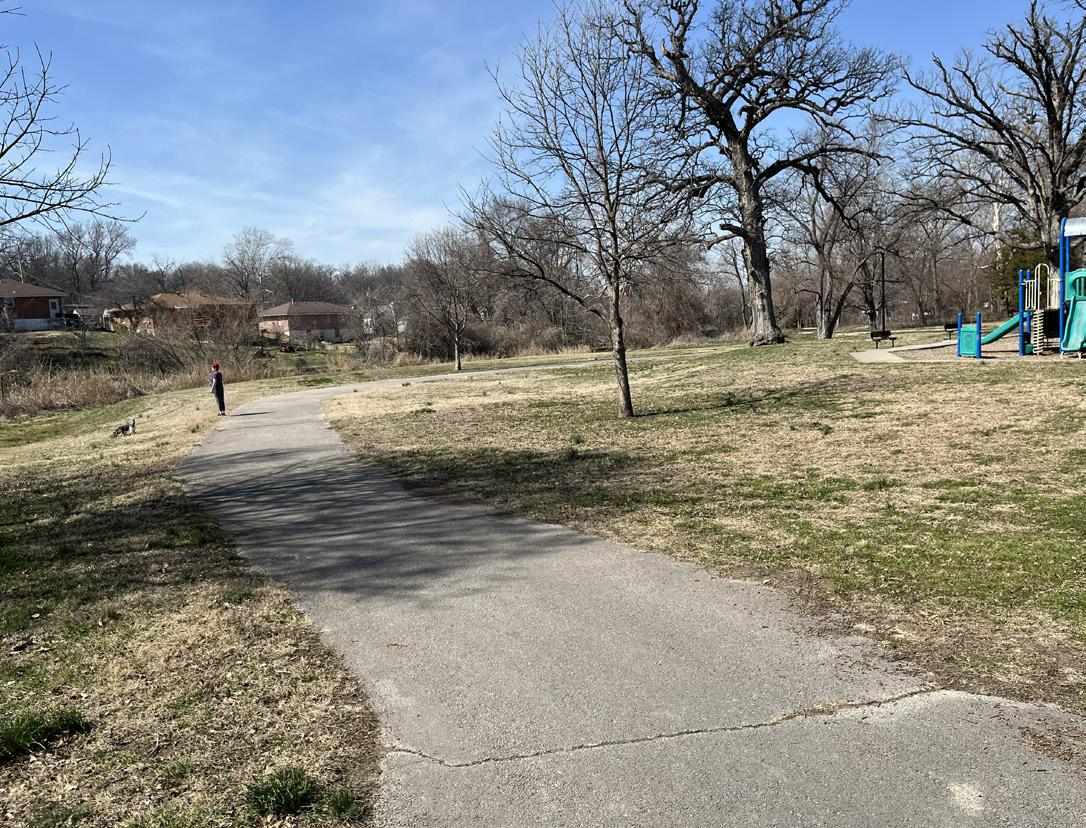
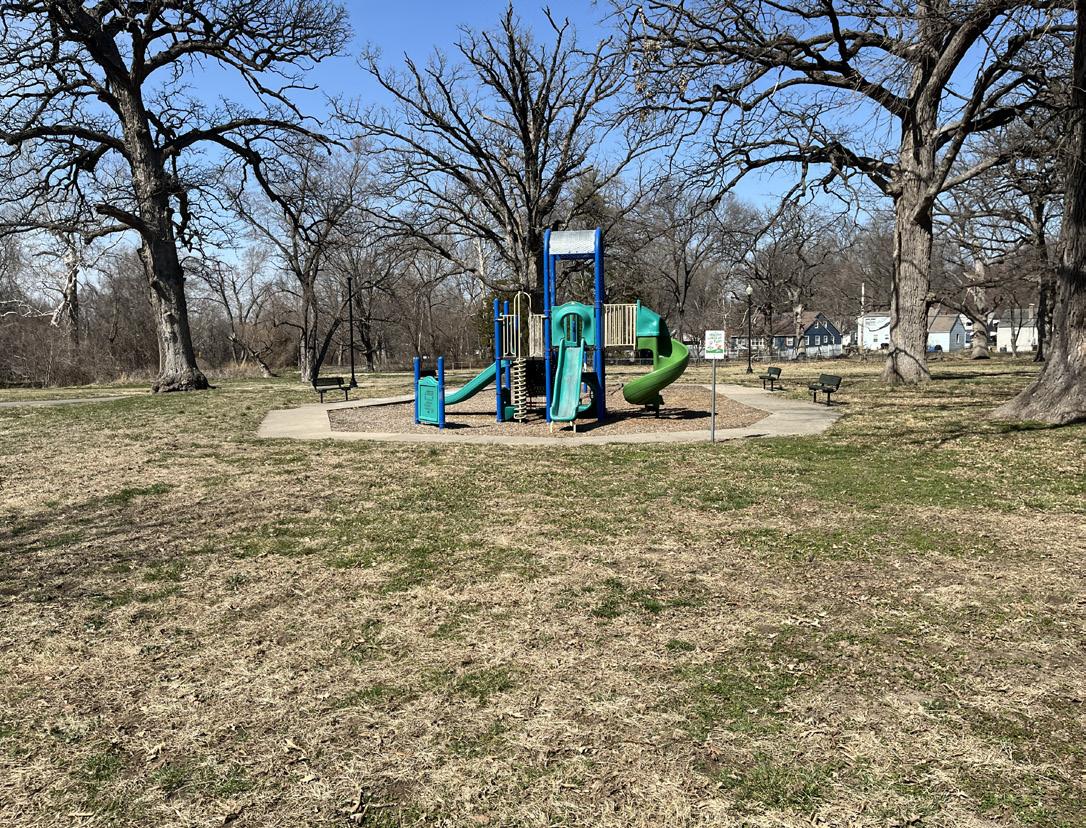
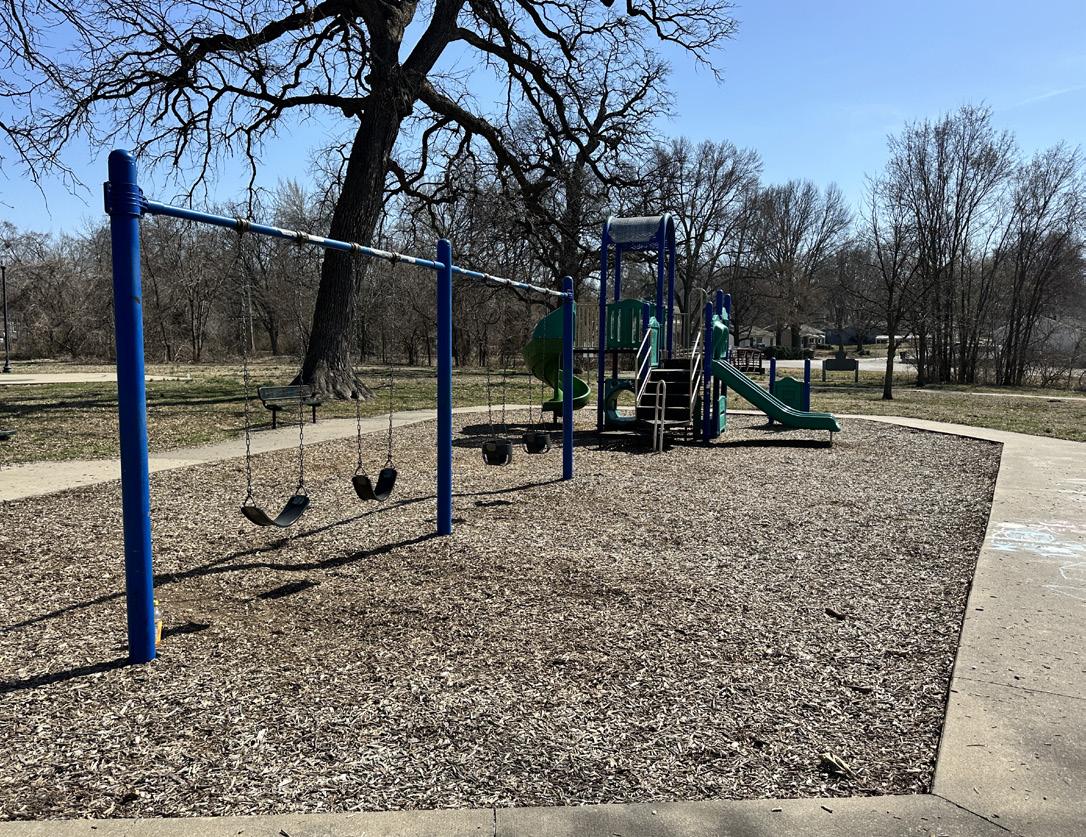
Name of Site: Crackerneck Park
Date Completed: March, 2025
Completed
By: Avery Nichols and Bennet McCoy
16820 E. Crackerneck Rd, Independence, MO 64055
This park is located in the southern area of Independence and abuts a railroad line.
Size: 6.9 acres
Classification: Neighborhood Park
BBQ Grills (Fair Condition)
Picnic Shelters (Fair Condition)
Picnic Tables (Fair Condition)
Playgrounds (Fair Condition)
Restrooms (Poor Condition)
Signage (Poor Condition)
Walking Path (Poor Condition)
Strengths: The park is easy to access via car and has fair picnic amenities.
Opportunities: There is a need to expand the trail throughout the lawn and wooded space as well as improve signage. In addition, the parking lot could be refurbished with new asphalt and parking strips.
Rating:
2 (Moderate Accessibility)
- There is a parking lot with direct access with ramps to the shelter, playground, and restroom facility.
Active/Passive: Passive
7. PHOTO INVENTORY:
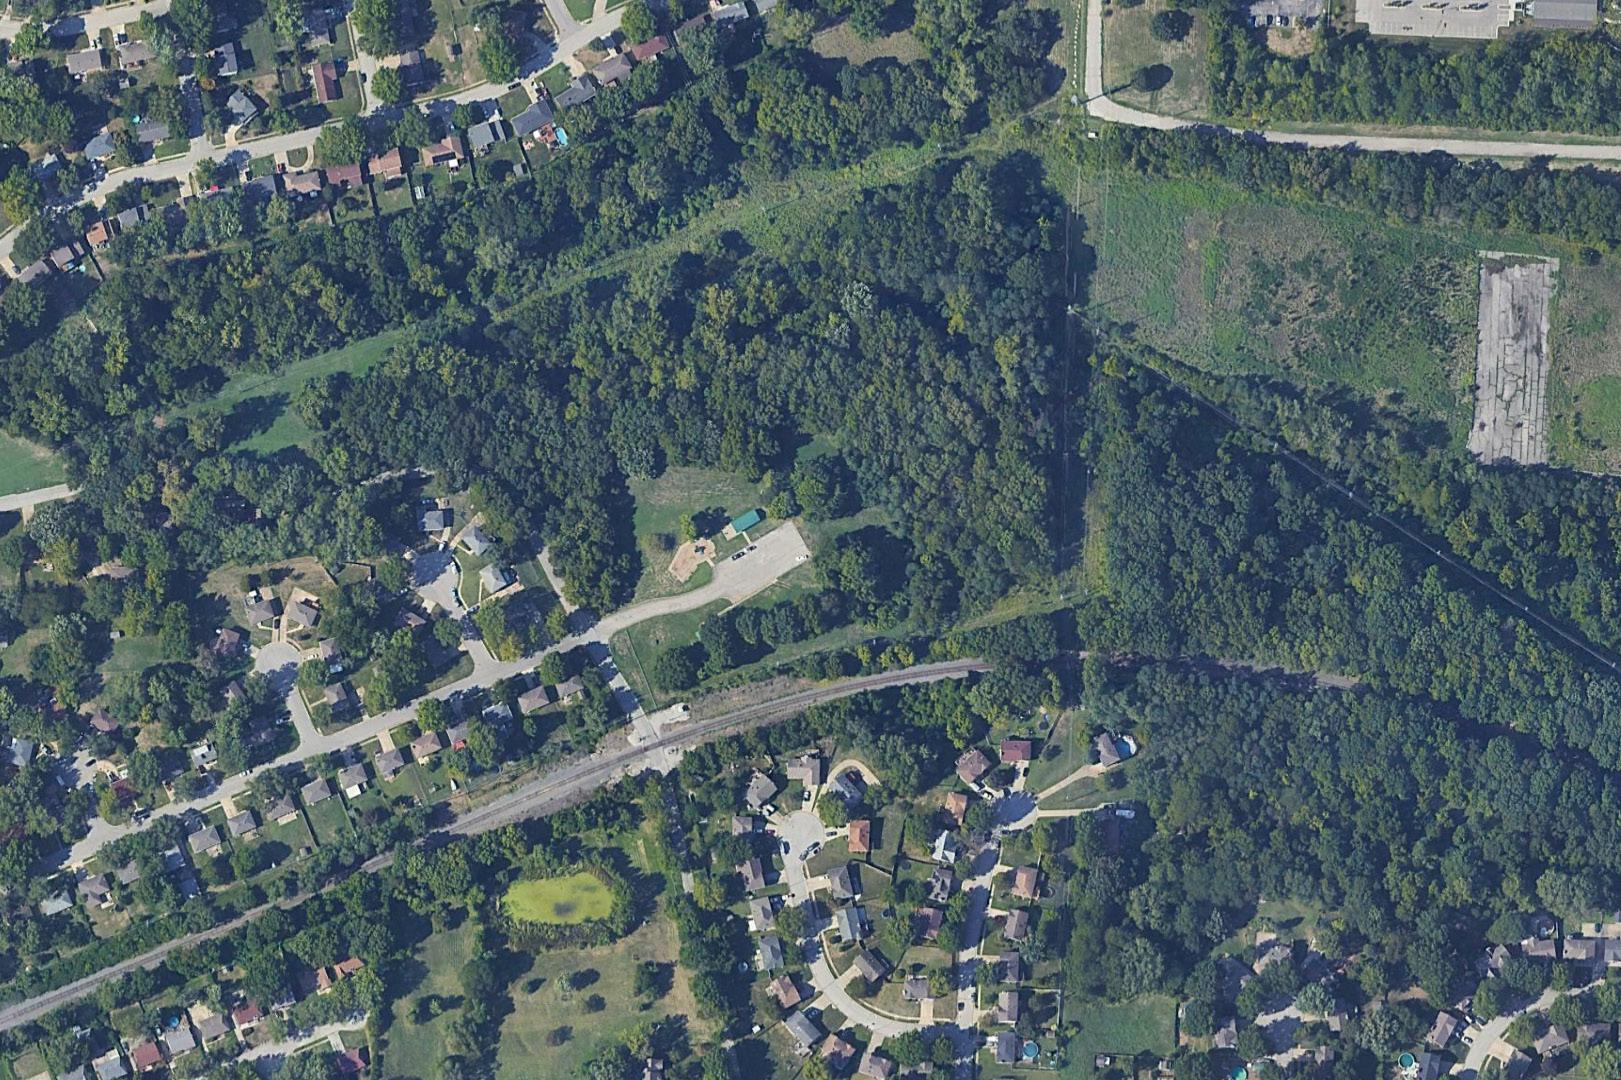
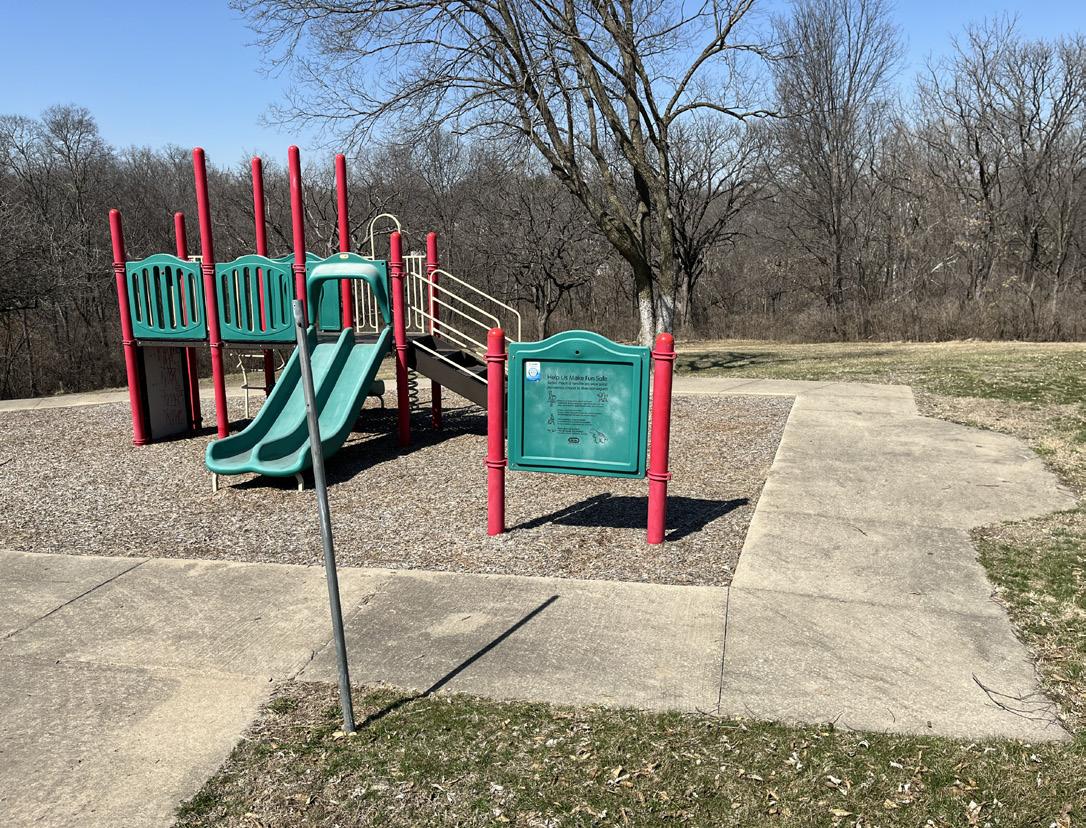
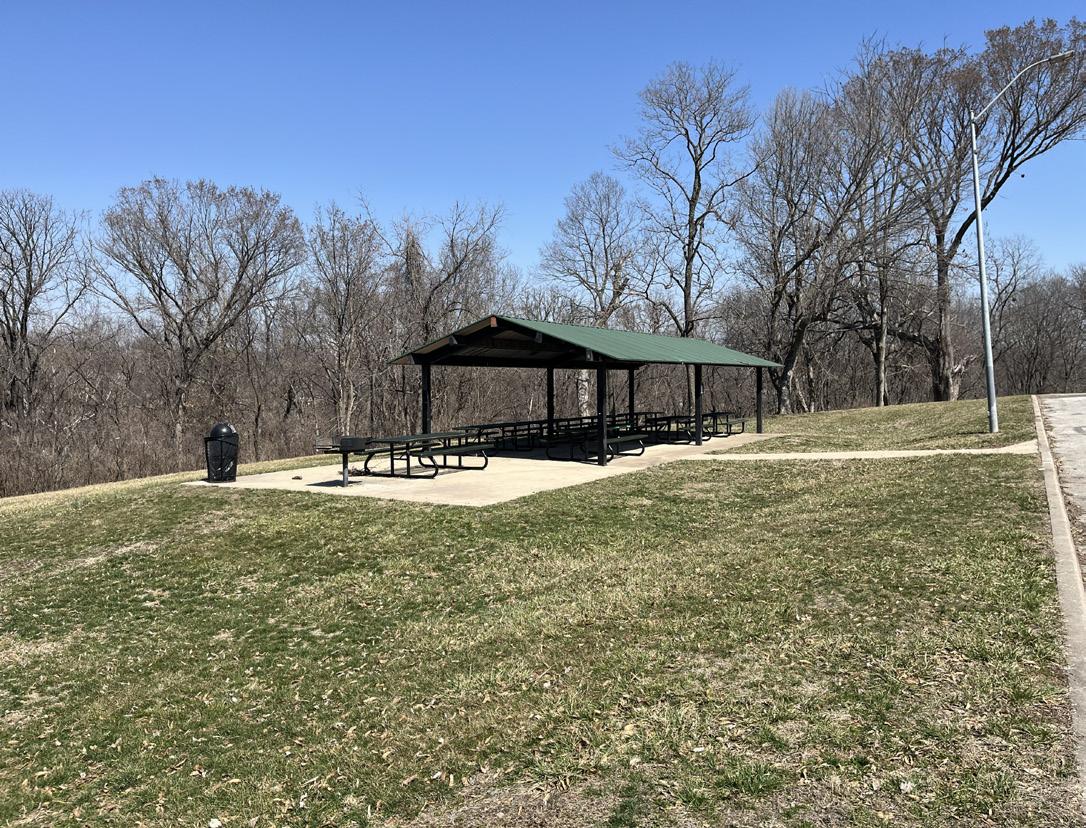
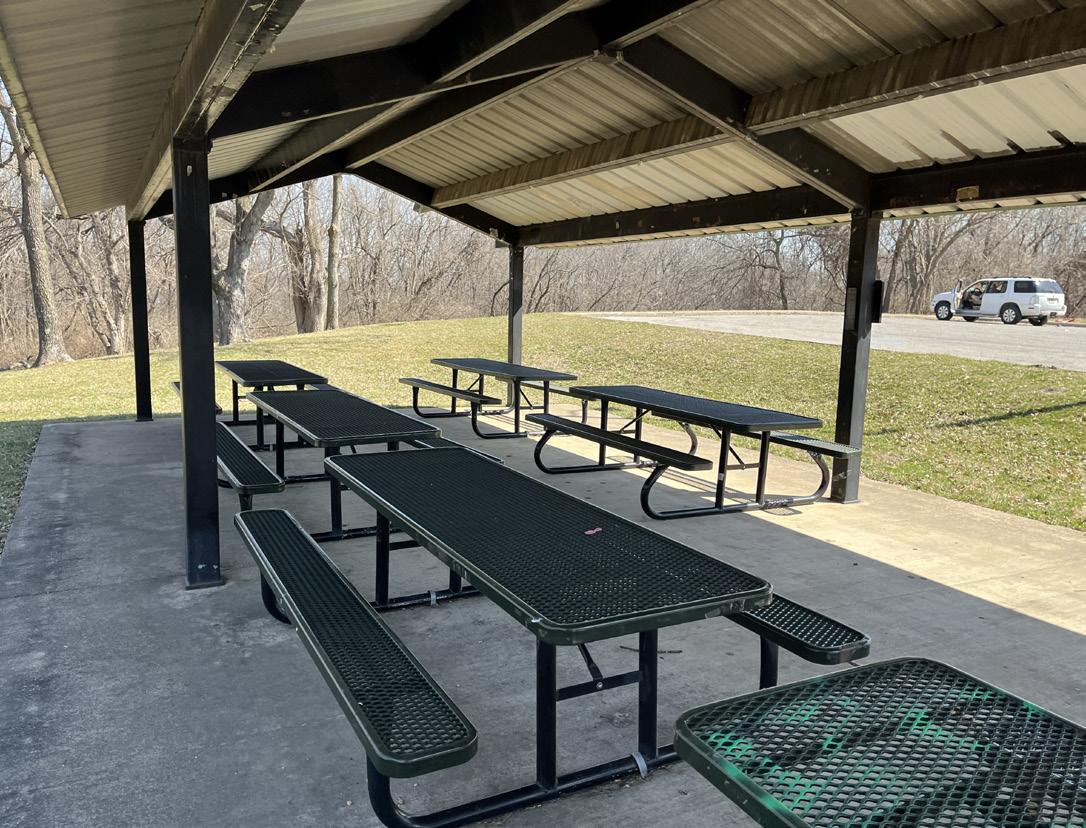
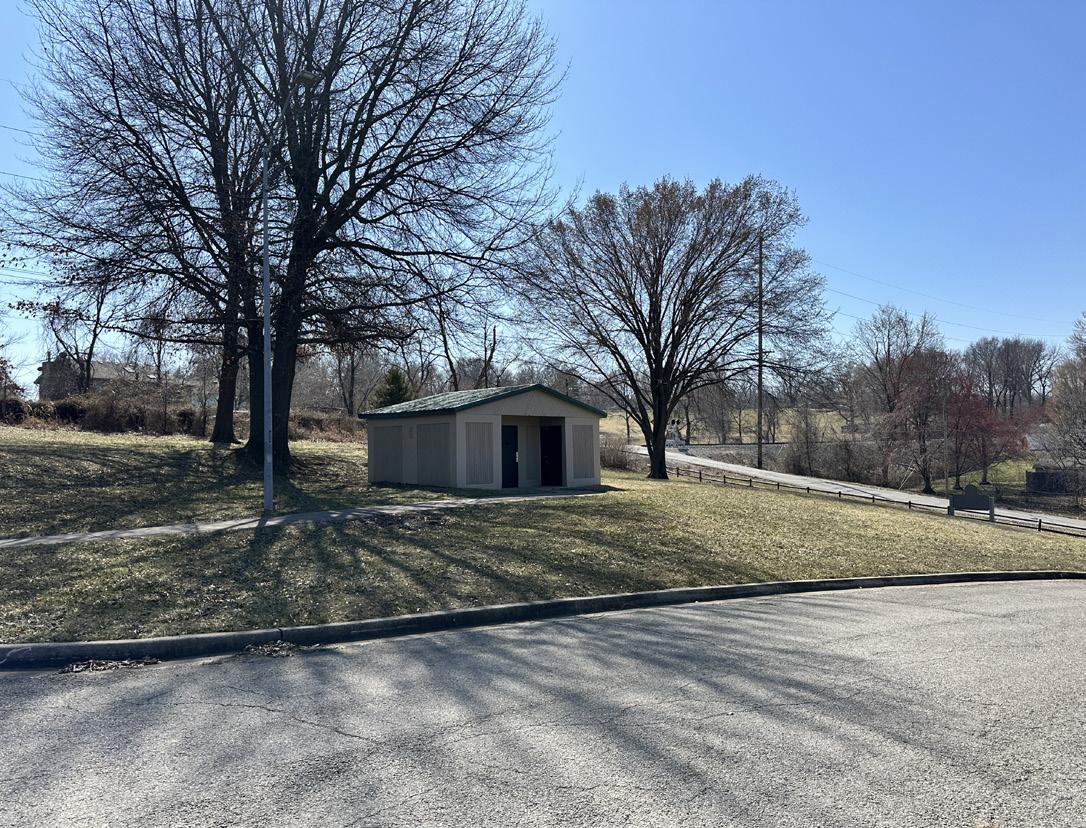
Excess lawn space.
Name of Site: Curtis Greenspace
Date Completed: March, 2025
Completed By: Avery Nichols and Bennet McCoy
700 E. Lexington Ave, Independence, MO 64050
Curtis Greenspace is located just south of Truman Road and runs along the railroad line.
Size: 1.7 acres
Classification: Neighborhood Park (Greenspace)
3. INVENTORY OF FACILITY AMENITIES AND CONDITIONS:
Signage (Fair Condition)
4.
Strengths: The park is a small lawn space with adjacency to neighborhoods.
Opportunities: There is opportunity to improve accessibility from the street. In addition, an opportunity exists for on-street parking options.
Rating:
5 (low Accessibility)
- The site has no dedicated parking, other than on-street parking. There is no park access or circulation within the site and the heavy slopes makes accessibility difficult.
6. GENERAL NOTES:
Active/Passive: Passive
7. PHOTO INVENTORY:
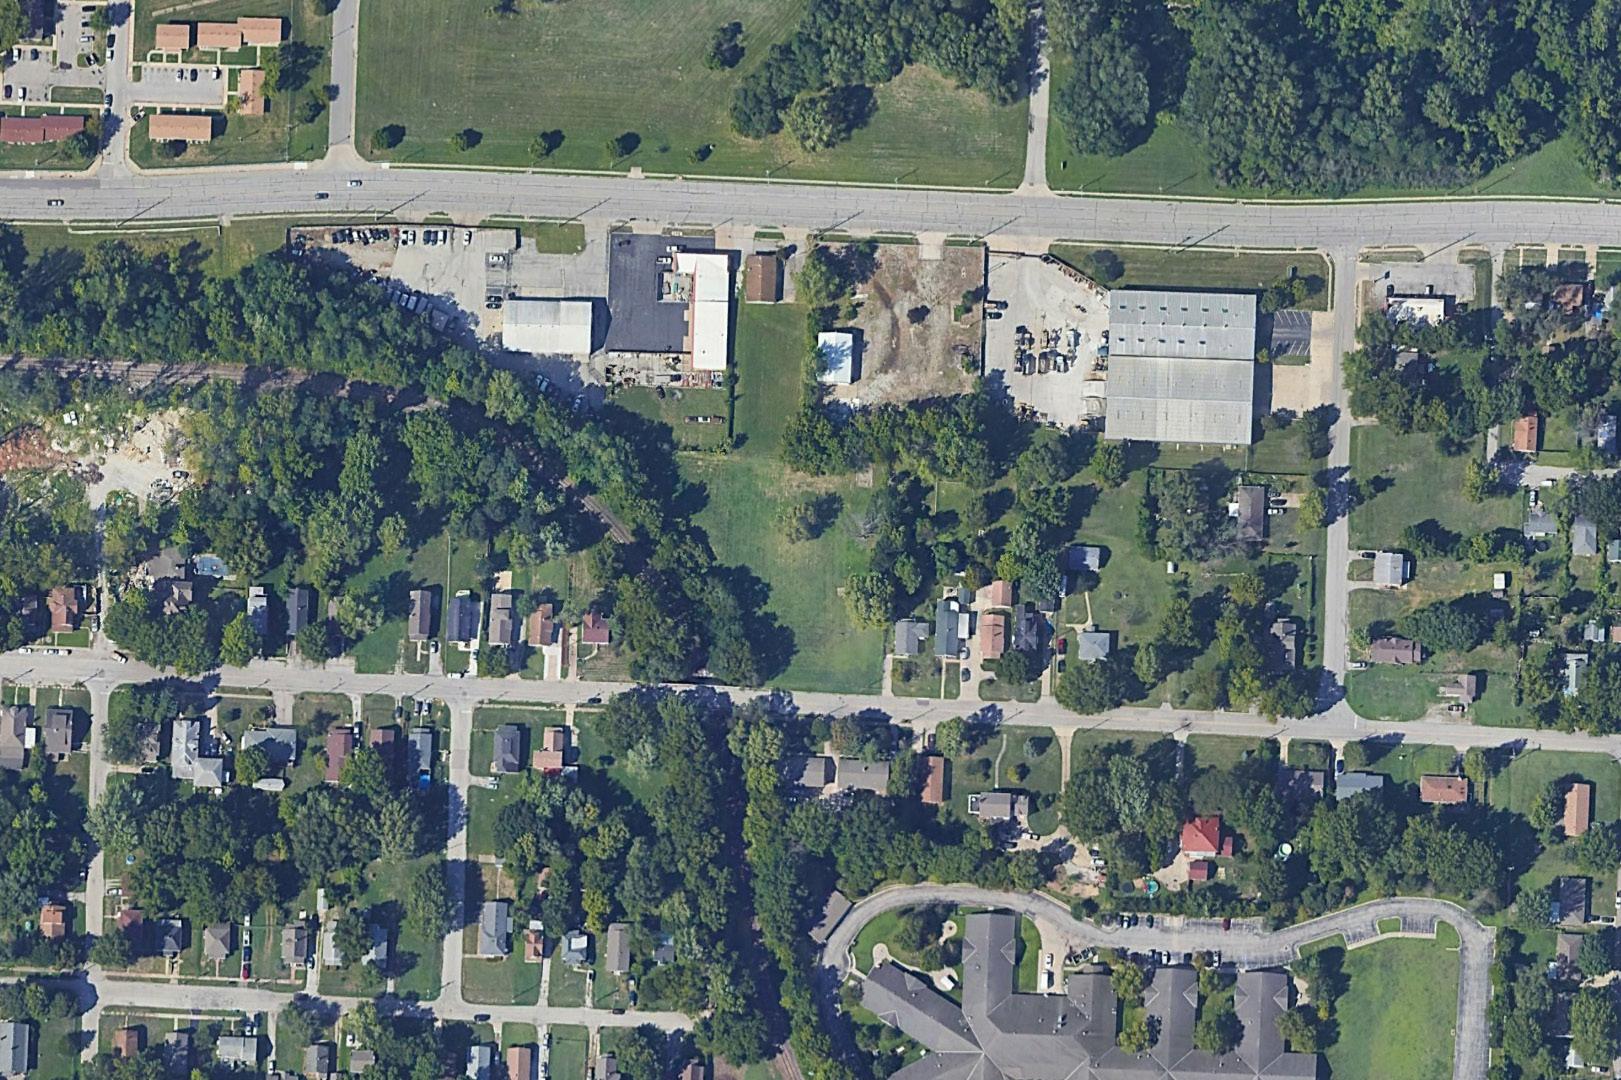
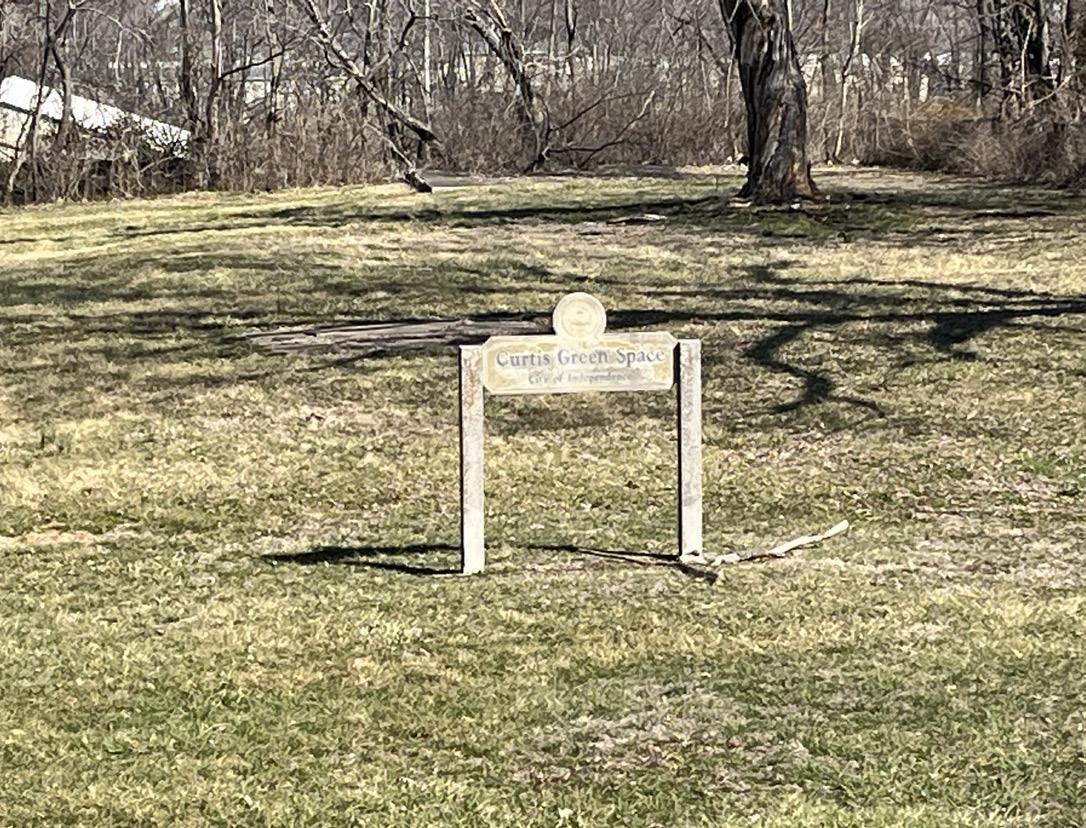
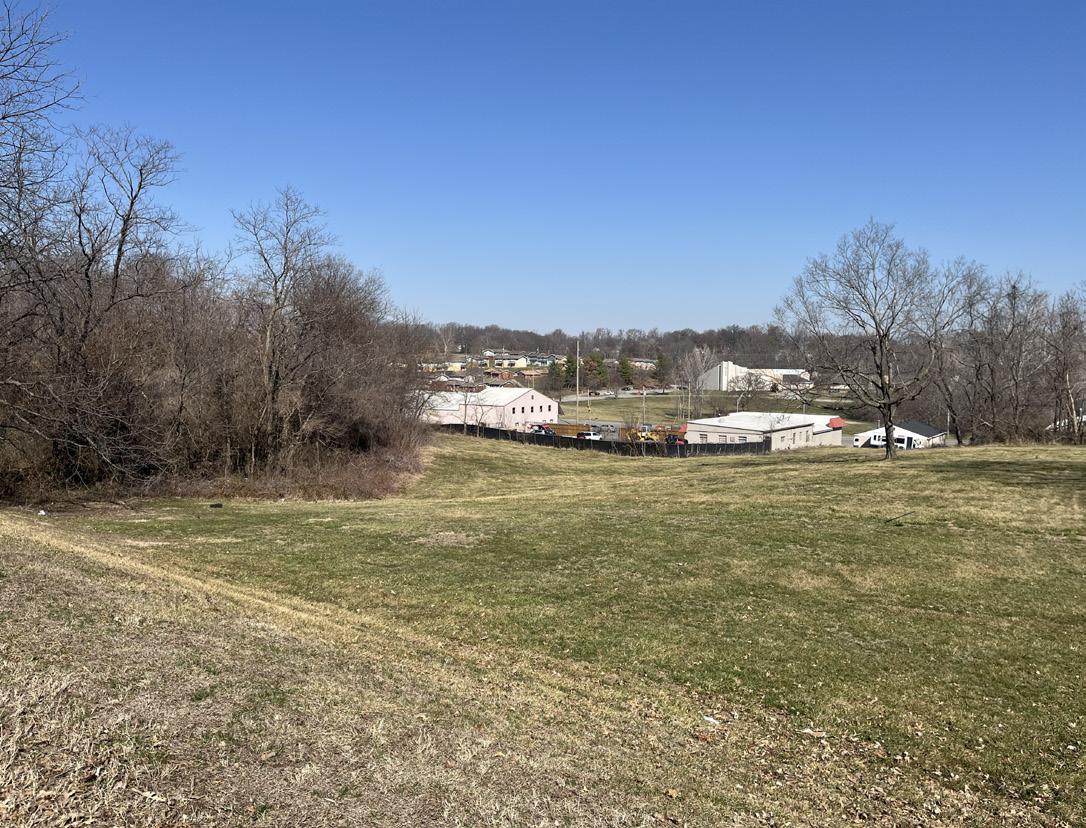
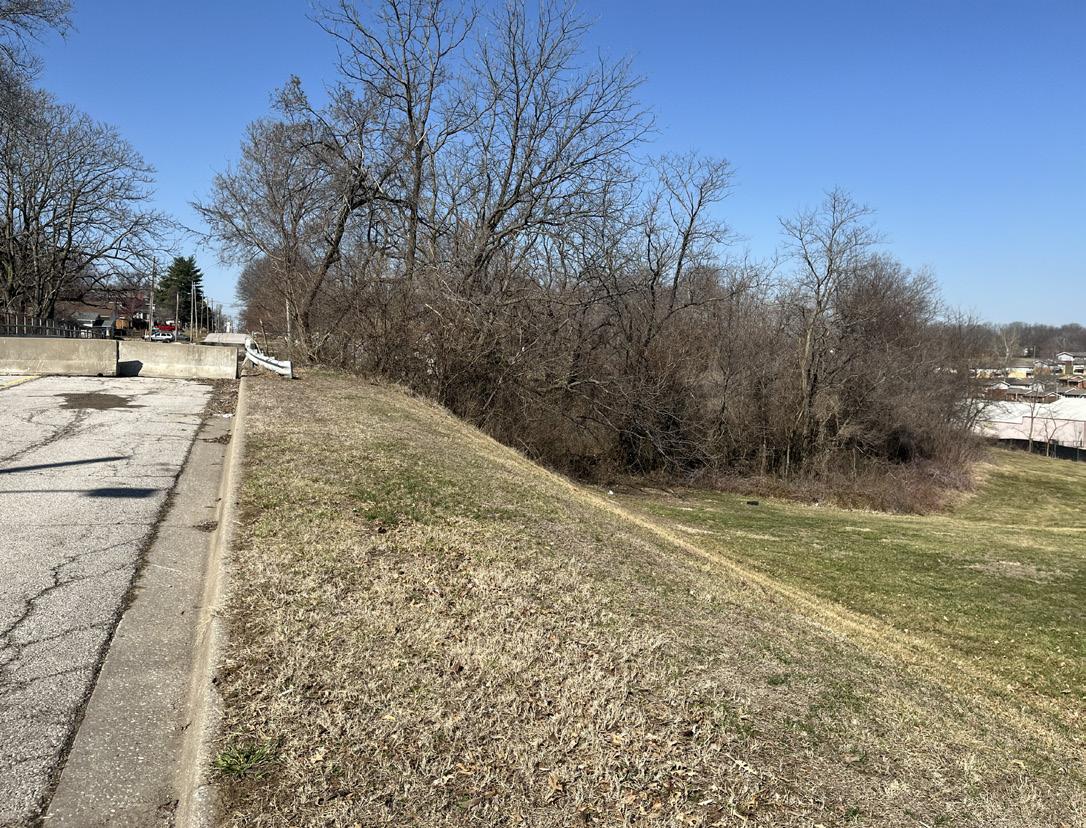
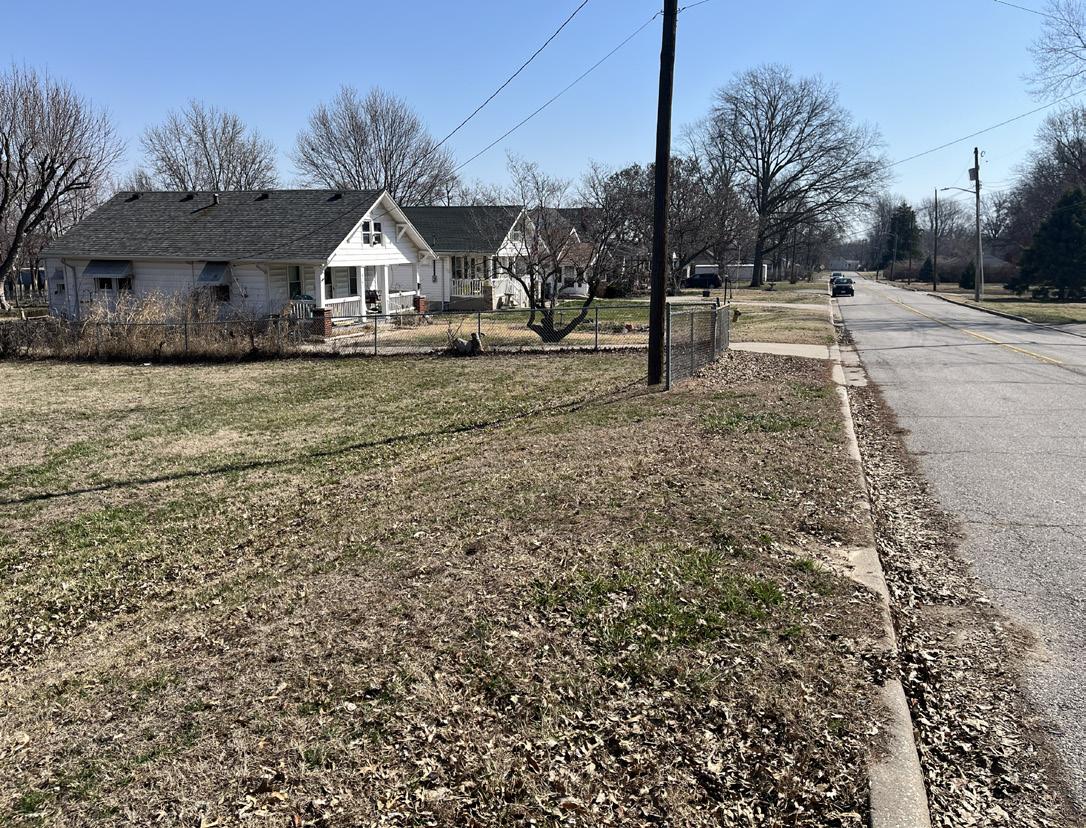
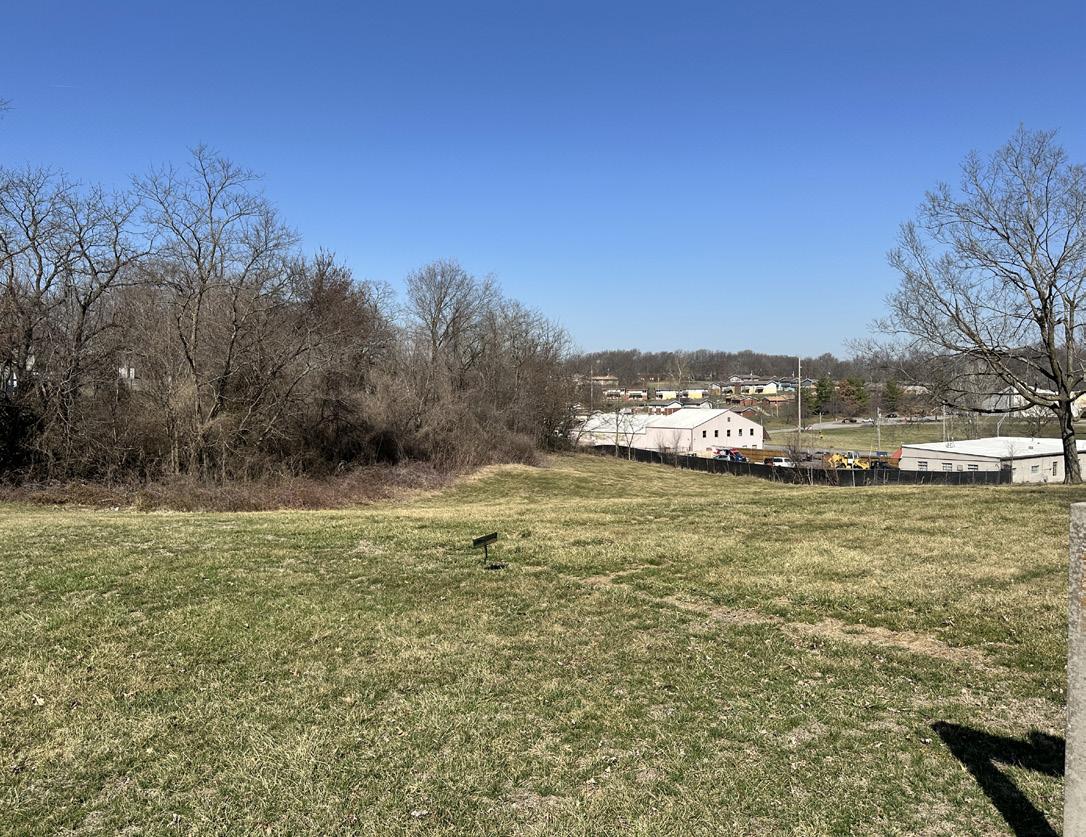
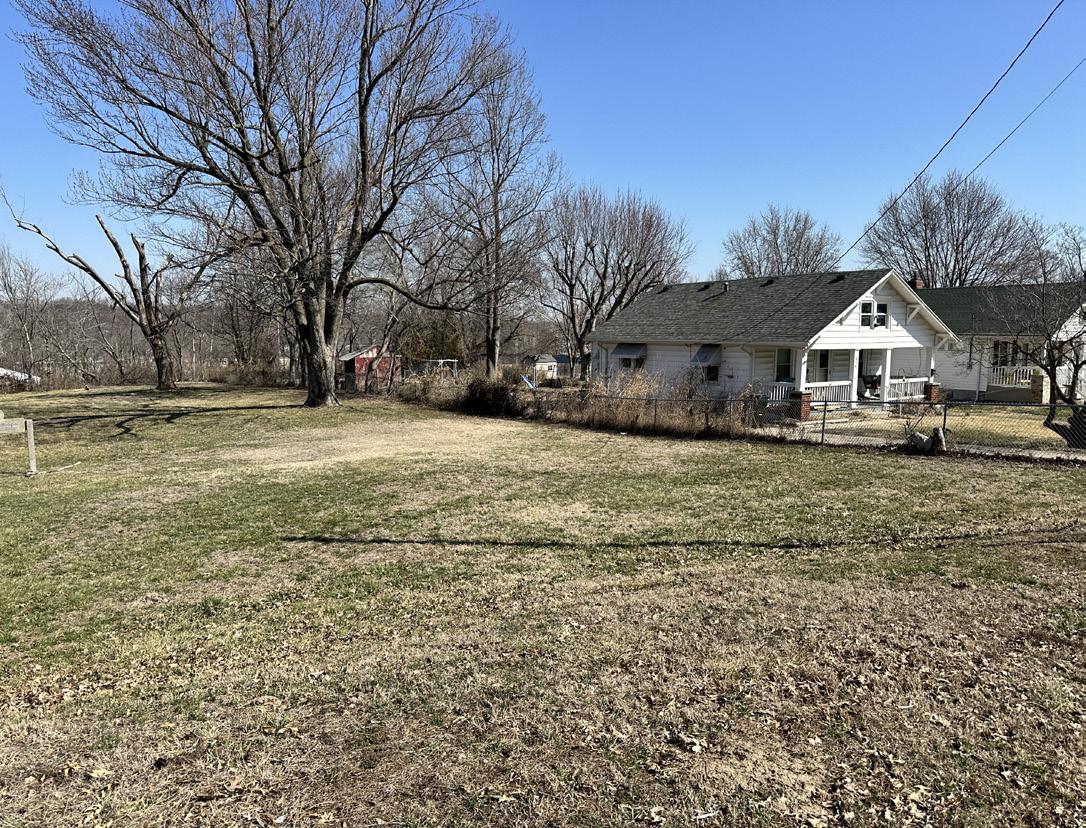
Adjacency to neighborhood.
Name of Site: Davis Park
Date Completed: March, 2025
Completed By: Avery Nichols and Bennet McCoy
221 N Arlington Ave, Independence, MO 64053
The site located at the northwest corner of Independence city limits. It is adjacent to Fairmount Park and bounded by Norledge Ave. and E Scarritt Ave.
Size: 5.9 acres
Classification: Neighborhood Park
Basketball half-court (Poor Condition)
Baseball fields (2) (Poor Condition)
Signage (Poor Condition)
Walking path (Fair Condition)
4.
Strengths: Davis Park is easily accessible with a two-way drive and parking lot with a walking trail.
Opportunities: There is an opportunity to refurbish the parking lot and improve walking trail connections. Additionally, the basketball court is located in the parking lot so relocating or denoting the space with parking stripes would be an improvement.
Rating: 2 (Moderate Accessibility)
- There is a parking lot bisecting two practice fields and a trail that connects the park amenities to other park trails.
Active/Passive: Passive
7. PHOTO INVENTORY:
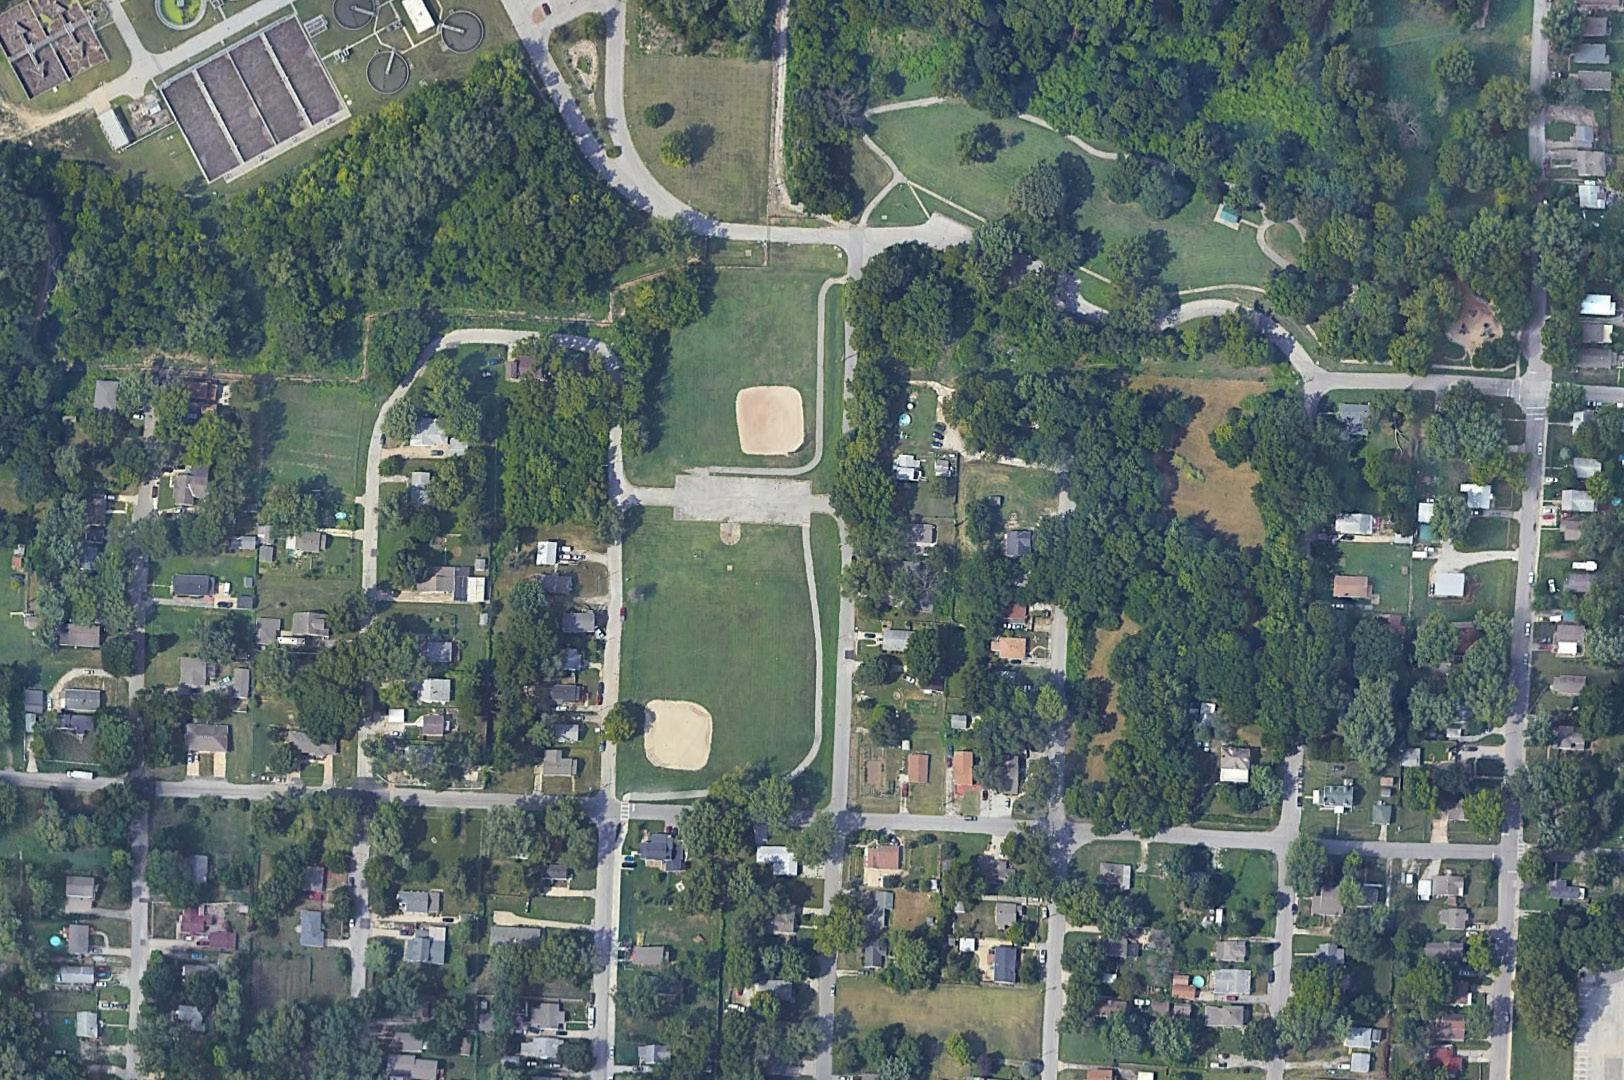
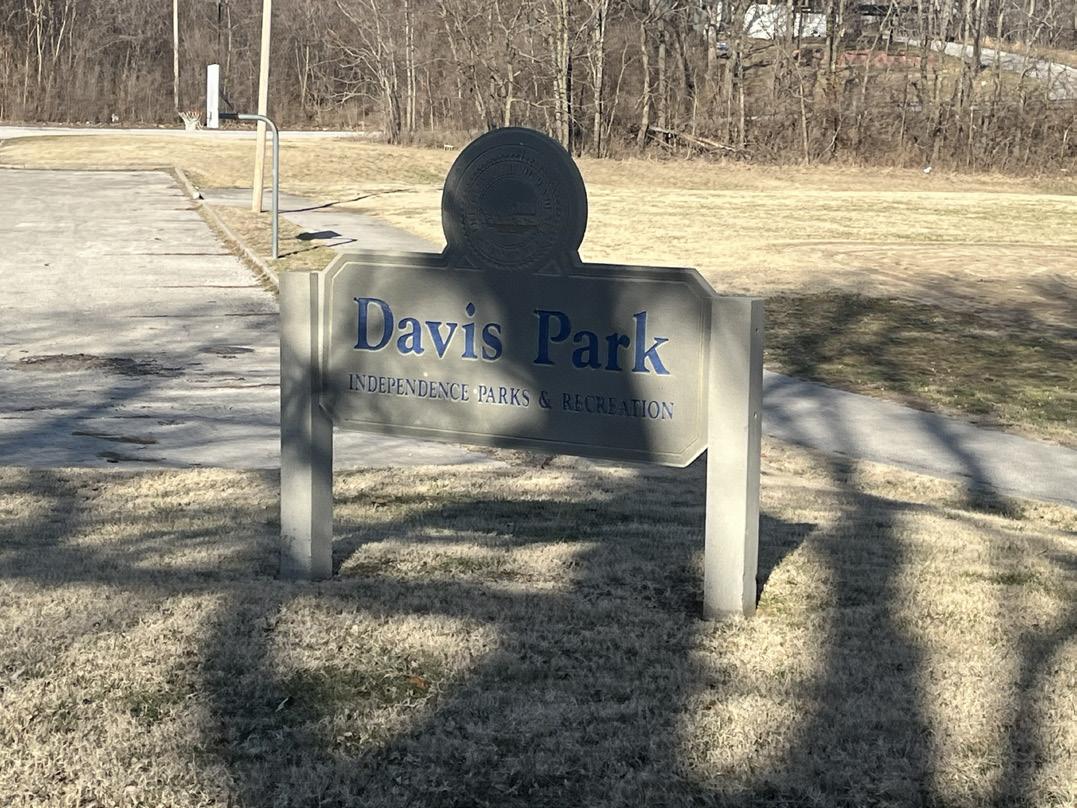
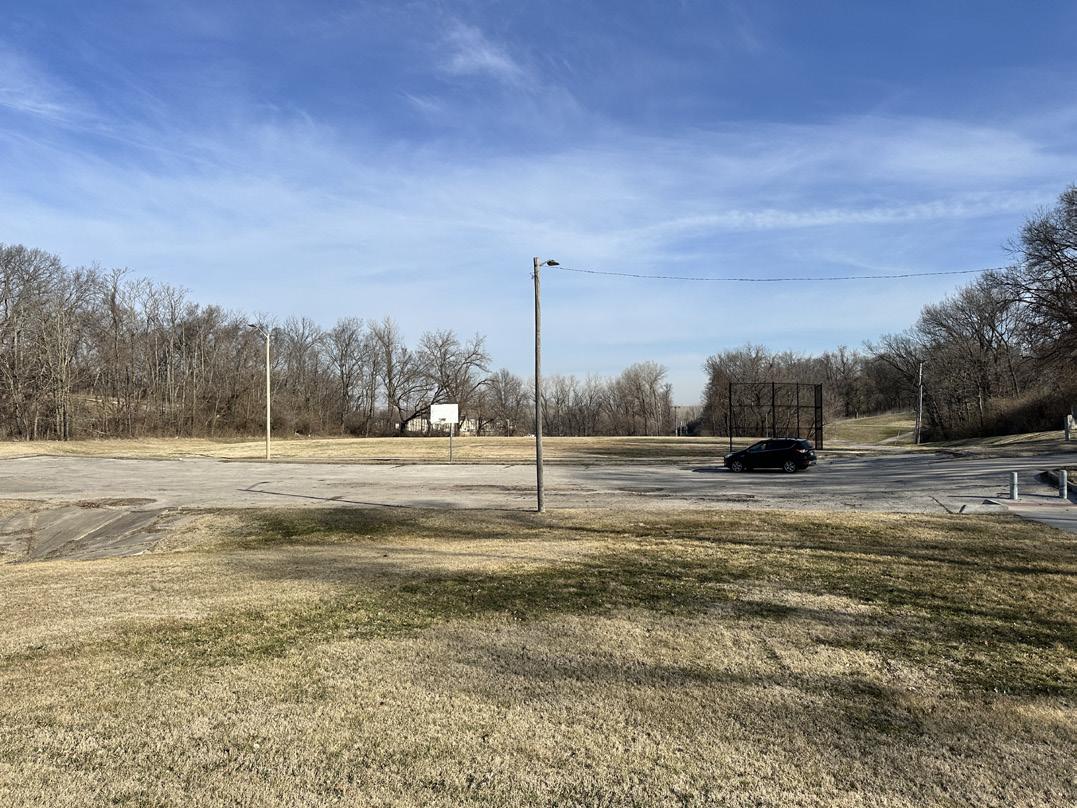
Additional view of parking lot.
Name of Site: Dickinson Park
Date Completed: March, 2025
Completed By: Avery Nichols and Bennet McCoy
1700 Dickinson Rd. Independence, MO 64050 (Dickinson Park)
1500 N Emery DR. Independence, MO 64050 (Dickinson Park Pond)
Dickinson Park is located in the northwest area of Independence and is just north of US-24 Highway.
Size: 44.1 acres
Classification: Neighborhood Park
Picnic Shelter (Fair Condition)
Picnic Tables (Fair Condition)
Playground (Fair Condition)
Restrooms (Fair Condition)
Signage (Fair Condition)
Walking Path (Fair Condition)
Fishing Lake (Poor Condition) Grill (Fair Condition)
Strengths: The park has plenty of parking and open space with flexible programming. Additionally, the pond provides an important opportunity for residents to engage water.
Opportunities: There is an opportunity to improve the connectivity of walkways to the different amenities, as well as an opportunity to develop the accessibility to and around the fishing pond. Playground and signage improvements are needed to improve recreational opportunities. Additionally, a more accessible playground surfacing is needed.
Rating:
4 (Moderate Accessibility)
- The site has a parking lot with ramp access to sidewalks traversing a small section of the site with a shelter, restrooms, and a playground. A large portion of the park is not acceptable by path. The pond is only accessed by Emery Street with no sidewalk access.
Active/Passive: Passive
7. PHOTO INVENTORY:
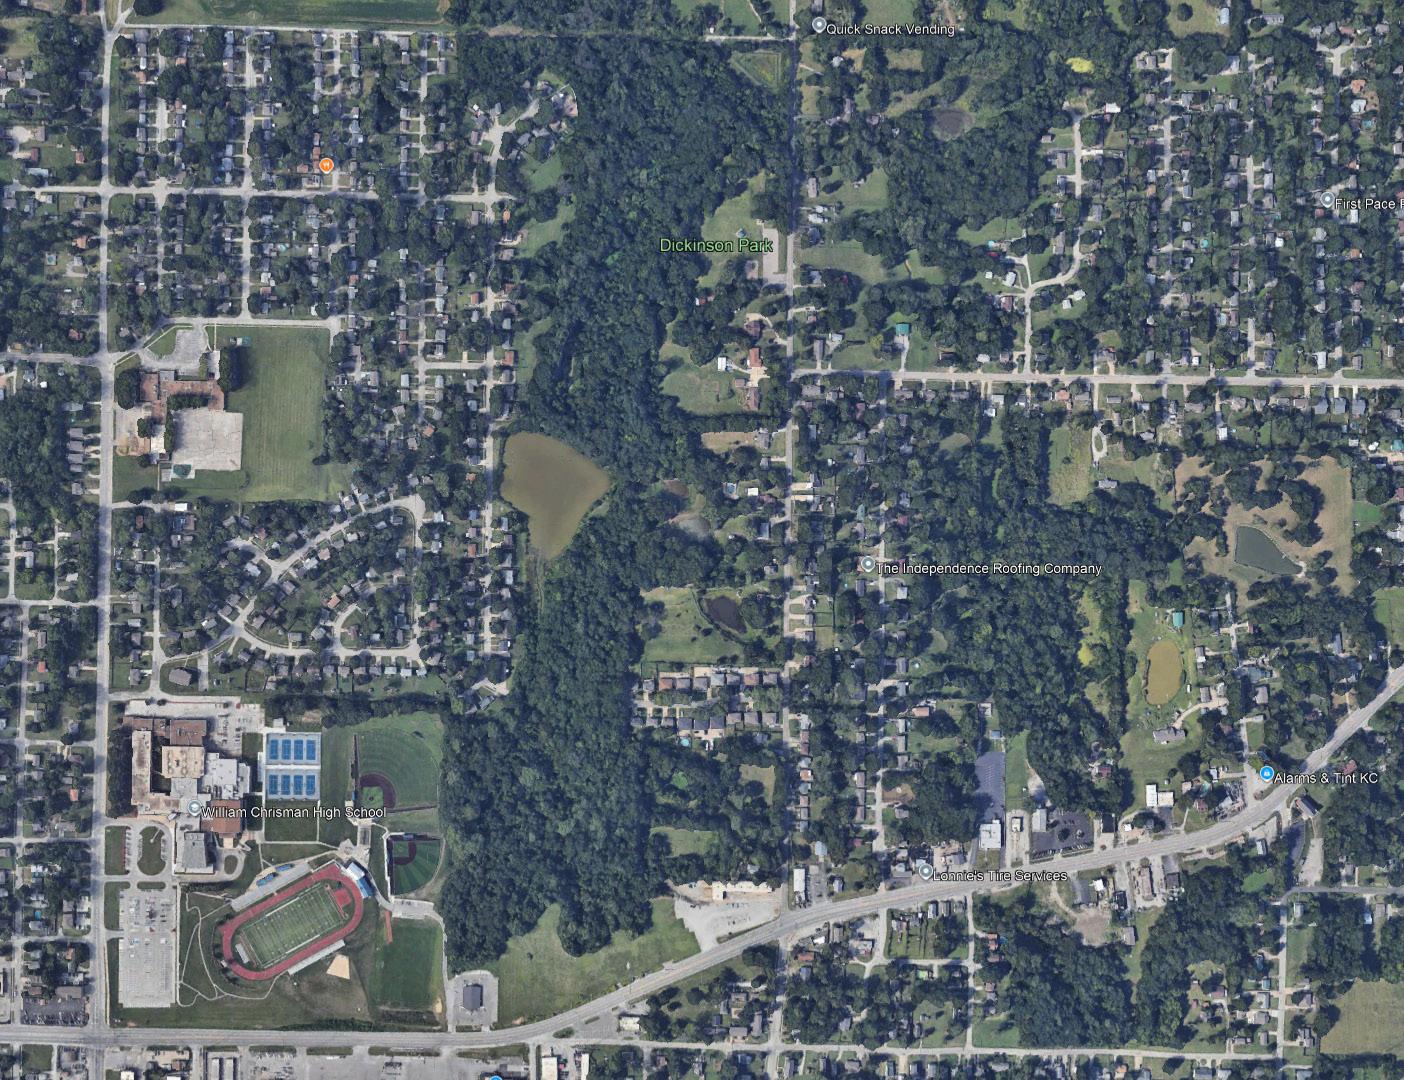
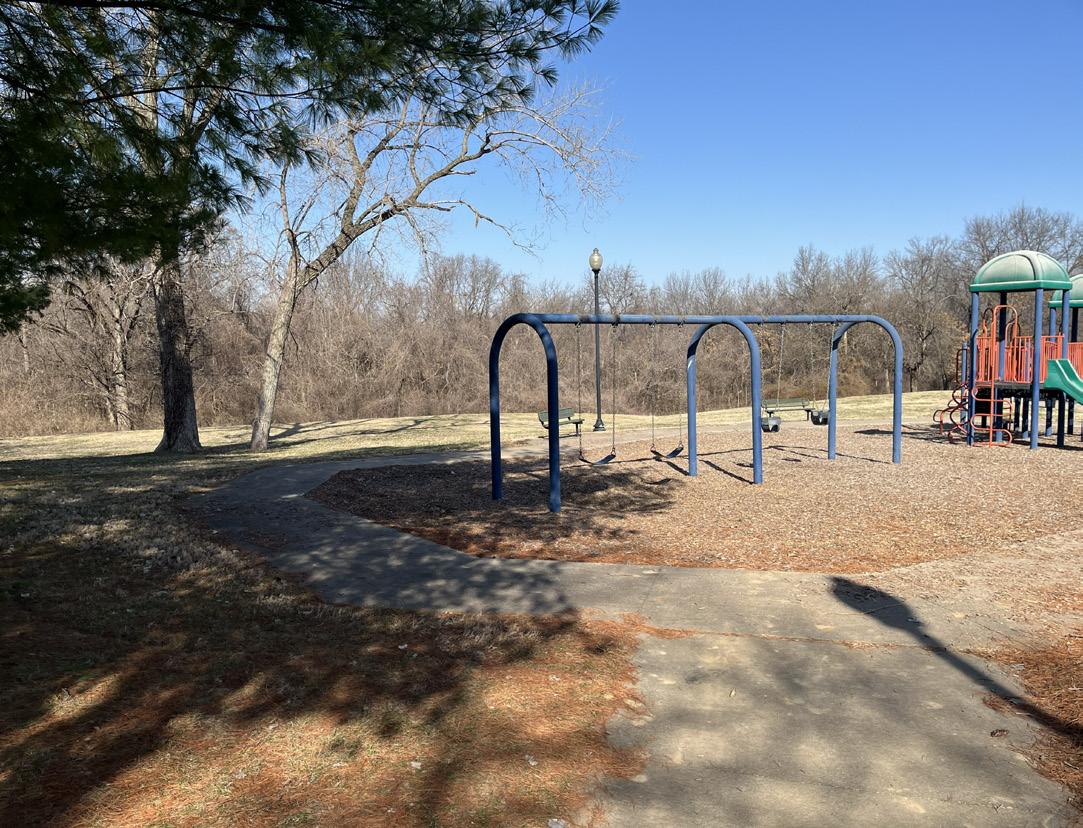
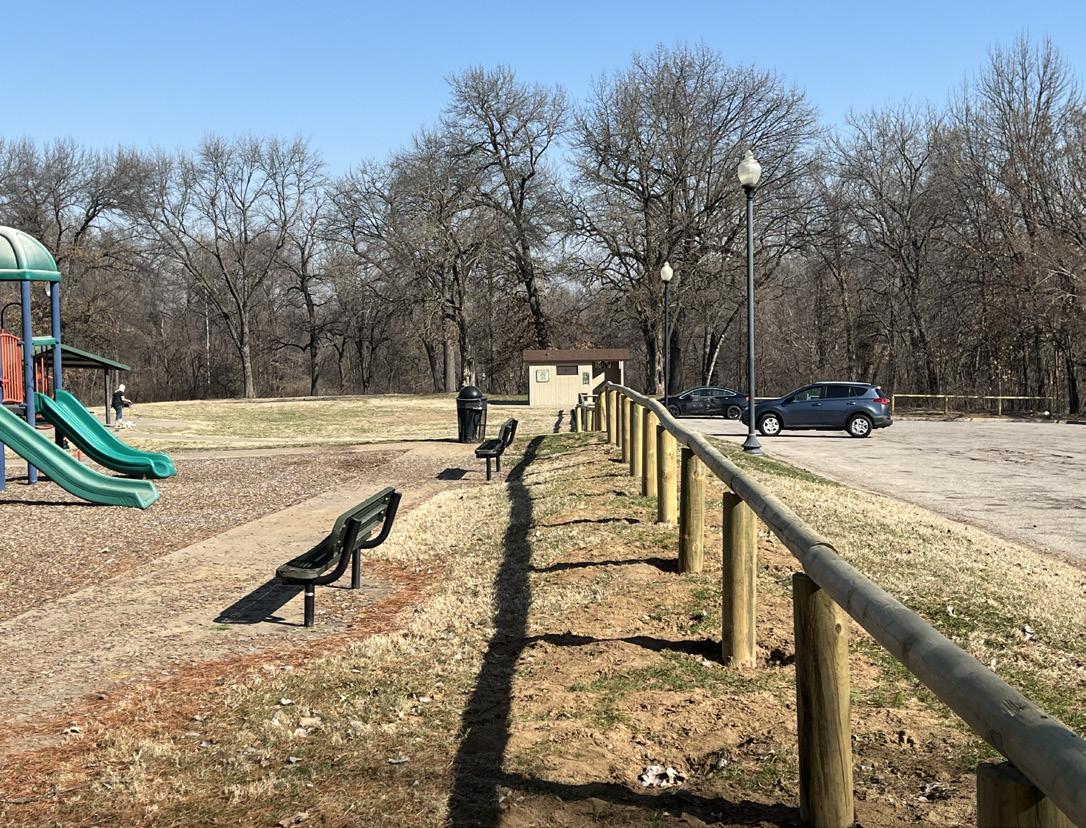
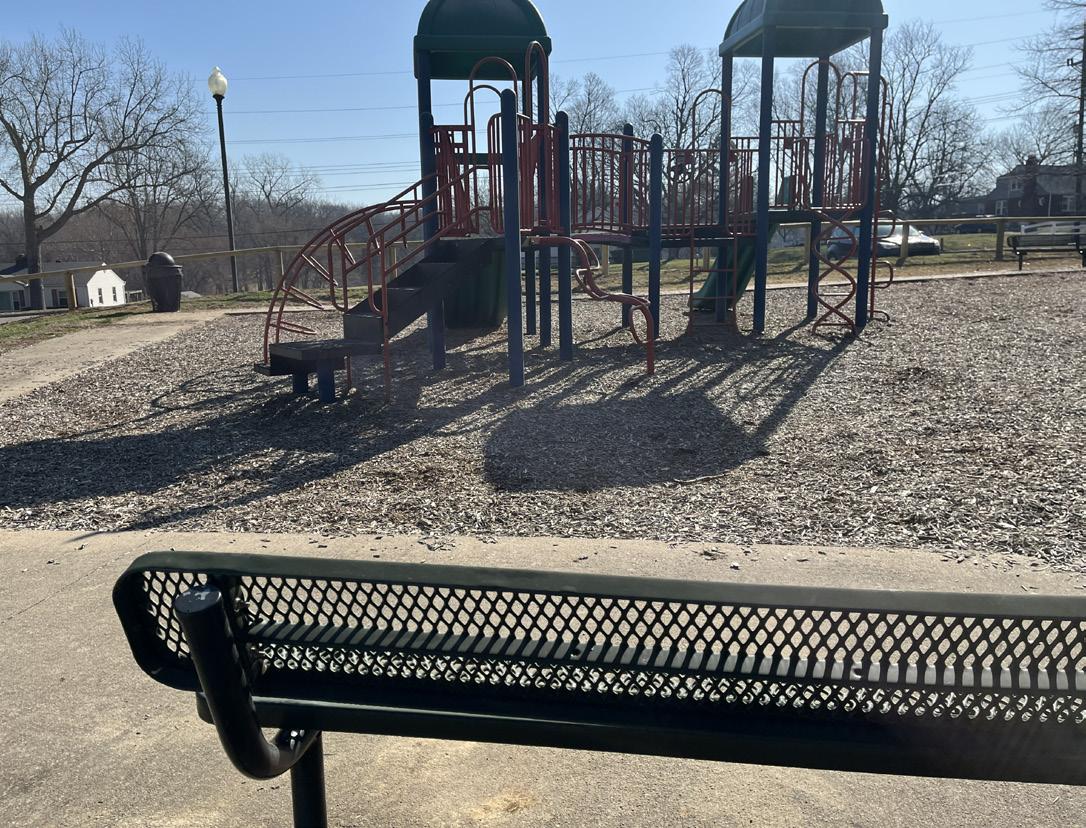
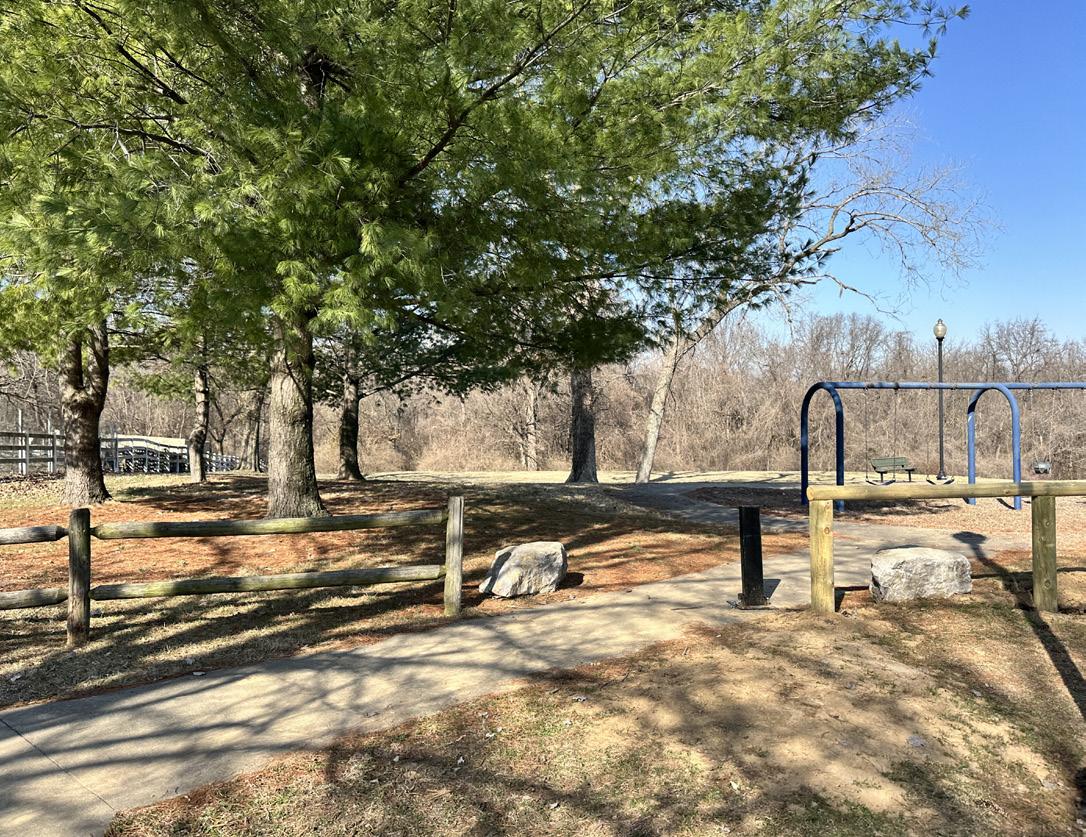
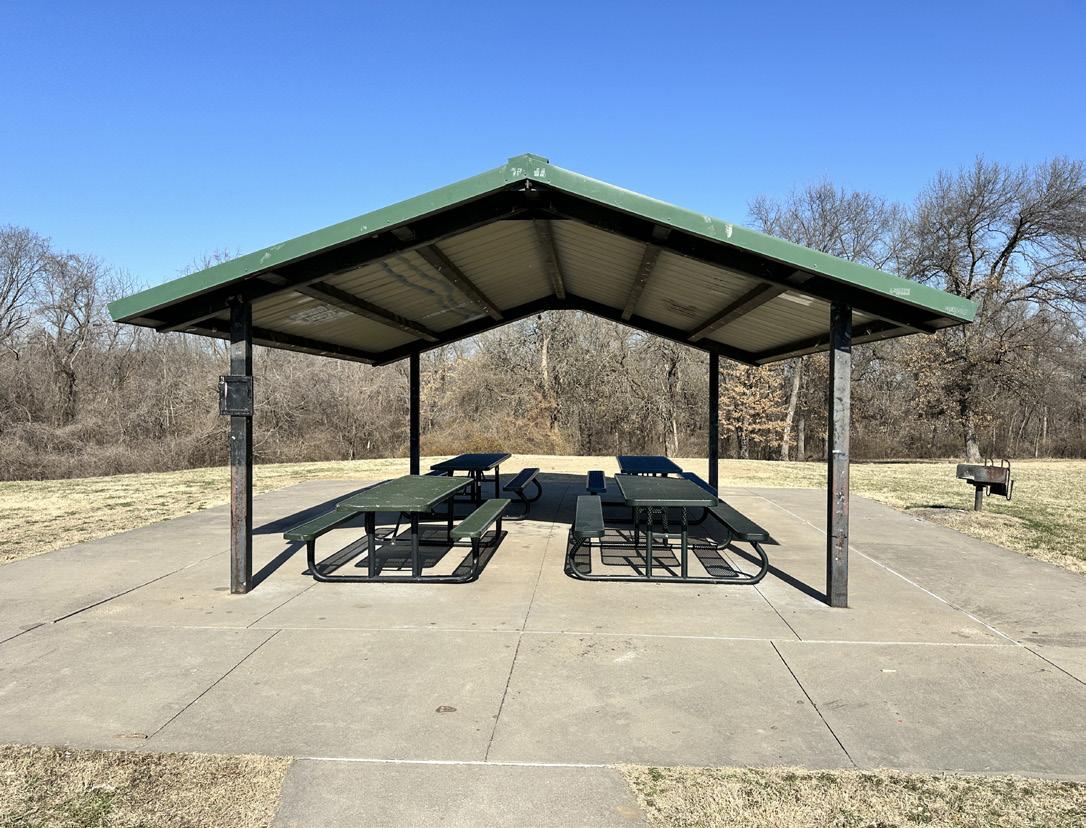
Name of Site: Fairmount Park
Date Completed: March, 2025
Completed By:
Avery Nichols and Bennet McCoy
300 N. Home Ave., Independence, MO 64053
The site sits in the NW corner of Independence’s city limit. It can be accessed along Norledge Ave. Sitting adjacent to a railroad along its north side.
Size: 27.5 acres
Classification: Regional Park
Picnic Shelters (Fair Condition)
Picnic Tables (Fair Condition)
Playgrounds (Fair Condition)
Signage (Fair Condition)
Walking Path (Fair Condition)
Dog Park (Fair Condition)
Grill (Fair Condition)
Restroom (Fair Condition)
Strengths: There is available on-street parking and loop trail connections to entry points and park amenities.
Opportunities: There is opportunity to develop more picnic shelters and update the playground structure to revamp the park for the region. The playground surfacing should be updated to a poured-in-place or rubber surfacing to be more accessible.
Rating:
4 (Moderate Accessibility)
- The park has a parking lot with sidewalk access. The trail circulation around the park has heavy slopes making accessibility difficult. The dog park is accessed by an asphalt trail with minimal parking. The remaining park space is woodland and not accessible.
Active/Passive: Passive
7. PHOTO INVENTORY:
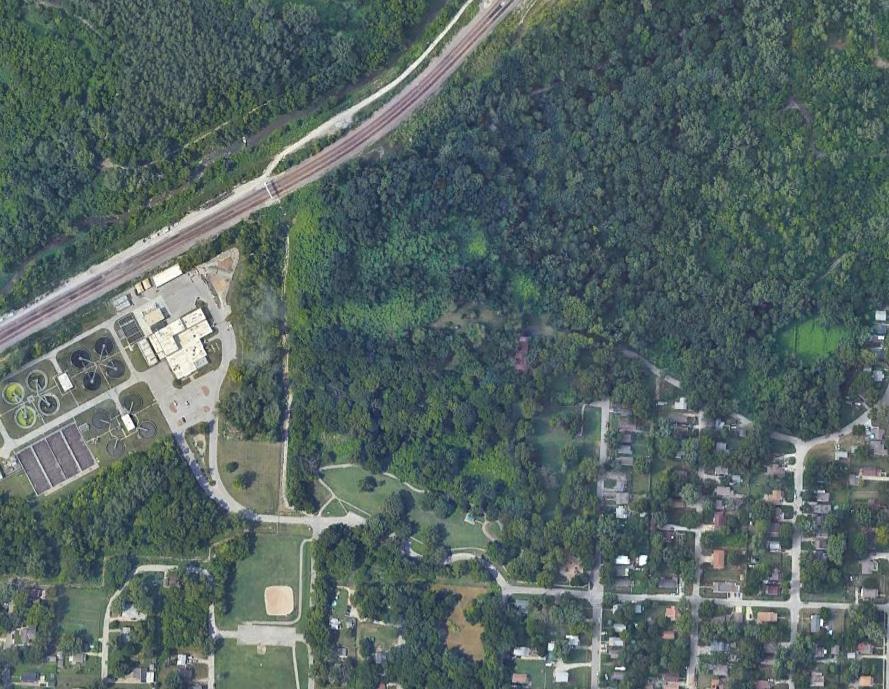
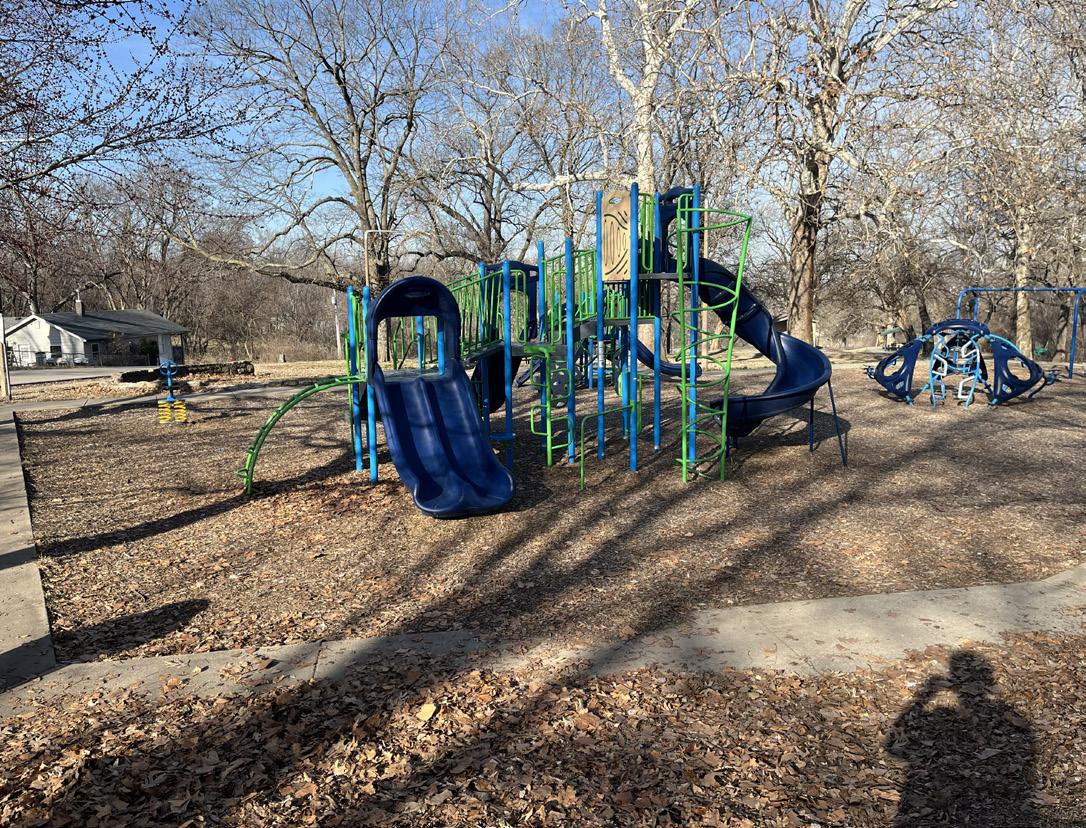
Name of Site: Firehouse Park
Date Completed: March, 2025
Completed By: Avery Nichols and Bennet McCoy
11305 E 35th St S, Independence, MO 64052
This site is located just South of 35th street along the Independence Fire Department #5.
Size: 5.1 acres
Classification: Neighborhood Park
3. INVENTORY OF FACILITY AMENITIES AND CONDITIONS:
Signage (Poor Condition)
Fishing Lake (Poor Condition)
4. STRENGTHS AND OPPORTUNITIES:
Strengths: The fishing pond makes for a nice neighborhood amenity, however improvements are needed to make it more usable.
Opportunities: There is an opportunity to take advantage of the pond as it is a unique condition when compared to the other parks. One consideration could be to develop a boardwalk to wrap around parts of the edge of the pond and dredge the pond to create more depth.
Rating:
5 (low Accessibility)
- The site has little dedicated parking near the fire department. There is no circulation access around the pond.
6. GENERAL NOTES:
Active/Passive: Passive
7. PHOTO INVENTORY:
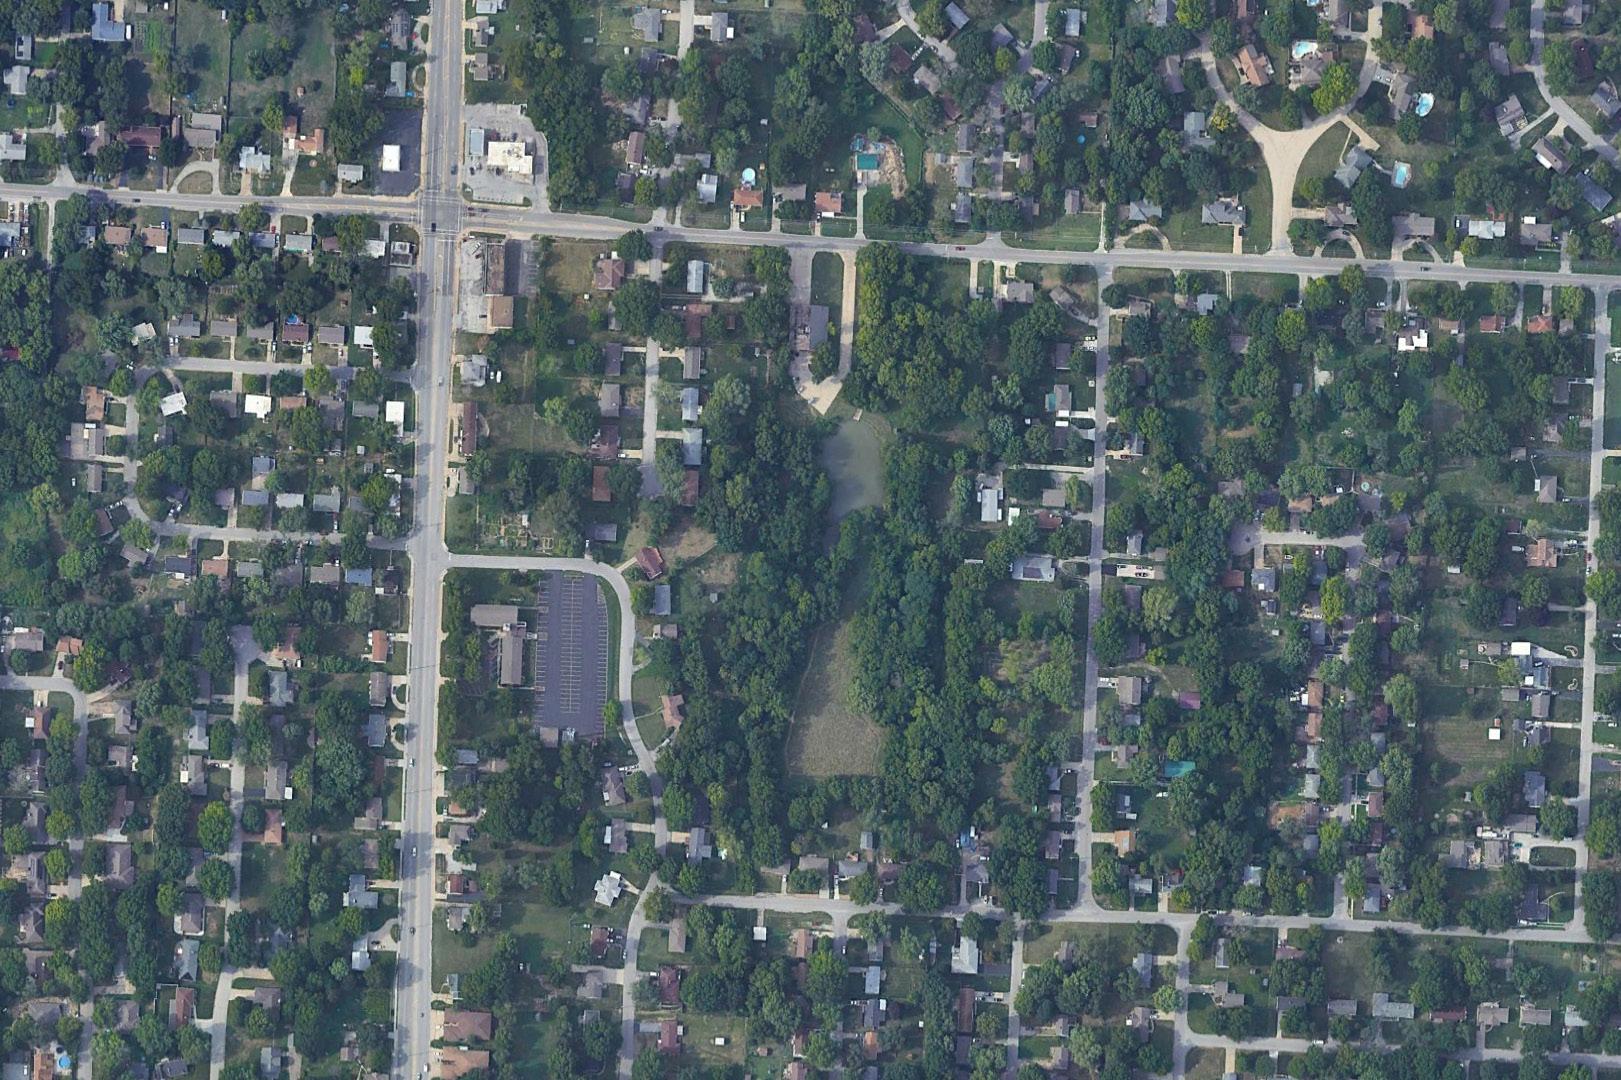
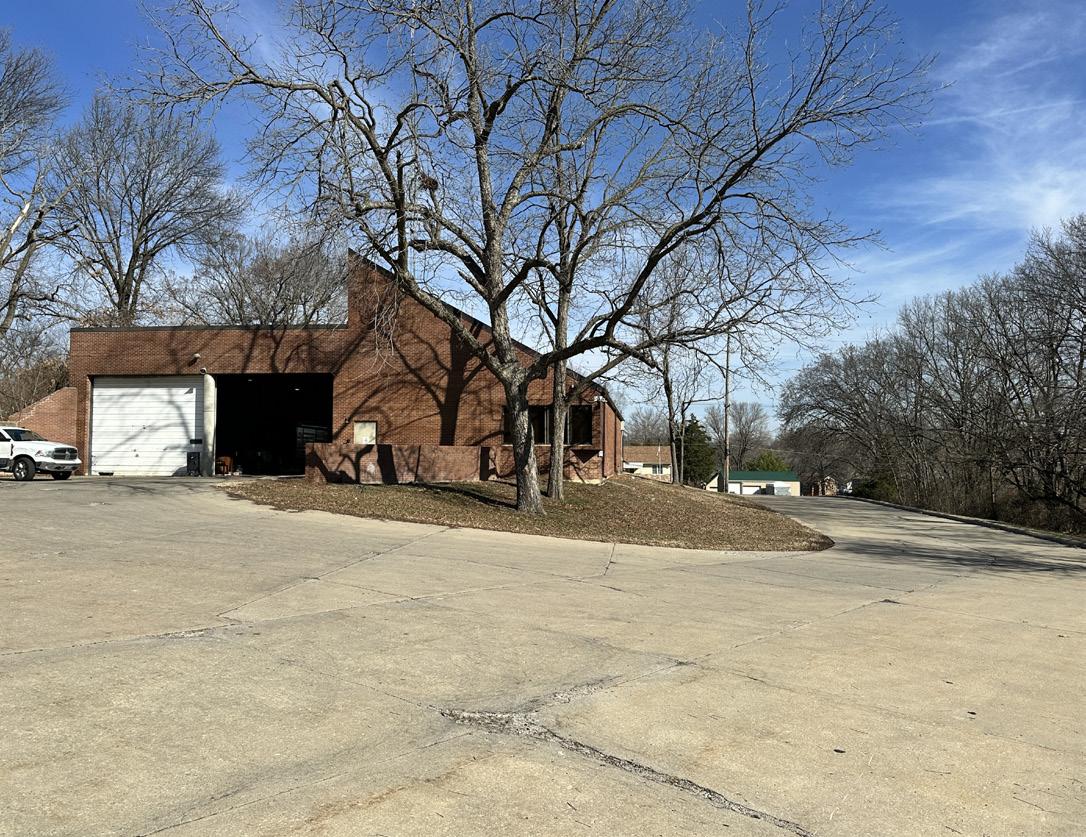
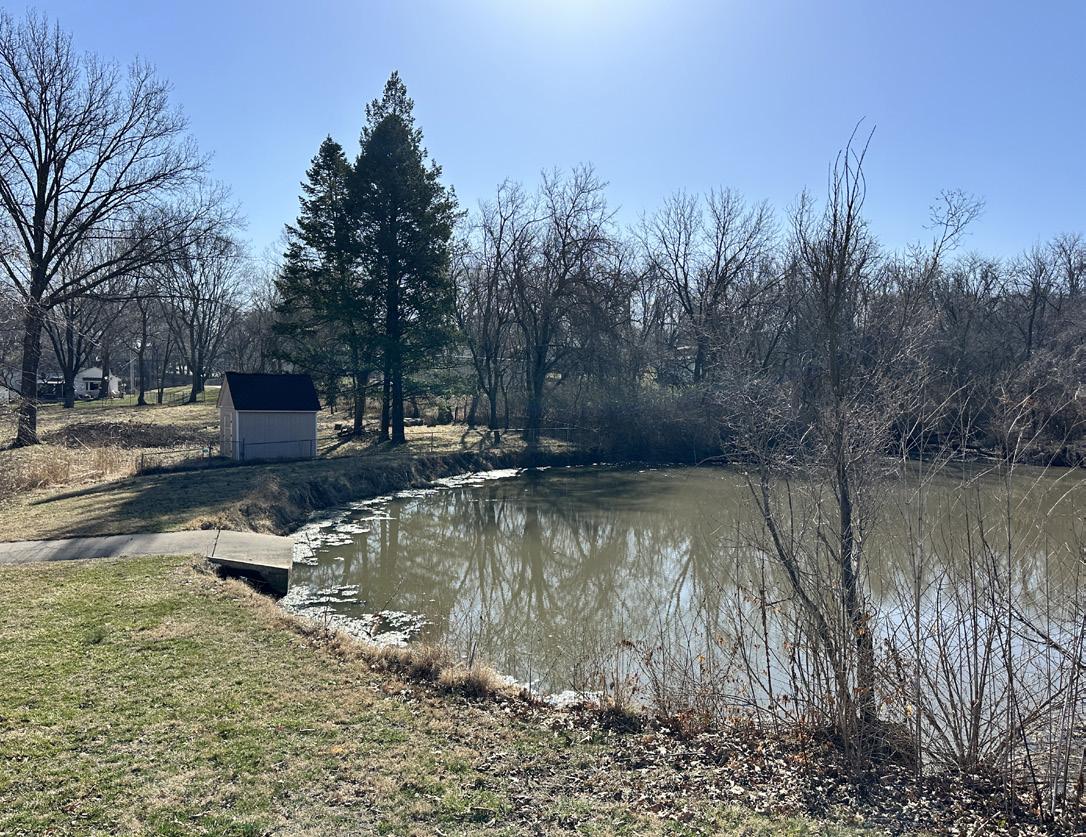
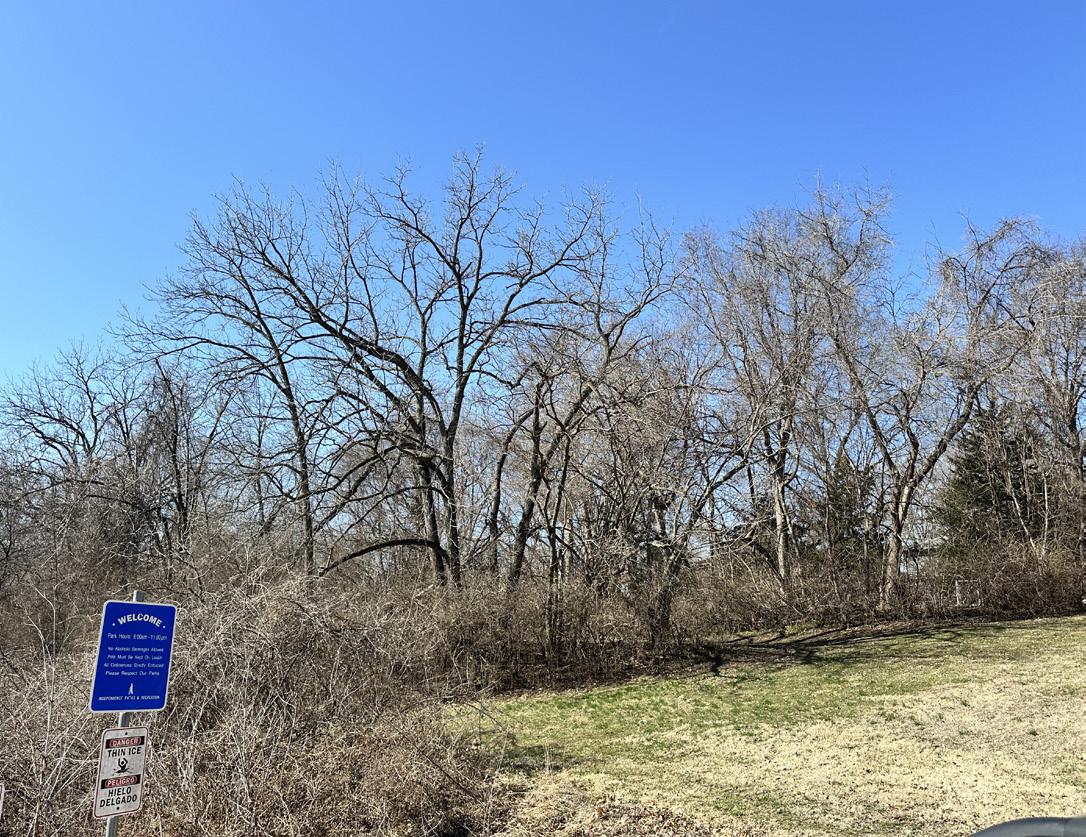
Name of Site: George Owens Nature Park
Date Completed: March, 2025
Completed By: Avery Nichols and Bennet McCoy
1601 S. Speck Rd., Independence, MO 64057
The site sits near the center of the city. The park can be accessed via Speck Rd. and is located just north of M-78 Highway.
Size: 75.1 acres
Classification: Regional Park
Picnic Shelters (Fair Condition)
Picnic Tables (Fair Condition)
Restrooms (Fair Condition)
Signage (Good Condition)
Walking Path (Fair Condition)
Nature Center (Fair Condition)
Group Camp Area (Fair Condition)
Fishing Lakes (Fair Condition)
Cornhole (Fair Condition)
Horseshoe Pitches (Fair Condition)
Strengths: George Owens Nature Park has plenty of programmed trails and spaces, maintained by the park. The site provides a lot of recreational amenities not found in other area parks.
Opportunities: There is an opportunity to design more dedicated nature trails with signage and mile markers. This park also provides users with environmental learning opportunities which should be capitalized on with future improvements.
Rating: 2 (Moderate Accessibility)
- The site has a parking lot leading to the main buildings. Trails and amenities are located around the site, some of which do not have direct sidewalk access.
Active/Passive: Passive
7. PHOTO INVENTORY:
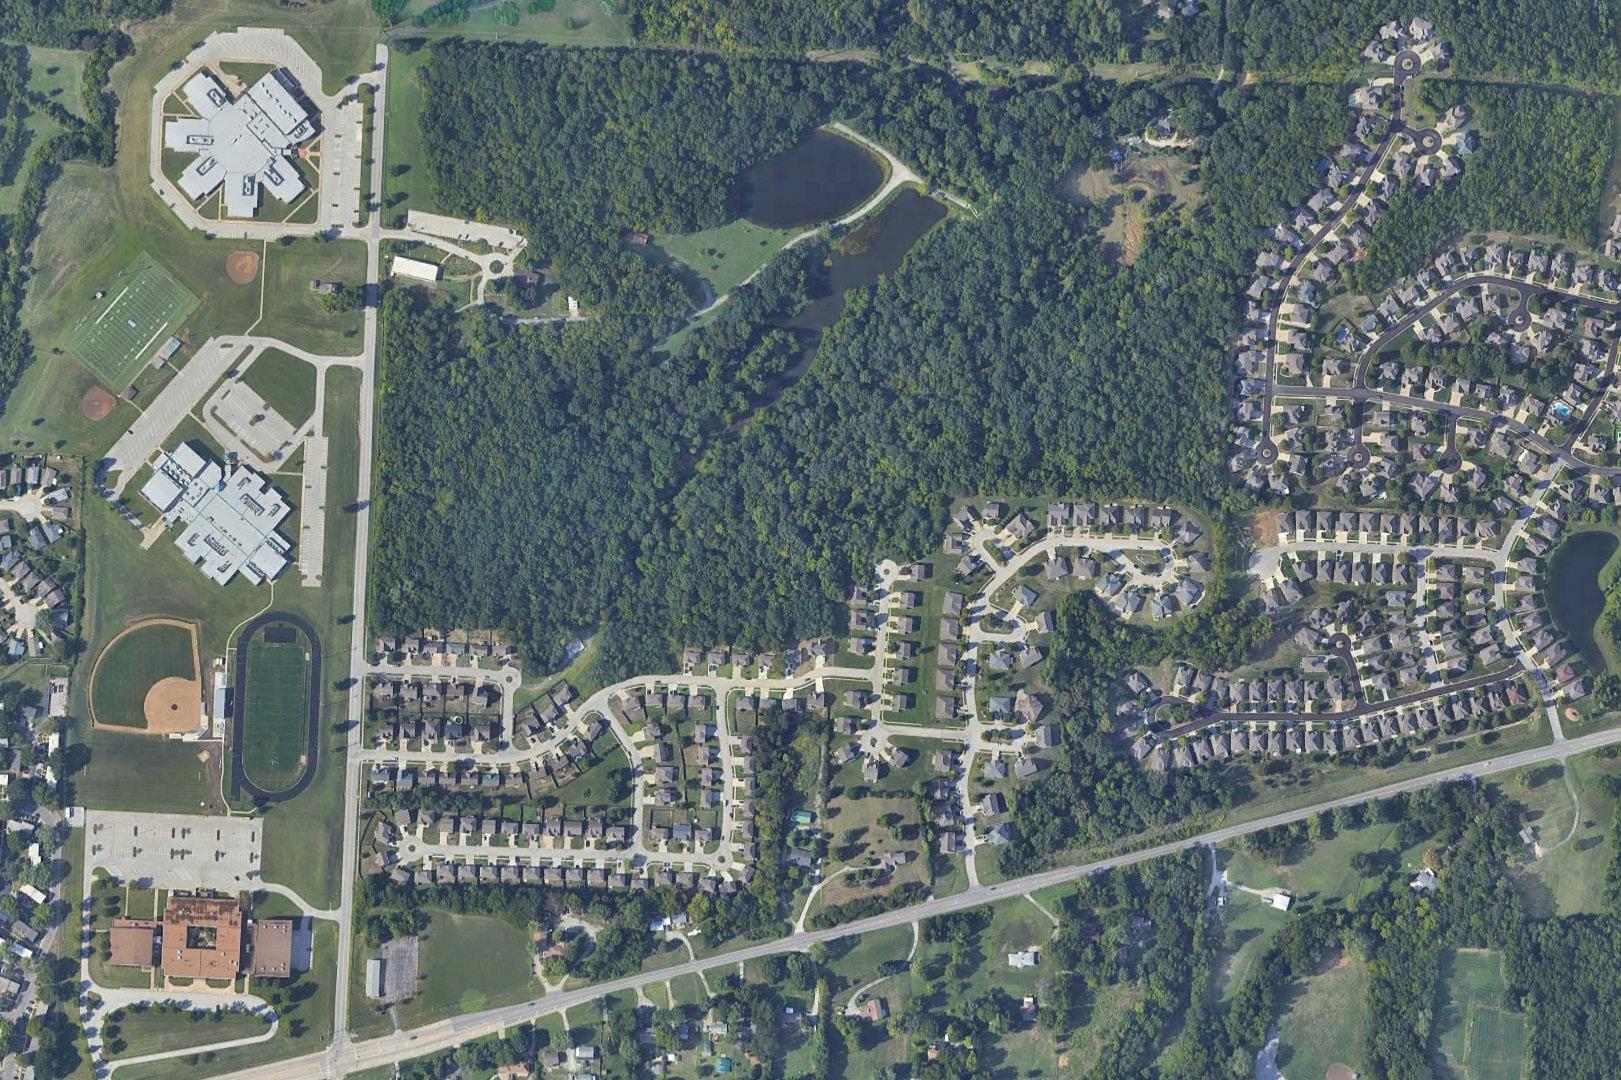
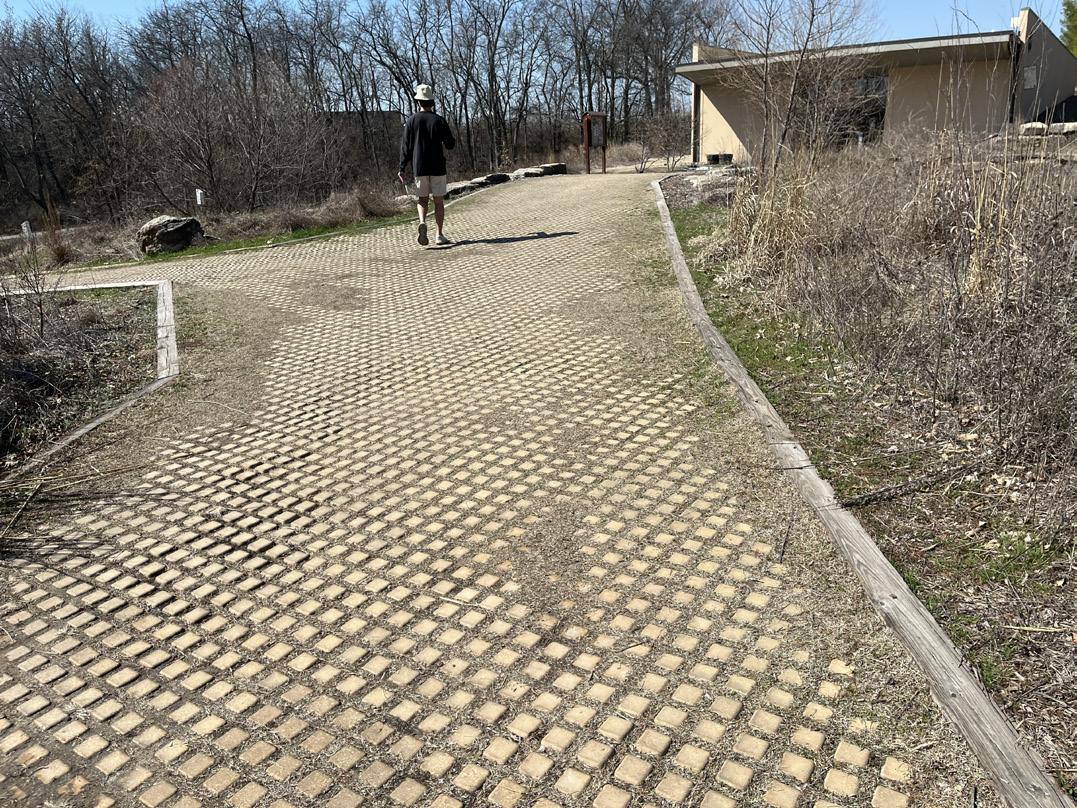
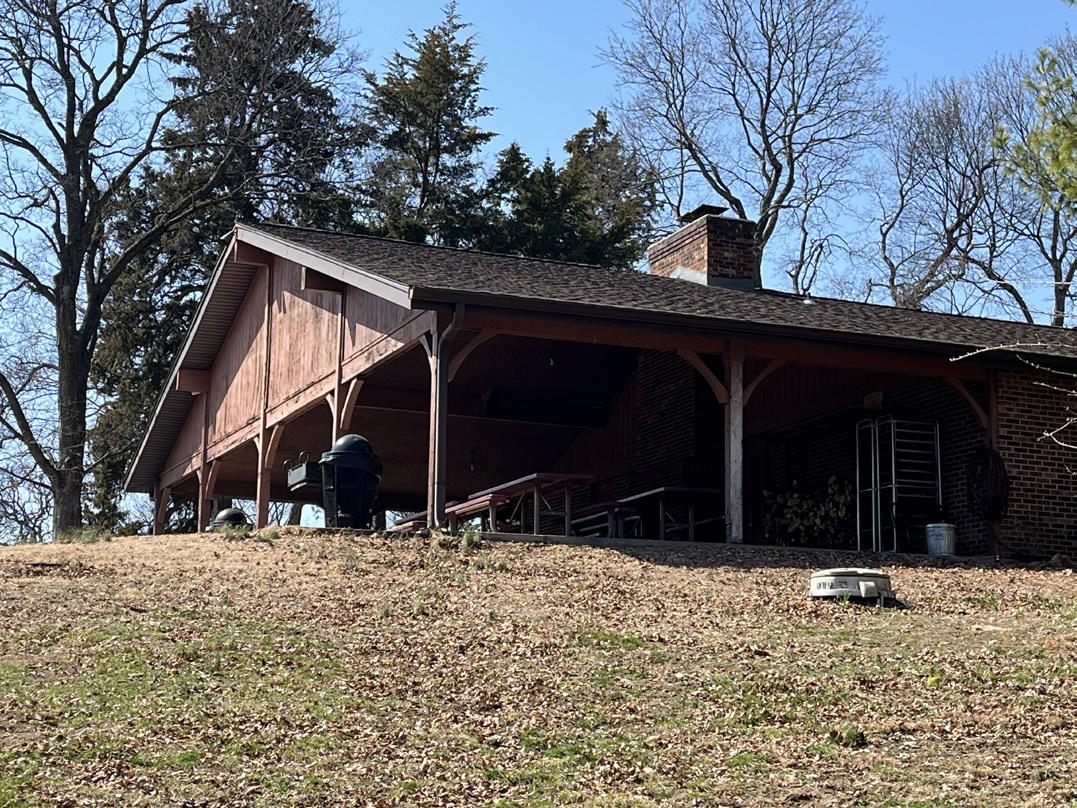
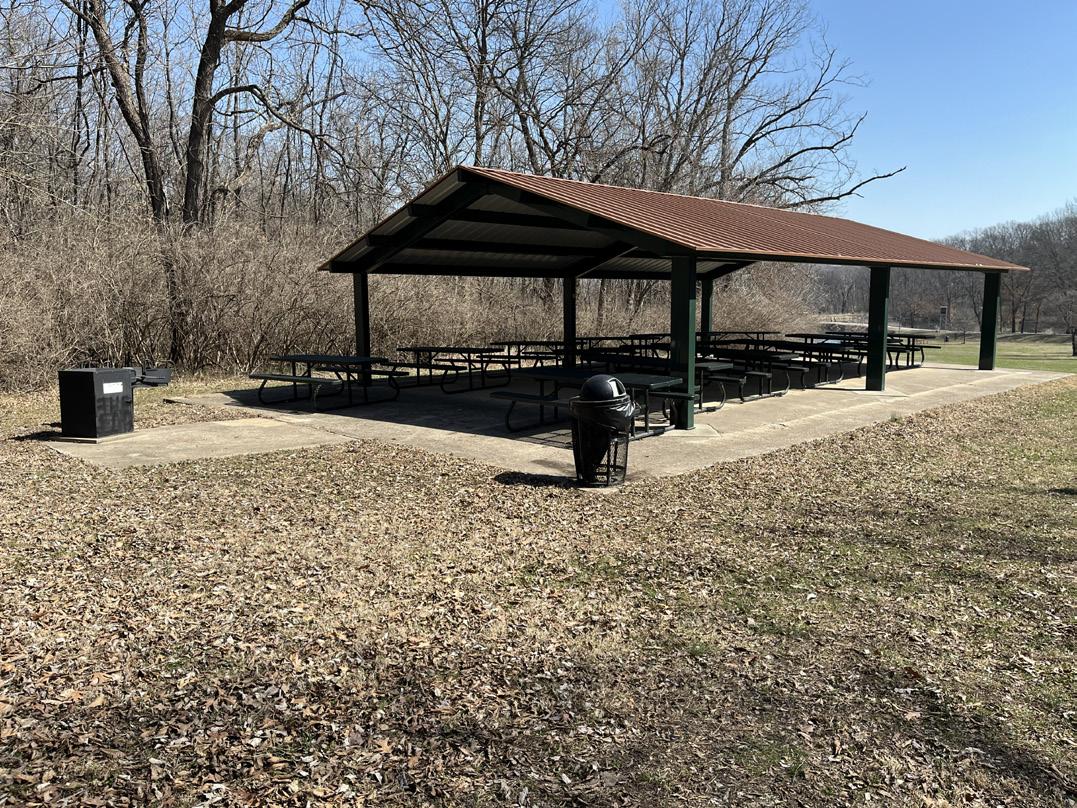
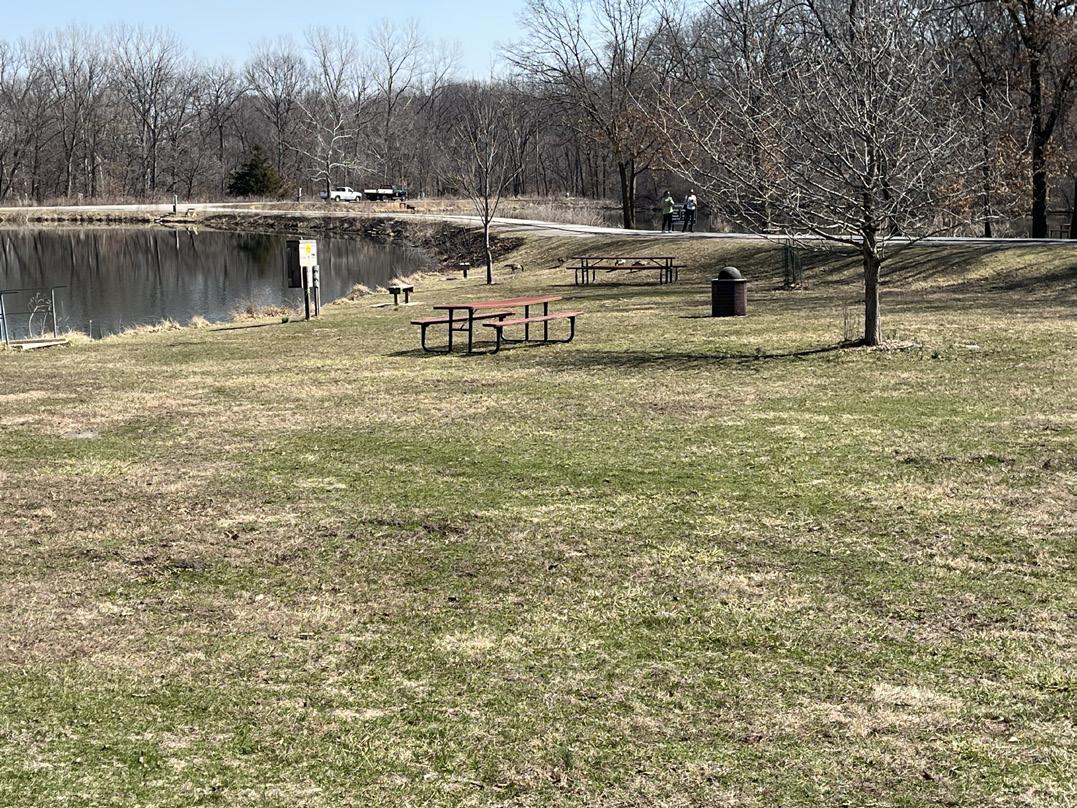
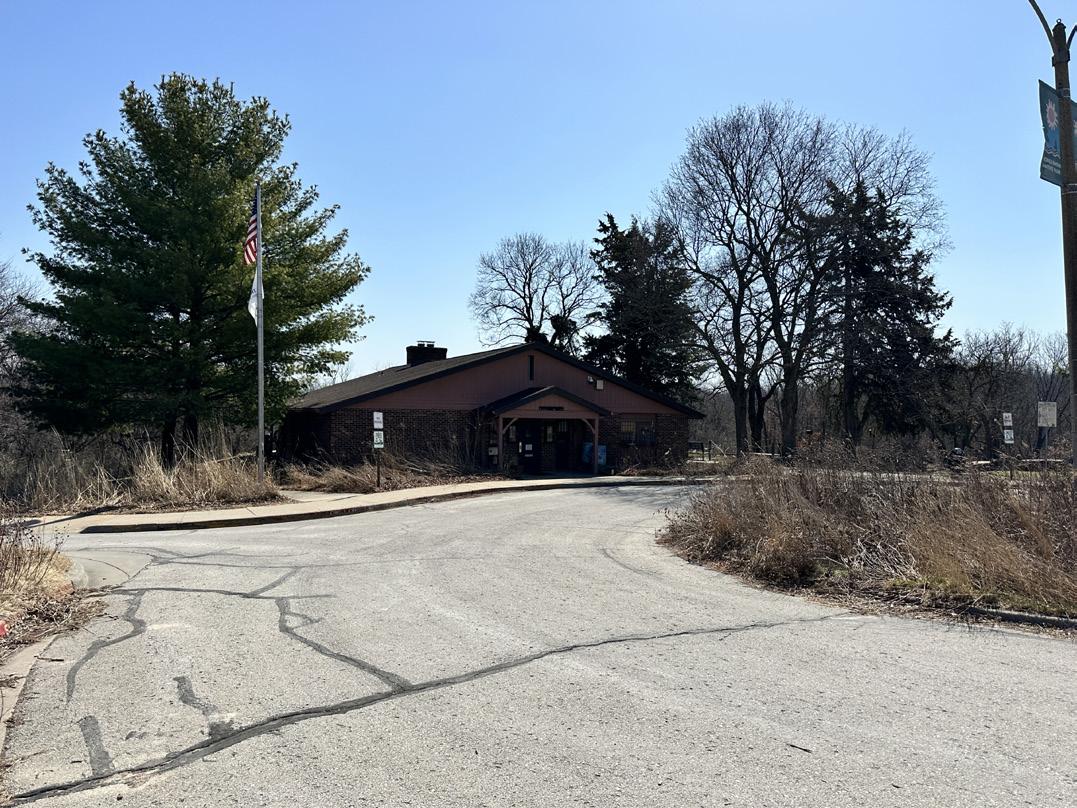
Entry drive turn-around at the Lodge.
Name of Site: Glendale Park
Date Completed: March, 2025
Completed By:
Avery Nichols and Bennet McCoy
16010 E. Crackerneck Rd, Independence, MO 64055
This park is located along Lee’s Summit Road in the southern area of Independence.
Size: 3.2 acres
Classification: Neighborhood Park
3. INVENTORY OF FACILITY AMENITIES AND CONDITIONS:
Picnic Tables (Fair Condition)
Playground (South) (Good Condition)
Playground (North) (Fair Condition)
Restrooms (Poor Condition)
Signage (Fair Condition)
Walking Path (Fair Condition)
4. STRENGTHS AND OPPORTUNITIES:
Strengths: Glendale Park has plenty of open space and a loop trail. In addition, it has two playground structures, with restrooms nearby.
Opportunities: There is an opportunity to use some of the lawn space for sport courts or more natural planting areas. The restrooms are in poor condition and should be removed, given the short usage time frame of this facility. Trail resurfacing and additional connections to amenities are needed throughout the park.
Rating:
2 (Moderate Accessibility)
- The park has a parking lot with direct access to sidewalks with ramps to a shelter, playgrounds, and restroom facility. A perimeter sidewalk and a trail within the park are accessible, with some amenities not accessible to all users.
Active/Passive: Passive
7. PHOTO INVENTORY:
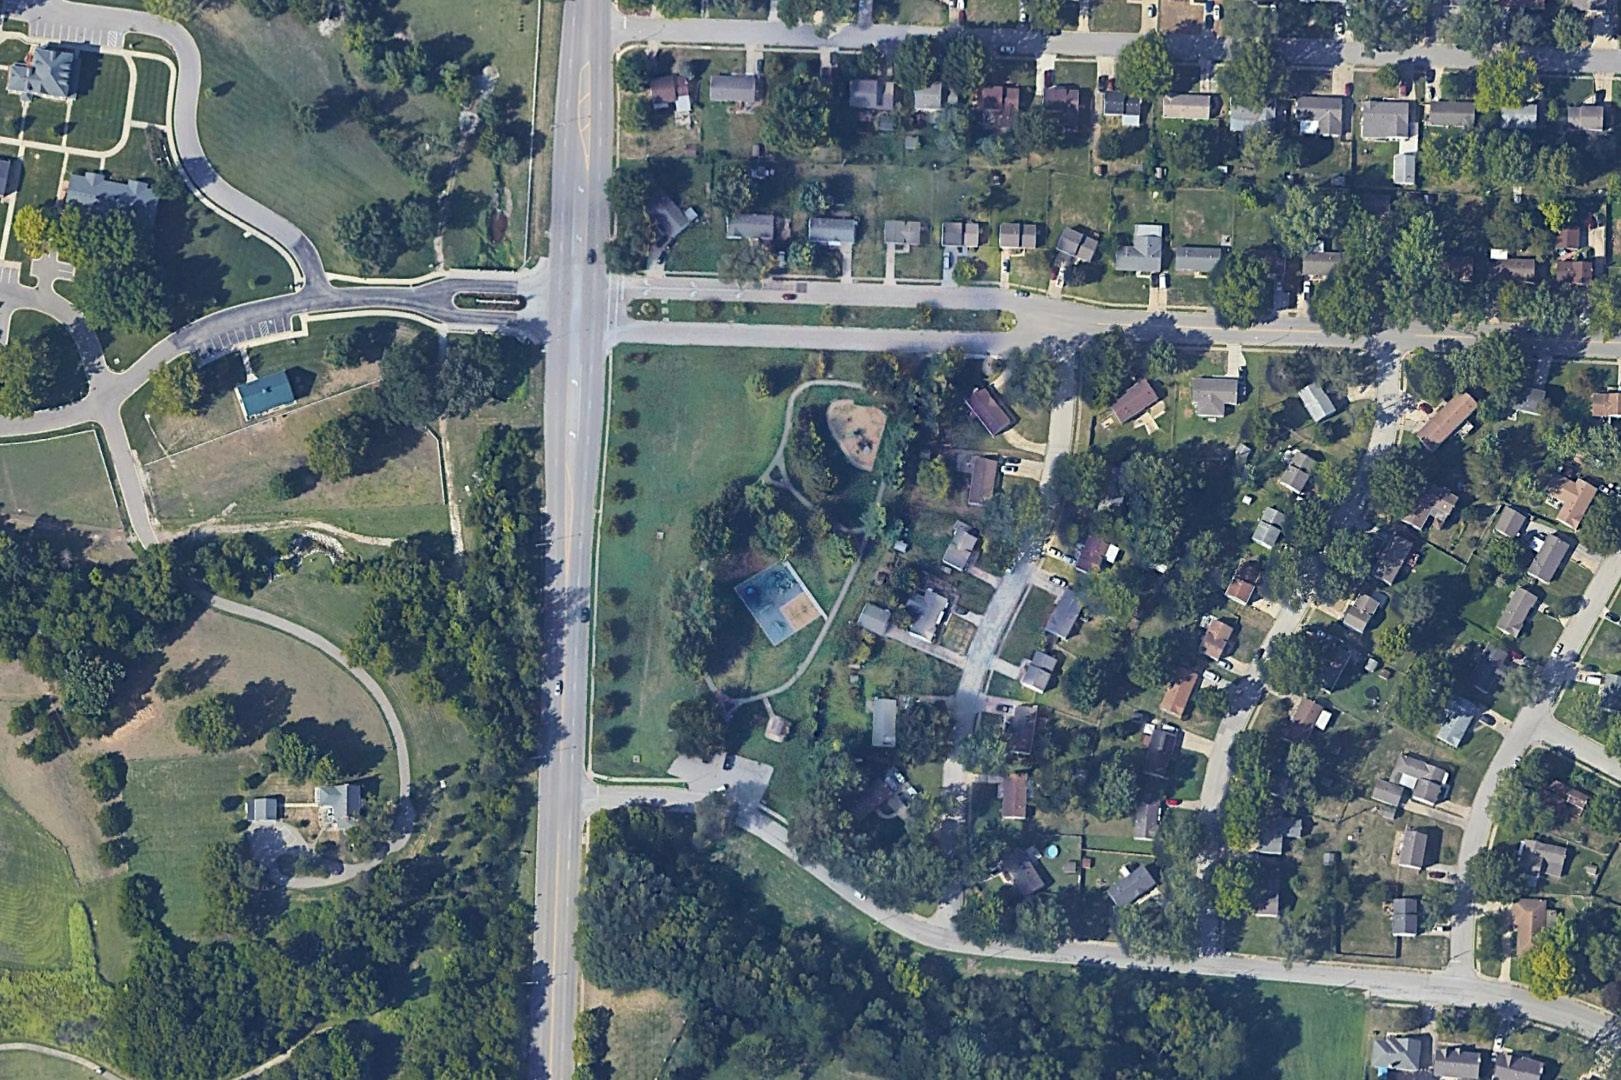
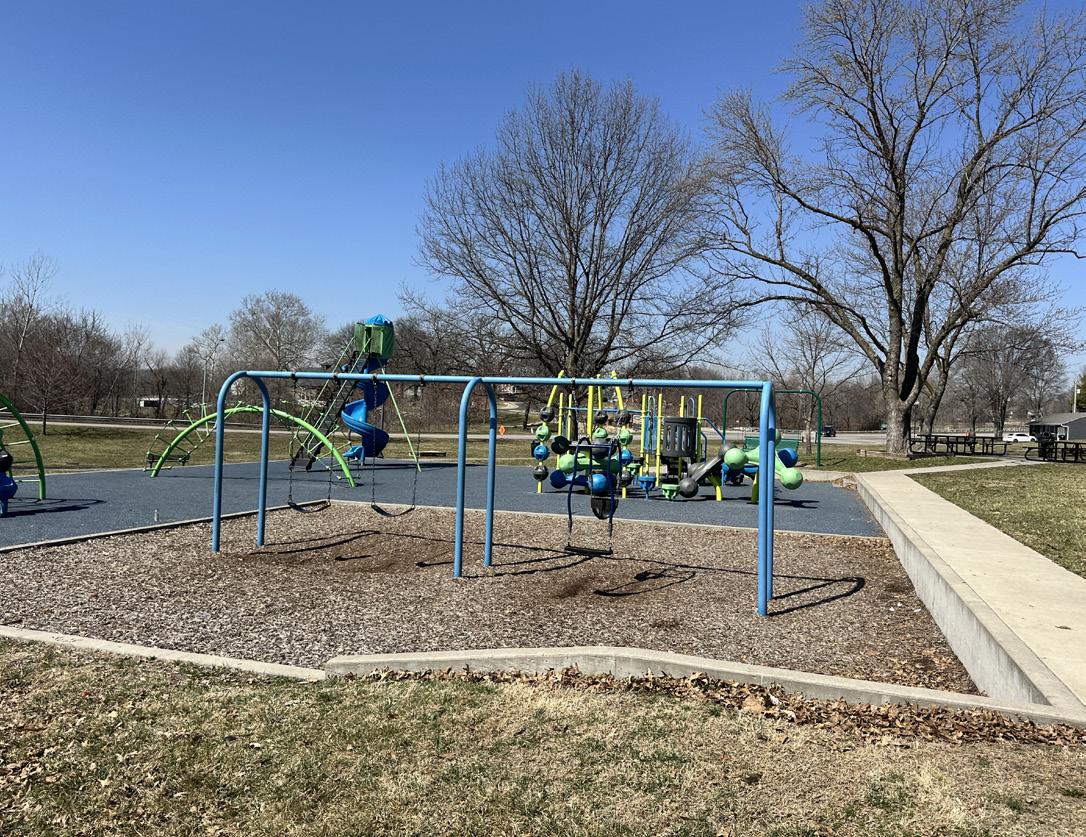
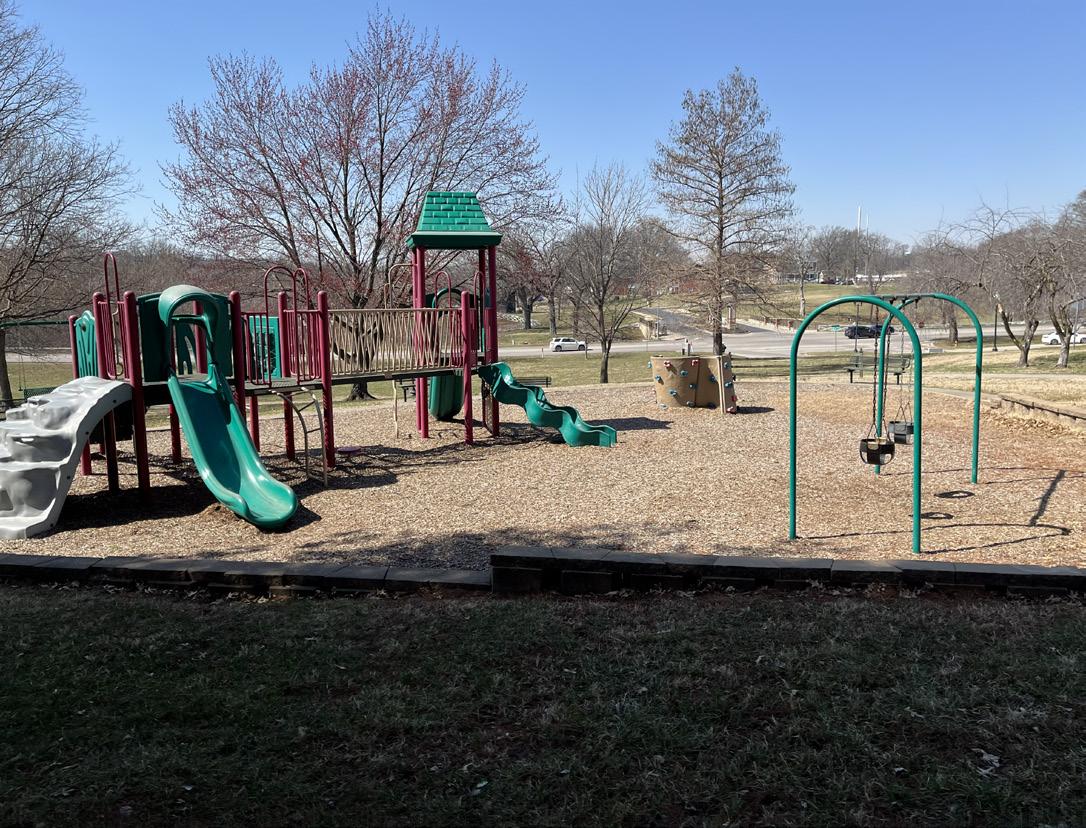
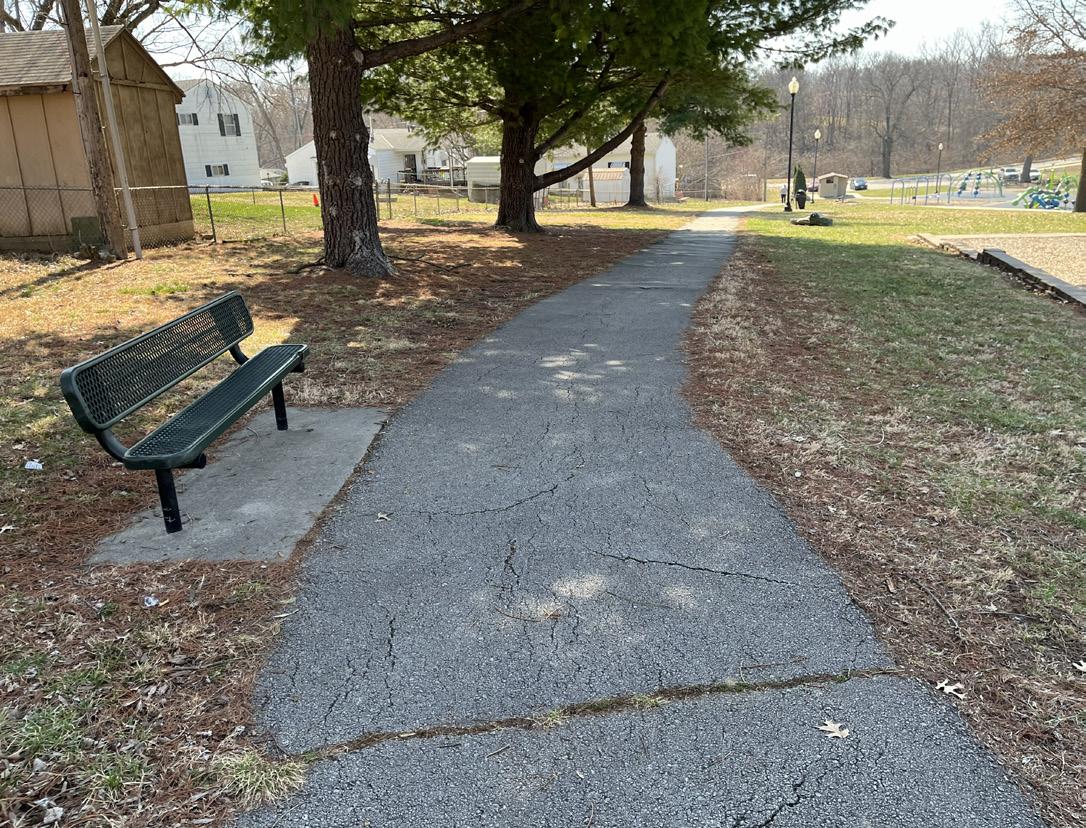
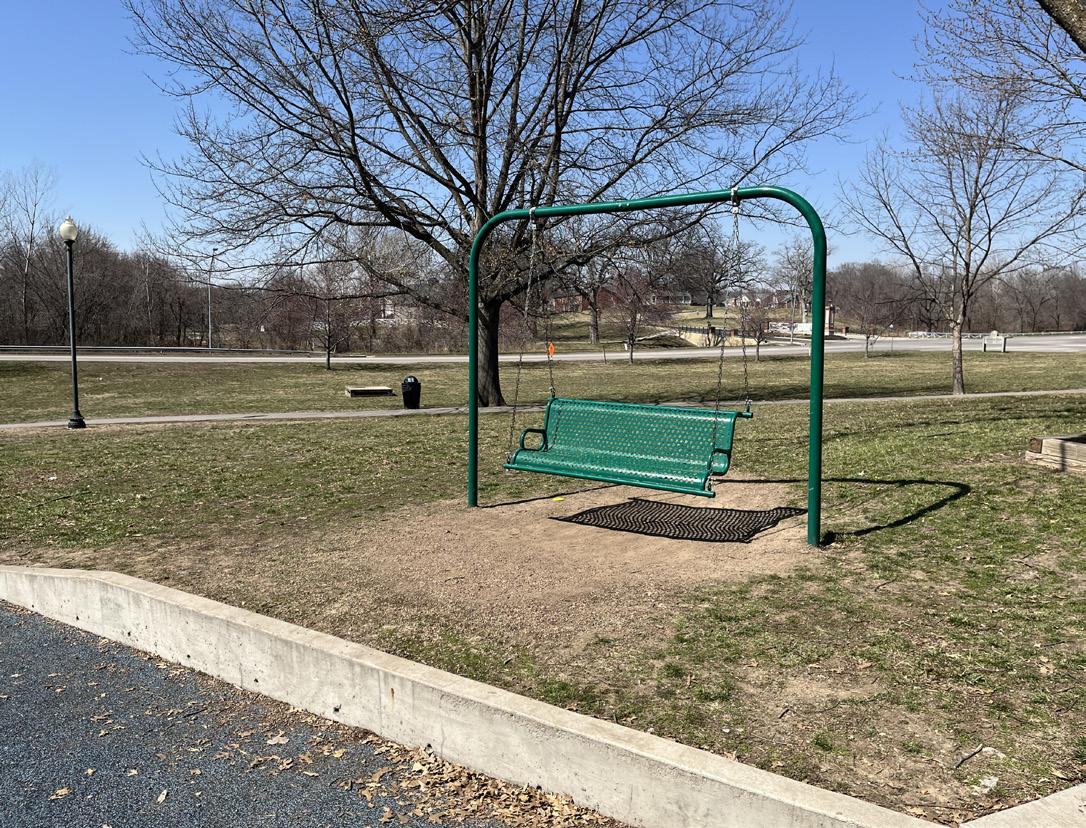
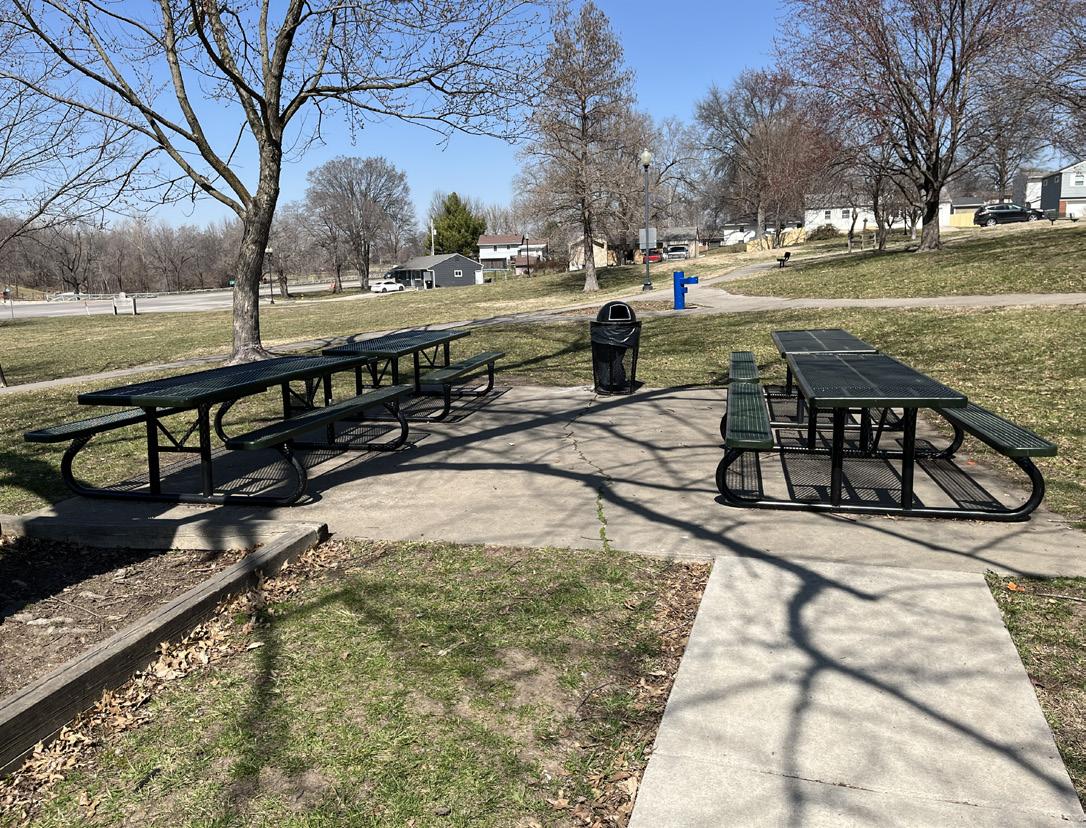
Name of Site: High Ridge Greenspace
Date Completed: March, 2025
Completed By: Avery Nichols and Bennet McCoy
11301 E. 40th St. S, Independence, MO 64052
This site is located along the southern edge of Independence, near US-40 Highway.
Size: 0.22 acres
Classification: Pocket Park (Greenspace)
3.
OF FACILITY AMENITIES AND CONDITIONS:
No amenities present.
4.
Strengths: This space has easy access from the neighborhood.
Opportunities: This area can make for a small pocket park with programming or returned to neighborhood property.
Rating:
5 (low Accessibility)
- The site has no dedicated parking, other than on the street. There is no circulation access around the greenspace.
Active/Passive: Passive
7. PHOTO INVENTORY:
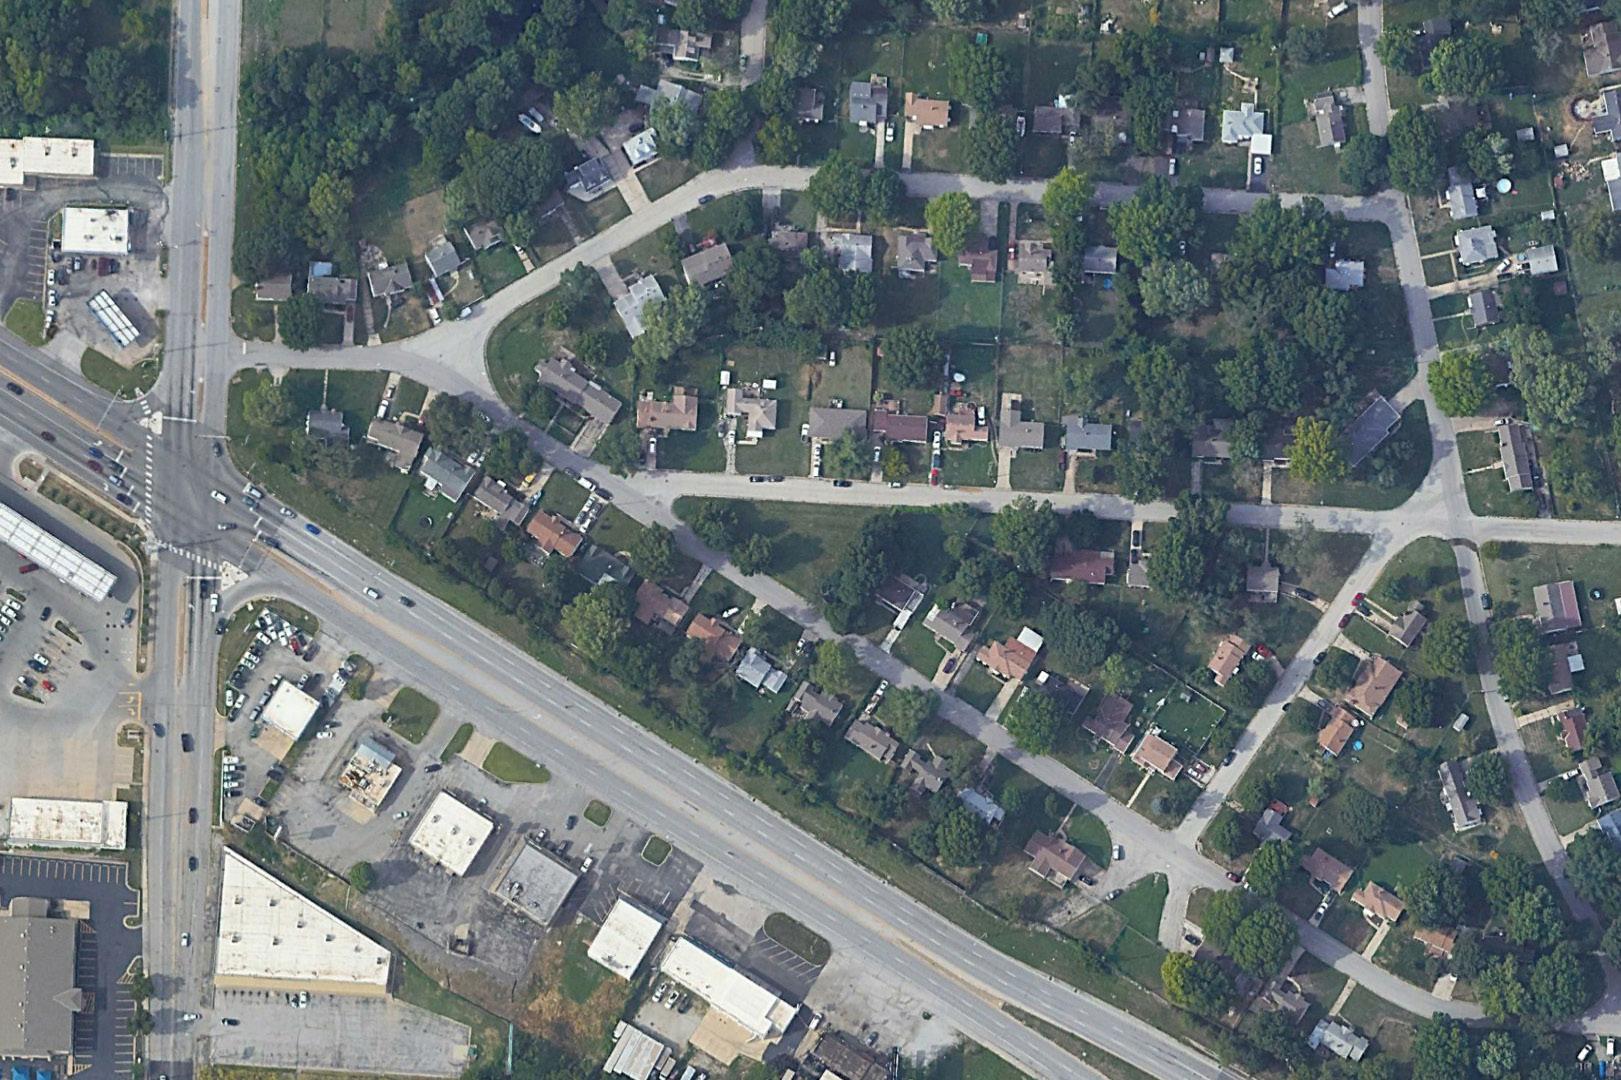
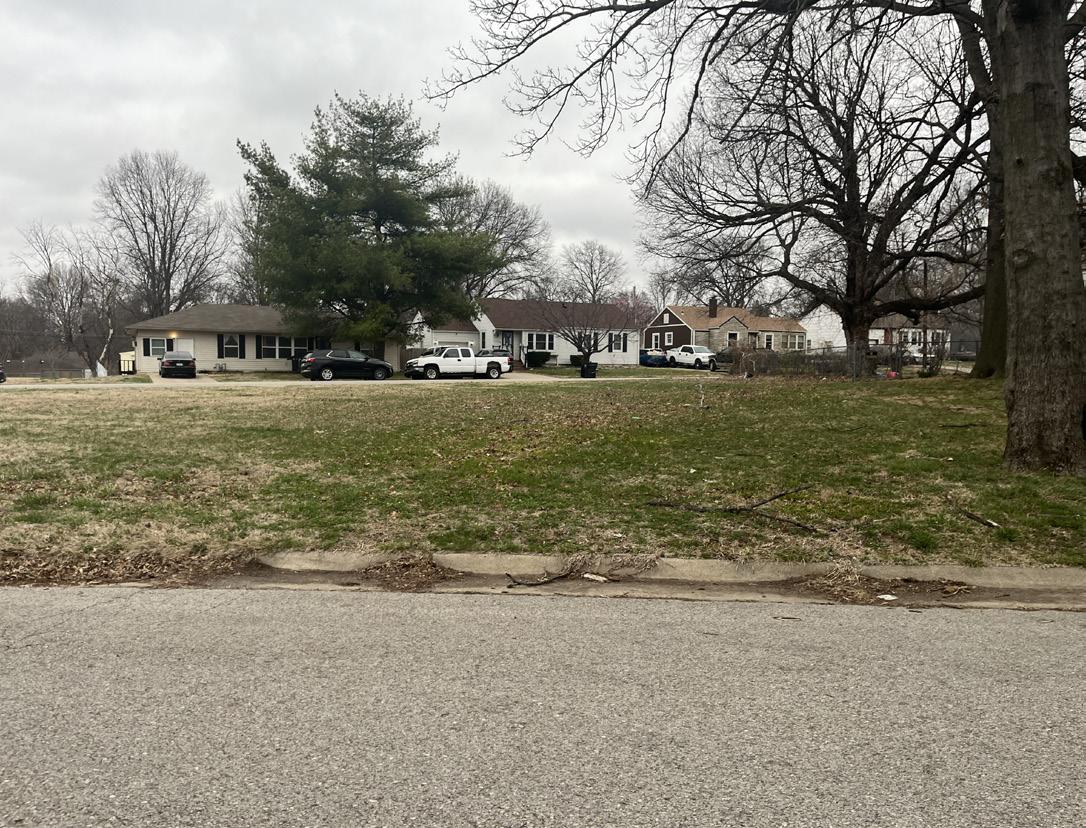
Relationship to the neighborhood.
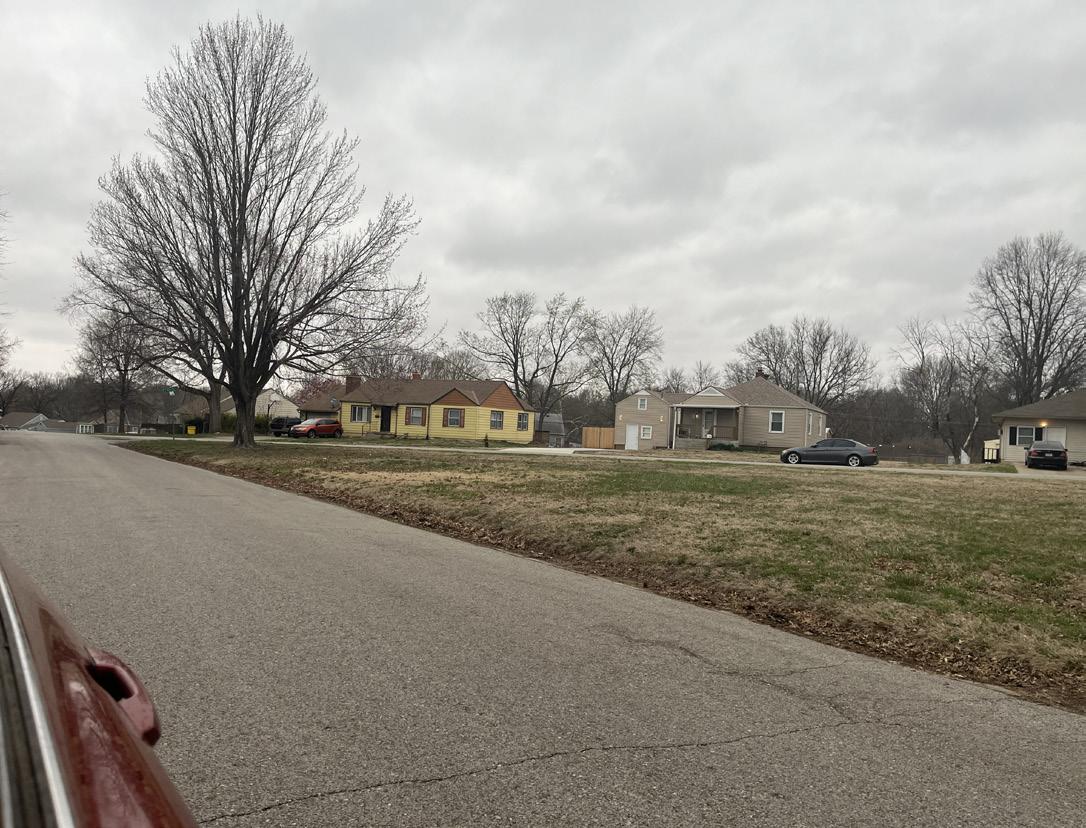
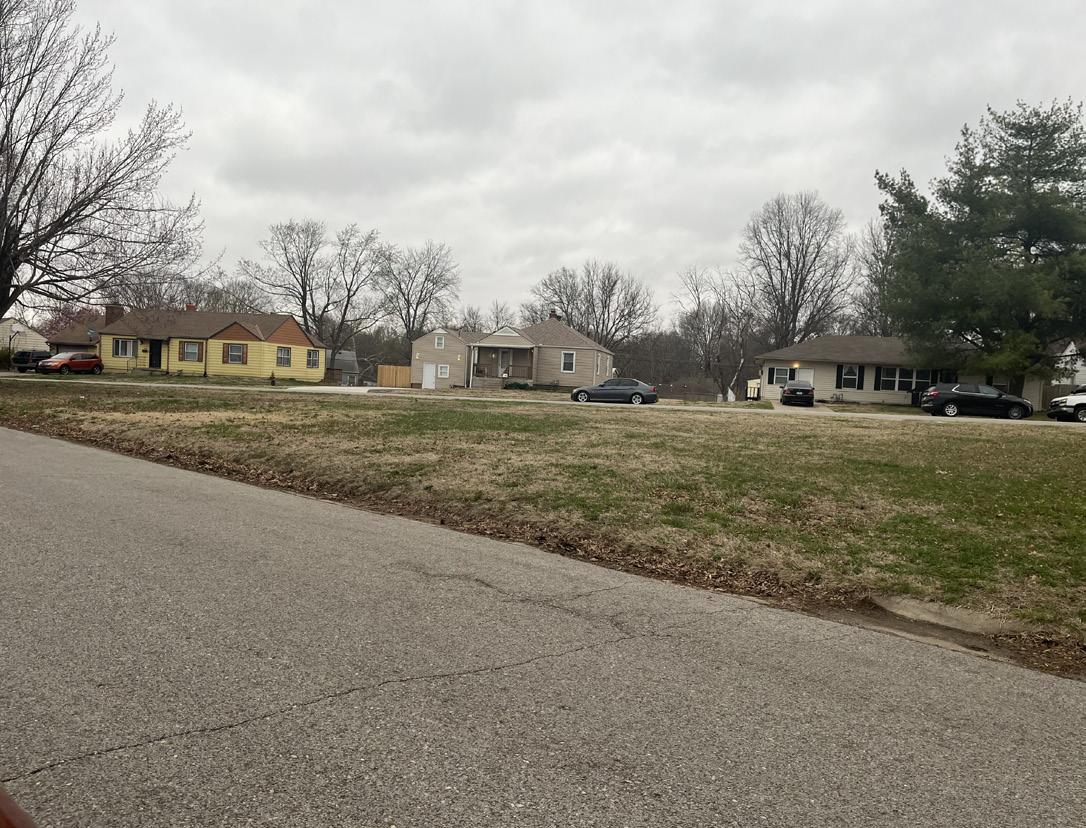
No park amenities.
Name of Site: Hill Park
Date Completed: March, 2025
Completed By: Avery Nichols and Bennet McCoy
2201 S. Maywood Ave., Independence, MO 64052
The site sits on the west side of the city. It is bounded by East 20th St., M-78 Highway, and S Maywood Avenue.
Size: 21.1 acres
Classification: Community Park
3. INVENTORY OF FACILITY AMENITIES AND CONDITIONS:
Picnic Shelters (Fair Condition)
Picnic Tables (Fair Condition)
Playground (Fair Condition)
Signage (Fair Condition)
Walking Path (Poor Condition)
Skate Park (Poor Condition)
Grills (Poor Condition) Restroom (Fair Condition)
4. STRENGTHS AND OPPORTUNITIES:
Strengths: Hill Park has unique character with the steep rocky cliff that creates two distinct spaces connected by the old stone stairway. The amenities are in fair condition with signage and trails.
Opportunities: There is opportunity to upgrade the park equipment and utilize the skate park area for an improved skating facility.
Rating: 2 (Moderate Accessibility)
- The site has parking lots in the southern portion of the site, a smaller parking area near the cemetery, and a parking area near the skate park. The loop trail throughout the site creates access to amenities.
Active/Passive: Passive
7. PHOTO INVENTORY:
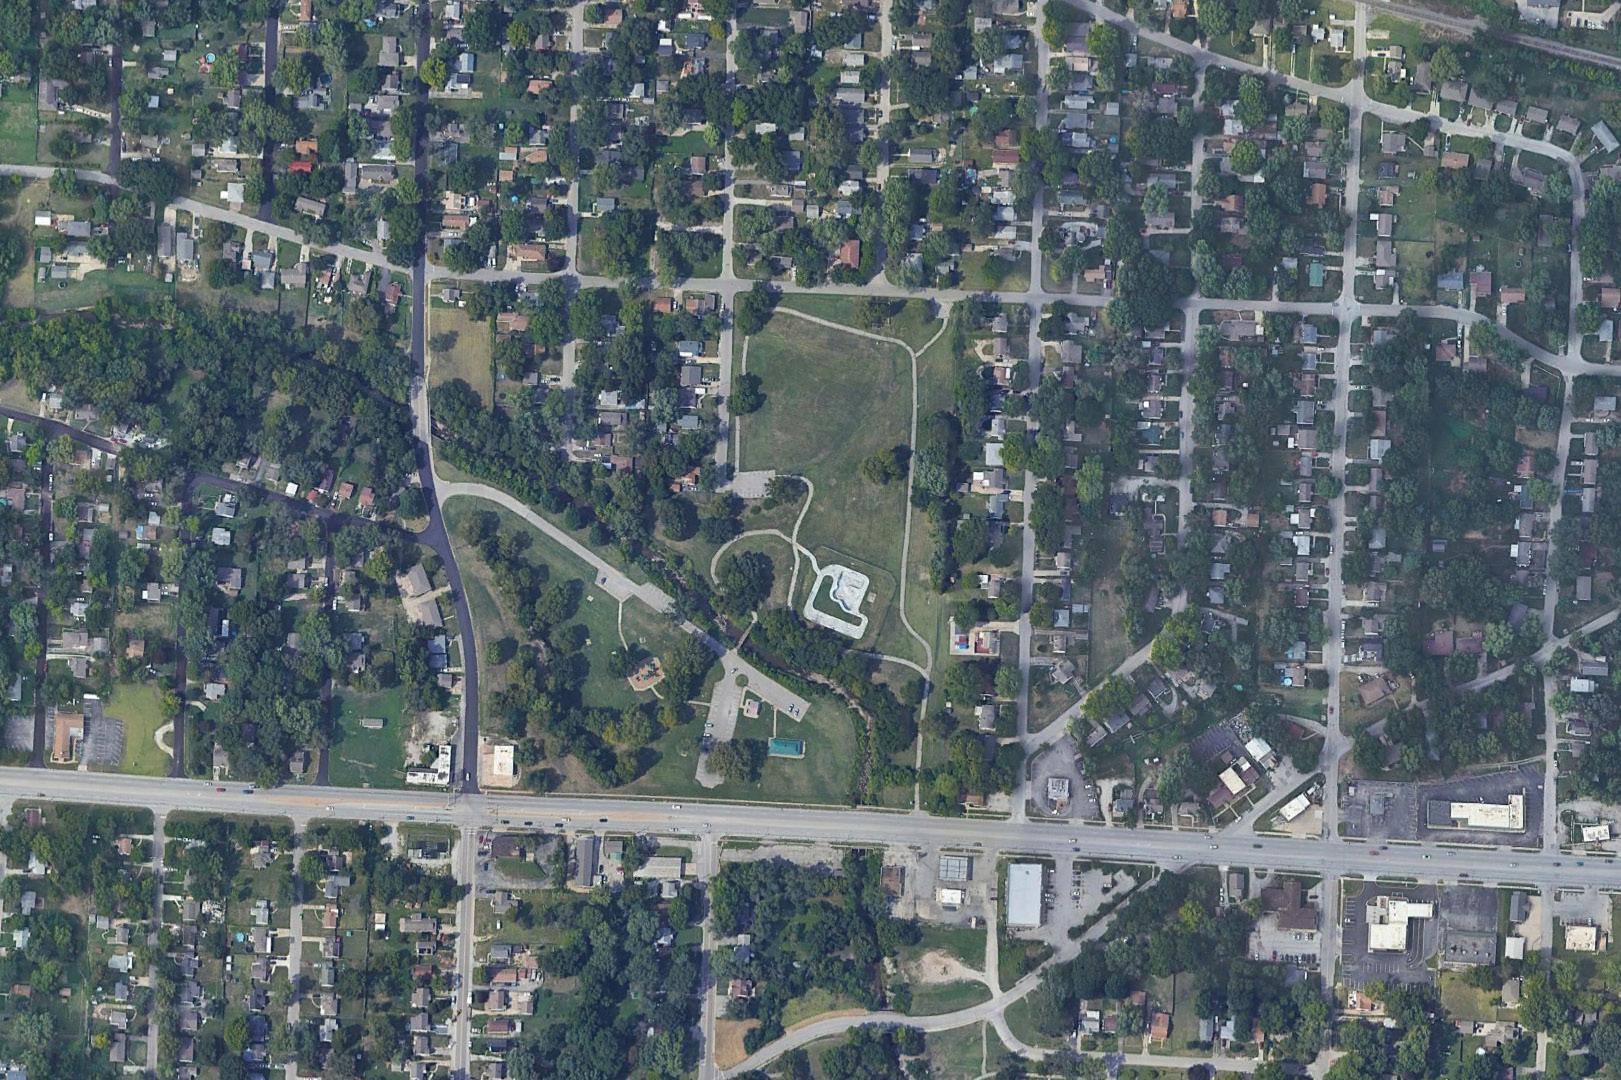
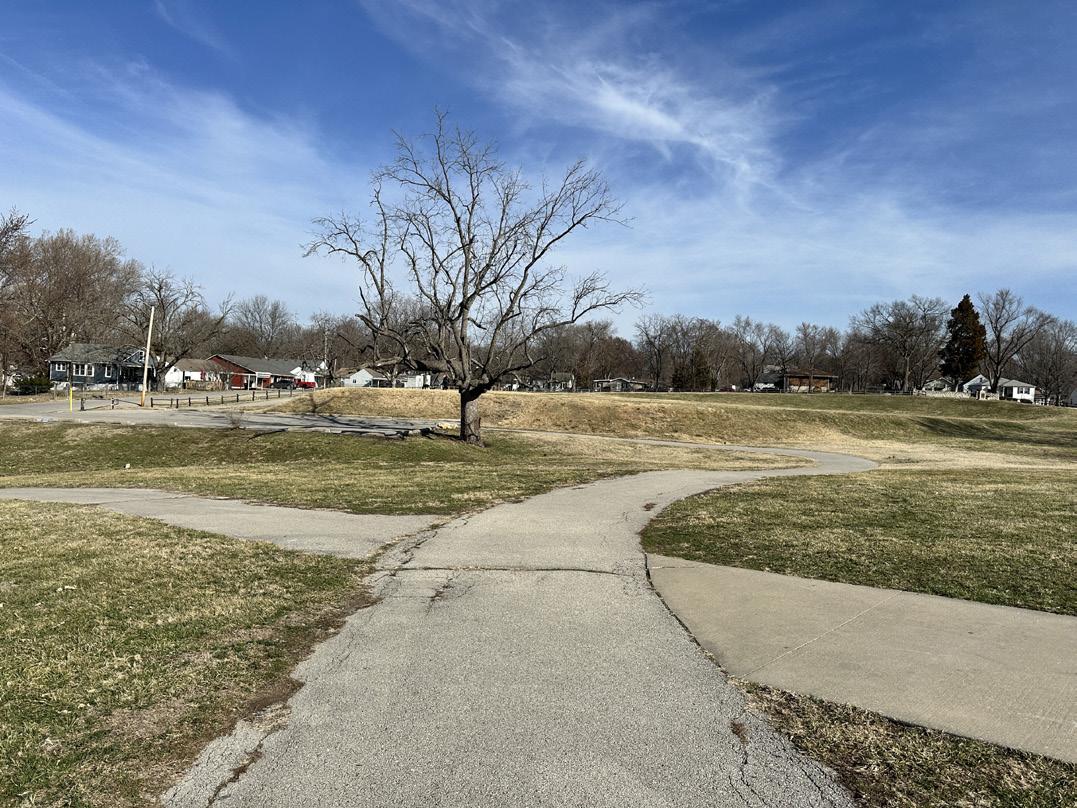
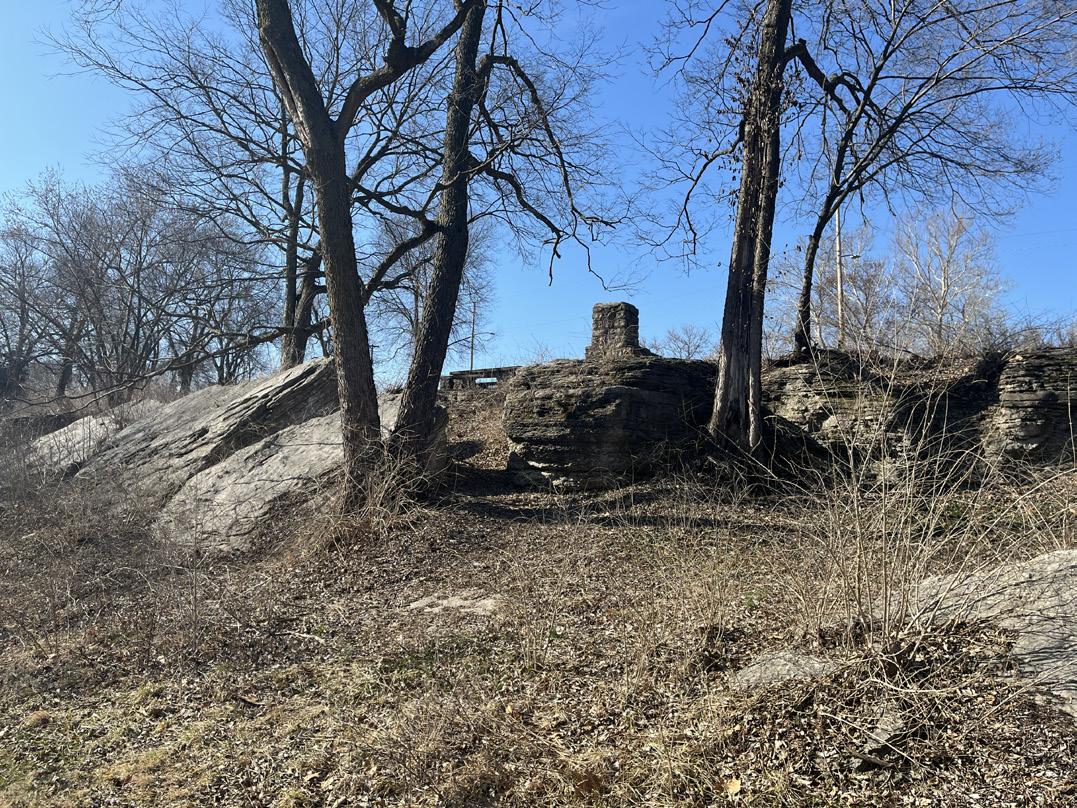
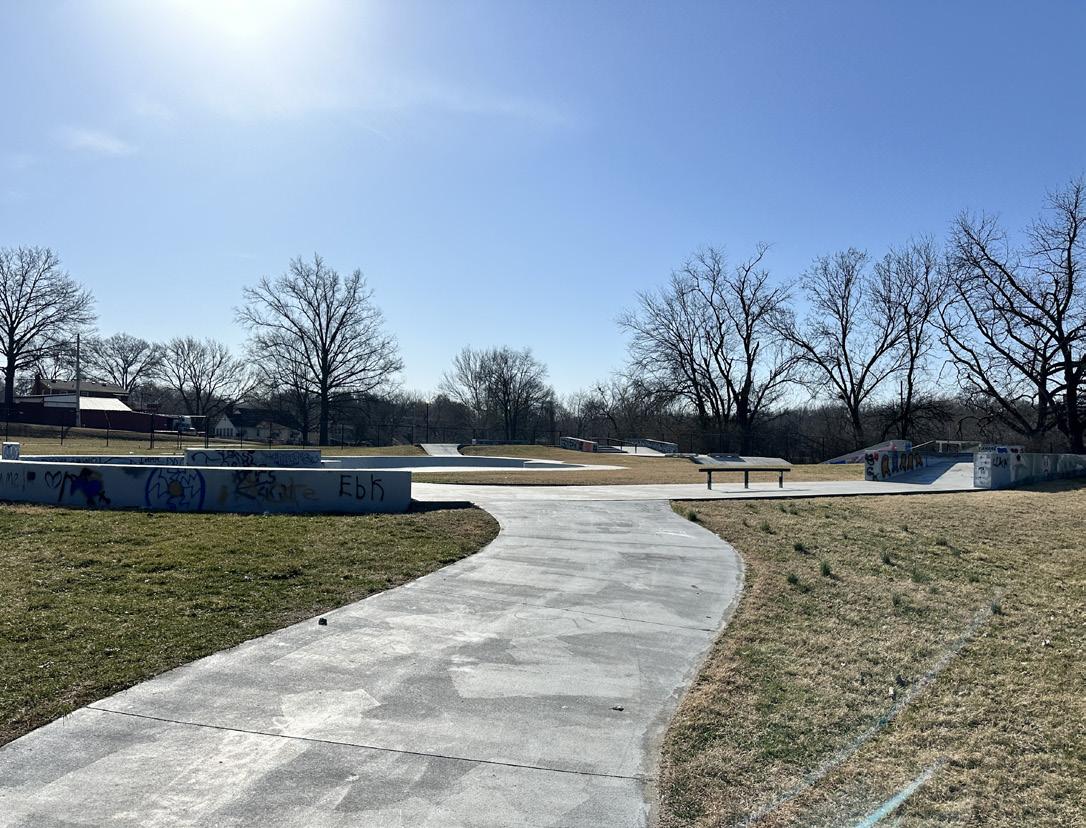
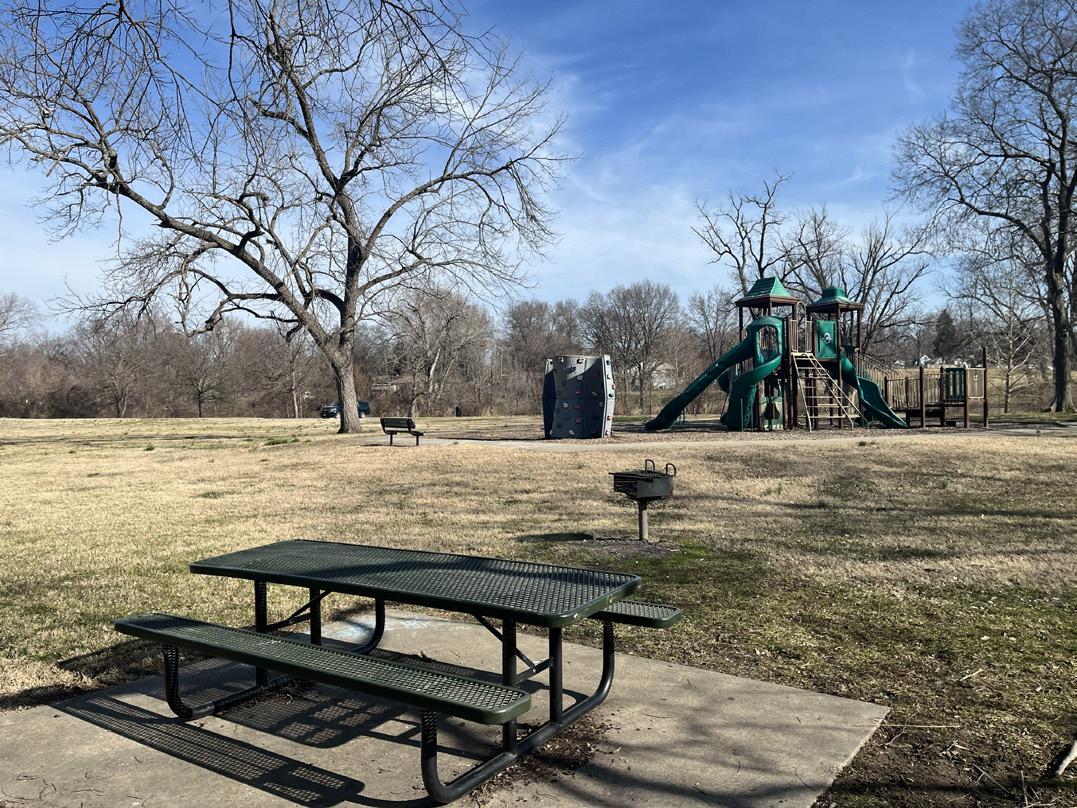
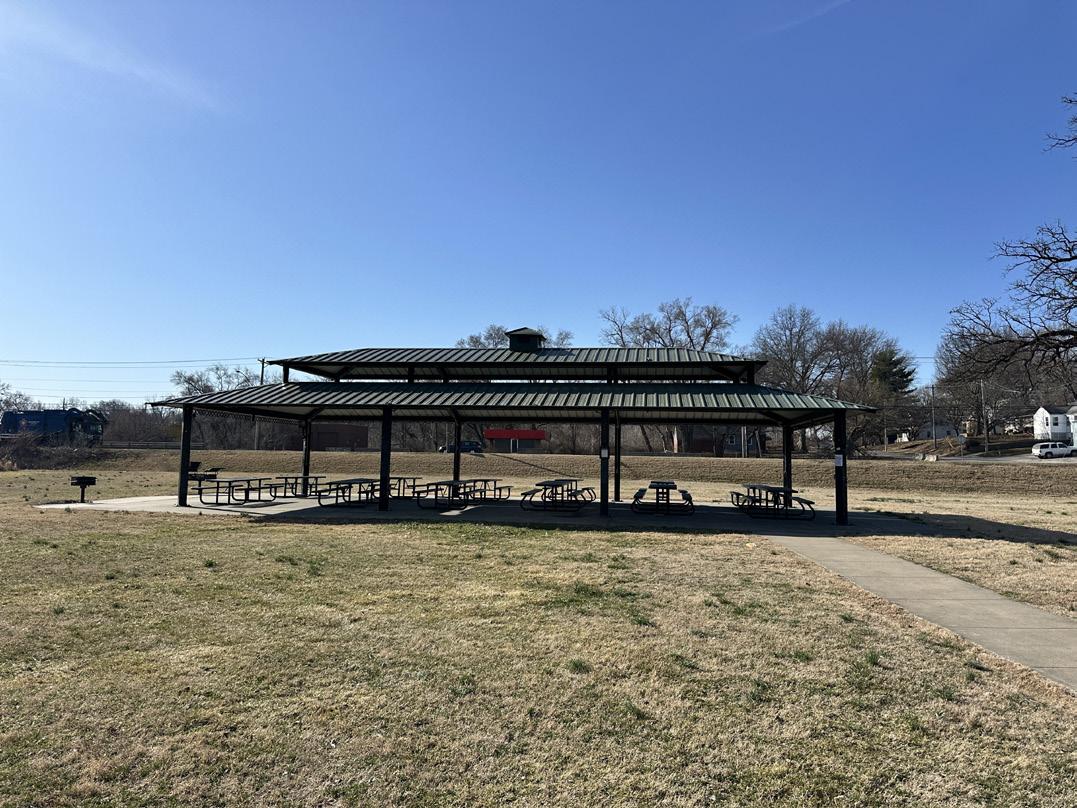
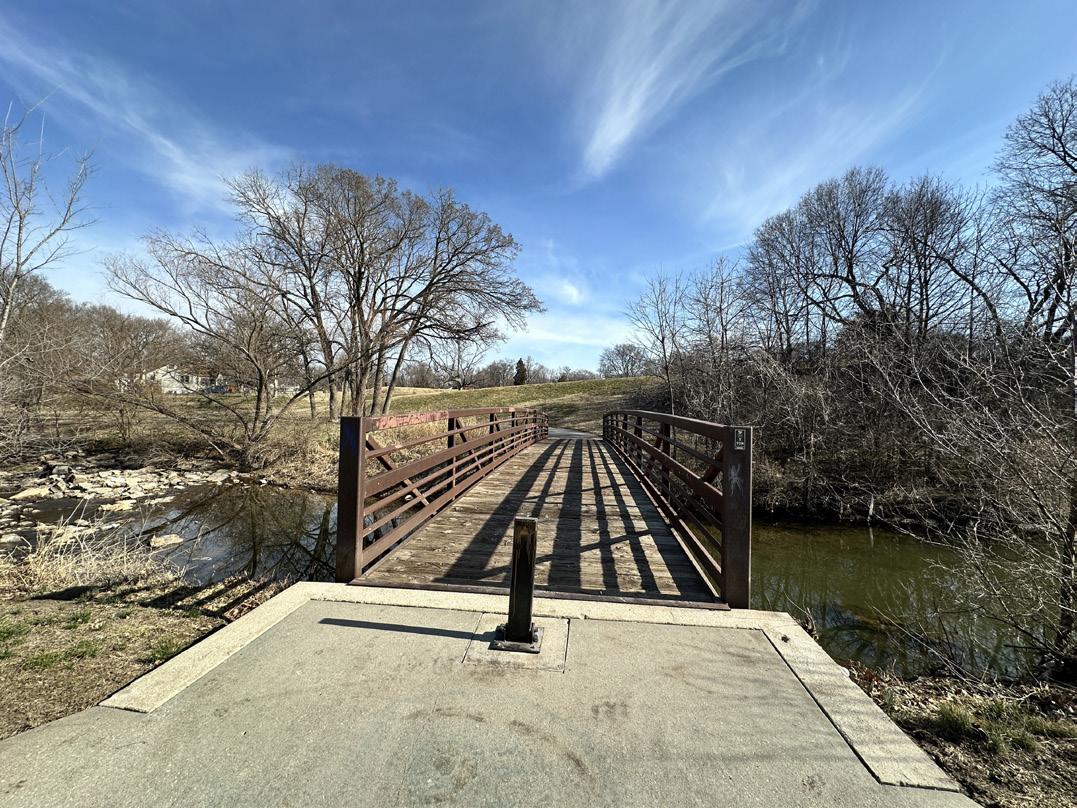
Name of Site: Hiram Young Park
Date Completed: March, 2025
Completed By: Avery Nichols and Bennet McCoy
215 E. Lexington Ave, Independence, MO 64050
This park is located in downtown Independence and sits along Noland Road.
Size: 1.4 acres
Classification: Neighborhood Park
Benches (Fair Condition)
Signage (Good Condition)
Walking Path (Fair Condition)
Strengths: This is a nice use of park space near downtown for passive use and a loop trail for circulation.
Opportunities: There is a need to improve seating opportunities for pedestrians along the trail. Additional opportunities for interpretative signage or monuments exists allowing for more usage of the park.
Rating:
2 (Moderate Accessibility)
- The site has on street parking for access, with a loop trail around the park and seating.
Active/Passive: Passive
7. PHOTO INVENTORY:
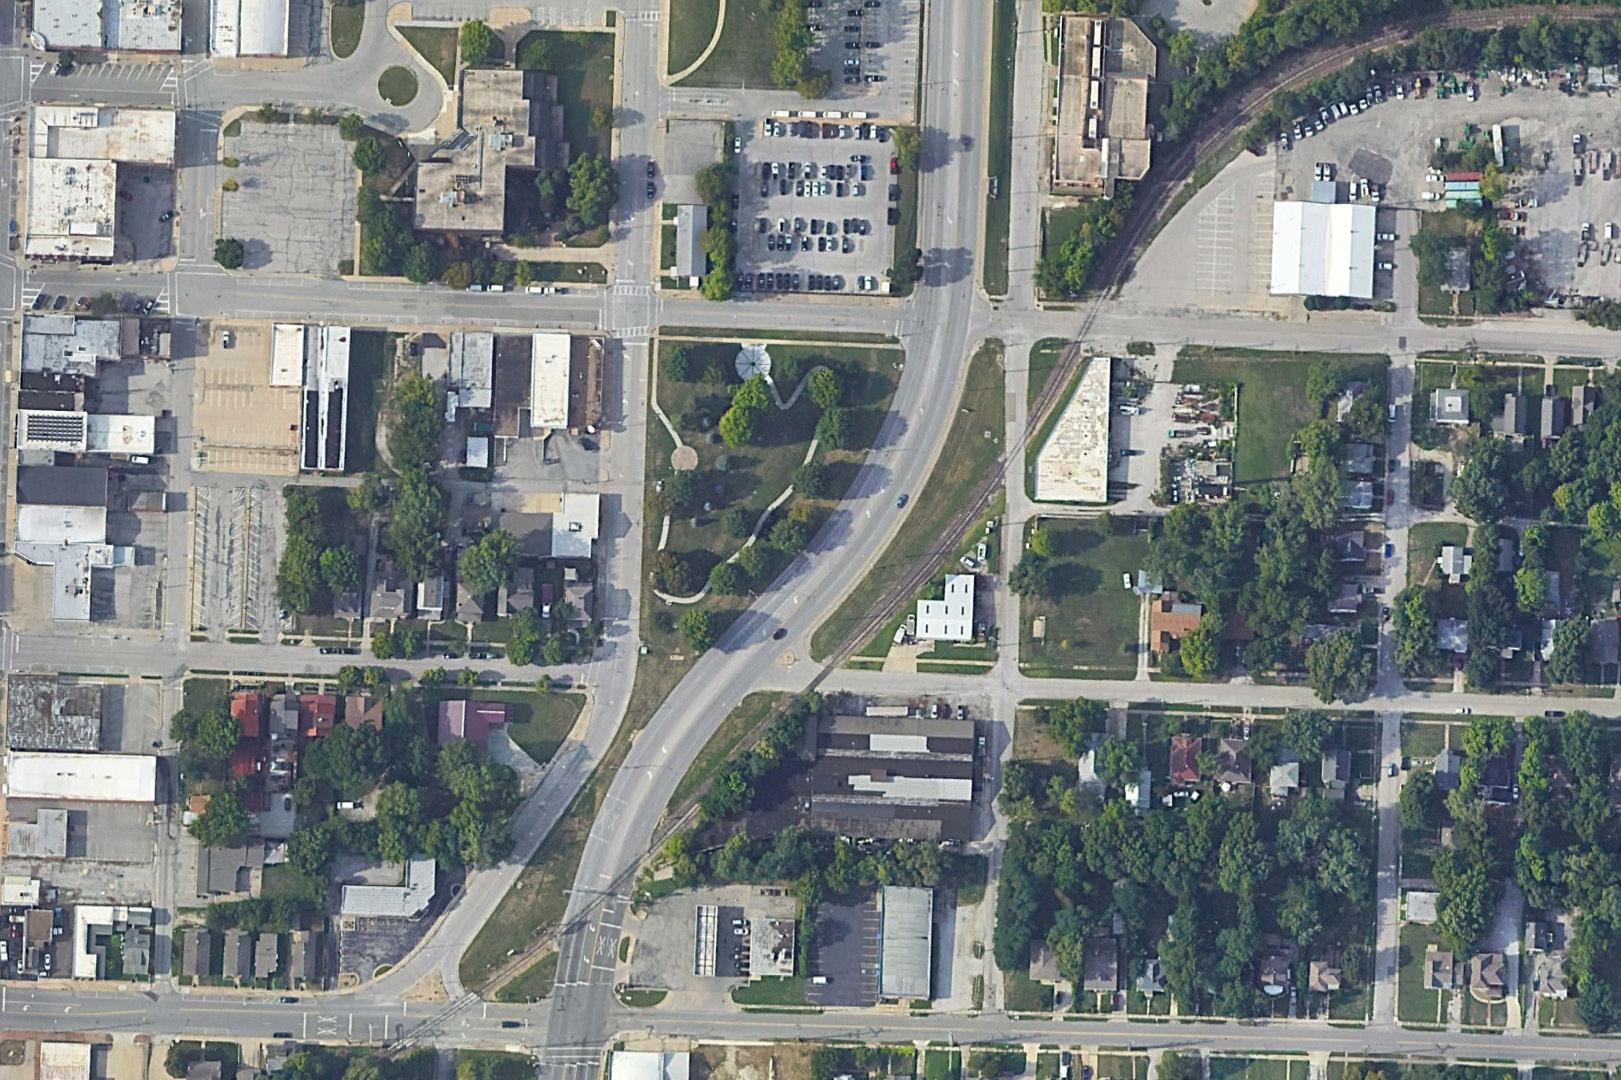
Un-programmed space.
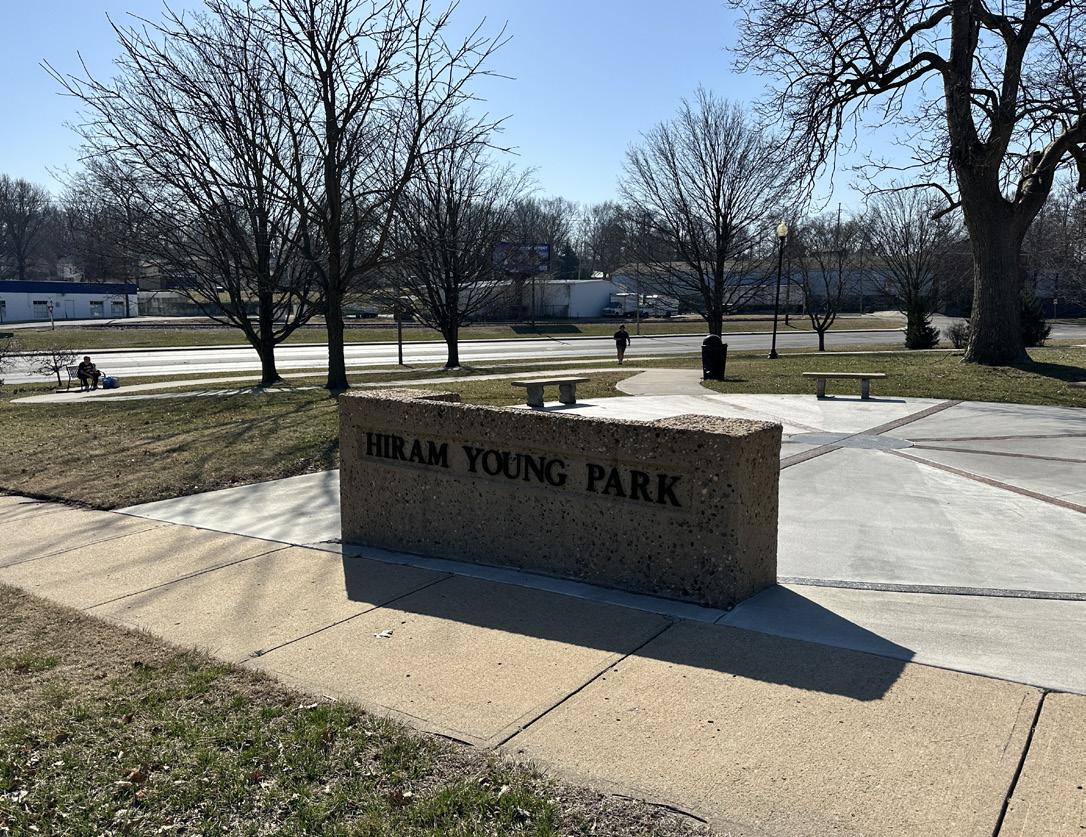
Park signage.
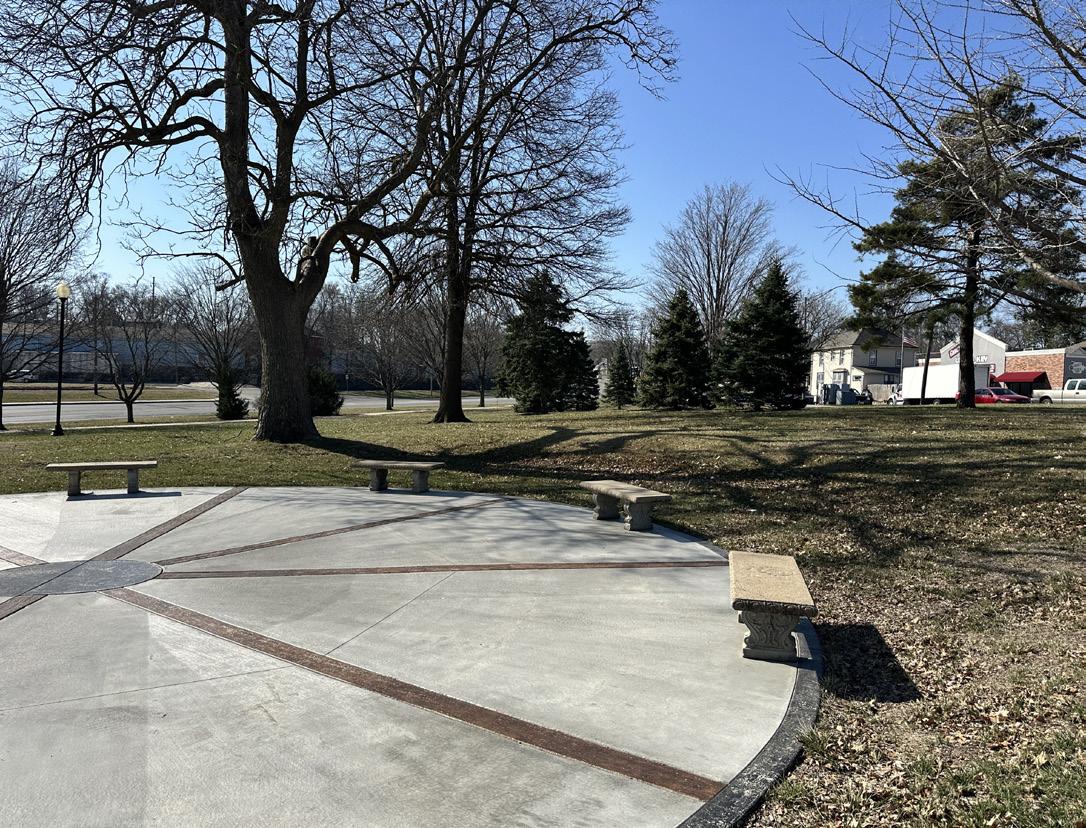
Plaza space with stone benches.
Name of Site: Independence Athletic Complex
Date Completed: March, 2025
Completed By: Avery Nichols and Bennet McCoy
17800 E Salisbury Rd, Independence, MO 64056
The site sits north of the center of the city along Salisbury Rd.
Size: 165 acres
Classification: Regional Park
3. INVENTORY OF FACILITY AMENITIES AND CONDITIONS:
Picnic Shelters (Fair Condition)
Picnic Tables (Fair Condition)
Playgrounds (Fair Condition)
Restrooms (Fair Condition)
Signage (Fair Condition)
Walking Path (Fair Condition)
Soccer Fields (Fair Condition)
4.
Baseball Fields (Fair Condition)
Multipurpose field (Fair Condition)
Softball Fields (Fair Condition)
Football Field (Fair Condition)
Grills (Fair Condition)
Concession Stand (Fair Condition)
Football Fields (4) (Fair Condition)
Strengths: This site has 8 full size (adult) soccer fields, 2 baseball fields, 3 softball fields, and 4 football fields. With a focus on sports and space for parking it makes for a well rounded athletic complex.
Opportunities: The large site with sports fields has an opportunity to expand parking and field layout for a one sport oriented athletic complex. Additional focus should be given to implementing the long term master plan developed for the park.
Rating: 3 (Moderate Accessibility)
- The site has parking throughout, with access to trails and sidewalks that lead to playing fields. The asphalt parking and trails are lacking some accessible paths from all parts of the park.
Active/Passive: Active
7. PHOTO INVENTORY:
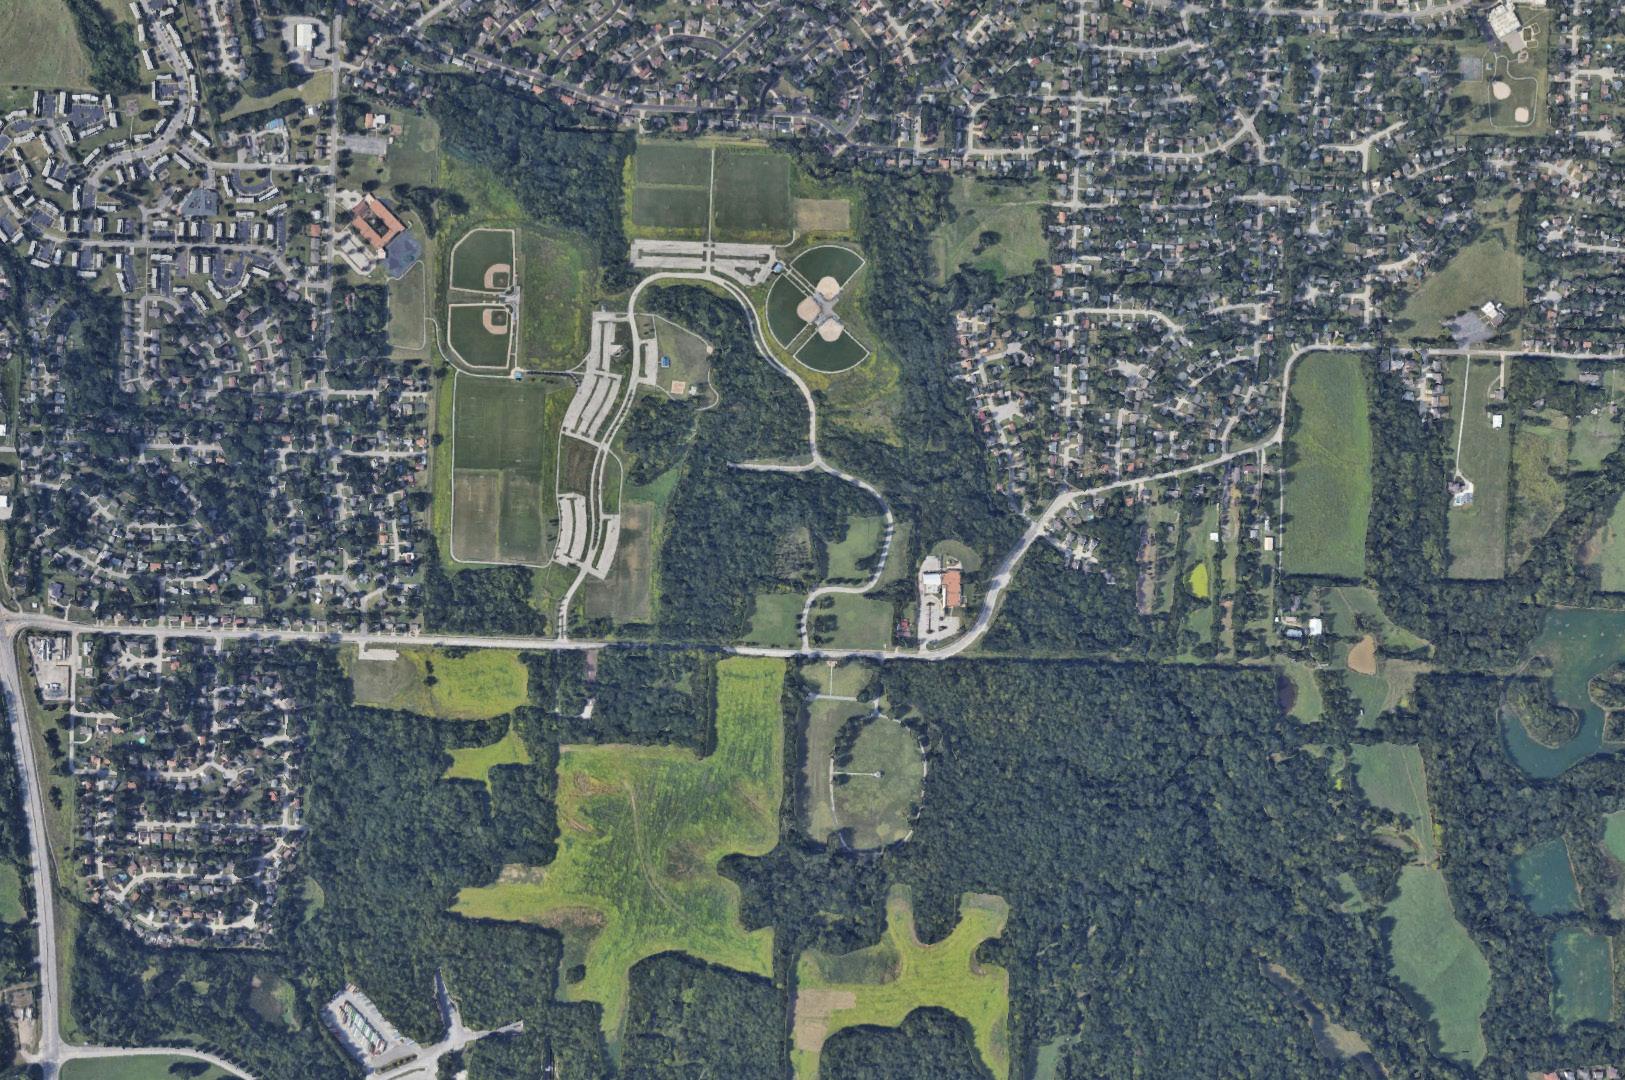
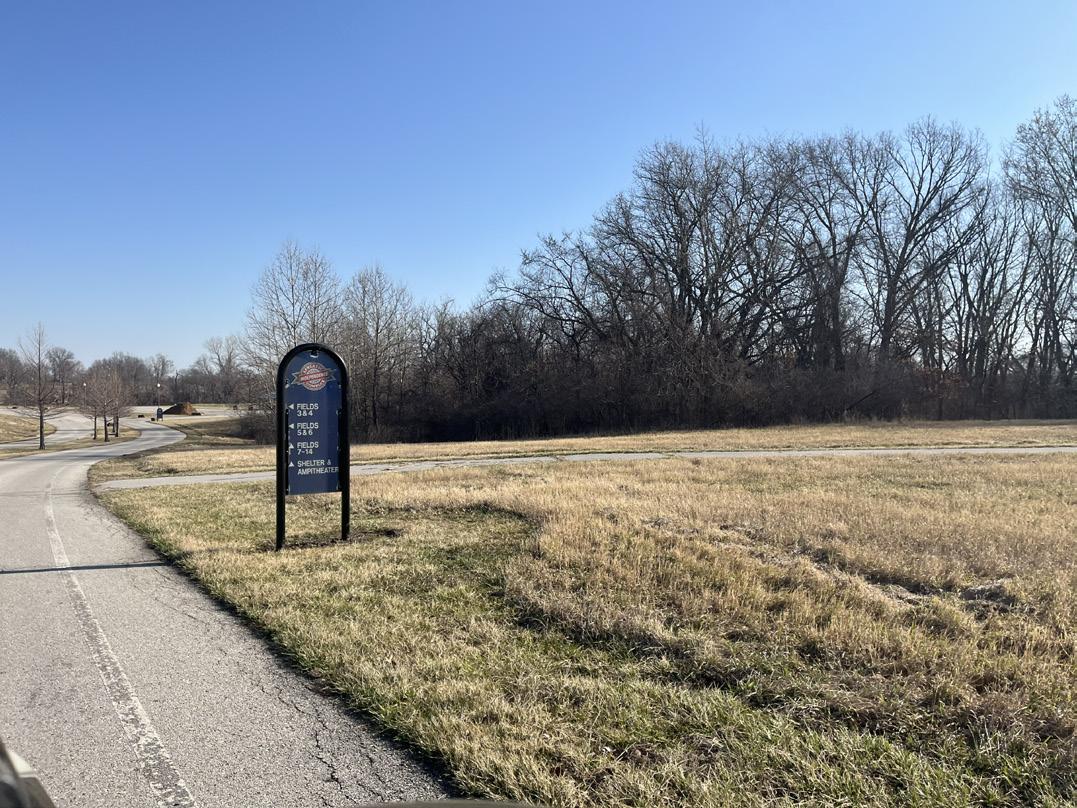
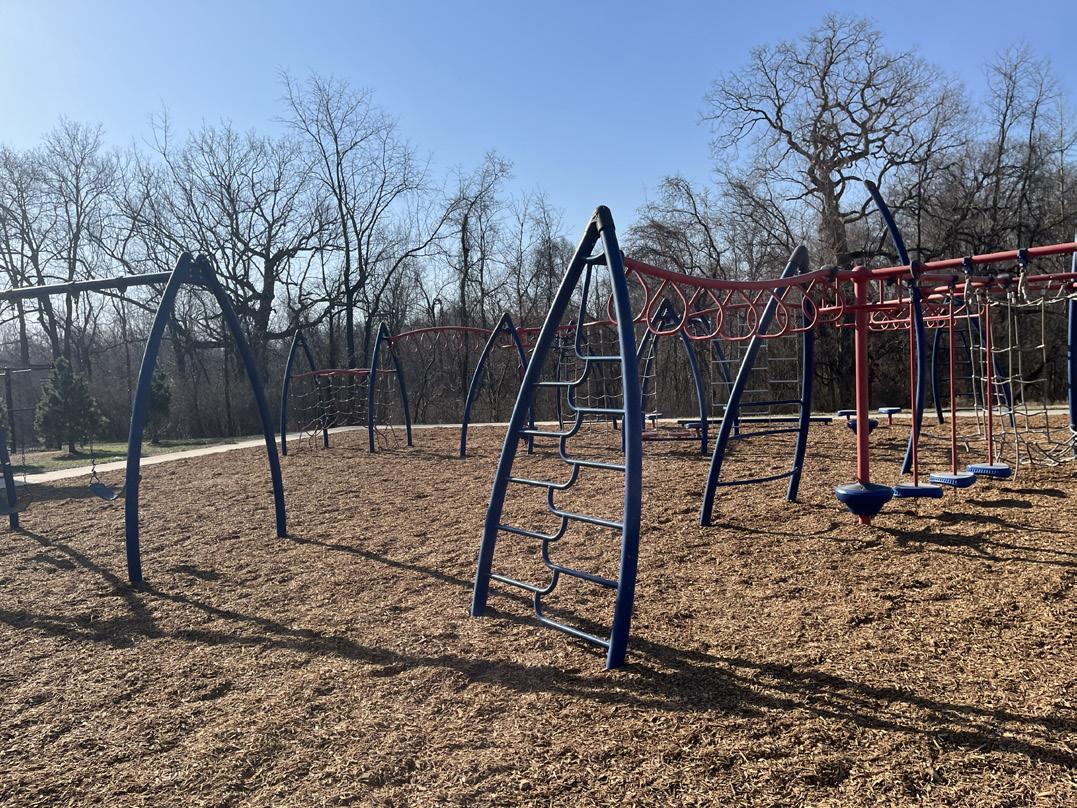
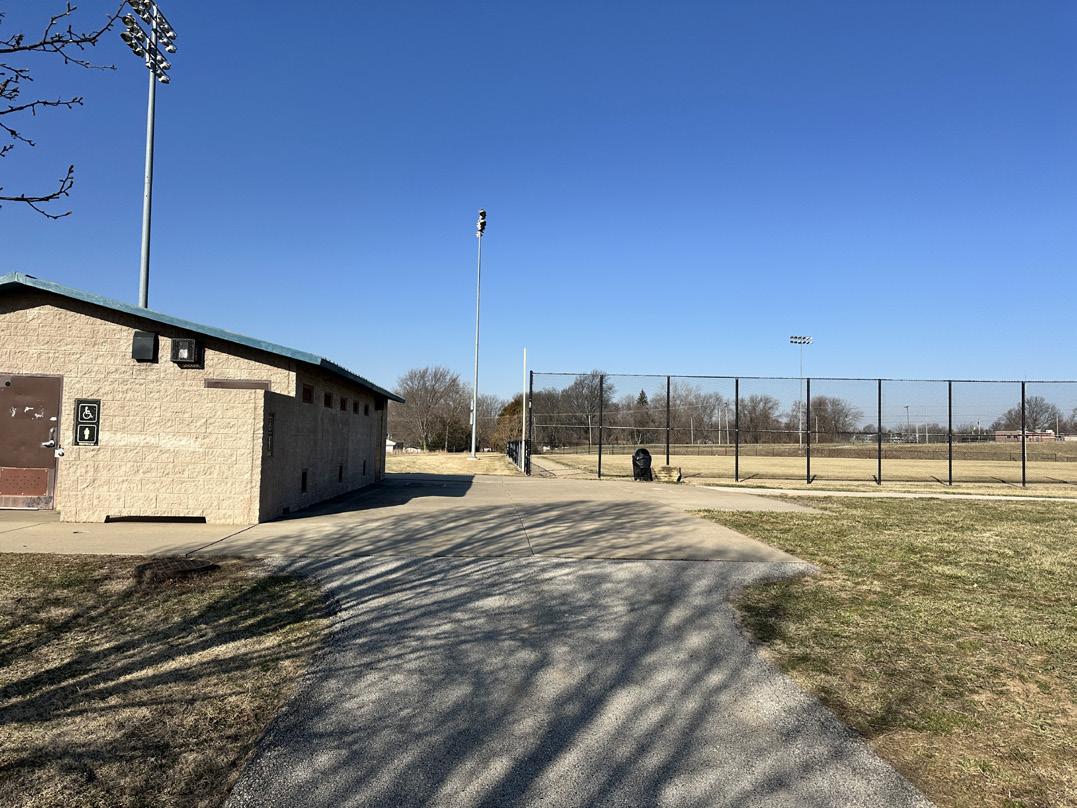
Trails connecting amenities and fields in the
Name of Site: Lipton Conservation Area
Date Completed: March, 2025
Completed By: Avery Nichols and Bennet McCoy
201 W 31st St, Independence, MO 64055
This site is located near Santa Fe Trail Park just off of Noland Road.
Size: 43.2 acres
Classification: Conservation Area
3.
OF FACILITY AMENITIES AND CONDITIONS:
Walking Path (Poor Condition) Signage (Poor Condition)
Strengths: The conservation area has an existing trail network.
Opportunities: The area could use improvements to trail conditions or pedestrian signage/ trail heads. The Conservation Department has made an offer to transfer ownership.
Rating:
4 (Moderate Accessibility)
- The site has a small circle drive for parking with a gravel trail throughout the conservation area with some heavy slopes and erosion conditions making for difficult circulation.
Active/Passive: Passive
7. PHOTO INVENTORY:
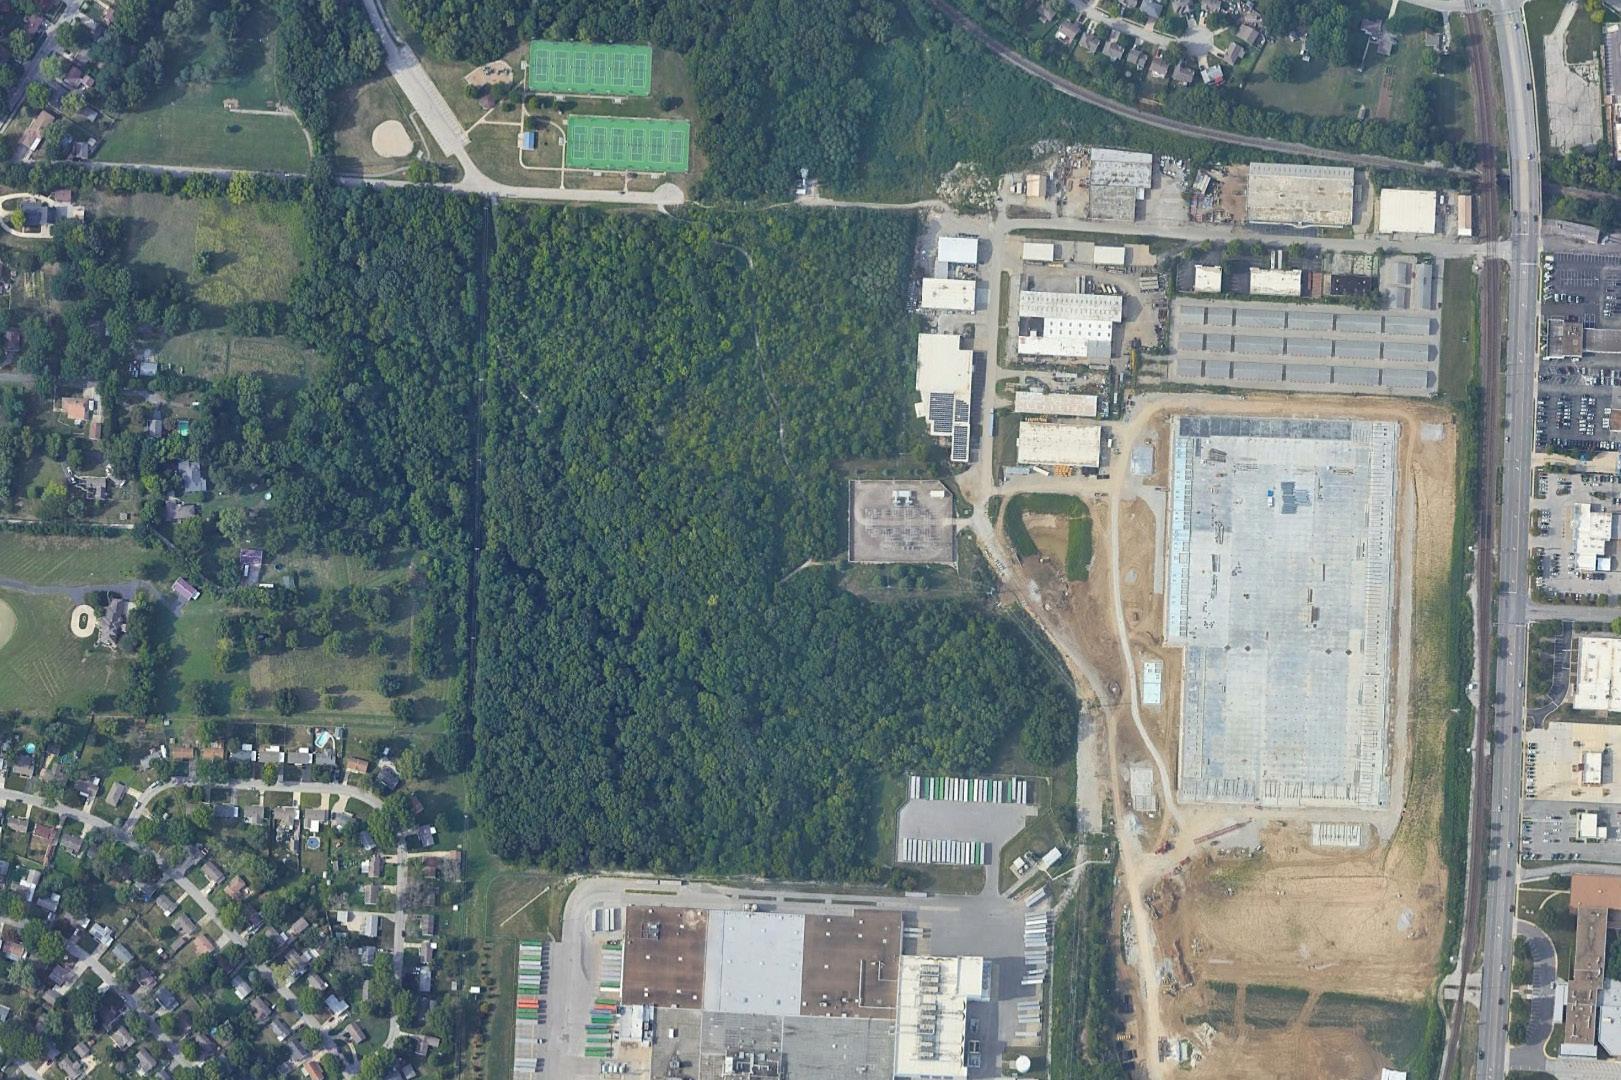
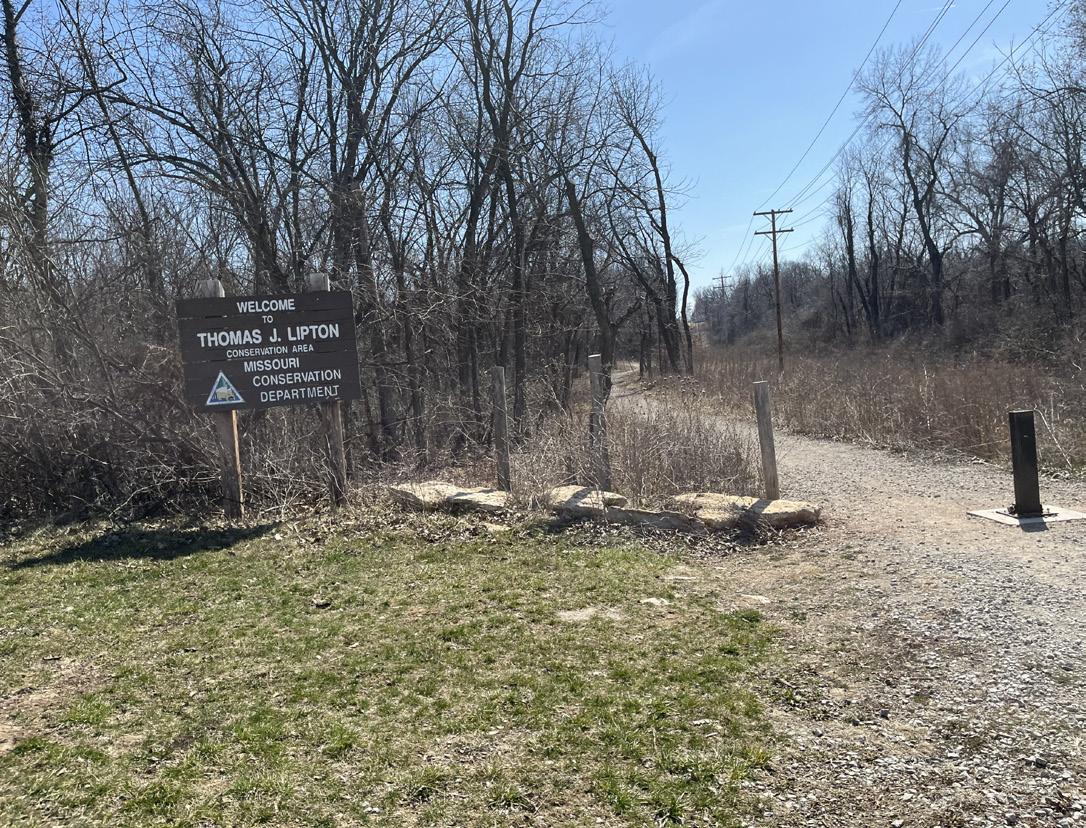
Trail shows signs of erosion in some places and makes for an uneven surface.
Trail lacks signage or markers.
Name of Site: McCoy Park
Date Completed: March, 2025
Completed By: Avery Nichols and Bennet McCoy
800 N Bess Truman Parkway, Independence, MO 64050
The site is located just north of downtown Independence. It is bound by US-24 Highway, N Spring St.; and accessed by W College St. It is bisected by Bess Truman Pkwy and a small drainage channel.
Size: 26 acres
Classification: Regional Park
3.
BBQ Grills (Fair Condition)
Picnic Shelters (Good Condition)
Picnic Tables (Good Condition)
2- (Variety KC) Inclusive Playgrounds (Good Condition)
1- Play-field (Good Condition)
Restrooms (Fair Condition)
Signage (Fair Condition)
4.
Walking Path (Fair Condition)
Grills (Fair Condition)
Splash Pad (Poor Condition)
Pickleball/Tennis Courts (Fair Condition)
Horseshoes (Fair Condition)
Strengths: McCoy Park has amenities that are well maintained; most programming is already well established in the form of playgrounds, sport courts, a splash pad, and horseshoe pits.
Opportunities: There is an opportunity to improve the quality of drives and parking lots as some lack proper parking stripes and curbs. Additional focus should be given on the splash pad upgrades and improvements.
Rating: 1 (High Accessibility)
- The site has parking lots that lead to accessible sidewalks and trails that lead to all park amenities all of which are universally accessible for park users.
Active/Passive: Passive
7. PHOTO INVENTORY:
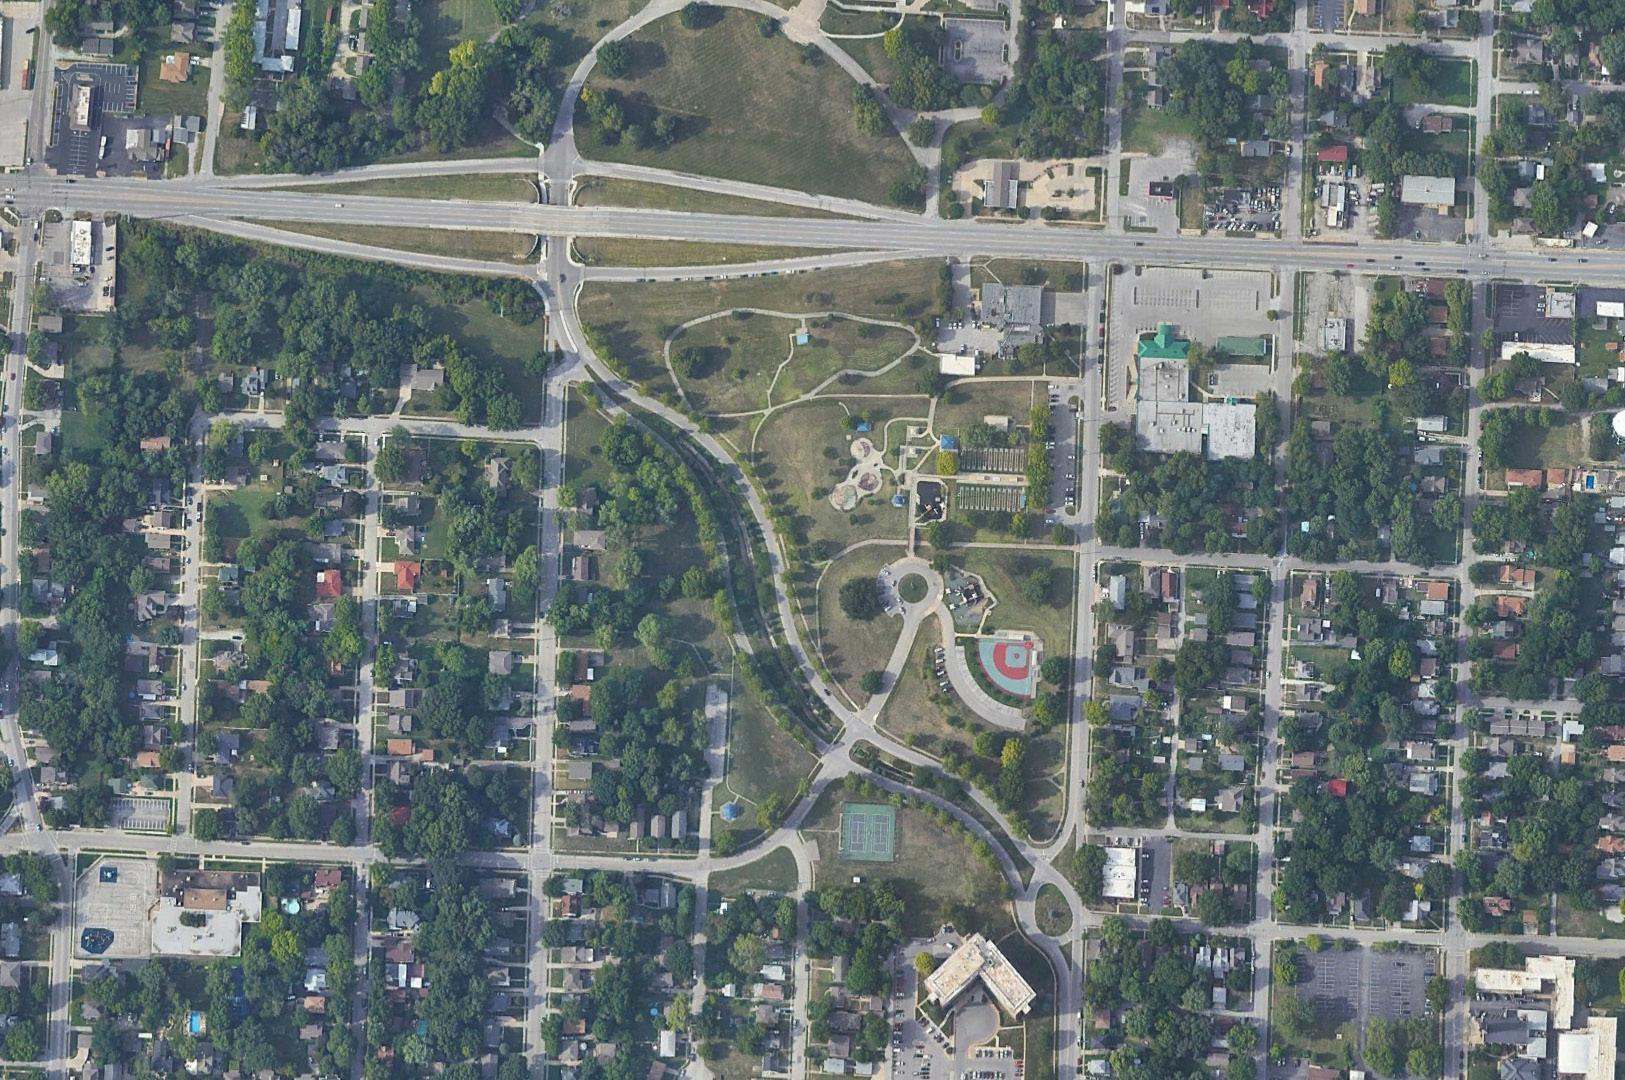
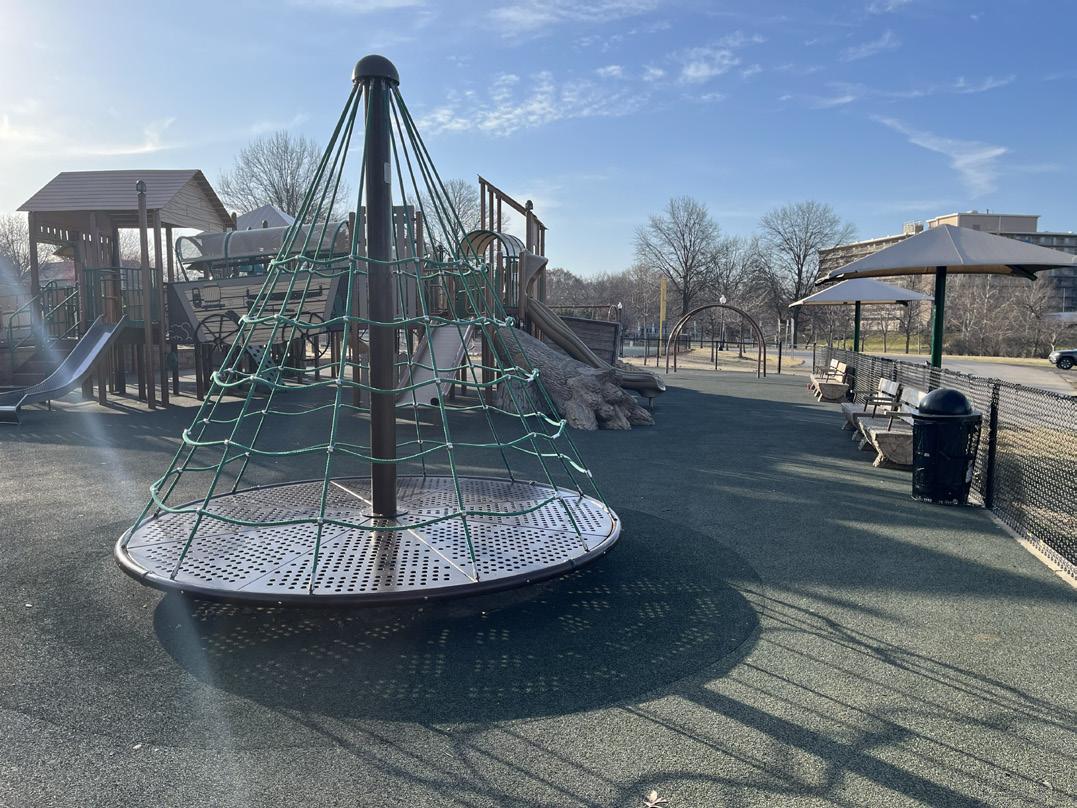
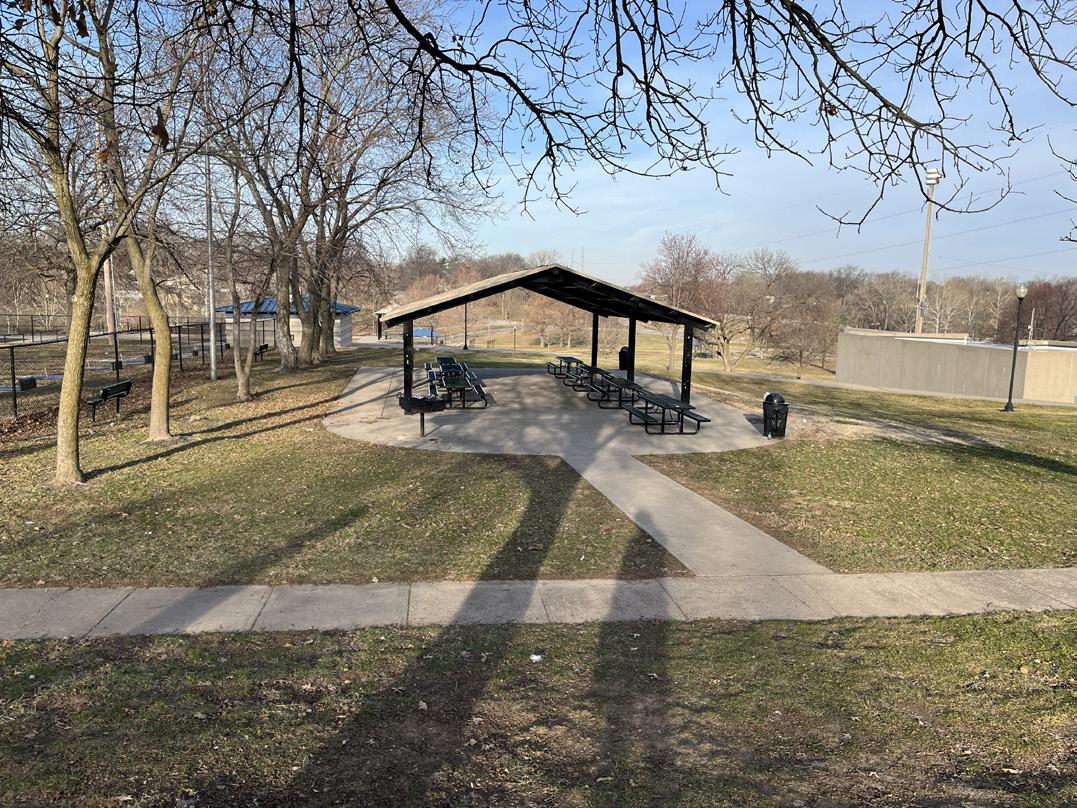
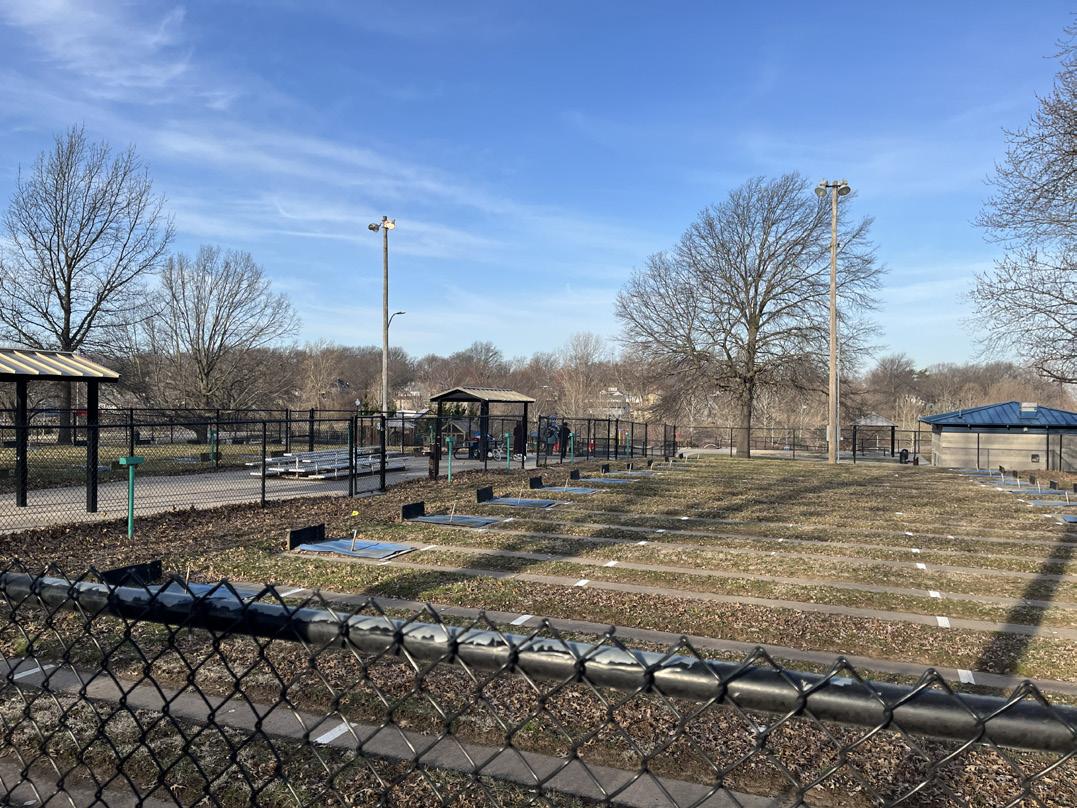
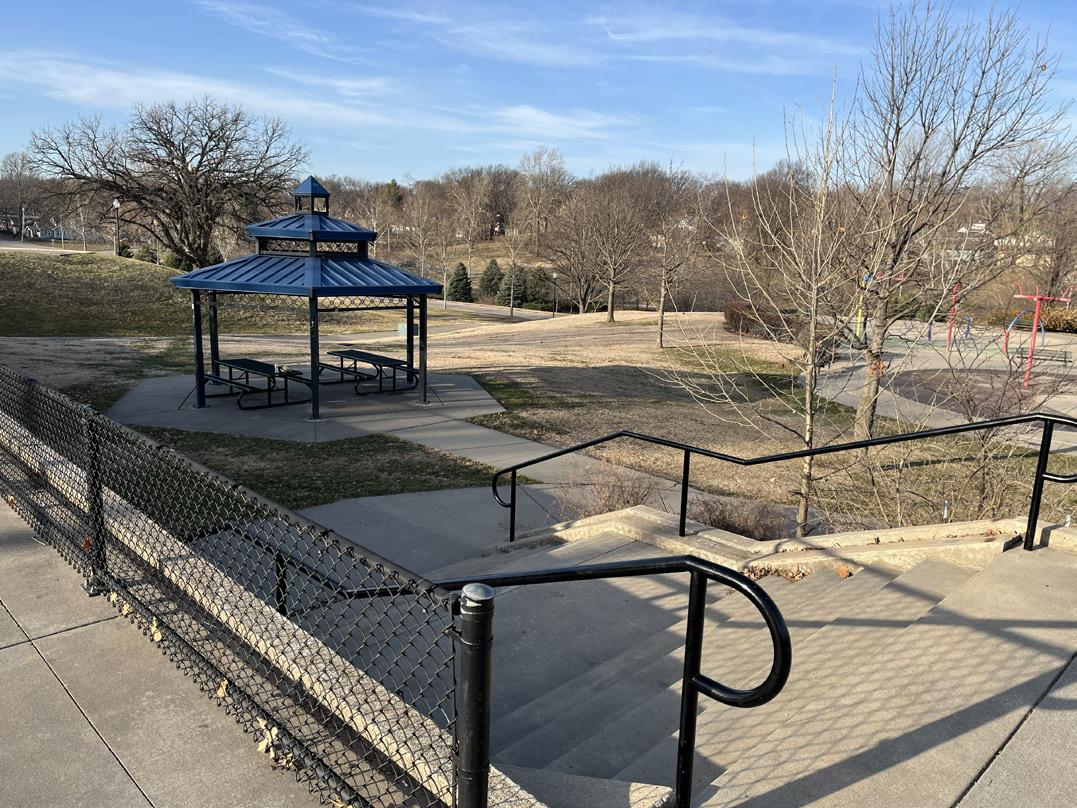
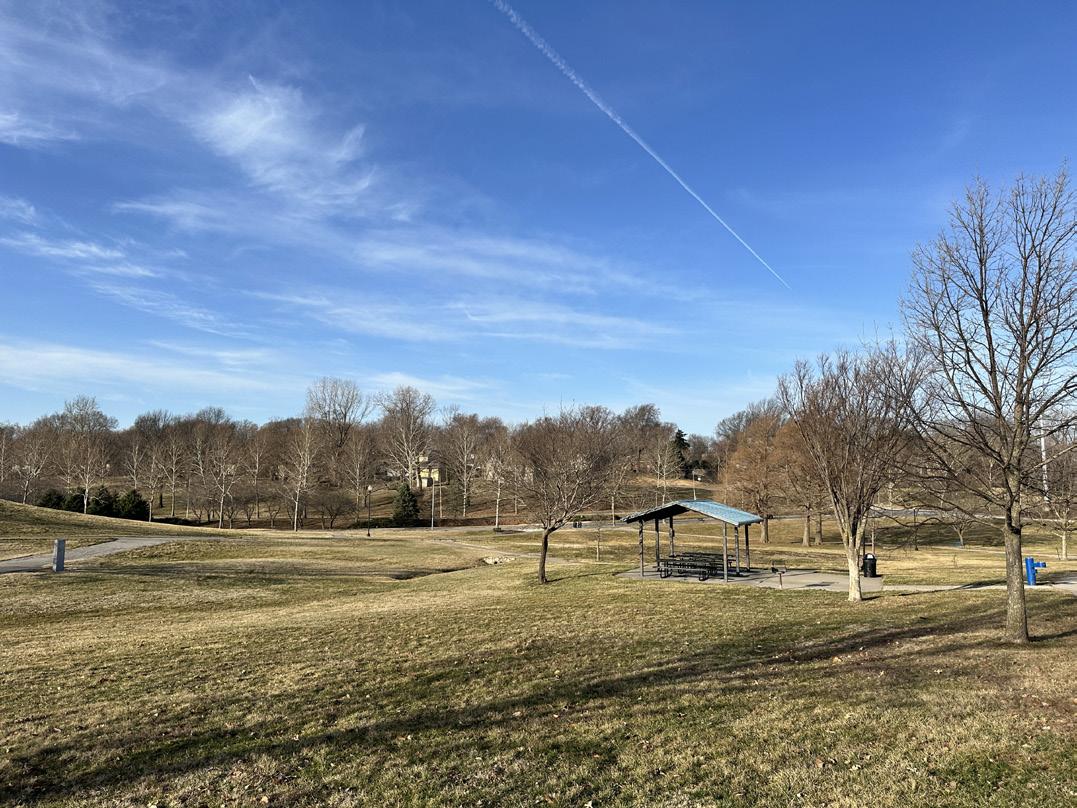
Primary lawn area for open use.
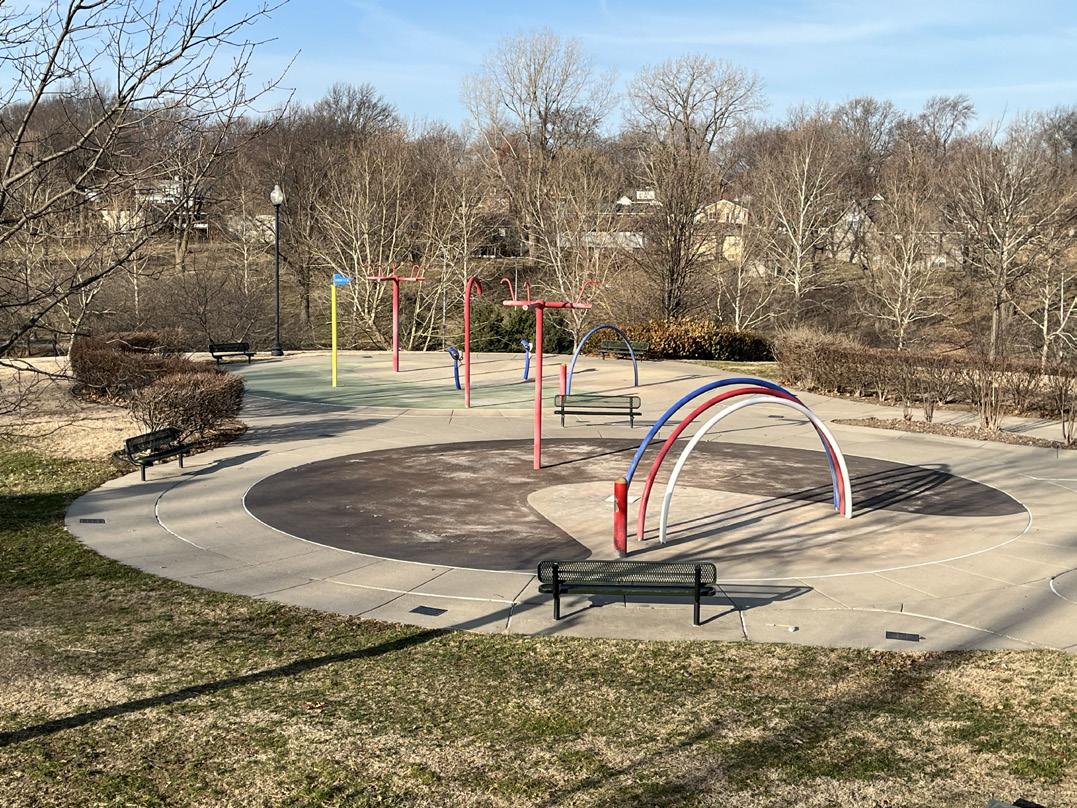
Splash pad area.
Name of Site: Mill Creek Park
Date Completed: March, 2025
Completed
By:
Avery Nichols and Bennet McCoy
1717 N River Blvd, Independence, MO 64050
The site sits in the NW portion of the Independence city limit. It is bounded by W Jones St. and Kemper Ave.; it is bisected by Mill Creek Dr.
Size: 44.9 acres
Classification: Regional Park
Baseball fields (Fair Condition)
BBQ Grills (Fair Condition)
Picnic Shelters (Fair Condition)
Picnic Tables (Fair Condition)
Playgrounds (Fair Condition)
Restrooms (Fair Condition)
Signage (Fair Condition)
Walking Path (Poor Condition)
Tennis Courts (Fair Condition)
Concessions Stand (Fair Condition)
Strengths: Mill Creek Park has multiple sport fields that are well maintained with parking and play opportunities.
Opportunities: There are opportunities to improve connectivity of walkways and pedestrian signage. Other improvements can focus on playground equipment and surfacing, making these more accessible to users.
Rating: 3 (Moderate Accessibility)
- The site has parking lots and sidewalks that lead to some of the park amenities. Not all areas of the park are connected by trail or have universal access.
Active/Passive: Passive
7. PHOTO INVENTORY:
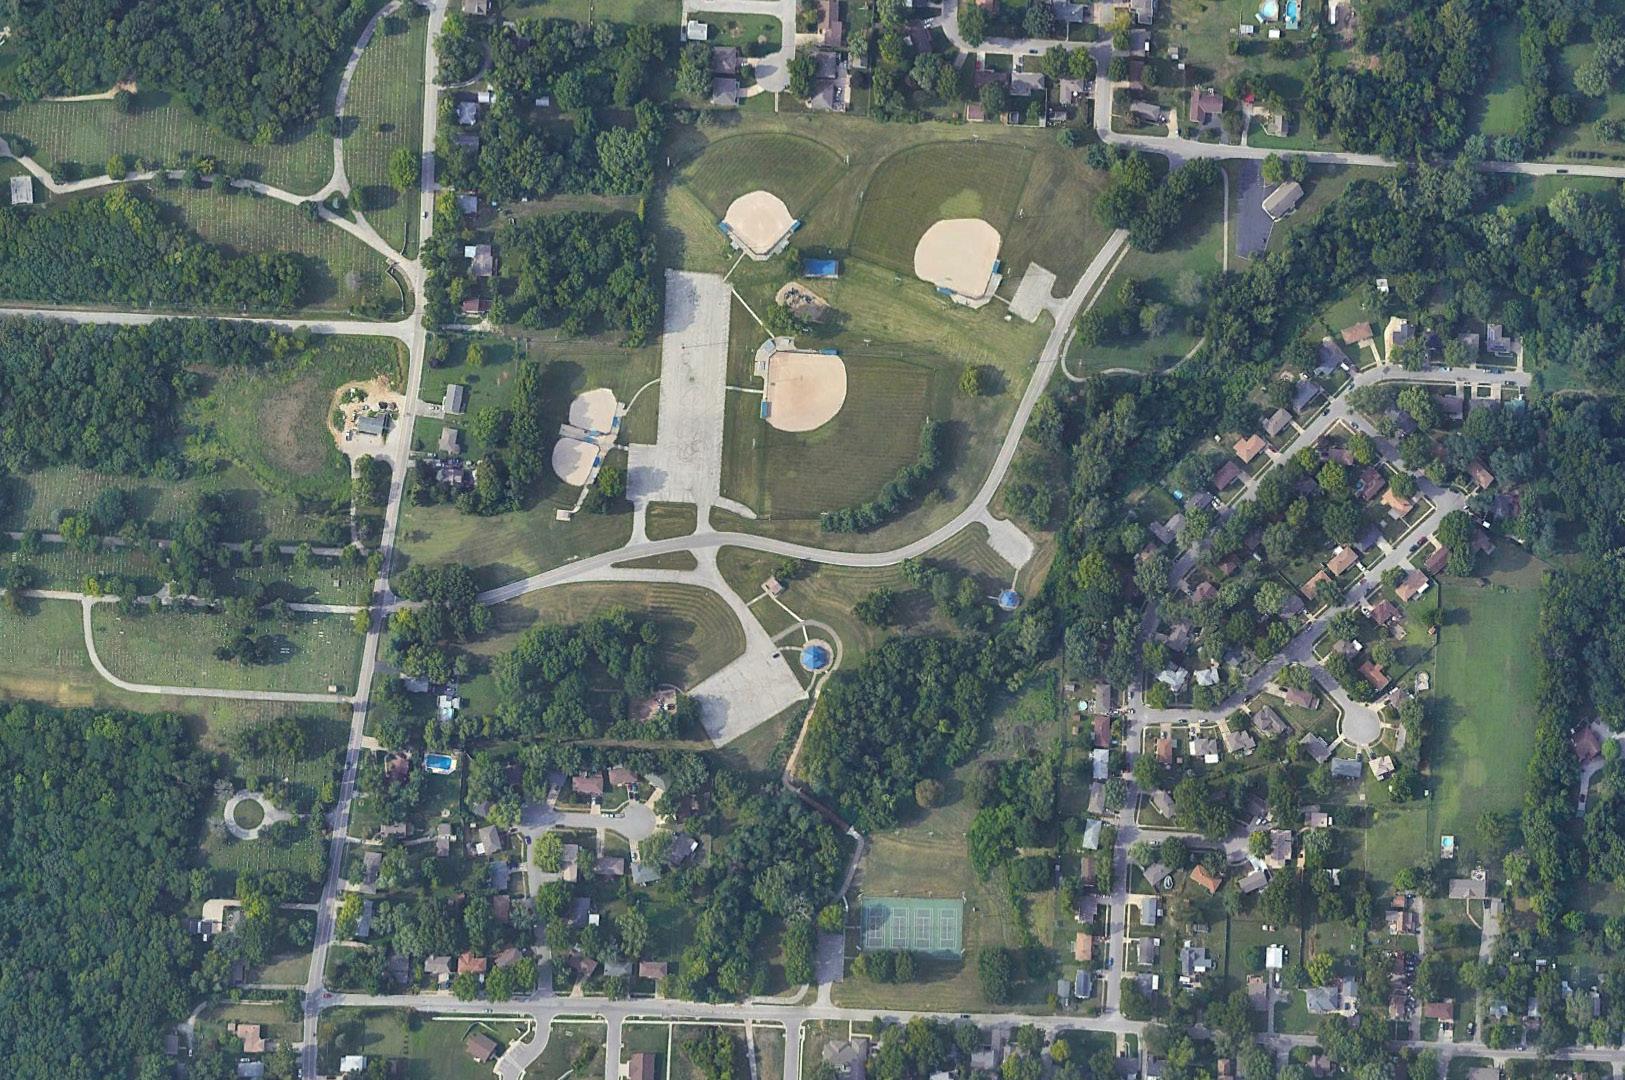
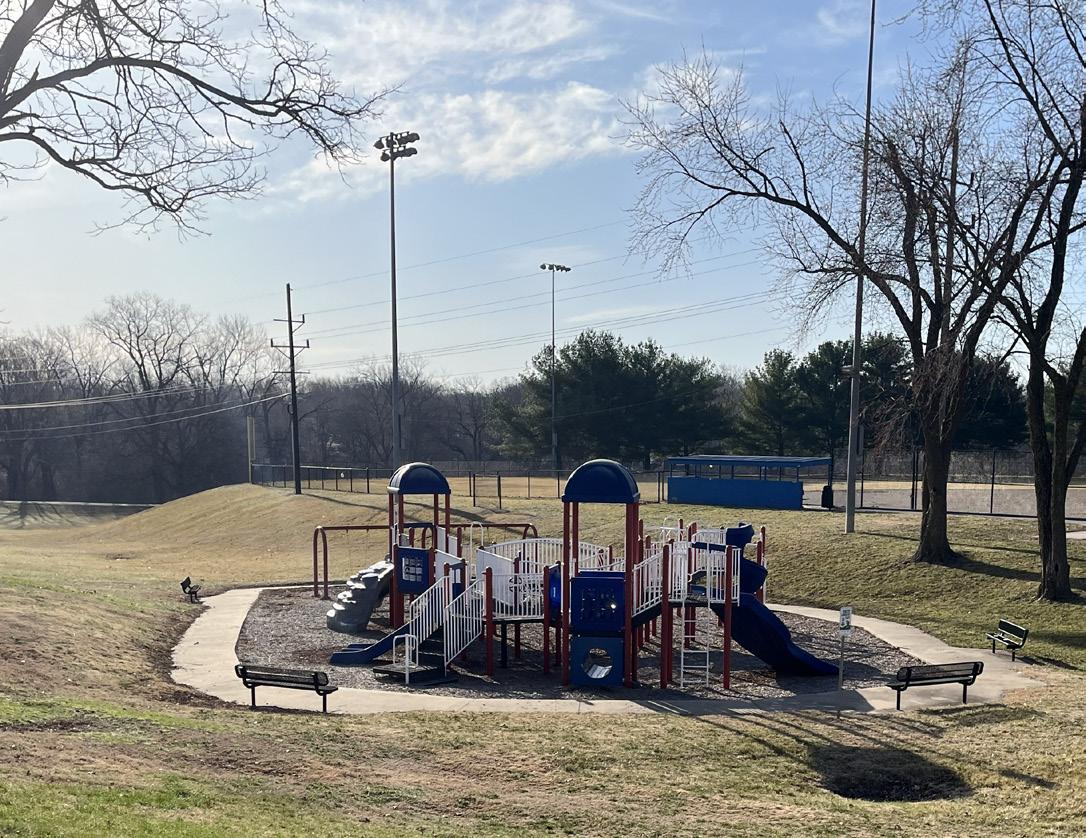
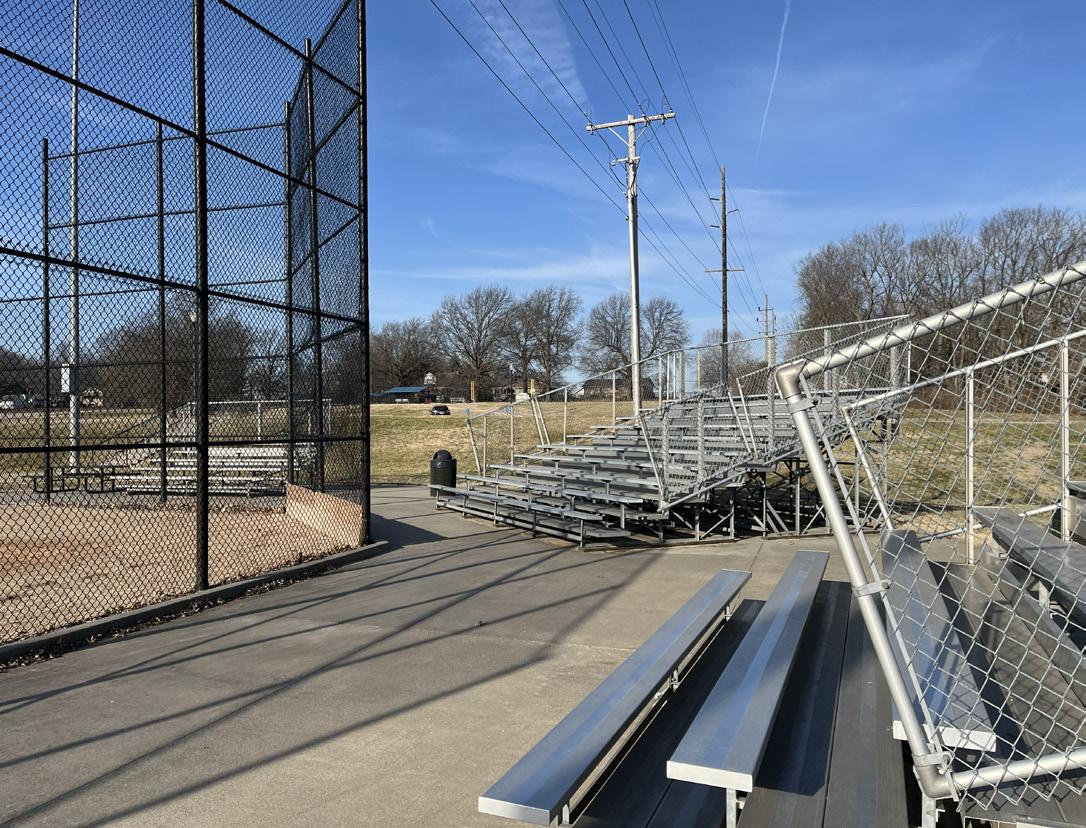
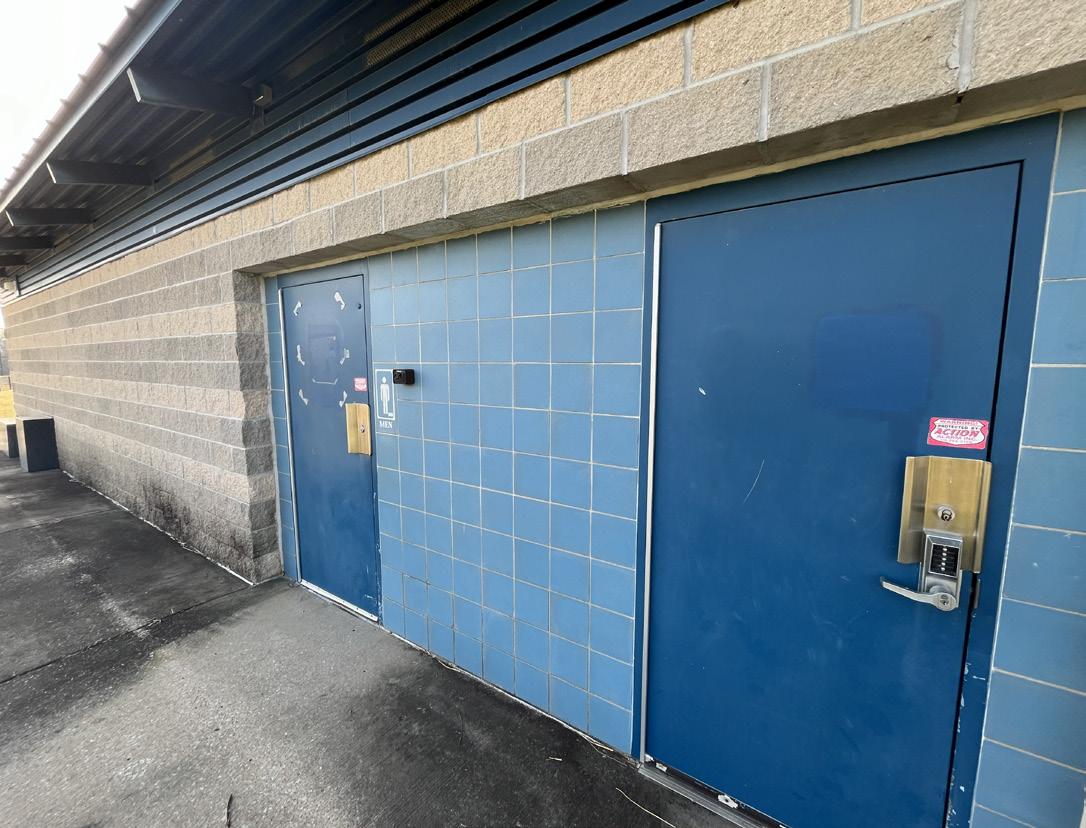
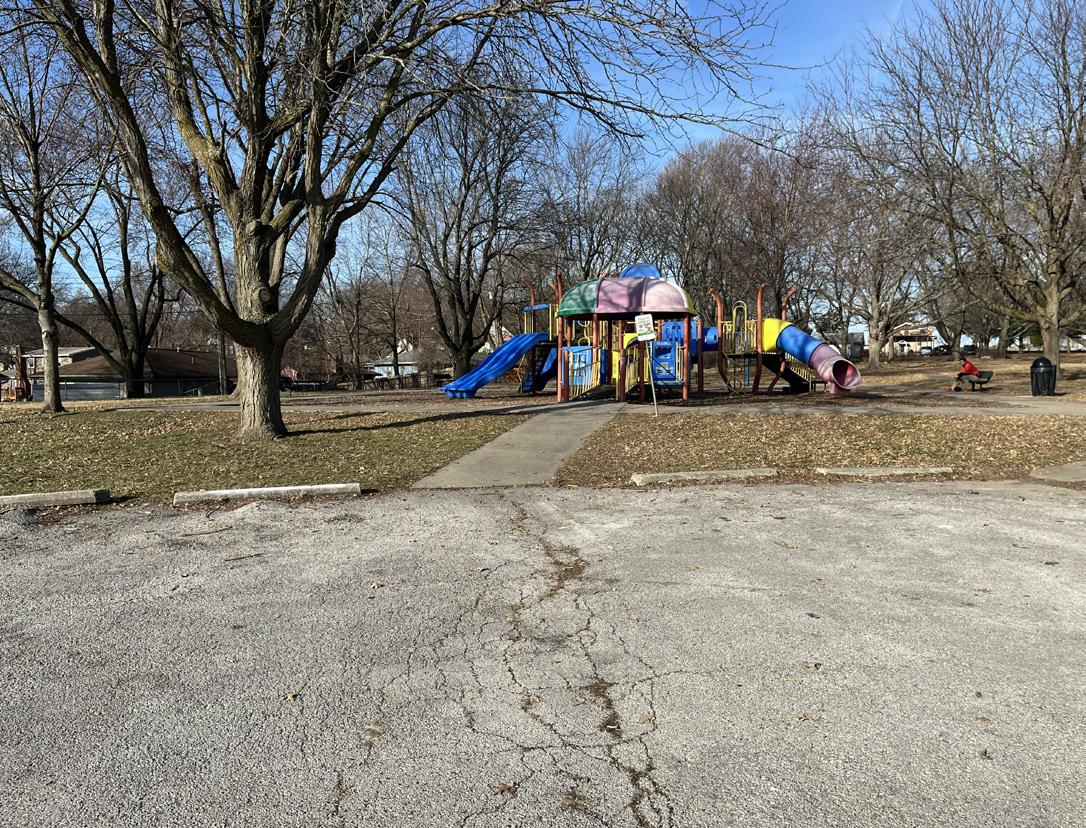
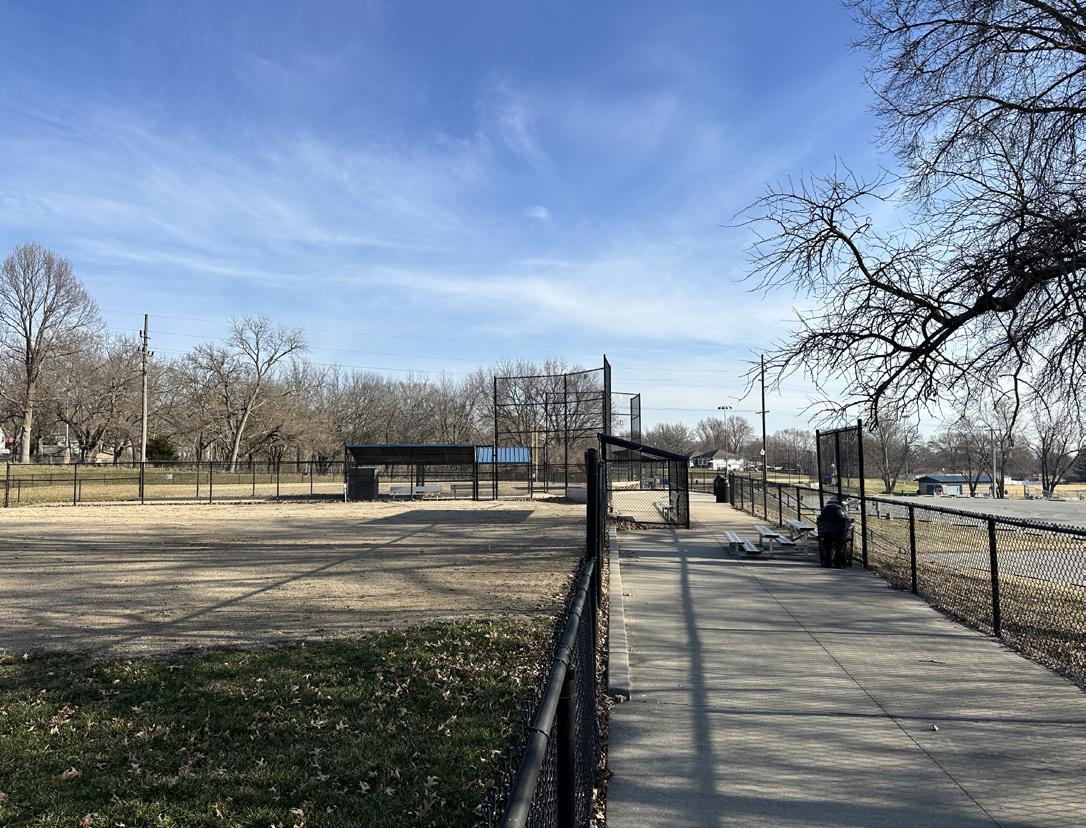
Parks and Recreation signage.
Name of Site: Overton Park
Date Completed: March, 2025
Completed By: Avery Nichols and Bennet McCoy
824 S Overton Ave, Independence, MO 64053
The park is located along E 9th Street and takes up less than half an acre. It has a one hoop basketball court, one bench, and signage.
Size: 0.26 acres
Classification: Pocket Park
3. INVENTORY OF FACILITY AMENITIES AND CONDITIONS:
Basketball Court (Half Court) (Fair Condition)
Signage (Fair Condition)
Walking Path (Good Condition)
4.
Strengths: Overton Park is a small pocket park with a half basketball court, making for a nice amenity in the neighborhood.
Opportunities: There is an opportunity to provide amenities that feed into the basketball court, with benches or a water fountain.
Rating:
1 (High Accessibility)
- The site has on-street parking with access to the basketball court from a sidewalk.
6. GENERAL NOTES:
Active/Passive: Passive
7. PHOTO INVENTORY:
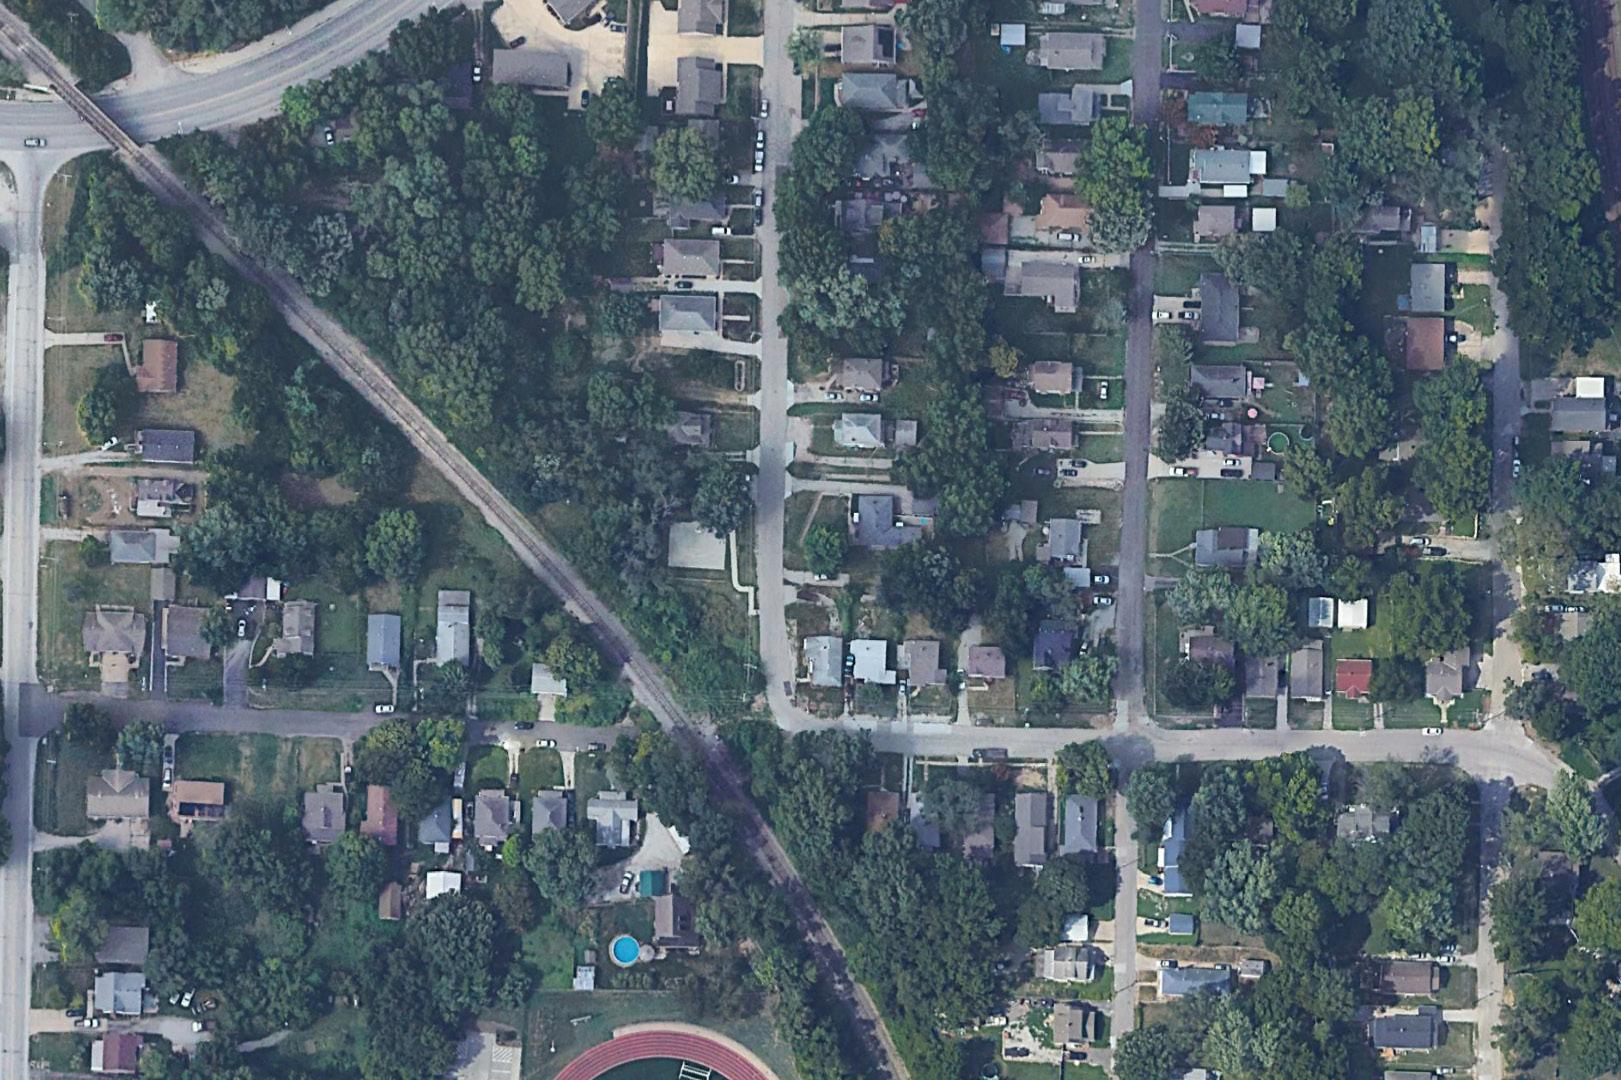
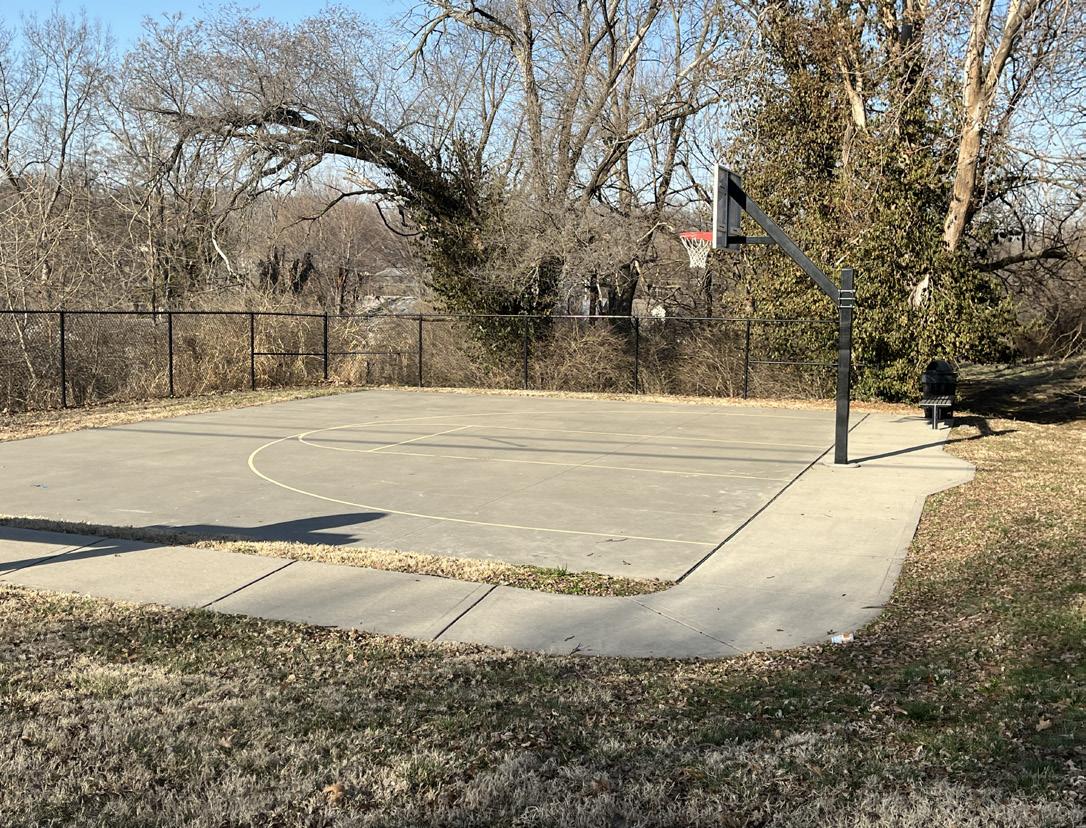
Name of Site: Phil Roberts Park
Date Completed: March, 2025
Completed By:
Avery Nichols and Bennet McCoy
3250 S. Blue Ridge Blvd, Independence, MO 64052
The site is located along Blue Ridge Blvd and shares the space with a small cemetery.
Size: 10.9 acres
Classification: Community Park
Picnic Tables (Poor Condition)
Signage (Fair Condition)
Walking Path (Poor Condition)
Pitcher Cemetery (Fair Condition)
Strengths: Phil Roberts Park is easily accessible and has plenty of parking with direct trail access. There is also a lot of natural areas providing ample shade to users.
Opportunities: There is an opportunity to refurbish seating elements to make them more cohesive as they are currently mismatched. There is also a need for trail lighting and improved sight lines.
Rating:
2 (Moderate Accessibility)
- There is a parking lot connecting a loop trail and access to benches and a picnic table. Trail access ends with a gravel trail that is not considered accessible to other parts of the site.
Active/Passive: Passive
7. PHOTO INVENTORY:
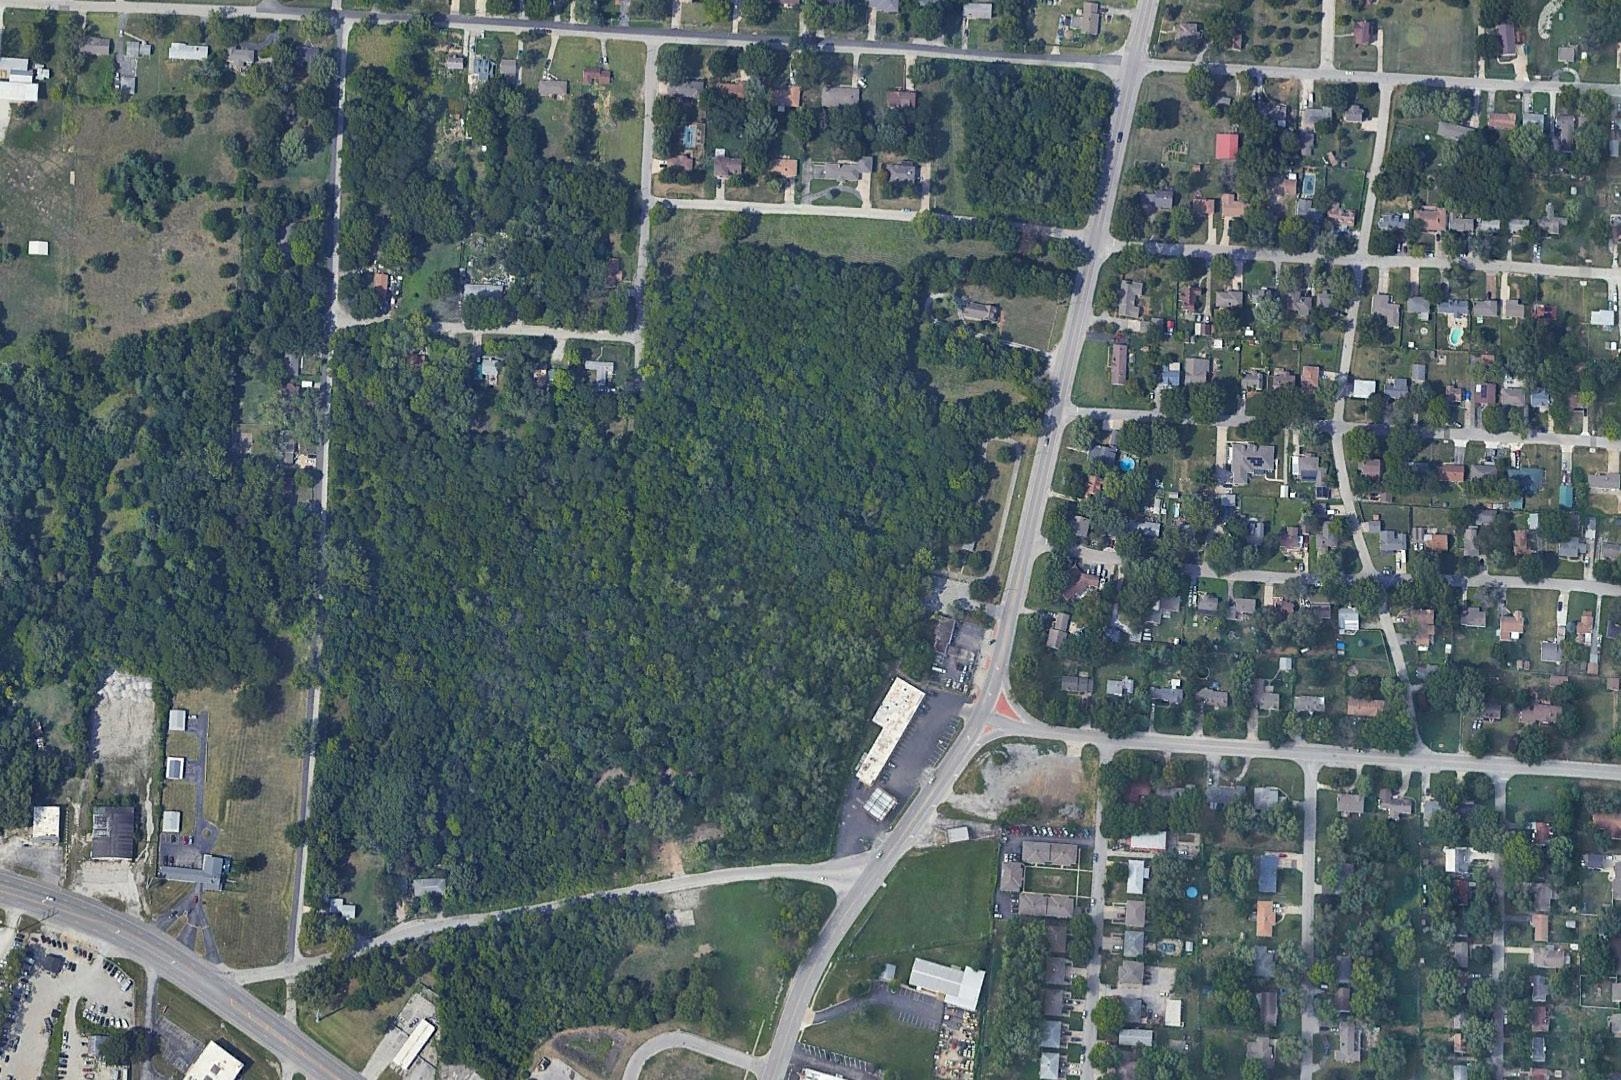
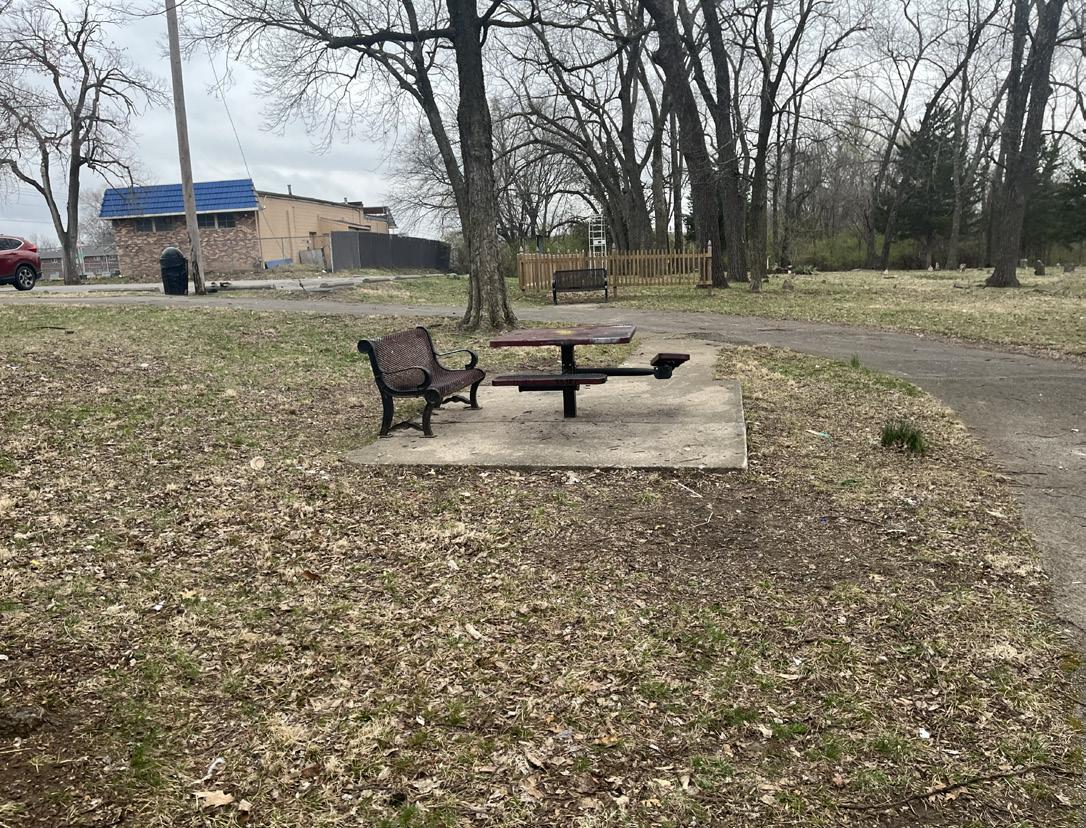
Name of Site: Polly’s Pop Park
Date Completed: March, 2025
Completed By: Avery Nichols and Bennet McCoy
204 N River Blvd, Independence, MO 64050
The site is located directly adjacent to the intersection at W Truman Rd and N River Blvd. It is located behind a convenience store on the corner.
Size: 2 acres
Classification: Neighborhood Park
3. INVENTORY OF FACILITY AMENITIES AND CONDITIONS:
No amenities.
Strengths: The park has plenty of open space ready for programming. It has decent connectivity to surrounding development.
Opportunities: There is an opportunity for playground equipment, sport courts, yard games, splash pad park, etc.
Rating:
5 (low Accessibility)
- The site has no dedicated parking, other than on-street parking. There is a perimeter sidewalk along Truman Road and River Boulevard, with no other park access.
6. GENERAL NOTES:
Active/Passive: Passive
7. PHOTO INVENTORY:
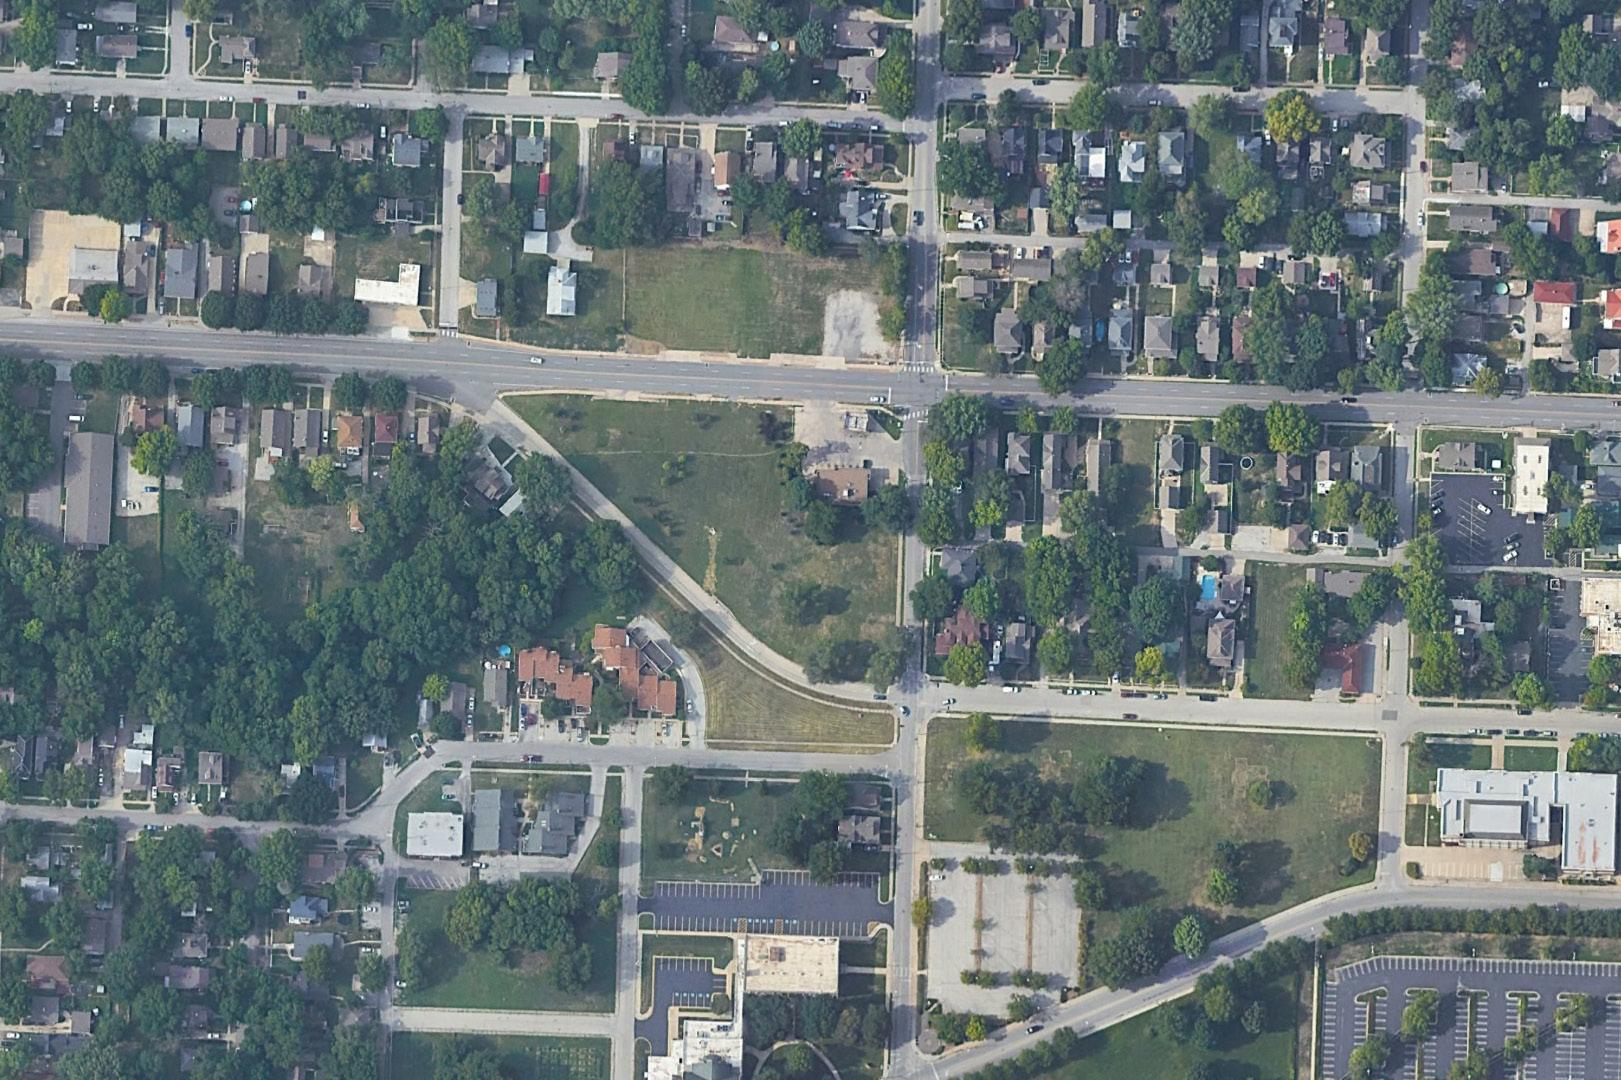
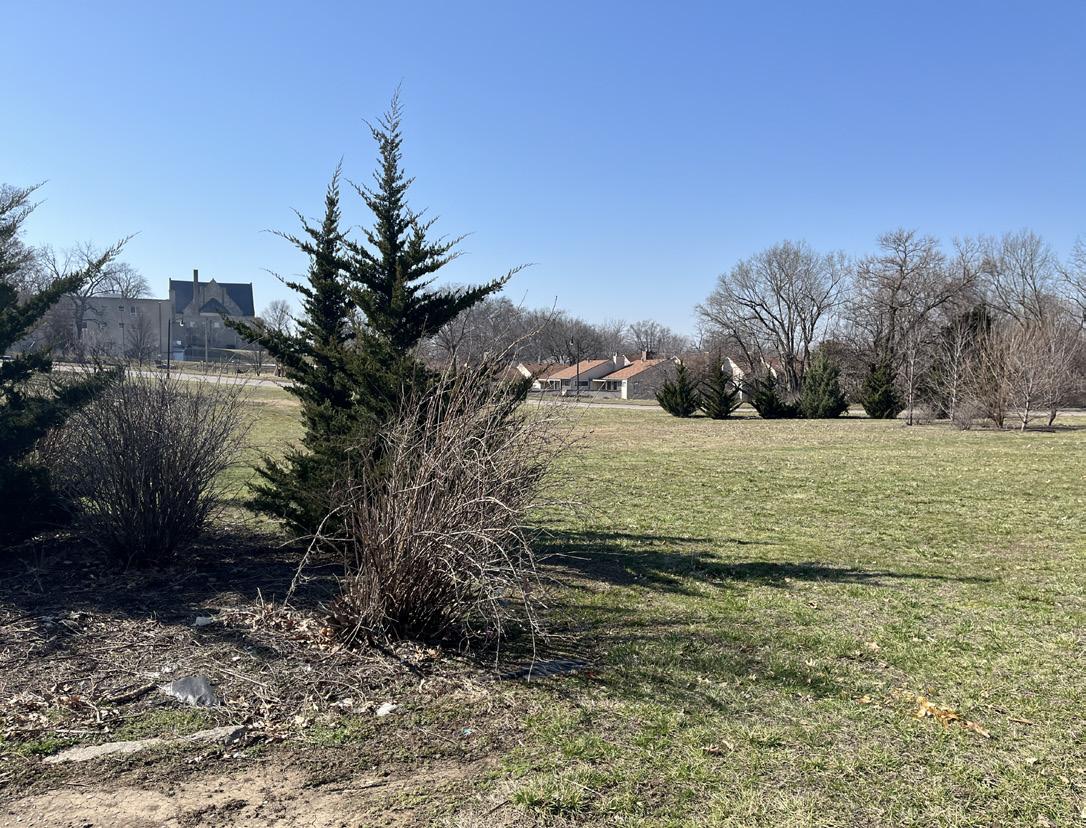
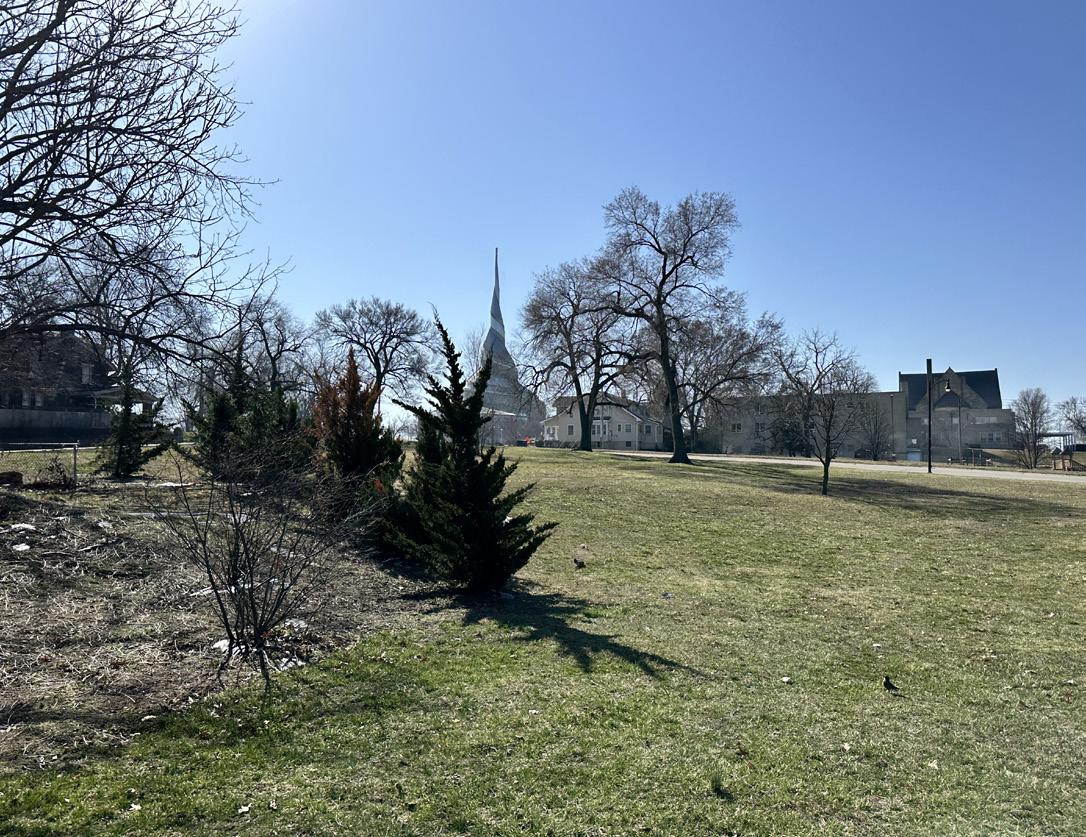
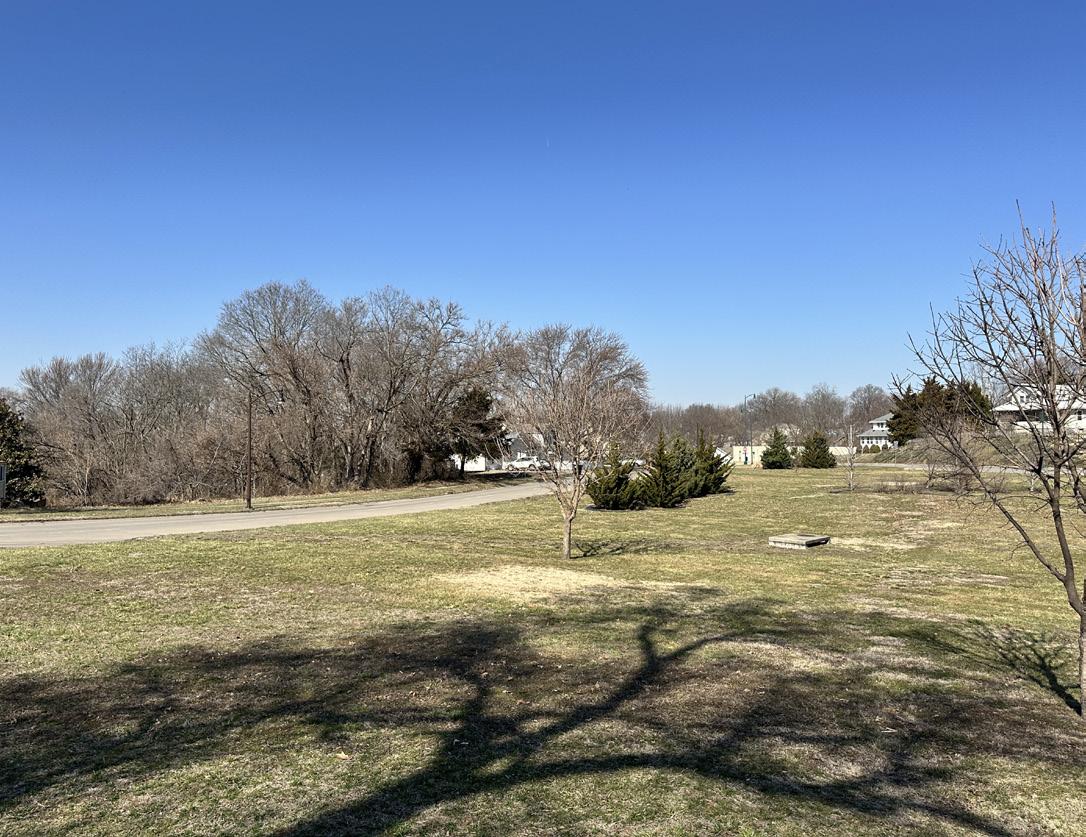
Large
at the low point in the topography.
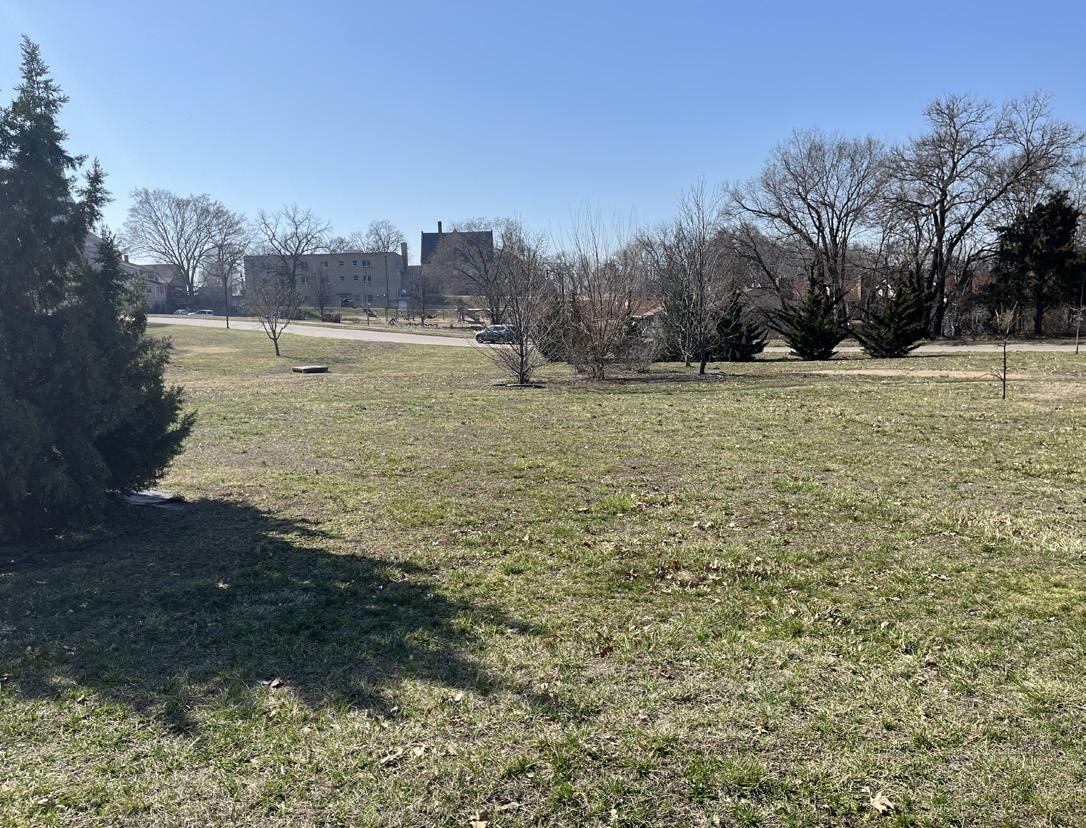
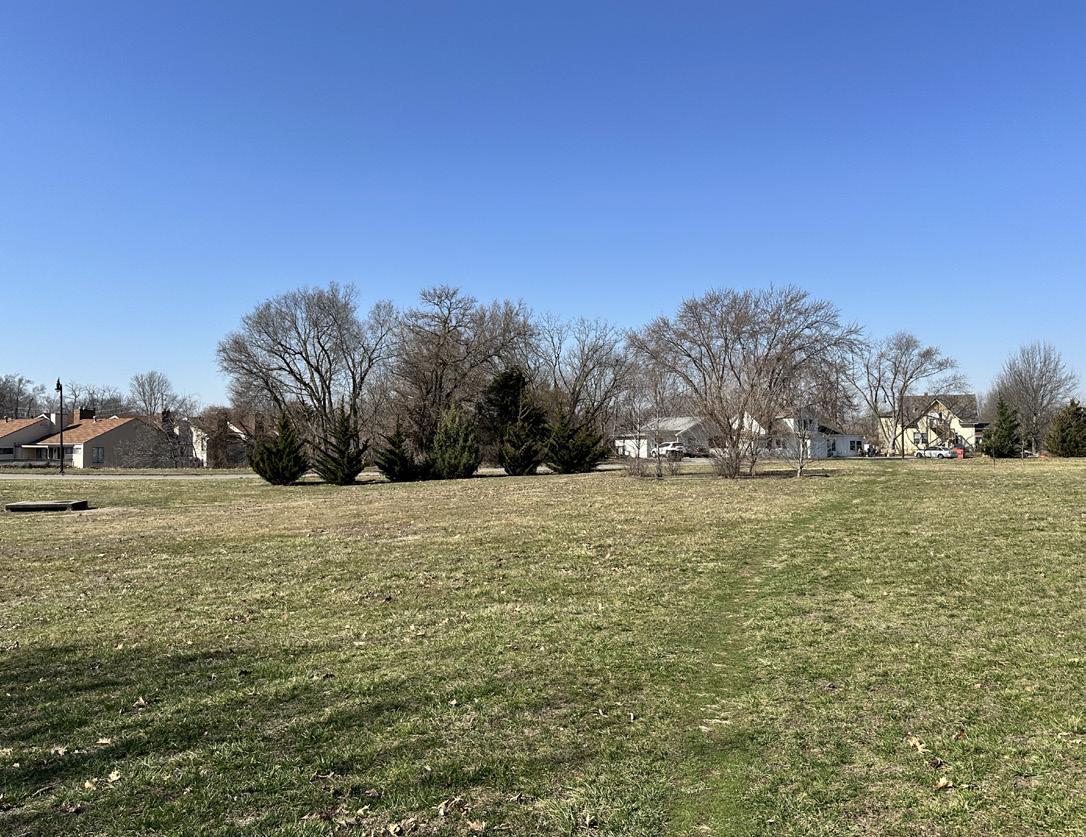
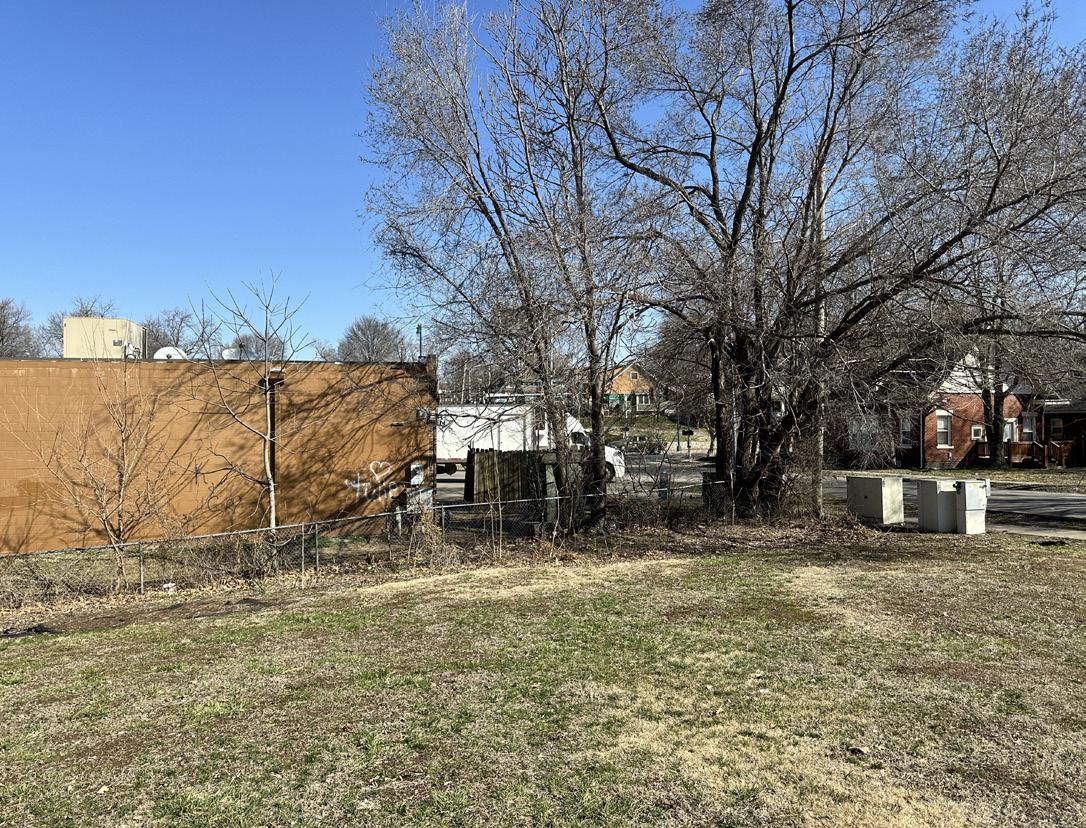
Space behind adjacent convenience store.
Name of Site: Rotary Park
Date Completed: March, 2025
Completed By: Avery Nichols and Bennet McCoy
10615 E 24th St S, Independence, MO 64052
The site is located on the west side of Independence city limits. It is adjacent to Nova Center School and the intersection at Westport Rd. and E 24th St.
Size: 11.1 acres
Classification: Neighborhood Park
Picnic Shelters (Fair Condition)
Picnic Tables (Fair Condition)
Playground (Good Condition)
Restrooms (Fair Condition)
Signage (Fair Condition)
Walking Path (Poor Condition)
Splash Pad (Poor Condition)
Outdoor Exercise Equipment (Good Condition)
Grill (Good Condition)
Strengths: Easily accessible via car with ample parking. It also has a trail connecting to another park allowing for an alternative entry via trail.
Opportunities: The park has a dead-end parking lot so there is an opportunity to provide a turnaround to make it easier to get in and out of the parking lot. There is also an opportunity for better signage to indicate the parks connection via the trail. Improvements to the splash pad and trail are also needed to draw more users to the park.
Rating: 1 (High Accessibility)
- There is a parking lot connecting a loop trail and sidewalks to all amenities.
Active/Passive: Passive
7. PHOTO INVENTORY:
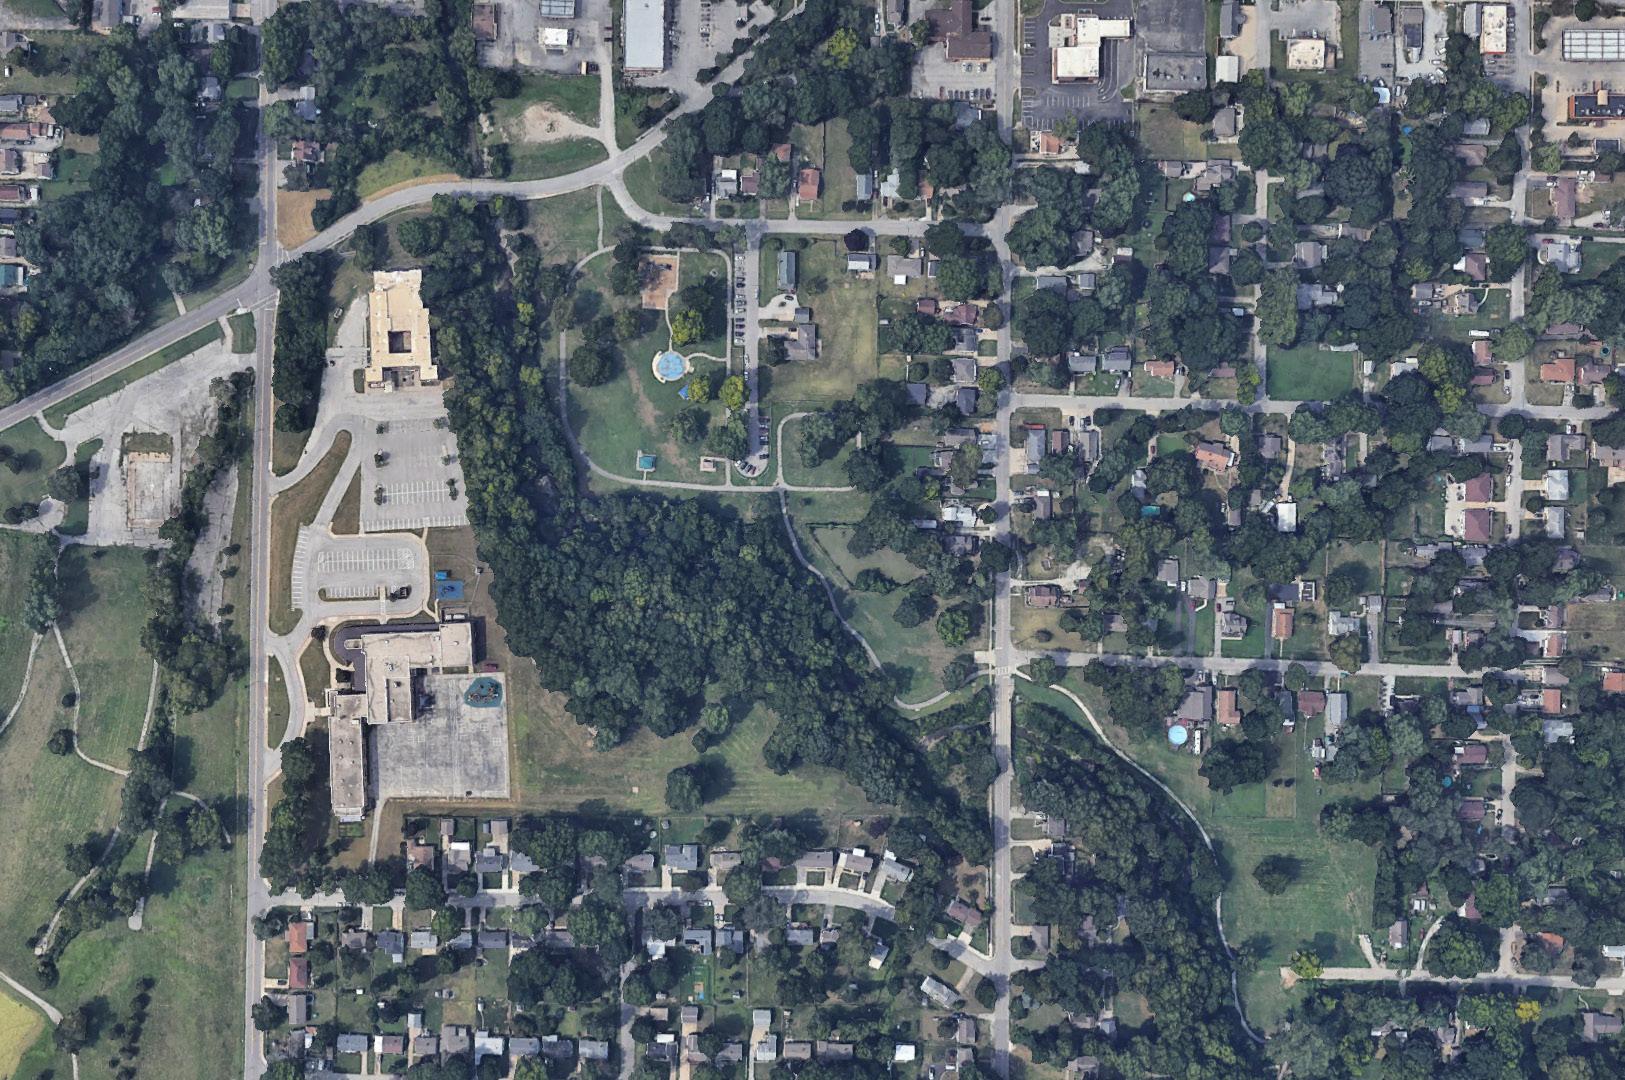
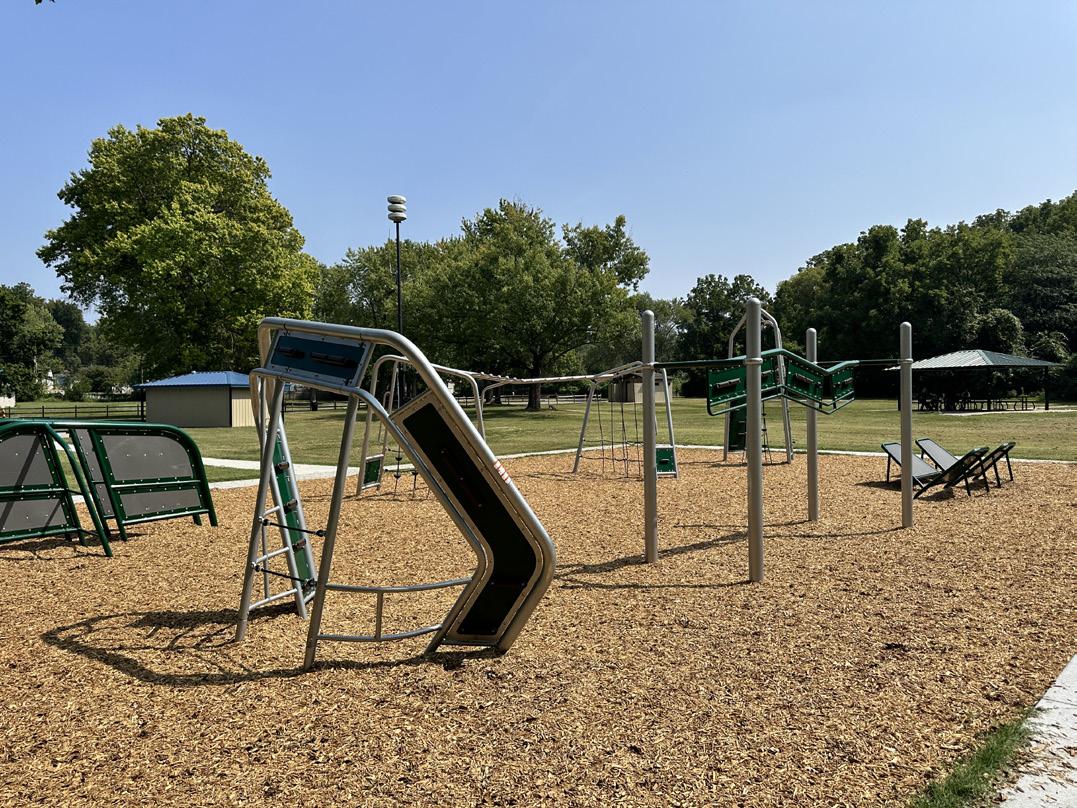
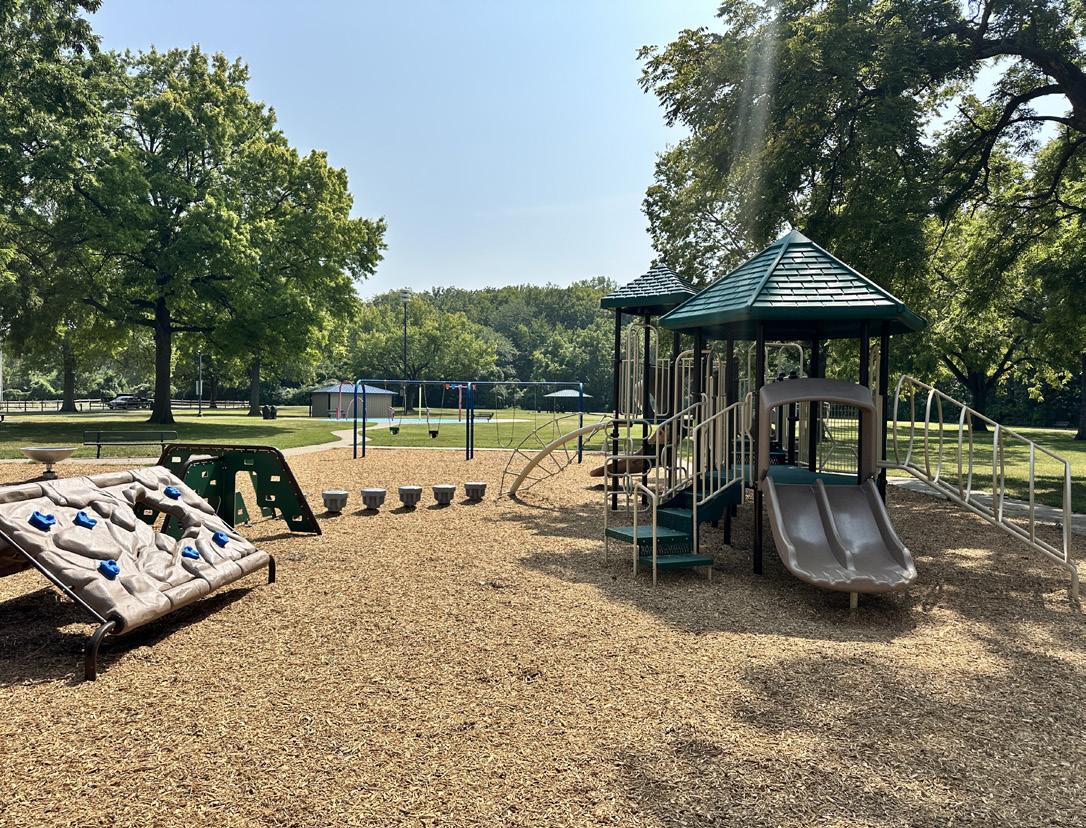
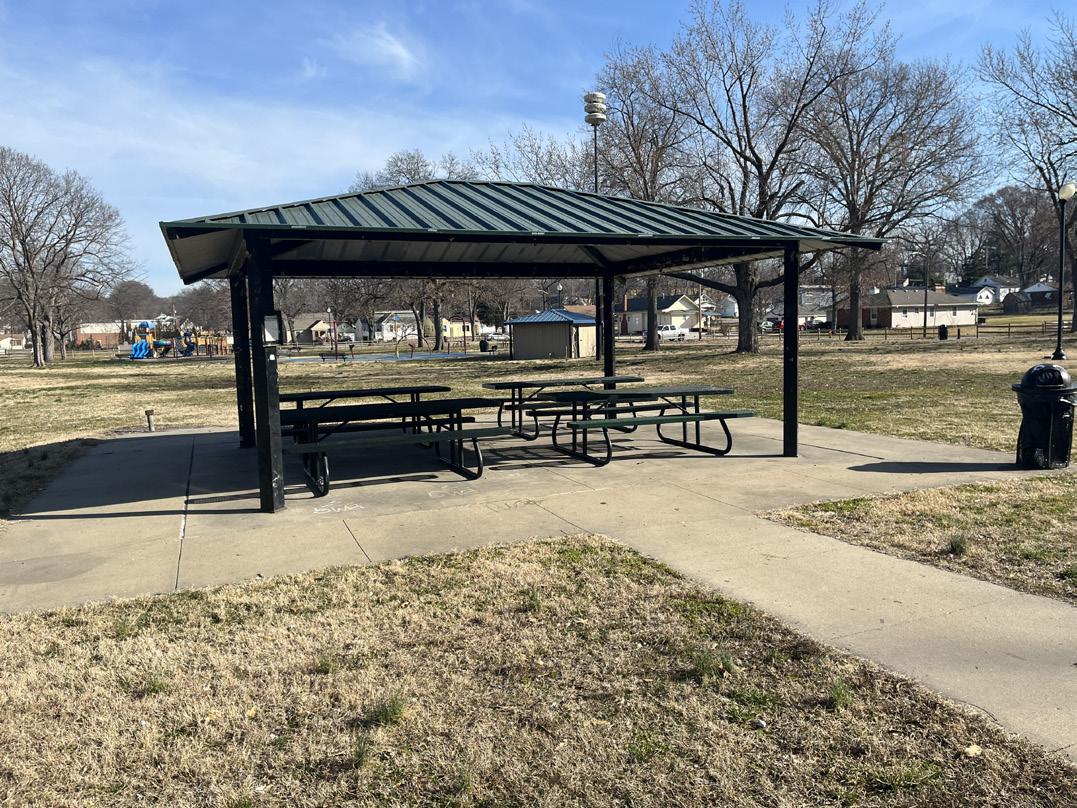
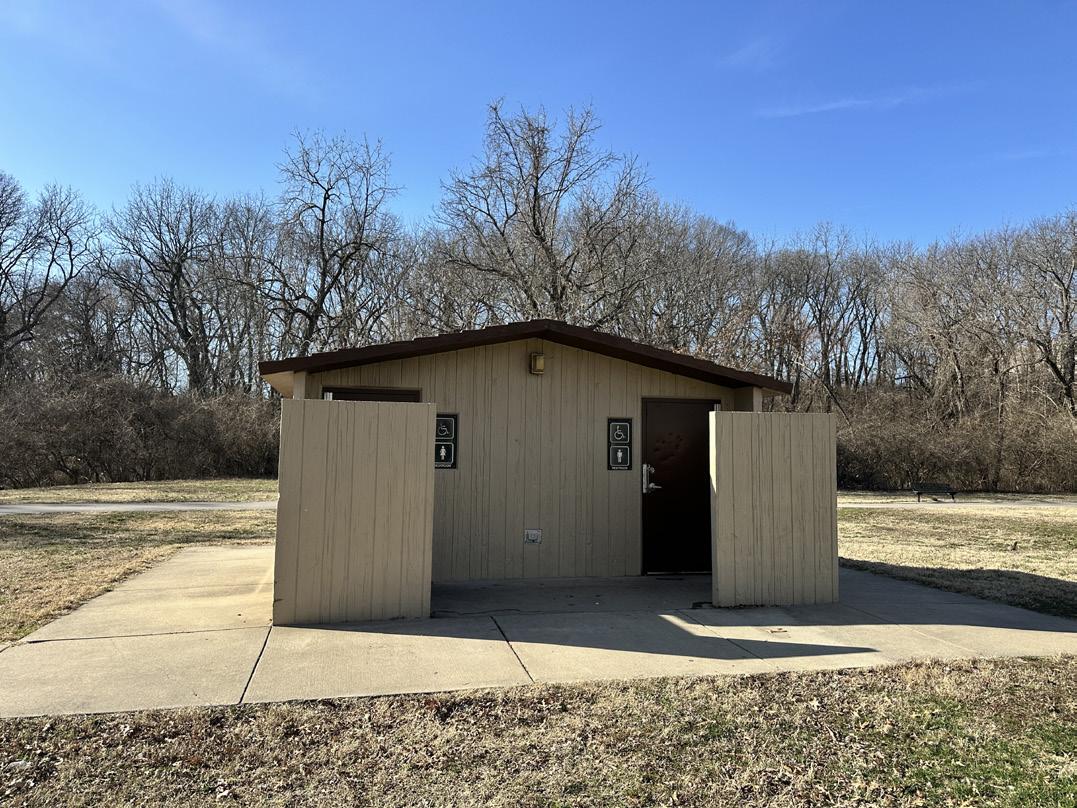
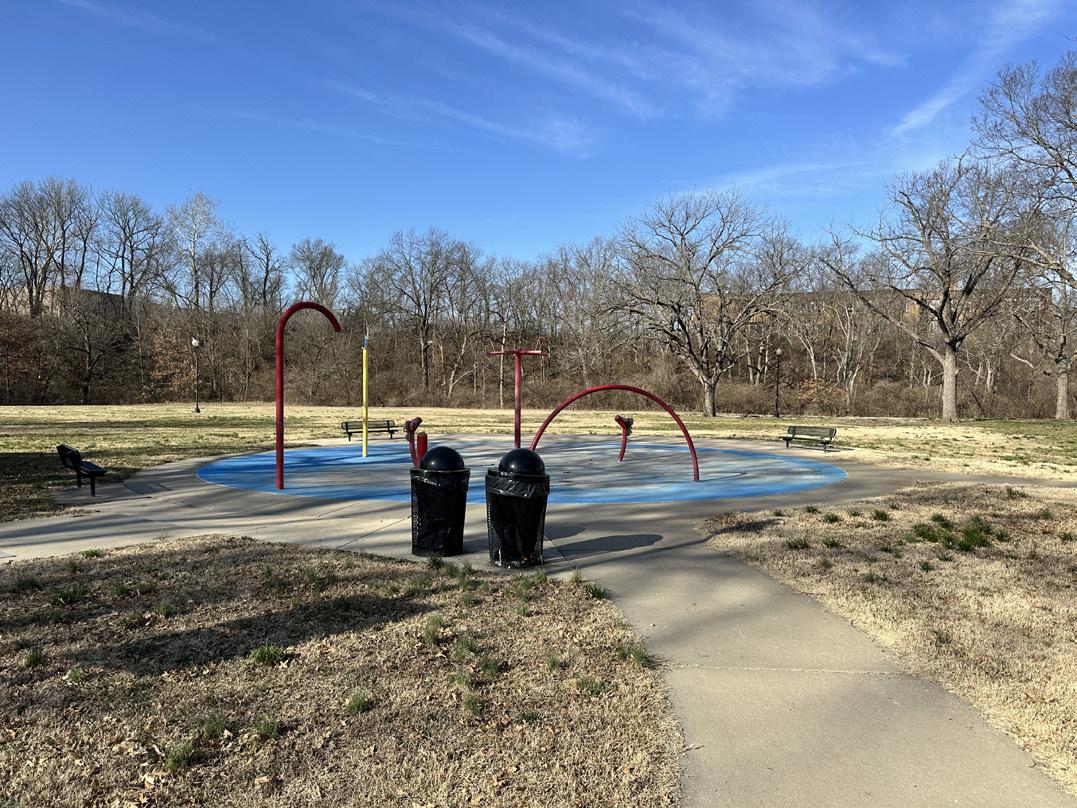
Restroom facility.
Name of Site: Santa Fe Trail Park
Date Completed: March, 2025
Completed By: Avery Nichols and Bennet McCoy
2731 S Santa Fe Rd., Independence, MO 64052
The site sits just SW from downtown Independence. It is bounded by W 31st St. and Santa Fe Rd. within a single-family neighborhood. It is also adjacent to a railroad line in Independence.
Size: 41.5 acres
Classification: Community Park
3. INVENTORY OF FACILITY AMENITIES AND CONDITIONS:
Tennis Court (Fair Condition)
BBQ Grills (Poor Condition)
Picnic Shelters (Fair Condition)
Picnic Tables (Fair Condition)
Playground 1 (North) (Fair Condition)
Playground 2 (South) (Under Replacement)
4.
Restrooms (Poor Condition)
Signage (Fair Condition)
Walking Path (Fair Condition)
Dog Park (Fair Condition)
Skate Park (Fair Condition)
Strengths: Santa Fe Trail park has ample parking and accessibility. Multiple amenities including a dog park, tennis courts, ball fields, and playgrounds make this a dynamic park.
Opportunities: There are opportunities to better connect the baseball fields, tennis courts, and dog park with pedestrian paths.
Rating: 3 (Moderate Accessibility)
- There is a parking lot bisecting the site, providing sidewalks and trails to all amenities, not all of which are universally accessible. Heavy slopes in the park also make traversing the trails difficult in areas.
Active/Passive: Passive
7. PHOTO INVENTORY:
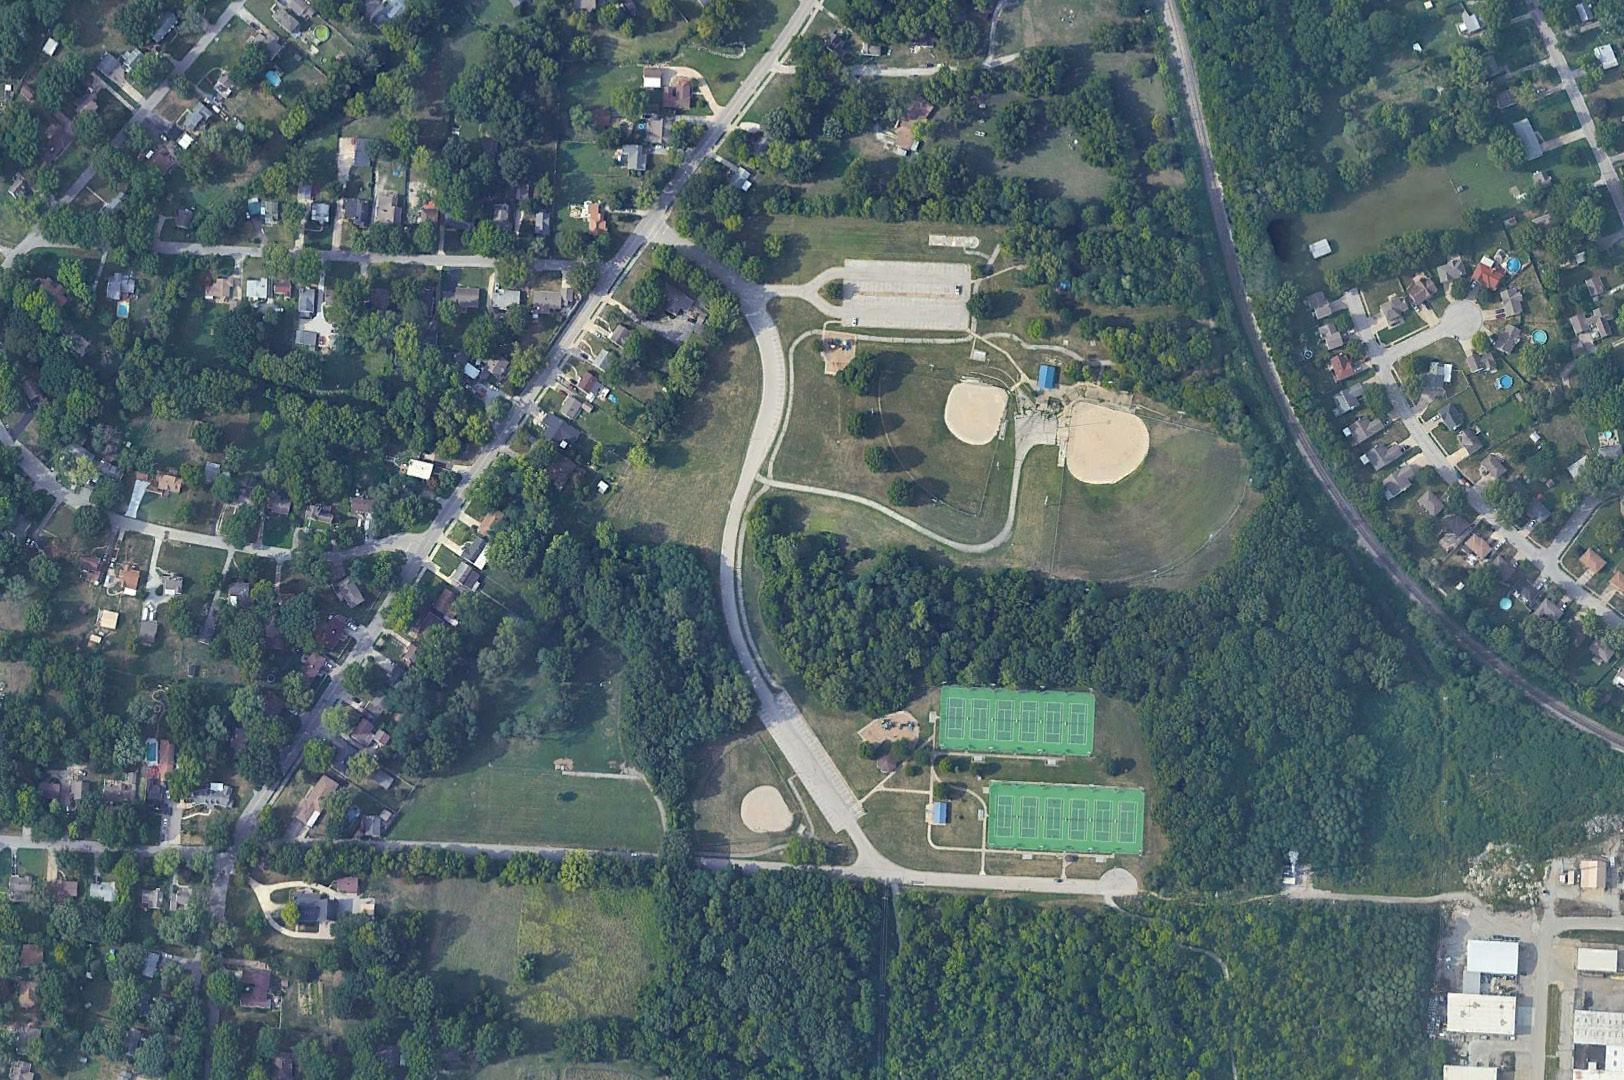
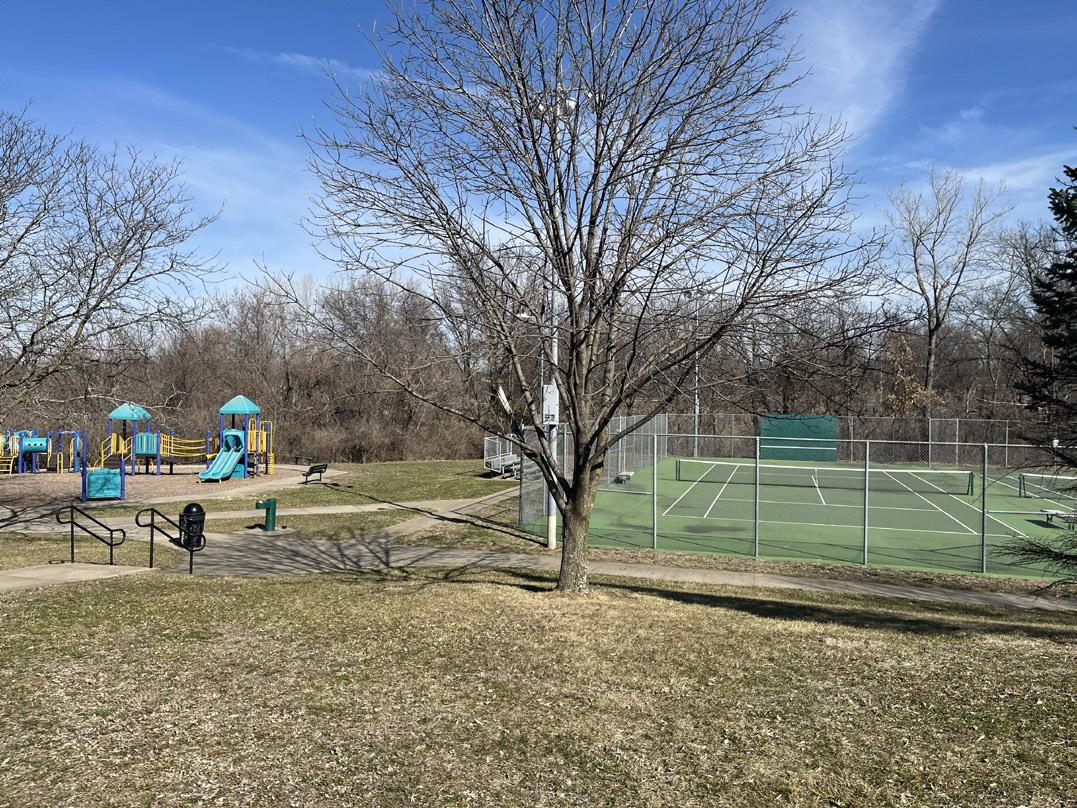
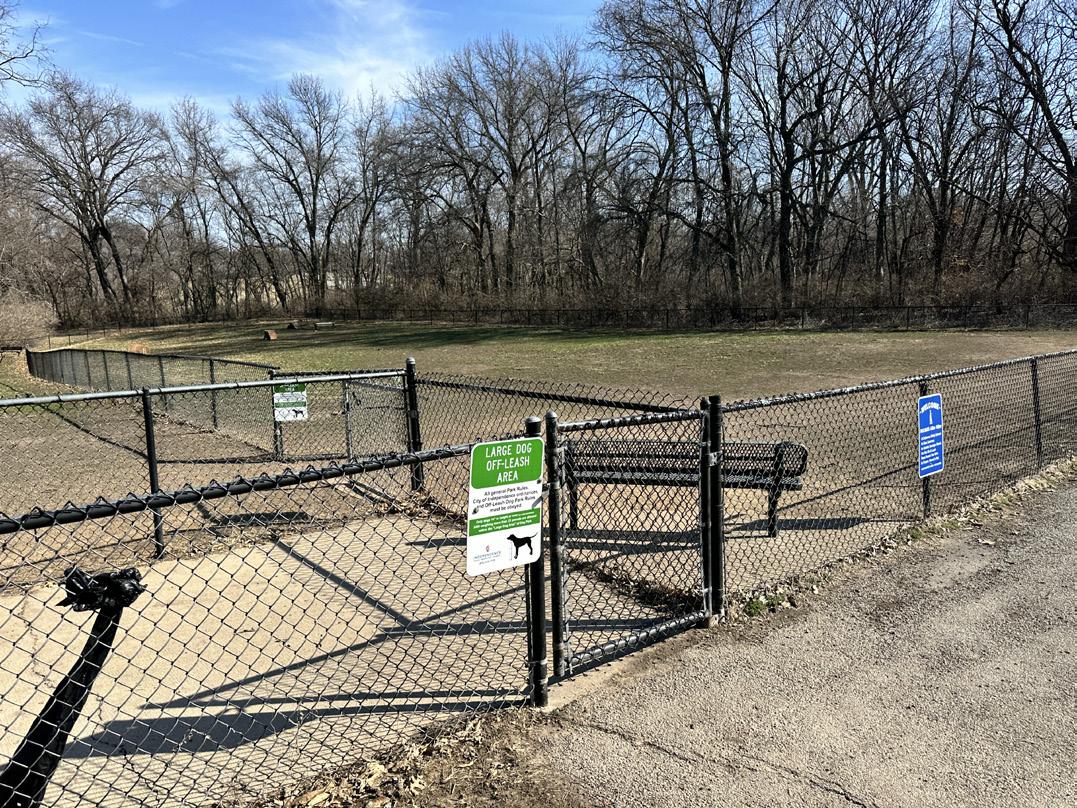
and large breed dog park fenced in. Tennis courts and southern playground structure.
Name of Site: St. Clair Park
Date Completed: March, 2025
Completed By: Avery Nichols and Bennet McCoy
433 S Farley Terrace, Independence, MO 64053
The site sits in a residential area just south of Winner Rd along S Farley Terrace.
Size: 2.5 acres
Classification: Neighborhood Park
Playgrounds (Fair Condition)
Signage (Fair Condition)
Walking Path (Poor Condition)
Strengths: This neighborhood park has a small playground sitting at the bottom of a sloped hill and open greenspace.
Opportunities: There is an opportunity to add more shade options and improve the quality of the trail leading to the playground.
Rating:
4 (Moderate Accessibility)
- There is no dedicated parking, with a sidewalk running along the road with no ramp access. The trail in the park is asphalt with a large elevation change from the road down to the playground.
Active/Passive: Passive
7. PHOTO INVENTORY:
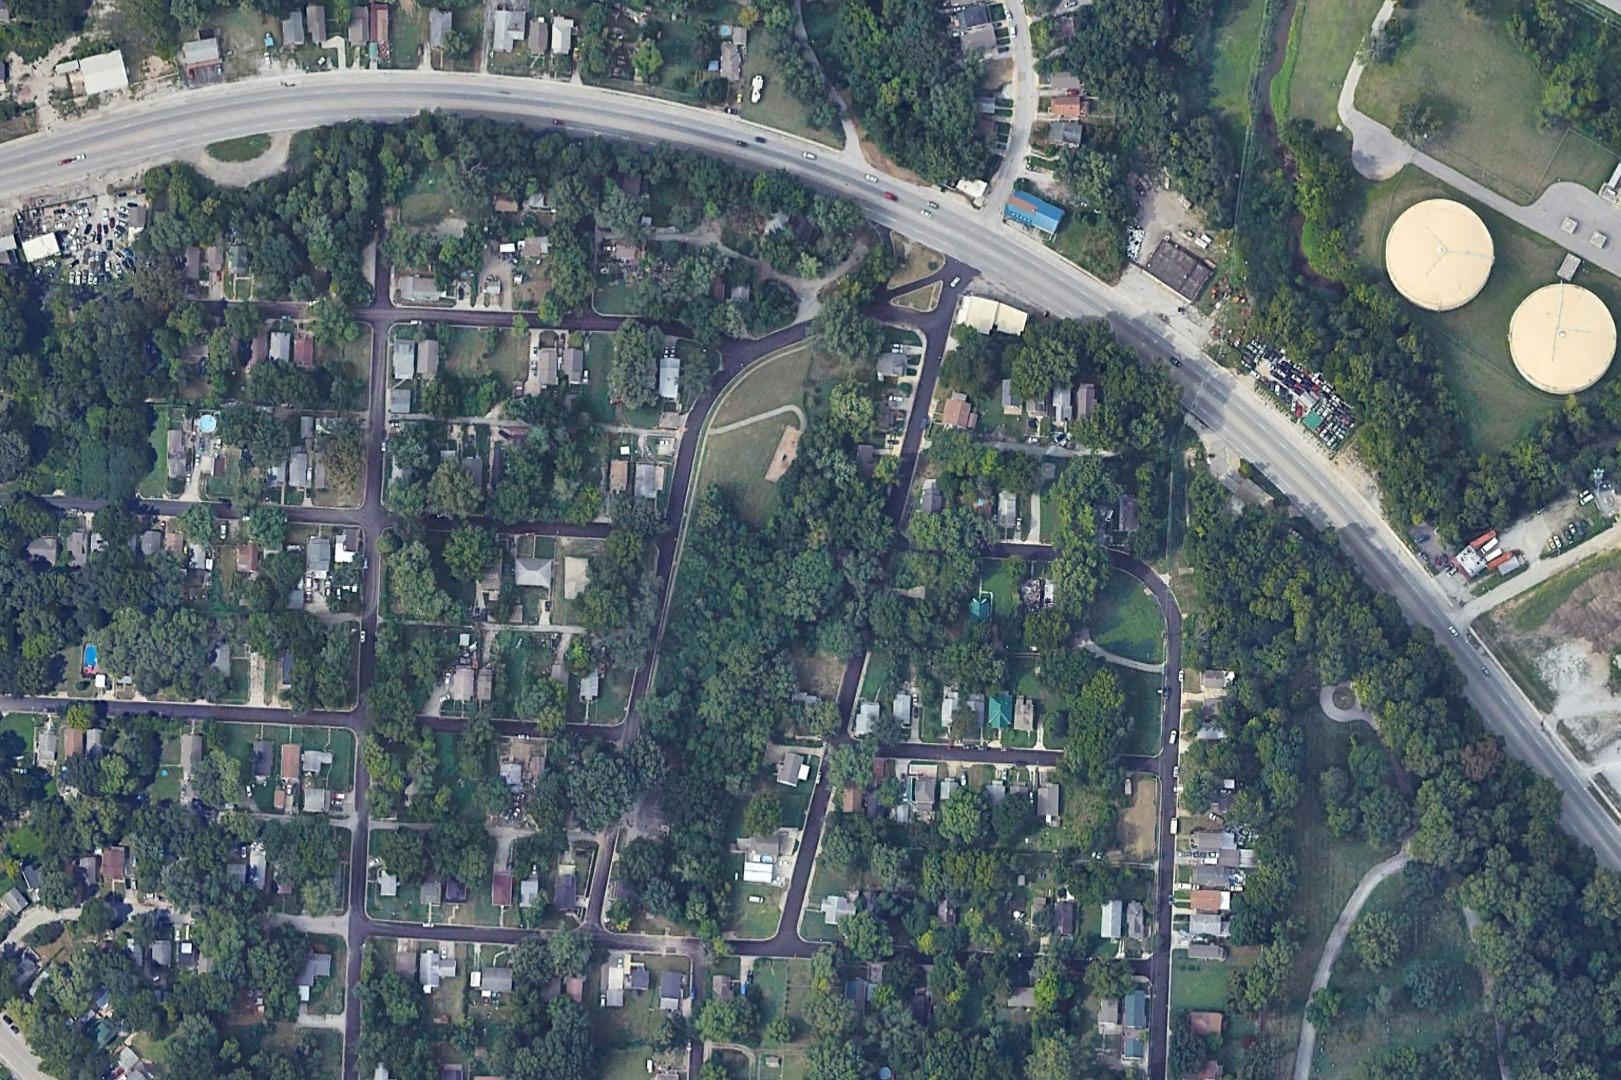
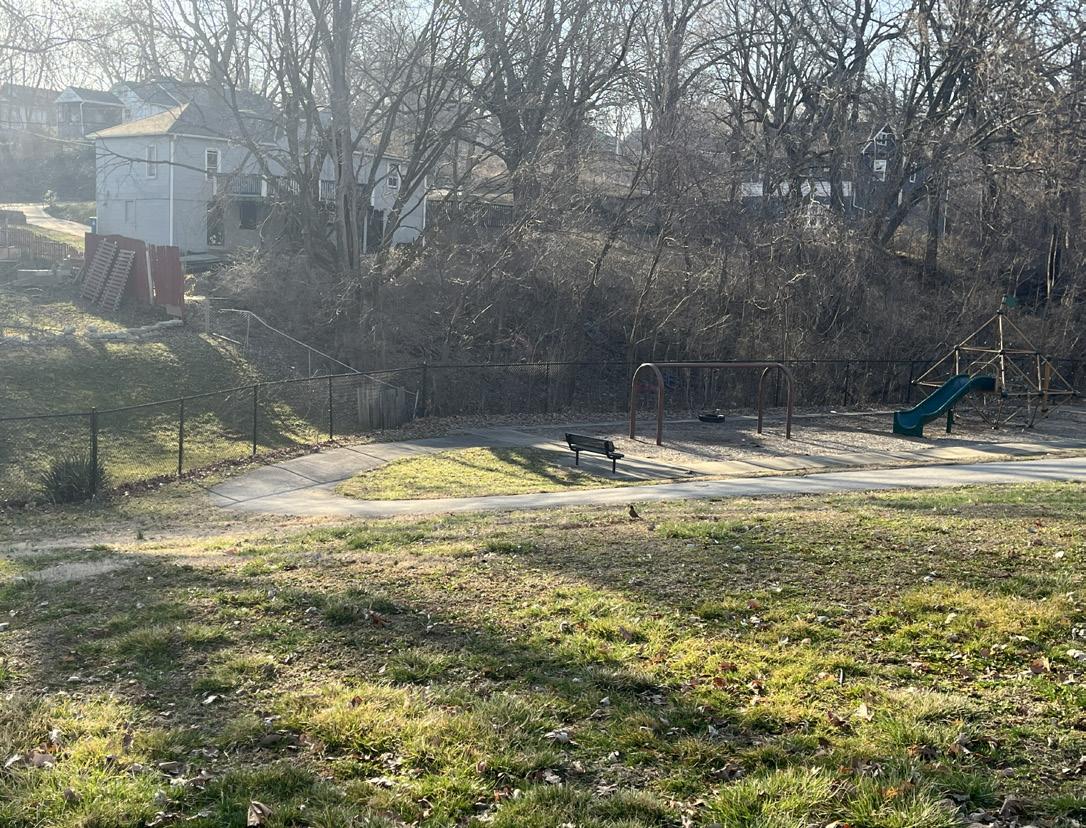
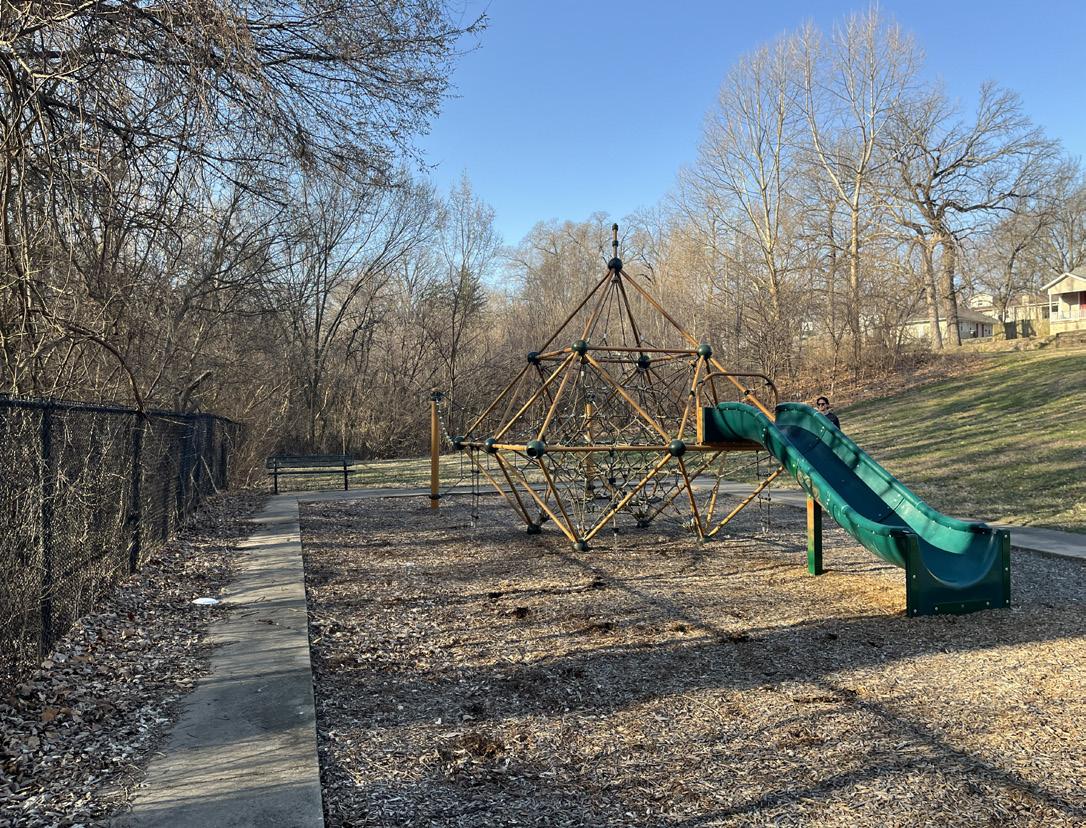
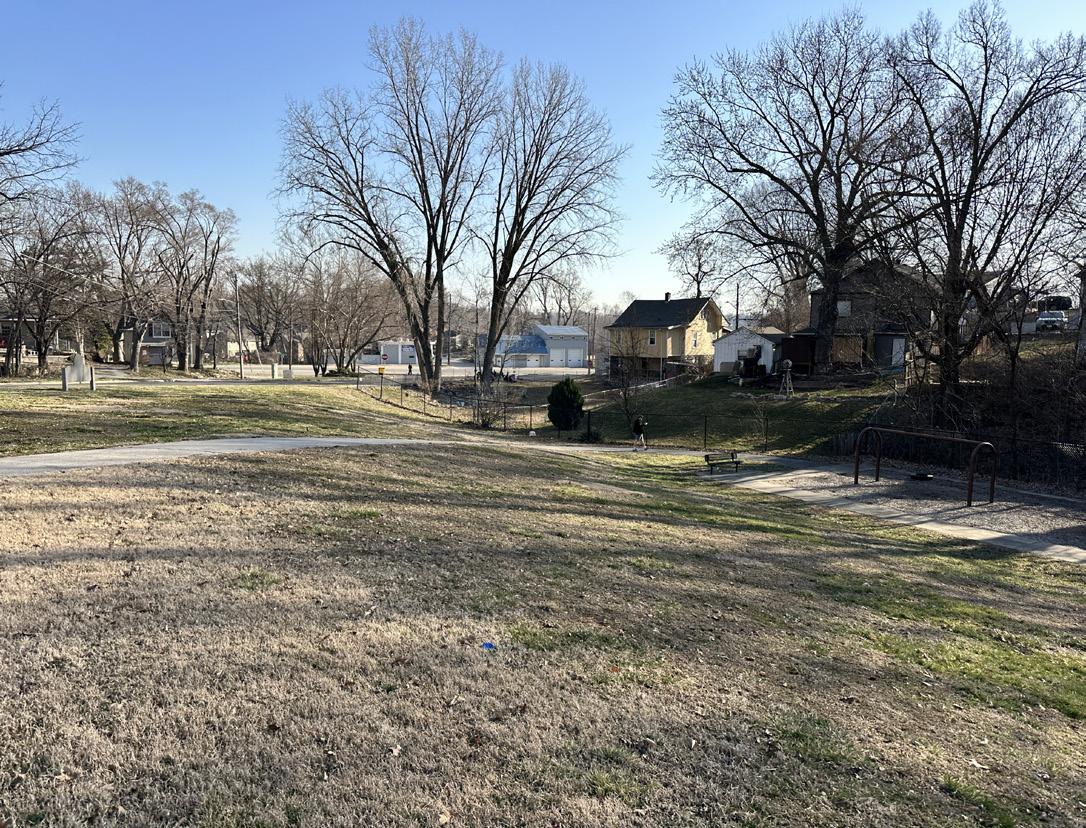
Name of Site: Sycamore Hills Park
Date Completed: March, 2025
Completed By: Avery Nichols and Bennet McCoy
3700 S Haden Dr, Independence, MO 64055
The park sits within a residential area just north of East 39th St and connects to the Sycamore Hills Elementary School.
Size: 2.8 acres
Classification: Neighborhood Park
3. INVENTORY OF FACILITY AMENITIES AND CONDITIONS:
Picnic Tables (Poor Condition)
Playgrounds (Fair Condition)
Signage (Fair Condition)
Walking Path (Fair Condition)
4. STRENGTHS AND OPPORTUNITIES:
Strengths: The park has playground equipment and benches with a pedestrian bridge over a small creek and wooded area.
Opportunities: The loop trail quality could be improved and the playground surfacing can be improved with a poured-in-place or rubber surfacing.
Rating:
1 (High Accessibility)
- There is no dedicated parking, other than on-street parking. There is sidewalk access into the park from the neighborhood with a ramp from the street. The loop trail in the park is asphalt, surrounding the playground and connecting up the site to the adjacent school sidewalk.
Active/Passive: Passive
7. PHOTO INVENTORY:
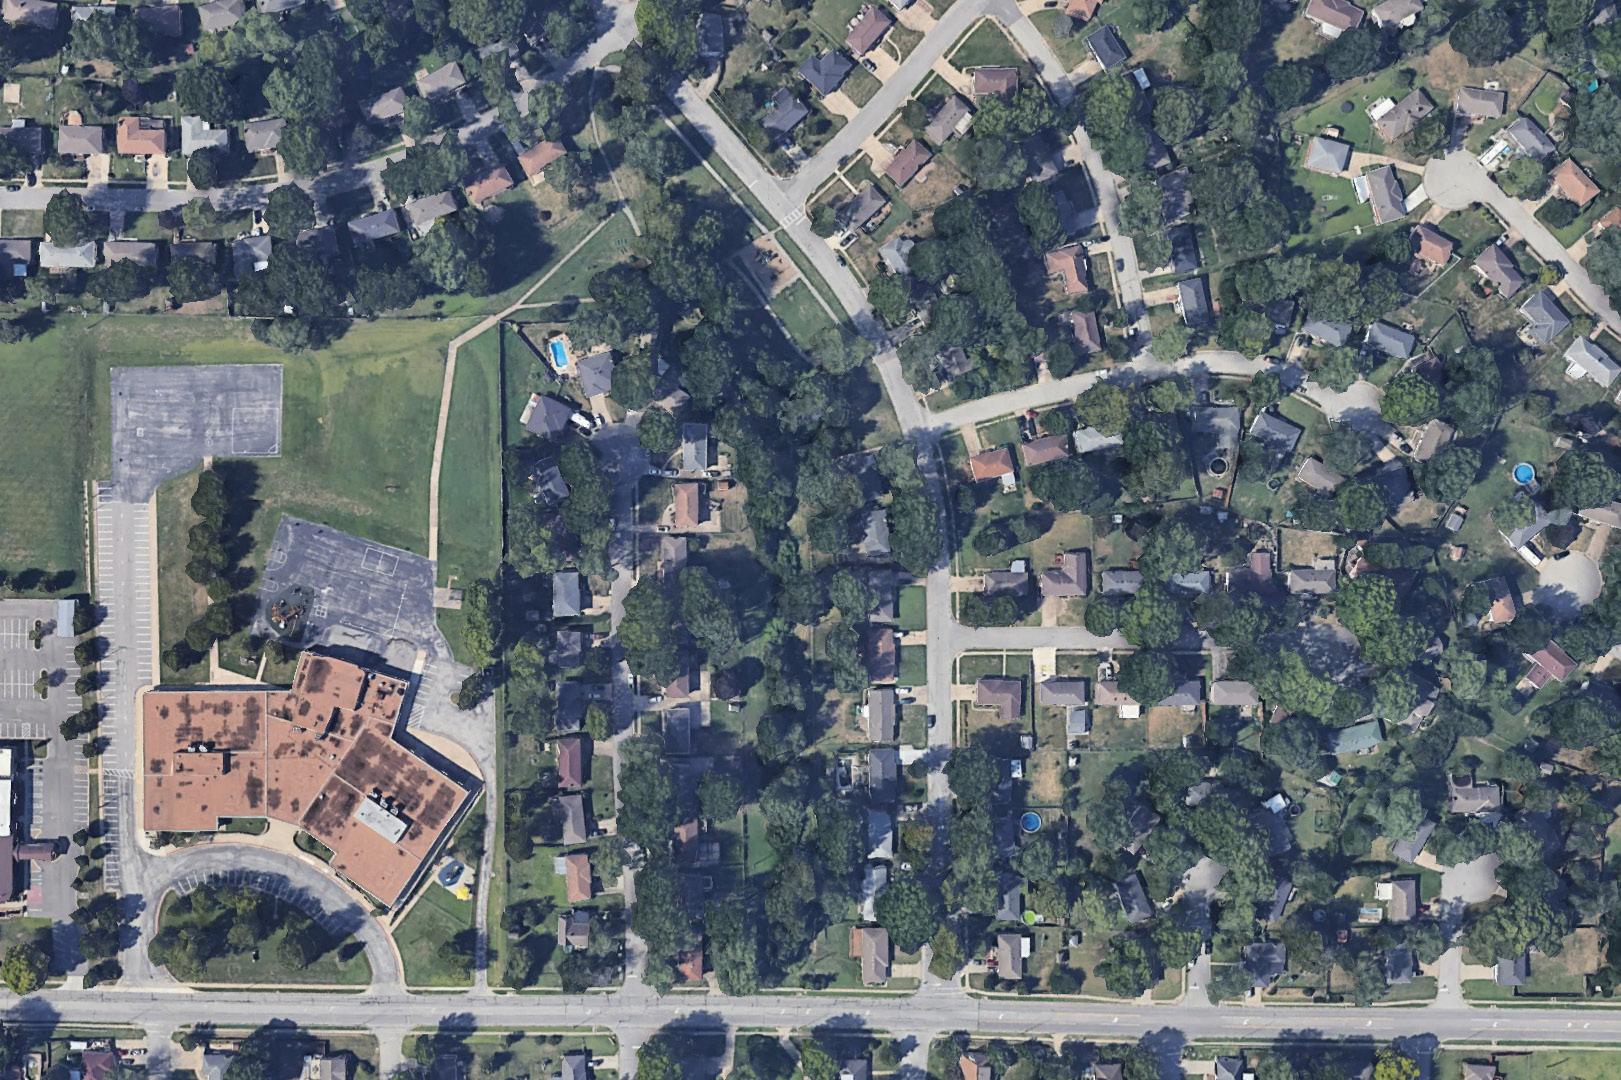
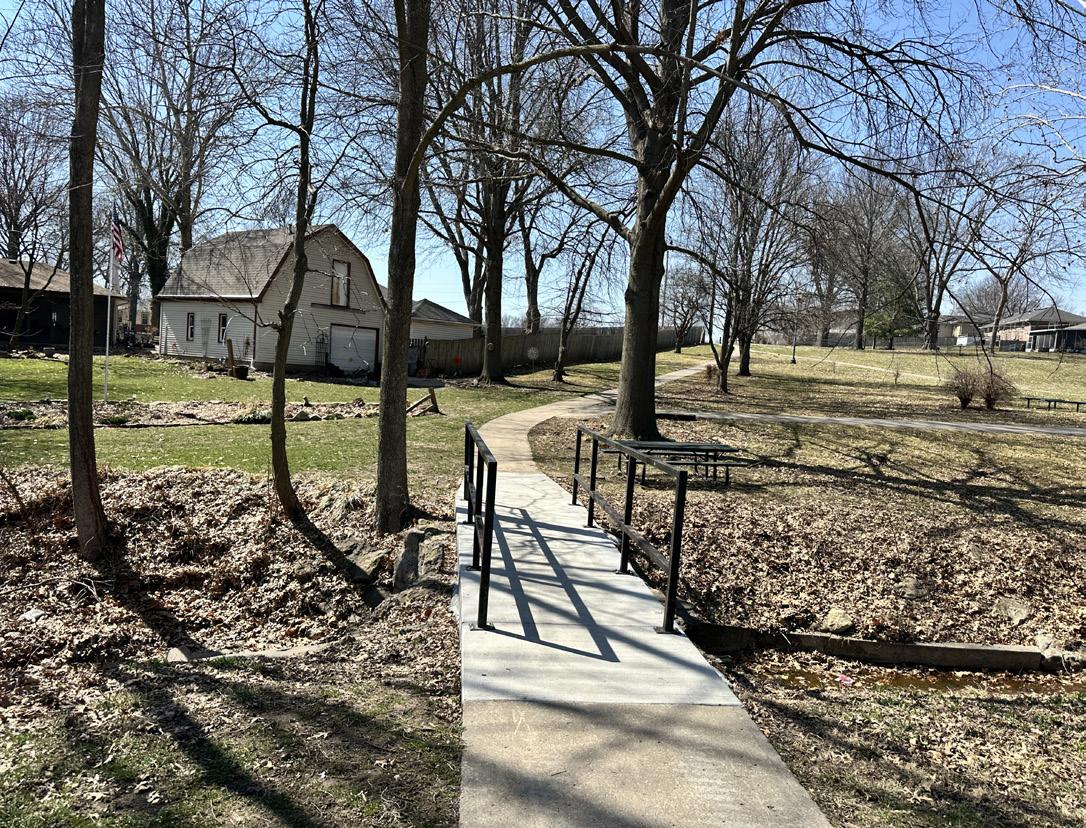
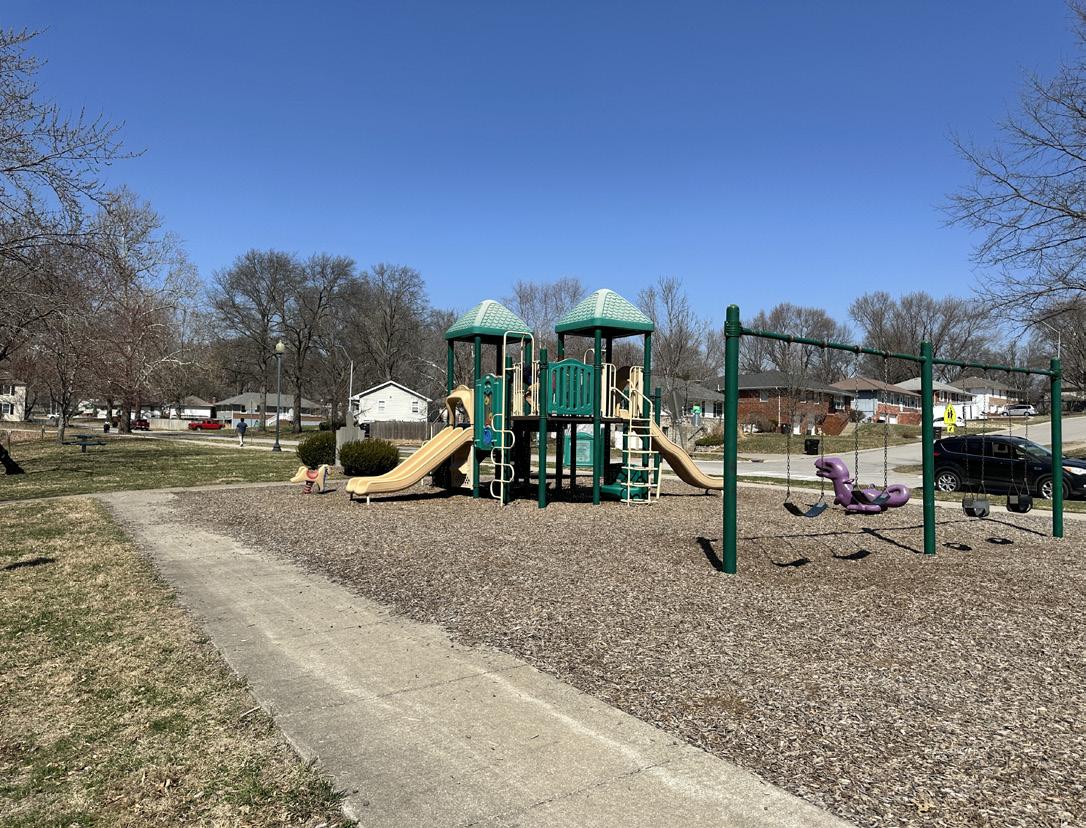
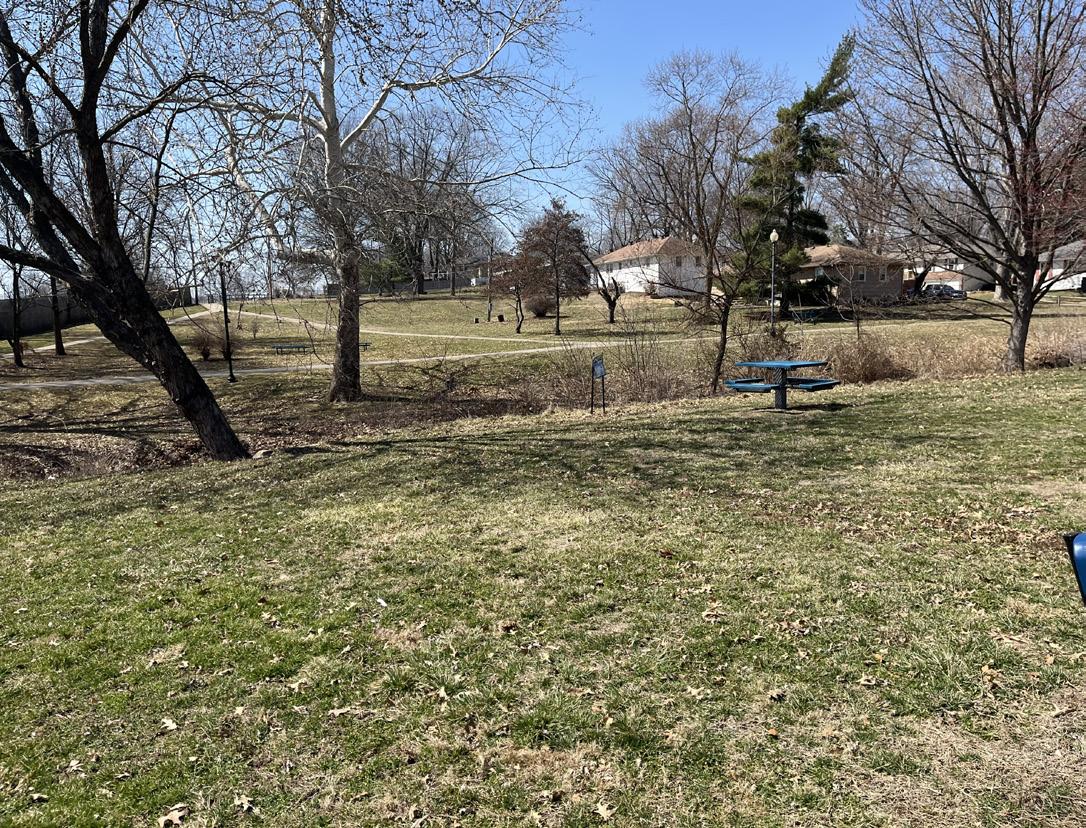
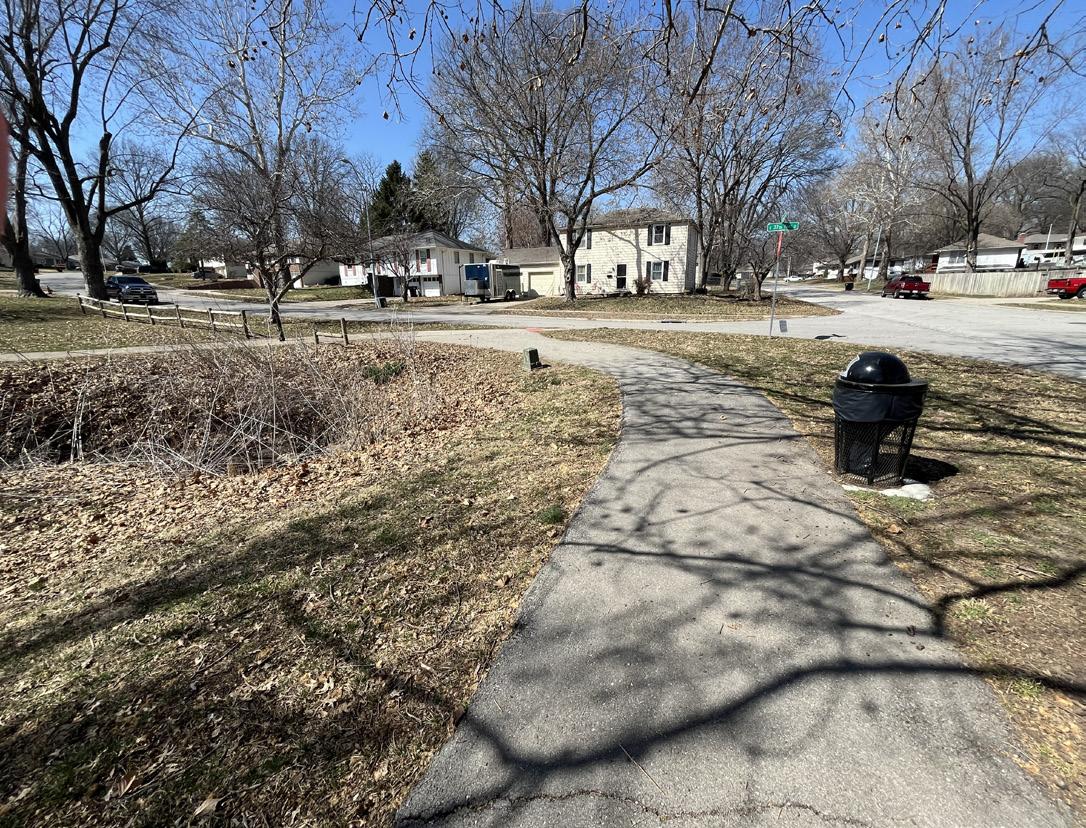
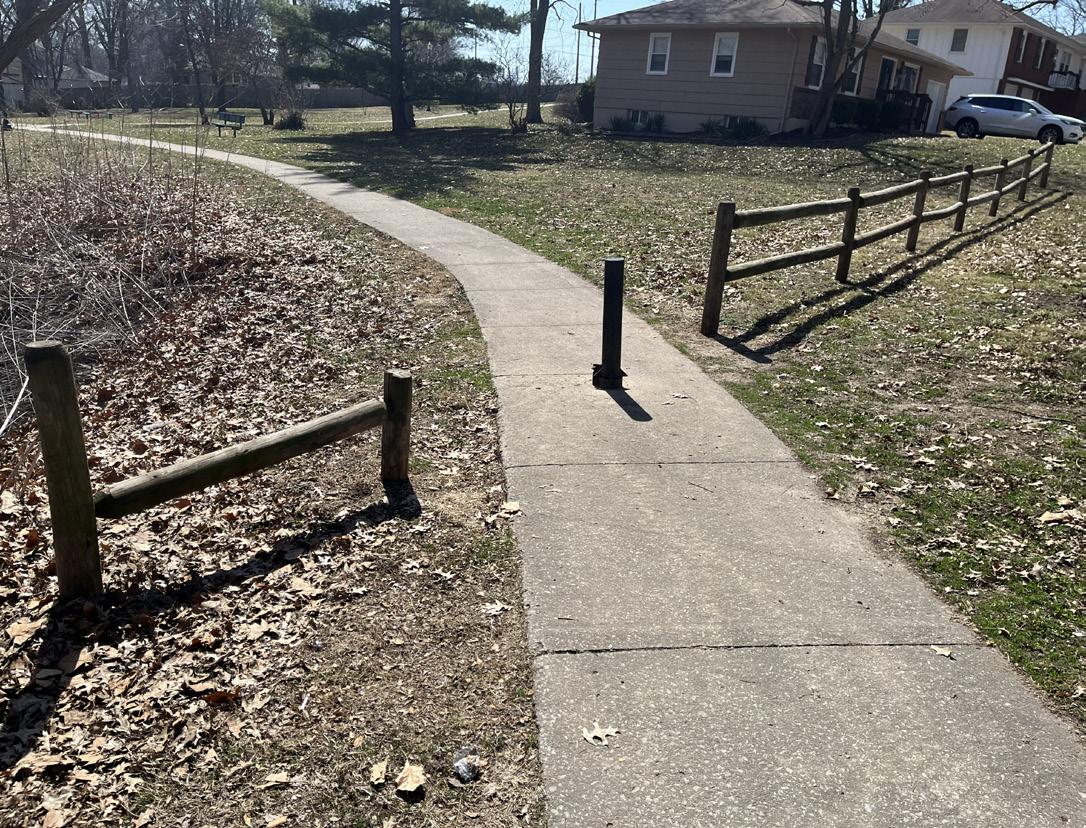
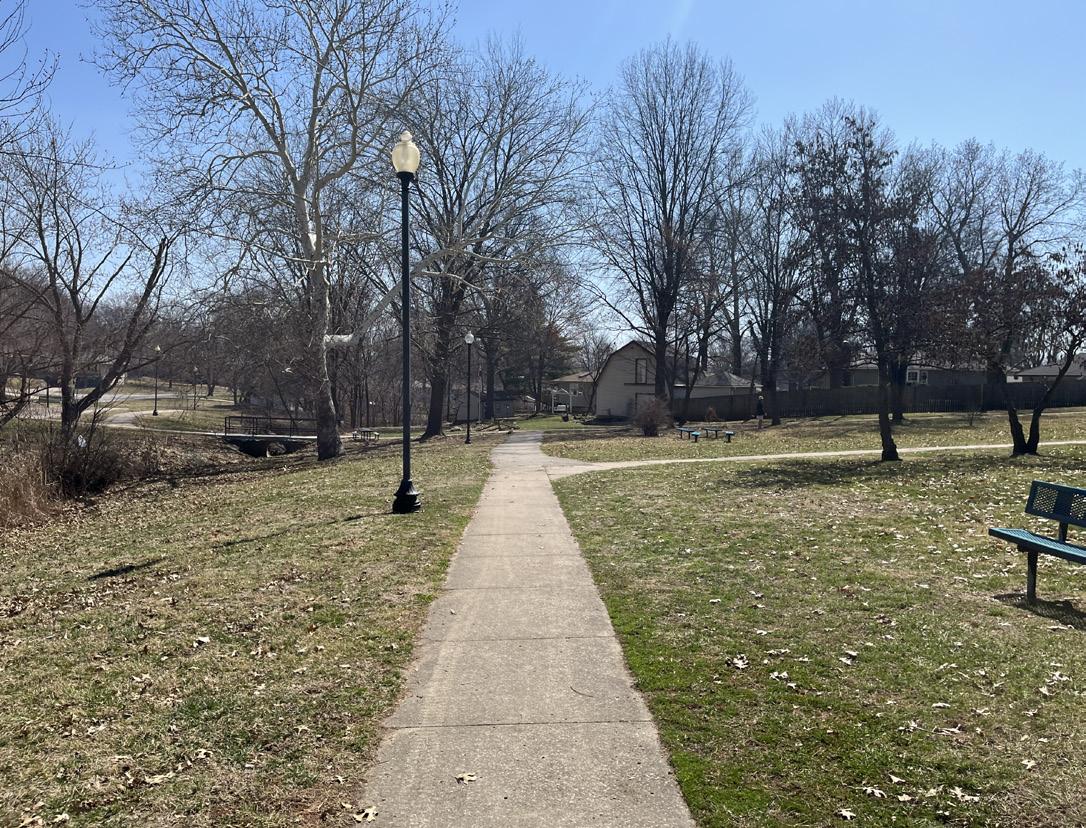
Name of Site: Vaile Mansion
Date Completed: September, 2025
Completed By: Avery Nichols
1500 N. Liberty St., Independence, MO 64050
The Vaile Mansion Museum is located on North Liberty Street near downtown Independence.
Size: 3.8 acres
Classification: Historic Site
3.
Signage (Fair Condition) Fence (Poor Condition)
4.
Strengths: The 3 story museum displays a traditional lawn and landscape with an outdoor seating area.
Opportunities: This historic site has the opportunity to re-furbish some of the outdoor amenities such as the fencing located along North Liberty Street, as well as an opportunity for new seating in the outdoor courtyard area.
Rating: 2 (Moderate Accessibility)
- The site has a new sidewalk along West 2nd Street South and Jones Street that creates accessible entry into the site, but lacks perimeter sidewalks along Liberty and Osage Street. There is a parking lot on site creating entry into the museum with stairs.
Active/Passive: Passive
7. PHOTO INVENTORY:
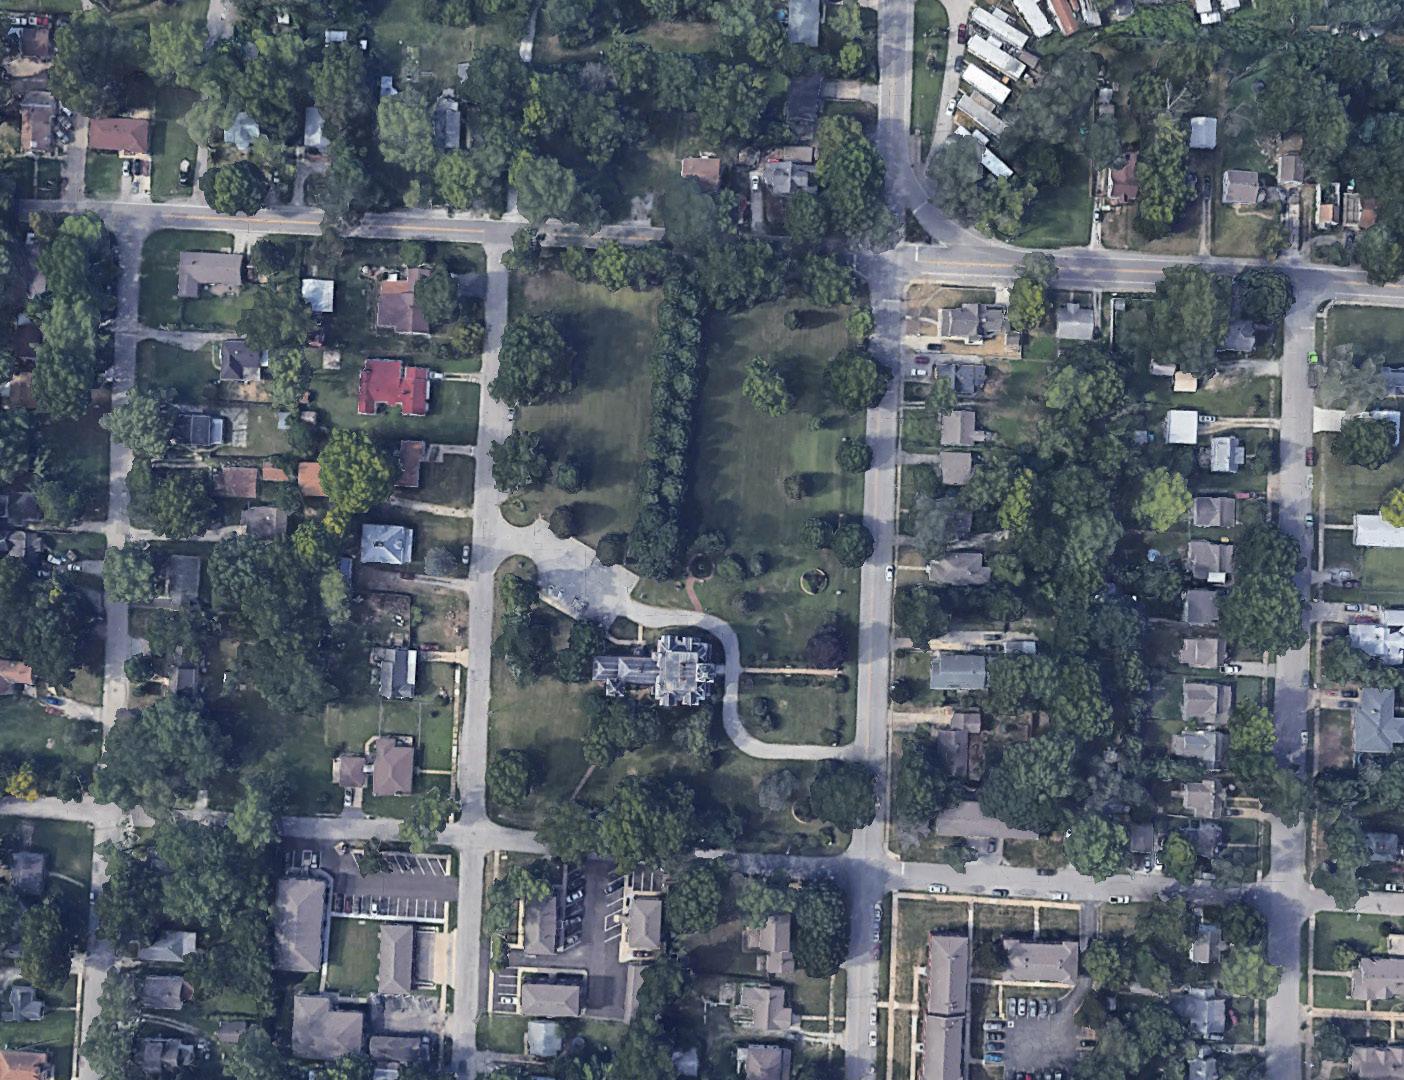
Name of Site: Van Hook Park
Date Completed: March, 2025
Completed By: Avery Nichols and Bennet McCoy
3231 S Shrank Rd., Independence, MO 64055
The site sits just south of the center of the Independence city limit. It is located between Crackerneck Rd. and M-291 Hwy.
Size: 113.8 acres
Classification: Regional Park
(4) Fields (Poor Condition)
Restrooms (Portapotty) (Poor Condition)
Signage (Poor Condition)
Note: This park sits on an old landfill site that limits the use of its amenities due to the trash.
Strengths: The park has a lot of space for events and future programming.
Opportunities: There is an opportunity to refurbish existing fields and facilities while adding pedestrian trails and amenities. There is also opportunity to develop playground spaces or other sport courts.
Rating: 4 (Low Accessibility)
- Access to the site is currently closed due to declining site conditions. Sidewalk access on site from the parking lots are not considered ADA accessible.
Active/Passive: Passive
7. PHOTO INVENTORY:
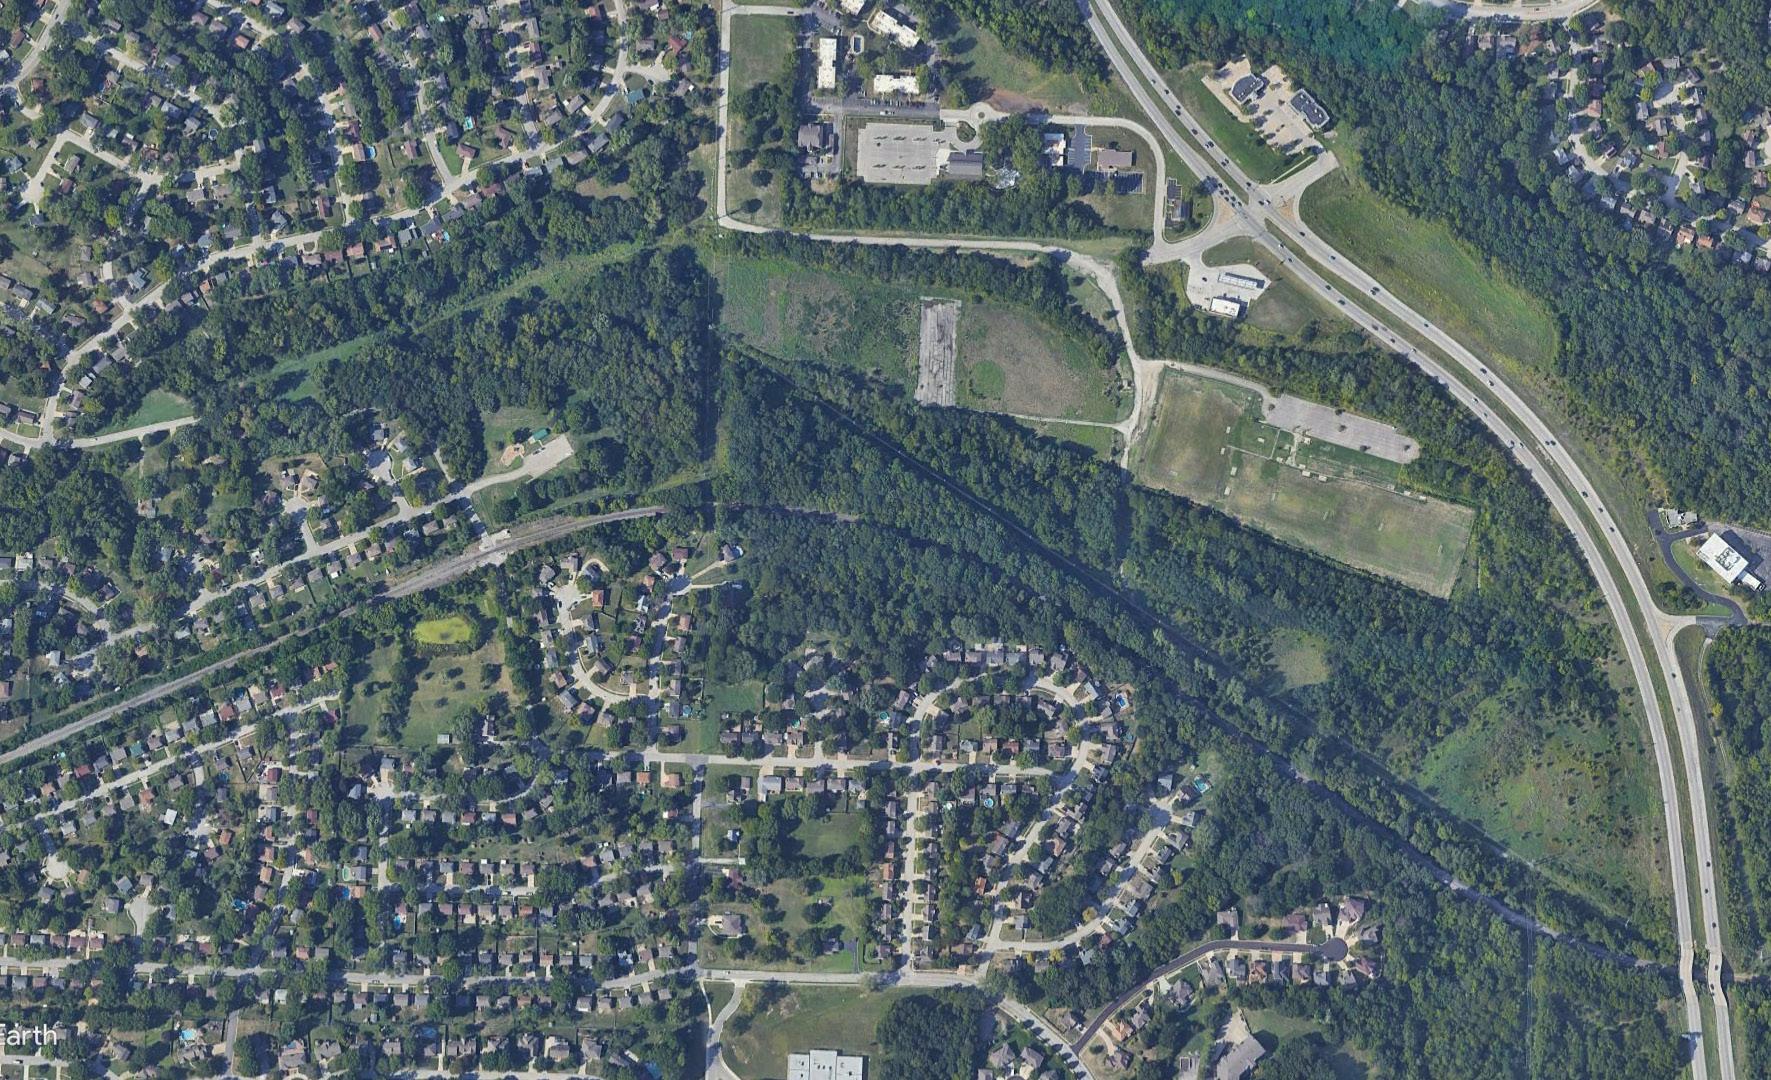
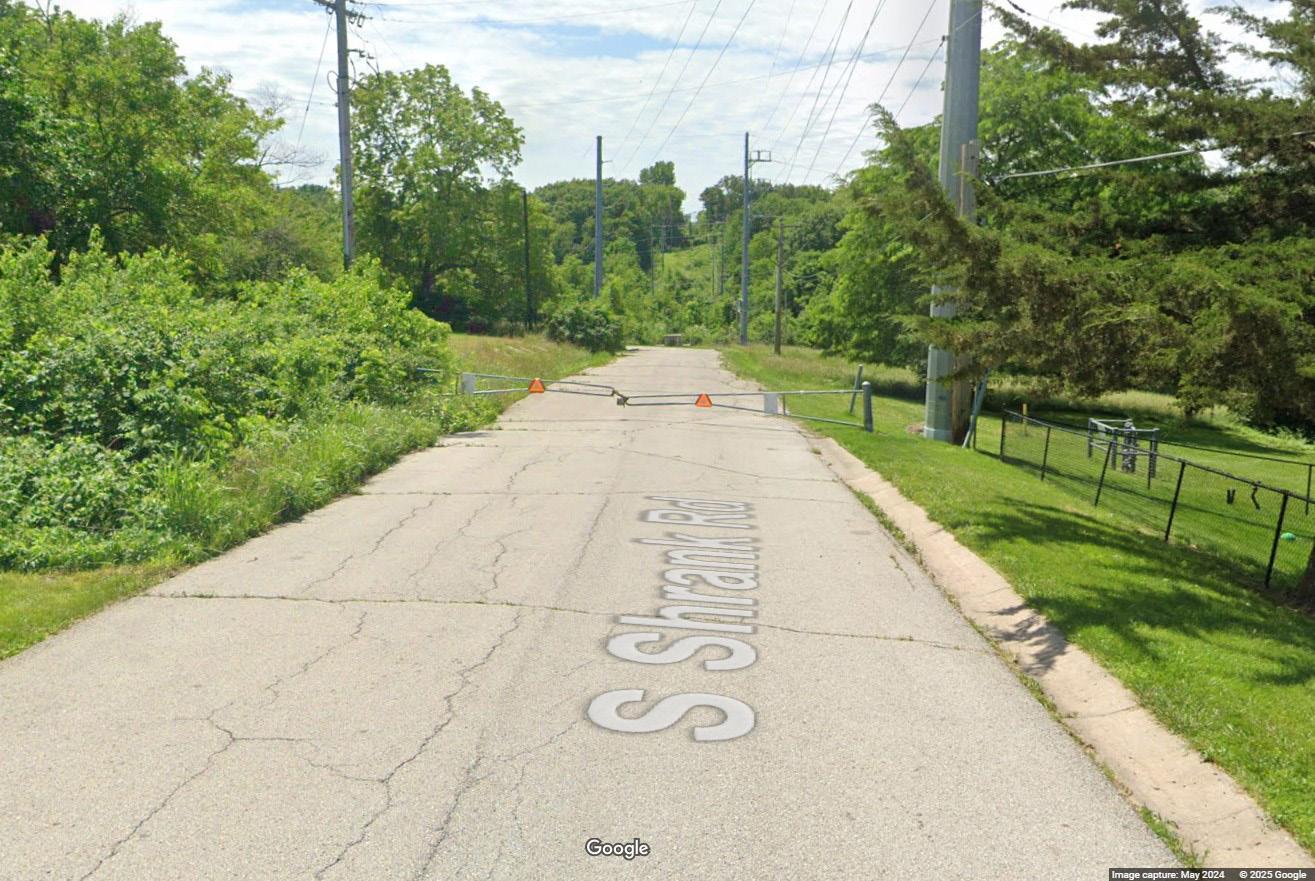
Name of Site: Waterfall Park
Date Completed: March, 2025
Completed By: Avery Nichols and Bennet McCoy
4501 S Bass Pro Dr, Independence, MO 64055
The site is located south of the center of the Independence city limit. It is located along Bass Pro Dr. and is adjacent to a Bass Pro Shop as a part of a connected campus.
Size: 49.6 acres
Classification: Regional Park
3. INVENTORY OF FACILITY AMENITIES AND CONDITIONS:
Picnic Shelters (Fair Condition)
Picnic Tables (Fair Condition)
Playgrounds (Good Condition)
Restrooms (Fair Condition)
Signage (Fair Condition)
Walking Path (Fair Condition)
Cornhole (Fair Condition)
Grill (Fair Condition)
Fishing Pier (Good Condition)
4. STRENGTHS AND OPPORTUNITIES:
Strengths: The park has ample parking and mature trees that shade play amenities and a shelter for gatherings. The site has easy access via Bass Pro Dr. It has a unique amenity with an overlook platform on the lake.
Opportunities: There are opportunities to improve some of the walking path sections as well as improving the quality of the restroom facility.
Rating: 1 (High Accessibility)
- There is a parking lot with ramp access into the site from sidewalks that also connect to a loop trail. There is a loop trail within the park that connects the park amenities and a loop trail around the lake that creates access to nearby attractions.
Active/Passive: Passive
7. PHOTO INVENTORY:
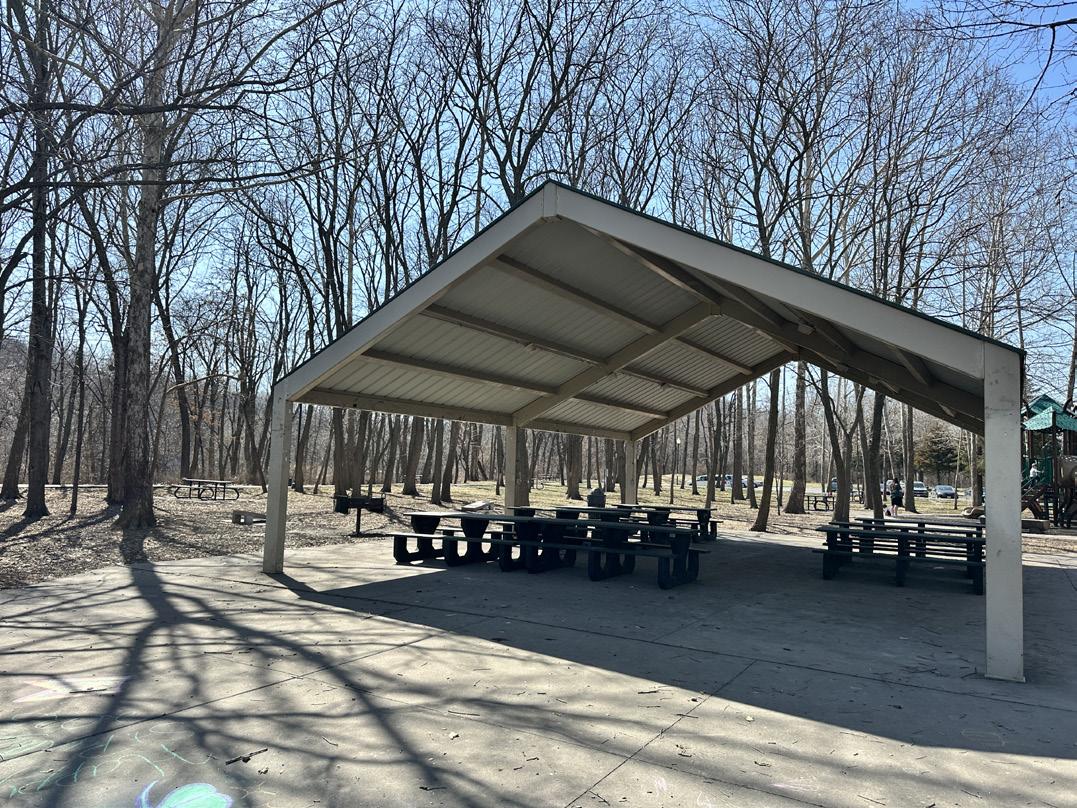
Name of Site: Woodlawn Cemetery
Date Completed: September, 2025
Completed By: Avery Nichols
701 S. Noland Rd. Independence, MO 64050
This site is centrally located near downtown Independence.
Size: 43 acres
Classification: Special-Use
Cemetery (Fair Condition)
4.
Strengths: This is a centrally located cemetery near downtown Independence, with an access road throughout the site.
Opportunities: The unique classification of this park does not allow for other programming uses, improvements can be made to the road within the site.
Rating:
5 (Low Accessibility)
- Access to and through the site is by road.
GENERAL NOTES:
Active/Passive: Passive
7. PHOTO INVENTORY:
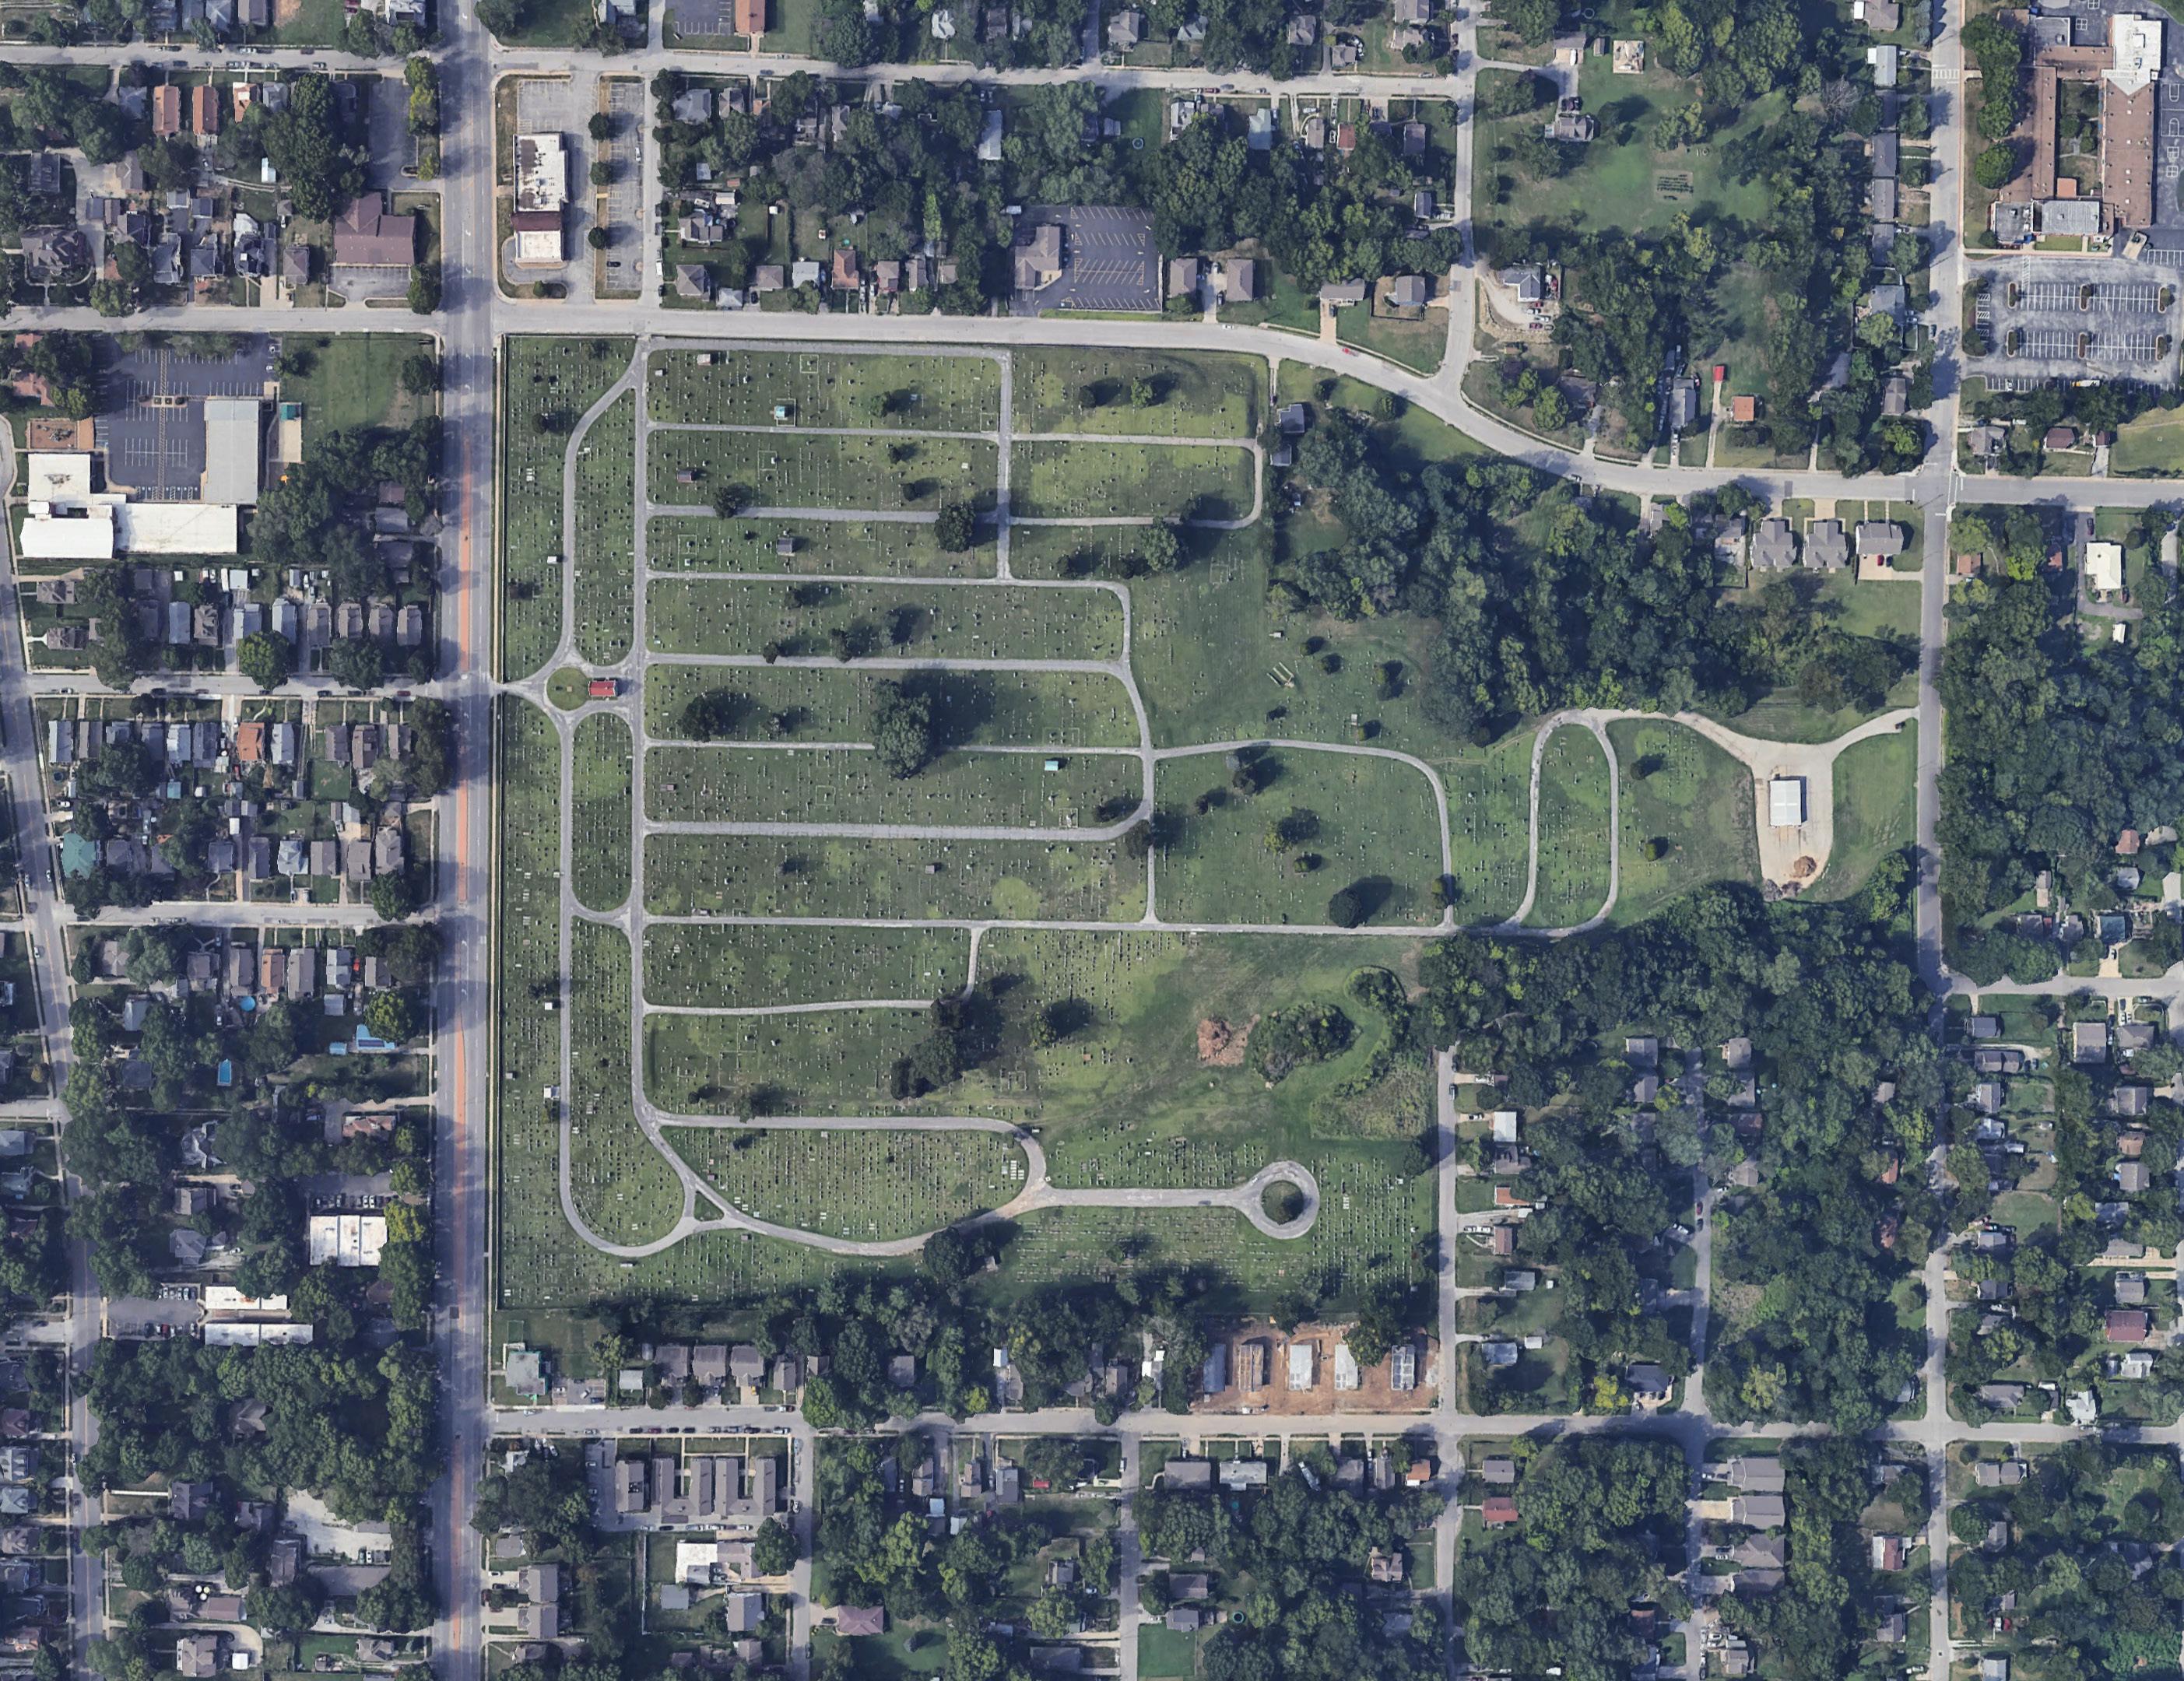
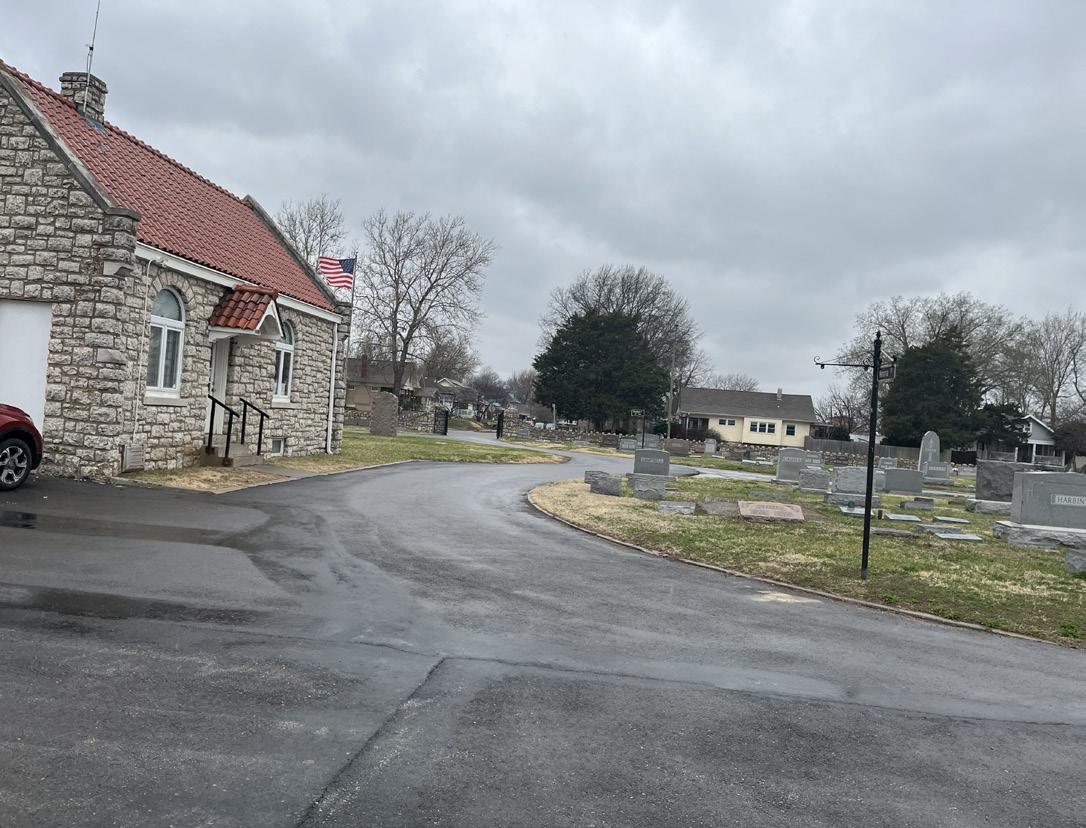
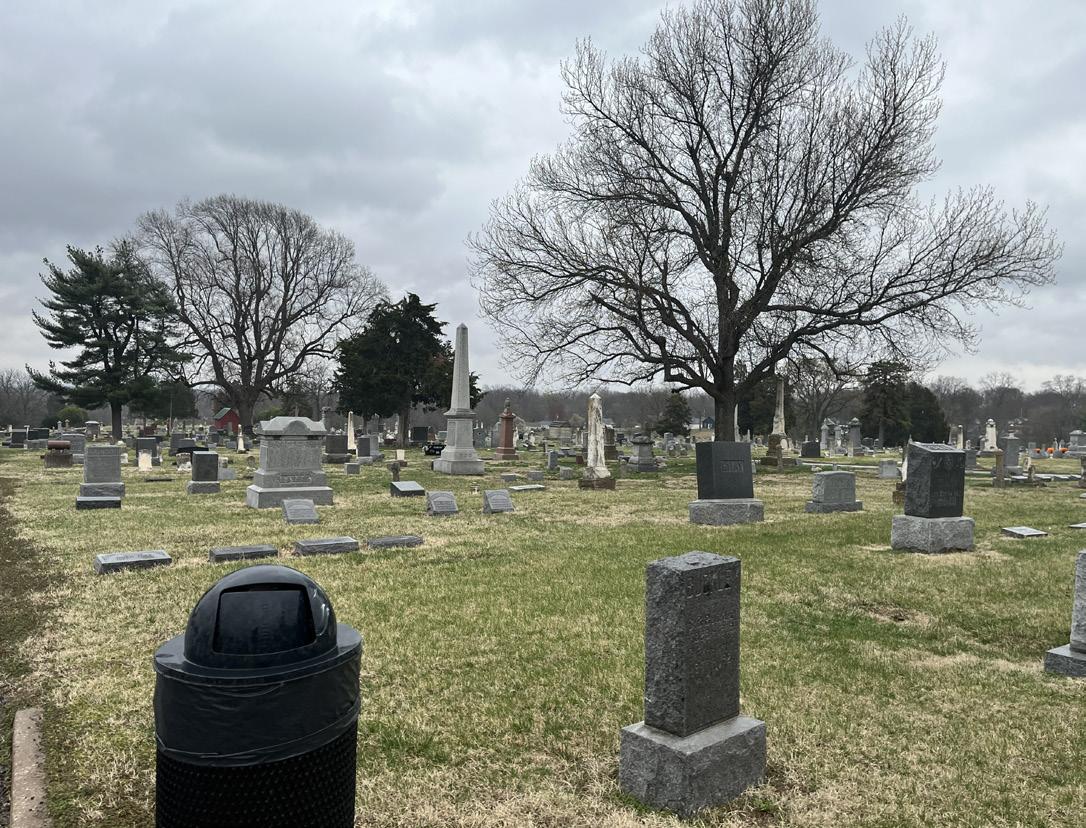
Name of Site: Young Park
Date Completed: March, 2025
Completed By: Avery Nichols and Bennet McCoy
405 N Dodgion St, Independence, MO 64050
The site sits northeast of downtown Independence, near the intersection of Noland Road and Truman Road.
Size: 1.5 acres
Classification: Neighborhood Park
3. INVENTORY OF FACILITY AMENITIES AND CONDITIONS:
Basketball Court (Poor Condition)
Small Playground (Fair Condition)
Signage (Fair Condition)
Walking Path (Poor Condition)
4.
Strengths: The park is adjacent to residential homes and has play amenities and a trail that weaves through some natural planting areas.
Opportunities: There is an opportunity to make better connections to the nearby apartments. The park can also be improved with a refurbished sport court and a new playground.
Rating:
3 (Moderate Accessibility)
- This park has no dedicated parking, with some on-street parking. There is access into the park from the street with a ramp leading to a sidewalk and loop trail around the park amenities.
Active/Passive: Passive
7. PHOTO INVENTORY:
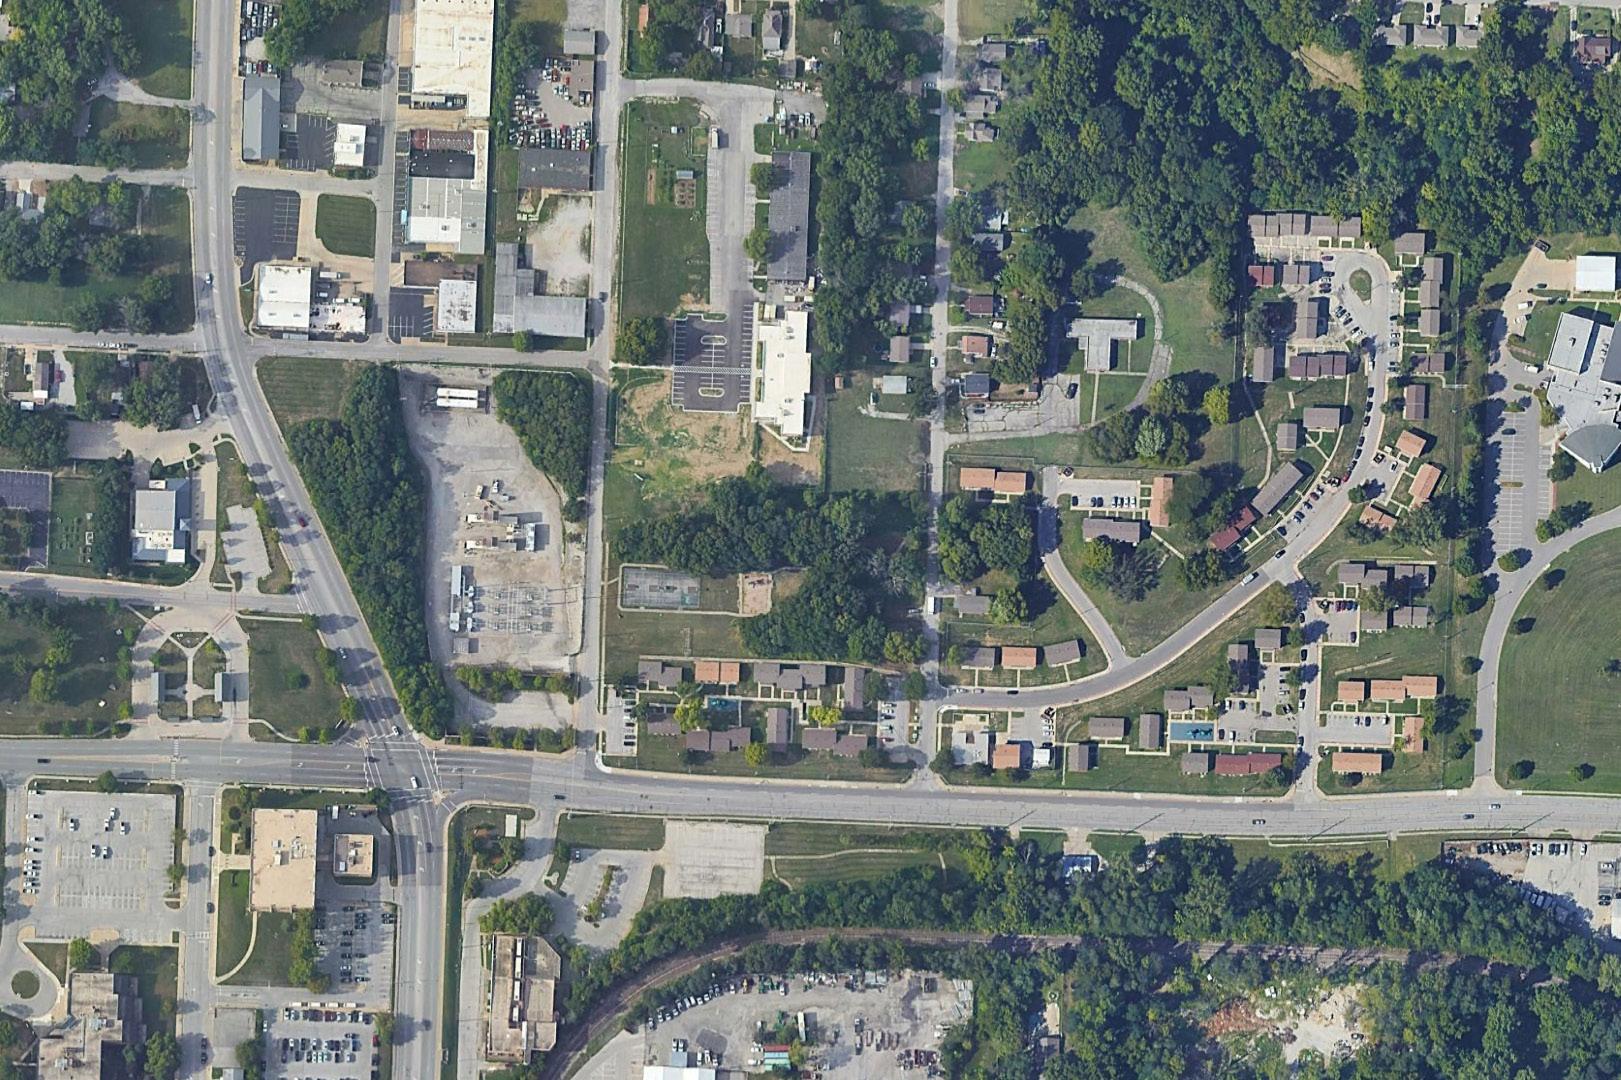
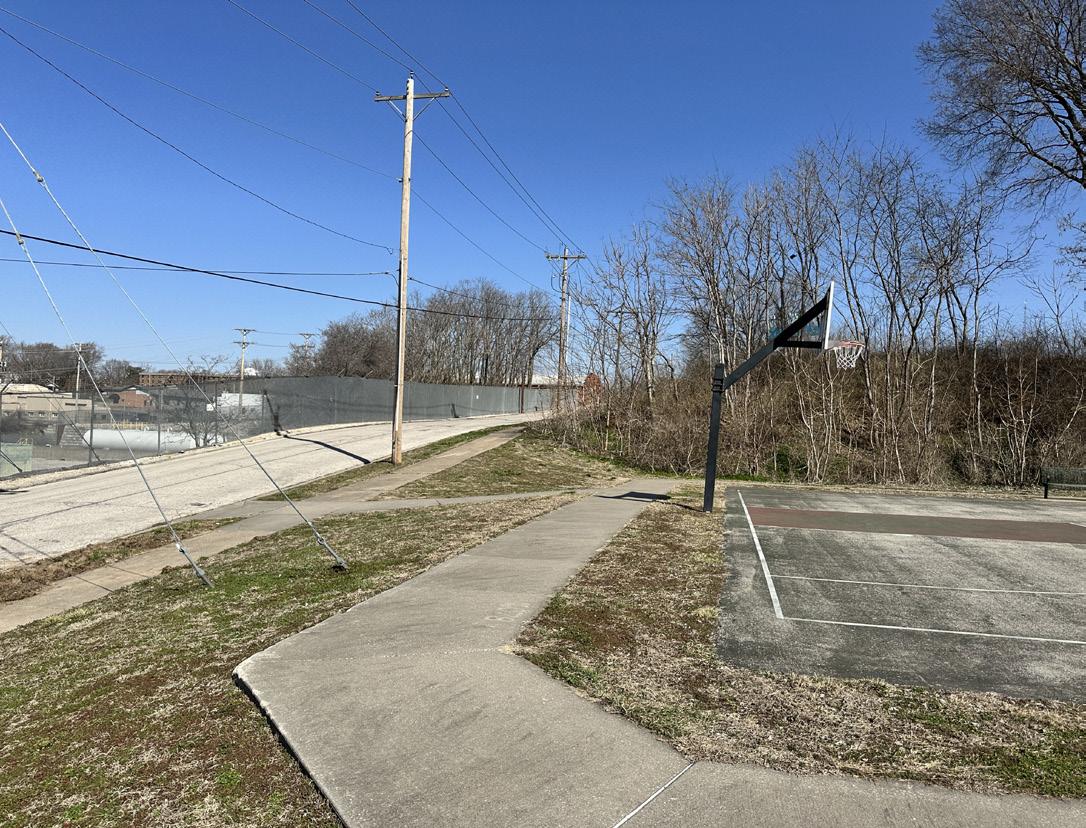
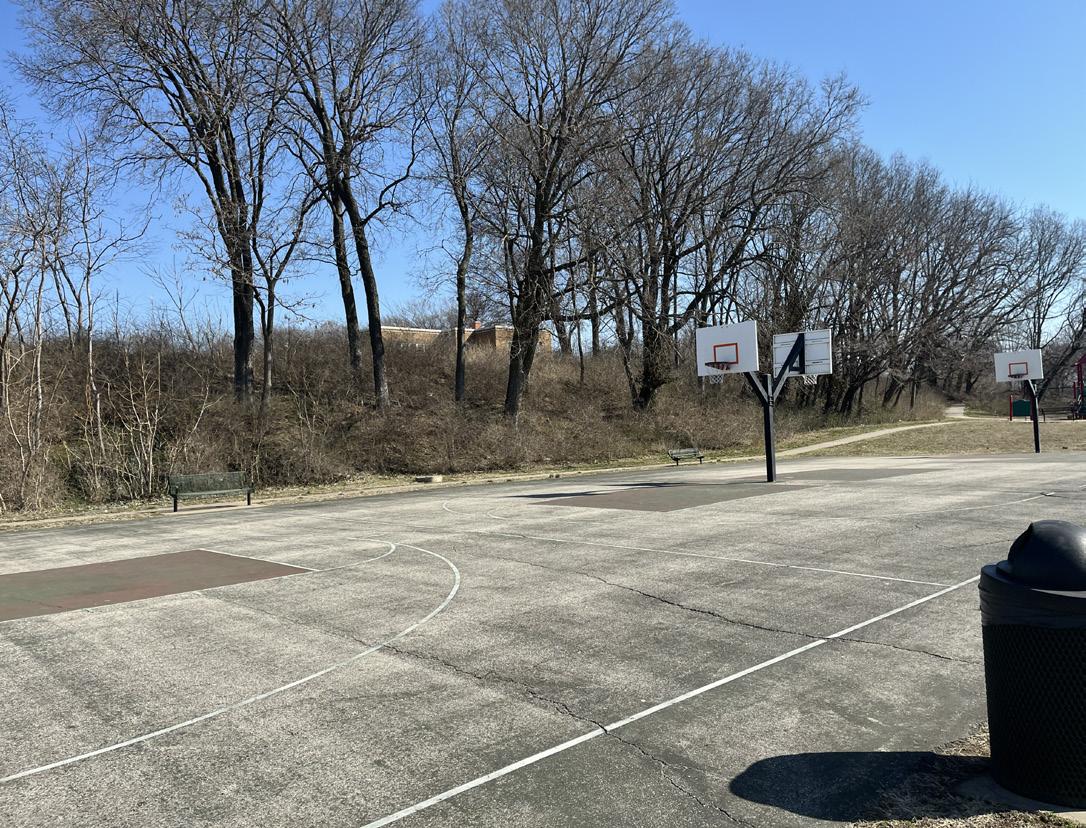
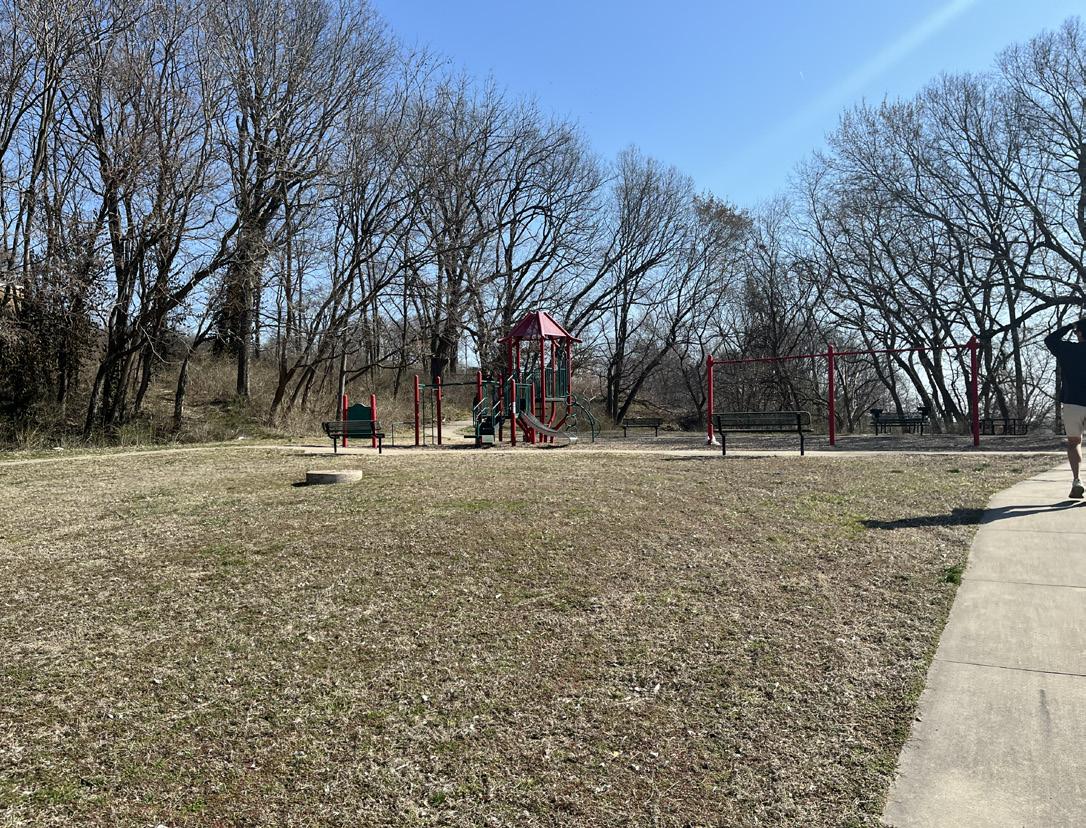
Name of Site: 39th Street - Off Street Trail
Date Completed: March, 2025
Completed By: Avery Nichols and Bennet McCoy
Little Blue Pkwy to Rd Mize Rd - Independence, MO 64057
This trail is located along E 39th Street stretching from Little Blue Parkway to Rd Mize Rd.
Size: 1.5 Miles
Classification: Off-Street Trail
3. INVENTORY OF FACILITY AMENITIES AND CONDITIONS:
Walking Path (Fair Condition)
4.
Strengths: The trail can fit multiple users at once and is located along the Southeastern portion of the city.
Opportunities: There is a need for signage along the trail for pedestrians. The space along the trail can also support amenities in the future such as shade and seating.
Rating:
1 (High Accessibility)
- This trail provides accessible sidewalks along the route.
Active/Passive: Passive
7. PHOTO INVENTORY:
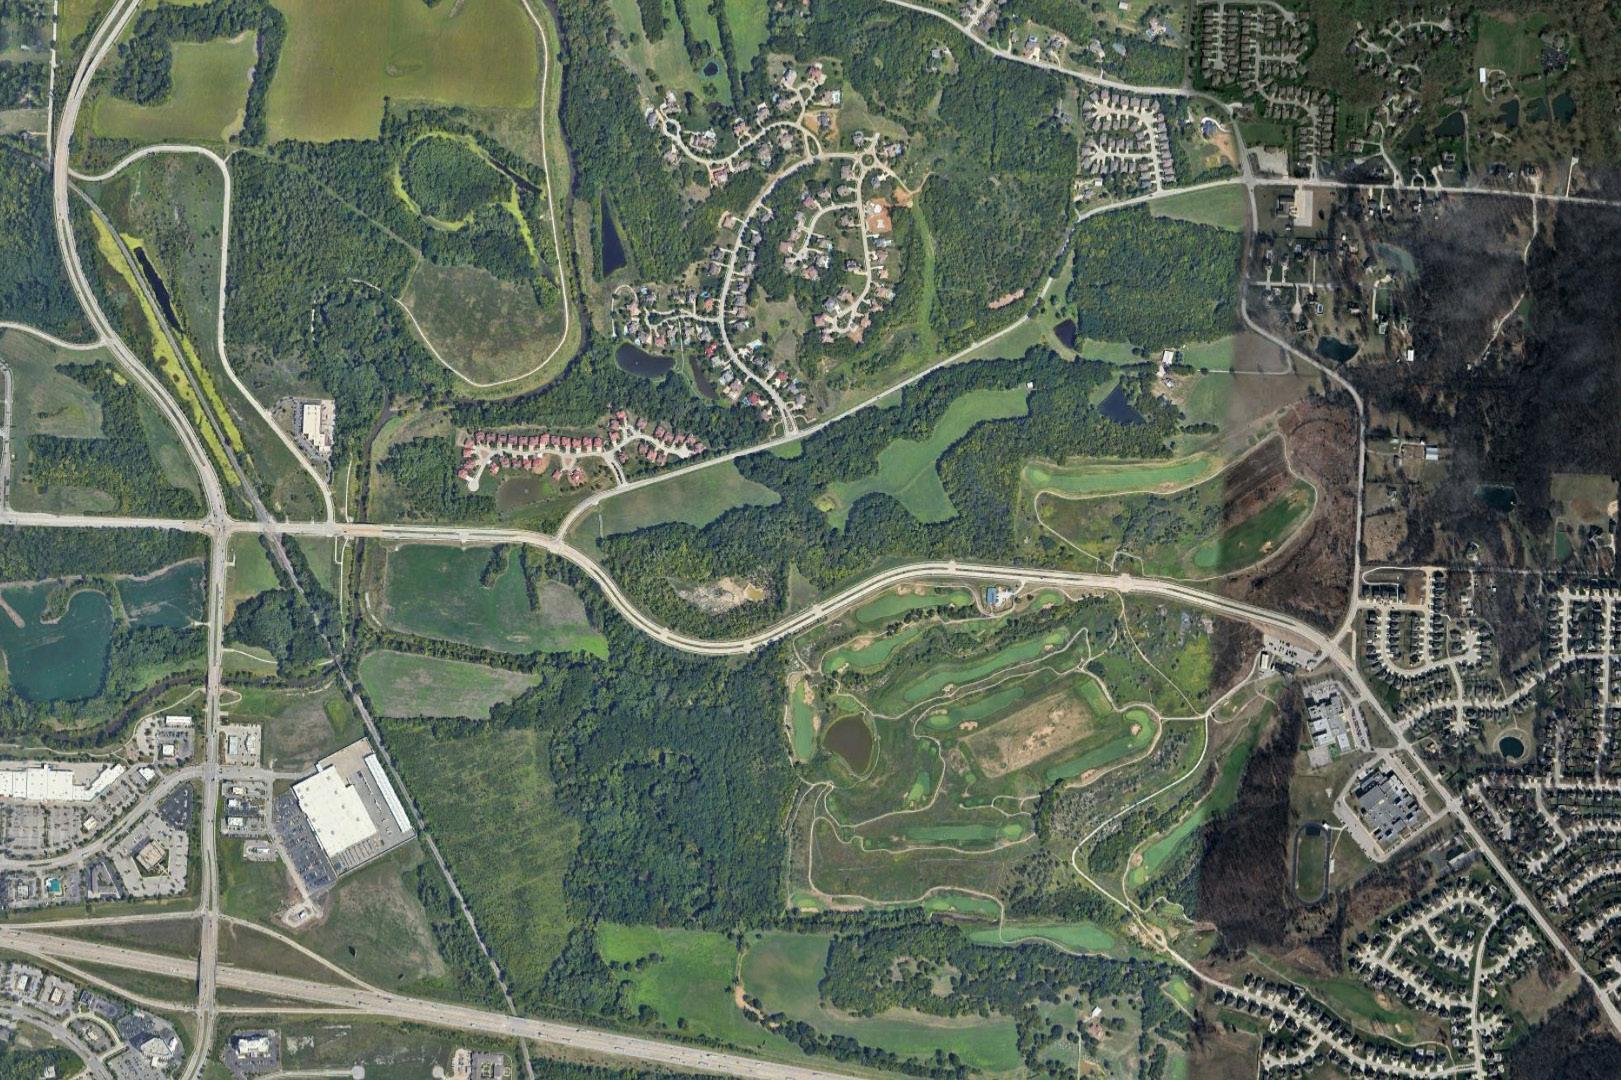
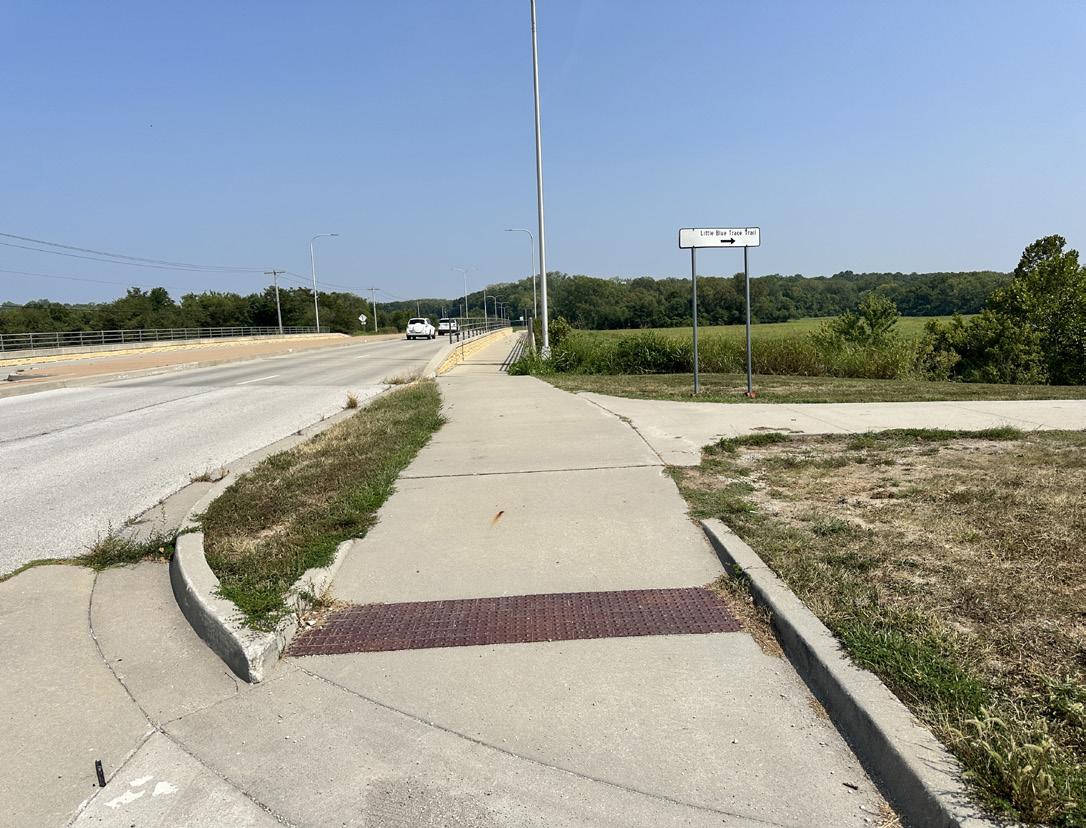
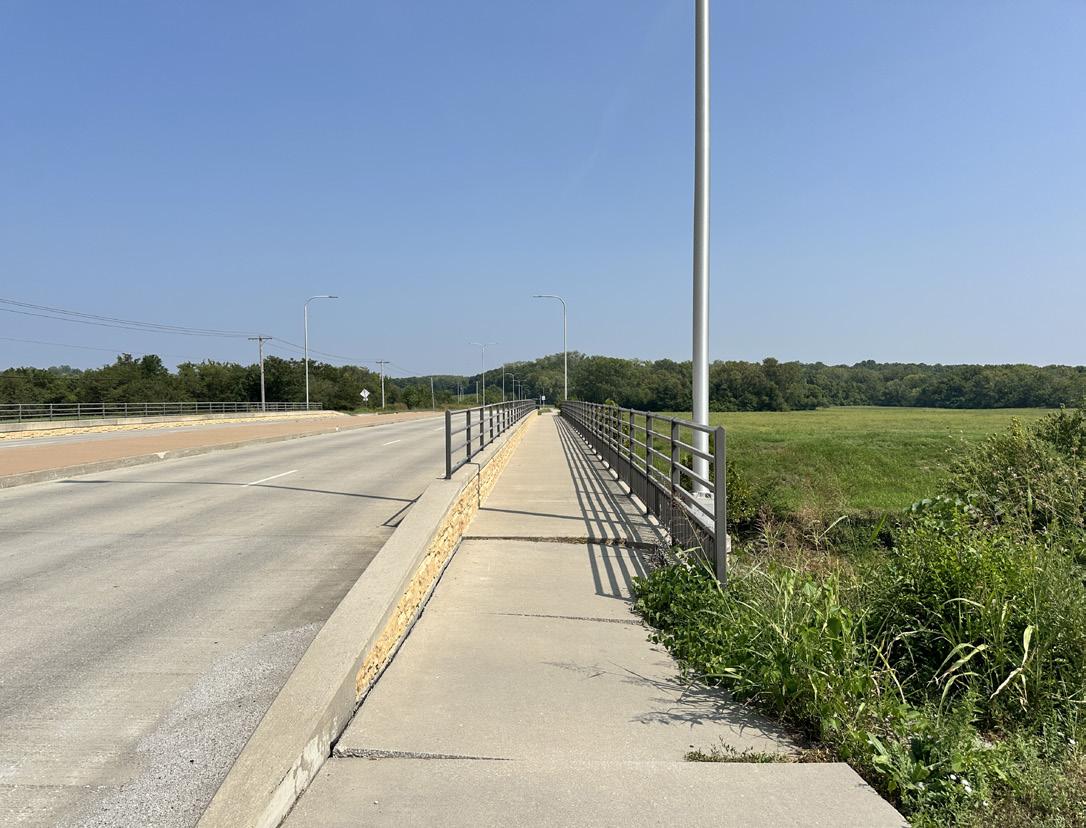
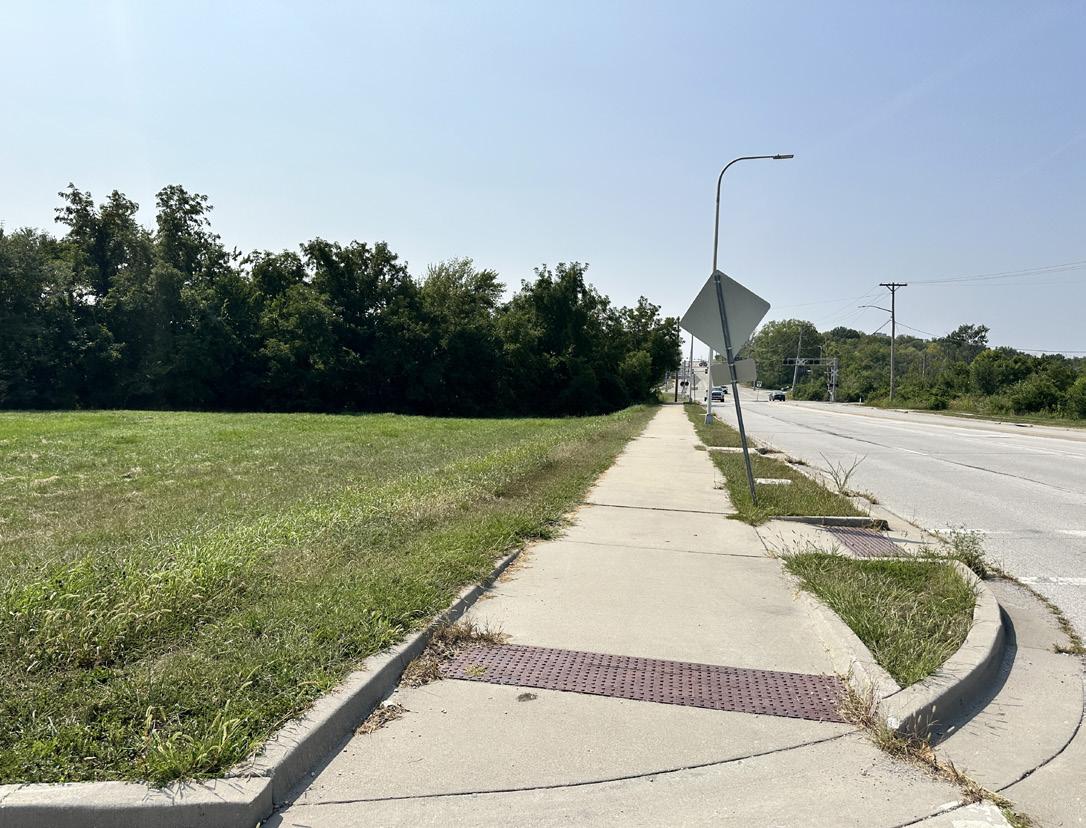
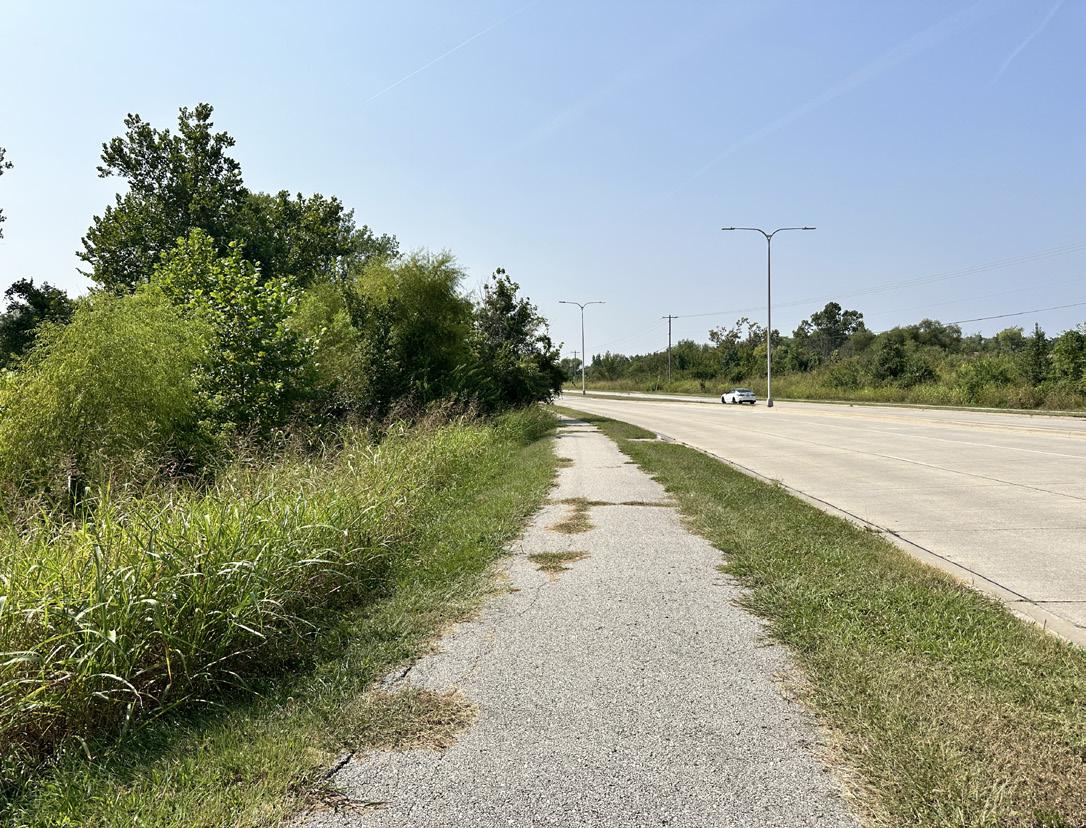
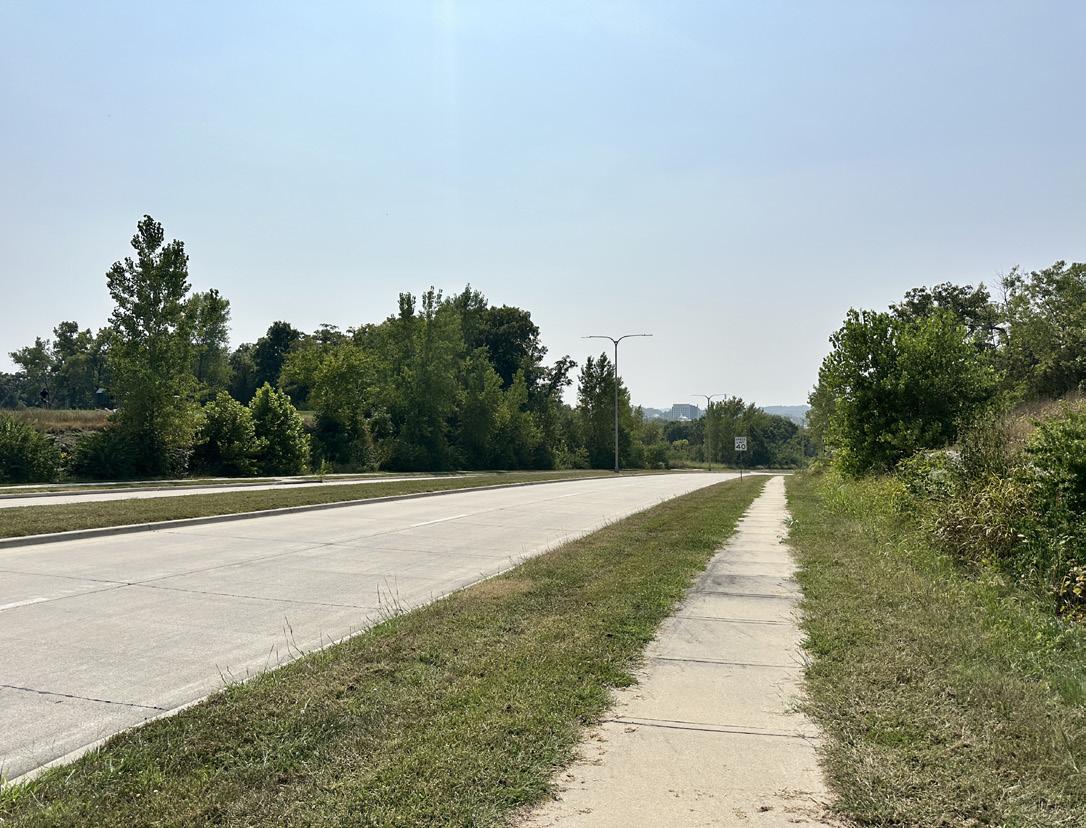
Name of Site: Fairmount Connector Trail
Date Completed: November, 2025
Completed By: Avery Nichols
Arlington Avenue to Fairmount Park, Independence MO 64053
This trail is located in northeast Independence and runs from Fairmount Park to the intersection of US Highway 24 and Huttig Avenue.
Size: .5 Miles
Classification: Linear Trail
3. INVENTORY OF FACILITY AMENITIES AND CONDITIONS:
Walking Path (Fair Condition)
4. STRENGTHS AND OPPORTUNITIES:
Strengths: This is a wide trail connecting a large park space, running through a residential area and along the railroad line.
Opportunities: There is a need for signage along the trail for pedestrians and the trail can be improved with a plaza terminus near the intersection of US highway 24 and Huttig avenue.
Rating:
1 (High Accessibility)
- This trail provides accessible sidewalks along the route.
Active/Passive: Passive
7. PHOTO INVENTORY:
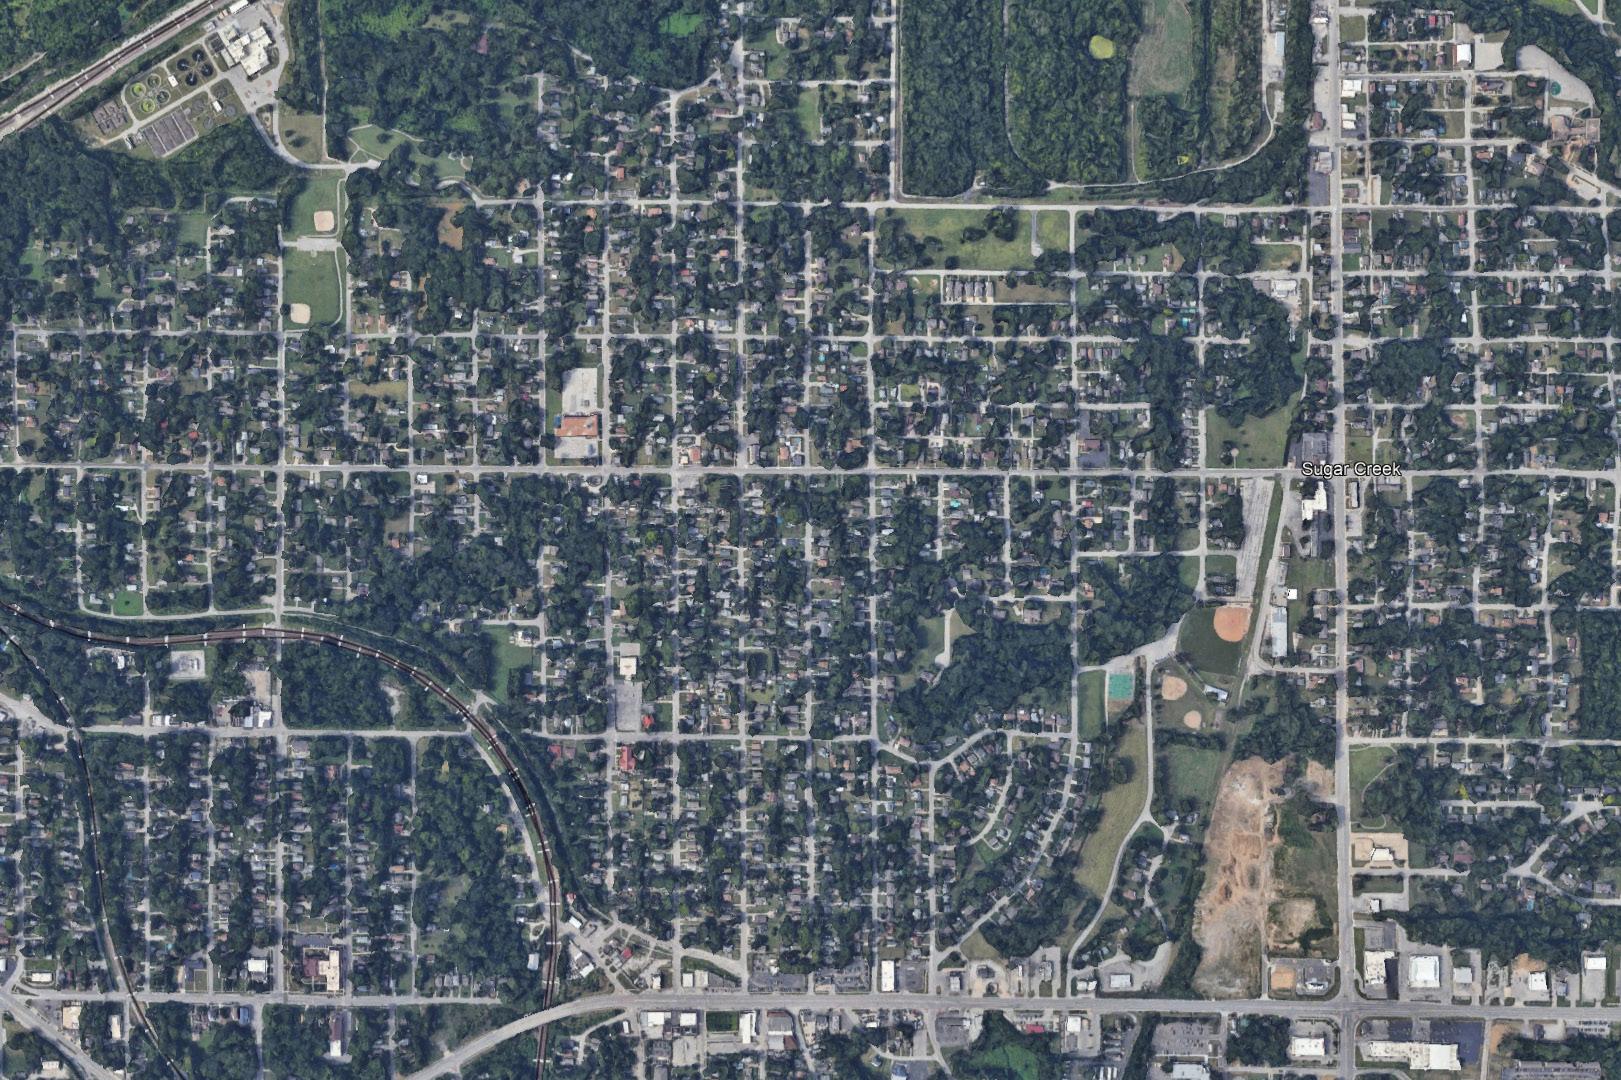
Name of Site: Hidden Valley Rd/RD Mize Rd Off-street Trail
Date Completed: March, 2025
Completed By: Avery Nichols and Bennet McCoy
M-291 Highway to Little Blue Trace Trail, Independence, MO 64057
This trail runs along Hidden Valley Road and Rd Mize Rd from M-291 Hwy to Little Blue Parkway.
Size: 2.1 miles
Classification: Off-street Trail
3. INVENTORY OF FACILITY AMENITIES AND CONDITIONS:
Signage (Poor Condition)
Walking Path (Fair Condition)
4.
Strengths: The trail has a grass median for most of the stretch which provides separation from the street.
Opportunities: There is opportunity to expand the grass median to some stretches of the trail that do not currently have one. Otherwise, there is opportunity for more signage or pedestrian crossing signals at some intersections.
Rating:
1 (High Accessibility)
- This trail provides accessible sidewalks along the route.
Active/Passive: Passive
7. PHOTO INVENTORY:
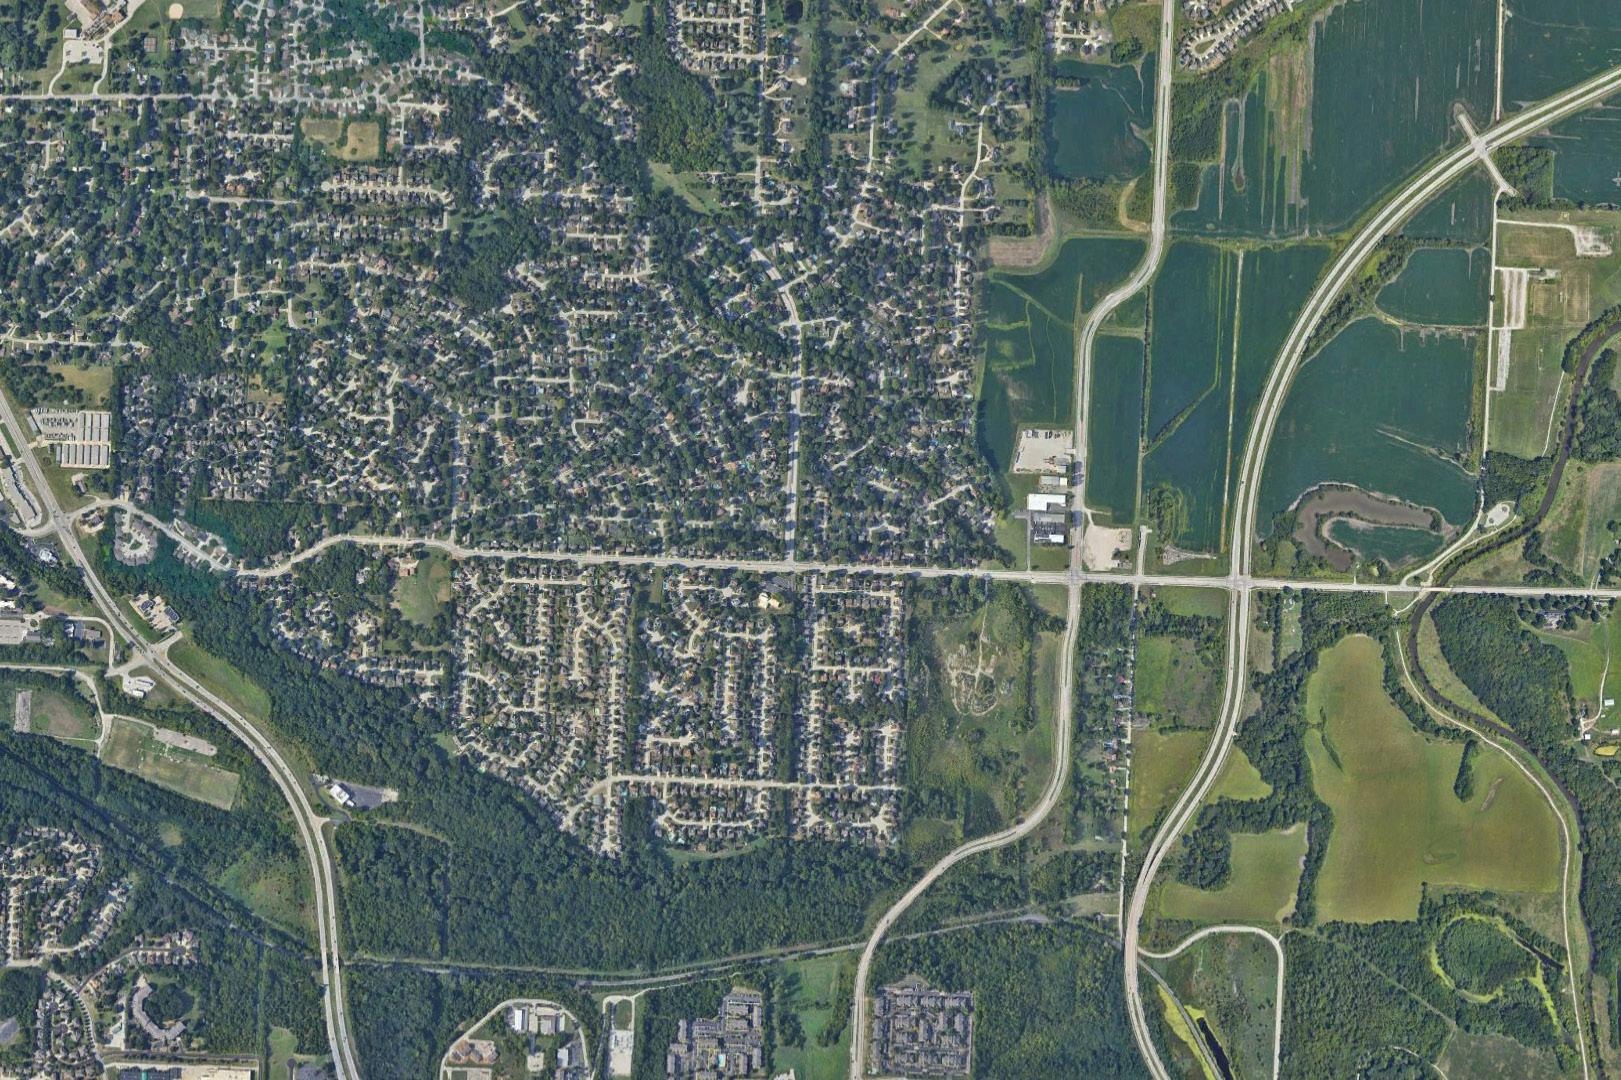
Trail has a vegetated buffer in some areas.
Some stretches of trails are newly
Refurbished crosswalk corner.
Intersection has pedestrian signals and crosswalks.
Some stretches have no median between trail and street making for close proximity to traffic.
Similar conditions with trail running along roadway traffic.
1.
Name of Site: Jackson Drive Off-street Trail
Date Completed: March, 2025
Completed By: Avery Nichols and Bennet McCoy
39th St to M-78 Hwy, Independence, MO 64057
This trail follows along side Jackson Dr and connects 39th St to M-78 Highway.
Size: 1.5 miles
Classification: Off-street Trail
3. INVENTORY OF FACILITY AMENITIES AND CONDITIONS:
Signage (Poor Condition)
Walking Path (Fair Condition)
4. STRENGTHS AND OPPORTUNITIES:
Strengths: The trail has pedestrian signals at each intersection it reaches.
Opportunities: There is potential to add more planting to the existing grass median.
Rating:
1 (High Accessibility)
- This trail provides accessible sidewalks along the route.
Active/Passive: Passive
7. PHOTO INVENTORY:
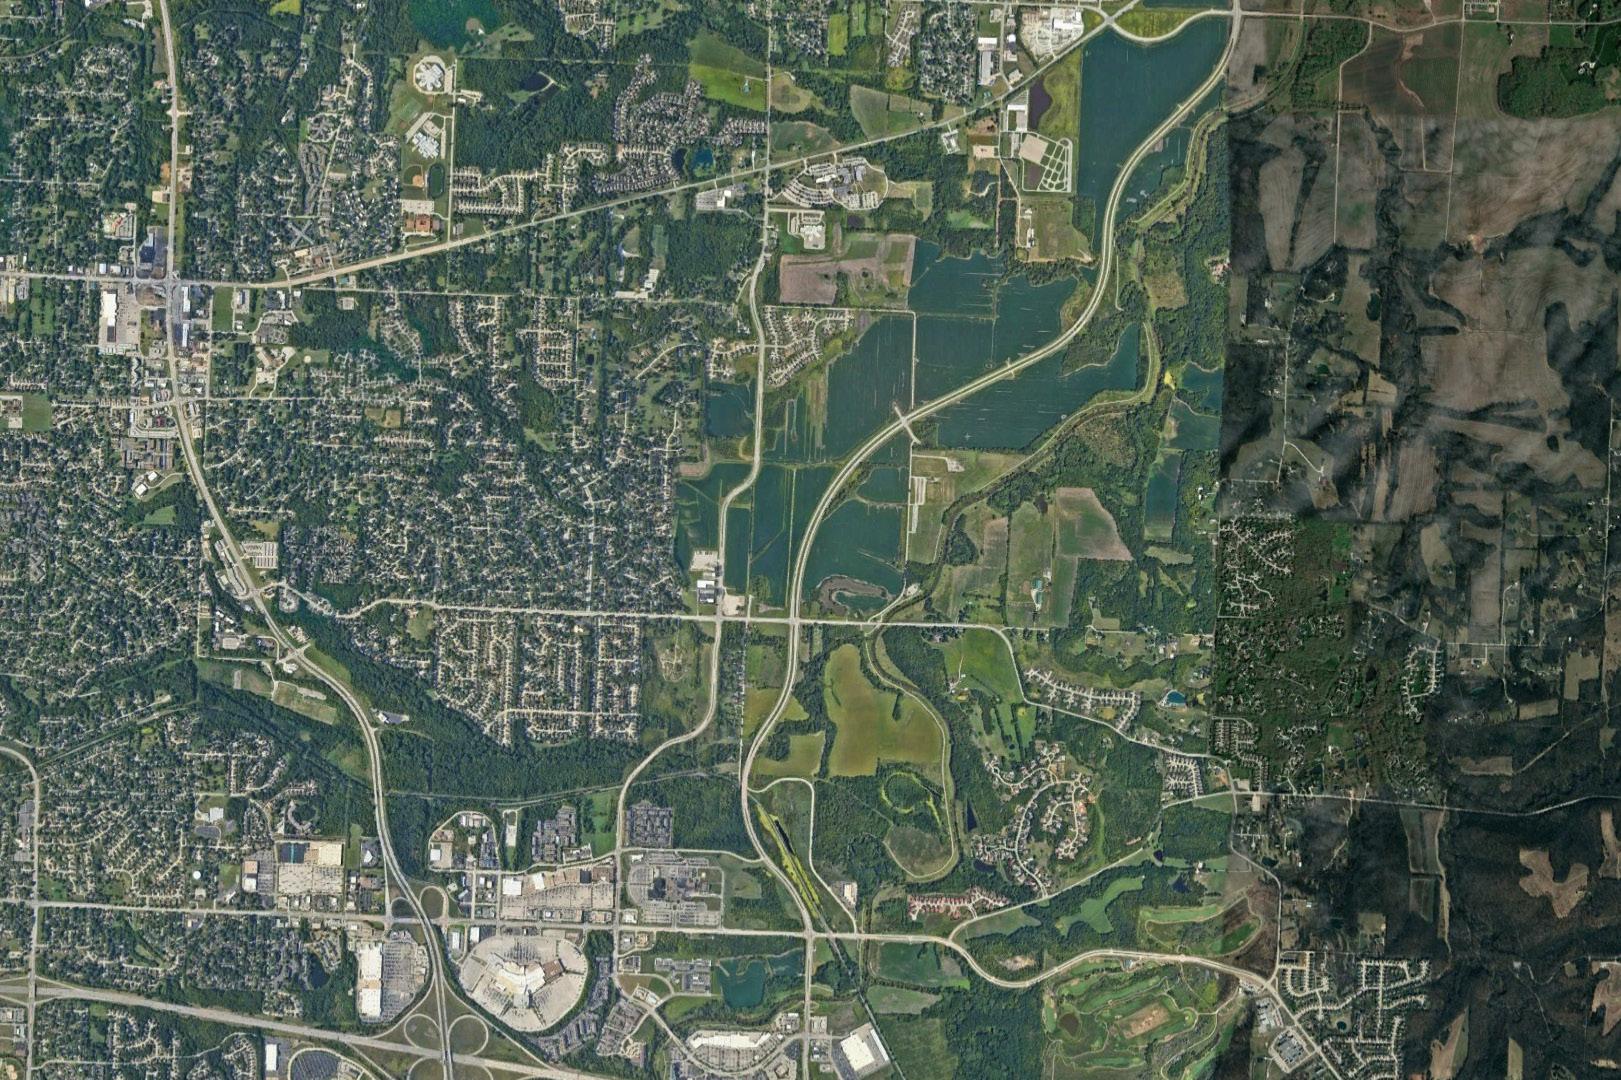
Trail conditions for a majority of the trail length.
Name of Site: Little Blue Pkwy Off-street Trail
Date Completed: March, 2015
Completed By: Avery Nichols and Bennet McCoy
24 Hwy to south of 40 Hwy, MO 64055
This trail runs along Little Blue Parkway in the southern area of Independence.
Size: 8.6 miles
Classification: Off-street Trail
3. INVENTORY OF FACILITY AMENITIES AND CONDITIONS:
Signage (Poor Condition)
Walking Path (Poor Condition)
4. STRENGTHS AND OPPORTUNITIES:
Strengths: The trail is a concrete and asphalt material through stretches and has dedicated crosswalks across major roadways.
Opportunities: There is opportunity to improve trail conditions, pedestrian signage, and provide more crosswalk signals and signage across streets that do not have those amenities.
Rating:
1 (High Accessibility)
- This trail provides accessible sidewalks along the route.
Active/Passive: Passive
7. PHOTO INVENTORY:
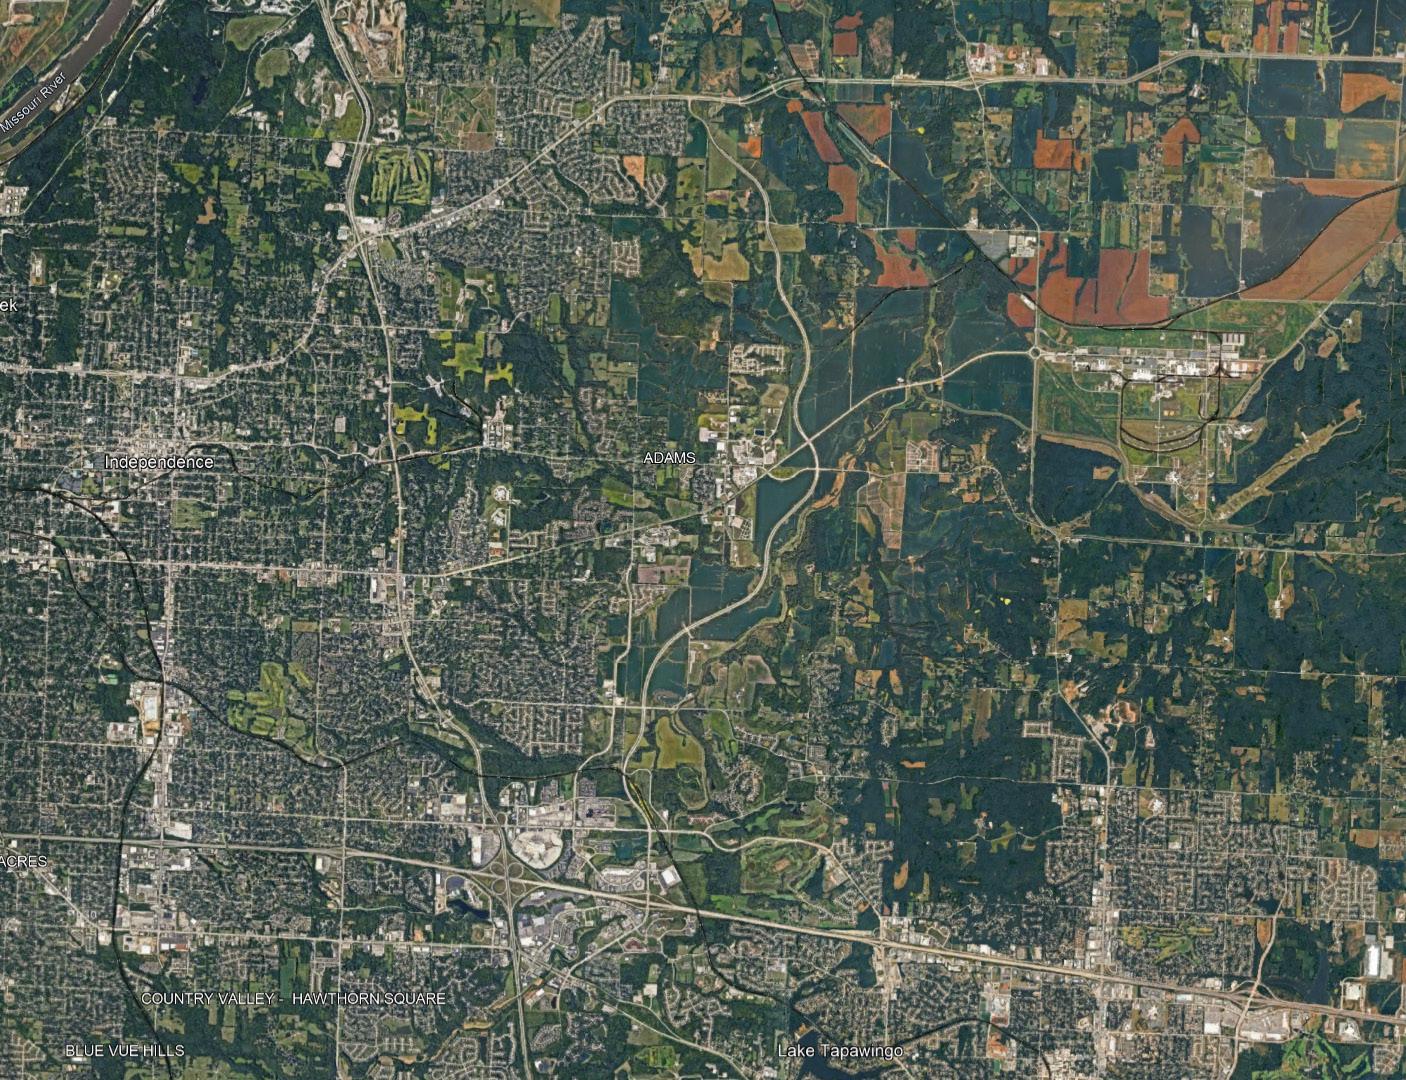
Name of Site: McCoy Off-street Trail
Date Completed: March, 2025
Completed By: Avery Nichols and Bennet McCoy
23rd St to Santa Fe Trail Park, MO 64055
This trail runs along Santa Fe Road to 23rd street.
Size: 0.77 miles
Classification: Off-street Trail
3. INVENTORY OF FACILITY AMENITIES AND CONDITIONS:
Signage (Poor Condition)
Walking Path (Fair Condition)
4.
Strengths: The trail is a part of the city's three historic trails and provides access to a large park.
Opportunities: There is an opportunity to improve the trail conditions along the road with a planted median or change in material to help define separation between the trail and the road.
Rating:
1 (High Accessibility)
- This trail provides accessible sidewalks along the route.
Active/Passive: Passive
7. PHOTO INVENTORY:
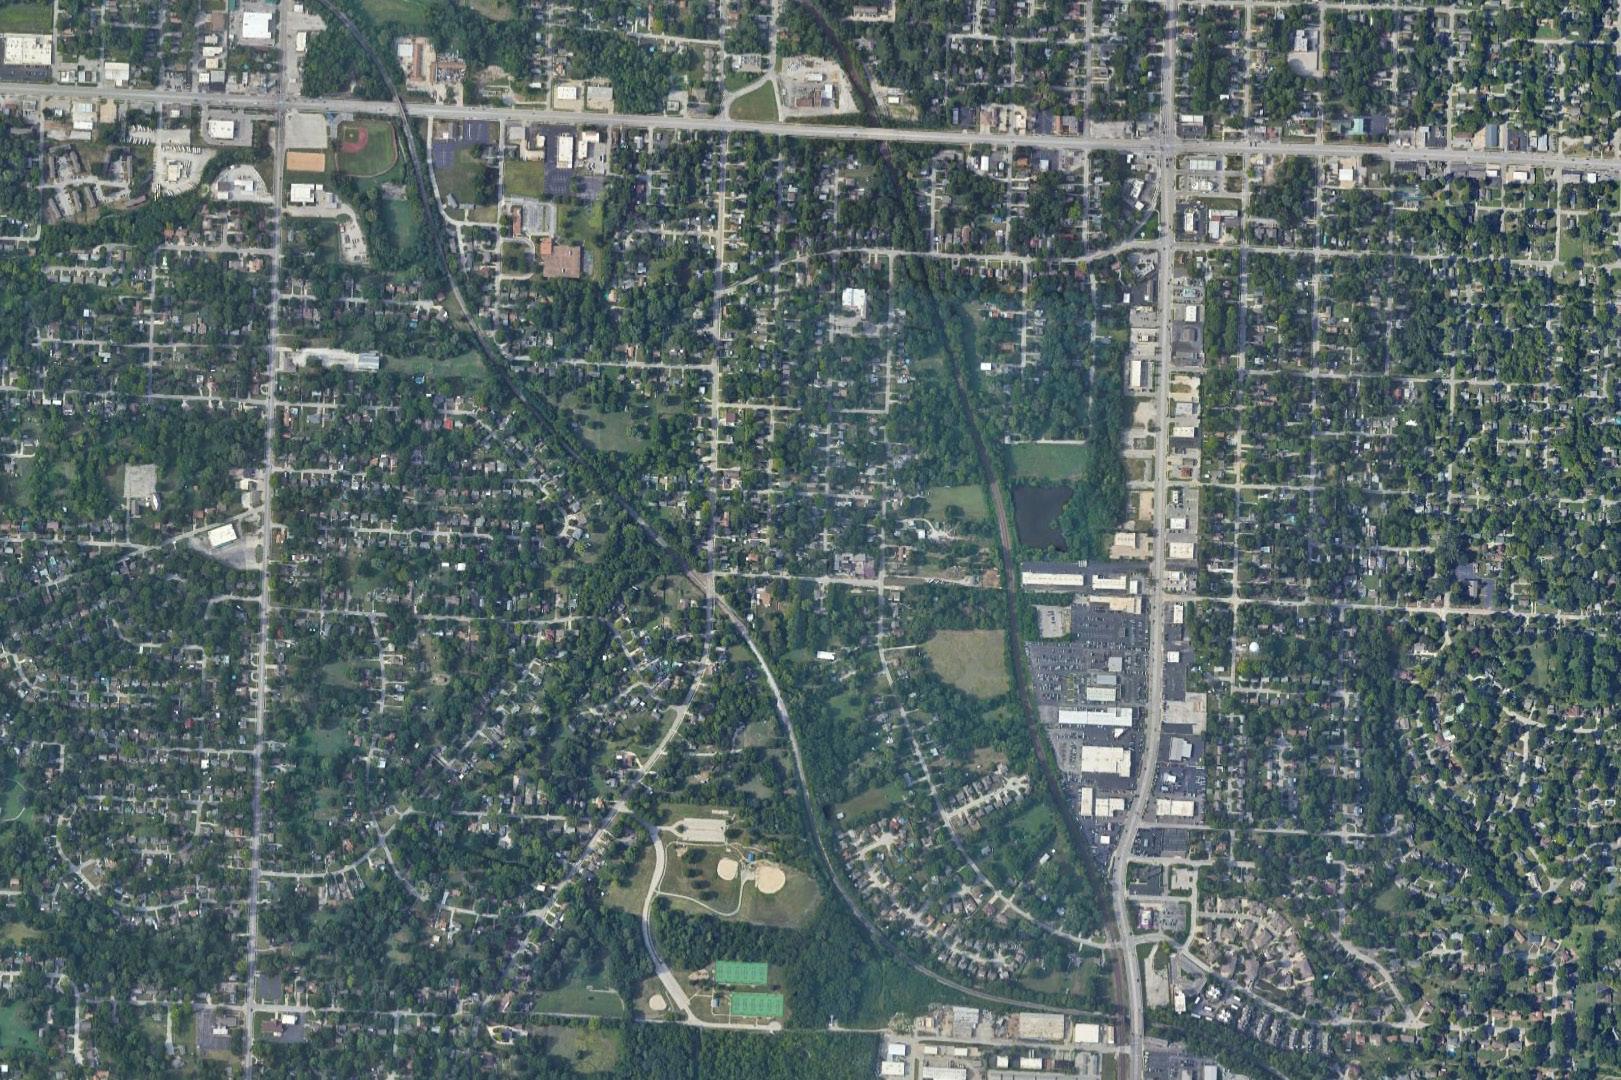
primarily through residential neighborhoods and has minimal signage and other amenities.
Historic trail signage.
Portion of trail with no planted median.
Name of Site: Mill Creek Trail to McCoy Park
Date Completed: March, 2025
Completed By: Avery Nichols and Bennet McCoy
1799 N River Blvd, Independence, MO 64050
This trail sits between Mill Creek Park and McCoy Park and connects the two through residential neighborhoods. Trail easement is on privately owned property.
Size: 0.5 miles
Classification: Linear Trail
3. INVENTORY OF FACILITY AMENITIES AND CONDITIONS:
Signage (Poor Condition)Walking Path (Fair Condition)
4. STRENGTHS AND OPPORTUNITIES:
Strengths: This is a width walking path with signage through the backside of neighborhoods, connecting the two parks.
Opportunities: There is an opportunity to improve signage or marking of the trail, making it more apparent to pedestrians.
Rating: 1 (High Accessibility)
- This trail provides accessible sidewalks along the route.
Active/Passive: Passive
7. PHOTO INVENTORY:
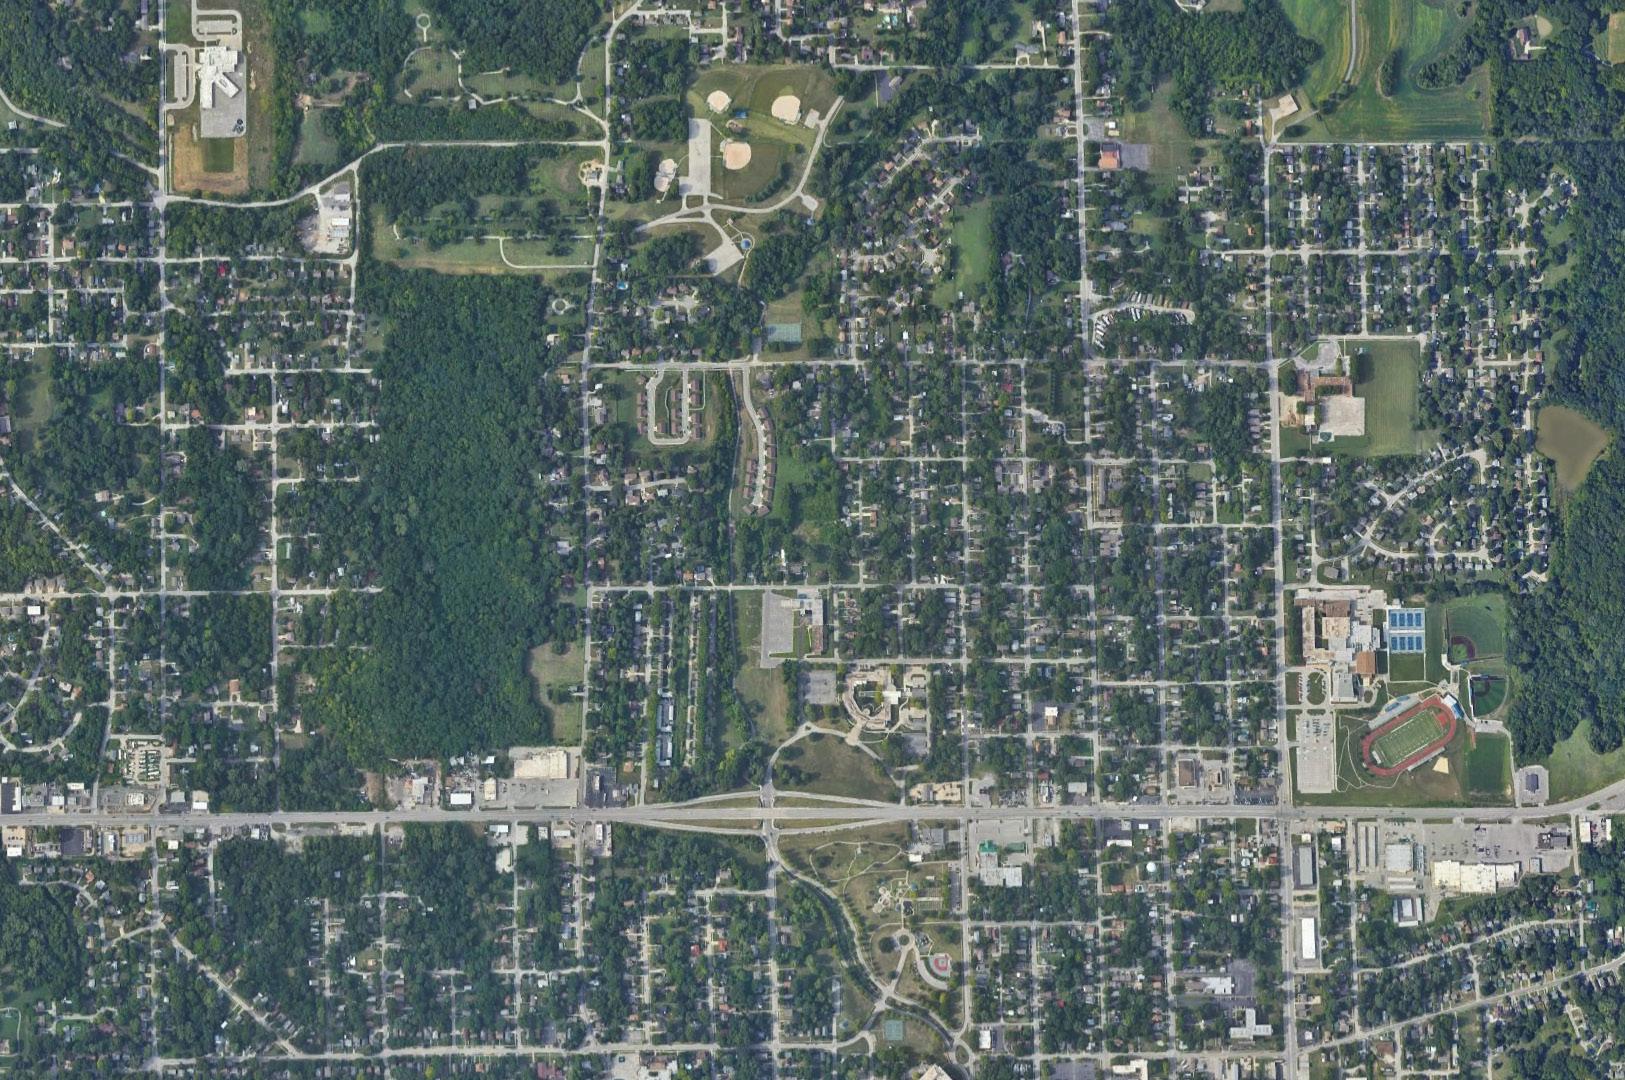
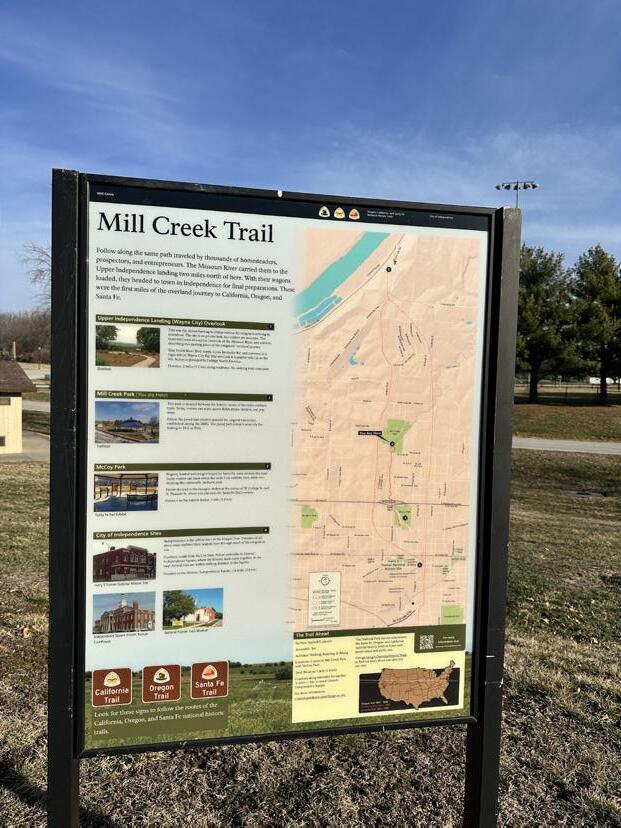
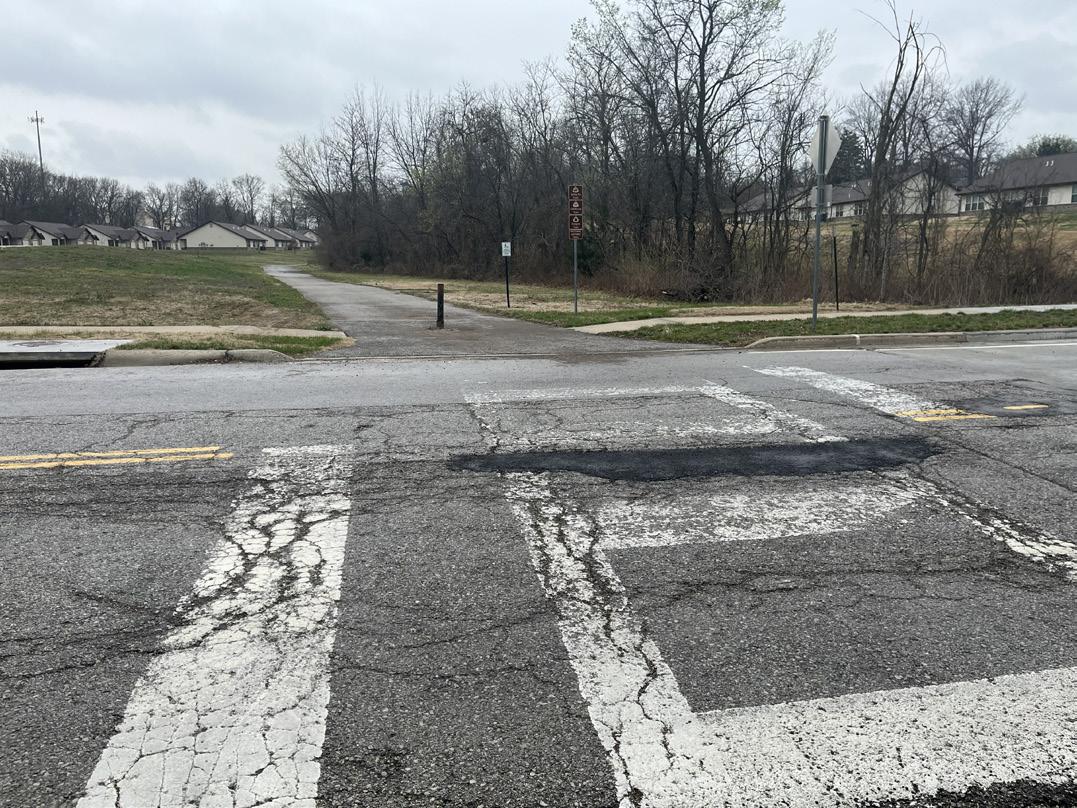
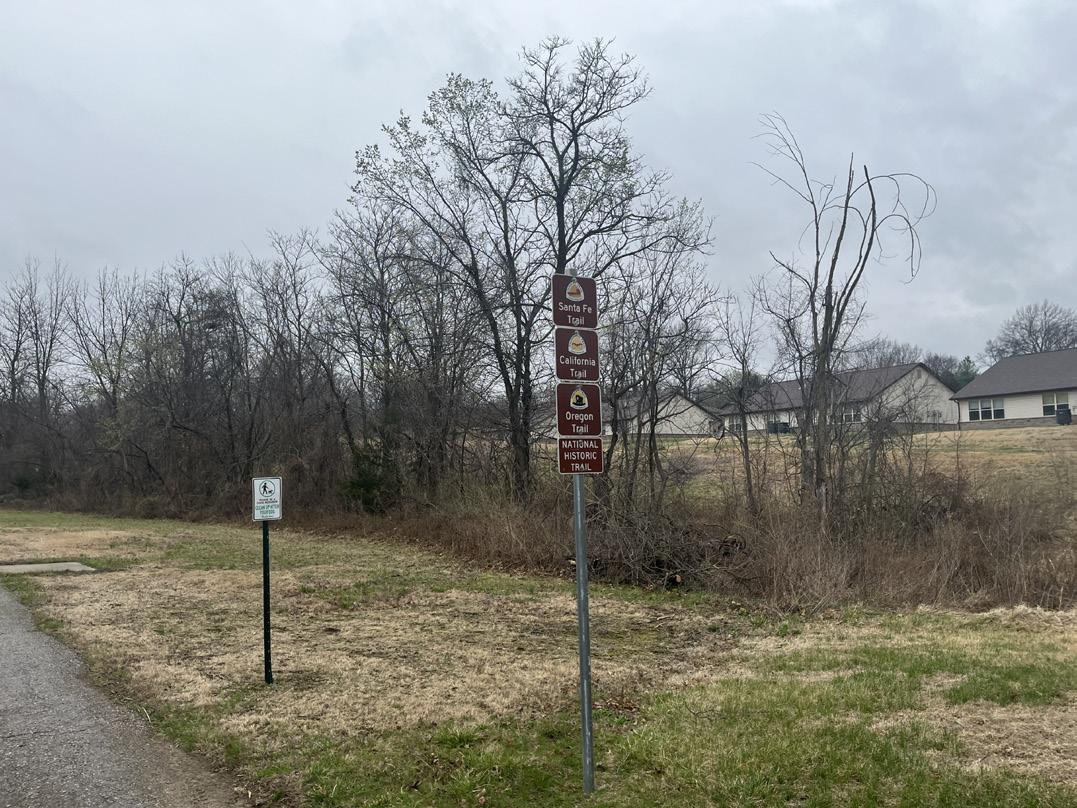
National Park Service Trail signage.
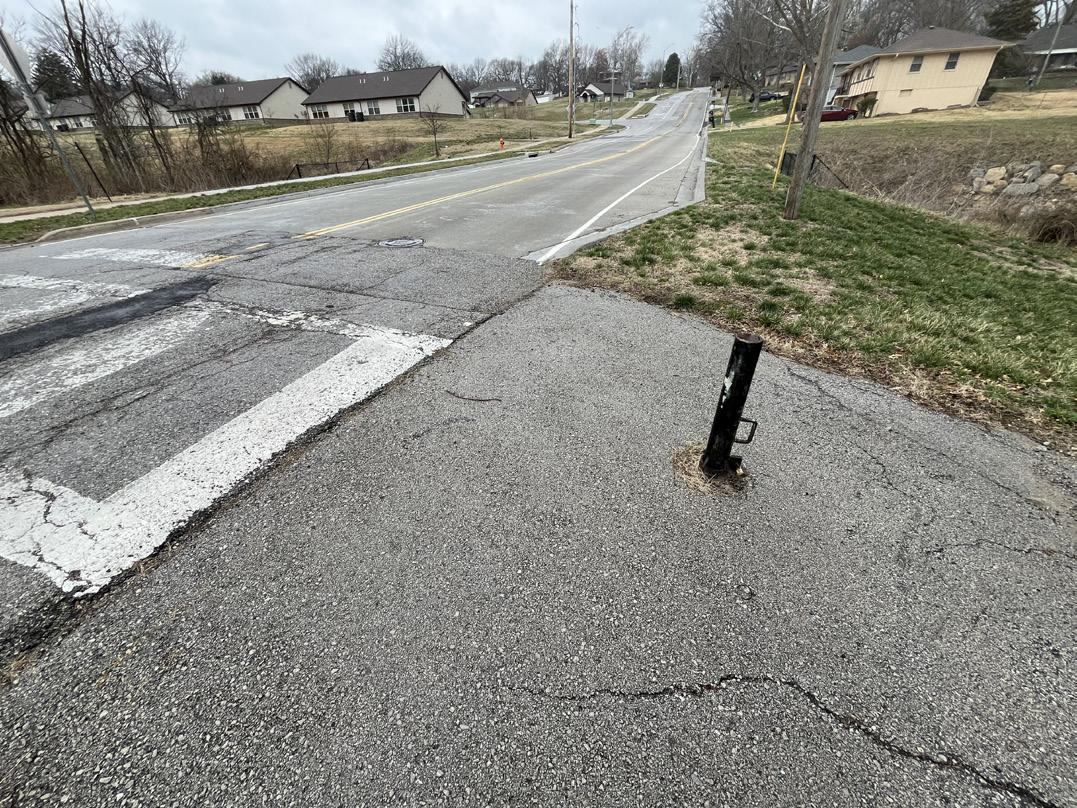
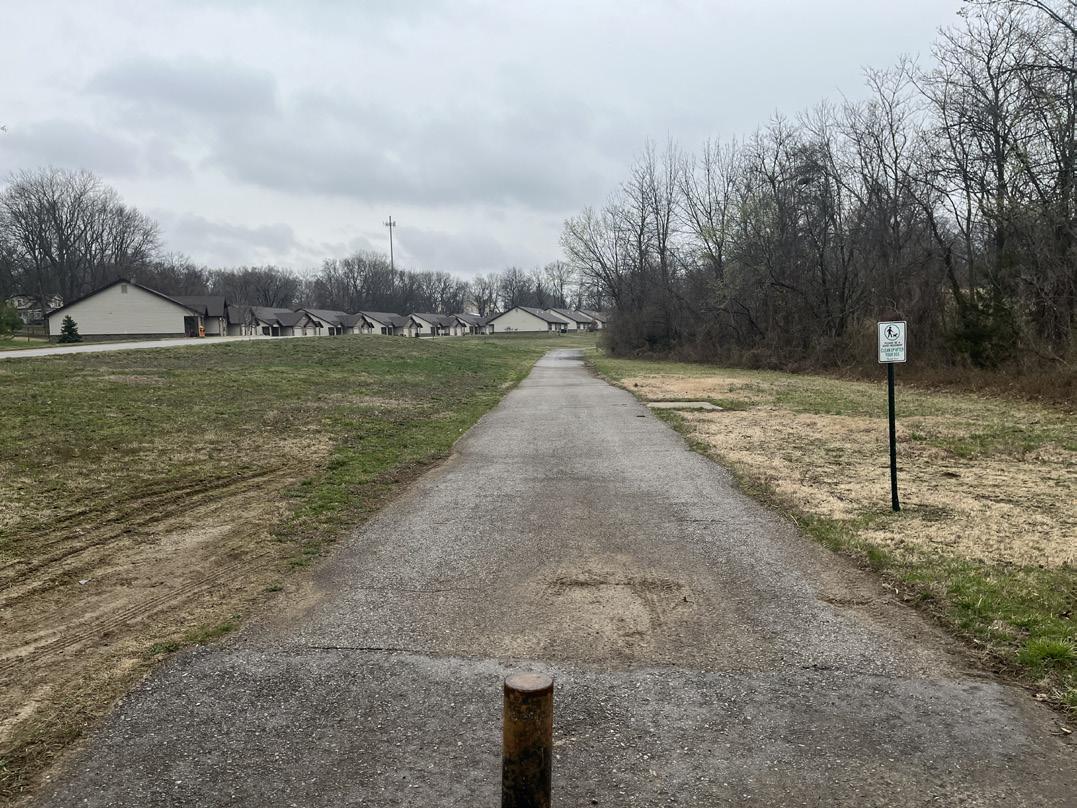
Adjacent street conditions.
Name of Site: Rock Creek Connector Trail
Date Completed: November, 2025
Completed By: Avery Nichols
Rotary Park to Country Club Park, Independence, MO 64050
This trail runs between Country Club Park and Rotary Park on the west side of Independence.
Size: 1.25 miles (Un-paved)
Classification: Off-Street Trail
Path (Poor Condition)
Strengths: This natural trail utilizes stretches of road and sidewalk to connect paths, but is predominately an unpaved trail.
Opportunities: There is an opportunity to improve signage or marking of the trail, making it more apparent to pedestrians.
Rating: 5 (Low Accessibility)
- This trail does not provide an ADA accessible trail material for all users to traverse the route.
Active/Passive: Passive
7. PHOTO INVENTORY:
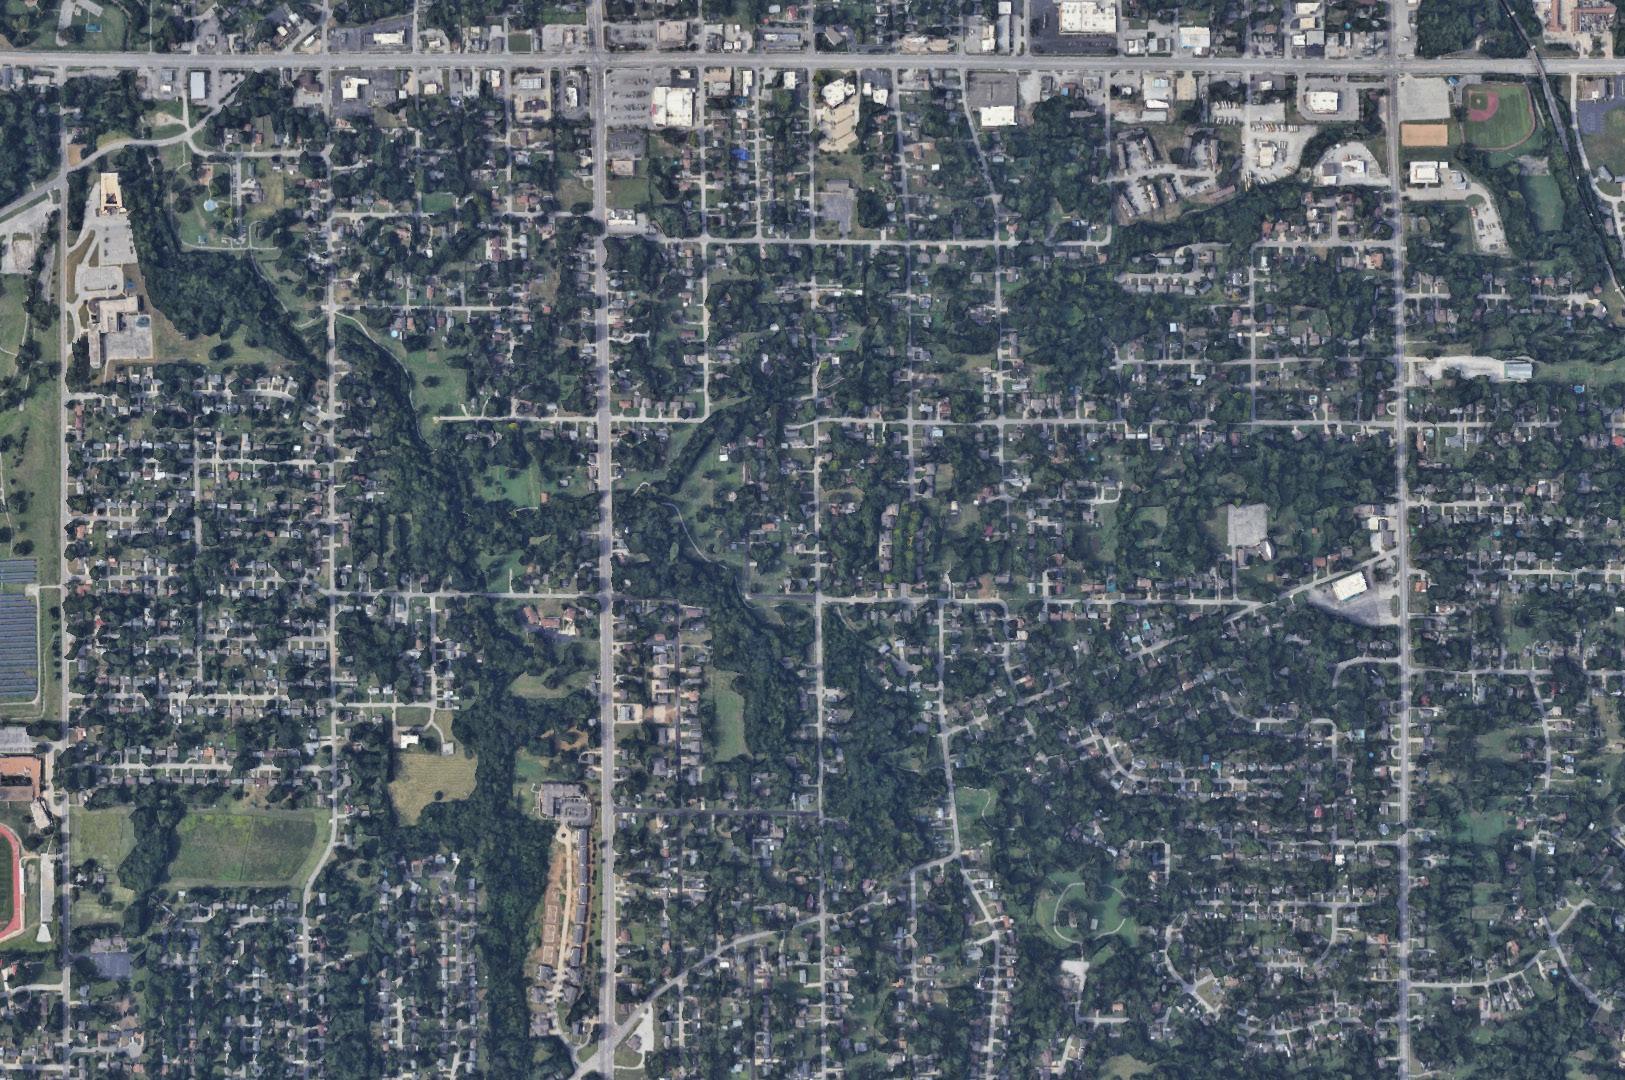
1)

Program Identification Program/ Event Idea (Name or Concept): Date
Supervisor(s)
Strategic Plan Alignment:
Internal Factors
Market - Similar Providers
Program Idea (Name or Concept):

A: Calculate Direct Costs
(These are expenses tied directly to delivering the program)
Staff Wages
Supplies & Materials
Equipment
Transportation
Facility Use (if applicable)
Contracted Services
Admission/Tickets/Entry Fees
Marketing Costs Other (specify):
B: Indirect Costs
(Percentage of overhead expenses that support the program)
The Sports & Fitness Industry Association’s (SFIA) Sports, Fitness & Leisure Activities Topline Participation Report 2024 was utilized in evaluating the following trends:
• National Recreation Participatory Trends
• Core vs. Casual Participation Trends
The study is based on findings from surveys conducted in 2023 by the Sports Marketing Surveys USA (SMS), resulting in a total of 18,000 online interviews. Surveys were administered to all genders, ages, income levels, regions, and ethnicities to allow for statistical accuracy of the national population. A sample size of 18,000 completed interviews is considered by SFIA to result in a high degree of statistical accuracy. A sport with a participation rate of five percent has a confidence interval of plus or minus 0.32 percentage points at a 95 percent confidence level. Using a weighting technique, survey results are applied to the total U.S. population figure of 306,931,382 people (ages six and older).
The purpose of the report is to establish levels of activity and identify key participatory trends in recreation across the U.S. This study looked at 124 different sports/activities and subdivided them into various categories including: sports, fitness, outdoor activities, aquatics, and other recreational activities.
Approximately 242 million people ages six and over reported being active in 2023, which is a 2.2% increase from 2022 and the greatest number of active Americans in the last 6 years. (Figure 42) This is an indicator that Americans are continuing to make physical activity more of a priority in their lives. Outdoor activities continue to thrive; recreation facilities have reopened. Fitness at home continues to be popular and team sports are slowly reaching pre-pandemic participation levels. The chart below depicts participation levels for active and inactive (those who engage in no physical activity) Americans over the past 6 years.
Total Actives Total Inactives
NUMBER OF PARTICIPANTS (MILLIONS)
2017 2018 2019 2020 2021 2022 2023
CORE VS. CASUAL PARTICIPATION
In addition to overall participation rates, SFIA further categorizes active participants as either core or casual participants based on frequency of participation. (Figure 43) Core participants have higher participatory frequency than casual participants. The thresholds that define casual versus core participation may vary based on the type
of each individual activity. For instance, core participants engage in most fitness activities more than fifty times per year, while for sports, the threshold for core participation is typically 13 times per year.
In each activity, core participants are more committed and tend to be less likely to switch to other activities or become inactive (engage in no physical activity) than casual participants. This may also explain why activities with more core participants tend to experience less pattern shifts in participation rates than those with larger groups of casual participants. Increasing for the sixth straight year, 165 million people were considered CORE participants in 2023.
The following chart shows 2023 participation rates by generation. (Figure 44) Fitness sports continue to be the goto means of exercise for Boomers, Gen X, and Millennials. Over half of the Gen X, Millennials, and Gen Z generation participated in one type of outdoor activity. Team sports were heavily dominated by generation Gen Z and nearly a third of Gen X also participated in individual sports such as golf, trail running, triathlons, and bowling.
Pickleball continues to be the fastest growing sport in America by reaching 13.6 million participants in 2023 which is a 223.5% growth since 2020. The growth of pickleball participants (13.6 million) has nearly reached the size of outdoor soccer participants (14.1 million). Following the popularity of pickleball, every racquet sport except table tennis has also increased in total participation during 2023.
Group, full-body workout activities such as tai chi, barre, and Pilates saw the biggest increase in participation this past year. Americans continued to practice yoga, workout with kettlebells, and started indoor climbing, while others took to the hiking trail. The waterways traffic had increases in participation in all activities in the past year.
Over two-thirds (67.8%) of Americans participated in fitness sports followed by over half (57.3%) of Americans participated in outdoor sports. Total participation for fitness, team, outdoor, racquet, water and winter sports are higher than their pre-pandemic participation rates. Individual sports are the only category still not at their prepandemic participation levels (45% in 2019 currently at 42.1% in 2023).
P A R T I C I P A T I O N L E V E L S
The top sports most heavily participated in the United States were basketball (29.7 million), golf (26.6 million), and tennis (23.8 million) which have participation figures well more than the other activities within the general sports category. Playing golf at an entertainment venue (18.5 million) and baseball (16.7 million) round out the top five.
The popularity of basketball, golf, and tennis can be attributed to the ability to compete with a small number of participants. This coupled with an ability to be played outdoors and/or properly distanced helps explain their popularity during the COVID-19 pandemic. Basketball’s overall success can also be attributed to the limited amount of equipment needed to participate and the limited space requirements necessary, which make basketball the only traditional sport that can be played at most American dwellings as a drive-way pickup game. Golf continues to benefit from its wide age segment appeal and is considered a life-long sport. In addition, target type game venues or golf entertainment venues have increased drastically (99%) as a 5-year trend, using golf entertainment (e.g., Top Golf) as a new alternative to breathe life back into the game of golf.
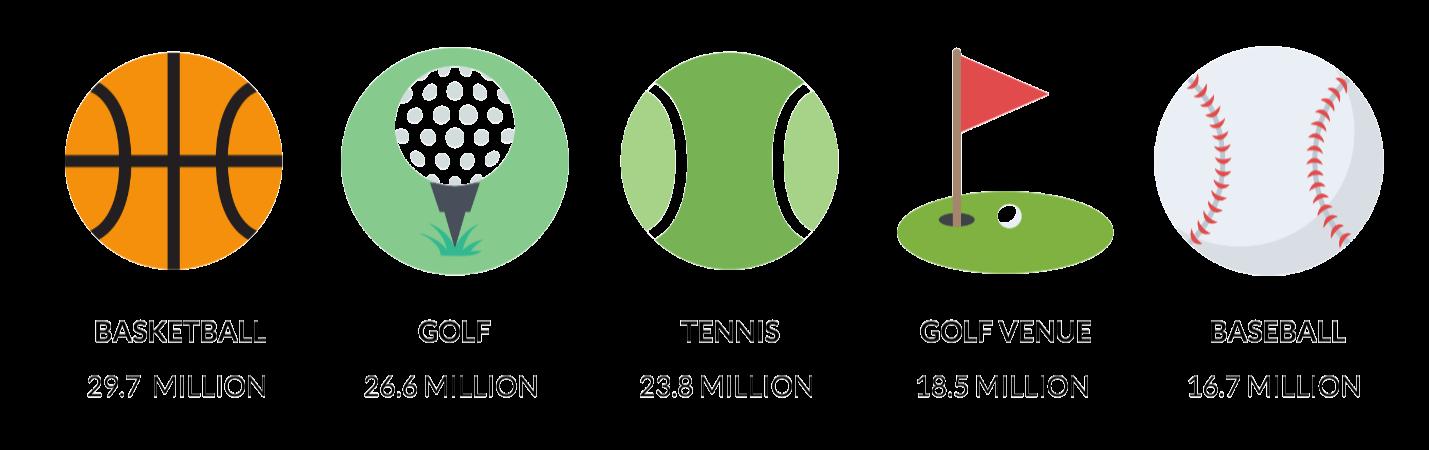
Since 2018, pickleball (311.5%), golf - entertainment venues (99.0%), and tennis (33.6%) have shown the largest increase in participation. Similarly, outdoor soccer (23.4%) and basketball (22.7%) have also experienced significant growth. Based on the five-year trend from 2018-2023, the sports that are most rapidly declining in participation include roller hockey (-28.7%), rugby (-28.7%), and ultimate frisbee (-23.0%).
O N E - Y E A R T R E N D
The most recent year shares some similarities with the five-year trends; with pickleball (51.8%) and golfentertainment venues (18.8%) experiencing some of the greatest increases in participation this past year. Other top one-year increases include court volleyball (13.3%), ice hockey (9.6%), and cheerleading (8.3%).
Sports that have seen moderate 1-year increases, but 5-year decreases are cheerleading (8.3%), track and field (5.8%), lacrosse (5.5%) and slow-pitch softball (5.3%). This could be a result of coming out of the COVID-19 pandemic and team program participation on the rise. Like their 5-year trend, roller hockey (-9.6%), sand/beach volleyball (5.1%), and rugby (-4.6%) have seen decreases in participation over the last year.
General sport activities, basketball, court volleyball, and slow pitch softball have a larger core participant base (participate 13+ times per year) than casual participant base (participate 1-12 times per year). Due to the COVID-19 pandemic, most activities showed a decrease in their percentage of core participants, but these percentages for core users are slowly reaching their pre-pandemic levels.
P A R T I C I P A T I O N L E V E L S
Overall, national participatory trends in fitness have experienced growth in recent years. Many of these activities have become popular due to an increased interest among Americans to improve their health and enhance quality of life by engaging in an active lifestyle. The most popular general fitness activities in 2023 were those that could be done in multiple environments such as at home, gym or in a virtual class setting. The activities with the most participation were walking for fitness (114.0 million), treadmill (54.8 million), free weights (53.9 million), running/jogging (48.3 million), and yoga (34.2 million).
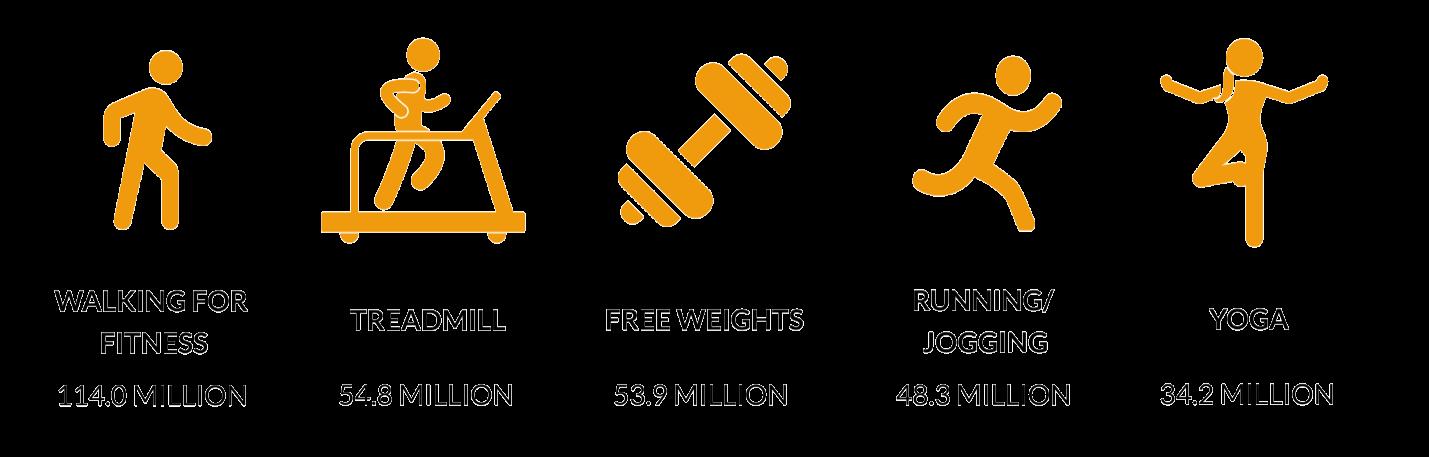
Over the last five years (2018-2023), the activities growing at the highest rate were trail running (48.7%), Pilates training (30.6%), barre (21.6%) and yoga (19.1%). Over the same period, the activities that have undergone the biggest decline in participation include group stationary cycling (-34%), cross-training style workout (-29.5%) and traditional/road triathlons (-19.8%).
In the last year, fitness activities with the largest gains in participation were group-related, slow, intentional movements activities, tai chi (16.3%), Pilates training (15.0%), and barre (12.9%). This 1-year trend is another indicator that participants feel safe returning to group-related activities. Trail running (12.3%) also saw a moderate increase indicating trail connectivity continues to be important for communities to provide. In the same span, fitness activities that had the largest decline in participation were boxing/MMA for fitness (-14.4%), traditional/road triathlons (-2.4%) and weight/resistant machines (-1.9%).
Participants of walking for fitness are mostly core users (participating 50+ times) and have seen a 1.3% growth in the last five years.
Results from the SFIA report demonstrate rapid growth in participation regarding outdoor/adventure recreation activities. Much like general fitness activities, these activities encourage an active lifestyle, can be performed individually, and are not as limited by time constraints. In 2023, the most popular activities, in terms of total participants include day hiking (61.4 million), freshwater fishing (42.6 million), road bicycling (42.2 million), camping (38.6 million), and wildlife viewing (21.1 million)
From 2018 2023, camping (40.7%), birdwatching (33.0%), skateboarding (37.3%), BMX bicycling (29.7%), and day hiking (28.4%) ha year trend also shows that only two activities declined in participation, adventure racing (
most rapid
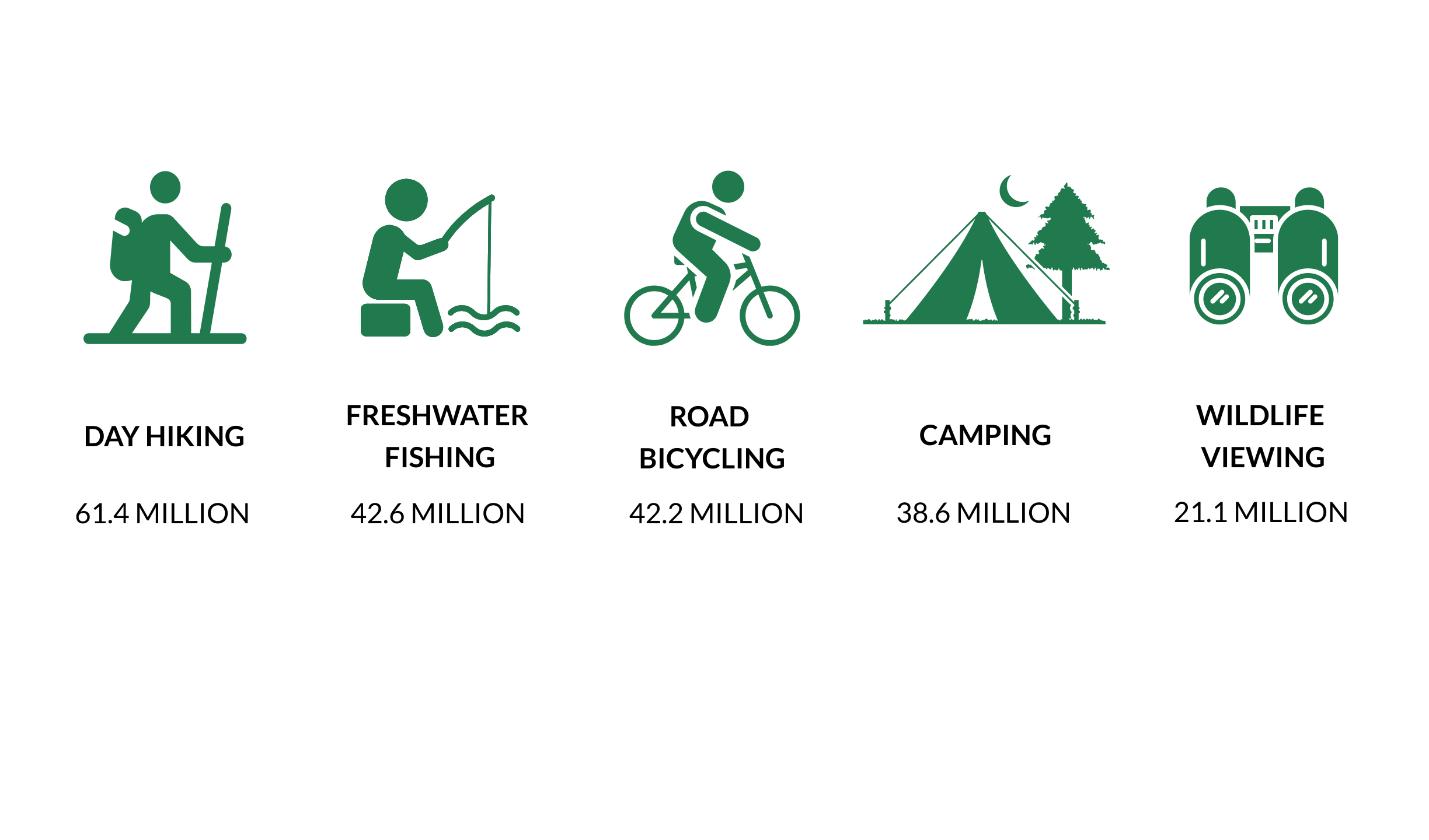
growth being indoor climbing (10.0%), BMX bicycling (6.7%), fly fishing (5.8%), and adventure racing (5.5%). Over the last year, the only activities that underwent decreases in participation were road bicycling (-3.0), overnight backpacking (-2.2%), RV camping (-2.0%), and skateboarding (-1.1%).
Although most outdoor activities have experienced participation growth in the last five years, it should be noted that all outdoor activities participation, besides adventure racing, mostly consist primarily of casual users.
PARTICIPATION L E V E L S
Swimming is deemed a lifetime activity, which is why it continues to have such strong participation. In 2023, fitness swimming remained the overall leader in participation (28.2 million) amongst aquatic activities.
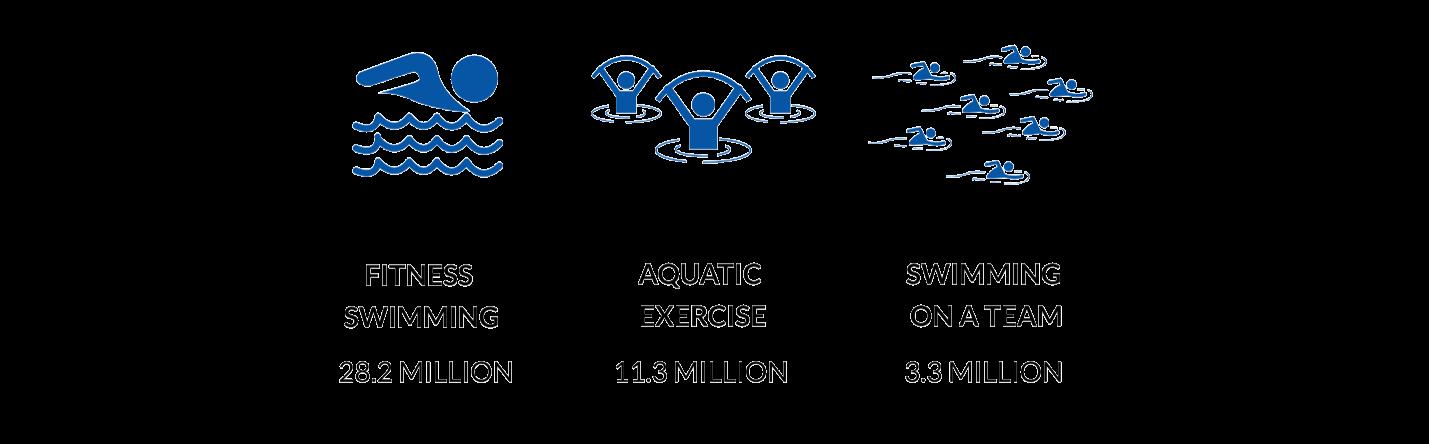
Assessing the five-year trend, all three aquatic activities saw moderate increases in participation.
In 2023, all aquatic activities saw moderate increases in participation which can be asserted to facilities and programs returning to pre-COVID-19 pandemic levels. Swimming on a team (14.6%) saw the highest percentage increase in participation.
CORE VS. CASUAL TRENDS IN AQUATICS
All activities in aquatic trends have undergone an increase in casual participation (1-49 times per year) over the last five years.
P A R T I C I P A T I O N L E V E L
The most popular water sports / activities based on total participants in 2023 were recreational kayaking (14.7 million), canoeing (10.0 million), and snorkeling (7.5 million). It should be noted that water activity participation tends to vary based on regional, seasonal, and environmental factors. A region with more water access and a warmer climate is more likely to have a higher participation rate in water activities than a region that has a long winter season or limited water access. Therefore, when assessing trends in water sports and activities, it is important to understand that fluctuations may be the result of environmental barriers which can influence water activity participation.
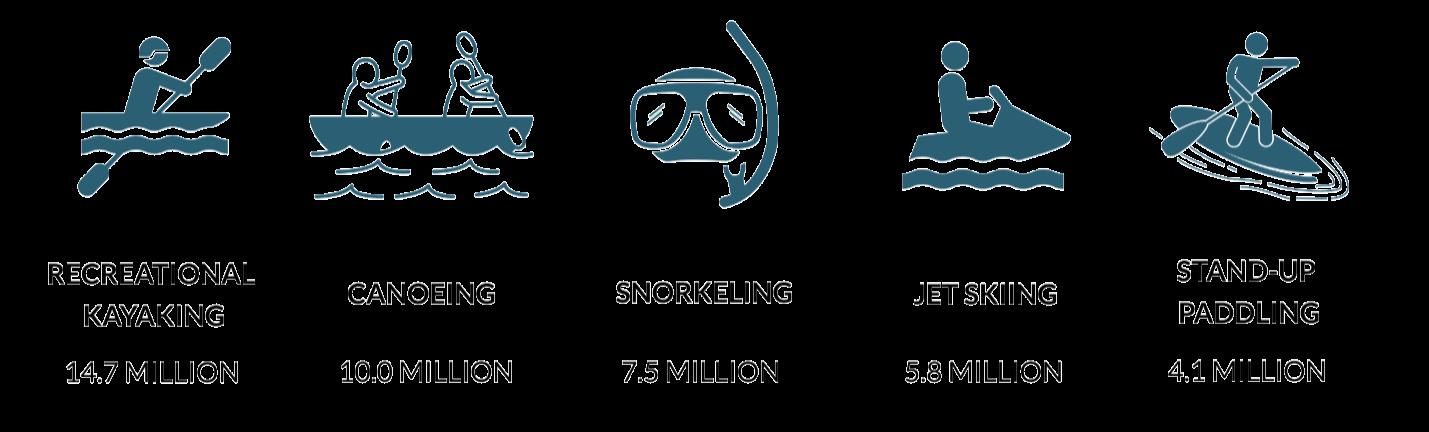
Over the last five years, surfing (38.9%), recreational kayaking (33.7%), stand-up paddling (19.6%) and rafting (19.0%) were the fastest growing water activities. From 2018-2023, activities declining in participation were water boardsailing/windsurfing (-7.8%), water skiing (-6.8%), snorkeling (-4.2%) and sea/touring kayaking (-0.2%).
In 2023, zero activities saw a decrease in participation. Activities which experienced the largest increases in participation include scuba diving (15.2%), sailing (12.9%), and rafting (12.7%).
As mentioned previously, regional, seasonal, and environmental limiting factors may influence the participation rate of water sports and activities. These factors may also explain why all water-based activities have drastically more casual participants than core participants, since frequencies of activities may be constrained by uncontrollable factors.
NOTE: Participation figures are in 000's for the US population ages 6 and over Participation Growth/Decline:
NOTE: Participation figures are in 000's for the US population ages 6 and over
NOTE: Participation figures are in 000's for the US population ages 6 and over Participation Growth/Decline:
A program lifecycle analysis is important because it ensures a recreation department offers a balanced mix of innovative, stable, and legacy programs. Maintaining a portfolio with roughly 50–60% of programs in the early stages (Introduction, Take-Off, Growth) keeps the programming dynamic and responsive to evolving community interests, while approximately 40% in the Mature stage provides a dependable core of well-established, highperforming offerings. Programs in the Saturation or Decline stages should be evaluated for improvement, repurposing, or replacement.
More than 27% of IPR programs fall within the Saturation and Decline stages or have been cancelled for various reasons. Also, the percentage of programs (42.4%) that fall within the Introduction, Take-Off, and Growth stages is below the recommended distribution of 50-60% of the overall programming portfolio. These two percentages indicate that there are several programs that either need to be re-evaluated for relevancy to the community or entirely replaced by new programming that has been identified as a priority in this report. The core program areas with the majority of programming in the Saturated and Decline stages are Senior Programs and Sports & Wellness.
Nature (Free)
Nature (Free)
Nature (Free)
Nature (Free)
Let’s talk about: Hummingbirds
Let’s talk about: insects
Let’s talk about: mammology
Let’s talk about: Migratory Birds (summer, winter)
Nature (Free) Let’s talk about:Native Animals of Missouri
Nature (Free)
Nature (Free)
Nature (Free)
Nature (Free)
Nature (Free)
Nature (Free)
Nature (Free)
talk about: Pollinators and Bees
Let’s talk about: Reptiles and Amphibians
Let’s talk about: Scavengers
Let’s talk about: Spooky Crawly Critters
Let’s talk about: Taxonomy
Let’s talk about: The Forest
talk about: Turkeys!
Program classifications categorize recreation offerings based on how closely they align with an organization’s mission and how services should be funded, whether through tax support, user fees, or other revenue sources. This analysis is a valuable planning tool that guides decision-making related to pricing, subsidy levels, resource allocation, and program priorities.
Program classifications categorize recreation offerings based on how closely they align with an organization’s mission and how services should be funded, whether through tax support, user fees, or other revenue sources. This analysis is a valuable planning tool that guides decision-making related to pricing, subsidy levels, resource allocation, and program priorities.
Program classifications categorize recreation offerings based on how closely they align with an organization’s mission and how services should be funded, whether through tax support, user fees, or other revenue sources. This analysis is a valuable planning tool that guides decision-making related to pricing, subsidy levels, resource allocation, and program priorities.
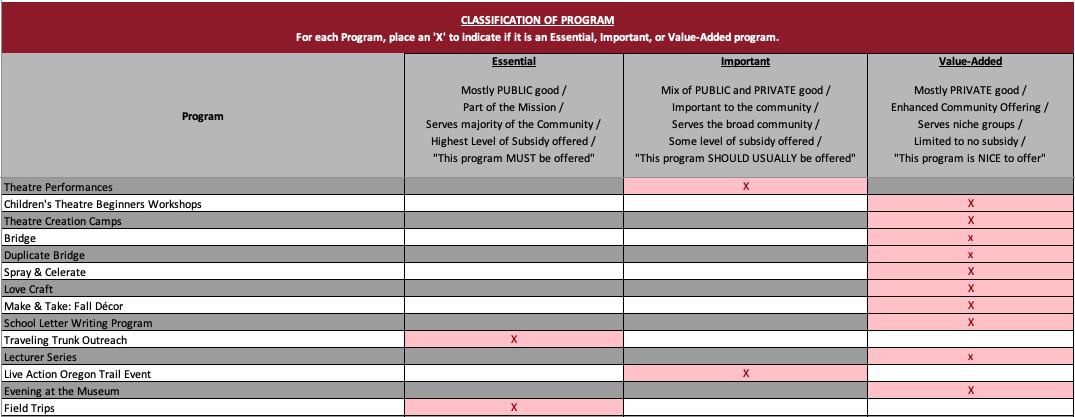

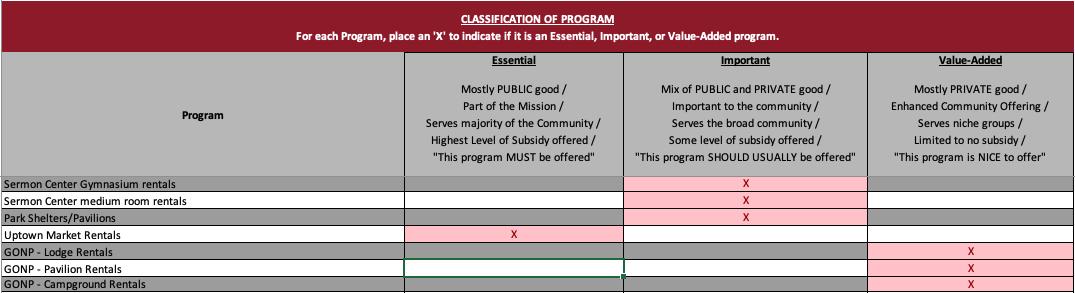
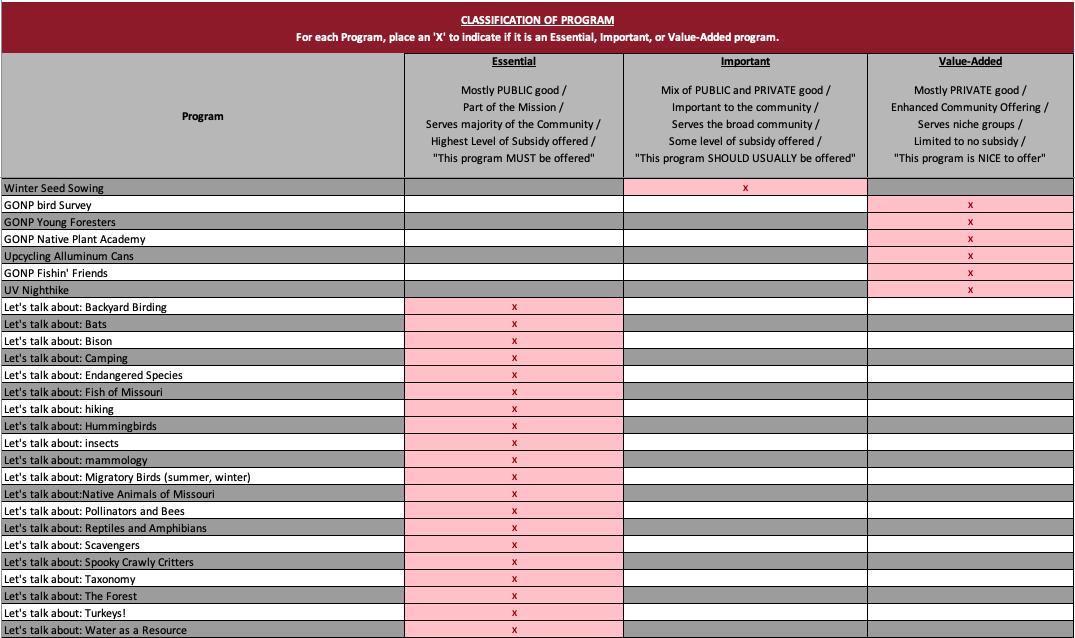
TABLE 25 NATURE PROGRAMS
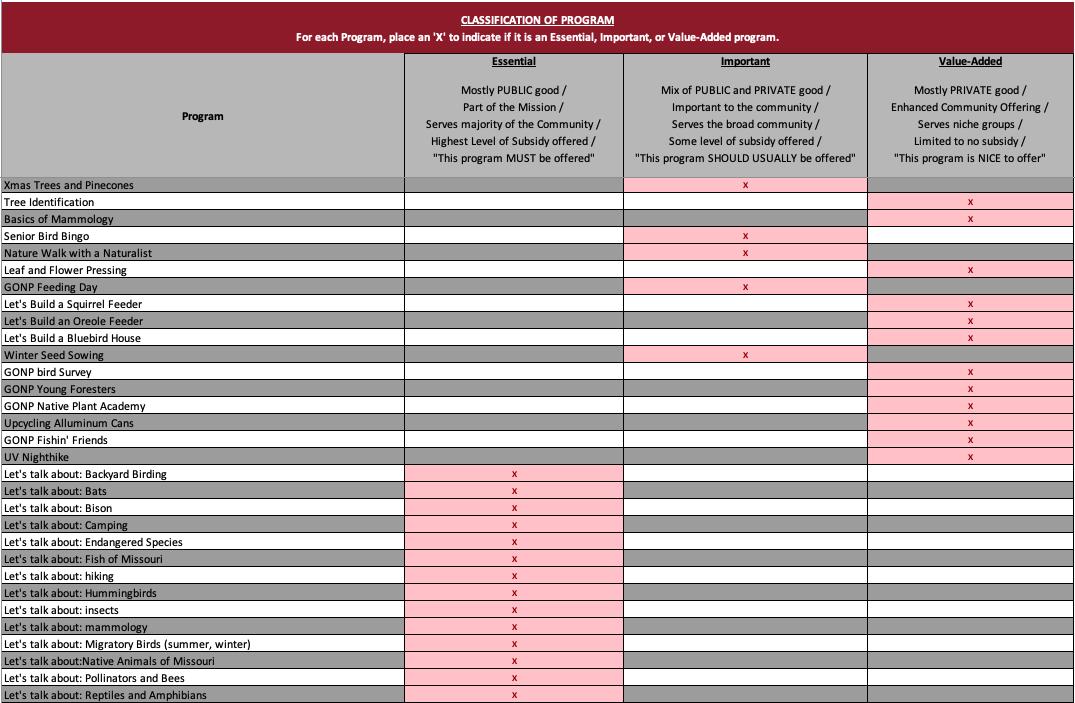
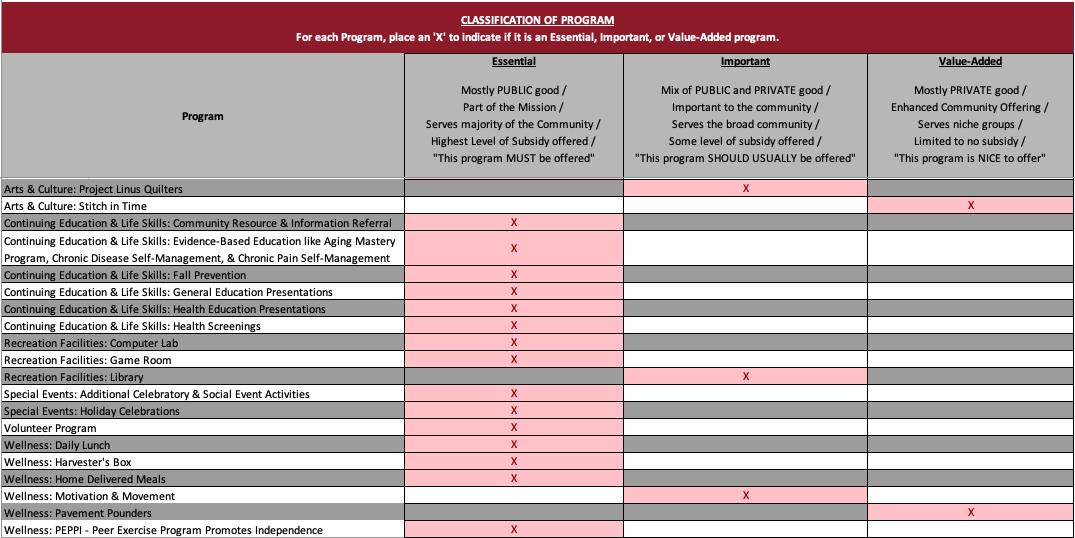
TABLE 26 SENIOR PROGRAMS
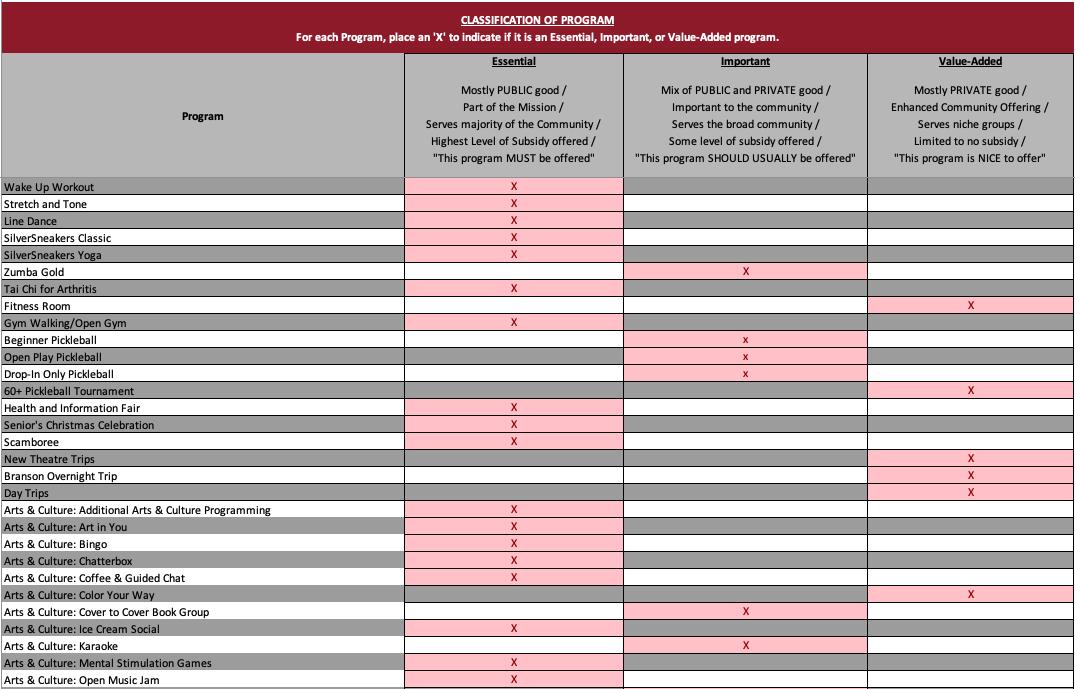
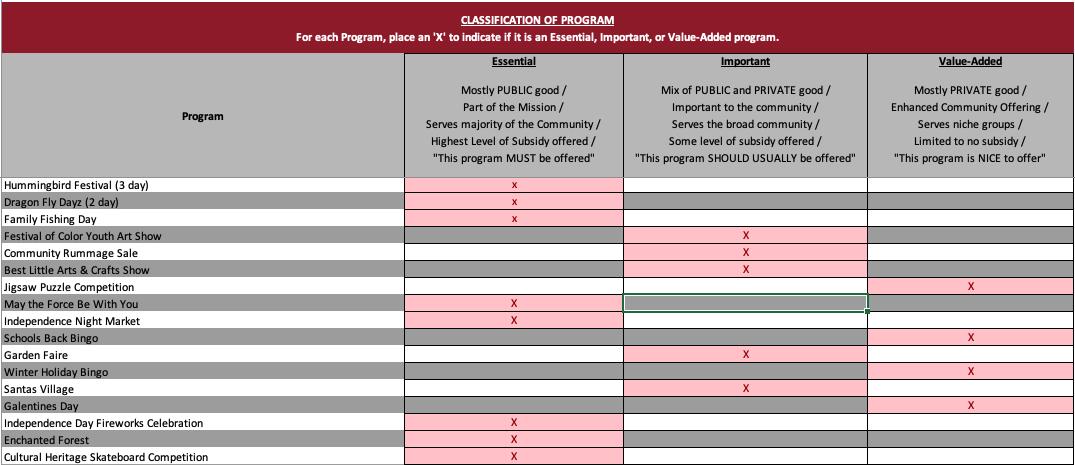
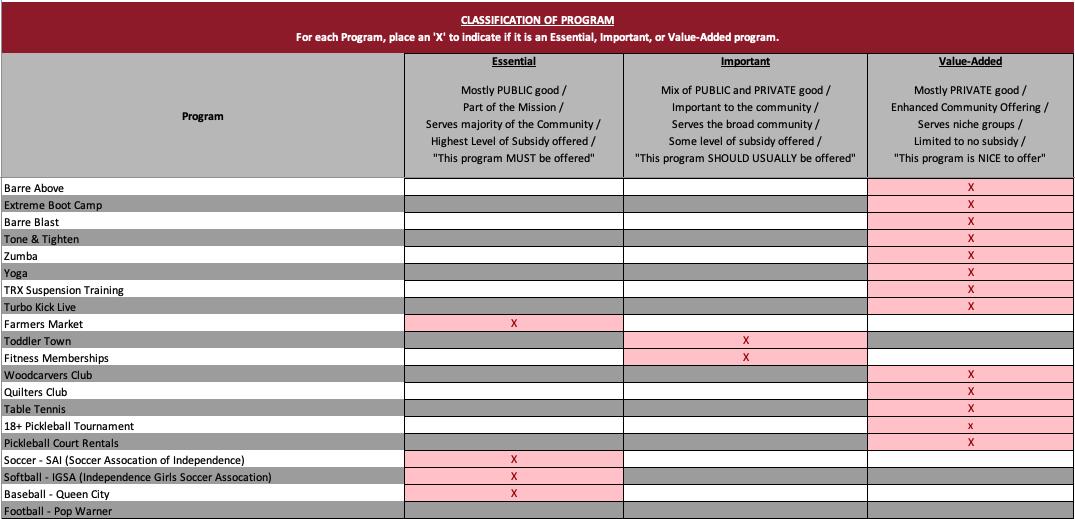
Ancillary services refer to supplementary offerings that support and enhance the core recreational programs provided by the Department. These services offer added value to residents, drive community engagement, and contribute to the department's financial sustainability. Tracking their performance helps identify opportunities for optimization, expansion, or alignment with community needs.
*COVID-19 regulations gradually decreasing.
**Reservation fees increased in FY22/23.
Some key insights from IPR include:
• Sermon Center rental revenue increased 126% between 2021 and 2023.
• Shelter reservations and revenue decreased between 2021 – 2023 but rebounded slightly between 20222023.
• The number of Pavilion rentals decreased between 2021 – 2023, however the revenue increased by 17% due to increased fees.
• George Owens’ rental revenue increased between 2021-2023 by 13% but saw dip in revenue between 20222023 by 25%.
Maintenance standards are organized by three Levels of Service. Maintenance standards can change by season and month depending on the type of park area level of use. Standards shall be calculated by time and equipment proposed for all parks in the system.
This format provides guidance in terms of understanding the required work activities and elements in a descriptive manner that then can be quantified numerically. Following are descriptions of the levels of service and both qualitative and quantitative maintenance standards proposed for all parks in the system.
Three maintenance levels are generally defined. The difference between levels is frequency of maintenance as determined by ability. Maintenance Standards have these 3 general characteristics
• Level 1 Maintenance – High profile areas where the entire area is visible to foot traffic such as entrances to community centers, signature facilities, and areas where funding permits a higher level of maintenance. Example of maintenance activities include Mowing and edging twice per week, 95 percent turf coverage at start of season with 5 percent weeds and 0 percent bare area, edging once per week, tree pruning cycle once annually, litter pickup twice per week.
• Level 2 Maintenance – Moderate to heavy use typical of most parks. Example maintenance activities include Mowing and edging once per week, 88 percent turf coverage at start of season with 8 percent weeds and 4 percent bare area, tree pruning cycle every seven years, litter pickup once per week.
• Level 3 Maintenance – Typical for low usage parks or when funding is limited. Example maintenance activities include Mowing and edging every 10 days, 80 percent turf coverage at start of season with 20 percent weeds, edging once per week or every 2 weeks in off-season, tree pruning cycle every 10 years, litter pickup every other week.
In areas where turf does not impact quality of experience (i.e., dog parks) or non-landscaped open space areas, demand-based maintenance is provided according to funding availability.
• Turf Maintenance – high profile areas (small areas, entire area visible to foot traffic)
o Mowing will occur 2 times/week
o Mowing heights
§ 2 ½” during warm season (day time highs consistently above 75 degrees)
o Edging of all turf perimeters will occur 1 time/week
o 95% turf coverage
o 3% weed infestation for existing areas (all efforts should be made to keep new areas 100% weed free)
o 2% bare area
o Remove grass clippings if visible
o Aerate 1 time/year (additionally if needed)
o Inspect thatch layer regularly and remove as needed
o Test soil and water annually
§ Additional testing will occur if deemed necessary
o Soil moisture will be consistent
§ No wet areas
§ No dry areas
§ Firm enough for foot and mower traffic
§ Apply wetting agents to assist in uniform soil moisture
§ Hand water as needed
o Inspect daily for insects, disease, and stress and respond to outbreaks within 24 hours
o Fertilize 3 times per year
o Top dress/over seed once a year
• Tree and Shrub Maintenance
o Prune/trim trees and shrubs as dictated by species twice annually during spring and fall
o Remove sucker growth annually
o Test soil annually to ensure application of appropriate nutrients as needed
o Apply fertilizer to plant species according to their optimum requirements as needed or yearly
o Inspect regularly for insects and diseases. Respond to outbreaks within 48 hours
o Place 2” of organic mulch around each tree within a minimum 18” ring
o Place 2” of organic mulch around shrub beds to minimize weed growth
o Remove hazardous limbs and plants immediately upon discovery
o Remove dead trees and plant material immediately unless located within an environmental area
o Remove or treat invasive plants within 5 days of discovery
o Flower bed maintenance done yearly
o Fertilize once a year
o Pond maintenance is done yearly and inspect weekly
o Water features maintained weekly
o Invasive plant removal annually
• Storm Cleanup
o Inspect drain covers at least twice monthly, before rain and immediately after flooding
o Remove debris and organic materials from drain covers immediately
o Maintain water inlet height at 100% of design standard
• Irrigation Systems
o Inspect irrigation systems at least once per month or computer monitors as necessary
o Initiate repairs to non-functioning systems within 24 hours of discovery
o Back flow testing done annually
• Litter Control
o Pick up litter and empty containers at least once daily or as needed
o Remove leaves and organic debris once a week or as necessary
• Playground Maintenance
o Audit each playground to ensure compliance with the current version of ASTM Performance Standard F1487 and the Consumer Product Safety Commission “Handbook for Public Playground Safety” used by the Certified Playground Safety Inspector program through the National Recreation and Park Association.
o Complete low-frequency playground inspections at least bi-monthly or as required. All lowfrequency inspections are to be completed by a Certified Playground Safety Inspector (CPSI). Complete safety-related repairs immediately, and initiate other repairs within 48 hours of discovery
o Complete high-frequency inspections at least weekly
o Grooming surface three times weekly, nine months a year
• Hard Surface Maintenance
o Remove debris and glass immediately upon discovery
o Remove sand, dirt, and organic debris from walks and hard-court surfaces weekly
o Remove trip hazards from pedestrian areas immediately upon discovery
o Paint fading or indistinct instructional / directional signs annually
o Blow grass clippings after mowing around hard surfaces
o Remove grass growing in cracks as needed
• Outdoor Court Maintenance
o Inspect tennis and basketball courts at least once monthly. Complete all repairs within
48 hours of discovery.
o Repaint lines at least once each year
o Replace basketball nets when frayed, broken, or removed
o Maintain basketball goal posts, backboards, rims, tennis net posts, fencing, and hardware to original design specifications
• Trail Maintenance
o Inspect hard and soft surface trails at least once monthly
o Remove dirt, sand, and organic debris from hard surfaces at least once weekly
o Remove organic debris from soft surfaces at least once weekly
o Maintain a uniform 3 to 4” depth of compacted material on soft surface trails at all times
o Graffiti removed weekly
o Remove overhanging branches within 84” of the trail surface at least twice annually
o Mechanically or chemically control growth 24” on either side of the trails
o Inspect signs, benches, and other site amenities at least once monthly. Complete repairs within 10 days of discovery
o Inspect and make necessary repairs to lighting systems at least once monthly
o Repair / replace bulbs to maintain lighting levels to design specifications at all times
• Site Amenity Maintenance
o Inspect benches, trash containers, picnic tables and grills, bicycle racks, flag poles, drinking fountains, and other site amenities at least monthly. Complete repairs within 24 hours of discovery
o Cleaning, scrub and power wash of amenities twice yearly
o Inspect daily for insects, disease, and stress and respond to outbreaks within 24 hours
• Athletic fields grounds maintenance (Baseball, Soccer, Softball and Rugby)
o Fields that are dedicated to softball, baseball, soccer and rugby only
o Use mower capable of “striping” the turf
o Mowing will occur twice weekly
o Mowing heights
§ 2” during cool season (day time highs consistently below 75 degrees)
o Edging of field perimeters will occur twice monthly
o 95% turf coverage at the start of every season
o 80% turf coverage after play begins
o 5% weed infestation
o No bare areas at the start of every season
o 15% bare and weak areas will be acceptable after play begins
o Apply pre-germinated seed to heavily worn areas after every tournament
o Remove grass clippings if visible
o Aerate 3 times annually
o Spot aerate high use areas as needed
o Inspect thatch layer regularly and remove as needed
o Test soil and water annually
§ Additional testing will occur if deemed necessary
o Soil moisture will be consistent
§ No wet areas
§ No dry areas
§ Firm enough for foot and mower traffic
§ Apply wetting agents to assist in uniform soil moisture
§ Hand water as needed
o Inspect daily for insects, disease and stress and respond to outbreaks within 24 hours
o Fertilize monthly
o Aerate and over seed yearly
• Fence and Gate Maintenance
o Inspect fences, gates and bollards at least twice annually. Complete safety-related repairs immediately. Complete other repairs within 48 hours of discovery
o Annually free fence of debris
• Sign Maintenance
o Inspect sign lettering, surfaces, and posts at least once monthly
o Repair / replace signs to maintain design and safety standards within 24 hours of discovery
o Clean signs twice a year
o Cut back plant material annually or more if needed
• Pest Control
o If the Department has an Integrated Pest Management Program (IPM) policy, address problem areas and inspected monthly and remedied immediately upon discovery
• Vandalism and Graffiti Removal
o Initiate repairs immediately upon discovery. Document and photograph damage as necessary
• Picnic Shelters
o Reserved units cleaned and litter removed prior to and after each reservation
o Minor repairs are made immediately upon discovery
o Non-reserved units are cleaned weekly by power washing, or as necessary
• Lighting Security/Area
o Foot-candle levels will be maintained to preserve original design
o Inspect once monthly
o Repairs/bulb replacement will be completed within 24 hours of discovery
• Broken Equipment Standard
o Broken equipment shall be repaired immediately, as staff is capable and parts are available when noticed or reported
o If staff cannot repair, the broken equipment will be signed and roped off with emergency tape indicating that the amenity is broken, not to be used and if and when it will be repaired
• Lifecycle Replacement
o The Department should develop a lifecycle replacement program that must be built into the Capital Improvement Program based on contractor and product specifications
• Concession Standards (outdoor)
o Concession facilities cleaned, wiped down, and sanitized before opening
o Electrical appliances checked for compliance and repaired if damaged
o Lights checked and repaired as needed
o Concession operating permits secured before opening
o Appliances cleaned thoroughly before opening
o Prices for concessions will be posted
o Cash registers tested to ensure they work properly
o Circuit breakers tested prior to opening
o Cleaning and sanitization supplies on hand before opening
o Pick up debris daily
• Closing Concession Standards (outdoor)
o Equipment cleaned thoroughly
o Supplies removed and discarded
o Electricity should be turned off
o Refrigerators and cables turned off and sealed
o Facility floors, sinks, and counters cleaned thoroughly
o Hoses cleaned and drained
o Kitchen cleaned thoroughly
o Inspections of standards will occur monthly
• Restrooms
o Restrooms cleaned twice per day unless contracted
o Restrooms inspected hourly
o Restrooms locked/unlocked daily
o Replace waterless urinal cartridges monthly
o Leaks dealt with immediately and were repaired within 24 hours of discovery
• Open Space Standard
o Maintain natural appearance to open space areas
o Remove trees and branches that pose a hazard to the users of the area
o Respond to disease and insect outbreaks within 24 hours of identification
o Inspect areas monthly
o Remove and clean dump sites within 48 hours of identification
o Post and maintain appropriate signage for each individual area
o Implement strategies to assist in reducing the stand of non-native invasive plants by 5% annually
o No large branches or debris will be allowed in parks and along perimeters
LEVEL TWO MAINTENANCE STANDARDS FOR PARKS
Maintenance standards can change by season and month depending on the park and level of use. Standards will be calculated by time and equipment needed to develop the required operation budgets. The difference between Level 1 and Level 2 standards is the fr equency rate.
• Turf Maintenance
o Mowing will occur once weekly
o Mowing heights
§ 2½” during cool season (day time highs consistently below 75 degrees)
o Edging of all turf perimeters will occur weekly during season and every 2 weeks in off-season
o 88% turf coverage
o 8% weed infestation
o 4% bare area will be acceptable after play begins
o Remove grass clippings if visible
o Aerate once annually in low use areas
o Aerate twice annually in high use areas (additional if needed)
o Inspect thatch layer regularly and remove as needed
o Test soil and water annually
§ Additional testing will occur if deemed necessary
o Soil moisture will be consistent
§ No wet areas
§ No dry areas
§ Firm enough for foot and mower traffic
§ Apply wetting agents to assist in uniform soil moisture
§ Hand water as needed
o Inspect weekly for insects, disease, and stress and respond to outbreaks within 24 hours
o Fertilize twice yearly
• Tree and Shrub Maintenance
o Prune/trim trees and shrubs as dictated by species at least once annually
o Apply fertilizer to plant species only if plant health dictates
o Remove sucker growth as needed
o Inspect regularly for insects and diseases. Respond to outbreaks within 48 hours
o Place 2” of organic mulch around each tree within a minimum 18” ring
o Place 2” of organic mulch around shrub beds to minimize weed growth
o Remove hazardous limbs and plants immediately upon discovery
o Remove dead trees and plant material within 30 days of discovery
o Remove or treat invasive plants yearly
• Storm Cleanup
o Inspect drain covers at least once monthly and immediately after flooding occurs
o Remove debris and organic materials from drain covers every other month
o Inspect and clean drains before forecasted storms begin
o Maintain water inlet height at 100% of design standard
o Invasive plant removal once a year or as needed
o Drain system maintenance done once a year
• Irrigation Systems
o Inspect irrigation systems a minimum of once per month and as necessary
o Initiate repairs to non-functioning systems within 48 hours of discovery
o Annual back flow inspection done yearly
• Litter Control
o Pick up litter and empty containers at least every other day or as needed
o Remove leaves and organic debris once a week
• Playground Maintenance
o Audit each playground to ensure compliance with the current version of ASTM Performance Standard F1487 and the Consumer Product Safety Commission “Handbook for Public Playground Safety”
o Complete low-frequency playground inspections at least bi-monthly or as required. All lowfrequency inspections are to be completed by a Certified Playground Safety Inspector (CPSI). Complete safety-related repairs immediately and initiate other repairs within 48 hours of discovery
o Complete high-frequency inspections at least weekly
o Grooming surface two times weekly
• Hard Surface Maintenance
o Remove debris and glass immediately upon discovery
o Remove sand, dirt, and organic debris from walks, lots, and hard surfaces every 30 days
o Remove trip hazards from pedestrian areas immediately upon discovery
o Paint fading or indistinct instructional/directional signs every other year
o Remove grass in the cracks monthly
• Outdoor Court Maintenance
o Inspect basketball courts at least once monthly. Complete repairs within 10 days of discovery
o Repaint lines at least once every 2 years
o Replace basketball nets within 10 days when frayed, broken, or removed
o Maintain basketball goal posts, backboards, rims, fencing and hardware to original design specifications. Complete repairs within 10 days of discovery
• Trail Maintenance
o Inspect hard and soft surface trails at least once monthly
o Remove dirt, sand and organic debris from hard surfaces at least once monthly
o Remove organic debris from soft surfaces at least once monthly
o Maintain a uniform 2-4” depth of compacted material on soft surface trails
o Mechanically or chemically control growth 24” on either side of the trails
o Remove overhanging branches within 84” of the trail surface at least once annually
o Inspect signs, benches, and other site amenities at least once monthly. Complete repairs within 10 days of discovery
• Site Amenity Maintenance
o Inspect benches, trash containers, picnic tables, grills, bicycle racks, drinking fountains, and other site amenities at least monthly. Complete repairs within 5 days of discovery
o Cleaning and washing annually
o Inspect daily for insects, disease, and stress and respond to outbreaks within 24 hours
• Athletic Field Grounds Maintenance (baseball, soccer, softball, and rugby)
o Fields that are dedicated to soccer, baseball, softball and rugby only
o Mowing will occur twice weekly
o Mowing heights
§ 2 ½” during cool season (day time highs consistently below 75 degrees)
§ 3” during warm season (daytime highs consistently above 75 degrees)
o Edging of all field perimeters will occur once monthly
o 80% turf coverage at the start of every season
o 65% turf coverage after play begins
o 20% weed infestation
o 5% bare area at the start of every season
o 15% bare and weak areas will be acceptable after play begins
o Remove grass clippings if visible
o Aerate once annually
o Inspect thatch layer regularly and remove as needed
o Test soil and water annually
§ Additional testing will occur if deemed necessary
§ Soil moisture will be consistent
o No wet areas
o No dry areas
o Firm enough for foot and mower traffic
o Inspect weekly for insects, disease, and stress, and respond to outbreaks within 24 hours
• Fence and Gate Maintenance
o Inspect fences, gates, and bollards at least once annually. Complete safety-related repairs immediately, and complete other repairs within 5 days of discovery
o Clean debris annually
• Sign Maintenance
o Inspect sign lettering, surfaces, and posts at least once every 3 months
o Repair/replace signs to maintain design and safety standards within 5 days of discovery
o Clean sign once a year
• Pest Control
o In accordance with the Department’s Integrated Pest Management Program (IPM), inspect problem areas monthly and remedy immediately upon discovery
• Vandalism and Graffiti Removal
o Initiate repairs immediately upon discovery. Document and photograph damage as necessary
• Picnic Shelters
o Reserved units cleaned and litter removed prior to and after each reservation
o Minor repairs are made immediately upon discovery
o Non-reserved units are cleaned bi-weekly, or as necessary
• Lighting Security/Area
o Inspect quarterly
o Repairs/bulb replacement will be completed within 72 hours of discovery
• Restrooms
o Restrooms cleaned daily unless contracted
o Restrooms inspected every three hours
o Restrooms locked/unlocked daily
o Replace waterless urinal cartridges monthly
o Leaks dealt with immediately and were repaired within 24 hours of discovery
Maintenance Standards can change by season and month depending on the type of park and level of use. Standards will be calculated by time and equipment needed to develop required operation budgets.
• Turf Maintenance
o Mowing will occur once every 10 days
o Mowing heights
§ 2½” during cool season (day time highs consistently below 75 degrees)
o 50% turf coverage
o Up to 50% weed coverage for existing
o Up to 20% bare area
o Safety of hazard only action
The Department shall establish and implement a maintenance program to assure safe and enjoyable water park conditions.
The Department shall establish and administer programs for all areas of the water parks. These should be maintained in good condition in conformance with the Department’s minimum standards. The policies that will govern minimum standards for maintenance operations include but are not limited to:
• Customer Service
o Safety and directional signs are properly positioned
o Entrance is clearly visible with appropriately placed road signs to access the water park
o Entrance is well landscaped with a “Welcome To” sign in place
o Parking lot is clean and well maintained
o Parking lot has designated handicapped slots
o Area surrounding water park is neatly groomed and landscaped
o Maintenance building is neat and clean
• Buildings and structures
o Bathhouse and restrooms floors should be disinfected daily
o Pool decks should be rinsed daily
o Buildings and structures shall be maintained in good repair at all times in a fashion which is consistent with fire and safety codes and regulations.
o Tools, supplies and equipment will be organized in an orderly fashion
o Chemical storage shall be reported to the Department on an annual basis as part of SARA III reporting requirements. All chemicals shall be stored in a fashion consistent with local/state storage recommendations.
• Restrooms shall be checked at least hourly on a daily basis and maintained in a manner to provide clean and sanitary facilities. Soap, towels, toilet issue, etc., shall be provided in adequate quantities at all times.
• Water Park
o Check the operation of the recirculation pump and motor daily
o Check the operation of the disinfectant and pH chemical feeder daily
o Check the filter operation, read the pressure gauges, and backwash, if necessary, daily
o For all closed filters, manually release the air daily
o Skimmer strainer baskets must be cleaned daily
o Clean the bottom of the pool and manually skim debris from the surface daily
o Measure and record the chlorine or bromine residual and the pH at least twice a day
• The staff shall keep true, accurate, and complete records of water park maintenance, chemical applications, and safety inspections
• Planters (All areas planted with ornamental plants, and having a definable border)
o Planters shall be maintained free of trash and debris such as (e.g., paper, drinking cans, bottles, fallen limbs and leaves, etc.)
o Planters shall be maintained free of weeds or grass by mechanical, manual or chemical means
o Plant material (e.g., trees, shrubbery and ground covering) in planters shall be trimmed for protection from wind, insect damage, and appearance
o Various planting areas throughout the facility will be cultivated, weeded, pruned, and fertilized regularly, with at least 2 replanting programs for annuals scheduled yearly
• Irrigation (All equipment required to irrigate all areas of the property)
o Repair or replace all heads, valves, control equipment, wiring and pipe as needed to maintain the proper operation of the irrigation system on an ongoing basis
• Fences (All fences, chain links, walls, or barbed wire on or within boundaries of the property)
o Repair all broken or damaged fencing as necessary
o Immediately repair or replace all fences, gates and locking devices as needed for the protection of the water park
• Parking, Sidewalks and Hardscape
o All sidewalks, patios, and concrete paths must be kept edged. Edging around valve boxes, meter boxes, backflow preventers, etc., shall be done as needed to ensure there is no obstruction of play or maintenance from growth around these areas
o Any change in the physical characteristics of the water park or the modification of any portion of the grounds or structures, shall only be undertaken with the direct approval of the Department
o Trash and refuse shall be collected daily and removed from the property as necessary to ensure minimal problems from refuse odors, insects, etc.
• Park Amenities and Slides
o All slides are inspected daily for problems. Slides are waxed on a yearly basis
o All in-park amenities are inspected daily and repaired as need
o Sand in play areas are raked daily as it applies to play areas and volleyball areas
o Picnic areas washed down daily and tables inspected for repairs before park opens to visitors
o Lazy river painted and repaired yearly as needed
o Park pool painted and striped on a yearly basis
o All tubes are inspected weekly
• Mow park at least once a week at 3 inches
• Pick up trash daily in parking lots
• Clean restroom at least once a week
• Inspect signage on how to use the park properly
• Move dog areas every two weeks to keep areas from getting beat down
• Grade parking lot monthly or as needed
• Inspect fencing on a weekly basis
• Inspect safety lighting on a weekly basis