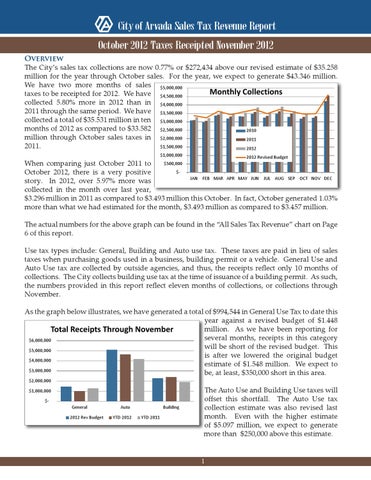
City of Arvada Sales Tax Revenue Report October 2012 Taxes Receipted November 2012 Overview The City’s sales tax collections are now 0.77% or $272,434 above our revised estimate of $35.258 million for the year through October sales. For the year, we expect to generate $43.346 million. We have two more months of sales $5,000,000 Monthly Collections taxes to be receipted for 2012. We have $4,500,000 collected 5.80% more in 2012 than in $4,000,000 2011 through the same period. We have $3,500,000 collected a total of $35.531 million in ten $3,000,000 months of 2012 as compared to $33.582 $2,500,000 2010 million through October sales taxes in $2,000,000 2011 $1,500,000 2011. 2012 $1,000,000
2012 Revised Budget
$500,000 When comparing just October 2011 to $October 2012, there is a very positive JAN FEB MAR APR MAY JUN JUL AUG SEP OCT NOV DEC story. In 2012, over 5.97% more was collected in the month over last year, $3.296 million in 2011 as compared to $3.493 million this October. In fact, October generated 1.03% more than what we had estimated for the month, $3.493 million as compared to $3.457 million.
The actual numbers for the above graph can be found in the “All Sales Tax Revenue” chart on Page 6 of this report. Use tax types include: General, Building and Auto use tax. These taxes are paid in lieu of sales taxes when purchasing goods used in a business, building permit or a vehicle. General Use and Auto Use tax are collected by outside agencies, and thus, the receipts reflect only 10 months of collections. The City collects building use tax at the time of issuance of a building permit. As such, the numbers provided in this report reflect eleven months of collections, or collections through November. As the graph below illustrates, we have generated a total of $994,544 in General Use Tax to date this year against a revised budget of $1.448 million. As we have been reporting for Total Receipts Through November several months, receipts in this category $6,000,000 will be short of the revised budget. This $5,000,000 is after we lowered the original budget $4,000,000 estimate of $1.548 million. We expect to $3,000,000 be, at least, $350,000 short in this area. $2,000,000 $1,000,000 $General 2012 Rev Budget
Auto YTD 2012
Building YTD 2011
The Auto Use and Building Use taxes will offset this shortfall. The Auto Use tax collection estimate was also revised last month. Even with the higher estimate of $5.097 million, we expect to generate more than $250,000 above this estimate. 1
Building Use tax, however, has been the biggest surprise. Through November the City issued 300 single-family housing permits. The last year the City permitted this many single-family housing permits was 2004. The Building Use tax rececipts reflect single-family housing, multi-housing and general renovation types of permits. We had revised the building use tax revenue from $1.557 million to $2.283 million (See “Other Tax Collections” graph on Page 7). Through November a total of $2.389 million was collected. We do not expect to significantly exceed this total through the last month of the year. As the “Other Tax Collections” graph on Page 7 illustrates, with the Use Taxes we also report Franchise Fees. As will be discussed below, revenue from utilities, particularly the types that help heat and cool environments, is lower than it has been. This is due to the weather. As shown, the secondary impact of more temperate weather is that we are also seeing a significant loss from utility franchise fees. In fact we have collected only 72% of our revised budgeted estimates, and it is nearly $900,000 short of budget. It is clear we will not be able to attain our estimates, and expect to be short of budget by nearly $500,000 in this one category of revenue. Sales Tax Receipts Detail It is important to review the sales tax detail to determine the source of the revenue. First, the following graph provides the allocation of the sales tax to the two areas: General and Public Safety or Tax Increment. The graph compares the years’ 2007 – 2012 Budgets. $40,000,000 $35,000,000 We continue to examine the $30,000,000 $25,000,000 history from the onset of the $20,000,000 Great Recession through $15,000,000 $10,000,000 today. Clearly, our sales tax $5,000,000 $collections have experienced 2012 2007 2008 2009 2010 2011 2012 Budget robust growth last year and Voter-Approved Police Sales Tax $4,418,633 $4,509,510 $4,308,317 $4,339,080 $4,513,455 $4,817,958 $4,777,540 this year through October. General $28,822,849 $29,419,259 $28,096,968 $28,298,517 $29,068,372 $30,713,077 $30,481,061 We have now surpassed our highest year of collections, which was 2008. This graph also illustrates that we have collected more than our Revised Budget Estimates. We will continue this analysis over time until the country addresses its long-term fiscal issues. The international economy is experiencing major changes in economic interdependency. Until we are through this period, which may take years, the national economy will require oversight. How all this macro change impacts the local economy is an interesting study. Total Receipts Through November
2
Types of Businesses The “All Sales Tax by Category” graph on Page 6 provides detail of the significant number of types of businesses we analyze. For the purposes of this summary, we combine the following areas: Restaurants/Fast Food/and Fast Food Casual; Grocery and Health Food/Specialty; and Public Utilities and Telephone. We also combine Liquor Stores, Drug Stores, Auto Care, Office Supplies and Furniture into “All Others.” JAN-OCT 2010
JAN-OCT 2011
JAN-OCT 2012
% CHANGE 2011/2012
Clothing Stores
$839,650
$860,279
$865,702
0.63%
Restaurants/Fast Food/Fast Casual
3,675,927
3,807,683
4,117,287
8.13%
General Department
5,931,896
6,211,936
6,526,169
5.06%
Grocery/Health
5,679,205
5,771,738
6,487,191
12.40%
Utilities/Telephone Equipment
5,354,342
5,298,614
5,353,160
1.03%
Retail Hardware
2,510,616
2,416,348
2,602,306
7.70%
Auto Care
1,396,038
1,456,103
1,543,546
6.01%
311,793
333,293
328,470
-1.45%
3,659,464
7,426,588
7,707,204
3.78%
$32,658,931
$33,588,582
$35,531,035
5.80%
Drug Stores All Others Total
The table above includes rebates and late fees; thus, the total tax collections. Also, these numbers have been adjusted to “smooth” the collections from one major business. This business makes 13 payments, and the payment has already been made, but historically, it usually is paid in the July/August payments. Thus, these numbers do not match the Oracle receipts.
Information by Location The following is a compilation of area shopping centers. Page 7 contains a graph (Sales Tax Revenue by Area) which provides additional information. LOCATION
JAN-OCT 2009
JAN-OCT 2010
JAN-OCT 2011
JAN-OCT 2012
80th Sheridan/Wadsworth
$4,532,004
$4,492,650
$3,863,569
$4,419,899
1,343,539
1,278,823
1,324,707
1,347,838
1.75%
23,131
497,633
608,912
22.36%
112,279
64th Eastside Sheridan/Wadsworth 88th/ Wadsworth 64th Westside Ward/McIntyre/Indiana City Center/Olde Town
N/A
N/A
2011/2012 % CHANGE 14.40%
2011 -2012 $ CHANGE $556,330
3,699,920
3,678,986
3,887,681
4,104,490
5.58%
216,809
$9,693,604
$9,849,282
$10,040,770
$10,721,408
6.78%
$680,638
All areas of our city are seeing increased sales for the year. As the “Sales Tax Revenue by Area” chart on Page 7 illustrates, the Arvada Urban Renewal Area referred to as “Ralston Fields/ Target Center” is the only area of town that is showing lower revenues than last year. There is some shifting between stores and eating establishments in the various areas. This is to be expected as new businesses begin and users try new options. Overall, there is solid growth in the locations and types of businesses. 3
As we did last year, we are adding the special analysis for the Olde Town Monthly Sales tax collections. This area of town now has a 12.90% growth rate over the first 10 months of 2011. While we have larger growth rates in three areas of the city, this is due to grocery store changes and significant new business. In the Olde Town, the growth is coming from new businesses, but small business, a brewery, restaurants and small gift Olde Town Monthly Sales Tax Collections shops. It is an area of the City whose growth is the $90,000 reflection of a growing $80,000 “place.” It is becoming $70,000 a place with a variety of $60,000 2009 businesses that draws $50,000 2010 the entire demographics $40,000 2011 of the City – young $30,000 2012 professionals, families $20,000 and longer-established $10,000 $0 residents. JAN
FEB MAR APR MAY JUN
JUL
AUG SEP
OCT NOV DEC
Use Taxes There are three types of use taxes: General, Auto and Building. The first two are collected one month in arrears; this means we have only 10 months’ worth of collections. Building Use Tax is collected here at the City with the issuance of a building permit; thus the following graph provides 11 months of information. The graph provides information for six years. As stated in the introduction, the only concern is General Use tax. We have fallen to pre-Great Recession levels. Businesses pay this tax when they are adding interior things to their buildings (shelves, etc.) or for supplies for which they have not paid tax. Generally, one would see this as an indicator of increasing business. This is somewhat a concern.
Monthly Use Tax Collection Through October $10,000,000 $9,000,000 $8,000,000 $7,000,000 $6,000,000 $5,000,000 $4,000,000 $3,000,000 $2,000,000 $1,000,000 $General
JAN-OCT 2007
JAN-OCT 2008
JAN-OCT 2009
JAN-OCT 2010
JAN-OCT 2011
JAN-OCT 2012
2012 REVISED BUDGET
$958,895
$1,285,844
$1,093,968
$1,145,082
$1,282,367
$2,389,234
$1,448,000
Auto
$4,546,185
$4,335,339
$3,852,714
$3,817,071
$4,180,555
$4,642,869
$5,097,294
Building
$1,694,737
$1,670,671
$2,188,438
$1,937,627
$1,920,805
$994,544
$2,283,308
4
Summary After ten months of receipts, it is possible to state that the City’s sales tax revised estimates will be achieved. We will surpass the 2011 revenue in sales taxes by, at least, 5%, and hopefully collect more than 1% above our revised estimates. As illustrated, the challenges come from weather-dependent revenue: sales and franchise revenue from electric and national gas use. Of course, more temperate weather and lower utility costs are significant positives for every resident and business. In fact, the City also will have savings on the expenditure side from the same weather influences. These lower revenues will be offset from higher care, food, restaurant and additional discretionary spending. Overall, we should end the year well on the revenue side in almost all categories. The use taxes for building, as stated earlier, have been extraordinary. Within our city limits, home building has not only started again, but has been aggressive. These revenues, along with the revenue generated from new car sales, will help offset the lower business spending. This latter issue is one to carefully watch over the next few months as the private sector reacts to the national economy. Please call with any questions. Report Prepared By: Victoria A. Runkle Finance Director
5
ALL SALES TAX REVENUE OCTOBER 2012 SALES / NOVEMBER 2012 RECEIPTS AS OF DECEMBER 6, 2012 Sales/Receipts* Jan/Feb Feb/Mar Mar/Apr Apr/May May/June June/July July/Aug Aug/Sept Sept/Oct Oct/Nov Nov/Dec Dec/Jan
General/Sales Police TI & T2 Total All Funds Total All Funds Funds 01/26 Fund 21,22 2012 Actual 2012 Budget $ 2,834,152 $ 444,046 3,278,198 $ 3,237,444 $ 2,786,632 $ 437,859 3,224,491 $ 3,113,773 $ 3,130,557 $ 492,679 3,623,236 $ 3,484,930 $ 2,985,352 $ 467,944 3,453,296 $ 3,288,598 $ 3,061,666 $ 479,735 3,541,401 $ 3,441,555 $ 3,324,067 $ 522,200 3,846,267 $ 3,580,323 $ 3,061,745 $ 479,415 3,541,160 $ 3,348,276 $ 3,368,737 $ 528,082 3,896,819 $ 3,584,647 $ 3,139,949 $ 493,303 3,633,252 $ 3,470,971 $ 3,020,220 $ 472,696 3,492,916 $ 3,321,166 0 $ 3,348,459 0 $ 4,421,613
THROUGH YTD
$
30,713,077
$ 4,817,958
35,531,035 $ 33,871,683
2012 Actual
Total All Funds 2012 REVISED Budget $ 3,370,005 $ 3,241,270 $ 3,627,624 $ 3,423,254 $ 3,582,474 $ 3,726,924 $ 3,485,375 $ 3,731,425 $ 3,613,094 $ 3,457,155 $ 3,485,566 $ 4,602,662 $
35,258,601
Total All Funds 2012 Actual 2012 vs 2011 2011 Actual 012 REVISED Bud Actual $ 3,106,192 -2.72% 5.54% $ 3,058,870 -0.52% 5.41% $ 3,426,845 -0.12% 5.73% $ 3,308,172 0.88% 4.39% $ 3,308,917 -1.15% 7.03% $ 3,593,524 3.20% 7.03% $ 3,353,428 1.60% 5.60% $ 3,630,085 4.43% 7.35% $ 3,500,400 0.56% 3.80% $ 3,296,150 1.03% 5.97% $ 3,338,263 $ 4,559,375 $ 33,582,582
2012 Budget
0.77%
5.80%
2011 Actual
50 45 40 35
x 100000
30 25 20 15 10 5 0
Jan/Feb
Feb/Mar
Mar/Apr
Apr/May
May/June
June/July
July/Aug
Aug/Sept
Sept/Oct
Oct/Nov
Nov/Dec
Dec/Jan
ALL SALES TAX BY CATEGORY OCTOBER 2012 SALES / NOVEMBER 2012 RECEIPTS AS OF DECEMBER 6, 2012
$ $ $ $ $ $ $ $ $ $ $ $ $ $ $ $
TOTAL
$
3,492,920
$ $ $ $ $ $ $ $ $ $ $ $ $ $ $ $
Total Sales Total Sales % Chg. Oct-11 Oct 12-11 94,607 4.89% 140,511 -3.45% 57,105 7.81% 611,988 2.97% 567,849 12.03% 15,321 21.33% 261,707 8.04% 206,413 3.73% 242,616 1.38% 215,029 1.60% 87,106 4.30% 34,284 -3.90% 163,844 12.73% 58,208 -9.94% 67,958 11.97% 484,503 5.94%
$ 3,309,047 Oct-12
Oct-11
35,531,035
$
YTD-2012
Total Sales YTD Total Sales YTD % YTD-2011 YTD 12-11 860,279 0.63% 1,324,213 5.03% 510,324 16.98% 6,211,936 5.06% 5,619,055 12.44% 152,683 10.83% 3,229,981 -1.57% 1,973,146 7.92% 2,416,348 7.70% 2,068,633 5.09% 829,277 9.93% 333,293 -1.45% 1,456,103 6.01% 689,744 -7.32% 747,734 10.06% 5,183,518 2.89% 33,606,267
5.73%
YTD-2011
1,953 391 78 16 3 1 0 0 0 0
$600
Thousands
$ $ $ $ $ $ $ $ $ $ $ $ $ $ $ $
5.56%
$700
October 2012
Total Sales YTD YTD-2012 865,702 1,390,822 596,998 6,526,169 6,317,965 169,226 3,179,300 2,129,467 2,602,306 2,173,860 911,627 328,470 1,543,546 639,232 822,971 5,333,374
$500 $400 $300 $200 $100 $-
6
Year-to-Date
Clothing Stores Fast Food Rests. Fast Casual Restaurants General Dept. Stores Grocery Chain Stores Health/Specialty Foods Public Utilities, Cable TV Restaurant / Lounges Retail Hardware Tele Equip/Service Liquor Stores Drug Stores/Pharmacies Auto Care / Leasing Office Sups./Equiq./Computer Furn./Appliance/Flooring All Others
Oct-12 99,231 135,665 61,563 630,136 636,160 18,588 282,742 214,106 245,971 218,477 90,851 32,948 184,707 52,422 76,093 513,259
Thousands
Source of Sales Tax
SALES TAX REVENUE BY AREA OCTOBER 2012 SALES / NOVEMBER 2012 RECEIPTS AS OF DECEMBER 6, 2012 Oct-12 Sales Tax
Area
Oct-11 Sales Tax
% Change Oct 12-11
2012 YTD Sales Tax
2011 YTD Sales Tax
% Change YTD 12-11
64th & Indiana
$
73,117 $
38,454
90.14% $
529,145 $
364,612
45.13%
64th & McIntyre
$
198,574 $
195,845
1.39% $
1,947,876 $
1,885,723
3.30%
64th & Sheridan
$
112,256 $
114,931
-2.33% $
1,137,333 $
1,128,241
0.81%
64th & Wadsworth
$
21,820 $
20,273
7.63% $
210,505 $
196,466
7.15%
64th & Ward
$
158,821 $
157,331
0.95% $
1,627,469 $
1,608,383
1.19%
77th & Wadsworth
$
61,042 $
61,523
-0.78% $
613,151 $
591,463
3.67%
80th & Sheridan
$
119,012 $
117,985
0.87% $
1,172,386 $
1,159,255
1.13%
80th & Wadsworth
$
317,145 $
278,082
14.05% $
3,247,513 $
2,661,073
22.04%
88th & Wadsworth
$
56,438 $
55,534
1.63% $
608,912 $
497,633
22.36%
City Center
$
997,694 $
954,449
4.53% $
10,123,126 $
9,510,838
6.44%
Olde Town
$
64,025 $
58,955
8.60% $
598,282 $
529,932
12.90%
AURA / Ralston Fields
$
9,590 $
10,132
-5.35% $
108,091 $
111,664
-3.20%
AURA / Triangle
$
191,637 $
190,189
0.76% $
1,924,387 $
1,874,191
2.68%
TOTAL
$
2,381,173 $
2,253,681
9.23% $
23,848,176 $
22,119,475
8.26%
OTHER TAX COLLECTIONS OCTOBER 2012 SALES / NOVEMBER 2012 RECEIPTS AS OF DECEMBER 6, 2012
Funds 01, 21, 22
YTD Revenue
Use Tax Admissions Auto Use Building Use Franchise Fee - Utility Franchise Fee - Cable Franchise Fee - Tele. HUTF
$ $ $ $ $ $ $ $
TOTAL
$
Original Budget 2012
REVISED 2012 BUDGET
1,548,000 179,597 4,881,500 1,557,700 3,274,000 1,075,000 190,000 3,940,000
$ $ $ $ $ $ $ $
16,645,797
$
1,448,000 179,597 5,097,294 2,283,308 3,209,000 1,075,000 190,000 3,940,000
17,422,199 YTD 2012
$5,000,000 $4,500,000 $4,000,000 $3,500,000 $3,000,000 $2,500,000 $2,000,000 $1,500,000 $1,000,000 $500,000 $-
Use Tax
Admissions
Auto Use
Building Use
$ $ $ $ $ $ $ $
YTD 2012 994,544 148,198 4,642,869 2,389,234 2,316,672 806,821 164,642 3,211,749
$ 14,674,728
$ $ $ $ $ $ $ $
YTD % 2012 Revised Budget to YTD 2011 Actual 1,282,367 126,386 4,180,555 1,920,805 2,257,429 766,823 183,015 3,197,981
$ 13,915,362
68.68% 82.52% 91.08% 104.64% 72.19% 75.05% 86.65% 81.17%
$ $ $ $ $ $ $ $ $ 84.23% $
YTD 2011
Franchise Franchise Franchise Fee - Utility Fee - Cable Fee - Tele.
7
Revised to Actual Dollar Difference
HUTF
(453,456) (31,399) (454,425) 105,926 (892,328) (268,179) (25,358) (728,251) (2,747,471)
Finance Department • 8001 Ralston Road • Arvada, Colorado 80002 (720) 898-7120 • www.arvada.org
Contributors: Patrick Brown, Revenue Manager Carol Larimer, Financial Systems Analyst Arlene Martinez, Executive Assistant
8