16 minute read
Infrastructure


Infrastructure Work System Summary
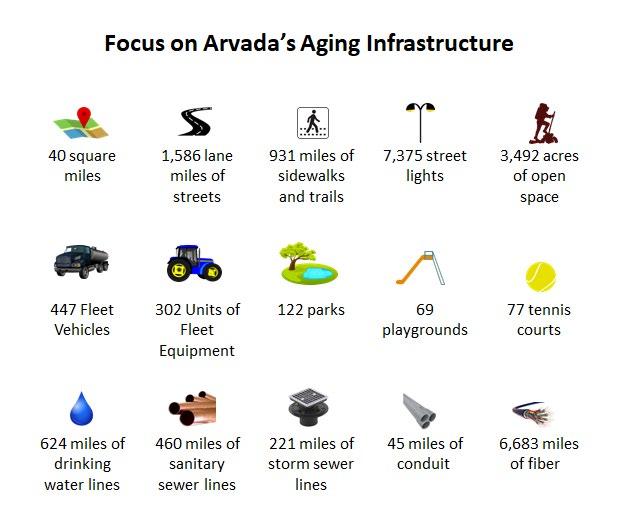
The community depends on a well-maintained foundation of streets, sidewalks, and water, wastewater and stormwater facilities. Planned and steady population growth requires proper maintenance of existing infrastructure and additional capacity to support a thriving community.
Advertisement
PRINCIPLES AND SERVICES:
To support infrastructure, the City of Arvada:
• Provides the community with a safe, reliable, high-quality water supply, drainage system, and wastewater disposal services for full city build-out, as defined by the Comprehensive Plan. This includes maintaining utility rates at lowest practical levels with accurate billing that supports replacement of aging infrastructure in order to maintain robust utility systems . • Offers services focused on safe and environmentally-efficient City facilities and fleet vehicles to ensure the most efficient and maximum usage of valued assets. • Maintains existing roads and transportation network in tandem with snow and ice control services to ensure swift and safe transportation modes for the community . • Provides safe and efficient connections to modes of transportation, including transit, streets, sidewalks, and bikeways with a focus on enhanced technology at high-priority intersections improving safety and minimizing traffic congestion. • Applies cost-effective and timely engineering design, geographic information, effective construction practices, and established standards and specifications to align public infrastructure priorities with community growth and redevelopment needs . • Provides computer-aided drafting, design services, special analysis, GIS applications, and enterprise system integration for the workforce to better visualize spatial relationships for informed decisions, while maintaining and/or replacing infrastructure and accommodating new construction projects . • Enforces the federal Clean Water Act, Safe Drinking Water Act, and Endangered Species Act through best practices for stormwater runoff protecting water quality in rivers and streams, watershed health, and groundwater as a drinking water resource .
Budget Summary
Infrastructure Work System Summary
REVENUES BY TYPE 2021 ACTUAL 2022 REVISED 2023 BUDGET 2024 BUDGET Licenses, Permits and Fees $11,502,808 $4,649,158 $13,996,179 $14,539,566 Intergovernmental 6,803,883 6,151,623 7,401,006 7,593,632 Charges for Services 44,776,021 49,106,474 55,306,467 59,259,357 Fines and Forfeits 127,941 - - - Miscellaneous 4,374,915 2,357,351 2,538,701 2,546,811 Revenue Transfer 11,519,668 15,453,865 12,810,166 13,039,246 Other Financing Sources (483,037) 75,000 101,325,000 75,000 Total Revenues $78,622,200 $77,793,471 $193,377,519 $97,053,612
Revenue Highlights
• Licenses, Permits and Fees include water and sewer system development fees, drilling fees, inspection fees , Waste and Recycling fees . The increase in 2023 and 2024 is due to an increase in system development fees to coincide with current market rates in this area . System development fees were formally tap fees . • Charges for services increased in 2022 due to increases in water and wastewater rates and the implementation of the waste hauling and recycling program . The increases in 2023 and 2024 are due to water and sewer rate increases of approximately 14% and 12% respectively . • Miscellaneous revenues include interest on investments and recovered costs, including payments received as part of the 50/50 sidewalk replacement program . • The increase in other financing sources in 2023 is due to planned $50,000,000 bond issues in the
Water and Wastewater fund .
Infrastructure Work System Summary
EXPENDITURES BY TYPE 2021 ACTUAL 2022 REVISED 2023 BUDGET 2024 BUDGET Personnel $21,787,695 $24,940,621 $28,455,785 $29,868,129 Services and Charges 14,787,234 19,105,139 19,404,895 19,143,519 Supplies and Expenses 7,098,610 6,272,106 6,657,690 6,811,338 Contracts and Leases 19,610,713 28,981,324 27,297,514 27,499,622 Debt Service 276,667 490,000 6,590,000 6,590,000 Capital Maintenance 4,451,986 12,888,840 11,589,029 11,581,812 Capital Outlay 20,760,808 49,076,592 75,429,407 45,306,178 Transfers 6,073,732 5,804,823 5,482,377 5,556,502 Other (4,732) 6,447 6,560 6,757 Total Expenditures $94,842,712 $147,565,892 $180,913,257 $152,363,857
Employee FTE 213 .25 229 .25 251 .25 251 .25
Expenditure Highlights
• Personnel costs and the position count increased due to new positions in streets maintenance, facilities, engineering and the water and waste water funds . • Utilities and water disposal charges are included in the services and charges category . The annual increase in utilities was mitigated by implementation of the Ameresco Energy program in 2020 which is expected to reduce water, electric, and natural gas expenses . • The largest components of contracts are payments to Denver Metro Wastewater Reclamation
District for wastewater processing, asphalt and concrete work in the Street Maintenance program, and services associated with the new Waste Hauling program . • Debt Service increases in 2023 due to the issuance of bonds in the Water and Wastewater
Funds . • Capital Maintenance and Capital Outlay increase in 2022 due to the Gross Reservoir project and in 2023 capital projects which are discussed in further detail in the Capital Improvement section .
The anticipated bond issues in water and wastewater funds will fund the capital projects . • Transfers include transfers from the Water, Wastewater, and Stormwater utilities to the general fund and transfers from the Stormwater fund for payment of COPs .
Challenges Advantages
Aging curb, gutter, sidewalks, ADA compliant ramps, streets and utility assets Execution of bond projects
Funding required for asset maintenance, replacement and serving planned development Completion of Master Plans
Cost and availability of labor and materials Progress on long-term water and sewer needs
Expanding service area Comprehensive road condition analysis
Accessibility to public buildings Success of organized waste hauling
Infrastructure Work System Summary
Strategic Result 1
By 12/2022 complete and implement a Street Maintenance Master Plan
MILESTONES: • Through 12/2025 prepare an annual street maintenance report for City Council and the community • By 1/2023 provide City Council with a briefing of the Streets Maintenance Master Plan Performance Measure: Funds allocated toward street maintenance and the dollars required to maintain streets
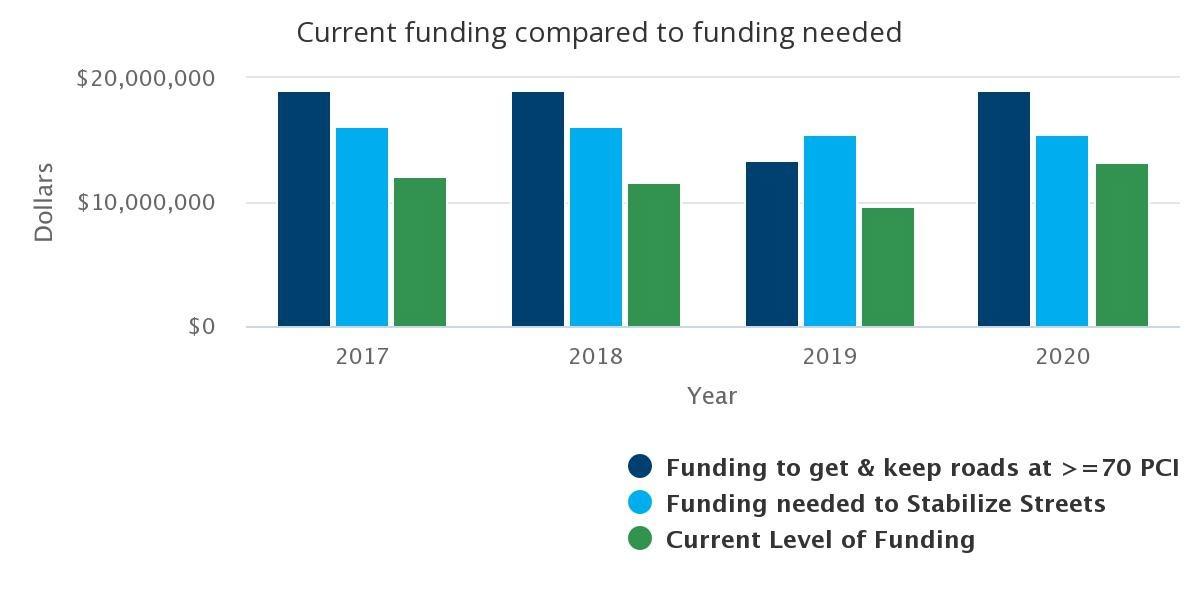
2016 2017 2018 2019 2020
Level of Funding $5,500,000 $12,164,988 $11,664,806 $9,623,036 $13,194,319 Funding needed to stabilize streets $16,200,000 $16,200,000 $16,200,000 $15,500,000 $15,500,000 Gap in Funding $10,700,000 $4,035,012 $4,535,194 $5,876,964 $2,305,681
Over the past decade, the cost of repairs to the street system has outpaced the money the City is able to dedicate to street maintenance projects . In November 2016, the City placed a measure on the ballot to increase City sales and use tax by 1/2 cent to fund only street maintenance and improvements . The ballot measure did not pass . Nevertheless, the City remains committed to protecting this asset and is working diligently to increase funding for street maintenance . This performance measure demonstrates that the City is making progress towards closing the gap in funding needed to stabilize streets
Performance Measures Target 2020
Pavement Quality Index 70 38
In 2020, the City transitioned from a Pavement Condition Index to a more comprehensive Pavement Quality Index (PQI) . The PQI provides an overall indication of a pavement section's condition with regard to present and future service to the user. The present service to the user is reflected in the Riding Comfort Index, which reflects the traveling public's opinion of the pavement's smoothness, hence the quality of service it provides . Future service to the user is measured through measurement of surface distress and structural adequacy . The city-wide averages of these measures make up the PQI, which is rated from a low of 0 to a high of 100 . The PQI helps the City to create its maintenance plan and efficiently allocate resources
Infrastructure Work System Summary
Performance Measures Target 2019 2020
75% of Traffic Signals connected by 2025 89 by 2025 27 34
The City of Arvada operates and maintains 118 traffic signals and 73 school zone flashers placed throughout the City. Signal connectivity will allow the Traffic and Transportation Division to monitor, troubleshoot, and adjust signal timing in order to improve traffic flow and safety. Fifteen additional signals are expected to be connected by the end of 2020 with future connections planned in coordination with signal rebuilds and the City's fiber project
Performance Measures - Community Survey Results 2017 2019
Overall street condition
Traffic Signal Timing
Level of congestion on the streets
Road convenience and accessibility
Plowing of streets in Arvada 5 .58 5 .45
5 .26 5 .29
4 .64 4 .83
6 .22 6 .58
6 .84 6 .5
The Arvada Community (Citizen) Survey is conducted every other year, and functions as a consumer report card for the City by providing residents the opportunity to rate their satisfaction with their quality of life, community amenities, and local government . The survey has a scale from 0 to 10 where 0-4 means “Does not meet expectations”, 5 means “Meets expectations”, and 6-10 means “Exceeds expectations” .
Strategic Result 2
a By 12/2021 complete full implementation of waste hauling options
COMPLETED MILESTONES: a By 5/2020 the first reading of the proposed ordinance will be complete a By 6/2020 a public hearing at a City Council Business Meeting will be held and City Council will be provided with the option for contract approval a By 12/2020 develop a waste hauling engagement and outreach plan if the contract is approved by
City Council a By 4/2021 complete initial household component selections to prepare for Cart Deployment in
June a By 6/2021 stage and deploy waste and recycle carts a By 7/2021 begin waste and recycle collection services with a contracted vendor
Performance Measure Support for Single-Hauler Waste Collection Service in Arvada 2017 2019
Somewhat or Strongly Support Neither Support nor Oppose Somewhat or Strongly Oppose
Infrastructure Work System Summary
66% 62% 13% 13% 21% 24%
The Arvada Community (Citizen) Survey is conducted every other year, and functions as a consumer report card for the City by providing residents the opportunity to rate their satisfaction with their quality of life, community amenities, and local government . Overall, two-thirds of residents either "somewhat" or "strongly" support the idea of single-hauler waste collection service
Strategic Result 3
By 12/2023 update water, sewer, stormwater master plans and develop an implementation plan to address all findings
COMPLETED MILESTONES: a By 12/2021 complete the Sewer and Stormwater Master Plans a By 12/2022 complete the Water Master Plan MILESTONES: • BBy 12/2023 actions including conceptual project and operational changes to utilities programs necessary to implement the Master Plans are included in the 10-year ClP and performance budget
Water related urgent response events will have a technician on site within 60 minutes 100% 100% 100% 100% 100% 100%
Water distribution pipeline breaks 25 29 12 21 24 14
The City is committed to maintaining the investment in the water system infrastructure . Timely response to all urgent situations minimizes property damage and inconvenience to all customers . By investing in water main replacement and taking the time to analyze and prioritize existing infrastructure, pipeline breaks have remained under the target in recent years .
Infrastructure Work System Summary
Stormwater assets inspected and cleaned annually . 25% 28% 39% 52% 62% 52%
Routine cleaning and maintenance of the stormwater system is needed to prevent blockages from forming in the pipelines . Inspecting and cleaning each pipe segment an average of once every 4 years is effective in preventing the buildup of materials that lead to blockages. This work helps minimize local flooding and maintain maximum flow capacity. Timely responses to water breaks, sewer overflows, and flooding help minimize damage.

Miles of sanitary sewer pipeline installed prior to 1980 rehabilitated or replaced
Annual replacement or rehabilitation of sanitary sewer
Portion of the sewer system cleaned annually Sanitary sewer backup events resulting in claims Underground infrastructure locates which result in damage to the City's water, sewer, or stormwater systems
Zero miles remaining by 2023 60,000 feet annually
63 53 38 29 24
70,650 56,099 75,022 48,745 37,770
a minimum of 66% 56% 57% 57% 52% 48%
2 or fewer 1 3 3 1 1
2 or fewer 5 1 0 0 1
Infrastructure Work System Summary
Upgrading the sewer system installed prior to 1980 will increase the lifecycle of the pipes . With this goal in mind, the City has a target of rehabilitating and/or replacing 60,000 lineal feet of sanitary sewer each year. Routine cleaning of the system prevents blockages from forming in the pipelines; the City target of 66% of the system to be cleaned each year is double the industry standard of 33% . Mainline backups are caused by debris that builds up over time . If a mainline is blocked and sewage backs up into the basement of a nearby home, the City assumes responsibility . The City is responsible for locating all underground infrastructure; if the assets are not precisely located, any damage becomes the City’s responsibility and cost .
As of the end of 2020, only 7% of sanitary sewer pipe 15" and smaller still need rehabilitation or replacement
Miles of 15" and Smaller Sanitary Sewer
500 450 400 350 300 250 200 150 100 50 0
2016 2017 2018 2019 2020 Needs Rehabilitation
Replaced/Rehabilitated
Previously Rehabilitated
Strategic Result 4
By 12/2023 provide financial options for City Council in order to eliminate the street maintenance deficit
MILESTONES: • By 12/2022 evaluate and develop policy direction for streets maintenance including ADA compliance requirements • By 12/2022 all new development in the City complies with ADA requirements and 2022 updated engineering standards • By 1/2023 complete research and create the business case for dedicated funding to street maintenance • By7/2023 obtain council support and direction for dedicated streets funding • By 12/2023 have a business case for maintaining infrastructure in the future
Infrastructure Work System Summary
Strategic Result 5
By 12/2025 effectively utilize voter approved bond funds for the completion of Ralston Road phase 2 and the expansion of 72nd Avenue
MILESTONES: • By 3/2023 85% of bond funds will be expended • By 12/2024 the required 5-year bond arbitrage calculation will be completed on time
Performance Measure Bond Budget 2019 2020
72nd Underpass
15,300,000 638,141 4,432,573
In 2018, Arvada citizens approved Ballot Issue 3F to fund $79 .8 million of improvements to Ralston Road and West 72nd Avenue . By March 2022, 85% of those funds ($67 .8 million) must be expended .
$7,000,000
$6,000,000
$5,000,000
$4,000,000
$3,000,000
$2,000,000
$1,000,000
$0
As of the end of FY 2020, 13% of the $79.8 million in bond proceeds had been spent
72nd Underpass Ralston Road - Yukon to Garrison
2019 2020
Strategic Result 6
By 12/2025 complete a comprehensive plan for City facilities and properties that would be utilized for City business operations post COVID-19, including the City Hall campus, Indiana Shops, and other appropriate satellite facilities to ensure optimal usage of space
COMPLETED MILESTONES: a By 12/2020 update the conceptual plan for the Post Office property a By 12/2021 present the conceptual plan for the Post Office property with cost, funding, and schedule to City Council MILESTONES: • By 12/2022 complete an evaluation of utilization of all currently operating City facilities • By 12/2023 determine need for additional facilities to support City operations • By 12/2024 develop a financial plan for improvements to existing City facilities and/or purchase of additional properties
Infrastructure Work System Summary
Performance Measure Target 2019 2020
Asset Management Program: Maintain less than 3% facility cost index (FCI) Less than 3% 0 .9% 0 .4%
The Facility Condition Index (FCI) is the ratio of current year required renewal cost to current building replacement value . It assesses the current and projected condition of the City’s building assets . Usage of the City Hall campus as a whole will be subject to future study. Currently, the post office has a lease through 2022 which it is anticipated they will renew . In addition, the recent COVID situation has potentially changed the way the City uses the workspace within City Hall . Between the anticipated lease renewal and the likely potential change in the use of workspace at City Hall, the post office expansion plan has been placed on hold until the current situation stabilizes and the City has a better long-term view of how workspace will be used .
Strategic Result 7
Through 12/2025 continue progress on having 100% of the water supply needed for buildout based upon the water supply master plan and current schedule for completion of Gross Reservoir by 2028
MILESTONES: • By 12/2024 develop a Water Supply Master Plan • Through 12/2025 maintain funds to meet water supply financial commitments • Through 12/2025 monitor Denver Water participation contract requirements to meet water delivery scheduled for 2028
Performance Measure FY 2016 Target 2016 Actuals 2017 Actuals 2018 Actuals 2019 Actuals 2020 Actuals
Responsible water use at golf courses - West Woods Average use for the prior Responsible water use at golf three yearscourses - Lake Arbor 315 287 295 239 331
117 116 124 111 153
The ability to use water in a responsible manner while maintaining USGA golf course appearance and play-ability standards requires the monitoring of water usage at both courses. Pump station flow meter readings are collected at both pump stations and converted from gallons to acre feet . The target is based on the average usage on the courses for the prior three years . In 2018 a new irrigation system was installed at West Woods which has reduced water usage .
Strategic Result 8
By 12/2022 the engineering standards and City code framework will be updated
COMPLETED MILESTONES: a By 12/2020 create new development agreement terms and tern- plate a By 12/2021 complete draft engineering standards and specifications update MILESTONES: • By 12/2020 complete an inventory of engineering Ordinances and specifications and by 12/22, adopt new/revised Ordinances and specificationsnew/revised ordinances and specifications 150
Infrastructure Work System Summary
Strategic Result 9
By 12/2023 complete and implement an Arvada transportation master plan, including analysis of the current transportation network, and analysis of future multi –model opportunities including non-motored micro-mobility options, transit operations first and last mile opportunities, road system safety improvements, and emerging transportation technology
MILESTONES: • By 6/2022 initiate a transportation master planning project with a selected contractor • By 6/2023 begin implementation of the transportation master plan • By 7/2023 the Transportation Committee will align with city stakeholders in the refinement and implementation of the masterplan recommendations • By 1/2024 on an on-going basis provide semi-annual updates to the City Council regarding the implementation
Strategic Result 10
MILESTONES: • By 8/2022 evaluate current City Ordinances, state and federal regulatory requirements, and the logistics for the development of an environmental regulatory compliance program • By 12/2022 provide the analysis and . recommendations regarding a comprehensive environmental regulatory compliance program to the City Manager • By 6/2023 based upon the outcomes of previous milestones, update workforce plans and set new milestones for the resourcing of recommendations
Strategic Result 11
By 6/2024 conduct a fleet electrification transition study
MILESTONES: • Effective 6/2022 all future vehicle purchases will include the evaluation of electric vehicle options • By 12/2022 identify and solicit additional state, local and grant funding opportunities for charging infrastructure • By 6/2023 complete a telematics study of city fleet vehicle use patterns • By 6/2024 prepare a comprehensive report with vehicle use pattern assessments and recommendations for fleet electrification, including vehicles, resource needs, and charging infrastructure
Meets or Exceeds Target Just Under Target Does Not Meet Target a Complete