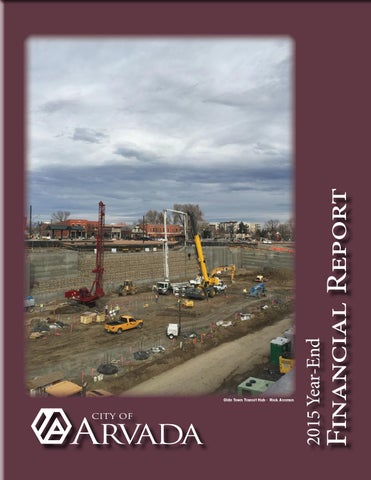
Financial Report
2015 Year-End
Olde Town Transit Hub - Rick Assmus
Table of Contents Overview.......................................................................................1 General Fund...............................................................................3 Arvada Center..............................................................................7 Parks Fund...................................................................................9 Special Revenue Funds........................................................... 11 Capital Improvements Projects Fund.................................... 13 Enterprise Funds...................................................................... 15 Internal Service Funds............................................................. 21 City of Arvada Investment Report.......................................... 25
The Financial Report for the City of Arvada provides an unaudited overview of the major funds and how their revenues and expenditures performed in comparison to budget. This is not meant to be a complete accounting, but rather a quick look at the highlights. Revenues started out 2015 with a bang and never slowed down. The reduction in the price of oil, and the corresponding decrease in gas prices, led to increased consumer confidence and spending. The Federal Reserve did not adjust target interest rates until December, keeping borrowing rates at all-time lows throughout 2015. Lower rates resulted in a continued strong housing market, especially in the single-family detached category. General Fund revenues finished the year with 7.8% growth over 2014. This marks the fourth consecutive year of growth (2012-2015) since the recession in 2011. All major revenue categories participated, led by building revenues and sales tax. Even interest revenue experienced an uptick, albeit a small one, at 13 basis points over 2014 to close at .78%. Sales tax numbers continued to be strong, closing out the sixth consecutive year of growth (2009-2015). This included double-digit increases in the major categories of Fast-Casual Restaurants, Health and Specialty Foods, Auto Care, Office Supplies, Office Equipment, Furniture, Appliances and Flooring. Grocery Stores and General Department Stores also returned strong year-over-year growth with 4.9% and 3.7%, respectively. The only major category to experience a decline was Public Utilities. An unseasonably warm spring, coupled with a mild summer, led to reduced energy costs for residents. The graph below represents single-family detached building permits and overall building revenues for the past five years. Since the recession, building activity has increased every year, with 647 single-family permits issued in 2015. This represents the highest number of single-family permits issued going back to the early 1990s. Colorado continues to have one of the strongest financial markets, which has driven the housing market to its all-time high.
$12,000,000
700
$10,000,000
580
$8,000,000
460
$6,000,000
340
$4,000,000
220
$2,000,000
100
$0 GF Building Revenue Single-Family (Detached) Permits
2011 $3,896,438
2012 $5,137,472
2013 $6,072,258
2014 $9,200,979
2015 $10,501,613
125
321
427
581
647
Permits
Dollars
General Fund Building Revenue through December
-20
Auto Use tax collections almost broke the $7 million dollar mark for the first time in history. Aided by increased population and lower interest rates, revenue grew 16.6% over 2014. Long-term forecasts do not show this revenue pattern continuing, but for the short term, auto use should be a reliable source.
1
OVERVIEW
R. Assmus
2015 Year-End Report
The Gold Line, now called the G Line, is scheduled to open in October of 2016. Preparations along the line continue, with most of the work concentrated around the stations. Plazas at all three stations in Arvada are almost complete. Testing of trains along the track will start in early spring. The parking structure at the Olde Town Station is now out of the ground with construction beginning on the second deck. Progress is steady with crews working multiple shifts and six days a week. The transition of the operation of the Arvada Center from the City to a nonprofit is fast approaching. With a planned cut-over date of July 1, 2016, many operational items still need to be worked out. Dedicated teams from the current Center staff, along with many City employees, take the time to meet weekly to keep checklist items from falling through the cracks. While this is going on, there is still a business to run. Controlling costs while trying to increase market share will always be a challenge. 2015 had some improvement compared to the previous couple of years, but there is still more work to do. Final numbers show the Center ended with a $239,000 deficit, partially offset by an additional cash transfer from the General Fund of $180,000. The Parks Fund experienced a wonderful milestone in 2015, the completion of a master plan that was started in 1973. With the addition of Britton and Griffith Parks, all Arvada residents now have a park with a 10-minute walk of their home. Parks’ focus will now shift to upgrading some of the older parks, as playground equipment, irrigation and design standards have changed since the 1970s and 1980s. The Arvada Housing Authority is feeling the effects of the very tight rental market. Currently, they are only able to help 471 families out of a maximum of 508 through the Section 8 housing program. This is because of the growth in rental costs over the past couple of years.
https://www.rentrange.com/arvada-co/ The City of Arvada is in the middle of a significant growth pattern. Single-family and multi-family residential homes are springing up out west by the hundreds. Transit-Oriented Development is in full swing around each of the light rail stations and businesses are interested in obtaining a presence in our City. This has created some opportunities but has also brought with it a list of challenges. Infrastructure, specifically street maintenance and capacity, will need to be addressed in the very new future. As the City continues to grow, the ability to provide the services our residents count on, without additional resources, will become a challenge. Strategic planning, coupled with long-term financial planning, should allow the City to identify these areas and work on solutions.
2
The General Fund pays for the City’s basic services. This includes police, street maintenance, planning, transportation planning, code enforcement, street light maintenance and costs, building activity and general administration. In addition, the General Fund also provides for the following: • Operational support to the Arvada Center • Operational support to the Parks Fund • General Debt Service payments • Transfer to the Capital Improvement Projects Fund for new parks, transportation and other infrastructure projects The following table provides a comparison of budgeted fund balances, revenues and expenditures to actual amounts in 2015. We have included the original 2015 budget adopted in October 2014 and the 2015 revised budget, which was a result of the ten-year financial planning model that was completed in the third quarter 2015 and adopted by council in the fourth quarter 2015. General Fund
2015 Budget
2015 Revised (ten-year plan)
2015 Actual
Beginning Fund Balance
$30,847,000
$30,847,000
$30,847,000
Revenues
$75,878,254
$83,052,567
$87,032,183
$77,197,814
$77,777,914
$72,286,074
EXPENDITURES Ongoing Capital
7,299,974
7,357,082
7,357,082
JPPHA (Jefferson Parkway Public Highway Authority)
1,255,000
1,255,000
770,650
$85,752,788
$86,389,996
$80,413,806
Expenditures Net Income/(Loss) Ending Fund Balance Goal (17% of Expenditures) Excess/(Deficit)
(9,874,534)
(3,337,429)
6,618,377
$20,972,466
$27,509,571
$37,465,377
14,577,974
14,686,299
13,670,347
$ 6,394,492
$12,823,272
$23,795,030
Budget Dedicated for 2016-2024 JPPHA (Jefferson Parkway Public Highway Authority)
$
-
$
-
$
484,350
Carryovers to 2016
-
-
1,569,725
One-time Items added in 2016
-
-
2,929,100
Olde Town Transit Hub in 2016
-
-
4,260,596
10,549,702
10,549,702
$10,549,702
$19,793,473
Use of Fund Balance 2016-2024 Total Dedicated Budget
$
-
The General Fund will end 2015 with a fund balance of a little more than $28 million, after carry-over and one-time items that will be expended in 2016. Some of this balance, $2,054,076, will be used for items not completed in 2015. Another portion, $2,929,100, will be dedicated towards one-time items. Additionally, $4,260,596, will be used to complete the funding package for the Olde Town Transit Hub. The remaining amount will be used towards ongoing operations to help balance our 10-year financial plan and maintain our Council-directed 17% fund balance reserve.
Revenue Highlights 2015 was an outstanding year for revenue in the General Fund. All revenue categories were up over 2014 and exceeded their budgets except franchise fees. As you will see on the following pages, sales tax, auto use tax and building-related revenues led the way with increases of 5.6%, 16.6% and 17.1%, respectively, over 2014. Overall, revenues experienced a 7.8% increase over 2014 and finished $3.9 million dollars over the revised budget. A large percentage of this revenue is considered one-time, not able to support ongoing operations, and will be used towards one-time expenditures as mentioned above.
3
GENERAL FUND
General Fund Overview
GENERAL FUND REVENUES Sales Tax 48%
Use Tax 2%
Property Tax 5%
Auto Use Tax 8%
Other 19% Interest 1%
Franchise Fees 5%
Sales Tax
In 2015, sales tax collections increased 5.6% over 2014. This is very respectable, considering that this increase follows five consecutive years of sales tax increases, three years which exceeded 5%. Grocery stores and general department stores increased 4.96% and 3.67%, respectively, over 2014. These two categories account for 36% of total sales tax. Other large categories which include retail hardware, restaurants, furniture/ appliances/flooring and auto care/leasing, all showed increases over 7%. Utilities/cable and telephone equipment were the only categories that showed decreases over the prior year. The utilities/cable category decreased primarily due to the wet weather during the spring of 2015.
Court Fines & Fees 2%
Building Use Tax & Permits 10%
Sales Tax Collections
$50,000,000 $40,000,000 $30,000,000 $20,000,000 $10,000,000 $0
2011 2012 2013 2014 2015 Sales Tax $35,852,374 $37,954,667 $40,205,021 $43,211,510 $45,642,944
4
Use Tax The City has three primary use tax types: general, building and automobile. These are taxes paid in lieu of sales tax on purchases.
Use Tax Collections $14,000,000 $12,000,000
General use tax is a stable source of revenue and showed a slight increase over 2014.
$10,000,000
Auto use tax collections for 2015 were almost $7 million or 16.6% over 2014, demonstrating that there is still strong demand for new vehicles. However, we continue to be conservative when budgeting for this revenue source as these increases cannot be sustained over time.
$6,000,000
Building use tax is also up over 17% from 2014 due to new home construction, primarily in northwest Arvada, and around the light rail stations. There was some commercial development, mostly infill, with additional planned over the next few years.
$8,000,000
$4,000,000 $2,000,000 $0 General
2011 $1,511,848
2012 $1,220,977
2013 $1,554,343
2014 $1,533,818
2015 $1,598,995
Auto
$4,340,794
$4,804,227
$5,379,579
$5,982,520
$6,973,208
Building
$1,780,442
$2,385,633
$2,884,866
$4,431,197
$5,215,500
Building
Property Tax The City’s property tax rate is 4.31 mills per $100 of valuation. In Colorado, the mill rate is placed on the assessed valuation. The following graph illustrates the year-to-date collections for the current and past four years.
Auto
General
Property Tax Collections
$5,500,000 $5,000,000 $4,500,000 $4,000,000 $3,500,000
Property tax collections in 2015 were slightly ahead of 2014. Given the increases that we have seen in assessed valuations, many may wonder why there isn’t a larger increase in property tax. Since real property is only appraised every odd-numbered year, tax collections trail the actual change in values, so we will not see the effect from increased valuations until 2016. This increase has been incorporated into the 10-year financial plans.
$3,000,000 $2,500,000 $2,000,000 $1,500,000 $1,000,000 $500,000 $0 Property Tax
Intergovernmental Revenues
2011 $4,643,015
2012 $4,500,376
2013 $4,556,940
2014 $4,600,995
2015 $4,668,082
Intergovernmental Revenues
This category is made up of two revenue sources, Highway Users Trust Fund (HUTF), which is the City’s share of State-collected gas tax revenue, and Road and Bridge, which is the City’s share of property tax collected by Jefferson County and dedicated to the maintenance of roads and bridges. In 2015, intergovernmental revenue increased 4% over 2014. While these revenue sources are stable, they have not increased at the same pace as the cost of street maintenance; therefore, other general fund revenues have had to fill the gap, reducing resources for other services.
$5,000,000 $4,500,000 $4,000,000 $3,500,000 $3,000,000 $2,500,000 $2,000,000 $1,500,000 $1,000,000 $500,000 $0 Jefferson County HUTF
2011 $776,092
2012 $855,684
2013 $718,844
2014 $730,239
2015 $734,993
$3,809,048
$3,818,142
$3,847,443
$3,949,386
$4,134,398
HUTF
5
Jefferson County
Expenditure Highlights Total expenditures show savings of over $5.9 million. Unspent JPPHA funds in the amount of $484,350, personnel and benefit savings of $1,975,521 and carryovers of $1,569,726 make up the bulk of this savings. The remaining dollars are spread across all of the major expenditure categories, as departments did a good job of monitoring their budgets and spending appropriately in 2015.
GENERAL FUND EXPENDITURES
Miscellaneous 2%
Transfers 19%
Personnel 48%
Debt Service 5%
Contracts 12%
Supplies and Expenses 6%
Services and Charges 8%
Salary and Benefit Savings Salary & Benefits
2015 Budget
Salaries & Wages
$30,161,104
Vacancy Savings
2015 Actual $29,320,181
(809,226)
-
Overtime
1,049,122
976,735
Group Insurance
6,042,442
5,531,833
Retirement
3,404,792
3,352,421
Medicare
374,456
373,360
Temporary Wages & SS
373,118
527,497
Other
359,185
360,667
$40,954,992
$40,442,693
Total
6
Temporary Wages were up significantly in 2015, due primarily to the use of independent contractors by Public Works to help manage Transit-Oriented Development projects currently underway. Overall savings of 1.2% compared to budget were achieved in 2015.
ARVADA CENTER
Arvada Center Overview
2015 Budget
2015 Actual
For the Arvada Center, 2015 presented many of the same challenges as in prior years, increasing market share while trying to control costs.
Arvada Center
There were positives along the way including: Scientific and Cultural Facilities District (SCFD) revenues, Performing Arts ticket sales, Education programs, and Marketing expenditures. The challenges included: high production costs related to show revenue and operational overhead. When the year closed, the Center needed an additional $239,222 to balance the books –an improvement from the $405,200 needed in 2014. A portion of this difference was funded from the General Fund in the form of $180,000 supplemental cash transfer, leaving a gap of $59,222. This gap will come out of the Center’s fund balance. The total cash contributed from the General Fund to the Center for 2015 was $1,875,536. An additional $1,810,854 of in-kind support was provided, for total General Fund support of $3,686,390.
REVENUES
Total Revenues
Revenue Highlights
Ending Fund Balance
357,857
141,778
The 2015-2016 theater season continues the Center’s tradition of positive reaction from both patrons and critics. The winter musical White Christmas was a success, grossing $912,800 in total tickets sales.
Goal (11% of Expenditures)
1,104,965
1,099,584
Excess/(Deficit)
$ (747,108)
$ (957,806)
Beginning Fund Balance
Generated
$
201,000
$
201,000
$ 5,335,306
$ 5,128,293
SCFD
1,029,553
1,122,316
City Cash Transfer-Original
1,611,251
1,695,536
City Cash Transfer-Additional City In-Kind Transfer
180,000 2,225,881
1,810,854
$10,201,991
$9,936,999
Ongoing
$7,819,253
$8,185,367
In-Kind
2,225,881
1,810,854
$10,045,134
$9,996,221
EXPENDITURES
Total Expenditures Income/(Loss)
156,857
(59,222)
SCFD revenues saw an increase over 2014 of 8% or $83,200. This was also 9% over the 2015 budget. The SCFD’s current authority to levy sales and use tax expires on June 30, 2018. A ballot measure for reauthorization of the tax could happen as soon as November of 2016. Contributed revenue increased from 2014 by approximately $48,800 or 17%; however, this revenue source was short of its $575,000 budget by 42%. In addition, another $24,000 was raised to fund a portion of the 2016 Jeffery Siegel concerts. The amount rests in deferred revenue at the end of 2015. The Center’s second collaboration with Swallow Hill Music Association resulted in 12 concert shows during Summer State. While the budgeted expectation was set at $576,400, total shows grossed just $396,500.
Expenditure Highlights Irving Berlin’s White Christmas - P Switzer Photography 2015
Education programs exceeded their budgeted revenue goal by $30,000, while expenditures were in line with budget. Both runs of Charlotte’s Web were well-received by patrons. Performing arts programs continue to work toward reducing show expenses. However, Musical Theatre, Theatrical Play, and Production concluded the year at 30% above budget. This will continue to be a challenge in the upcoming years as the Center transitions to non-profit status. Marketing expenditures are down 4% or $40,000 from 2014. The Center is constantly working on the right mix to increase ticket sales.
7
SCFD Revenue $1,200,000 $1,000,000 $800,000 $600,000 $400,000 $200,000 $0
2011
2012
2013
2014
2015
City of Arvada Contributions $4,500,000 $4,000,000 $3,500,000 $3,000,000 $2,500,000 $2,000,000 $1,500,000 $1,000,000 $500,000 Cash
In-Kind 2011
2012
2013
Total 2014
2015
Irving Berlin’s White Christmas - P Switzer Photography 2015
$0
8
Parks Fund Overview The Parks Fund accounts for costs associated with the acquisition, design, development, maintenance and beautification of parks, open space and trails within the City. Revenues are derived from the City’s General Fund, Grants Fund, Apex and Jefferson County Open Space funds.
Revenue Highlights In 2015, total Park Fund revenue was 6.5% greater than 2014 due to an especially strong year for Jefferson County Open Space tax collections. Open Space tax collections in 2015 were 7.35% greater than 2014, representing an additional $292,500 in revenue. APEX reimbursement revenue was 4.60% higher in 2015 as compared to 2014, but still under budget. All remaining revenue categories performed as expected.
2015 Budget
Parks Fund Beginning Fund Balance
$4,455,000
$3,620,182
$3,978,094
3,061,070
3,079,070
APEX Reimbursement
983,454
842,284
Other
193,076
400,598
$7,857,783
$8,300,045
$8,217,022
$7,766,797
-
-
$8,217,022
$7,766,797
REVENUES Open Space City Cash Transfer
Total Revenues EXPENDITURES Ongoing Capital Total Expenditures
(359,239)
Ending Fund Balance Goal (11% of Expenditures) Excess/(Deficit)
533,249
$4,095,761
$4,988,249
903,872
854,348
$3,191,889
$4,133,901
R. Assmus
In 2015, total Park Fund expenditures were approximately 1.89% greater than in 2014 and under 2015 budget by 5%. As a result, the ending fund balance was greater than originally forecasted - a strong performance year for Arvada Parks.
2015 Actual
$4,455,000
Income/(Loss)
Expenditure Highlights
PARKS FUND
PARKS FUND
9
PARKS FUND REVENUE
Parks Fund Revenue $8,000,000 $7,000,000 $6,000,000 $5,000,000 $4,000,000 $3,000,000 $2,000,000 $1,000,000 $-
2012 $877,333
2013 $828,696
2014 $829,498
2015 $842,284
Cash Transfer
$2,740,040
$2,790,917
$2,883,545
$2,937,398
$3,079,070
Open Space
$3,142,349
$3,312,981
$3,537,126
$3,685,566
$3,978,094
R. Assmus
2011 $865,995
APEX
10
SPECIAL REVENUE FUNDS
Special Revenue Funds Overview Special Revenue Funds account for revenues that are to be used for specific purposes. The following funds are considered special revenue funds: • Tax Increment Funds • Community Development • Housing
Tax Increment Funds Overview There are two tax increment funds which account for the voter-approved sales tax increases to fund expanded police services. The first accounts for the .21 cent sales tax and the second accounts for the .25 cent sales tax. Sources include sales tax, general use tax, auto use tax, building use and interest income. Since the tax increment is in addition to the City’s 3% sales tax, revenue trends in the tax increment fund will closely follow those in the general fund.
.21 and .25 Tax Increment Funds Beginning Fund Balance
2015 Budget
2015 Actual
$7,449,000
$7,449,000
$6,811,046
$7,170,115
1,475,580
2,124,922
117,000
210,257
$8,403,626
$9,505,294
$9,088,698
$7,774,747
420,000
396,221
$9,508,698
$8,170,968
REVENUES Sales Tax/Audit Revenue Use Tax Other Total Revenues EXPENDITURES Ongoing
Revenue Highlights
Capital
In 2015 Sales Tax increased by 5.73% and Use Taxes (Auto, General and Building) by 15.84%. Sales Tax and Use Taxes increased in total by $678,000 over 2014. Partnerships with outside agencies increased by 2.39%. These partnerships provided over $60,000 in 2015 and included agencies such as Colorado Automobile Theft Prevention program (BATTLE) and High Visibility Impaired Driving Enforcement (HVE). In 2015, a Community-Oriented Policing Services (COPS) Program federal grant for $875,000 was awarded for salary and fringe benefits for seven new Police Officer positions for three years, beginning in 2016. The City’s required match is 20% in 2016, 30% in 2017 and 50% in 2018.
Total Expenditures Income/(Loss) Ending Fund Balance Goal (11% of Expenditures) Excess/(Deficit)
(1,105,071)
1,334,326
$6,343,929
$8,783,326
1,045,957
898,806
$5,297,972
$7,884,520
Expenditure Highlights
Arvada Police Department
Personnel-related expenditures increased in total by $644,000 or 10.36% in 2015. With continued personnel realignment into the Community Stations, salaries increased by 10.29% from 2014. Retirements and resulting promotions throughout the ranks provided some savings in 2015, approximately $201,000 or 4.4%. With the 2015 approved policy change, Assignment Pay and On-Call Pay combined to increase just under $39,000. Shift Differential matched 2014 with no noticeable increase. Overtime, however, did see an increase of 34.91% or $75,000 over 2014.
11
Community Development
2015 Budget
2015 Actual
$6,299,000
$6,299,000
$ 114,737
$ 200,315
668,001
468,259
45,000
45,000
Community Development Fund
Overview
Beginning Fund Balance
The Community Development Fund accounts for all entitlements, revenues and expenditures of the Community Development Block Grants (CDBG) program and the Home Rehabilitation program and Essential Home Repairs program.
REVENUES
Revenue Highlights
City Cash Transfer
Due to some substantial deferred loan payments reflected in Recovered Revenues, the City was limited in how much it could draw from HUD in 2015. This is the cause of the gap between Budget and Actual for Grants Revenue.
Interest/Other
9,000
11,212
Total Revenues
$836,738
$724,786
$ 884,001
$ 683,275
302,044
281,760
-
-
500,000
500,000
$1,686,045
$1,465,035
(849,307)
(740,249)
$5,449,693
$5,558,751
Recovered Grants
EXPENDITURES Ongoing
Expenditure Highlights A drop in expenditures on energy efficiency audits and improvements represents much of the overall decreases in Ongoing Expenditures. The Capital Project Transfer represents the use of $500,000 in HODAG funding for sidewalk improvements along West 60th Avenue between Lamar Street and Sheridan Boulevard.
Essential Home Repairs Loans Capital Project Transfer Total Expenditures Income/(Loss) Ending Fund Balance
Arvada Housing Authority Overview
The Authority administers funds received for rent subsidy to low/ moderate income households under Section 8 of the U.S. Housing Assistance Payment Program.
Revenue Highlights
Arvada Housing Authority Beginning Fund Balance
Grants
Expenditure Highlights As of December 31, the Arvada Housing Authority was assisting 471 families with monthly rent subsidies out of a maximum 508. These subsidies continue to constitute approximately 90% of the Fund’s expenditures. As with Grants Revenue, increased Rents Expenditures were due primarily to timing in the first half of the year. The historically low number of client families is notable due to the current rental market. Normally, when a family leaves the program, the Authority would fill the vacancy with another family. However, with drastic increases in rental costs, the AHA hasn’t been filling vacancies like before. Instead, it is using the cost savings to cover elevated costs for the remaining families in the program.
2015 Actual
$
16,000
$
16,000
$
19,178
$
18,002
REVENUES Recovered
Revenues came in generally as expected for 2015..
2015 Budget
3,939,000
3,919,406
82,400
50,000
Interest/Other
1,000
326
Total Revenues
$4,041,578
$3,987,734
$ 399,777
$ 362,576
3,638,166
3,519,798
31,333
33,578
$4,069,275
$3,915,952
(27,697)
71,782
Transfers
EXPENDITURES Ongoing Rents Transfers Total Expenditures Income/(Loss) Ending Fund Balance
$ (11,697)
$
87,782
EOC ENERGY ASSISTANCE 2011-2015 - Dollars (Grants) $60,000
The City directly receives funding from Energy Outreach Colorado (EOC), a nonprofit corporation, and disburses it to low-income residents of Arvada as assistance with costs related to energy.
Total Dollars
$50,000 $40,000 $30,000 $20,000 $10,000 $0 Series1
2011 $48,800
2012 $52,000
2013 $44,212
2014 $44,492
2015 $52,078
12
The Capital Improvement Projects Fund is where the City keeps track of capital projects for streets, traffic, parks and the Arvada Center.
Capital Projects 2015 Budget
2015 Actual
$ 38,551,182
$ 38,551,182
$7,528,952
$10,578,593
-
2,267,797
$7,528,952
$12,846,390
CIP Administration
$11,254,790
$10,134,212
CIP Street Projects
5,311,078
1,654,795
CIP Traffic Projects
2,269,479
4,091,726
CIP Park Projects
4,463,580
4,622,350
50,000
348,843
Total Expenditures
$23,348,927
$20,851,926
Ending Fund Balance
$22,731,207
$30,545,646
Capital Improvement Fund Beginning Fund Balance REVENUES Transfers in Other revenue Total Revenues EXPENDITURES
CIP Arvada Center Projects
Anticipated Grant Revenue
10,127,074
Assigned for Projects: CIP Administration
$20,361,295
CIP Street Projects
7,918,980
CIP Traffic Projects
5,144,792
CIP Park Projects
5,103,744
CIP Arvada Center Projects
40,408,602 1,668,154
Ending Fund Balance
$
264,118
R. Assmus
8% Reserve
R. Assmus
Total Assigned for Projects
211,637
13
CAPITAL IMPROVEMENT PROJECTS FUND
Capital Improvement Projects (CIP) Fund Overview
Revenue Highlights In 2015, the majority of the revenues in the Capital Improvement Project (CIP) fund consisted of transfers from the General Fund, Lands Dedicated Fund, Community Development Fund and Special Assessments Fund. Other revenues include park development fees, grant revenue and contributions from other governmental agencies.
Expenditure Highlights In 2015, capital expenditures totaled over $20 million. Almost half of the expenditures are related to the Olde Town Transit Hub. With the retaining wall and plaza work complete, construction will begin on the parking garage. Completion is anticipated to coincide with the opening of the Gold Line in October. The Kipling Street Underpass and the Ridge Road improvements are also two new projects that will provide pedestrians and bicyclists easier access to the Gold Line stations. Britton and Griffith parks also opened in 2015, giving citizens in southern and eastern Arvada new choices to enjoy the outdoors. Not all the capital dollars were spent on new capital projects. Budgeted dollars were spent on renovation of three existing playgrounds and reconstruction of five traffic signals. The construction of 74th Avenue pedestrian and bicyclist bridge will connect Robby Ferrufino Park to a trail by Indian Tree Golf Course. Reserved Funds Even though the level of spending on capital projects was over $20 million, there is $30 million reserved for future projects and $10 million in grant revenue that will also supplement these projects.
R. Assmus
Future Work In 2015, the City Council convened a citizen capital improvement projects committee to recommend future capital projects in anticipation of two bond issues being paid off in 2018. In 2016, planning for and construction of the recommended projects will begin.
14
Overview The Water Fund accounts for all activities within the scope of the water utility operations including administration, operations, capital water projects, financing and related debt service and billing and collection. Water Fund Beginning Fund Balance
2015 Budget
Revenue Highlights
2015 Actual
$71,970,000
$71,970,000
$20,700,210
$18,595,392
Tap Fees
8,329,106
10,597,733
Interest
329,438
345,041
Other
698,449
1,882,494
$30,057,203
$31,420,659
$17,744,709
$17,346,414
Debt Service
2,261,700
2,252,725
Major Capital Maintenance
4,087,564
3,572,004
Capital
5,058,656
1,626,854
$29,152,629
$24,797,998
904,574
6,622,661
$72,874,574
$78,592,661
7,288,157
6,199,499
$65,586,416
$72,393,162
REVENUES Water Charges
Total Revenues EXPENDITURES
Total Expenditures Income/(Loss) Ending Fund Balance* Goal (25% of Expenditures) Excess/(Deficit)
As for Other Revenues, sales of water for construction purposes, as well as water meters, came in well above budget.
Expenditure Highlights Capital Expenditures included substantial work to expand the City’s water system to better serve the northwest area of Arvada. For 2016, deferred work on the Leyden Cavern water storage project and further work to augment cathodic protection for the City’s water transmission lines are planned. *$37,352,971 of the Fund Balance is a cash escrow reserved in Denver Water’s name for the Gross Reservoir expansion.
R. Assmus
Ongoing
For the Fourth Quarter of 2015, Water Charges showed a sharp reversal compared to the preceding three quarters, rising 143% over the Fourth Quarter of 2014. Total consumption finished 2015 down 6.3%. Annual Tap Fee receipts cleared $10 million for the second consecutive year due to continued robust building activity.
15
ENTERPRISE FUNDS
Water Fund
Water Consumption This chart, with data provided by Utilities, shows annual water consumption since 2011.
WATER CONSUMPTION 6,000,000
Thousands of Gallons
5,000,000 4,000,000 3,000,000 2,000,000 1,000,000 1000s of Gallons
2011 5,049,729
2012 5,700,412
2013 4,707,585
2014 4,775,208
2015 4,474,570
This chart shows water tap fee revenue since 2011.
Dollars
WATER FUND - TAP FEES $11,200,000 $10,400,000 $9,600,000 $8,800,000 $8,000,000 $7,200,000 $6,400,000 $5,600,000 $4,800,000 $4,000,000 $3,200,000 $2,400,000 $1,600,000 $800,000 $Tap Fees
2011 $2,394,111
2012 $4,378,473
16
2013 $7,896,850
2014 $10,167,203
2015 $10,597,733
Wastewater Fund Overview The Wastewater Fund accounts for all activities necessary in the collection, transmission and disposal of sewage and wastewater.
Revenue Highlights
2015 Budget
2015 Actual
$13,048,000
$13,048,000
$12,401,341
$10,858,398
Tap Fees
555,211
1,146,951
Interest
128,674
116,262
Other
612,581
862,790
$13,697,807
$12,984,401
$ 7,832,149
$ 7,832,149
Ongoing
3,140,527
2,891,011
Major Capital Maintenance
2,720,762
2,304,786
501,500
-
$14,194,938
$13,027,946
Wastewater Fund
As with Water Taps, Sewer Tap Fee Revenues remain substantially elevated, with 2015 being the second consecutive year of Tap Fee Revenue above $1,000,000.
Beginning Fund Balance
Expenditure Highlights
Sewer Charges
REVENUES
Treatment charges from the Metro Wastewater Reclamation District represented three-fifths of Total Expenditures for the year. The Department of Utilities will request that the budgets for Capital, specifically for infill sewer system extensions and easement modifications, be approved for carry-over into 2016.
Total Revenues EXPENDITURES Metro District
Capital Total Expenditures
R. Assmus
Income/(Loss)
(497,131)
Ending Fund Balance
$12,550,869
$13,004,455
3,548,734
3,256,987
$ 9,002,135
$ 9,747,468
Goal (25% of Expenditures) Excess/(Deficit)
Wastewater Tap Fees This chart shows sewer tap fee revenue since 2011.
Dollars
WASTEWATER FUND - TAP FEES $1,200,000 $1,120,000 $1,040,000 $960,000 $880,000 $800,000 $720,000 $640,000 $560,000 $480,000 $400,000 $320,000 $240,000 $160,000 $80,000 $Tap Fees
2011 $343,561
2012 $834,078
2013 $849,001
17
2014 $1,001,500
(43,545)
2015 $1,146,951
Stormwater Fund Overview The Stormwater Fund accounts for all activities necessary to maintain a stormwater management plan.
Stormwater Fund Beginning Fund Balance
2015 Budget
2015 Actual
$5,565,000
$5,565,000
$3,326,374
$3,348,154
32,341
82,745
$3,358,715
$3,430,899
$2,306,716
$2,169,427
933,288
869,731
1,385,000
1,660
Total Expenditures
$4,625,004
$3,040,817
Income/(Loss)
(1,266,289)
Ending Fund Balance
$4,298,711
$5,955,082
1,156,251
760,204
$3,142,460
$5,194,877
REVENUES Stormwater Fee Other Total Revenues
Revenue Highlights The City’s Stormwater Utility Fee rate rose by 2% as of the beginning of 2015, the first increase since 2009. Total Utility Fee receipts rose 3.2% for 2015 over 2014.
Expenditure Highlights The Department of Utilities will request that the budgets for Capital, specifically for an Estes Street Outfall and further flood mitigation efforts in the wake of 2013 flooding, be approved for carry-over into 2016.
EXPENDITURES Debt Service Capital
Goal (25% of Expenditures) Excess/(Deficit)
390,082
R. Assmus
Ongoing
18
Golf Fund Overview The Golf Course Fund accounts for all revenues and expenses of the Lake Arbor and West Woods Golf Courses, including food service operations.
Revenue Highlights
2015 Budget
2015 Actual
$ 207,000
$ 207,000
Golf Courses
$3,489,178
$3,309,361
Restaurants
1,228,929
1,473,308
215,759
230,274
$4,933,866
$5,012,944
Golf Courses
$2,210,080
$2,076,137
Restaurants
1,285,904
1,558,779
Administration
1,298,795
1,241,367
241,000
10,201
$5,035,779
$4,886,484
Golf Fund
In 2015, total Golf Fund revenue exceeded the original budget by 7.7%. Golf-related revenue was approximately 8.8% greater in 2015 compared to 2014 due to exceptionally strong retail sales in the pro shops and outside tournament rounds played. While rounds were down at Lake Arbor almost 11%, they were up at West Woods over 3%. Restaurant sales were 4.8% greater in 2015, with more than 128,000 people served at both golf course restaurants, an increase of 18,000 customers over 2014.
Beginning Fund Balance REVENUES
City Cash Transfer Total Revenues
Expenditure Highlights
EXPENDITURES
In 2015, total Golf Fund expenditures were approximately 7.41% greater than in 2014 and under the 2015 budget by 3%. As a result, the ending fund balance was approximately $228,000 greater than originally forecast. 2015 was a strong performance year for Arvada Golf considering the challenges faced with the wet start to the golf season.
Capital Total Expenditures Income/(Loss) Ending Fund Balance Goal (11% of Expenditures) Excess/(Deficit)
Golf Rounds by Type - January - December Westwoods
Variance
2014
2015
33,561
34,186
625
2%
7,617
8,029
412
5%
Super User Clubs
3,162
2,835
(327)
(10%)
Tournament
4,334
4,955
621
14%
510
729
219
43%
49,184
50,734
Player Support Super Users Annuals
Grow the Game Total
Lake Arbor
1,550
3%
Variance
2014
2015
Player Support
23,033
20,383
(2,650)
(12%)
Super Users Annuals
16,370
14,065
(2,305)
(14%)
Super User Clubs
1,263
1,486
223
18%
Tournament
716
901
185
26%
Grow the Game
373
496
123
33%
41,755
37,331
Total
(4,424)
(11%)
19
(101,912)
126,460
$ 105,088
$ 333,460
553,936
537,513
$ (448,848)
$ (204,053)
Hospitality Fund Overview The Hospitality Fund accounts for all revenue and expenses associated with food service activities including the operation of banquet facilities at the Arvada Center for the Arts and Humanities and off-site catering.
Revenue Highlights In 2015, total Hospitality Fund revenue exceeded 2014 by .18%. Sales revenue saw a slight decrease of 1.29% due to economic challenges primarily within the education and government market segments. The wedding market is currently down 50% compared to the average of the past five years. The main challenge is the aesthetics in the ballroom. While Concession Services revenue in 2015 reflected a slight 1% decrease, Banquet and Guest Service increased 3.21% over 2014. In 2015, a total of 38,346 people received culinary services.
2015 Budget
Hospitality Fund Beginning Fund Balance
2015 Actual
$
602,000
$
602,000
$
784,557
$
773,708
REVENUES Sales Concession Services
172,960
180,195
1,006,193
466,867
$1,963,710
$1,420,770
Banquet and Guest Services Total Revenues
Expenditure Highlights
EXPENDITURES
In 2015, total Hospitality Fund expenditures were approximately 3.65% less than in 2014 and $762,965 or 36.76% under the 2015 budget. The large reduction in budget was due to the delay of replacing capital equipment until after the master plan study has been completed. The plan study is scheduled for completion in the summer of 2016. As a result, the ending fund balance was greater than originally forecast.
Administration
$
Operations
724,055
$
352,262
1,351,275
962,833
Capital
-
-
Transfer to General Fund
-
-
$2,075,330
$1,315,095
Total Expenditures Income/(Loss) Ending Fund Balance
(111,620) $
Goal (11% of Expenditures) Excess/(Deficit)
20
490,380
105,676 $
228,286 $
262,094
707,676 144,660
$
563,015
We have five Internal Service Funds – Insurance Fund (Risk Management), Computer Fund, Print Services Fund, Vehicles Fund and Building Fund. Internal Service Funds charge internal programs and departments for use of goods and services. The Funds then pay for all associated costs of things such as purchasing insurance, vehicle purchases and maintenance, computer purchases and maintenance, and buildings maintenance.
Insurance Fund Overview The Insurance Fund, administered by the Risk Management Program of Finance, accounts for the City’s self-insurance against loss. It is funded with contributions by all City departments and programs based on their levels and types of exposure. The Fund is also used for loss prevention programs, the protection of City personnel and the preservation of City property and assets.
Insurance Fund Beginning Fund Balance
2015 Budget
2015 Actual
$4,065,000
$4,065,000
$1,817,992
$1,818,190
72,120
80,216
$1,890,112
$1,898,406
$2,301,669
$1,928,655
434,889
427,491
$2,736,558
$2,356,147
REVENUES Contributions Other Total Revenues EXPENDITURES
Total Expenditures Income/(Loss) Ending Fund Balance*
(846,446) $3,218,554
(457,741) $3,607,259
Revenue Highlights Contributions Revenue was down overall by 11.8% for 2015 from 2014, due to the move of two City Attorney’s Office FTEs from the Insurance Fund to the General Fund. Charges for lines of coverage - Workers Compensation, General Liability, Auto Liability, Property, and Auto Physical - remained generally unchanged.
Expenditure Highlights The Risk Management program had another successful year in 2015. One of the large projects was the updating of the Motor Vehicle Records for employees whose job responsibilities include driving, other than Public Safety, which conducts their own review. Working with representatives from other City departments to design a manageable program, Risk reviewed records for over 300 employees, and recommended remedial training for only a handful of individuals.
*Per GASB Statement 10, an additional $1,269,963 in cash is currently held in the Risk Management Fund to cover potentially incurred liabilities as of the beginning of the year. This figure was reached by Risk Management’s actuary for 2014.
21
R. Assmus
Risk Mgmt Administration Risk Mgmt Operations
INTERNAL SERVICE FUNDS
Internal Service Funds Overview
Computer Fund & Print Services Fund Overview The Computer Fund provides resources for both ongoing maintenance and replacement of the City’s computers, network hardware, and other electronic infrastructure. It is funded with contributions by all City divisions based on their levels of use of this technology. The Print Services Fund provides ongoing capital support for the City’s printing needs. Because these two funds operate to support combined activities within the Innovation and Technology Department, the financial reporting is combined for these two funds. Computer Fund/ Print Services Fund
2015 Budget
2015 Actual
$6,240,000
$6,240,000
Maintenance
$ 950,006
$ 953,429
Replacement
961,061
1,163,908
Print Shop
464,463
386,848
$2,375,530
$2,504,185
Maintenance
$1,072,121
$ 766,142
Replacement
2,323,213
741,968
450,581
336,735
$3,845,915
$1,844,845
Beginning Fund Balance REVENUES
Total Revenues EXPENDITURES
Print Shop Total Expenditures Income/(Loss)
(1,470,385)
Ending Fund Balance
$4,769,615
659,340 $6,899,340
22
Revenue Highlights The Maintenance and Replacement funds, combined, exceeded their anticipated budgets by 10.79% The Print Shop is 16.71% short of revenue budget, but with expenditures utilizing only 75%, this leaves the Print Shop with a $50,113 net income for 2015. Overall, Print Shop revenue increased just under 22% in comparison to 2014.
Expenditure Highlights Combined, the Maintenance and Replacement Fund utilized just under 50% of their budget. A large work effort was rolled out in 2015 to properly evaluate existing products and their anticipated replacement. As a result, there are several expenditures that will be pushed into 2016. Some existing maintenance expenses have increased as the pricing models on certain systems (i.e. back-up software) are based on the performance capability of the hardware. These systems are in the process of being evaluated to determine if they are still appropriate for the changing environment. The Print Shop expenses were below budget and 9.35% less than 2014 expenditures.
Vehicles Overview The Vehicles Fund provides resources for the maintenance of City vehicles and heavy equipment and/or replacement. It is funded with contributions by all City divisions based on their vehicle inventory and use. 2015 Budget
2015 Actual
$6,247,000
$6,247,000
Maintenance Transfers
$2,321,122
$2,321,122
Replacement Transfers
1,130,947
1,130,947
144,378
892,227
$3,596,447
$4,344,296
Maintenance
$3,056,258
$2,449,476
Replacement
1,725,440
1,494,333
Total Expenditures
$4,781,698
$3,943,809
Income/(Loss)
(1,185,251)
Ending Fund Balance
$5,061,749
Vehicles Fund Beginning Fund Balance REVENUES
Other Total Revenues EXPENDITURES
400,487 $6,647,487
Revenue Highlights Charges for Vehicle Maintenance services, which include personnel costs, rose 3% over 2014 levels. Charges for Vehicle Replacement contributions rose 1% over 2014 levels. Substantial gains from the sale of retired units are reflected in the Other Revenues.
Expenditure Highlights For 2015, Fleet acquired 12 new vehicles and 15 new pieces of equipment. Several additional units were put on order in 2015, but will not be delivered until 2016. Budgeted Maintenance Expenditures included $500,000 for the construction of a new storage building at the Indiana Shops, which will include a PD weapons testing range. Construction will take place in 2016.
Buildings Overview The Buildings Fund provides resources for maintaining major portions of facility infrastructure as replacement becomes necessary. The primary types of infrastructure are HVAC equipment, parking lots, roofs, and carpet. It is funded with contributions by all City divisions based on their facility occupancy. 2015 Budget
2015 Actual
$2,368,000
$2,368,000
$ 446,814
$ 443,230
136,312
241,330
$ 583,126
$ 684,561
Replacement
$ 588,615
$
Capital Lease
120,918
115,988
$ 709,533
$ 154,317
Building Fund Beginning Fund Balance REVENUES Replacement Transfers Other Total Revenues EXPENDITURES
Total Expenditures Income/(Loss) Ending Fund Balance
(126,407) $2,241,593
23
38,328
530,244 $2,898,244
Revenue Highlights Monthly replacement charges from contributing funds were generally increased by 3% for 2015, having been frozen since 2009.
Expenditure Highlights The Capital Lease Expenditures represent payments per an agreement with Siemens Building Technologies in 2004 for energy efficiency improvements at various City facilities. The term of this lease expires in 2016. Several HVAC replacements scheduled for the past couple of years are being deferred to 2016 in order to exploit better pricing with economies of scale. This represents the gap between the Replacement Budget and Actual.
Arvada Economic Development Association (AEDA) Overview AEDA was established to encourage and stimulate all forms of economic development – commercial and industrial. The services provided by AEDA benefit both the City and citizens by providing information and services to existing and prospective businesses and industries. Funding for AEDA consists of compensation from the City for services it renders the City and its citizens. The City also provides administrative support for AEDA. A Board of Directors appointed by City Council governs AEDA.
Operations
2015 Budget
Beginning Fund Balance
$475,577
$475,577
Revenue
790,879
700,242
Expenditures
784,897
691,062
$481,559
$484,757
Ending Fund Balance
2015 Actual
Revenue Highlights Revenue in the AEDA Operations Fund consists of a transfer from the general fund equal to the personnel and operating expenditures.
Expenditure Highlights Expenditures in 2015 are lower than budget primarily due to reduced spending in professional services, training and meetings, and dues and subscriptions.
Program Beginning Cash Balance Revenue Expenditures Ending Cash Balance
12/31/2015 $ 579,836 791,171 (525,361) $ 845,646
Reserved for Job Creation Program
(18,000)
Reserved for New Entrepreneur Program
(19,500)
Arvada Manufacturing Initiative
(5,400)
Commitments
(445,155)
Available Unallocated Cash Balance
$ 357,591
Revenue Highlights Revenues in 2015 consist of a cash contribution from the City of Arvada for $500,000, interest income and repayments on two loans.
Expenditure Highlights Expenditures in 2015 reflect 31 AEDA small business grants and one loan. The grants are used to help Arvada businesses improve signage, landscaping, facades, and site improvements.
24
R. Assmus
Pursuant to the City’s investment policy, the primary objectives of the City’s investment activities, in priority order are safety, liquidity and yield. Consistent with this policy, the portfolio of securities is invested in US Treasuries, US Agency debt, local government investment pools (LGIP’s), commercial paper, and corporate debt subject to rating and concentration limits. The City’s investment portfolio is managed to provide sufficient liquidity to meet all reasonably anticipated operating cash needs without selling securities prior to maturity.
R. Assmus
Investment Portfolio Overview The City’s investment portfolio in 2015 can be characterized by modest but steady improvement in the form of interest income. The portfolio saw a year-to-date fourth quarter yield of .78%, an increase of 13 bps when compared to 2014 annualized yield of .65%. This resulted in additional interest earnings of $307,246. Granted, the biggest improvement was in the last quarter of the year in anticipation and after the Federal Reserve raised its target rate from .25 to .50%. The most evident improvement was on the short-term side of the Treasury yield curve. In 2015 the City’s investments increased by $11 million to a total of $184 million. The performance of the City’s portfolio is regularly assessed against the established benchmark, which is calculated on a monthly basis as a weighted average yield of relative securities of the same or similar class and maturity as in our portfolio. In 2015 the portfolio yielded 18 bps above the composite benchmark. During the year the City’s portfolio also received $112 million in investment calls, which accounts for about 60% of the total portfolio. Callable securities always present a greater reinvestment risk, particularly in falling interest rate environments, but they offer higher coupon rates. There is some uncertainty in the markets around the Federal Reserve hiking the rates a few more times in the coming year, especially given the fact that most other central banks are doing just the opposite. In spite of the current market volatility, we continue to follow the investment strategy and put safety of investments as our first priority. Key information regarding the City’s portfolio is shown in the following tables and graphs:
25
CITY OF ARVADA INVESTMENT REPORT
Investment Portfolio Objectives
PORTFOLIO PERFORMANCE YTD Interest Earnings Portfolio Yield Benchmark Yield Tracking Error
2015 $1,341,747 0.779% 0.600% +18bps
2014 $1,034,501 0.647% 0.450% +20bps
PORTFOLIO CHANGES 2015 2014 $114,762 $1,013,883 3,645,820 13,289,185 15,088,055 10,015,299 8,987,000 5,995,000 29,382,054 20,924,908 127,050,000 121,725,000 $184,267,691 $172,963,275
Money Market Savings/ Cash CD Corporate LGIP US Agency Total
Difference $307,246 0.132% 0.150% -2bps Difference $(899,121) (9,643,366) 5,072,756 2,992,000 8,457,146 5,325,000 $11,304,416
ACCOUNT SUMMARY Par Value $184,267,691 Book Value $184,274,585 Market Value $183,672,938 Unrealized Gain/(Loss) $ (594,753)
PORTFOLIO CHARACTERISTICS Average Duration (yrs) 2.19 Average Coupon 0.921% Average Cost YTM 1.090% Average Market YTM 1.230%
PORTFOLIO ALLOCATION
Portfolio Yield vs. Custom Benchmark 1.20% 1.00%
U.S. Agencies, 68.9%
0.80% 0.60%
CD, 8.2% Corporate, 4.9%
0.40% 0.20% 0.00%
Savings/cash 2.0%
LGIP, 15.9%
2011
2012
2013
Portfolio Yield
2014
2015
Money Market 0.1%
Benchmark
MATURITY DISTRIBUTION 25.0% 20.0%
18.7%
17.1%
19.1%
21.1%
12.6%
15.0%
11.4%
10.0% 5.0% 0.0%
0-.25
.5-1
1-2
2-3
Maturity (yrs)
26
3-4
4-5
City of Arvada Investments - 2015 The City’s portfolio as of December 31, 2015 is shown below, which includes credit ratings as of December 31, face value and actual interest earnings for 2015. Description
CUSIP/Ticker
Credit Rating 12/31/2015
Coupon Rate
Maturity Date
Ending Face
Interest
Amount/Shares
Dividends
SAVINGS/CHECKING JPMorgan Chase Savings
CHASE
N/A
0.03%
N/A
$146,657
91
Wells Fargo Savings
WELLSFARGO
N/A
0.03%
N/A
$136,286
224
N/A
0.30%
N/A
$3,362,877
-
$3,645,820
315
JP Morgan Checking Sub Total Savings/Checking CERTIFICATE OF DEPOSIT Vectra Bank
5791396061
N/A
0.55%
06/25/2016
$5,032,040
20,809
Vectra Bank
5791396079
N/A
0.55%
06/25/2016
$5,032,040
20,809
Vectra Bank
5791396095
N/A
0.55%
07/07/2016
$1,008,702
3,702
Vectra Bank
5791396103
N/A
0.65%
08/29/2016
$1,003,818
3,818
Vectra Bank
5791396111
N/A
0.65%
08/29/2016
$1,003,818
3,818
Vectra Bank
5791396129
N/A
0.65%
08/29/2016
$1,003,818
3,818
Vectra Bank
5791396137
N/A
0.65%
08/29/2016
$1,003,818
3,818
$15,088,055
60,592
Sub Total Certificate Of Deposit CORPORATE Apple, Inc
037833AH3
AA1
0.45%
05/03/2016
$1,410,000
6,345
Berkshire Hathaway
084664BX8
AA2
0.95%
08/15/2016
$3,085,000
29,308
Exxon Mobil
30231GAA0
AAA
0.92%
03/15/2017
$1,500,000
13,815
Microsoft Corp 2 11/3/2020
594918BG8
AAA
2.00%
11/03/2020
$2,992,000
-
$8,987,000
49,468
Sub Total Corporate LOCAL GOVERNMENT INVESTMENT POOL C Safe LGIP
CSAFE
AAAm
0.29%
N/A
$10,520,519
18,133
Colo Trust LGIP
COLOTRUST8001
AAAm
0.30%
N/A
$13,948,313
23,423
Colo Trust LGIP
COLOTRUST8004
AAAm
0.30%
N/A
$174,175
326
Colo Trust LGIP
COLOTRUST8008
AAAm
0.30%
N/A
$4,557,863
7,996
Colo Trust LGIP
COLOTRUST8010
AAAm
0.30%
N/A
$181,184
650
$29,382,054
50,528
$114,762
879
$114,762
879
12/23/2016
$5,000,000
32,500
Sub Total Local Government Investment Pool MONEY MARKET CSIP MM
CSIP
AAAm
0.24%
N/A
Sub Total Money Market US AGENCY FHLMC
3134G56W0
AAA
0.65%
FHLB
313380U88
AAA
0.80%
04/17/2017
$3,000,000
24,000
FHLB
313382TR4
AAA
0.60%
04/24/2017
$5,000,000
30,000
FHLMC
3134G6UC5
AAA
0.70%
04/28/2017
$4,000,000
14,000
Chart continues next page
27
Description
CUSIP/Ticker
Credit Rating 12/31/2015
Coupon Rate
Maturity Date
Ending Face
Interest
Amount/Shares
Dividends
FFCB
3133ECP40
AAA
0.64%
05/09/2017
$5,000,000
32,000
FHLMC
3134G7ET4
AAA
0.85%
06/23/2017
$3,000,000
12,254
FHLB
313382W25
AAA
0.75%
08/15/2017
$5,000,000
37,500
FHLMC
3134G5A21
AAA
1.15%
12/26/2017
$5,000,000
57,500
FHLB
3130A5UN7
AAA
1.00%
01/29/2018
$5,000,000
-
FFCB
3133EEP46
AAA
1.09%
02/26/2018
$6,000,000
16,350
FHLMC
3134G6L76
AAA
1.25%
05/25/2018
$5,000,000
30,556
FHLB
3130A5UU1
AAA
1.05%
05/30/2018
$3,000,000
12,950
FHLMC
3134G7MU2
AAA
1.00%
08/17/2018
$4,000,000
10,000
FHLMC
3134G7A27
AAA
0.75%
10/15/2018
$3,000,000
-
FNMA
3136G2R58
AAA
1.04%
10/26/2018
$1,250,000
-
FHLMC
3134G73D1
AAA
0.50%
10/29/2018
$4,000,000
-
FHLMC
3134G8BZ1
AAA
0.75%
12/17/2018
$4,000,000
-
FFCB
3133EFBP1
AAA
1.41%
03/01/2019
$5,000,000
-
FNMA
3136G2QM2
AAA
1.20%
05/16/2019
$4,300,000
-
FHLB
3130A6UH8
AAA
1.55%
06/28/2019
$4,000,000
-
FFCB
3133EE6U9
AAA
1.73%
08/12/2019
$3,000,000
-
FFCB
3133EFEL7
AAA
1.60%
09/23/2019
$5,000,000
-
FFCB
3133EFKY2
AAA
1.36%
10/28/2019
$5,000,000
-
FHLB
3130A3EG5
AAA
1.25%
11/20/2019
$5,000,000
62,500
FNMA
3136G2SU2
AAA
1.50%
11/25/2019
$5,000,000
-
FNMA
3136G2RB5
AAA
1.43%
12/27/2019
$2,500,000
-
FFCB
3133EE2S8
AAA
1.98%
06/29/2020
$3,000,000
29,700
FHLMC
3134G7XN6
AAA
1.25%
09/30/2020
$5,000,000
-
FHLMC
3134G73S8
AAA
1.00%
10/29/2020
$5,000,000
-
FHLMC
3134G7S77
AAA
1.13%
10/29/2020
$5,000,000
-
Subtotal US Agency
$127,050,000
401,810
Total
$184,267,691
$563,591
Investment Management Focus - 2016 In December the Federal Reserve raised short-term interest rates by .25% for the first time in seven years. The anticipated four additional rate hikes in 2016 seem very unlikely given the weak economic data, strong dollar, and downside risk in the global economy. Even though the U.S. economy is doing better than emerging markets and euro zone, the futures market foresees an increased possibility of a recession. The flattening of the Treasury yield curve reflects this expectation. The focus will continue to be on the diversification of maturities. We will keep a portion of our portfolio in LGIP, money markets, and cash balances at levels to meet operating needs and capture attractive interest rates. We will continue to use a blended strategy, which calls for emphasis in short-term positions as well as some long-term positions (five years in the City’s case), but also staggering maturities in between to smooth the revenue stream. This strategy will allow ample cash should the City experience unexpected needs and allow us to take advantage of better coupons in longer maturity buckets. Agency spreads are still tight, callables will get better yield: Call provisions are a tool used by issuers to refinance debt at a more attractive rate. The focus will be to purchase callable securities with a call “lockout” period of at least six months to enhance investment income over the LGIP funds, which are currently yielding 48bps.
28
Finance Department • 8101 Ralston Road • Arvada, Colorado 80002 720-898-7120 • www.arvada.org Contributors: Bryan Archer, Director of Finance Lisa Yagi, Assistant Director of Finance Ryan Adler, Budget Analyst Deanne Gibboney, Budget Analyst Debra Nielson, Controller Arlene Martinez, Executive Assistant Vesta Weinhauer, Treasury Analyst