2015-2016 Revised Biennial Operating and Capital Budget
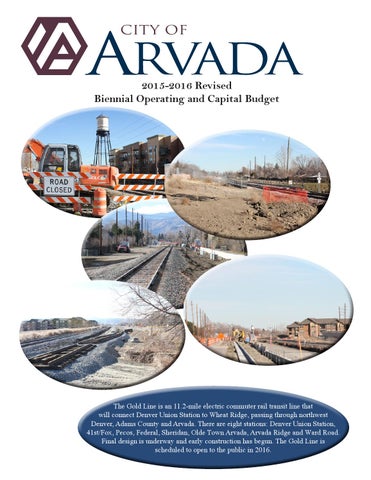
The Gold Line is an 11.2-mile electric commuter rail transit line that will connect Denver Union Station to Wheat Ridge, passing through northwest Denver, Adams County and Arvada. There are eight stations: Denver Union Station, 41st/Fox, Pecos, Federal, Sheridan, Olde Town Arvada, Arvada Ridge and Ward Road. Final design is underway and early construction has begun. The Gold Line is scheduled to open to the public in 2016.
2015-2016 Revised BIENNIAL OPERATING AND CAPITAL BUDGET TABLE OF CONTENTS Overview Budget Transmittal Letter............................................................................................................................................. 1-5 FOCUS Overview...........................................................................................................................................................7-10 Community Profile.............................................................................................................................................................11 Legal Requirements and Budget Process................................................................................................................12-16 Introduction....................................................................................................................................................................17-21 2015-2016 Proposed Revised Operating and Capital Budget Summary.............................................................23-37 Ten-Year Assumptions and Models..............................................................................................................................39-54 Budget in Brief Section...................................................................................................................................................55-80 Capital Improvements......................................................................................................................................................81-96 Debt Obligations................................................................................................................................................................97-99 Additional Information Proposed Pay Plan Position and Schedules ...................................................................................................... 101-115 2016 Budget Adoption Resolution ...............................................................................................................................117 2016 Appropriation Ordinance ............................................................................................................................ 118-119 Mill Levy Ordinance .......................................................................................................................................................120 2016 Pay Plan Adoption Resolution ............................................................................................................................121 2016 Capital Improvement Adoption Resolution .....................................................................................................122 Glossary of Terms..................................................................................................................................................123-126
Cover Design Provided By: Special Thanks To:
Arlene Martinez, Executive Assistant Lisa Yagi, Assistant Finance Director Ryan Adler, Budget Analyst Deanne Gibboney, Budget Analyst Debra Nielson, Controller Arlene Martinez, Executive Assistant i
2015-2016 Revised BIENNIAL OPERATING AND CAPITAL BUDGET
CITY OFFICIALS
Marc Williams Mayor (Term expires 2015)
Don Allard Councilmember At-Large (Term expires 2017)
Bob Fifer Mayor Pro Tem At-Large (Term expires 2015)
CITY MANAGER AND KEY STAFF
Nancy Ford Councilmember District 1 (Term expires 2017)
Mark McGoff Councilmember District 2 (Term expires 2015)
Mark G. Deven Lorie Gillis William Ray David Cooke Christopher K. Daly Bryan Archer Ron Czarnecki Linda Haley Robert Manwaring Rita McConnell Maureen Phair Gordon Reusink Philip Sneed Ryan Stachelski James Sullivan Don Wick Kelley Hartman Chris Koch Jessica Prosser Maria VanderKolk
John Marriott Councilmember District 3 (Term expires 2017)
David Jones Councilmember District 4 (Term expires 2019)
City Manager Deputy City Manager Deputy City Manager Municipal Judge City Attorney Director of Finance Chief Information Officer Director of Human Resources Director of Public Works Director of Community Development Executive Director of Arvada Urban Renewal Authority Director of Parks, Golf and Hospitality Services Executive Director of Arvada Center Director of Arvada Economic Development Association Director of Utilities Chief of Police Performance Budget Manager City Clerk Sustainability Coordinator Communications Manager
ii
2015-2016 Revised BIENNIAL OPERATING AND CAPITAL BUDGET CITIZENS OF ARVADA
City Attorney
Mayor and City Council
Municipal Judge
City Manager
Deputy City Manager
Deputy City Manager
Arvada Center for the Arts and Humanities
iii
2015-2016 Revised BIENNIAL OPERATING AND CAPITAL BUDGET
The Government Finance Officers Association of the United States and Canada (GFOA) presented a Distinguished Budget Presentation Award to the City of Arvada for its Biennial Budget for the fiscal years 2015-2016. In order to receive this award, a governmental unit must publish a budget document that meets program criteria as a policy document, as an operations guide, as a financial plan, and as a communications device.
iv
The City of Arvada has received this Distinguished Budget Presentation Award for the past 23 years!
August 31, 2015 Members of City Council City of Arvada 8101 Ralston Road Arvada, Colorado 80002 Members of City Council and the Arvada Community: Transmitted with this letter is the City of Arvada Proposed 2016 Budget Update which includes recommendations for the second year of the 2015-2016 Biennial Operating and Capital Budget. As required by City Council Policy No. 300.4, Arvada Budget and Fiscal Policy, staff must develop and present an updated budget that Council will consider and approve in order to authorize expenditures for the second year of a two-year budget. This budget document is the first proposed budget that you will consider following your approval of the Arvada Budget and Fiscal Policy. This approval achieved the following City Council Strategic Result: • By 2014, a formalized system for Council-enacted fiscal and operational policies for the City is adopted. The purpose of this Strategic Result is to establish a consistent Budget and Fiscal Policy that will support efforts to achieve and maintain service excellence by building a data-driven, results-oriented, customer-focused and responsive organization. The Policy is intended to guide City budget and financial management decisions based on strategic planning, performance measures, long-term financial stability, delivery of basic City services and protection of past and future investments in the City’s infrastructure and facilities. The proposed 2016 Budget Update meets the intent of the Policy. As introduced last year, the 2016 Budget Update continues the presentation of revenues and expenditures within the FOCUS framework. Departmental budgets incorporate performance measures that reflect the direction provided by the City Council’s Strategic Plan and departmental strategic business plans. The Council and our community will be able to determine the key results and “customer experience” that are intended to be accomplished during 2016. Specifically, the City Council will see the “Golden Thread” which will link your Strategic Plan to the day to day business operations of the City organization. Please note that our budget information is still a work in progress. Over the last year, the City Manager’s Office along with key staff members from other departments have held quarterly performance meetings with each department in order to review performance measures and evaluate whether or not the measures are generating the data necessary to determine effectiveness, efficiency and improvement. In many cases measures have been adjusted or changed in order to receive more relevant data.
Proposed 2015-2016 Biennial Operating and Capital Budget Update Members of City Council August 31, 2015 Page 2 While we have adjusted performance measures in some areas, the data that has been generated through FOCUS has resulted in adjustments to various departmental budgets as part of the proposed 2016 Budget Update. Other changes reflect direction from the City Council, including the completion of certain Council Strategic Results. Two examples of changes specifically associated with Council direction are the updated 10-Year Financial Models and the updated 10-Year Capital Improvement Plan. The updated 10-Year Financial Models now show fund balance goals that are consistent with the levels mandated by the Arvada Budget and Fiscal Policy. The 10-Year CIP includes projects that are identified in the Council Strategic Plan as well as projects identified by the Citizens Capital Improvement Project Committee (CCIPC) which completed their work earlier this year. The 2016 Budget Update reflects the collaboration between the City and the community as well as between the City Council and staff. With this understanding in mind, this letter will introduce the Council and the community to the proposed 2016 Budget Update and present highlights of the budget and the updated 2015-2024 10-Year Financial Models for all major funds. Presentation of the Budget Document As Council may recall, the 2015-2016 Biennial Budget document was presented in two parts which were identified as Volume 1 and Volume 2. Volume 1 included an overview of FOCUS, an overview of the proposed operating and capital budget revenues and expenditures, presentations of the 10Year Financial Models, capital improvements summary, debt obligations and additional information. The additional information section reserved space for the insertion of resolutions and ordinances that the City Council will consider as part of this process which will result in the appropriation of resources and provide the authority to expend City funds. Volume 2 included an overview of FOCUS and detailed information on each department’s proposed budget. The details included the primary elements of FOCUS, including each department’s Mission Statement, Issue Statements, Lines of Business and Programs. Volume 2 “drilled down” to the performance measures within each program in order to trace the Council’s direction through the Strategic Plan to the day to day operations of each department which is often referred to as the “Golden Thread”. The proposed 2016 Budget Update will be limited to an updated Volume 1 document and not include Volume 2. Limiting the update to Volume 1 is intended to transmit that changes in the second year of a two-year budget should be fairly minor and the continuing adjustment of performance measures will be reflected more accurately as staff prepares the 2017-2018 Biennial Operating and Capital Budget. In fact, the most important changes will be described in the updated 10-Year Financial Models that will be presented for each major fund. The other significant update will be to the 10-Year Capital Improvement Plan (CIP). Last year, the 10-Year CIP included resources to accomplish the following priorities: a) fully funded the additional costs for the Phase I Olde Town Transit Hub improvements; b) funded certain high priority projects in 2015-2016 wherein the funds are leveraged or the timing critical; c) maintained certain ongoing major projects such as the annual street maintenance and traffic signal replacement programs; and d) reserved financial capacity for the highest priority strategic projects which will be determined through a process that will engage Arvada stakeholders through a Citizens Capital Improvement Project Committee.
Proposed 2015-2016 Biennial Operating and Capital Budget Update Members of City Council August 31, 2015 Page 3 Reserving financial capacity in order to consider the recommendations from the CCIPC was intended to factor input from citizens regarding the City’s highest priority capital needs. The CCIPC began their work in September 2014 and issued an excellent report in June 2015. Leadership Team members Bill Ray, Bryan Archer and Lorie Gillis worked with facilitator Heather Bergman and a dedicated group of 21 citizens, who reviewed financial data, examined infrastructure reports, inspected physical assets and engaged in spirited discussions over nine months. The CCIPC recommendations were presented to the City Council during a Workshop on July 13. Staff proposals for the CCIPC 10-Year CIP recommendations were presented during a Workshop on August 10. The staff proposals reflected the issuance of an approximately $55 million bond in order to finance part of over $70 million in projects during the next ten years. The City Council asked staff to present options that would either reduce the financing or not finance any of the projects. As of the date of this letter, staff is preparing the alternative plans for presentation during the September 14 Council Workshop. Therefore the CIP section of the proposed budget document will include a reference that the 10-Year CIP is under development. The final budget document will include the 10-Year CIP following approval of the entire 2016 Budget Update by the City Council. Biennial Operating and Capital Budget Highlights Pages 23-37 within the budget document summarize the major changes and assumptions associated with the Proposed 2016 Budget Update. As Council is aware, revenue generated through sources such as sales and use tax and development related activities continue to reflect a strong local economy. Therefore, the proposed updated budget includes some additional expenditures that will meet service level demands and help to achieve Council Strategic Results and/or key results within departmental strategic business plans. While acknowledging a strong economy, uncertainty and concerns remain in the global, national, state and regional economies. As an example, the stock market correction during the week of August 24-28 was unsettling and reflects how the global market can impact national, regional and local economic conditions. The Federal Reserve is contemplating an interest rate increase as soon as September 2015; most experts agree that an increase in the prime interest rate will occur by the end of the year. Finally, the 2016 presidential and national elections will likely have a significant impact on the national economy. While economic conditions within Colorado and the Denver Metro Area remain strong, it is important to remember that 2015 marks the fourth year of the economic recovery from the Great Recession. Many economists believe that the current conditions will at least level off if not decrease in the next couple of years. Therefore, assumptions associated with the proposed 2016 Budget Update reflect an appropriate level of caution. As an example, sales tax which increased at an unforeseen rate in 2013, 2014 and so far in 2015 is assumed to increase at a low of 2% to a high of 3.25% during the 10-year window. These assumptions were discussed with Council during a Workshop on July 27 wherein some caution was suggested. Staff reconsidered our initial assumptions and agrees that the revised assumptions are appropriately conservative. Despite the conservative assumptions, the exceptional economic conditions over the last three years and the City’s stewardship of our financial resources will allow for some additional resources to be included in the updated 2016 budget and 10-Year Financial Plan. The pro-
Proposed 2015-2016 Biennial Operating and Capital Budget Update Members of City Council August 31, 2015 Page 4 posed 2016 Budget Update includes five new full-time positions in order to meet service demands associated with the City’s growth and/or achieve City Council Strategic Results. An additional four officer positions are proposed for the Police Department to be hired in 2016 that had been previously included in the 10-Year Financial Plan for hiring in 2017 and 2019. Additional resources are also proposed for materials, contract services and similar operating accounts in order to meet service demands, replace worn equipment and achieve identified Strategic Results. The new full-time positions and operating account changes are summarized on pages 24-26 within the budget document. In order to fully explain the impact of the changes proposed in the 2016 Budget Update, the following section will briefly review the overall assumptions for the 10-Year Financial Models as well as significant changes for each fund. 10-Year Financial Models Preparation of the 2016 Budget Update continued our commitment to long range financial planning. Developing long range-financial models encompasses many different elements, including ten-year planning for all major funds to view costs within a longer framework, a ten-year Capital Improvement Plan that identifies projects, funding sources and any associated operating costs and the allocation of all resources in a manner that reflects the Council’s strategic results. These elements should also be consistent with associated long-term planning efforts, such as the City’s Comprehensive Plan. Pages 39-54 of the budget document summarize assumptions and present each of the 10-Year Financial Models for the major city funds. The first set of bullet points on page 39 summarize the assumptions that were applied to all funds. As an example, updated assumptions regarding salary range adjustments in accordance with the City’s total compensation philosophy and the potential impact of the Affordable Care Act Excise Tax (aka Cadillac Tax) are included in all the updated models. These assumptions have a significant impact on the forecasted expenditures. As staff develops updated models for the 2017-2018 budget, every effort will be made to mitigate the financial impact of the Cadillac Tax since some adjustments to our current employee medical plans may be able to offset this burden. The balance of the assumptions presented on pages 39 and 40 are specific to each fund. As mentioned previously, caution was exercised for the General Fund in certain areas such as sales tax and building related fees in recognition that the current level of growth in these areas is not sustainable over the ten-year window. These assumptions also impact the Police Tax Increment funds. Pages 41-54 present the actual 10-year models for each fund. These models were reviewed during the July 27 Workshop and additional time for further review is scheduled in September. The Council and community should note that while all funds are solvent during the 10-year window, the Golf and Hospitality funds fall short of their fund balance goals during some of the years. These funds will be reviewed as the budget is updated. In addition, please note that a 10-Year Model was not developed for the Arvada Center in recognition of the future transfer of the operations to the nonprofit organization. The funds required to meet the City’s obligations per the agreement approved by the City Council on July 6 are included in the General Fund and staff will work with the nonprofit Board to facilitate a sustainable long term financial plan for the Arvada Center over the next ten months.
Proposed 2015-2016 Biennial Operating and Capital Budget Update Members of City Council August 31, 2015 Page 5 Capital Improvements The final section of the budget document referenced in this letter is Capital Improvements which is found on page 83. As stated previously, this section will be updated as staff receives direction from the Council in association with the alternatives that will be discussed during the September 14 Workshop. Future Challenges As stated previously herein, the exceptional economic conditions over the last three years and the City’s stewardship of our financial resources have allowed for some additional expenditures to be included in proposed 2016 Budget Update and 10-Year Financial Plans. These expenditures are proposed in order to meet additional service demands and the achievement of certain strategic results. The City is indeed fortunate to be in a position to include the additional expenditures within the proposed budget. Nonetheless, there are future challenges looming. The growth in northwest Arvada and transit oriented development areas will present service level demands that staff must develop strategies to fund. These demands are expected to impact public safety and infrastructure to the point that Police, Municipal Courts, Public Works and Parks will need additional resources in the future. Other departments within the City organization such as Human Resources and Finance may need to grow as well to support a larger organization. In addition, there are capital needs that as yet have not been addressed. Three examples include resolving the deferred maintenance of local streets and roads, construction of the Jefferson Parkway and replacement of the Myers Pool. As the development of the 2017-2018 Biennial Operating and Capital Budget and updated 10-Year Financial Models are initiated early next year, staff will commence work on strategies to address these challenges. These will likely include an examination of existing programs and services to determine where resources can be reallocated, forging regional partnerships and reviewing opportunities for new revenue sources. In closing, I want to thank the Finance staff for their work on this new budget. This department worked hard to evaluate the current economic conditions, identify trends and develop scenarios for discussion in association the 2016 Budget Update. As always, the information presented herein reflects their dedication to transparency, accuracy and service to the City and community of Arvada. Respectfully submitted,
Mark G. Deven City Manager
“The City desires to continue its efforts to achieve and maintain service excellence by building a data-driven, results-oriented, customer-focused and responsive organization.” In 2013 the City initiated a new integrated performance management system called FOCUS, which includes performance-based budgeting and strategic planning to clearly define what the City needs to accomplish over a six-year timeframe. FOCUS is driving how Arvada prioritizes services and programs for the community by concentrating on the value to the customer, or customer experience, and by measuring, evaluating and reporting our performance. FOCUS: • Helps the City to track what it is doing and provides more meaningful reports to the community. • Shows the value the community receives for what it invests in Arvada. • Opens the door for innovation and creative thinking for employees at all levels in the organization. City employees have more tools to identify innovative ways to improve services and be better, smarter, and faster which ultimately leads to enhancing and improving the customer experience. City Council Strategic Plan In 2013 the City Council identified major issues confronting the City and developed a citywide strategic plan to address these issues. This plan identified four priority areas containing specific and measureable results that Council and staff will achieve between 2013 and 2019. Revisions to the plan were adopted by Resolution in July 2015. The strategic results outlined in the plan guide how the City expends its resources and provide the foundation for the services each City department delivers. Progress is reviewed and discussed on a regular basis with leadership and City Council. The following are the four priority areas adopted by City Council:
GROWTH AND ECONOMIC DEVELOPMENT • The future of Arvada’s prosperity and quality of life will be influenced largely by the City’s ability to manage growth through intelligent economic development and strong fiscal policies. Good paying jobs, thoughtful transit‐oriented development and new housing, together with long‐term investments in the Wadsworth Corridor, will define managed growth in Arvada.
INFRASTRUCTURE
VIBRANT COMMUNITY AND NEIGHBORHOODS
• Arvada’s future will be built upon well‐maintained streets, sidewalks, trails and recreation amenities. Steady future economic growth will follow transit lines and the Jefferson Parkway, accompanied by appropriately designed parking facilities and readily available water resources to support a planned and steady growth in our population.
• Strong neighborhood associations, citizens engaged in civic life and the arts, and a long‐term sustained focus on the safety and success of our children will bring out the best of our character and ensure Arvada is the place we want to raise our children for generations to come.
7
ORGANIZATIONAL AND SERVICE EFFECTIVENESS • Citizens depend on a well‐managed, fiscally responsible City government to guide and support growth. Performance‐based management practices, sustainable levels of resource use and Council‐approved fiscal and operational policies will ensure the long‐term credibility and ac‐ countability of City Government.
While work on City Council Strategic Results occurs in a cross-departmental manner, every City Council Strategic Result has a home within a specific department to ensure accountability. In 2014, there were four City Council Strategic Results slated for completion. All four Strategic Results as shown in the following diagram were accomplished.
Work continues on eleven City Council Strategic Results slated for completion in 2015. The eleven Strategic Results encompass a wide variety of work from pavement condition index studies, to conduit maps, to workforce planning. City staff will provide progress updates on all City Council Strategic Results in a comprehensive yearend report.
8
Along with City Council Strategic Results that will conclude in 2015, there are a host of long-term strategic results with completion dates in 2016 through 2019. This long-term approach ensures staff continues to address issues in a forward-thinking and progressive manner.
Growth and Economic Development
Infrastructure
Vibrant Community and Neighborhoods
25% of new housing is located in urban centers and corridors
All ROW for the Jefferson Parkway legally described and committed to JPHHA and the CDOT Sec. 1601 Environmental review process will be initiated
12.5% of Arvada households will be engaged with the Arvada Center as paying patrons on an annual basis
25% of new housing will be located in neighborhoods or developments that incorporate a mix of lotsized, development densities and housing types and styles
20% of all sidewalk gaps selected from the Transportation Committee inventory and approved by Council will be built
50% of identified neighborhoods, who in 2013 did not have organized groups, will be organized and provide a liaison with the City
1,000 new non-retail jobs from businesses created in urban centers and corridors
The City will have 100% of the water needed for buildout as defined in the Comprehensive Plan
75% of middle and senior high school-age juvenile cases meet completion of sentencing requirements aimed at positive decision making
800 new non-retail jobs from businesses created in targeted industries
100% of identified trail gaps and connection points recognized in Master Plans and approved by Council are built/completed
Water usage by the community is reduced from 146 GPD to 139 GPD
$350 million in private sector capital investments created
West Woods club house and related facilities are replaced
45% of the City fleet will be capable of using alternative fuel sources
Energy consumed at city facilities will be reduced or offset by 8% from 2013 usage
The use of alternative travel modes for commuting to work by Arvada residents will increase from 12% to 15%
9
Organizational and Service Effectiveness 10% of Arvada Center operating budget is derived from charitable donations
Performance-Based Budgeting FOCUS is also linked to the City’s budgeting process. Each year departments update strategic business plans that are comprised of multiple programs. Each program measures the benefit customers experience as a consequence of receiving the program’s services. Collecting and evaluating performance measures in strategic business plans plays a significant role in each department’s decision making by illuminating how well performance measures are achieved. The end result is that the City improves program efficiency and effectiveness, which in turn, provides better results for citizens. Each department participates in a quarterly meeting with City leadership and a core review team. The purpose of the meeting is to review performance and make adjustments as needed. Performance data also assists in the budget process as all budget requests must be aligned with performance measures and clearly identify the need for additional resources. In some cases there may be a need to reallocate resources. Staff are also encouraged to utilize cross-departmental collaborative efforts to best utilize City resources.
10
2015-2016 revised BIENNIAL OPERATING AND CAPITAL BUDGET
Community Profile ARVADA AT A GLANCE Incorporated Population Median Age Households Land Area (sq. mi.) Average Home Price Median Household Income
11
1904 111,559 40 44,724 39.28 $290,000 $67,156
PARKS AND RECREATION Skate Parks Golf Courses Playgrounds Open Space Areas Miles of bike/hiking trails
3 3 58 29 230
PRIMARY EDUCATION Public Schools in Arvada: Elementary (K-8) Middle Schools (7-8) High Schools (9-12) Charter Schools
22 4 4 3
2015-2016 revised BIENNIAL OPERATING AND CAPITAL BUDGET The City Charter requires the adoption of budgets for the general fund, special revenue funds, debt service funds, capital projects funds, and proprietary funds. Budgets are not required for fiduciary funds. A fiduciary fund is custodial in nature and is used to account for assets that the government holds for others in an agent or trustee capacity.
LEGAL REQUIREMENTS AND BUDGET PROCESS The City of Arvada is a political subdivision of the State of Colorado, located in Jefferson and Adams Counties in the Northwest quadrant of the greater Denver, Colorado, metropolitan area. The City Charter establishes a Council-Manager form of government. The City’s governing body consists of an elected Mayor and six -member Council. The Mayor and Council appoint a City Manager. The City of Arvada is a “home rule” City, governed by its City Charter, the Colorado State Constitution, and City ordinances as adopted by the City Council.
DECEMBER Publication of final Budget and CIP OCTOBER Adoption of 2016 Operating Budget and CIP with 10-year considerations
SEPTEMBER Council reviews recommended 2016 operating budget with 10-year revenue & expenditure plans JULY Council begins review of Proposed CIP & 10-Year Plan
City Council annually appropriates all budgeted funds with the exception of the capital projects funds. Project-length budgets are adopted for these funds. The City adopts budgets for all funds using the modified accrual basis of accounting, the same basis used in the entity’s financial statements, consistent with generally accepted accounting principles (GAAP).
JANUARY Council Strategic Retreat
2016 BUDGET PROCESS CALENDAR
JUNE Departments develop Operating Budgets for 2016
12
FEBRUARY Revenue assumption criteria completed
MARCH Funding criteria developed for expenditures
APRIL Departments present capital requests, including associated operating costs MAY City Manager & departments develop CIP recommendations/ Update 10-year Model
2015-2016 revised BIENNIAL OPERATING AND CAPITAL BUDGET The City Manager submits a proposed budget to the City Council for each of two budget years (January 1 to December 31). The budget includes an explanatory message and is submitted in early September. The proposed budget contains a complete and detailed financial plan for all City funds. The proposed budget is open for public inspection and review. By October 15th, City Council conducts at least one public hearing on the proposed budget. Not less than sixty days prior to the first day of the next fiscal year, City Council adopts the City budget by resolution and the annual appropriation by ordinance. The City prepares a combination line-item and department budget, but the legal level of control is at the fund level which is the amount approved by ordinance.
exceeds, the required fund balance goal in the tenth year. The “Ten-Year Models” section of this document includes summaries of ten-year financial models for the City’s major operating funds. The comparison of ending balances to the required fund balance goal in the tenth year reveals whether or not adjustments in the current level of proposed expenditures are necessary in order to maintain longterm financial stability. If the ending balance is equal to or exceeds the fund balance goal, no adjustment in the current proposed budget is necessary. The fund may also contemplate additional expenditures based on the needs in the fund. However, if there is a discrepancy between ending fund balance and the fund balance goal, the City has ten years to either eliminate one-time capital expenditures, reduce ongoing operating expenditures, or some combination of the above to work toward the fund balance goal.
TEN-YEAR FINANCIAL MODELS In 2015, City Council adopted a budget and fiscal policy that utilizes long-range planning for each of the City’s major operating funds to maintain the fiscal health of the City. Specifically, the City prepares a two-year budget based on a ten-year financial model. This method of budgeting is used to determine if future impacts of the current proposed budget are fiscally sound. Using this ten-year model, the City is able to test the effects of current financial decisions on future years’ financial conditions when approving funding requests throughout the organization.
Taking a long-term view of the City’s current operations insures that the City acts in a fiscally responsible manner. Budgeting in this manner also allows management time to react and respond to changes in the economy and minimizes the effect of budget fluctuations on service delivery. The City defines a balanced budget when proposed expenditures are equal to or less than forecasted revenues and fund balance for each year of the two-year budget. For the 2016 budget, the City proposed a balanced budget.
There are many variables and factors that impact the ten-year model. These components include the following: beginning fund balance, projected revenues, projected expenditures (including capital expenditures), ending fund balance and required fund balance goals. Revenue and expenditure projections are based on historical trends, various economic and inflation forecasts, and known changes in operations, legislation and capital outlay requirements.
Basis of Budgeting Annual budgets for governmental funds (General, Special Revenue and Debt Service funds) are prepared separately using the modified accrual basis of accounting, the same basis of accounting that is used in the entity’s financial statements. Under the modified accrual basis of accounting, revenues are recognized in the accounting period in which they become available and measurable, and expenditures are recognized in the accounting period when the liability is incurred, if measurable.
The budget process begins with the estimated beginning fund balance for the current year. Projected revenues and expenditures are applied to the beginning balance to calculate the ending balance for the proposed budget year. This process is continued for the next ten years. The resulting calculation of the ending balance in year ten is compared to the calculation of the minimum required fund balance goal. The bottom line is that each fund should work towards maintaining a fund balance that is equal to, or
Annual budgets are also created for all Enterprise and Internal Service funds. This basis used to budget these funds is also a modified accrual basis of accounting which includes capital expenditures and current debt service principal and interest payments
13
2015-2016 revised BIENNIAL OPERATING AND CAPITAL BUDGET and excludes depreciation, amortization and adjustments for accrued compensation absences.
provement Revenue Bonds, and the $11,820,000 Series 2015 Refunding Certificates of Participation. • Capital Improvement Projects Fund – This fund accounts for the financial resources to be used for the acquisition or construction of major capital facilities (other than those financed by the Enterprise or Internal Service Funds).
FUND STRUCTURE A brief description of the City of Arvada’s fund structure follows: Governmental Funds (General, Special Revenue and Debt Service) • General Fund - This fund accounts for all the financial resources of the City which are not required to be accounted for in another fund. • Lands Dedicated Fund – This fund accounts for annexation requirements of a 6% land dedication or an equivalent cash contribution to be used primarily for park purposes. • Arvada Center Fund – This fund accounts for all revenues and expenditures of the Arvada Center for the Arts and Humanities. • Arvada Housing Authority Fund – The Section 8 Housing Assistance Payments Program is administered by the Arvada Housing Authority. • Community Development Fund – This fund accounts for all entitlements, revenues and expenditures of the Community Development Block Grant (CDBG), the Home Rehabilitation and the Essential Home Repairs programs. • Parks Fund – This fund accounts for costs associated with the acquisition, design, development, maintenance and beautification of parks, open space and trails within the City. • Police Seizure – Colorado State Statutes authorize local law enforcement agencies to seize cash and other assets belonging to persons convicted of public nuisance crimes. This fund was established to account for these resources as they are awarded and expended by the City’s law enforcement agency. • Police Tax Increment Funds – The purpose of the tax increment funds is to account for the voter-approved sales tax increment (.21 and .25) to fund expanded police services. • Grants Fund – This fund accounts for receipt of lottery monies through the Conservation Trust Fund. • Debt Service Funds – This fund accounts for the payment of principal and interest on the $19,885,000 Series 2009 Sales and Use Tax Revenue Refunding bonds, the $5,675,000 Series 2013 Sales and Use Tax Refunding and Im-
The major Governmental Funds, as reported in the 2014 City of Arvada CAFR, were the General Fund, Community Development Fund, Arvada Center Fund, Parks Fund, and the General Capital Improvement Projects Fund. Internal Service Funds • Insurance Service Fund – This fund accounts for the activities associated with the City’s worker’s compensation and property and liability insurance activities. • Print Shop Fund – This fund accounts for the activities associated with the print shop operations. • Computer Fund – This fund accounts for the accumulation of financial resources necessary for the timely and orderly replacement and maintenance of the City’s computers. • Vehicles Fund – This fund accounts for the accumulation of financial resources necessary for the timely and orderly replacement and maintenance of the City’s vehicles and equipment. • Building Fund – This fund accounts for the accumulation of financial resources necessary for the maintenance of City buildings.
14
Enterprise Funds • Water Fund – This fund accounts for administration, operations, capital outlay, maintenance, financing and related debt service and billing and collection for the water utility operations. • Wastewater Fund – This fund accounts for administration, operations, capital outlay, maintenance, billing and collection for the collection, transmission and disposal of sewage and wastewater. • Stormwater Fund –This fund accounts for all activities necessary to maintain a stormwater management plan. • Golf Course Fund – This fund accounts for all revenues and expenses of the Lake Arbor and
2015-2016 revised BIENNIAL OPERATING AND CAPITAL BUDGET West Woods Golf Courses. • Food Services Fund – This fund accounts for all revenues and expenses associated with food service activities including the operations of the banquet facilities at the Arvada Center for the Arts and Humanities.
provement Fund which do not lapse until the project is complete or abandoned. Fund Balance Policy A top priority of the City Council is to maintain the fiscal health of the City. Revenue projections are conservative and expenditures are monitored throughout the year. In stable economic times, the combination of these two strategies leads to revenue collections being higher than budgeted and expenditures being lower than budgeted. The combination of the two usually leads to additional monies in the fund balance which can be used for unanticipated increases in expenditures, unforeseen reductions in revenues, financing of one-time capital expenditures, adding to the fund balance or a combination of all the above. If these monies are used for expenditures, their use is not approved until the next year.
The major Enterprise Funds, as reported in the 2014 City of Arvada CAFR, were the Water Fund, the Wastewater Fund and the Stormwater Fund. The Golf Course Fund and Food Service Fund did not meet the requirements to be major funds, but were presented as major. Budget Control and Budget Transfers Control of expenditures is exercised at the fund level. Once the City Council adopts the budget, the City’s financial management system is used to monitor activity. Quarterly financial reports are prepared for City Council and compare actual expenditures and revenues against the budgeted and prior year amounts. Reviewing actual expenditures to budgeted amounts on a fund-by-fund basis ensures that expenditures are within the legal appropriated limits required by the City’s Charter.
Included in the budget and fiscal policy adopted by City Council in 2015, is a required fund balance reserve that is established to mitigate current and future risks (e.g. revenue shortfalls or unanticipated expenditures). The City maintains a fund balance in its General Fund equal to 17% of annual expenditures. Three percent is reserved for emergencies as required by Article X of the Colorado Constitution. The remaining 14% protects the City from cyclical fluctuations in revenues or unanticipated expenditures. The City also establishes an individualized fund balance requirement for various operating funds. Use of fund balance reserves must be recommended by the Finance Director, and approved by the City Manager and City Council.
Once the budget is adopted, transfers between line items for regular operating expenses, within funds and programs, can be accomplished with the approval of the department director. Transfers from any personnel accounts require the approval of the department director and the City Manager. Budget Amendments and Supplemental Appropriation The adopted budget can be amended during the year. This action requires City Council approval in the form of a resolution. At the end of the year City Council approves a supplemental appropriation by ordinance for the budget amendments approved throughout the year for any unforeseen changes arising after the adoption of the annual appropriation. A supplemental appropriation can be made as long as the total amount budgeted does not exceed the actual or anticipated revenues and the available fund balance. Lapsed Appropriations All appropriations not spent at the end of the year lapse into the fund balance applicable to the specific fund except for appropriations in the Capital Im-
Cash Management and Investment Policy The Colorado statutes and the City of Arvada Investment Policy govern general provisions for the City’s investment strategies. The investment policy for the City shall apply to the investment of all general and special funds of the City of Arvada over which it exercises financial control. The City’s objectives for cash management and investments are:
15
• Observation of investment management objectives of safety, liquidity and yield • Preservation of capital through the protection of investment principal • Maximization of cash available for investment • Maintenance of sufficient liquidity to meet the City’s cash needs
2015-2016 revised BIENNIAL OPERATING AND CAPITAL BUDGET Taxpayers’ Bill of Rights (TABOR)
• Diversification of the types and maturities of investments purchased to avoid incurring unreasonable credit or market risk regarding a specific security, maturity period or institution • Maximization of the rate of return for prevailing market conditions for eligible securities • Conformance with all federal, state and other legal requirements
In 1992, voters approved an amendment to the Colorado Constitution (Article X, Section 20) that places limits on revenue and expenditures of the state and local governments. Even though the limit is placed on both revenue and expenditures, the constitutional amendment ultimately applies to a limit on revenue collections. Growth in revenue is limited to the increase in the Denver-Boulder Consumer Price Index plus local growth (new construction and annexation). This percentage is added to the preceding year’s revenue base, giving the dollar limit allowed for revenue collection in the ensuing year. Any revenue collected over the limit must be refunded to the citizens. Federal grants or gifts to the City are excluded in the revenue limit.
Debt Policies • Short-term borrowing or lease-purchase contracts may be considered for financing major operating capital equipment when the Finance Director, with approval of the City Manager and City Council, determines that this is in the City’s best financial interest. • Long-term debt will not be used to finance current operating expenses. When long-term debt is warranted for a project, the payback period for bonds used for the project must not exceed the useful life of the project. • The City of Arvada will attempt to obtain a minimum AA bond rating and maintain a favorable rating through prudent financial management and adherence to a policy of full disclosure on financial reports. • As required by State Statute, appropriate elections will be held to obtain voter approval for debt issuance.
In November 1996, the qualified electors of the City approved Resolution R-96-127 which reads as follows: Without creating any new tax or increasing any current taxes, shall the City of Arvada be permitted, in 1996 and each year thereafter, to retain and spend City revenues in excess of the spending, revenue raising, or other limits in Article X, Section 20 of the Colorado Constitution, utilizing such revenues for public safety, municipal services, transportation and other public improvements, parks and recreational facilities, and any other lawful public purpose?
16
2015-2016 REVISED BIENNIAL OPERATING AND CAPITAL BUDGET INTRODUCTION All the revenue assumptions and expenditure changes made to the Proposed 2016 Operating Budget were made in the context of the same priorities used in capital planning. • Taking Lasting Care • Building the Base • Investing in the Future The first priority is to take care of our current assets: people, services and infrastructure. The second priority is to identify the areas where we need to build on our current services. Finally, we need to understand our city is constantly growing and changing. The next few years will continue to dramatically change our current physical presence and require us to consider not only new and different services, but will also require us to develop different ways to address the services we now offer. However, prior to considering how areas could be changed or enhanced, there were other areas that had to be reviewed. The next set of parameters considered for all recommendations included: • Overall Economy • Ten-Year Plans • Performance-Based Budgeting (FOCUS) We had to evaluate our overall economy to determine what could be addressed both today and into the future. Every current decision has a long life. Every recommendation is included in the ten-year plan, including all operating costs for any new capital or ongoing recommendation. Finally, this organization is now using performance-based budgeting. While our city will grow in both population and revenue, the questions will be multi-faceted: what are the priorities as our city changes; what are the levels of services the population wants; what levels of services can be afforded; and can we accomplish our work differently? All of these issues are addressed each and every day. However, within the work we will undertake in 2016, we will have updated and different tools to use to address these, including City Council’s Strategic Plan, updated comprehensive plan, implementation plans for the Gold Line, phase one of the Transit-Oriented Development (TOD) well underway and performance-based budgeting methodologies. In the short term, however, the Proposed 2016 Budget must be adopted so the city can continue to provide the quality of services the citizens expect. In that context, the first step is the review of our current overall economy and the revenue base we expect in the next few years. Overall Economy Local Economy The City’s general revenue base has several different influences. Two of the major issues are sales tax and building activity. As illustrated in the discussion below, we have been experiencing very positive results in the major revenue sources of our City in nearly every activity for the past four years. Sales Tax A 3% sales tax rate on all goods sold within the City limits pays for more than 56% of our General Fund services. In addition, it pays for 67 police positions through an additional dedicated 0.46% tax on the same goods. Over the past four years, we have seen significant sales tax growth. The following graph illustrates the percentage increase month over month. This type of increase is not expected to continue but we feel confident that the City will continue to experience some level of growth for the rest of 2015 and into 2016.
17
2015-2016 REVISED BIENNIAL OPERATING AND CAPITAL BUDGET Percent Growth Month Over Month Previous Year 14.00% 12.00% 10.00% 8.00% 6.00% 4.00% 2.00% 0.00%
Building Activity We are also seeing significant positive trends in our building permits. The following graph demonstrates the trend in single-family housing permits. The majority of this growth can be seen in two new housing developments in northwest Arvada. In addition to the single-family home permits, the City has two apartment buildings being constructed in one of the transit-oriented development areas.
Single Family - Detached Home Permits 700 600 500 400 300 200 100 0 2007
2008
2009
2010
2011
2012
2013
2014
Revenues from building activity will generate over $6 million of our 2015 estimated revenues for general operating purposes – including building use tax and building permits for both the General Fund and the Police Tax Increment Funds. New housing tap fees for the Water and Wastewater Funds generated $5.2, $8.7 and $11.1 million for 2012, 2013 and 2014, respectively. This shows that the general direction of the economy in Arvada appears quite healthy. However, if the current building activity cannot be sustained, revenue estimates related to building activity will decline in the future.
18
2015-2016 REVISED BIENNIAL OPERATING AND CAPITAL BUDGET Economic Environment Colorado Unemployment The unemployment rate continues to decrease and is lower than the national average. As the graph indicates, we are approaching pre-recession unemployment levels.
Colorado Unemployment Rate 10.0 9.0 8.0 7.0 6.0 5.0 4.0 3.0 2.0 1.0 0.0 Mar Sept Mar Sept Mar Sept Mar Sept Mar Sept Mar Sept Mar Sept Mar Sept Mar Sept Mar Sep Mar '05 '05 ' 06 '06 '07 '07 '08 '08 '09 '09 '10 '10 '11 '11 '12 '12 '13 '13 '14 '14 '15
Ten-Year Planning All of these indicators and more went into developing the assumptions for the “Ten-Year Plans.� The 2016 Operating Budget document has a separate section on each Fund and the assumptions included in the ten-year plan. The emphasis on the ten-year concept is to understand that this is a planning document. It is important to understand the long-term implications of all current decisions as related to expenditures and revenues. This previous year, 2014, and current year, 2015, both represent positive years. Simultaneously, we will have another economic slowdown some time in the future and we also anticipate for this in the ten-year plan. Ten-year plans typically anticipate both upticks and downward trends. Both 2014 and 2015 have reflected the benefits of economic growth revenues are up. With that said, projections in this ten-year plan include impacts of a slowing economy. Following is a summary of significant revenue and expenditure assumptions in this updated ten-year plan.
19
2015-2016 REVISED BIENNIAL OPERATING AND CAPITAL BUDGET Revenues • Sales Tax revenue assumes variable growth rates from a low of 2% to a high of 3.75%. We use a base growth rate of 3% and adjust up or down depending on a host of factors. Planned development is used as our main driver. Building use tax revenue assumes a 2% growth for all years of the model with a reset of the base in 2020. • Revenue changes reflect assumptions on future development in the Ralston Creek Urban Renewal Area. • Open Space revenues are derived from sales tax throughout the region. These are assumed to increase at 3% annually. • Water Rates are budgeted to increase 4% in 2016 and 3-4% in the years thereafter. • Wastewater Rates increase 2.45% in 2016 and 3-4% in the years thereafter. Over 50% of the change in rates is due to the regional costs of cleaning wastewater. • Stormwater Rates are budgeted to increase 2% in the “odd” years of the budget: 2017, 2019, 2021 and 2023. No rate increase is budgeted in the “even” years. Expenditures • Personnel-related costs were calculated based upon each employee’s current grade and step and include an assumption for future market range adjustments (MRA’s). The MRA methodology is not based on cost of living adjustments, but rather an analysis of each job class in an identified market. The model assumes a 2.3% change for all personnel for 2016 and 2% thereafter. • Medical cost increases are the most unknown due to external national forces and the full implementation of the Affordable Care Act. The City has implemented a near-site clinic with Paladina as a provider to help curb future medical increases. At this time, the increases are budgeted to be 6% between 2016–2018 and 4% beginning in 2019 through the life of the model. The financial plans also include an estimate for the Cadillac tax (the 40% excise tax on health insurance premiums that exceed a predetermined threshold starting in 2018 as part of the Affordable Care Act). • Internal Service costs – insurance, building maintenance, vehicle replacement and computer costs – have a 1% increase through the model. • Staff vacancy savings have been assumed in many of the funds. These are not the same across each fund due to the analysis of change in personnel by fund. Vacancy savings average 1% and go as high as 2.75%. • Every other year, effective 2017, the ten-year model does assume $200,000 for the community curbside clean-up program. • Street maintenance is budgeted at $5.8 million, growing at 3%, for the entire model. • In 2018 all sales tax debt is retired. There will be additional monies available for capital improvement projects, or a new bond issue, beginning in 2019.
20
2015-2016 REVISED BIENNIAL OPERATING AND CAPITAL BUDGET Fund Balances Over time each fund needs a well-considered fund balance goal. In 2015, City Council adopted a budget and fiscal policy setting out minimum reserve levels. All expenditures and revenues have to be considered within the context of ten-year implications. The goal is to ensure all Funds have a positive balance within the end of the ten-year planning horizon. • General Fund: 17% of General Fund expenditures. • Arvada Center, Parks, Golf and Hospitality: 11% of fund expenditures. • Enterprise Funds: 25% of all expenditures. These Funds include: Water, Wastewater and Stormwater. • Internal Service Funds: These have no adopted levels, except for the Print Shop which is 11%. All have healthy balances throughout the model. Performance-Based Budgeting (FOCUS) Arvada is continuing and bolstering our implementation of FOCUS. This integrated performance management system is not a project with a defined end date. Instead this is a change of how our staff looks at what we do each day. It provides data for decision making and helps drive funding for the many programs Arvada citizens want and need. We are making this important philosophical change to allow Arvada to prepare for the future, while also directly showing our citizens the value they receive for their investment. Recapping the process, on June 17, 2013, City Council adopted the City Strategic Plan 2013 to 2019. Their plan outlined four priority areas and 30 strategic goals over the next six years. City staff used the Council’s identified strategic measures to develop their department’s targets to know what results are being achieved and what needs refinement. With these measures in place a discussion on process and related budget will occur, helping the City transition to a performance-based system. On July 23, 2015, City Council adopted a revision to the strategic plan to recognize updates to current goals and remove goals that have already been achieved.
SUMMARY
The factors noted above were all evaluated in developing the 2016 Operating Budget. After we considered the priorities and the parameters, the 2016 budget process was very focused. As presented in the following section, the focus was on previously identified priorities and changes occurring in our environment. The nation is under enormous pressures: healthcare costs, weather impacts on our food supply, uncertain issues at the national leadership level, changing demographics, aging workforce, interest rates, the stock market and international issues. Overall, the City and, it appears, the region, are doing very well. However, there are more unknown economic factors than occurred in the first decade of this century. The 2016 Operating Budget offers an appropriately conservative direction for the next year.
21
2015-2016 REVISED BIENNIAL OPERATING AND CAPITAL BUDGET
22
2015-2016 REVISED BIENNIAL OPERATING AND CAPITAL BUDGET 2015-2016 REVISED OPERATING AND CAPITAL BUDGET The following pages provide an overview of revenues and expenditures including changes by fund. All Funds Summary The total 2016 Revised Budget is $195,602,681 with $188,227,001 in revenues to meet these expenditures.
Funds General Fund
Beginning
2015
2015
2015
2016
2016
2016
Funds Available
Budgeted Revenues
Budgeted Expenditures
Funds Available
Budgeted Revenues
Budgeted Expenditures
Funds Available
$ 30,847,599 $
83,052,567 $
86,389,996
$ 27,510,170 $
80,287,090 $
81,755,087
$ 26,042,173
Special Revenue Funds: Grants Fund
1,849,088
561,055
418,000
1,992,143
567,620
200,000
2,359,763
Lands Dedicated
2,697,655
143,222
1,792,052
1,048,825
95,000
-
1,143,825
Arvada Center Community Development Arvada Housing Authority Parks Police Seizure
200,560
10,480,543
10,045,134
635,969
10,507,327
10,450,498
692,798
6,299,131
836,738
1,686,045
5,449,824
836,739
1,024,039
5,262,524
15,729
3,951,578
4,069,275
(101,968)
3,993,440
3,988,083
(96,611)
4,456,204
8,089,160
8,217,021
4,328,343
8,287,029
8,541,932
4,073,440
438,914
28,713
25,750
441,877
28,825
26,523
444,179
Police Tax Increment Fund .21
3,282,984
3,984,926
4,043,233
3,224,677
4,136,560
4,030,594
3,330,643
Police Tax Increment Fund .25 Economic Development
4,166,068 397,326
4,810,711 743,420
5,465,465 784,897
3,511,314 355,849
5,291,991 776,512
5,033,770 773,560
3,769,535 358,801
Total Special Revenue Funds:
23,803,659
33,630,066
36,546,872
20,886,853
34,521,043
34,068,999
21,338,897
COP Series 2005 Debt Service Debt Service Fund
109,341 326,458
13,134,561 3,922,500
13,228,731 3,922,500
15,171 326,458
1,299,510 3,917,400
1,308,510 3,917,400
6,171 326,458
Total Debt Service Funds
435,799
17,057,061
17,151,231
341,629
5,216,910
5,225,910
332,629
Capital Projects Fund Special Assessments Fund
39,109,112
8,733,625 -
23,348,927 520,000
24,493,810 (520,000)
6,856,843 -
11,093,663 -
20,256,990 (520,000)
Total Capital Projects Funds
39,109,112
8,733,625
23,868,927
23,973,810
6,856,843
11,093,663
19,736,990
Water Fund
34,884,647
30,057,203
29,152,629
35,789,221
28,632,349
28,534,324
35,887,246
Wastewater Fund
13,047,755
13,697,807
14,194,938
12,550,624
14,249,171
14,104,335
12,695,460
Golf Course Fund
206,875
4,940,579
5,035,779
111,675
5,093,237
5,078,956
125,956
5,564,001 601,808
3,358,715 1,963,710
4,625,004 2,075,357
4,297,712 490,161
3,294,283 1,427,316
3,933,543 1,440,273
3,658,452 477,204
54,305,086
54,018,014
55,083,707
53,239,393
52,696,356
53,091,431
52,844,318
Debt Service Funds:
Capital Projects Funds:
Enterprise Funds:
Stormwater Fund Food Service Fund Total Enterprise Funds Internal Service Funds: Insurance Fund
4,065,000
1,890,112
2,736,558
3,218,554
1,908,294
2,434,096
2,692,752
Computers
6,150,833
1,911,067
3,395,334
4,666,566
1,921,455
2,508,699
4,079,322
Print Shop
89,021
464,463
450,581
102,903
471,780
438,772
135,911
6,247,000 2,367,733
3,596,447 583,126
4,781,698 709,533
5,061,749 2,241,326
3,747,002 600,228
4,181,411 804,613
4,627,340 2,036,941
Total Internal Service Funds:
18,919,587
8,445,215
12,073,704
15,291,098
8,648,759
10,367,591
13,572,266
Total All Budgeted Funds
$ 167,420,842 $
204,936,548 $
231,114,437
$ 141,242,953 $
188,227,001 $
195,602,681
$ 133,867,273
Vehicles Buildings
23
2015-2016 REVISED BIENNIAL OPERATING AND CAPITAL BUDGET The major differences between 2015 and 2016 are in the following areas: • In the previous ten-year financial plan, funding for street maintenance was reduced $1,000,000 for the period 2018 through 2024. The street maintenance budget is now level funded with a 3% annual increase for the entire ten-year financial plan. • The market rate adjustment in the ten-year financial plan starting in 2019 was only 1% which was not realistic. The new ten-year financial plan assumes a 2% market rate adjustment. • The Affordable Care Act (ACA) proposes a 40% excise tax starting in 2018 for health insurance premiums that exceed a pre-determined dollar threshold. The ten-year financial plan creates a placeholder for the estimated cost of this tax. Staff, with the assistance of the City’s benefit consultant, will work to change the structure of the City’s health plan to mitigate and delay impacts of this legislated cost increase. These, combined with the salary assumptions of steps, the Salary Range Adjustment increase of 2.3% and the health care costs of 6%, comprise the most significant changes between the two years. Other major changes between the 2015 and 2016 Budget are as presented in the following table. General Fund Fund/ Department Community Development
Description
Cost
Notes
Add Neighborhood Engagement Coordinator position
$79,632 This position will handle the neighborhood engagement activities. This position will start in 2016.
Finance
Contribution to Arvada Center for lab and studio renovation
$50,000 This is the first of three equal, annual contributions starting in 2016 of the General Fund to the Arvada Center for its digital art lab and studio renovation.
Finance
Additional transfer to Parks Fund
$10,595 With Britton and Griffith Station Parks coming online, this increase will cover costs for their operation and maintenance.
Finance
Circulator study
$80,000 These funds will pay for a feasibility study for a circulator bus service in Arvada.
Human Resources
New Pay Plan software
$20,000 These funds will pay for annual maintenance and licensing for software to help manage the City's Pay Plan.
Human Resources
Third-party reference checks
$3,500 The use of a third-party vendor to complete reference checks will better automate and streamline the hiring process of benefitted applicants.
Public Works
Contract security staffing for facilities
$252,000 This is to contract for additional third-party security personnel for the Arvada Center, City Hall, and Annex.
Public Works
Additional salt
$100,000 This increase in funding will permit a greater use of salt instead of salt/sand mixtures in the west part of the City, which will be more effective and mitigate both regional "brown cloud" and mitigate the need for street sweeping.
Judicial
Laptop for second courtroom
$1,500 This funding will provide a laptop computer for use in the second courtroom by relief judges.
Judicial
Maintenance and replacement costs for second laptop
$1,200 This will fund annual maintenance and replacement charges for the new court laptop.
Judicial
Additional funding for relief judges
$34,000 This will supplement funding for relief judges to better match current expenditures. Total of $84,500 for 2016 and 2017 only.
24
2015-2016 REVISED BIENNIAL OPERATING AND CAPITAL BUDGET General Fund (continued) Fund/ Department Public Safety
Description Maintenance and replacement costs for four new police vehicles
Cost/ Revenue
Notes
$68,836 This will fund annual maintenance and replacement charges for the four new police vehicles.
Other Funds Fund/ Department
Description
Cost/ Revenue
Notes
Arvada Center
New Properties Shop Supervisor position
$67,405 This converts an existing part-time position to a full-time position.
Arvada Center
New Costume Shop Assistant position
$64,976 This converts an existing part-time position to a full-time position.
Arvada Center
Reduce temporary wages
($65,000) Temporary wages will be reduced to partially offset the two new, full-time Arvada Center positions.
Arvada Center
Studio Renovation
$50,000 These funds reflect dollars to be provided by the General Fund for renovating the Arvada Center's Digital Art Lab and Studio ($150,000 in total over three years).
Additional appropriation
$382,250 The scheduled replacements of several items were deferred over the past two years. This is a reappropriation of funds unspent on those replacements.
Buildings/ Public Works Capital Projects
Art In Public Places
Capital Projects
Circulator study
$80,000 These funds will pay for a feasibility study for a circulator bus service in Arvada.
Parks/Parks, Golf & Hospitality
Add two Parks Worker II positions
$117,744 These positions will help to cover the City's growing park operations and maintenance needs.
Parks/Parks, Golf & Hospitality
Reduce temporary wages
($20,000) Temporary wages will be reduced to partially offset the two new, full-time Parks positions.
Parks/Parks, Golf & Hospitality
Uniforms
Parks/Parks, Golf & Hospitality
Acquisition of two new trucks
Parks/Parks, Golf Maintenance and & Hospitality replacement costs for two new trucks Parks/Parks, Golf & Hospitality
Increase Jefferson County Open Space revenue
Parks/Parks, Golf Revise rental revenue & Hospitality
$0 Existing budgeted funding will be split $30,000 for acquisition, $20,000 for maintenance.
$520 These funds will cover the expenses of new uniforms for the two new Parks positions. $52,000 These vehicles will enable the two new Parks Worker II employees to fulfill their duties. $13,264 This will fund annual maintenance and replacement charges for the two new Parks vehicles. $181,229 This increase will better reflect actual City receipts from Jefferson County Open Space. ($12,000) This downward revision reflects anticipated drops in rental revenue from homes near the Majestic View Nature Center.
Parks/Parks, Golf & Hospitality
Port-a-let rentals
$8,000 This increase will match budget with actual expenditures for porta-lets.
Parks/Parks, Golf & Hospitality
Trash removal
$20,000 This increase will match budget with actual expenditures for trash removal.
25
2015-2016 REVISED BIENNIAL OPERATING AND CAPITAL BUDGET Other Funds (continued) Fund/ Department
Description
Cost/ Revenue
Notes
Parks/Parks, Golf & Hospitality
Park operations and maintenance
$10,595 With Britton and Griffith Station Parks coming online, this increase will cover costs for their operation and maintenance.
Tax Increment .21/ Public Safety
One new Police Officer position
$88,939 One Police Officer position will be added in contemplation of the awarded federal COPS grant.
Tax Increment .21/ Public Safety
One-time expenses for new Police Officer position
$5,072 One-time expenses include academy costs, uniforms, and mobile phones & equipment.
Tax Increment .21/ Public Safety
Records conversion
$90,000 This will see to the conversion of over 40 years of microfilm, microfiche, and hard copy documents to digital, searchable formats.
Tax Increment .25/ Public Safety
Department of Justice COPS grant
$401,904 This reflects the first of three years of distributions for the awarded grant, which partially offsets the costs of hiring seven new police officers.
Tax Increment .25/ Public Safety
Six new Police Officer position
$533,634 Six Police Officer positionsare being added in contemplation of the awarded federal COPS grant.
Tax Increment .25/ Public Safety
One-time expenses for new Police Officer positions
$15,216 One-time expenses include academy costs, uniforms, and mobile phones & equipment.
Tax Increment .25/ Public Safety
Ballistic vests
$20,000 These funds will bring the Police Department's inventory of ballistic vests up-to-date.
Tax Increment .25/ Public Safety
On-call contract psychologist
$80,000 This will permit a contract with a qualified psychologist to be on site and available to respond with officers on mental health related calls for immediate intervention with a mental health professional.
Tax Increment .25/ Public Safety
Mobile device analyzer
$30,000 These funds will permit the acquisition of electronic forensic tools that will permit the timely extraction of evidence from devices such as smartphones.
Insurance Fund/ Risk Management
Increase in Hazardous Response Authority assessment
$898 This increase will cover the City's higher obligation to the Adams and Jefferson County Hazardous Response Authority.
26
2015-2016 REVISED BIENNIAL OPERATING AND CAPITAL BUDGET 2016 Operating Revenue by Source Licenses & Permits 6.48% Intergovernmental Reveues 12.69%
Fines & Forfeits 0.97%
Miscellaneous 1.87% Other Financing Sources 0.04%
Transfers 9.29%
Taxes 40.32%
Charges for Services 28.34%
Taxes
$75,884,608
Charges for Services
$53,327,169
Intergovernmental Reveues
$23,891,540
Transfers
$17,489,697
Licenses & Permits
$12,196,784
Fines & Forfeits
$1,830,984
Miscellaneous
$3,531,219
Other Financing Sources Total
$75,000 $188,227,001
2016 Expenditures by Category Miscellaneous 0.56%
Transfers 12.34% Personnel Costs 37.66%
Debt Service 3.97% Supplies 7.01%
Professional Services 10.05% Capital Maintenance & Replacement 14.29%
Services & Charges 14.12%
Personnel Costs
$73,666,900
Capital Maintenance & Replacement
$27,953,445
Services & Charges
$27,610,254
Professional Services
$19,656,233
Supplies
$13,702,472
Debt Service Miscellaneous Transfers Total
27
$7,764,757 $1,101,275 $24,147,345 $195,602,681
2015-2016 REVISED BIENNIAL OPERATING AND CAPITAL BUDGET Revenues Taxes, Charges for Services and Intergovernmental Revenue comprise 81% of the total revenues the City generates to pay for all services. These three types of revenues are expected to generate over $153 million of the $188 million for 2016. Taxes Taxes provide over 40% of the total budgeted revenue. The major sources of taxes are as follows with over $545 million going to the General, Debt Service and Police Tax Increment Funds. 2013 Actual $48,463,129 4,906,939 6,205,601 3,485,117 4,419,787 365,997 $67,846,570
Sales and Use Tax Property & Ownership Tax Auto Use Tax Building Use Tax Franchise Other Total Taxes
2014 Actual $51,923,345 4,976,633 6,899,840 5,252,631 4,399,862 347,047 $73,799,358 5,952,788 8.77%
$ Change % Change Sales Taxes
2015 2016 Proposed Estimate Revised Budget $54,191,506 $55,644,637 5,026,765 5,710,498 6,898,000 6,829,110 5,419,040 2,618,540 4,610,456 4,714,367 363,683 367,456 $76,509,450 $75,884,608 2,710,092 (624,842) 3.67% -0.82%
Sales Tax Collections $60,000,000 $50,000,000 $40,000,000 $30,000,000 $20,000,000 $10,000,000 $0 2010
2011
2012
2013
General Fund
2014
2015 Revised
2016 Budget
Tax Increment
The expectation is that, in 2016, the base will increase by 3.25%. It is assumed there will be some loss from the Ralston Creek Urban Renewal Authority.
28
2015-2016 REVISED BIENNIAL OPERATING AND CAPITAL BUDGET Property Tax The City has had the same property tax rate since 1993, or for over 22 years – 4.31 mills or 4.31 cents for every $100 of assessed value. Also in Colorado, assessed value is 7.96% of appraised value on residential and 29% on all other property. The total assessed value of property within the City lags by a year. Due to the new construction and new property valuations, we do expect to receive approximately $5,350,000 in 2016, which is 15% over 2015.
Assessed Valuation to Property Tax Collections $6,000,000
$1,120,000,000
$5,000,000
$1,100,000,000
$4,000,000
$1,060,000,000
$3,000,000
$1,060,000,000
$2,000,000
Assessed Valuation
Property Tax Revenue
$1,140,000,000
$1,040,000,000
$1,000,000 $0 2010
2011
2012
2013
2014
2015 Revised 2016 Budget
Assessed Valuation
Prop Tax Revenue
Use Taxes We have three types of use taxes: General, Auto and Building Use. Auto Use and Building Use tax revenue have shown steady growth over the past five years. This reflects the recovering economy. General use tax is a stable source of revenue of approximately $1.8 million on an annual basis.
Auto, Building and General Use Tax
$16,000,000 $14,000,000 $12,000,000 $10,000,000 $8,000,000 $6,000,000 $4,000,000 $2,000,000 $0 2010
2011
2012 Auto Use
2013 Building Use
29
2014 General Use
2015 Revised
2016 Budget
2015-2016 REVISED BIENNIAL OPERATING AND CAPITAL BUDGET Charges for Services The largest area of this revenue source is for the Water, Wastewater and Stormwater rates. The following table highlights these revenue sources. Water rates will increase 4% in 2016 and wastewater rates will increase 2.45% in 2016. There will be no increase in Stormwater rates.
Utility Rate Revenue $40,000,000 $35,000,000 $30,000,000 $25,000,000 $20,000,000 $15,000,000 $10,000,000 $5,000,000 $2010
2011
2012 Water
2013
Wastewater
2014
2015 Revised
2016 Budget
Stormwater
Intergovernmental This revenue category declined sharply in 2010 and has experienced limited growth since. There are two primary reasons. The Highway Users’ Trust Fund (HUTF) is from the sales tax on vehicle gas purchases. The State allocates the resources in a methodology based on number of vehicles and population. The challenge with this source of revenue is that the actual tax is a fixed amount on total gallons sold. As vehicles become more efficient and due to the economic conditions, the population drives less, and the total resource decreases. The second major source comes from the Jefferson County mill levy for road and bridge costs. They have the authority to change this allocation each year, and have been decreasing the mill levy for this purpose. Statistically, this revenue type has remained stable. The challenge is that we use these monies for street maintenance. These costs are seeing inflation between 8% to 11% over the past five years, while the revenue has been flat, requiring that the City dedicate more general revenues to street maintenance expenses.
Intergovernmental Revenue $6,000,000 $5,000,000 $4,000,000 $3,000,000 $2,000,000 $1,000,000 $0 2010
2011
2012 HUTF
2013
2014
County Road and Bridge
30
2015 Revised
2016 Budget
2015-2016 REVISED BIENNIAL OPERATING AND CAPITAL BUDGET Interest Earnings Interest earnings are one of the most dismal elements of our revenue sources. The following graph provides a short history of our total interest earnings and rate of return for the past five years, with the revised 2015 estimate and the 2016 Budget. Given the national trends with the Federal Reserve indicating it is considering low-interest rates through 2015, the international challenges and the confusion over the LIBOR (London InterBank Offered Rate) as a rate-setting number that can be trusted in the markets, we do not anticipate the yields growing substantially over the next two years. The budget does include spending considerable principal for our capital items in the next two years. Thus, total earnings will decrease.
Interest Earnings and Yield
1.20%
$3,000,000 1.00%
$2,500,000 0.80% 0.60%
$1,500,000
Yield
Interest
$2,000,000
0.40%
$1,000,000
0.20%
$500,000
0.00%
$0 2010
2011
2012
2013
2014
2015 Revised
2016 Budget
Revenue Summary Overall, revenues are expected to be stable from 2015 to 2016. Although sales and use taxes are going to increase at approximately inflationary levels, we do not expect the level of building activity to continue and have reduced 2016 estimates for building related revenue. Water and Wastewater rates will increase, primarily due to cost increases from Denver Water and Metro Wastewater, the utility’s providers.
31
2015-2016 REVISED BIENNIAL OPERATING AND CAPITAL BUDGET Expenditures by Category As the following chart illustrates, salaries comprise 38% of the total costs in 2016. 2015 Revised $71,544,903 43,409,528 28,766,537 22,767,275 15,134,141 19,684,441 1,182,525 28,625,087 $231,114,437
Salaries Capital Services & Charges Professional Services Supplies & Expenses Debt Service Miscellaneous Transfers
2016 Budget $73,666,900 27,953,445 27,610,254 19,656,233 13,702,472 7,764,757 1,101,275 24,147,345 $195,602,681
A review of the larger costs is provided. Salaries
Salaries and Wages Temporary Wages Benefits Overtime and Other Total Personnel Costs $ Change % Change
2013 Actual $44,473,863 3,915,622 14,380,159 1,353,145 $64,122,789
2014 Actual $45,895,009 3,663,843 15,415,432 1,843,849 $66,818,134 2,695,345 4.20%
2015 Revised $48,662,624 3,292,259 16,681,190 2,908,830 $71,544,903 4,726,769 7.07%
2016 Budget $51,222,067 3,272,679 17,748,667 1,423,487 $73,666,900 2,121,997 2.97%
For 2016, we have assumed a 2.3% Market Rate Adjustment for all positions and that each employee will receive their appropriate step increase. The remaining increase in salaries and wages is due to nine new positions, primarily in the Parks, Arvada Center and Police Tax Increment Funds. Benefits are primarily comprised of health and dental costs. Total health costs in 2016 are expected to be $9,236,536. This is a 7% increase over the 2015 budgeted amount for current benefitted employees. This reflects the estimated 6% increase in health insurance premiums and the nine new positions. Most of the overtime and special pays are in the streets, police and water divisions, all due to general emergencies such as weather and other extraordinary events.
32
2015-2016 REVISED BIENNIAL OPERATING AND CAPITAL BUDGET Services and Charges
Housing Program Insurance CDBG Program Utilities Program Expense Training Contract Services Other Total Services and Charges $ Change % Change
2013 Actual $3,388,823 1,664,683 427,584 8,215,451 2,611,269 750,889 1,196,218 10,976,917 $29,231,834
2014 Actual $3,445,788 2,622,173 605,518 8,045,429 3,557,499 777,659 1,392,502 11,049,948 $31,496,516 2,264,682 7.75%
2015 Revised $3,702,498 2,825,004 582,726 9,353,762 4,519,973 1,034,115 1,771,727 4,976,732 $28,766,537 (2,729,979) -8.67%
2016 Budget $3,633,532 2,538,255 471,427 9,692,679 3,474,239 1,052,979 1,357,974 5,389,169 $27,610,254 (1,156,283) -4.02%
The services and charges include expenses related to paying other agencies or organizations. Examples include: the utility costs the City pays for electricity, natural gas, water, wastewater and stormwater; monies paid to Denver Water for the purchase of water and the services to Metro Wastewater for the treatment of the City’s sewage. The City pays outside consultants for a variety of trainings, including state and federal mandated training. Capital The City now has a Capital Improvements Plan (CIP) document detailing both the 2015 and 2016 appropriations as well as a ten-year plan for the City‘s capital expenditures. The final version of this document will include a summary of the CIP appropriations under a separate tab. For the specificity of projects, please see the 2015-2024 Capital Improvement Plan document. The City has a legal provision to dedicate 20% of the City’s 3 cent sales tax to infrastructure, major capital maintenance and new construction. This is referred to as 98-101 money after the section of the City’s code authorizing the sales tax dedication for capital needs. As the following table shows, in 2016 a total of $9.4 million will be generated from sales tax for capital needs. Of this total, $4.4 million will be used to pay for debt service issued for previous capital needs. The remainder will be dedicated to “pay-as-you-go” projects. Funding
2015 Revised $9,127,629 (4,384,547) $4,743,082
98-101 Debt Service Obligations Transfer to the capital improvement program
2016 Budget $9,413,952 (4,379,255) $5,034,697
In addition to these monies, the CIP recommendations include using water, wastewater and stormwater rates for major utility projects. There will also be a variety of grants and other intergovernmental revenues to meet various needs.
33
2015-2016 REVISED BIENNIAL OPERATING AND CAPITAL BUDGET The table below is an overview of the types of capital expenditures. Category General Governmental Transportation Parks, Golf & Hospitality Utilities Total
2016 Budget $4,747,091 3,121,866 2,026,281 12,485,728 $22,380,966
Debt Service The City’s sales tax debt obligation will be paid off in 2019. This area also accounts for the Certificates of Participation issued in 2005. The obligation will be retired by 2025, and, of the annual $1.408 million obligation, the General Fund will owe only $430,000 through 2025. Transfers There are a host of transfers to and from various departments. Examples include the following highlights: From General Fund General Fund
To
Amount $3,930,720 3,177,603
Arvada Center Parks
General Fund
Certificate of Participation
1,299,510
General Fund General Fund General Fund Arvada Center Water Water Fund
CIP AEDA Golf General Fund General Fund General Fund
7,737,202 773,512 429,285 2,270,398 2,013,614 $1,941,138
The largest transfers are from the General Fund to help support the activities of the other departments’ missions. The Arvada Center, Water and Wastewater Funds pay the General Fund for building, utility and overhead expenses of operating these lines of businesses. Conclusion Overall, the changes to the 2016 Operating Budget reflect changes to existing programs and services. The Budget includes continuing the $2,000,000 added to the street maintenance started in 2012, ensuring that in 2016, and throughout the ten-year model, the budget for taking care of our streets will total approximately $6,000,000. The Budget recommends we invest in the security of City Hall, the Annex building and the Arvada Center. We have added monies for third-party security personnel for these buildings. We have also added additional funding in streets for greater use of salt instead of the current salt/sand mixture which will be more effective and mitigate the need for street sweeping. This 2016 Operating Budget recommends building on the base of our services in several areas. This budget adds two additional parks worker positions to maintain the new and expanded parks created in the past several years The Arvada Center will convert two part-time positions to full-time positions. One of City Council’s strategic goals is to work with neighborhoods to make sure that there is a homeowners association, council or other group
34
2015-2016 REVISED BIENNIAL OPERATING AND CAPITAL BUDGET with whom the City can liaison. A Neighborhood Engagement Coordinator position will be added in 2016 to coordinate neighborhood activities to achieve this goal. Finally, four police officers will be added to maintain police services. This represents a small, incremental step towards the number of officers needed to deal with the increasing demands. Finally, conversations are underway throughout the City about how we will deliver services - from police to water to parks to streets - to the growing population in northwest Arvada. This will be a focus of the next twoyear budget cycle and will likely add significant pressure to the ten-year plan.
Bryan Archer Director of Finance
35
2015-2016 REVISED BIENNIAL OPERATING AND CAPITAL BUDGET Revenue Trend Analysis 2013 Actuals, 2014 Actuals, 2015 Revised and 2016 Budgets
2013 Actual General Fund Grants Lands Dedicated Drainage Arvada Center Community Development Arvada Housing Authority Parks Police Seizure COP Series 2005 Debt Service Police Tax Increment .21 Police Tax Increment .25 Debt Service Capital Projects Construction Special Assessments Water Wastewater Golf Courses Stormwater Food Services Insurance Computers Print Shop Vehicles Buildings AEDA Total All Budgeted Funds
$
$
73,049,576 599,479 209,911 10,455,453 1,128,238 3,774,072 7,444,426 6,144 1,402,042 3,734,293 4,346,808 11,416,316 16,016,848 42,744 34,524,764 13,150,997 4,124,271 6,672,597 1,359,011 2,146,586 1,934,261 308,978 3,485,396 652,833 707,657 202,693,701
2014 Actual $
80,580,957 $ 760,845 360,977 10,130,905 810,476 3,598,237 7,778,305 196,798 1,382,757 4,535,030 4,810,988 3,908,277 9,809,994 82,144 35,379,811 14,666,725 4,654,189 5,281,592 1,411,847 2,152,100 2,001,451 316,980 3,746,878 572,382 758,959 $ 199,689,604 $
36
2015 Revised 83,052,567 561,055 143,222 10,480,543 836,738 3,951,578 8,089,160 28,713 13,134,561 3,984,926 4,810,711 3,922,500 8,733,625 30,057,203 13,697,807 4,940,579 3,358,715 1,963,710 1,890,112 1,911,067 464,463 3,596,447 583,126 743,420 204,936,548
2016 Actual $
$
80,287,090 567,620 95,000 10,507,327 836,739 3,993,440 8,287,029 28,825 1,299,510 4,136,560 5,291,991 3,917,400 6,856,843 28,632,349 14,249,171 5,093,237 3,294,283 1,427,316 1,908,294 1,921,455 471,780 3,747,002 600,228 776,512 188,227,001
2015-2016 REVISED BIENNIAL OPERATING AND CAPITAL BUDGET Expenditure Trend Analysis 2013 Actuals, 2014 Actuals, 2015 Revised and 2016 Budgets
2013 Actual General Fund Grants Lands Dedicated Drainage Arvada Center Community Development Arvada Housing Authority Parks Police Seizure COP Series 2005 Debt Service Police Tax Increment .21 Police Tax Increment .25 Debt Service Capital Projects Construction Special Assessments Water Wastewater Golf Courses Stormwater Food Services Insurance Computers Print Shop Vehicles Buildings AEDA Total All Budgeted Funds
$
$
2014 Actual
70,339,601 $ 2,237,518 10,449,646 1,150,228 3,783,765 7,183,003 11,900 1,401,188 6,556,109 6,378,505 11,426,964 10,324,670 2,000,001 24,923,902 10,144,045 4,652,532 7,959,693 1,475,728 2,623,656 3,836,768 304,685 3,843,099 211,600 706,095 193,924,901 $
75,408,449 155,000 10,162,626 1,407,153 3,777,517 7,622,903 21,619 1,399,131 4,727,543 5,149,401 3,907,325 16,088,789 30,636,380 13,511,970 4,548,314 5,658,591 1,364,039 2,680,100 1,842,618 362,554 3,849,879 335,650 758,523 195,376,074
37
2015 Revised $
$
86,389,996 418,000 1,792,052 10,045,134 1,686,045 4,069,275 8,217,021 25,750 13,228,731 4,043,233 5,465,465 3,922,500 23,348,927 520,000 29,152,629 14,194,938 5,035,779 4,625,004 2,075,357 2,736,558 3,395,334 450,581 4,781,698 709,533 784,897 231,114,437
2016 Actual $
$
81,755,087 200,000 10,450,498 1,024,039 3,988,083 8,541,932 26,523 1,308,510 4,030,594 5,033,770 3,917,400 11,093,663 28,534,324 14,104,335 5,078,956 3,933,543 1,440,273 2,434,096 2,508,699 438,772 4,181,411 804,613 773,560 195,602,681
2015-2016 REVISED BIENNIAL OPERATING AND CAPITAL BUDGET
38
Ten-Year Models 2015-2024 TEN-YEAR MODEL ASSUMPTIONS All Funds • Personnel-related expenses are calculated in detail based upon each employee’s current grade and step and include future estimated market rate adjustments. The market rate adjustment is budgeted at 2.3% for all positions in 2016 and 2% for 2017-2024. • Increases for the City’s medical plan are budgeted at 6% for 2016-2018 and 4% for 2019 and beyond. The plans also include an estimate for the Cadillac tax (the 40% excise tax on health insurance premiums that exceed a predetermined threshold starting in 2018). • Transfers to fund insurance lines, building maintenance, vehicle replacement, computer maintenance and computer replacement have a 1% increase throughout the models. • Transfers to fund vehicle maintenance and risk management services are increased at 3% throughout the models. General Fund • The fund balance goal is 17% of all expenditures. • Sales tax revenue assumes variable growth rates from a low of 2% to a high of 3.75%. We use a base growth rate of 3% and adjust up or down depending on a host of factors. Planned development is used as the main driver. • Building use tax revenue assumes a base of $2,100,000 in 2015 and a 2% growth until 2019, with a tax base reset to $2,000,000 in 2020 and 2% growth thereafter. • Assumes revenue offsets of increasing amounts for pending redevelopment in the Ralston Creek Urban Renewal Area. • Assumes $5.8 million for streets maintenance for 2016-2024 with a 3% growth factor. • Assumes a personnel vacancy savings of 2.0%-2.75% for all years of the model. • All non personnel expenditures increase 3% each year. Parks • The fund balance goal is 11% of all expenditures. • Open Space revenues are budgeted to increase at 3% for all years of the model • The City’s attributable share of Open Space revenue will continue to be used 100% for park maintenance and operations in 2016 and thereafter. Police Tax .21 • The fund balance goal is 11% of all expenditures. • Sales tax and building use tax assumptions are the same as the General Fund and also assumes an increase for development in the Ralston Creek Urban Renewal Area. • Model maintains a fund balance well above the 11% goal through 2024. Police Tax .25 • The fund balance goal is 11% of all expenditures. • Sales tax and building use tax assumptions are the same as the General Fund and also assumes an increase for development in the Ralston Creek Urban Renewal Area. • Model maintains a fund balance well above the 11% goal through 2024.
39
Ten-Year Models 2015-2024 TEN-YEAR MODEL ASSUMPTIONS (Continued) Water • The working capital goal is 25% of all expenditures. • Rates are budgeted to increase 4% in 2016 and increases of 3-4% thereafter. Wastewater • The working capital goal is 25% of all expenditures. • Rates are budgeted to increase 2.45% in 2016 and increases of 3-4% thereafter. Golf • The working capital goal is 11% of all expenditures. • Assumes an increase in rates of 3.5% in all revenue categories for 2016. Storm Water • The working capital goal is 25% of all expenditures. • Rates are budgeted to increase 2% in 2017, 2019, 2021 and 2023 with no rate increase in the other years. Hospitality • The working capital goal is 11% of all expenditures. • Assumes no operating transfer to or from the General Fund. • Model contains funding for capital replacement items of $40,000 in 2016 and beyond. Insurance Services • The fund balance goal is $3,000,000 plus the annual actuarial projection for limited loss. • Revenues for insurance lines are assumed to increase at 1% throughout the model. • Revenues for risk management services are increased at 3% throughout the model.
40
41 $ $ $ $
Fund Balance, Beginning Fund Balance, Ending
Fund Balance Goal (17% of Expenditures)
Excess/(Deficiency)
$ 36,823,066 $ 38,757,628 $ 6,630,002 7,055,737 4,859,564 4,829,449 7,581,154 8,795,533 1,222 5,377 475,849 381,398 65,648 44,949 13,898,605 15,534,889 4,491 3,489 $ 70,339,601 $ 75,408,449 $
12,819,436 $ 18,028,163 $
25,675,091 $ 30,847,599 $
14,686,299 $ 12,823,871 $
30,847,599 $ 27,510,170 $
40,936,559 $ 8,171,484 5,443,616 12,079,499 0 395,303 1,253,398 18,106,635 3,502 86,389,996 $
83,052,567 $
63,913,313 $ 4,611,000 5,265,980 6,280,342 1,795,034 983,075 203,823
2015 Revised
13,898,365 $ 12,143,807 $
27,510,170 $ 26,042,172 $
42,018,766 $ 8,240,698 5,483,711 9,184,605 0 527,161 32,340 16,264,200 3,607 81,755,088 $
80,287,090 $
62,959,658 $ 2,945,904 5,250,458 6,264,168 1,830,984 828,395 207,523
2016 Budget
14,063,946 $ 11,355,033 $
25,456,810 $ 25,418,978 $
44,790,783 $ 8,187,804 5,779,207 9,046,699 0 551,957 34,309 14,334,507 3,827 82,729,093 $
82,691,261 $
65,075,967 $ 2,957,805 5,028,997 6,468,377 1,867,787 1,077,395 214,933
2018 Budget
15,534,464 $ 7,767,716 $
24,453,477 $ 23,302,179 $
47,399,794 $ 8,644,807 6,046,704 9,392,301 0 578,263 36,398 19,276,872 4,060 91,379,199 $
90,227,901 $
72,356,037 $ 2,671,424 5,166,387 6,784,099 1,905,329 1,167,395 177,230
2020 Budget
16,396,965 $ 4,171,274 $
21,732,317 $ 20,568,239 $
50,210,995 $ 9,132,398 6,301,498 9,803,816 0 606,171 38,615 20,354,935 4,307 96,452,735 $
95,288,657 $
76,741,366 $ 2,757,057 5,307,743 7,117,092 1,943,626 1,242,395 179,378
2022 Budget
*2017, 2019, 2021 and 2023 data has been collapsed from this chart to allow for optimal presentation.
11,957,732 $ 13,717,359 $
22,965,115 $ 25,675,091 $
80,580,957 $
EXPENDITURES Personnel Services & Charges Supplies & Expenses Contract & Leases Inventory Capital Maintenance Capital Outlay Transfers Other Total General Fund Expenditures
73,049,577 $
$
Total General Fund Revenue
61,392,739 $ 4,832,991 5,052,092 6,071,757 1,609,392 1,154,999 466,987
2014 Actual
$ 56,132,451 $ 3,231,826 4,891,846 5,983,451 1,709,866 893,397 206,740
2013 Actual
REVENUES Taxes Licenses, Permits and Fees Intergovernmental Charges for Services Fines & Forfeits Miscellaneous Revenue Transfer
Ten Year Financial Models General Fund - Table 1
17,408,381 22,664
19,445,060 17,431,045
52,984,088 9,650,534 6,515,748 11,005,686 0 634,223 40,968 21,566,428 4,569 102,402,244
100,388,229
81,110,954 2,845,969 5,442,295 7,555,741 1,997,855 1,249,885 185,530
2024 Budget
Ten-Year Models
42
$ $ $ $
Fund Balance, Beginning Fund Balance, Ending
Fund Balance Goal (11% of Expenditures) Excess/(Deficiency)
790,130 $ 3,510,672 $
4,039,380 $ 4,300,802 $
4,275,910 $ 1,202,204 1,313,371 121,599 (1,040) 135,569 135,390 7,183,003 $
43,067 $ 3,537,126 62,131 918,556 2,883,545 7,444,425 $
2013 Actual
838,519 $ 3,617,685 $
4,300,802 $ 4,456,204 $
4,508,414 $ 1,468,574 1,344,941 163,002 431 90,378 23,063 24,074 25 7,622,903 $
48,336 $ 3,685,566 69,196 1,037,809 2,937,398 7,778,305 $
2014 Actual
903,872 $ 3,424,471 $
4,456,204 $ 4,328,343 $
4,714,077 $ 1,719,651 1,405,080 228,595 2,060 143,744 3,714 100 8,217,021 $
52,751 $ 3,796,133 58,306 1,059,473 3,122,497 8,089,160 $
2015 Revised
939,613 $ 3,133,828 $
4,328,343 $ 4,073,440 $
4,845,576 $ 1,804,300 1,450,506 235,454 2,122 148,056 52,000 3,818 100 8,541,932 $
54,334 $ 3,910,017 54,235 1,090,840 3,177,603 8,287,029 $
2016 Budget
995,772 $ 2,551,631 $
3,835,251 $ 3,547,403 $
5,214,423 $ 1,902,770 1,525,818 249,793 2,251 157,073 246 100 9,052,474 $
17,642 $ 4,148,137 70,269 1,156,837 3,371,741 8,764,626 $
2018 Budget
1,057,665 $ 1,889,776 $
3,261,825 $ 2,947,440 $
5,567,511 $ 2,007,227 1,606,018 265,006 2,388 166,638 246 100 9,615,134 $
61,153 $ 4,400,759 74,548 1,187,059 3,577,230 9,300,749 $
2020 Budget
1,119,819 $ 1,261,875 $
2,652,092 $ 2,381,693 $
5,910,481 $ 2,118,035 1,690,843 281,144 2,534 176,787 246 100 10,180,170 $
64,878 $ 4,668,765 79,088 1,301,786 3,795,254 9,909,771 $
2022 Budget
*2017, 2019, 2021 and 2023 data has been collapsed from this chart to allow for optimal presentation.
$
$
$
$
EXPENDITURES Personnel Services & Charges Supplies & Expenses Contract & Leases Inventory Capital Maintenance Capital Outlay Transfers Other Total Expenditures
REVENUES Licenses, Permits and Fees Intergovernmental Charges for Services Miscellaneous Revenue Transfer Total Revenues
Ten Year Financial Models Parks - Table 2
1,185,186 658,592
2,104,721 1,843,778
6,245,085 2,235,580 1,804,901 298,266 2,688 187,553 246 100 10,774,419
68,829 4,953,093 83,905 1,381,066 4,026,583 10,513,476
2024 Budget
Ten-Year Models
43
$ $ $ $
Fund Balance, Beginning Fund Balance, Ending
Fund Balance Goal (11% of Expenditures) Excess/(Deficiency)
721,172 $ 2,754,325 $
6,297,313 $ 3,475,497 $
2,653,563 $ 116,110 456,459 72,089 3,182,484 75,405 6,556,109 $
3,513,461 $ 130,155 90,677 3,734,293 $
2013 Actual
520,030 $ 2,762,954 $
3,475,497 $ 3,282,984 $
2,644,615 $ 148,287 472,788 62,858 879 1,322,211 75,905 4,727,543 $
3,872,392 $ 559,517 103,121 4,535,030 $
2014 Actual
444,756 $ 2,779,921 $
3,282,984 $ 3,224,677 $
2,956,593 $ 172,953 448,926 139,723 7,630 210,000 107,408 4,043,233 $
3,892,926 $ 50,000 42,000 3,984,926 $
2015 Revised
443,365 $ 2,887,277 $
3,224,677 $ 3,330,643 $
3,123,587 $ 178,870 474,835 165,677 7,859 79,766 4,030,594 $
4,041,560 $ 50,000 45,000 4,136,560 $
2016 Budget
460,541 $ 3,270,435 $
3,546,192 $ 3,730,976 $
3,340,895 $ 187,708 485,646 80,286 8,337 83,863 4,186,735 $
4,266,519 $ 50,000 55,000 4,371,519 $
2018 Budget
486,224 $ 3,579,209 $
3,903,103 $ 4,065,433 $
3,538,536 $ 198,298 501,153 85,175 8,845 88,209 4,420,216 $
4,470,546 $ 50,000 62,000 4,582,546 $
2020 Budget
2024 Budget
510,862 $ 535,429 3,952,130 $ 4,454,204
4,248,345 $ 4,712,358 4,462,992 $ 4,989,634
3,724,629 $ 3,907,919 209,534 221,450 517,469 534,640 90,363 95,865 9,384 9,954 92,820 97,710 4,644,199 $ 4,867,538
4,746,846 $ 5,032,814 50,000 50,000 62,000 62,000 4,858,846 $ 5,144,814
2022 Budget
*2017, 2019, 2021 and 2023 data has been collapsed from this chart to allow for optimal presentation.
$
$
$
$
EXPENDITURES Personnel Services & Charges Supplies & Expenses Contract & Leases Capital Maintenance Capital Outlay Transfers Total Expenditures
Taxes Intergovernmental Miscellaneous Total Revenues
REVENUES
Ten Year Financial Models Police Tax Increment .21 - Table 3
Ten-Year Models
44
$ $ $ $
Fund Balance, Beginning Fund Balance, Ending
Fund Balance Goal (11% of Expenditures) Excess/(Deficiency)
701,636 $ 3,802,846 $
6,536,179 $ 4,504,482 $
3,089,489 $ 108,122 190,749 9,618 78 2,895,436 85,013 6,378,505 $
4,320,800 $ 26,008 4,346,808 $
2013 Actual
566,434 $ 3,599,634 $
4,504,482 $ 4,166,068 $
3,129,935 $ 121,103 187,055 946 330 1,224,480 485,552 5,149,401 $
4,755,117 $ 55,871 4,810,988 $
2014 Actual
601,201 $ 2,910,113 $
4,166,068 $ 3,511,314 $
3,771,200 $ 1,080,900 205,664 78,240 4,825 210,677 113,959 5,465,465 $
4,785,711 $ 25,000 4,810,711 $
2015 Revised
553,715 $ 3,215,821 $
3,511,314 $ 3,769,535 $
4,306,880 $ 218,422 270,100 92,350 4,970 51,047 90,001 5,033,770 $
4,970,991 $ 321,000 5,291,991 $
2016 Budget
583,777 $ 3,836,940 $
4,150,069 $ 4,420,717 $
4,733,158 $ 223,408 236,666 13,102 5,272 739 94,721 5,307,066 $
5,245,714 $ 332,000 5,577,714 $
2018 Budget
628,941 $ 3,518,006 $
4,315,642 $ 4,146,946 $
5,114,289 $ 235,975 247,372 13,900 5,593 784 99,728 5,717,641 $
5,498,945 $ 50,000 5,548,945 $
2020 Budget
663,765 $ 3,163,464 $
3,972,031 $ 3,827,228 $
5,399,688 $ 249,306 258,679 14,746 5,934 832 105,040 6,034,225 $
5,839,422 $ 50,000 5,889,422 $
2022 Budget
*2017, 2019, 2021 and 2023 data has been collapsed from this chart to allow for optimal presentation.
$
$
$
$
EXPENDITURES Personnel Services & Charges Supplies & Expenses Contract & Leases Capital Maintenance Capital Outlay Transfers Total Expenditures
Taxes Miscellaneous Total Revenues
REVENUES
Ten Year Financial Models Police Tax Increment .25 - Table 4
696,261 2,930,462
3,714,774 3,626,723
5,662,079 263,449 270,621 15,645 6,296 883 110,676 6,329,649
6,241,598
6,191,598 50,000
2024 Budget
Ten-Year Models
45 $ $ $ $
Working Capital, Beginning Working Capital, Ending
Working Capital Goal (25%) Excess/(Deficiency)
6,230,976 $ 23,910,240 $
20,540,353 $ 30,141,216 $
5,537,165 $ 6,474,260 806,900 864,825 2,259,565 (1,238) 482,038 6,336,177 2,163,490 721 24,923,902 $
11,843,511 $ 18,106,972 4,146,822 427,460 34,524,765 $
2013 Actual
7,659,095 $ 27,225,552 $
30,141,216 $ 34,884,647 $
5,783,394 $ 6,129,838 881,550 791,976 2,253,407 4,773,684 7,651,652 2,332,940 37,938 30,636,380 $
16,025,193 $ 18,789,322 124,995 440,300 35,379,811 $
2014 Actual
7,288,157 $ 28,501,064 $
34,884,647 $ 35,789,221 $
6,539,542 $ 7,088,660 1,373,257 431,673 2,261,700 4,087,564 5,058,656 2,311,577 29,152,629 $
8,403,635 $ 20,845,626 353,337 454,605 30,057,203 $
2015 Revised
7,133,581 $ 28,753,665 $
35,789,221 $ 35,887,246 $
6,379,839 $ 7,296,117 1,116,258 444,623 2,262,550 4,210,191 4,450,334 2,374,412 28,534,324 $
8,554,658 $ 19,411,136 198,312 468,243 28,632,349 $
2016 Budget
8,869,417 $ 20,703,411 $
35,041,137 $ 29,572,828 $
6,895,316 $ 7,729,888 1,173,549 471,701 2,261,000 4,466,591 9,982,053 2,497,570 35,477,668 $
7,957,941 $ 21,347,281 207,379 496,758 30,009,359 $
2018 Budget
10,714,662 $ 12,764,243 $
34,562,866 $ 23,478,905 $
7,363,177 $ 8,190,075 1,234,162 500,427 3,866,852 4,738,607 14,329,181 2,636,165 42,858,646 $
7,642,103 $ 23,425,275 180,295 527,012 31,774,685 $
2020 Budget
6,966,933 $ 26,688,840 $
27,965,780 $ 33,655,773 $
7,813,438 $ 8,678,289 1,298,294 530,903 1,604,852 5,027,188 131,744 2,783,025 27,867,733 $
7,289,234 $ 25,658,177 51,208 559,107 33,557,726 $
2022 Budget
*2017, 2019, 2021 and 2023 data has been collapsed from this chart to allow for optimal presentation.
$
$
$
$
EXPENDITURES Personnel Services & Charges Supplies & Expenses Contract & Leases Debt Service Inventory Capital Maintenance Capital Outlay Transfers Other Total Expenditures
REVENUES Licenses, Permits and Fees Charges for Services Miscellaneous Revenue Transfer Other Financing Sources Total Revenues
Ten Year Financial Models Water Fund - Table 5
7,325,858 39,066,853
40,048,123 46,392,711
8,235,552 9,196,235 1,291,798 563,235 1,604,852 5,333,344 139,767 2,938,649 29,303,432
7,113,710 27,816,964 124,189 593,157 35,648,020
2024 Budget
Ten-Year Models
46
$ $ $ $
Working Capital, Beginning Working Capital, Ending
Working Capital Goal (25% of Expenditures) Excess/(Deficiency)
2,536,011 $ 9,356,989 $
8,886,047 $ 11,893,000 $
1,142,239 $ 188,397 375,581 7,253,270 50,991 141,370 990,671 1,526 10,144,045 $
2,603,836 $ 10,503,581 43,581 13,150,998 $
2013 Actual
3,377,992 $ 9,669,763 $
11,893,000 $ 13,047,755 $
1,153,005 $ 128,775 424,496 6,794,621 1,221,012 2,793,426 996,512 123 13,511,970 $
3,801,955 $ 11,315,083 (450,312) 14,666,725 $
2014 Actual
3,548,735 $ 9,001,890 $
13,047,755 $ 12,550,624 $
1,156,144 $ $145,402 $707,411 $7,834,930 $2,783,180 $534,666 $1,033,205 14,194,938 $
597,493 $ 12,898,214 128,674 73,426 13,697,807 $
2015 Revised
3,526,084 $ 9,169,377 $
12,550,624 $ 12,695,460 $
1,275,711 $ $148,798 $488,168 $8,226,620 $2,145,676 $755,161 $1,064,201 14,104,335 $
635,288 $ 13,406,054 132,200 75,629 14,249,171 $
2016 Budget
3,719,763 $ 10,088,867 $
13,457,892 $ 13,808,629 $
1,369,814 $ $155,898 $514,417 $9,069,730 $2,276,347 $364,059 $1,128,786 14,879,051 $
568,458 $ 14,443,926 137,169 80,235 15,229,788 $
2018 Budget
2022 Budget
2024 Budget
4,025,212 $ 4,372,069 $ 4,668,295 10,740,533 $ 11,513,153 $ 13,147,708
14,277,952 $ 15,316,515 $ 16,833,935 14,765,745 $ 15,885,221 $ 17,816,002
1,455,200 $ 1,540,462 $ 1,627,538 $163,429 $171,420 179,898 $542,195 $571,589 602,702 $9,999,251 $11,024,040 12,153,862 $2,414,977 $2,562,048 2,718,076 $328,267 $348,258 43,274 $1,197,529 $1,270,458 1,347,829 16,100,848 $ 17,488,275 $ 18,673,179
534,270 $ 504,869 $ 473,959 15,826,581 17,310,206 18,922,716 142,669 151,601 162,765 85,121 90,305 95,806 16,588,641 $ 18,056,981 $ 19,655,246
2020 Budget
*2017, 2019, 2021 and 2023 data has been collapsed from this chart to allow for optimal presentation.
$
$
$
$
EXPENDITURES Personnel Services & Charges Supplies & Expenses Contract & Leases Capital Maintenance Capital Outlay Transfers Other Total Expenditures
REVENUES Licenses, Permits and Fees Charges for Services Miscellaneous Revenue Transfer Total Revenues
Ten Year Financial Models Wastewater Fund - Table 6
Ten-Year Models
47
$ $ $ $
Working Capital, Beginning Working Capital, Ending
Working Capital Goal (11% of Expenditures) Excess/(Deficiency)
511,779 $ (410,779) $
629,261 $ 101,000 $
2,114,714 $ 424,205 581,401 160,177 155,386 720,415 81,778 384,957 29,499 4,652,532 $
3,907,364 $ 15,614 201,294 4,124,271 $
2013 Actual
500,314 $ (293,439) $
101,000 $ 206,875 $
2,246,360 $ 491,484 649,293 147,800 155,289 756,839 56,650 13,549 31,049 4,548,314 $
4,415,462 $ 29,252 209,475 4,654,189 $
2014 Actual
553,936 $ (442,260) $
206,875 $ 111,675 $
2,486,656 $ 406,770 631,142 203,564 162,268 730,762 124,778 286,000 3,839 5,035,779 $
4,515,929 $ 12,178 412,472 4,940,579 $
2015 Revised
558,685 $ (432,729) $
111,675 $ 125,956 $
2,573,905 $ 468,457 653,033 204,021 166,750 752,685 128,521 127,630 3,954 5,078,956 $
4,651,410 $ 12,542 429,285 5,093,237 $
2016 Budget
577,790 $ (571,259) $
67,620 $ 6,530 $
2,755,039 $ 495,319 686,299 204,981 176,123 798,524 136,349 5,252,634 $
4,934,679 $ 13,305 243,560 5,191,544 $
2018 Budget
597,142 $ (407,496) $
110,431 $ 189,646 $
2,933,202 $ 523,818 721,423 42,734 186,066 847,154 144,652 29,517 5,428,566 $
5,235,200 $ 14,115 258,466 5,507,781 $
2020 Budget
641,097 $ (359,703) $
266,254 $ 281,394 $
3,115,305 $ 554,051 758,516 43,814 196,615 898,746 153,462 107,644 5,828,153 $
5,554,024 14,975 274,294 5,843,293 $
2022 Budget
*2017, 2019, 2021 and 2023 data has been collapsed from this chart to allow for optimal presentation.
$
$
$
$
EXPENDITURES Personnel Services & Charges Supplies & Expenses Contract & Leases Debt Service Inventory Capital Maintenance Capital Outlay Transfers Total Expenditures
REVENUES Charges for Services Miscellaneous Revenue Transfer Total Revenues
Ten Year Financial Models Golf Course - Table 7
665,438 (99,560)
416,059 565,877
3,295,768 586,125 798,487 44,960 207,806 953,479 162,807 6,049,432
5,892,264 15,888 291,098 6,199,250
2024 Budget
Ten-Year Models
48
$ $
$ $
Working Capital, Beginning Working Capital, Ending
Working Capital Goal (25%) Excess/(Deficiency)
1,989,923 $ 3,951,077 $
7,228,096 $ 5,941,000 $
456,471 $ 35,642 15,669 99,778 4,536,860 2,766,779 48,493 7,959,693 $
3,503,984 $ 3,119,020 49,593 6,672,597 $
2013 Actual
1,414,648 $ 4,149,353 $
5,941,000 $ 5,564,001 $
390,923 $ 193,943 38,156 128,476 3,441,576 1,444,830 20,686 5,658,591 $
1,902,594 $ 3,224,066 154,932 5,281,592 $
2014 Actual
1,156,251 $ 3,141,461 $
5,564,001 $ 4,297,712 $
466,001 $ 679,529 108,565 135,738 1,635,000 1,600,171 4,625,004 $
- $ 3,326,374 32,341 3,358,715 $
2015 Revised
983,386 $ 2,675,066 $
4,297,712 $ 3,658,452 $
473,103 $ 699,828 60,196 139,811 1,135,793 1,424,812 3,933,543 $
- $ 3,266,474 27,809 3,294,283 $
2016 Budget
865,930 $ 2,717,436 $
3,652,935 $ 3,583,366 $
519,258 $ 742,273 63,282 148,325 530,682 1,459,899 3,463,719 $
- $ 3,370,427 23,723 3,394,150 $
2018 Budget
902,498 $ 2,512,762 $
3,528,569 $ 3,415,260 $
560,007 $ 787,302 66,552 157,357 546,722 1,492,052 3,609,992 $
- $ 3,472,677 24,007 3,496,684 $
2020 Budget
2024 Budget
940,959 $ 980,347 2,201,078 $ 1,779,262
3,307,830 $ 2,982,698 3,142,038 $ 2,759,608
600,007 $ 634,801 835,073 885,754 70,015 73,683 166,941 177,107 563,246 580,271 1,528,555 1,569,771 3,763,837 $ 3,921,387
- $ 3,574,475 3,675,995 23,570 22,302 3,598,045 $ 3,698,297
2022 Budget
*2017, 2019, 2021 and 2023 data has been collapsed from this chart to allow for optimal presentation.
$
$
$
$
EXPENDITURES Personnel Services & Charges Supplies & Expenses Contract & Leases Capital Outlay Transfers Other Total Expenditures
REVENUES Licenses, Permits and Fees Intergovernmental Charges for Services Miscellaneous Revenue Transfer Total Revenues
Ten Year Financial Models Stormwater Utility - Table 8
Ten-Year Models
49
162,330 $ 391,670 $
$ $
Working Capital, Beginning Working Capital, Ending
Working Capital Goal (11% of Expenditures) $ Excess/(Deficiency) $
2015 Revised
2016 Budget
2018 Budget
2020 Budget
2022 Budget
150,044 $ 451,764 $
554,000 $ 601,808 $
228,289 $ 261,872 $
601,808 $ 490,161 $
158,430 $ 318,774 $
490,161 $ 477,204 $
164,351 $ 122,268 $
390,534 $ 286,619 $
171,339 $ (156,111) $
148,756 $ 15,229 $
166,675 $ (152,122) $
20,705 $ 14,553
756,198 $ 951,952 $ 854,395 $ 898,702 $ 947,463 $ 995,477 $ 112,665 146,617 101,292 105,036 108,964 103,090 121,052 150,943 122,285 123,833 127,621 105,000 321,970 407,588 303,121 306,160 313,108 270,000 19,148 17,650 18,180 19,368 19,475 20,661 371,315 40,000 40,000 40,000 20,000 27,468 28,292 5,538 1,000 1,000 1,000 1,000 1,000 1,364,039 $ 2,075,357 $ 1,440,273 $ 1,494,099 $ 1,557,631 $ 1,515,228 $
1,354,283 $ 1,834,287 $ 1,358,787 $ 1,317,309 $ 1,347,161 $ 1,427,790 $ 57,563 116,266 54,583 57,205 59,995 62,955 13,157 13,946 15,670 16,948 18,331 1,411,847 $ 1,963,710 $ 1,427,316 $ 1,390,184 $ 1,424,104 $ 1,509,076 $
2014 Actual
*2017, 2019, 2021 and 2023 data has been collapsed from this chart to allow for optimal presentation.
670,717 $ 554,000 $
$
800,912 $ 98,125 135,368 321,130 84,520 4,800 25,952 4,922 1,475,728 $
1,359,011 $
$
$
1,320,407 $ 38,604
$
2013 Actual
EXPENDITURES Personnel Services & Charges Supplies & Expenses Inventory Capital Maintenance Capital Outlay Transfers Other Total Expenditures
REVENUES Charges for Services Miscellaneous Revenue Transfer Total Revenues
Ten Year Financial Models Hospitality - Table 9
173,905 (173,905)
13,800 -
1,041,611 117,430 109,000 270,000 21,909 20,000 1,000 1,580,950
1,459,224 88,099 19,827 1,567,150
2024 Budget
Ten-Year Models
50
(808,000)
$ $
Available Cash Ending
4,065,000 $ 3,218,554 $
345,500 $ 2,132,391 122,996 95,671 40,000 2,736,558 $
1,817,992 $ 72,120 1,890,112 $
2015 Revised
3,218,554 $ 2,692,752 $
383,403 $ 1,841,140 111,012 98,541 2,434,096 $
1,834,010 $ 74,284 1,908,294 $
2016 Budget
2,358,754 $ 2,015,566 $
421,729 $ 1,675,910 117,315 74,542 2,289,496 $
1,867,501 $ 78,807 1,946,308 $
2018 Budget
1,665,266 $ 1,308,261 $
456,445 $ 1,682,296 124,000 80,909 2,343,650 $
1,903,038 $ 83,607 1,986,645 $
2020 Budget
944,843 $ 577,896 $
488,559 $ 1,689,072 131,086 87,663 2,396,380 $
1,940,735 $ 88,698 2,029,433 $
2022 Budget
*2017, 2019, 2021 and 2023 data has been collapsed from this chart to allow for optimal presentation.
NOTE: The Actuarial Projection Adjustment is a component throughout the model, reflected in the Fund Balance.
4,065,000
4,873,000
$
Ending Cash Actuarial Projection Adjustment
4,593,000 $ 4,065,000 $ 5,401,000
5,070,070 $ 4,593,000 $
350,898 $ 1,960,642 107,953 28,384 232,223 2,680,100 $
2,032,874 $ 119,226 2,152,100 $
2014 Actual
$
$ $
Fund Balance, Beginning Fund Balance, Ending
553,039 $ 1,282,129 87,308 44,700 82,980 573,500 2,623,656 $
2,010,350 $ 136,236 2,146,586 $
2013 Actual
Beginning Cash
$
$
$
$
EXPENDITURES Personnel Services & Charges Supplies & Expenses Contract & Leases Capital Outlay Transfers Total Expenditures
REVENUES Intergovernmental Miscellaneous Total Revenue
Ten Year Financial Models Insurance Services - Table 10
307,989 1,943
516,876 1,640,392 130,721 92,886 2,380,875
1,980,730 94,099 2,074,829
2024 Budget
Ten-Year Models
51
$ $
Fund Balance, Beginning Fund Balance, Ending
7,894,507 $ 5,992,000 $
119,930 $ 28 2,197,036 6,400 13,375 1,500,000 3,836,768 $
1,780,285 $ 28,078 125,898 1,934,261 $
2013 Actual
5,992,000 $ 6,150,833 $
109,420 $ 1,708,666 12,000 12,532 1,842,618 $
1,878,346 $ 123,105 2,001,451 $
2014 Actual
6,150,833 $ 4,666,566 $
108,969 $ 3,286,365 3,395,334 $
1,830,183 $ 28,000 52,884 1,911,067 $
2015 Revised
4,666,566 $ 4,079,322 $
114,195 $ 2,394,504 2,508,699 $
1,838,985 $ 28,000 54,470 1,921,455 $
2016 Budget
4,339,120 $ 4,123,757 $
124,961 $ 2,033,042 2,158,003 $
1,856,853 $ 28,000 57,787 1,942,640 $
2018 Budget
3,366,662 $ 2,824,807 $
132,335 $ 2,373,908 2,506,243 $
1,875,081 $ 28,000 61,307 1,964,388 $
2020 Budget
3,078,884 $ 2,154,111 $
138,687 $ 2,772,801 2,911,488 $
1,893,675 $ 28,000 65,040 1,986,715 $
2022 Budget
*2017, 2019, 2021 and 2023 data has been collapsed from this chart to allow for optimal presentation.
$
$
$
$
EXPENDITURES Personnel Services & Charges Supplies & Expenses Contract & Leases Inventory Capital Maintenance Transfers Total Expenditures
REVENUES Intergovernmental Charges for Services Miscellaneous Total Revenue
Ten Year Financial Models Computers - Table 11
445,445 143,810
145,378 2,165,901 2,311,279
1,912,643 28,000 69,001 2,009,644
2024 Budget
Ten-Year Models
52
$ $
Fund Balance, Beginning Fund Balance, Ending
6,707,703 $ 6,350,000 $
1,213,141 $ 128,703 291,904 34,327 (43,665) 589,956 1,539,123 89,610 3,843,099 $
3,312,352 $ 60,573 112,471 3,485,396 $
2013 Actual
6,350,000 $ 6,247,000 $
1,255,195 $ 107,390 241,327 30,735 (936) 524,231 1,599,537 92,400 3,849,879 $
3,373,268 $ 158,159 215,452 3,746,878 $
2014 Actual
6,247,000 $ 5,061,749 $
1,369,375 $ 96,809 472,796 12,771 552,595 2,182,180 95,172 4,781,698 $
3,452,069 $ 69,378 75,000 3,596,447 $
2015 Revised
5,061,749 $ 4,627,340 $
1,382,817 $ 98,930 280,498 13,155 569,173 1,763,318 73,520 4,181,411 $
3,612,772 $ 59,230 75,000 3,747,002 $
2016 Budget
4,416,349 $ 4,514,349 $
1,496,295 $ 103,365 295,834 13,956 603,835 1,236,127 77,997 3,827,409 $
3,796,016 $ 54,393 75,000 3,925,409 $
2018 Budget
4,874,914 $ 1,542,892 $
1,593,793 $ 108,070 312,088 14,806 640,609 4,700,000 82,747 7,452,113 $
3,989,309 $ 55,782 75,000 4,120,091 $
2020 Budget
1,404,864 $ 1,263,858 $
1,689,894 $ 113,062 329,320 15,708 679,622 1,560,600 87,787 4,475,993 $
4,193,228 $ 66,759 75,000 4,334,987 $
2022 Budget
*2017, 2019, 2021 and 2023 data has been collapsed from this chart to allow for optimal presentation.
$
$
$
$
EXPENDITURES Personnel Services & Charges Supplies & Expenses Contract & Leases Inventory Capital Maintenance Capital Outlay Transfers Total Expenditures
REVENUES Intergovernmental Miscellaneous Other Total Revenue
Ten Year Financial Models Vehicles - Table 12
1,124,616 989,707
1,778,780 118,357 347,586 16,665 721,011 1,623,648 93,133 4,699,180
4,408,386 80,885 75,000 4,564,271
2024 Budget
Ten-Year Models
53
$ $
Fund Balance, Beginning Fund Balance, Ending
1,689,766 $ 2,131,000 $
- $ 113,725 97,875 211,600 $
407,351 $ 8,022 237,461 652,833 $
2013 Actual
2,131,000 $ 2,367,733 $
- $ 114,851 220,799 335,650 $
431,301 $ 25,965 115,117 572,382 $
2014 Actual
2,367,733 $ 2,241,326 $
57,835 $ 120,918 530,780 709,533 $
446,814 $ 13,000 123,312 583,126 $
2015 Revised
2,241,326 $ 2,036,941 $
68,064 $ 124,546 612,003 804,613 $
460,217 $ 13,000 127,011 600,228 $
2016 Budget
1,739,909 $ 1,804,431 $
75,203 $ 402,721 477,924 $
529,446 $ 13,000 542,446 $
2018 Budget
2,170,959 $ 1,401,771 $
81,742 $ 1,262,134 1,343,876 $
561,688 $ 13,000 574,688 $
2020 Budget
1,037,132 $ 231,746 $
87,219 $ 1,327,063 1,414,282 $
595,896 $ 13,000 608,896 $
2022 Budget
*2017, 2019, 2021 and 2023 data has been collapsed from this chart to allow for optimal presentation.
$
$
$
$
EXPENDITURES Personnel Debt Service Capital Maintenance Total Expenditures
REVENUES Intergovernmental Miscellaneous Revenue Transfer Total Revenue
Ten Year Financial Models Buildings - Table 13
575,345 1,100,436
91,831 28,268 120,099
632,190 13,000 645,190
2024 Budget
Ten-Year Models
54
$ $ $ $
Fund Balance, Beginning Fund Balance, Ending
Fund Balance Goal (11% of Expenditures) Excess/(Deficiency)
77,670 $ 319,220 $
395,328 $ 396,890 $
409,968 $ 117,055 20,796 153,725 4,551 706,095 $
1,855 $ 705,802 707,657 $
2013 Actual
83,438 $ 313,889 $
396,890 $ 397,326 $
446,793 $ 138,805 21,004 146,462 772 4,687 758,523 $
11,902 $ 747,058 758,959 $
2014 Actual
86,339 $ 269,511 $
397,326 $ 355,849 $
440,186 $ 173,124 24,676 146,116 795 784,897 $
3,000 $ 740,420 743,420 $
2015 Revised
85,092 $ 273,710 $
355,849 $ 358,801 $
418,734 $ 178,271 25,236 150,500 819 773,560 $
3,000 $ 773,512 776,512 $
2016 Budget
92,108 $ 270,946 $
361,246 $ 363,053 $
461,366 $ 189,033 26,407 159,666 869 837,341 $
3,000 $ 836,148 839,148 $
2018 Budget
99,345 $ 263,750 $
364,217 $ 363,095 $
504,735 $ 200,452 27,641 169,389 922 903,139 $
3,000 $ 899,017 902,017 $
2020 Budget
106,687 $ 240,524 $
357,414 $ 347,211 $
547,677 $ 212,566 28,956 179,705 978 969,882 $
3,000 $ 956,679 959,679 $
2022 Budget
*2017, 2019, 2021 and 2023 data has been collapsed from this chart to allow for optimal presentation.
$
$
$
$
EXPENDITURES Personnel Services & Charges Supplies & Expenses Contract & Leases Capital Maintenance Transfers Total Expenditures
REVENUES Miscellaneous Revenue Transfer Total Revenues
Ten Year Financial Models Economic Development - Table 14
113,325 204,528
334,054 317,853
582,525 225,462 30,556 190,647 1,037 1,030,227
3,000 1,011,026 1,014,026
2024 Budget
Ten-Year Models
Arvada Center for the Arts and Humanities
AREAS OF FOCUS
STRATEGIC RESULTS
Arts
18%
increase
Humanities & Education Advancement
10% of operating budget will come from
of households engaged as patrons by 2017
58,000+ students
will participate in classes, workshops and camps annually
Win the Regional Theater
charitable donations
Patron Experience
Tony Award by 2020
by 2019
95%
accessibility ranking
40,000 visitors
breaking down economic, physical and cultural barriers to experiencing the arts
MISSION
to Arvada Center galleries annually
The Mission of the Arvada Center is to provide Arts and Humanities to patrons and visitors near and far so they can be engaged, challenged and personally inspired to experience their world in new ways.
Aligns with City Council Goals
BUDGET 2013 Actual 2014 Actual 2015 Revised 2016 Budget
EMPLOYEES 2013 Actual 2014 Actual 2015 Revised 2016 Budget
$10,449,646 $10,162,626 $10,045,134 $10,450,496 55
39.25 39.25 39.25 41.25
HIGHLIGHTED STRATEGIC RESULTS
Beginning no later than FY 2016, the Arvada Center will operate without a budget deficit.
Status
We have incurred necessary expenses over the past two years, including hiring of an Executive Director and a Chief Development Officer. These expenses have been absorbed without increasing the budget gap over 2013 - evidence that expenses have been cut in other areas, including the Performing Arts division. 2015 budget projection is one million dollars less than the unrealized projections for 2014. Ticket sales to date suggest we will exceed projections, meaning that we are on track to significantly reduce the deficit in 2015 from what it was in 2014.
The Arvada Center will successfully complete its potential transition to a non-profit organization.
Timeline
July 2014: City Council appointed the five founding members of the new board. July 2015: Cooperative Agreement between City and Arvada Center approved. July 2015: Began reorganization of existing nonprofit, Arvada Council for the Arts and Humanities, including submission to the IRS. July 4, 2016: On the 40th anniversary of the Arvada Center’s opening, the nonprofit organization will be fully functioning and responsible for management of the Arvada Center.
By 2018, Arvada Center Galleries will be recognized by targeted national publications. March 2014 edition of Ceramics Monthly Recognition for sculpture exhibition Earth Moves: Shifts in Ceramic Art and Design Ivan Albreht Still Life-Composition 3 Renee Brown Karetite, Cielium, Bark Spray
July 2014 edition of Art, LTD Recognition for sculpture exhibition UnBound: Sculpture in the Field
Kevin Robb Whimsical Dances
56
Erick C. Johnson Navigator
Arvada Economic Development Association
AREAS OF FOCUS
STRATEGIC RESULTS
Business Growth & Stability
$350 Million
New Business Development
Marketing
+1,000
new jobs in urban centers & corridors by year-end 2019
in commercial capital investment by year-end 2019
Strategic Alliances
$250,000 in additional retail sales per year
Arvada business vacancy rate
All Arvada businesses contacted
compared to Denver metro vacancy rate
MISSION
2 times per year
The mission of the Arvada Economic Development Association (AEDA) is to provide business and commercial development services to new and existing businesses so they can grow and expand to create jobs, increase revenues and make capital investments.
Aligns with City Council Goals
BUDGET 2013 Actual 2014 Actual 2015 Revised 2016 Budget
EMPLOYEES 2013 Actual 2014 Actual 2015 Revised 2016 Budget
$710,412 $758,523 $784,897 $773,561 57
4.00 4.00 4.00 4.00
HIGHLIGHTED STRATEGIC RESULTS
By 2015, AEDA will generate 75 new business prospects annually.
40 30 20 10 Exceeding 0 goal! Jan Feb Mar Apr May Jun Jul Aug Sep Oct Nov Dec 2014 (191)
2015 (166)
By 2015, Arvada businesses will experience a stable business environment as evidenced by: 97% of businesses of 50 or more employees will be retained annually.
100% 75% 50% 25% 0
Jan-Mar 2015
Apr-Jun 2015
Jul-Sep 2015
By 2015, new retail businesses will bring a total of $250,000 in additional sales tax revenues annually.
More than double goal!
$600,000 $500,000 $400,000 $300,000 $200,000 $100,000 $50,000 0
$571,152 $396,479
Total 2014
Jan-Oct 2015 58
City Attorney’s Office
AREAS OF FOCUS
STRATEGIC RESULTS Risk avoidance
City Attorney
training
for elected/appointed officials and employees
95%
Prosecution Civil Litigation
thereby
protecting taxpayer
Focus on the
most serious offenders
dollars
of prosecution cases
resolved
through tools such as plea bargaining
within plea bargain standards
Legal Advice & Counsel Legal Documents
Support the city to make informed policy decisions based on timely and quality
legal advice
Good-Excellent scores on 90% of all
client satisfaction surveys
and council
MISSION
The Mission of the City Attorney's Office is to provide legal services to the City Council, Boards and Commissions and Administrative Staff so they can enforce the law, avoid or mitigate risks associated with City operations and protect the legal interests of the City of Arvada.
Aligns with City Council Goals
BUDGET 2013 Actual 2014 Actual 2015 Revised 2016 Budget
$1,497,513 $1,936,910 $1,975,780 $2,038,361 59
EMPLOYEES 2013 Actual 2014 Actual 2015 Revised 2016 Budget
10.00 11.00 13.00 13.00
HIGHLIGHTED STRATEGIC RESULTS
For the purposes of judicial economy 95% of prosecution cases resolved within the parameters of CAO-adopted plea bargain standards (both mail-in and face-to-face plea bargains). 100% 75% 50% 25% 0
Jan
Feb
Mar Apr
May Jun
Jul
Aug Sep
Oct
95% of litigation matters resolved were scored at a level 4 or 5 as outlined in the client satisfaction survey. 2nd Quarter 2015 at 100%. No litigation cases resolved in 3rd Quarter, thus no surveys in that quarter.
90% of training provided was scored at a level 4 or 5 as outlined in the client satisfaction survey.
Exceeding Goal
100% 75% 50% 25% 0
Apr-Jun 2015
Jul-Sep 2015 60
City Manager’s Office
AREAS OF FOCUS Community and Civic Engagement
STRATEGIC RESULTS
CREATE
customers service rating
with passport applicants
cultural commission
Fair and Open Government
begin work in 2016
Sustainable and Vibrant Community
95%
Good or Superior
95%
staff recommendations
Service Excellence Economic , Vitality and Infrastructure
are ADOPTED by City Council
Create & foster a
Justice Center Conceptual Plan
performancebased culture
REFINED
in 2015
MISSION
The Mission of the City Manager's Office is to provide leadership, policy, guidance and communication services to City Council, the community and the organization so they can successfully create a vibrant, safe, secure, and sound community.
Aligns with City Council Goals
BUDGET 2013 Actual 2014 Actual 2015 Estimate 2016 Proposed Revised
EMPLOYEES 2013 Actual 2014 Actual 2015 Estimate 2016 Proposed Revised
$2,920,333 $4,129,886 $6,190,937 * $4,508,339
*Includes $1,255,000 for Jefferson Parkway Public Highway Authority
61
18.95 21.95 20.95 20.95
HIGHLIGHTED STRATEGIC RESULTS
“Ask Arvada” respondents had expectations Met or Exceeded
By 2019, the City will continue to grow a culture of FOCUS on the customer as evidenced by: 90% of “Ask Arvada” respondents had their expectations Met or Exceeded
Within Reach of Goals!
100% 90% 80%
Jan-Mar Apr-Jun Jul-Sep Oct-Dec 2014 2015
Staff Recommendations Adopted by Council
By 2018, the City Manager’s Office will align to the City Council Strategic Plan and policies as evidenced by: a. 95% of staff recommendations to City Council are adopted by Council b. 50% of City employees open the Weekly Brief employee newsletter 100%
75%
Jan Feb Mar Apr May Jun Jul Aug Sep Oct Nov Dec 2014 2015
Averaging 63.6% of City employees who open the Weekly Brief employee newsletter in 2015.
All City Services listed in the 2015 Citizen’s Survey average a 70% rate of “satisfied” or “very satisfied” 75% 70%
Continue 65% to Engage 60% Citizens 55% 50%
2007
2009
2011
2013 62
2015
Community Development
AREAS OF FOCUS
RESULTS
99%
City Planning and Development
of residential code violations resolved
Neighborhood Services
without formal enforcement action
Housing Preservation and Resources
80% of plan reviews completed within 4 weeks
20
single family essential home repair grants provided in 2015
25% of new housing will incorporate a mix of lot size, density, styles & types
50%
of identified neighborhoods have
an organized community group
by 2019
by 2019
MISSION
The mission of the Community Development Department is to provide land use planning, affordable and quality housing, neighborhood engagement, and property code compliance services to the City and Community of Arvada so they can live and work in a well-planned, safe, and vibrant city for current and future generations. Aligns with City Council Goals
BUDGET 2013 Actual 2014 Actual 2015 Revised 2016 Budget
EMPLOYEES 2013 Actual 2014 Actual 2015 Revised 2016 Budget
$7,418,357 $7,983,221 $8,641,862 $7,817,972 63
24.00 25.00 26.00 27.00
HIGHLIGHTED STRATEGIC RESULTS
By December 31, 2015, 80% of initial development plan reviews completed within 4 weeks.
Positive Progress
100% 75% 50% 25% 0
80%
Jan Feb Mar Apr May Jun Jul Aug Sep Oct Nov Dec 2015 2015 2015 2015 2015 2015 2015 2015 2015 2015 2015 2015
By 2019, 50% of identified neighborhoods without organized groups (as of end of 2013) have organized neighborhood associations, HOAs, Councils or other leadership/engagement groups with whom the city can liaison.
100% 75% 50% 25% 0
Jan-Mar
Apr-Jun
Jul-Sep
2014
Oct-Dec
2015
Achieve HUD CDBG 1.5 expenditure timeliness ratio or less. 2
1.5
1 0 -2 Jan-Mar
Apr-Jun
Jul-Sep 2015
64
Oct-Dec
Finance
AREAS OF FOCUS
STRATEGIC RESULTS
Revenue, Accounting and Financial Analysis
90% of claiments
contacted within
$74+ Million
Strategic Partnership
2 business days
85%
of businesses are
VOLUNTARILY COMPLIANT
in sales & use tax collected in
2015
2015
Review & Update
75%
of major purchases are the result of strategic partnerships with Finance
10-year financial plan annually
AA Maintain
AA bond rating or better
MISSION
The mission of the Finance Department is to provide strategic partnerships, revenue and financial management, procurement and risk management services to City Council, Departments and the Community so they can make informed decisions, achieve desired results and thrive in a financially stable City.
Aligns with City Council Goals
BUDGET 2013 Actual 2014 Actual 2015 Revised 2016 Budget
$21,011,785 $21,506,317 $25,717,543* $22,813,228
EMPLOYEES 2013 Actual 2014 Actual 2015 Revised 2016 Budget
*Includes an additional $3,196,146 transfer to the Capital Improvement Projects Fund
65
41.00 35.00 33.70 33.70
HIGHLIGHTED STRATEGIC RESULTS
Maintain a AA or Better Bond Rating In February of 2015, Fitch conducted a surveillance review for the 2009 and 2013 Sales and Use Tax Bonds. After the review, Fitch affirmed the 'AAA' rating and state "Arvada's financial position is very strong, characterized by large reserves, ample liquidity and resilient revenue sources 30% of Businesses File Sales and Use Tax Returns by End of the Year 2015
Positive Progress
30.00% 25.00% 20.00% 15.00% 10.00% 5.00% 0.00%
Jan
Feb
Mar
Apr
May
Jun
Jul
Aug
Sep
Oct
1:10 Ratio of Workers Comp Claims to Employee
On Track
1,131 Employees
Goal: 113 Employees
64 Claims through Oct 2015 66
Human Resources
AREAS OF FOCUS Workforce and Strategic Partnerships
STRATEGIC RESULTS Promote health & wellness
Compensation, Benefits and Wellness
By 2018, city premium cost increase will be
lowered to 4% annually
100%
of departments create WORKFORCE PLANS in 2015
the right people are in the right places
Achieve
Top Workplace recognition from the Denver Post in 2015
Employment
90% of management positions will have a
succession plan
Connecting
in place by 2016
employee performance to the city strategic plan
MISSION
The Mission of the Human Resources Department is to provide strategic partnership, workforce management and development services to all City Departments so they can have the healthy, engaged, high performing workforce they need to achieve their operational and strategic results.
Aligns with City Council Goals
BUDGET 2013 Actual 2014 Actual 2015 Revised 2016 Budget
EMPLOYEES 2013 Actual 2014 Actual 2015 Revised 2016 Budget
$1,133,802 $1,388,351 $1,816,195 $1,738,750 67
9.00 9.00 9.00 9.00
HIGHLIGHTED STRATEGIC RESULTS
By 2015, the Human Resources Department will be a Strategic Partner with City departments as evidenced by 100% Annual Workforce Planning Consultations provided by HR. 100% 50% 0%
Jan-Mar Apr-Jun
Jul-Sep
Oct-Dec
The City will promote health and wellness, continue to provide quality health care options and manage costs in a long-term, sustainable manner as evidenced by: By 2018, 4% or less annual healthcare premium increases over the previous year. 12% 11% 10% 9% 8% 7% 6% 5% 4% 3% 2% 1% 0% -1% -2%
2011
2012
2013
2014
2015
2016
By 2017 Arvada employees will consider the City an Employer of Choice as reflected by: A Top Workplace designation in the “Top Workplaces� employee survey sponsored by the Denver Post which will take place in December 2014.
The City was selected as a Denver Post Top Work Place for 2015, and was the only municipal government recognized. Arvada was also named a Denver Post Top Work Place in 2012 68
Innovation and Technology Management
AREAS OF FOCUS Technology Infrastructure and Operations
STRATEGIC RESULTS Support innovative technology uses city-wide
90%
Technology and Project Management Services
of technology projects involve ITM team from onset through life cycle
Business Systems
Collaborative partnerships with city departments
COMPLETE
100%
City Conduit MAP
of regulated business systems adhere to
in 2015
MISSION
information security parameters
The Mission of the Innovation and Technology Management Department is to provide collaborative research analysis, software, hardware and project management services to City of Arvada Departments so they can serve our community.
Aligns with City Council Goals
BUDGET 2013 Actual 2014 Actual 2015 Revised 2016 Budget
EMPLOYEES 2013 Actual 2014 Actual 2015 Revised 2016 Budget
$6,976,666 $5,253,678 $7,817,158 $6,556,975 69
27.00 27.00 29.00 29.00
HIGHLIGHTED STRATEGIC RESULTS
100% of staff achievement plans completed each calendar year
100%
Continued Efforts
75% 50%
Jan-Mar
Apr-Jun
Jul-Sep
2014
Oct-Dec 2015
By 2016, 80% of business systems are up to date on current supported versions
100%
80% 75%
Jan Feb Mar Apr May Jun Jul Aug Sep Oct Nov Dec 2014
2015
90% technology projects will involved the ITM Department at inception and throughout project life cycle to ensure consistency and compatibility of systems.
100% 95% 90% 85% 80% 75% 70%
90%
Jan Feb Mar Apr May Jun Jul Aug Sep Oct Nov Dec 2014
2015 70
Municipal Court
AREAS OF FOCUS
STRATEGIC RESULTS
Judicial Judicial Support
75%
of juvenile cases meet sentencing requirements aimed @ changing behavior & decision making
95%
of judicial cases RESOLVED within
% 100 security
80% of offenders DO NOT re-offend within
2 years
screening
MISSION
120
D AY S
in Arvada
The Mission of the Municipal Court is to provide judicial and court record services to defendants, victims, court participants and the general public so they can have a fair and impartial process for determining the consequences of illegal behavior.
Aligns with City Council Goals
BUDGET 2013 Actual 2014 Actual 2015 Revised 2016 Budget
EMPLOYEES 2013 Actual 2014 Actual 2015 Revised 2016 Budget
$953,553 $1,162,864 $1,248,999 $1,309,282 71
10.00 11.00 11.00 11.00
HIGHLIGHTED STRATEGIC RESULTS
% of juvenile defendants completing Judge Mentor Program
Ongoing Focus
100% 75% 50% 25% 0
Jan Feb Mar Apr May Jun
Jul Aug Sep Oct Nov Dec
2014
2015
% of adult defendants who do not incur additional charges in Arvada within two years (non-traffic defendants) Within Reach of Goal
100% 75%
94% 94%
50% 25% 0
January 2014 thru October 2015
By 2017, a comprehensive security plan will be in place for courtrooms (Division 1 and 2). In Progress
Progress to date: 100% of people attending court sessions are being screened before entering courtrooms. Weapon tracking is occurring to identify types of weapons entering the building. 72
Parks, Golf, and Hospitality
AREAS OF FOCUS
STRATEGIC RESULTS
Parks
$2.8 M
Golf
revenue generated from hospitality services
Hospitality
in 2015
New club house facility at
West Woods Golf Club built by 2019
All identified & approved
trail gaps are completed
PARK MASTER PLAN developed and published in 2015
by 2019
MISSION
The mission of the Parks, Golf & Hospitality Department is to provide parks, urban design, golf, banquet, event, trails and environmental education services to the Arvada community and visitors so they can play, celebrate, and engage in the vitality of our welcoming community.
Aligns with City Council Goals
BUDGET 2013 Actual 2014 Actual 2015 Revised 2016 Budget
EMPLOYEES 2013 Actual 2014 Actual 2015 Revised 2016 Budget
$13,311,264 $13,506,240 $15,260,762 $14,990,930 73
69.00 73.00 73.00 75.00
HIGHLIGHTED STRATEGIC RESULTS
Arvada parks and athletic fields meet published maintenance standards between April and October (growing season) and between November and March (dormant season). 100% Adding Staff to 75% Help Meet 50% Standards 25% 0
95% Target
Jan Feb Mar Apr May Jun Jul Aug Sep Oct Nov Dec 2014
2015
Total revenue and golfers served from all Arvada Golf program services January-December 2014 Golfers Restaurant Guests Revenue 90,939 116,724 $4,654,184
January-September 2015 Revenue Golfers Restaurant Guests $4,457,236 76,944 139,208
Total 207,663
Total 216,152
Total revenue and guests served from all Arvada Hospitality program services January-December 2014 Guests Revenue 52,877 $2,811,508
January-September 2015 Revenue Guests $2,219,160 36,750
74
Public Safety
AREAS OF FOCUS
STRATEGIC RESULTS
Field Services
Decentralized Policing
80%
Operations
RESOLVE issues using resources at
follow-up and closure
Increased outreach & education through
social media
the sector level
on all identified citizen calls for service
Continued strong partnerships within our
school district Established Relationship
with 50% of neighborhood HOAs to better understand the needs of the community
90% of surveyed
citizens feel safe in their homes and community
MISSION
We, the members of the Arvada Police Department pledge: and one another. DEDICATION to service and professionalism. and ethical conduct. We will always strive for excellence.
RESPECT for the law, our community RESPONSIBILITY for public safety
Aligns with City Council Goals
BUDGET 2013 Actual 2014 Actual 2015 Revised 2016 Budget
EMPLOYEES 2013 Actual 2014 Actual 2015 Revised 2016 Budget
$32,473,715 $30,018,498 $30,625,070 $31,024,248 75
232.40 233.50 235.50 241.50
HIGHLIGHTED STRATEGIC RESULTS
By 2017, 90% of emergency calls will have less than 5 minutes response time.
Ongoing Efforts
100% 90% Target
75%
1Q 2014
2Q 2014
3Q 2014
4Q 2014
Adam
1Q 2015
Baker
2Q 2015
3Q 2015
Charlie
By 2017, 80% of identified citizen-initiated calls for service will receive follow-up from department members regarding their request. 80% Target
75%
Marked Improvement. Continued 50% Focus. 25%
1Q 2014
2Q 2014
3Q 2014 Adam
4Q 2014
1Q 2015
Baker
2Q 2015
3Q 2015
Charlie
By 2015, 8% of CSI investigations will result in a CODIS (COmbined DNA Index System) or AFIS (Automated Fingerprint Indentification System) hit. On Track
10%
8% Target
5% 0%
1Q 2015
2Q 2015
3Q 2015
4Q 2015
76
Public Works
AREAS OF FOCUS
STRATEGIC RESULTS
Engineering 95% of citizens
Facilities Management
surveyed agree that their community is
clean
Flood Control Geo Data Streets Infrastructure
PCI
pavement condition index study completed in 2015
1050
new parking spaces supporting the
Goldline in 2016
MISSION
The mission of the Public Works Department is to provide engineering, Geo Data and infrastructure services to the City and Community of Arvada so they can experience a safe, vibrant and prosperous community.
Aligns with City Council Goals
77
$8M
in public improvements built as the result of construction plan review in 2015
HIGHLIGHTED STRATEGIC RESULTS
Costs expected to be associated with curbside clean-up
$350,000
Target $325,000
Actual $346,659
Just Over Target
$325,000 $300,000 $275,000 $250,000
Six full street sweepings per year
0
0
0
.5
.5
1
1
1
1
1
-
-
Jan Feb Mar Apr May Jun Jul Aug Sep Oct Nov Dec
3,000 inspections for one-time spot location street or utility improvements or repairs
700 600 500 400 300 200
Jan Feb Mar Apr May Jun Jul Aug Sep Oct Nov Dec
2014 (3,160)
2015 (4,276 thru November) 78
Utilities
AREAS OF FOCUS
STRATEGIC RESULTS
Customer Information Services Reduce citizen water usage
Administration
from 146 to 139 gallons per day
Drinking Water
80 %
of sewer mains cleaned annually
Promoting CLEAN waterways Treating and delivering
Wastewater Collection & Disposal
5.6 Billion
98% of building
inspection requests completed on the
Stormwater Services
gallons of water annually
same day scheduled
Building Safety Fleet Services
45%
Increase customer usage of
vehicles capable of using
online tools
alternative fuels by 2016
MISSION
The Mission of the Utilities Department is to provide city fleet services, safe drinking water, wastewater treatment, storm water management, and safe building construction services to the members of the Arvada community so they can confidently assume a reliable supply of safe, high quality drinking water, have buildings constructed to the highest quality standards, and the safe disposal of sewage.
Aligns with City Council Goals
BUDGET 2013 Actual 2014 Actual 2015 Revised 2016 Budget
EMPLOYEES 2013 Actual 2014 Actual 2015 Revised 2016 Budget
$48,498,850 $40,557,274 $54,435,244 $52,367,935 79
109.75 115.75 120.75 118.75
HIGHLIGHTED STRATEGIC RESULTS
98% of building inspections conducted on the day scheduled
100%
98%
75% 50%
Jan
Feb
Mar
Apr May
Jun
Jul
Aug Sep
2014
Oct
Nov Dec
2015
90% of water quality investigations (taste and odor, fit for consumption, other) completed within 72 hours
Exceeding Goal for Two Years
2014 - 100%
2015 thru August - 100%
0%
90% 100%
80% of the wastewater system that is cleaned annually (industry standard is 33%)
100%
80%
2012
2013
2014
50%
2011
75% 2010
On Track
105.9%
101.5%
91.1%
72%
76.5%
80
Capital Improvements This updated Capital Improvement Plan (CIP) for 2016 represents the second year of a new comprehensive CIP plan that encompasses a long-term and strategic approach for the City’s capital maintenance and capital investments for the next decade (see the Capital Improvement Plan 2015-2024). As with the City’s first ten-year CIP beginning in 2013, the basis of this Plan is based on three major priorities: • • •
“Taking Lasting Care” (TLC) of our current physical assets “Building our Base” – completing investments we have started Building for the future
Among TLC undertakings, we are recommending over $8 million in capital maintenance for 2016. Highlights include: • Allocation of resources for traffic signal replacements, long-life pavement markings, guardrails, and sign replacements as these assets age • Reinvestment in parks focused in four major areas: irrigation replacement, playground renovation, trail renovation and tree replacement • Provision of significant capital maintenance for golf courses and replacement of equipment in our Hospitality operation • Water system and sewer system maintenance and replacement, including mains and ancillary infrastructure In the area of “Building on the Base” the following are some of the areas of focus: • The Plan includes initial funding for substantial future improvements at the intersection of West 72nd and Indiana Street. Also included is ongoing funding to install optical fiber and conduit in various places throughout the City, safety improvements at existing intersections, and expanded vehicle detection upgrades at signalized intersections. • The Parks Department focuses on setting aside over $350,000 annually to meet long-term irrigation and parking needs at the Stenger Sports Complex. • The Department of Utilities will begin drainage improvements on the Yankee Doodle Outfall System, as well as continue funding sewer system extensions into various parts of the City. The Revised CIP recommends various new improvements throughout the City, including initial funding for a new Kipling Street access to Red Rocks Community College. The Plan also contemplates continued participation by the City’s Water Utility in the expansion of the Gross Reservoir in Boulder County. However, the primary focus of resources for capital improvements is the Gold Line in the form of the First Phase of Transit-oriented Development (TOD) in the area to surround the Olde Town Station. These TOD facilities include a 600+ parking space garage, bus transfer facility, and various other changes that will both accommodate the use and enjoyment of the Gold Line and facilitate further redevelopment in the area. The total budgeted capital expenditures by major category for 2016 are listed below. The remaining pages of the capital improvement section explain the process of how capital improvement projects are budgeted, how the city pays for the projects and a detailed summary of capital expenditures. 2016 Budgeted Capital Expenditures Category General Government Transportation Parks, Golf & Hospitality Utilities Total
81
2016 Budget $ 4,747,091 3,121,866 2,026,281 12,485,728 $22,380,966
Capital Improvements What are Capital Improvements? The Capital Improvement Plan (CIP) is a ten-year road map for creating, maintaining and paying for Arvada’s present and future infrastructure needs. The CIP outlines project costs, funding sources and estimated future operating costs associated with each capital improvement. The plan is designed to ensure that capital improvements will be made when and where they are needed and that the City will have the funds to pay for and maintain them. Capital improvement projects are non-routine capital expenditures that result in the acquisition of land, design and construction of new assets, or the renovation, rehabilitation or expansion of existing capital assets. Capital projects usually have an expected useful life of at least five years. Capital improvements make up the bricks and mortar, or infrastructure that all cities must have in place to provide essential services to current residents and support new growth and development. They are also designed to prevent the deterioration of the City’s existing infrastructure such as roads, parks, buildings and underground pipes for water and sewer systems, and respond to and anticipate future growth of the City. Capital Budgeting Process The following graphic outlines the City of Arvada’s ten-year Capital Improvement Plan process: • Council reviews progress of past successes in first quarter of year. • Re-establishes priorities in context of new information, studies, surveys.
• Departments begin various legal processes to begin the construction processes. • Quarterly reporting on all progress.
Development of Strategic Plan
Develop ten-year capital maintenance and new projects to meet long-term strategic needs
Build and Measure
Council adopts both the two-year appropriations and the ten-year plans
• Analyze prior year expenditures. • Identify all possible sources of resources. • Develop prioritization methodology to meet Strategic Plan. • Analyze and select proposed projects for plan and for the ten-year planning horizon.
• Council reviews Proposed Plan. • Adopts two-year appropriations. • Prioritizes unfunded priorities and projects. • Adds operating costs into the operating budget.
In our first year of this new process, we met with each department and identified the progress of all projects. This process resulted in the recognition that there was excess funding in some projects or that the original project was no longer necessary or feasible. This provides the first monies we can allocate towards new capital needs.
82
Capital Improvements The second step was to design allocation methodology, recognizing that the needs always outpace the available resources. Through discussions with Council, surveys, and citizen guidance, the priorities for the 2016 allocation process were the same as in 2015: • Taking Lasting Care • Building our Base • Investing for the Future Departments then reviewed their ten-year proposals. Discussions were held with the City Manager on the highest priorities in each of these areas. The criteria used to evaluate the projects include: • • • • • •
Legislative or legal mandate Health or safety improvement Number of citizens benefitted Council strategic goal Completion of a missing link Economic impact on the City
This process results in the Capital Improvement Plan presented to City Council. Paying for Capital Improvements In many respects, the planning process for selecting, scheduling and financing capital improvements parallels the way an individual might plan for buying a house or a car. This process entails assessing many competing needs, determining priorities, evaluating costs and financing options and establishing a realistic timeline for completing the projects. Since the electors of Arvada adopted a sales tax in 1969, the City Code has required that, among other things, 60% of the first cent of sales tax revenue must be appropriated annually for capital projects or debt service. Being codified as §98-101, this funding is referred to as 98-101 funding. The funding for 2016 is calculated as follows: Funding 98-101 Debt service obligations Transfer to the capital improvement program
2016 $9,413,952 (4,345,237) $5,068,715
Other City dollars include the following sources: • An additional transfer of $2,585,327 from the General Fund to help finance First Phase TOD Improvements. • Water, Wastewater and Stormwater rates will pay for the necessary capital projects in those Funds. • Golf and Hospitality revenue will meet all of the identified needs in their respective Funds. • External Dollars are identified grant dollars or monies from another intergovernmental agency. Each year, as capital projects are planned and others are completed, the costs related to maintaining those capital assets are examined. Many times we are able to absorb these costs into our operations. There are also situations where we need to add additional staff and supplies. Examples of this may be the addition of park maintenance staff when a new park is completed or an increase in utility expenditures when new street lights or signals are added. In the capital project summary, the cost of the project is shown as well as the impact of the project on the operating budget.
83
Capital Improvements Capital Improvement Program Categories The City has divided its 2016 capital improvement program into three major categories based on the type of improvement that is being constructed. Parks, Golf, and Hospitality The parks system includes regional, community and neighborhood parks, as well as the trails that link neighborhoods to parks. This category also includes the “Taking Lasting Care” component of the parks capital improvement program which includes major capital maintenance of existing parks or park infrastructure, including playground and trail renovation, tree replacement and irrigation systems. Projects related to the City’s Golf and Hospitality enterprises also fall into this category. Transportation This category includes all transportation infrastructure within the City limits. This includes roads, bridges, traffic signals and bike lanes. Utilities This category includes improvements for all water, wastewater and stormwater infrastructure, including water treatment plants and the water and wastewater transmission systems. The Utilities department maintains its own capital improvement plan which is prepared in conjunction with the rate model and the City’s Comprehensive Plan, to prioritize and plan for future capital needs. Within each of the four major categories, the City differentiates between recurring capital expenditures and nonrecurring capital expenditures. Recurring Capital expenditures receive consistent funding for ongoing capital infrastructure needs throughout the City and ensure that General CIP dollars are available for improvements in particular areas. Their creation grew out of the recognition that, while some recurring needs are relatively small in scope, it was still imperative that resources be reserved to fund necessary work. Routine capital expenditures generally will have no significant impact on the operating budget. Nonrecurring capital expenditures generally receive one-time funding for the construction of a public facility or acquisition of land for a future pubic facility. Any ongoing operating and maintenance costs related to these projects have been identified on the next page in the column listed as O&M. These estimates have also been included in our operating budget. FOCUS Strategic Goals As mentioned earlier in this document, implementation of the City’s Performance-Based Budgeting FOCUS is well underway. In 2013, the City Council adopted four major priority areas and 30 strategic results that define measures of success for each area. A majority of the strategic goals are long-term capital projects, many of which have not been funded in the updated ten-year Capital Improvement Plan. These strategic goals were revised in 2015 and are listed below: • By December 31, 2015, Arvada Ridge Transit-Oriented Development site vehicle and pedestrian access improvements will be evaluated and presented to Council and by January 1, 2019 selected improvements will be completed • Beginning 2016, all right of way for the Jefferson Parkway will be legally described and committed to the JPPHA and the CDOT Section 1601 Environmental Review process will be initiated as the next actions needed to construct the Parkway
84
Capital Improvements • By 2015, partner with RTD to provide 300 parking spaces at Sheridan Gold Strike Transit Station and 150 parking spaces at Arvada Ridge Transit Station and by July 2016, partner with RTD to provide 400 spaces for RTD commuters and approximately 200 additional parking spaces at the Olde Town Arvada Transit Hub in an efficient and sustainable manner • By 2019, 20% of all sidewalk gaps selected from the Transportation Committee inventory and approved by City Council will be built according to the then-current code requirements • By 2015, a Pavement Condition Index (PCI) assessment will be completed and a Streets Capital Maintenance Plan will be submitted to City Council for consideration • By 2019, the City will have 100% of the water needed for build‐out of the City as defined by the Comprehensive Plan • By 2015, complete a Comprehensive City Conduit Map identifying key conduit pathways and by 2019, 80% of the pathways have conduit • By December 31, 2019, 100% of all identified trail gaps and connection points recognized in the City’s Parks, Trails and Open Space Master Plan and Bicycle Master Plan as identified by the Arvada Park Advisory Committee and as approved by City Council are built/completed • By 2015, staff will refine the conceptual plan for the Justice Center, give consideration to all available options and provide a recommendation to City Council in order to accommodate emerging safety requirements for the public • By December 31, 2019, West Woods club house and related facilities are replaced The total of all the identified projects will likely require a significant amount of funding that will not be available within the current time frame based on current revenue and expenditure projections. However, we may have opportunities to meet many of these goals over the next ten years using a long-term strategic plan guiding our allocation and prioritization. Staff will continue to work to obtain cost estimates and prioritize these goals throughout the term of this budget. Additionally, the final report issued by the 2015 Citizens Capital Improvement Planning Committee will further instruct long-term planning for the 2017-18 capital planning process. 2017-2024 Proposed Capital Expenditures Listed below are six areas we wish to highlight. These represent proposed capital expenditures through the 2017-2024 capital planning model. Transportation Traffic Signal Replacement - $7.6 million Intersection Safety Improvements - $800,000 Arterial Road Improvements - $7 million Leyden Road Improvements - $9 million Facilities Park Maintenance Complex - $16 million Candelas Police Community Station - $5 million Ralston Recreation Facility - $5 million Central Stores & Archive Facility - $2.5 million Parks Playground Renovations - $5 million Irrigation System Renovations - $2.6 million Gold Strike Park - $1.7 million Stenger Sports Complex - $2 million
85
Capital Improvements Arvada Center Public Art - $500,000 Arvada Center Facility Improvements - $250,000 Sidewalks and Trails Sidewalk Gaps Completion - $3 million Sidewalk & Trail Improvements - $5.4 million Trail Renovation - $500,000 Ralston Road & Simms Ralston Road Reconstruction - $16.6 million Simms Street Improvements - $13.5 million
2017-2024 Proposed Capital Expenditures
Transportation Facilities Parks Arvada Center Sidewalks and Trails Ralston & Simms
Transportation Facilities Parks Arvada Center Sidewalks and Trails Ralston & Simms
$43,703,744 $28,552,322 $16,648,936 $721,694 $10,550,684 $30,100,000
2016 Capital Expenditure Detail The table on the following two pages presents detail of the City’s 2016 capital expenditures. Capital expenditures are presented in major categories. Many major categories have recurring capital projects which are designated from capital projects that are considered one-time expenditures. The sources of funding are presented for each capital project as well as the impact to the operating budget.
86
Capital Improvements 2016 PLAN SUMMARY
2016
DEPARTMENT/DIVISION R R R R R R R R R R R R R NR NR R NR
ยง98-101
TRANSPORTATION Collector Street Improvements ADA Ramps Adams County Transportation Projects* W. 72nd Ave. and Indiana St. Improvements - Construction Safe Routes to School Program Intersection Safety Improvements New Traffic Signal Construction Vehicle Detection Program Signal Replacement UPS at Major Intersections Long Life Pavement Markings Program Sign Replacement; MUTCD Mandates ATMS Completion and Upgrades Optical Fiber and Conduit Interconnections Red Rocks - Arvada Ridge Station Access Circulator Study Guardrails FACILITIES Gold Line TOD Improvements - Phase I PARKS Irrigation System Renovation Playground Renovation Trail Renovation Stenger Sports Complex Tree Replacement Program Adams County Open Space Projects* Leyden Creek Trail
54,636 54,636 103,000 21,855 114,736 300,500 43,260 827,090 42,616 92,700 21,855 54,636 200,000 175,000 80,000 25,000 1,930,014
R R R CM R R NR NR Meadowglen Park/Pomona Lake Shore Reconstruction and Trail Improvements GOLF CM West Woods Golf Club Irrigation System Replacement CM West Woods Golf Club Pond Aeration Systems NR Lake Arbor Golf Course Tee Construction CM West Woods Golf Club Hole #8 - Sleeping Indian Remodel HOSPITALITY CM Refrigeration and Freezer Space Replacement ARVADA CENTER NR Arvada Center Master Plan R Public Art WATER NR Denver Water Moffat Project Participation CM Water System Replacement WASTE WATER CM Sewer System Replacement NR Sewer System Extensions R Access Improvements STORMWATER CM Flood Recovery NR Yankee Doodle Outfall Systems CAPITAL PROJECT FUNDING ALL DEPARTMENTS AND DIVISIONS * = Not Appropriated; R = Recurring; NR = Nonrecurring CM = Capital Maintenance/Replacement
87
300,500 54,636 382,454 16,391 154,500 51,500 5,101,516
Other City Other/TBD 2016 Total PW - TRANSPORTATION 54,636 54,636 65,564 65,564 515,000 412,000 98,345 120,200 114,736 300,500 43,260 827,090 42,616 92,700 21,855 54,636 200,000 175,000 80,000 25,000 PW - FACILITIES 2,585,327 4,515,341 PG&H - PARKS 158,352 158,352 300,500 54,636 486,999 104,545 16,391 27,318 27,318 618,000 772,500 150,000 400,000 250,000 PG&H - GOLF 2,567,908 2,567,908 79,550 79,550 42,070 42,070 6,010 6,010 PG&H - HOSPITALITY 109,273 109,273 ARVADA CENTER 180,250 180,250 51,500 UTILITIES - WATER 4,340,000 4,340,000 4,207,550 4,207,550 UTILITIES - WASTEWATER 2,081,385 2,081,385 669,500 669,500 51,500 51,500 UTILITIES - STORMWATER 1,030,225 1,030,225 105,568 105,568 15,779,141
4,161,099
25,041,757
O&M
546 1,142 -
Capital Improvements Capital Improvement Projects TRANSPORTATION Collector Street Improvements ADA Ramps Adams County Transportation Projects* W. 72nd Ave. and Indiana St. Improvements - Construction Safe Routes to School Program Intersection Safety Improvements New Traffic Signal Construction Vehicle Detection Program Signal Replacement UPS at Major Intersections Long Life Pavement Markings Program Sign Replacement; MUTCD Mandates ATMS Completion and Upgrades Optical Fiber and Conduit Interconnections Red Rocks - Arvada Ridge Station Access Circulator Study Guardrails
FACILITIES Gold Line TOD Improvements Phase I
Recurring funding to cover relatively minor improvements to collector streets Recurring funding to pay for sidewalk ramps throughout the City Recurring funding from Adams County for transportation projects where Arvada lies in Adams County Funding for actual improvements at intersection conditioned on DRCOG grant Recurring funding to match federal Safe Routes to School grants Recurring funding for intersection safety improvements throughout the City Recurring funding to finance new traffic signals in the City where warranted Recurring funding to finance intersection vehicle detection for traffic signal timing Recurring funding to replace aged traffic signals throughout the City Recurring funding to add uninterruptible power supplies to signalized intersections throughout the City Recurring funding to add long life pavement markings along with major street maintenance projects Recurring funding to upgrade traffic signs throughout the City to current standards Recurring funding to finance traffic signal interconnectivity and control systems Recurring funding to install optical fiber and fiber conduit throughout the City Funding for design to construct direct access to the Red Rocks campus from Kipling Street Funding to study the feasibility of a circulator bus service within the City Recurring funding to replace and install guardrails along City rights-of-way
Represents core of First Phase TOD improvements related to Gold Line
88
$54,636 $54,636 $65,564 $515,000 $120,200 $114,736 $300,500 $43,260 $827,090 $42,616 $92,700 $21,855 $54,636 $200,000 $175,000 $80,000 $25,000
$4,515,341
Capital Improvements PARKS Irrigation System Renovation Playground Renovation Trail Renovation Stenger Sports Complex Tree Replacement Program Adams County Open Space Projects* Leyden Creek Trail Meadowglen Park/Pomona Lake Shore Reconstruction and Trail Improvements
Recurring funding collected by Water utility for irrigation system upgrades Recurring funding to renovate and upgrade playgrounds throughout the City Recurring funding to renovate and improve trails throughout the City Multiyear funding for irrigation system replacement at the Stenger - Lutz Sports Complex Recurring funding to replace damage or destroyed trees throughout the City Recurring funding from Adams County for open space projects where Arvada lies in Adams County Funding for completing large section of Leyden Creek Trail northwest of 72nd & Simms Funding for completing repairs to the Pomona Lake shore and some trail improvements
$158,352 $300,500 $54,636 $486,999 $16,391 $27,318 $772,500 $400,000
GOLF West Woods Golf Club Irrigation System Replacement West Woods Golf Club Pond Aeration Systems Lake Arbor Golf Course Tee Construction West Woods Golf Club Hole #8 Sleeping Indian Remodel
Funding to replace the irrigation system at the West Woods Golf Club Funding to replace pond aeration systems at West Woods Golf Course Funding to improve various tees at Lake Arbor Golf Course Project for improvements at Hole #8 at West Woods Golf Course
HOSPITALITY Refrigeration and Freezer Space Replacement
Funding to replace Hospitality enterprise's food cooling equipment
$109,273
Funding for master plan for Arvada Center operations funds the acquisition of public art to be placed throughout the City
$180,250 $51,500
Funding for Arvada's share of Gross Reservoir Expansion costs Recurring funding for the replacement of water mains, meters, valves, and ancillary infrastructure
$4,340,000
ARVADA CENTER Arvada Center Master Plan Public Art
WATER Denver Water Moffat Project Participation Water System Replacement
89
$2,567,908 $79,550 $42,070 $6,010
$4,207,550
Capital Improvements WASTE WATER Sewer System Replacement Sewer System Extensions Access Improvements
STORMWATER Flood Recovery
Yankee Doodle Outfall Systems
Recurring funding for the replacement of sewer mains, vaults, and ancillary infrastructure Project to provide potential access to the City's sewer system in two existing subdivisions Recurring funding for improvements for access to sewer manholes throughout the City
$2,081,385
Funding to address areas and facilities exposed by September 2013 flooding as in need of drainage improvements Funding to improve drainage infrastructure along the Yankee Doodle Outfall System
$1,030,225
$669,500 $51,500
$105,568
THE FOLLOWING PAGES REPRESENT PROJECTS ADDED DURING THE 2016 PLANNING PROCESS.
90
0 0
O&M Costs
91
$2,031,821 No
0
0
206,000
139,050
0
66,950
2017
206,000
0
0
0
0
206,000
2017
0
218,545
147,518
0
71,027
2019
218,545
0
0
0
0
218,545
2019
0
225,102
151,944
0
73,158
2020
225,102
0
0
0
0
225,102
2020
COST ESTIMATE CONFIDENCE: LEGAL OBLIGATION TO COMPLETE?:
0
212,180
143,222
0
68,959
2018
212,180
0
0
0
0
212,180
2018
7 No
0
231,855
156,502
0
75,353
2021
231,855
0
0
0
0
231,855
2021
0
238,810
161,197
0
77,613
2022
238,810
0
0
0
0
238,810
2022
0
253,354
171,014
0
82,340
2024
253,354
0
0
0
0
253,354
2024
$0
$2,031,821
$1,371,479
$0
$660,342
TOTAL
$2,031,821
$0
$0
$0
$0
$2,031,821
TOTAL
Yes. Fiber/Conduit Interconnect.
RELATED TO COUNCIL STRATEGIC GOAL?
0
245,975
166,033
0
79,942
2023
245,975
0
0
0
0
245,975
2023
CONTINGENCIES: The timing of other infrastructure projects may influence location prioritizations.
OTHER RELEVANT PROJECT Other opportunities (e.g. Gold Line, CDOT, etc.) will also be identified for buildout and maintenance of the fiber‐optic interconnect. The INFORMATION: total project cost upon completion is estimated at $3.5M.
EXPLANATION OF NON §98‐101 None SOURCES (if any):
Utilities, Street Maintenance, and Arvada Police needs by connecting city buildings, field electronics, and monitoring stations for an efficient and well‐managed city.
NEEDS INTENDED TO FILL: The communication interconnect provides high speed data transfer and connectivity for Traffic assets. It can also benefit IT Department,
Traffic Signals in Arvada Public Works. The ATMS and Fiber/Conduit accounts are to be consolidated to allow projects to install the communication lines as well as the end devices (within traffic signals or at City facilities) and allow immediate use. Projects at major signalized intersections (such as set‐back detection and conduit placement) will occur with street reconstruction or resurfacing efforts.
PROJECT DESCRIPTION: Conduit and Fiber Interconnect allows communication between a centralized ATMS (Advanced Traffic Management System) and 98
TOTAL PROJECT COST: LAND/ROW ACQUISITION?:
135,000
0
Const. Costs
Total Proj Costs
200,000
0
65,000
0
2016
200,000
0
0
0
0
200,000
0
2015
0
0
0
0
0
0
2016
Design Costs
0
2015
Prelim Costs
USES
Total $
0
External $
TBD $
0
0
Other City $
Existing
Restricted City $
§98‐101 $
SOURCES
DEPARTMENT/DIVISION: Public Works / Engineering
PROJECT LOCATION: Various
PROJECT NAME: Optical Fiber and Conduit Interconnections
Capital Improvements
0 0
Total Proj Costs
O&M Costs
0
92
2017
0 0
0
1,500,000
1,500,000
2017
1,500,000
0
0
0
0
1,500,000
0
0
0
0
0
0
0
0
0
0
0
2019
2019
0
0
0
0
0
0
0
0
0
0
0
2020
2020
0
0
0
0
0
0
0
0
0
0
0
COST ESTIMATE CONFIDENCE: LEGAL OBLIGATION TO COMPLETE?:
2018
2018
8 No
2021
2021
0
0
0
0
0
0
0
0
0
0
0
2022
2022
0
0
0
0
0
0
0
0
0
0
0
2023
2023
0
0
0
0
0
0
0
0
0
0
0
2024
2024
0
0
0
0
0
0
0
0
0
0
0
TOTAL
CONTINGENCIES: None
OTHER RELEVANT PROJECT Preliminary design is complete and the preferred alternative has been selected. INFORMATION:
EXPLANATION OF NON §98‐101 None SOURCES (if any):
$0
$1,675,000
$1,500,000
NEEDS INTENDED TO FILL: This will provide more direct access from Kipling Parkway into the Red Rocks Community College and Arvada Ridge Station area.
College campus.
$0 $175,000
TOTAL
$1,675,000
$0
$0
$0
$0
$1,675,000
PROJECT DESCRIPTION: This project will install roadway access from Kipling Parkway into the Arvada Ridge development area and the Red Rocks Community
0
175,000
0
175,000
2016
175,000
0
0
0
0
175,000
2016
$1,675,000 Maybe
0
Const. Costs
TOTAL PROJECT COST: LAND/ROW ACQUISITION?:
0 0
2015
0
0
0
0
0
0
Prelim Costs
0
2015
Design Costs
USES
Total $
0
External $
TBD $
0
0
Other City $
Existing
Restricted City $
§98‐101 $
SOURCES
DEPARTMENT/DIVISION: PW/Eng
PROJECT LOCATION: Kipling Parkway at W. 56th Ave.
PROJECT NAME: Red Rocks ‐ Arvada Ridge Station Access
Capital Improvements
0
0
O&M Costs
93
0
2017
2017
0
0
0
0
0
0
0
0
0
0
0
0
0
0
0
0
0
0
0
0
0
0
0
0
0
740,000
740,000
2019
740,000
0
0
0
0
740,000
2019
2020
2020
0
0
0
0
0
0
0
0
0
0
0
COST ESTIMATE CONFIDENCE: LEGAL OBLIGATION TO COMPLETE?:
2018
2018
9 No
2021
2021
0
0
0
0
0
0
0
0
0
0
0
2022
2022
0
0
0
0
0
0
0
0
0
0
0
2023
2023
0
0
0
0
0
0
0
0
0
0
0
2024
2024
0
0
0
0
0
0
0
0
0
0
0
CONTINGENCIES: Demand is uncertain until Gold Line opens and revised RTD routes are in service.
OTHER RELEVANT PROJECT Priorities would be given to areas around Gold Line stations where riders exit commuter rail. Funding for a circulator was included in the INFORMATION: 2015 CCIPC's recommendations to City Council.
EXPLANATION OF NON §98‐101 None SOURCES (if any):
NEEDS INTENDED TO FILL: The study will help to determine if there is a demand for this service and predict ridership.
destinations.
$0
$820,000
$740,000
$0
$80,000
TOTAL
$820,000
$0
$0
$0
$0
$820,000
TOTAL
PROJECT DESCRIPTION: Study need/demand for a public circulator shuttle to transport pedestrians between Olde Town, the Arvada Center and other popular
$820,000 No
0
TOTAL PROJECT COST: LAND/ROW ACQUISITION?:
0
0
Const. Costs
Total Proj Costs
80,000
0
0
80,000
0
2016
80,000
0
0
0
Prelim Costs
2015
0
0
0
0
80,000
2016
Design Costs
USES
0
External $
Total $
0
Restricted City $
TBD $
0
0
Other City $
0
2015 0
Existing
§98‐101 $
SOURCES
DEPARTMENT/DIVISION: PW/Engineering
PROJECT LOCATION: Olde Town area to various destinations including Arvada Center
PROJECT NAME: Circulator Study
Capital Improvements
0 0
Total Proj Costs
O&M Costs
0 0
94
0 0
0
25,000
25,000
2017
25,000
0
0
0
0
25,000
2017
0 0
0 0
0
25,000
25,000
2019
25,000
0
0
0
0
25,000
2019
0 0
0
25,000
25,000
2020
25,000
0
0
0
0
25,000
2020
COST ESTIMATE CONFIDENCE: LEGAL OBLIGATION TO COMPLETE?:
0
25,000
25,000
2018
25,000
0
0
0
0
25,000
2018
0 0
8 No
0
25,000
25,000
2021
25,000
0
0
0
0
25,000
2021
0 0
0
25,000
25,000
2022
25,000
0
0
0
0
25,000
2022
0 0
0
25,000
25,000
2023
25,000
0
0
0
0
25,000
2023
0 0
0
25,000
25,000
2024
25,000
0
0
0
0
25,000
2024
$0 $0
$0
$225,000
$225,000
TOTAL
$225,000
$0
$0
$0
$0
$225,000
TOTAL
CONTINGENCIES: None
OTHER RELEVANT PROJECT Funding for guardrails was included in the 2015 CCIPC's recommendations to City Council. INFORMATION:
EXPLANATION OF NON §98‐101 None SOURCES (if any):
NEEDS INTENDED TO FILL: Eliminate safety hazards to motorists and pedestrians
Mitigation measures, in addition to the installation of guardrail, may include installing or extending culverts to eliminate a ditch or culvert end section or the removal of large roadside objects, where viable, that pose a hazard to the traveling public.
PROJECT DESCRIPTION: The project installs new guardrails or mitigates hazards that do not meet current City and AASHTO standards for roadside clear zones.
0
25,000
25,000
2016
25,000
0
0
0
0
25,000
2016
$225,000 Maybe
0
Const. Costs
TOTAL PROJECT COST: LAND/ROW ACQUISITION?:
0 0
2015
0 0
Prelim Costs
0
0
Design Costs
USES
Total $
0
TBD $
0
Restricted City $
External $
0
0
0
Other City $
2015 0
Existing
§98‐101 $
SOURCES
DEPARTMENT/DIVISION: Public Works / Engineering
PROJECT LOCATION: Varied
PROJECT NAME: Guardrails
Capital Improvements
95
$500,000 No
0
0
2017
2017
0
0
0
0
0
0
0
0
0
0
0
0
0
0
0
0
0
0
0
0
0
0
2019
2019
0
0
0
0
0
0
0
0
0
0
0
2020
2020
0
0
0
0
0
0
0
0
0
0
0
COST ESTIMATE CONFIDENCE: LEGAL OBLIGATION TO COMPLETE?:
2018
2018
7 No
2021
2021
0
0
0
0
0
0
0
0
0
0
0
2022
2022
0
0
0
0
0
0
0
0
0
0
0
2023
2023
0
0
0
0
0
0
0
0
0
0
0
2024
2024
0
0
0
0
0
0
0
0
0
0
0
$0
$0
$500,000
$400,000
$50,000
$50,000
TOTAL
$500,000
$0
$0
$250,000
$250,000
TOTAL
CONTINGENCIES: The trail is sufficiently undermined and may soon be closed to future use if shore line improvements do not occur.
OTHER RELEVANT PROJECT Neighbor input has occurred over several years and neighbor consensus is documented around the need for this project. INFORMATION:
anticipated General Fund surplus revenue & expenditure savings rounding out the project budget.
EXPLANATION OF NON §98‐101 Stormwater funds will be needed to reconstruct the north shore line as the lake is a stormwater control structure. Stormwater's SOURCES (if any): contribution will be $250,000 from its enterprise revenues. The $100,000 in 2015 represents residual capital dollars, with $150,000 in
valve is not operational and dredging is needed at the intake, west end of the lake.
NEEDS INTENDED TO FILL: North shore reconstruction may expose other dam and lake construction needs that may be added to this project. Currently, the drain
lake. Stormwater Funds may be available for the north shore reconstruction. However, trail reconstruction will be needed after the north banks are widened and reinforced. Trail construction funds are limited by neighborhood input to reconstruction of a 4' wide concrete trail and grassy landscape with an estimated cost of $75,000.
PROJECT DESCRIPTION: North shore collapse at Pomona Lake in Meadowglen Park is creating trail, vegetation and structural concerns along backyards facing the
TOTAL PROJECT COST: LAND/ROW ACQUISITION?:
O&M Costs
450,000
400,000
50,000
0
Total Proj Costs
Const. Costs
25,000
25,000
25,000
2016
400,000
0
0
250,000
150,000
0
25,000
2015
100,000
0
0
0
2016
Design Costs
0
0 100,000
2015
Prelim Costs
USES
Total $
0
External $
TBD $
0
0
Other City $
Existing
Restricted City $
§98‐101 $
SOURCES
DEPARTMENT/DIVISION: Park Department: Parks and Urban Design
PROJECT LOCATION: 81st Lane and Estes Street
PROJECT NAME: Meadowglen Park/Pomona Lake Shore Reconstruction and Trail Improvements
Capital Improvements
Capital Improvements
96
2015-2016 proposed revised BIENNIAL OPERATING AND CAPITAL BUDGET LONG-TERM DEBT OBLIGATIONS The following pages detail the City’s debt service obligations. General Obligation bonds are direct obligations which pledge the full faith and credit of the government and revenue bonds pledge specific revenue to pay debt service. The City does not have any outstanding general obligation debt. The City has the following revenue bonds outstanding as of December 31, 2015: Series 2009 Sales and Use Tax Refunding Revenue Bonds, with interest rates from 2.5% to 4.0% payable semiannually June 1 and December 1 and principal due annually to December 1, 2018. These bonds were issued for the purpose of advance refunding a portion of the City’s 1998 and 1999 Sales and Use Tax Revenue Refunding Bonds in order to realize interest savings of $2,686,000. Principal outstanding at December 31, 2015 is $8,035,000. Series 2013 Sales and Use Tax improvement Revenue Bonds, with interest rates from 2.0% to 5.0% payable semi-annually June 1 and December 1 and principal due annually to December 1, 2017. The City advance refunded $6,800,000 of the Series 2003 bonds to capture present value debt service savings of $606,019. Principal balance outstanding at December 31, 2015 is $2,950,000. Series 2009 Water Enterprise Revenue Refunding Bonds, with interest rates from 2.0% to 5.0% payable semiannually May 1 and November 1 and principal due annually to November 1, 2020. These bonds were issued for the purpose of advance refunding the Series 2001 Variable Rate Demand Water Enterprise Revenue Bonds in order to realize interest savings of $1,001,000. The bonds are payable solely from the net pledged revenues of the Water Enterprise. Principal outstanding at December 31, 2015 is $10,050,000. The City may issue general obligation securities only if the aggregate principal amounts of all such securities do not exceed 3% of the assessed valuation of the taxable property within the City as shown by the last preceding assessment. The legal debt limit for the City as of December 31, 2014 is $335,628,005. As of December 31, 2015, the City has no general obligation debt subject to this limitation.
97
2015-2016 proposed revised BIENNIAL OPERATING AND CAPITAL BUDGET Schedule of Debt Service Requirements Governmental Activities December 31, 2015
Sales and Use Tax Refunding and Improvement Revenue Bonds - Series 2009 Year
Principal
Interest
Total Payment
Principal Balance
2015 2016 2017 2018 Totals
8,035,000 2,045,000 2,105,000 3,885,000 $8,035,000
279,900 218,550 155,400 $653,850
2,324,900 2,323,550 4,040,400 $8,688,850
$
5,990,000 3,885,000 -
Sales & Use Tax Revenue Refunding Bonds - Series 2013 Year
Principal
Interest
Total Payment
2015 2016 2017 TOTALS
1,440,000 1,510,000 $2,950,000
147,500 75,500 $223,000
98
1,587,500 1,585,500 $3,173,000
Principal Balance 2,950,000 $
1,510,000 -
2015-2016 proposed revised BIENNIAL OPERATING AND CAPITAL BUDGET Schedule of Debt Service Requirements Business-Type Activities December 31, 2015
Water Enterprise Revenue Refunding Bonds - Series 2009 Year
Principal
Interest
Total Payment
Principal Balance 10,050,000
1,860,000 1,915,000 2,010,000 2,090,000 2,175,000 $10,050,000
402,550 346,750 251,000 170,600 87,000 $1,257,900
2,262,550 2,261,750 2,261,000 2,260,600 2,262,000 $11,307,900
8,190,000 6,275,000 4,265,000 2,175,000 $ -
2015 2016 2017 2018 2019 2020 TOTALS
99
2015-2016 proposed revised BIENNIAL OPERATING AND CAPITAL BUDGET
100
proposed revised 2015-2016 PAY PLAN SCHEDULES COMBINED POSITION LISTING 2013-2016 FUND
01 General Fund
DEPARTMENT
City Attorney City Manager's Office Community Development Finance Human Resources Information Technology Municipal Court Public Safety Public Works Utilities
08 Arvada Center 09 Community Development 10 Arvada Housing Authority 14 Parks 21 Police Tax Increment .21 22 Police Tax Increment .25 41 Water 42 Wastewater 43 Golf Courses 44 Stormwater 45 Food Services 51 Insurance 52 Computers 53 Print Shop 54 Vehicles 55 Buildings 86 AEDA Total Position Count
101
2013 Actual 10.00 18.95 18.00 28.25 9.00 24.00 10.00 169.40 88.50 13.00 389.10 39.25 2.42 3.58 47.00 30.00 33.00 65.75 15.00 14.00 4.75 8.00 6.25 1.00 2.00 17.75 0.00 4.00 682.85
2014 Actual 11.00 21.95 19.00 28.75 9.00 24.00 11.00 169.50 89.50 13.00 396.70 39.25 2.02 3.98 48.00 30.50 33.50 66.25 15.00 17.00 4.75 8.00 6.25 1.00 2.00 16.75 0.00 4.00 694.95
2015 Estimate 13.00 20.95 20.00 29.70 9.00 24.00 11.00 169.50 89.50 15.00 401.65 39.25 2.67 3.33 48.00 31.50 36.50 70.75 14.00 17.00 5.25 8.00 4.00 1.00 2.00 16.75 1.00 4.00 706.65
2016 Proposed Revised Budget 13.00 20.95 21.00 29.06 9.00 24.00 11.00 169.50 90.50 15.00 403.01 41.25 2.67 3.33 50.00 32.50 42.50 68.25 15.20 18.22 5.55 7.42 4.00 1.00 2.00 16.75 1.00 4.00 718.65
proposed revised 2015-2016 PAY PLAN SCHEDULES ARVADA CENTER Accountant Accounting Technician I Accounting Technician II Administrative Specialist Artistic Associate Assistant Production Manager Associate Producer Box Office Supervisor Chief Operating Officer Clay Programs Coordinator Corporate and Group Sales Specialist Costume Shop Assistant Costume Shop Manager Customer Service Representative Dance Coordinator Development Manager Development Officer Individual Giving Development Officer Institutional Giving Director of Financial Operations Director of Institutional Operations Education Assistant Education Manager Executive Coordinator Executive Director Arvada Center Exhibition Coordinator and Registrar Exhibition Manager Facilities Manager Gallery Museum Manager Graphic Designer House Manager Lead Theater Technician Marketing Patron Services Manager Online Marketing Coordinator Performing Arts Manager Production Manager Properties Shop Supervisor Public Relations Specialist Publicist School Programs Associate School Programs Coordinator Security Operations Officer Security Officer Senior Customer Service Representative
2013 Actual 1.00 1.00 0.00 1.00 1.00 1.00 1.00 1.00 1.00 0.50 1.00 0.00 1.00 1.00 0.50 1.00 1.00 1.00 0.00 1.00 1.00 0.00 1.00 1.00 0.00 1.00 1.00 1.00 1.00 1.00 1.00 1.00 0.75 1.00 1.00 0.00 0.00 1.00 1.00 1.00 1.00 0.00 1.00
102
2014 Actual 1.00 1.00 0.00 1.00 1.00 1.00 1.00 1.00 1.00 0.50 1.00 0.00 1.00 1.00 0.50 1.00 1.00 1.00 0.00 1.00 1.00 0.00 1.00 1.00 0.00 1.00 1.00 1.00 1.00 1.00 1.00 1.00 0.75 1.00 1.00 0.00 0.00 1.00 1.00 1.00 1.00 0.00 1.00
2015 Estimate 1.00 1.00 0.00 0.00 1.00 1.00 1.00 1.00 1.00 0.50 1.00 0.00 1.00 1.00 0.50 1.00 1.00 1.00 1.00 0.00 1.00 1.00 1.00 1.00 1.00 1.00 1.00 1.00 1.00 1.00 1.00 1.00 0.75 1.00 1.00 0.00 1.00 0.00 1.00 1.00 1.00 0.00 1.00
2016 Proposed Revised Budget 1.00 0.00 1.00 0.00 1.00 1.00 1.00 1.00 1.00 0.50 1.00 1.00 1.00 1.00 0.50 1.00 1.00 1.00 1.00 0.00 1.00 1.00 1.00 1.00 1.00 1.00 1.00 1.00 1.00 1.00 1.00 1.00 0.75 1.00 1.00 1.00 1.00 0.00 1.00 1.00 0.00 1.00 1.00
proposed revised 2015-2016 PAY PLAN SCHEDULES ARVADA CENTER (continued) Senior Education Coordinator Software Application Support Specialist Sound Technician Technical Director Theater Electrician Youth Symphony Coordinator Total Arvada Center Positions
2013 Actual 1.00 1.00 1.00 1.00 1.00 0.50 39.25
2014 Actual 1.00 1.00 1.00 1.00 1.00 0.50 39.25
2015 Estimate 0.00 1.00 1.00 1.00 1.00 0.50 39.25
2016 Proposed Revised Budget 0.00 1.00 1.00 1.00 1.00 0.50 41.25
ARVADA ECONOMIC DEVELOPMENT ASSOCIATION (AEDA) Deputy Director of Economic Development Director of Economic Development Economic Development Specialist Marketing Program Manager Total AEDA Positions
2013 Actual 1.00 1.00 1.00 1.00 4.00
2014 Actual 1.00 1.00 1.00 1.00 4.00
2015 Estimate 1.00 1.00 1.00 1.00 4.00
2016 Proposed Revised Budget 1.00 1.00 1.00 1.00 4.00
CITY ATTORNEY
2013 Actual 1.00 1.00 1.00 0.00 1.00 1.00 1.00 0.00 4.00 10.00
2014 Actual 2.00 1.00 1.00 0.00 1.00 1.00 1.00 0.00 4.00 11.00
2015 Estimate 2.00 1.00 1.00 1.00 1.00 1.00 0.00 1.00 5.00 13.00
2016 Proposed Revised Budget 2.00 1.00 1.00 1.00 1.00 1.00 0.00 1.00 5.00 13.00
2013 Actual 0.75 2.00 0.00 1.00 1.00 1.00 1.00 1.20 1.00 2.00 1.00 0.00
2014 Actual 0.75 2.00 0.00 1.00 1.00 1.00 1.00 1.20 1.00 2.00 1.00 1.00
2015 Estimate 0.75 2.00 0.00 0.00 1.00 1.00 1.00 1.20 1.00 2.00 1.00 1.00
2016 Proposed Revised Budget 0.75 2.00 1.00 0.00 1.00 1.00 1.00 1.20 1.00 2.00 1.00 1.00
Assistant City Attorney City Attorney Deputy City Attorney Law Office Administrator Legal Assistant Legal Secretary Legal Support Supervisor Litgation Paralegal Senior Assistant City Attorney Total City Attorney Positions CITY MANAGER'S OFFICE Administrative Assistant Administrative Specialist Assistant to the City Manager Assistant City Manager City Clerk City Manager Communications Manager Community Communications Coordinator Deputy City Clerk Deputy City Manager Document Management Systems Administrator Emergency Management Coordinator
103
proposed revised 2015-2016 PAY PLAN SCHEDULES CITY MANAGER'S OFFICE (continued) Executive Assistant Healthy Places Grant Coordinator Media Services Manager Multi Media Technician Performance Budget Manager Sustainability Coordinator Television Services Administrator Television Services Supervisor Total City Manager's Office Positions COMMUNITY DEVELOPMENT Administrative Assistant Administrative Coordinator Administrative Specialist Administrative Supervisor Code Compliance Officer Code Enforcement Manager Code Enforcement Officer Director of Community Development Housing / Neighborhood Revitalization Manager Manager of City Planning and Development Manager of Housing Preservation and Resources Neighborhood Engagement Coordinator Neighborhood Services Manager Planning Manager Planner I Planner II Senior Planner Total General Fund Positions
2013 Actual 2.00 0.00 0.00 3.00 0.00 1.00 1.00 0.00 18.95
2014 Actual 2.00 1.00 0.00 3.00 1.00 1.00 1.00 0.00 21.95
2015 Estimate 2.00 1.00 1.00 2.00 1.00 1.00 0.00 1.00 20.95
2016 Proposed Revised Budget 2.00 1.00 1.00 2.00 1.00 0.00 0.00 1.00 20.95
2013 Actual 0.00 1.00 1.00 1.00 0.00 1.00 5.00 1.00 1.00 0.00 0.00 0.00 0.00 1.00 0.00 0.00 6.00 18.00
2014 Actual 1.00 1.00 1.00 1.00 0.00 1.00 5.00 1.00 1.00 0.00 0.00 0.00 0.00 1.00 0.00 0.00 6.00 19.00
2015 Estimate 1.00 1.00 1.00 1.00 5.00 0.00 0.00 1.00 0.00 1.00 1.00 0.00 1.00 0.00 1.00 0.00 6.00 20.00
2016 Proposed Revised Budget 1.00 1.00 1.00 1.00 5.00 0.00 0.00 1.00 0.00 1.00 1.00 1.00 1.00 0.00 1.00 1.00 5.00 21.00
0.50 1.00 0.92 2.42
0.10 1.00 0.92 2.02
0.75 1.00 0.92 2.67
0.75 1.00 0.92 2.67
0.50 0.08 2.00 1.00 3.58 24.00
0.90 0.08 2.00 1.00 3.98 25.00
0.25 0.08 2.00 1.00 3.33 26.00
0.25 0.08 2.00 1.00 3.33 27.00
Administrative Specialist Housing Rehabilitation / Loan Specialist Housing Services Specialist Total Community Development Fund Positions Administrative Specialist Housing Services Specialist Housing Specialist Section 8 Program Supervisor Total Arvada Housing Authority Positions Total Community Development Positions
104
proposed revised 2015-2016 PAY PLAN SCHEDULES FINANCE Accountant Accounting Manager Accounting Specialist Accounting Technician II Accounting Technician III Accounts Payable Technician Assistant Finance Director Budget Analyst Business Analyst Collections Agent Controller Director of Finance Executive Assistant Financial Systems Analyst Grants Accountant Grants Administrator Investment Manager Payroll Administrator Procurement Specialist Purchasing Manager Revenue Manager Revenue Technician Sales Tax Auditor Sales Tax Auditor Supervisor Senior Accountant Storeskeeper Treasury Analyst Total General Fund Positions
2013 Actual 2.00 1.00 1.00 2.00 0.00 1.00 1.00 2.00 1.00 1.00 1.00 1.00 0.75 1.00 1.00 1.00 1.00 1.00 1.00 1.00 0.50 1.50 2.00 1.00 1.00 0.50 0.00 28.25
2014 Actual 2.00 1.00 1.00 2.00 0.00 1.00 1.00 2.00 1.00 1.00 1.00 1.00 0.75 1.00 1.00 1.00 1.00 1.00 1.00 1.00 1.00 1.50 2.00 1.00 1.00 0.50 0.00 28.75
2015 Estimate 2.00 1.00 0.00 2.00 1.00 1.00 1.00 2.00 1.00 1.00 1.00 1.00 1.00 1.00 1.00 1.00 0.00 1.00 1.00 1.00 1.00 2.00 2.00 1.00 1.00 0.70 1.00 29.70
Financial Systems Analyst Revenue Manager Revenue Technician Revenue Technician Supervisor Total Water Fund Positions
1.00 0.50 4.00 1.00 6.50
0.00 0.00 0.00 0.00 0.00
0.00 0.00 0.00 0.00 0.00
0.00 0.00 0.00 0.00 0.00
Business Analyst Total Golf Course Fund Position
0.00 0.00
0.00 0.00
0.00 0.00
0.32 0.32
Business Analyst Total Food Service Fund Position
0.00 0.00
0.00 0.00
0.00 0.00
0.32 0.32
Environmental Health and Safety Officer Executive Assistant
1.00 0.25
1.00 0.25
1.00 0.00
1.00 0.00
105
2016 Proposed Revised Budget 1.00 1.00 1.00 1.00 2.00 1.00 1.00 2.00 0.36 1.00 1.00 1.00 1.00 1.00 1.00 1.00 0.00 1.00 1.00 1.00 1.00 2.00 2.00 1.00 1.00 0.70 1.00 29.06
proposed revised 2015-2016 PAY PLAN SCHEDULES FINANCE (continued)
2013 Actual 1.00 1.00 1.00 1.00 1.00 6.25 41.00
2014 Actual 1.00 1.00 1.00 1.00 1.00 6.25 35.00
2015 Estimate 0.00 1.00 1.00 1.00 0.00 4.00 33.70
2016 Proposed Revised Budget 0.00 1.00 1.00 1.00 0.00 4.00 33.70
Administrative Specialist Benefits Specialist Compensation and Benefits Manager Director of Human Resources Employment Manager Employment Specialist Executive Assistant Human Resources Generalist Total Human Resources Positions
2013 Actual 1.00 1.00 1.00 1.00 1.00 1.00 1.00 2.00 9.00
2014 Actual 1.00 1.00 1.00 1.00 1.00 1.00 1.00 2.00 9.00
2015 Estimate 1.00 1.00 1.00 1.00 1.00 1.00 1.00 2.00 9.00
2016 Proposed Revised Budget 1.00 1.00 1.00 1.00 1.00 1.00 1.00 2.00 9.00
INNOVATION AND TECHNOLOGY MANAGEMENT Administrative Specialist Application Administrator Associate Project Manager Business Systems Manager Chief Information Officer Computer Support Specialist Information Systems Manager IT Business Analyst IT Security Specialist Mobile Business Analyst Mobile Technology Specialist Network Administrator Network System Manager Oracle Software Administrator Police Systems Analyst Police Systems Manager Senior Computer Support Specialist Senior Database Administrator Senior Network Administrator Senior Web Architect Service Desk Manager
2013 Actual 1.00 1.00 1.00 0.00 1.00 2.00 1.00 0.00 0.00 0.00 1.00 1.00 1.00 1.00 1.00 1.00 0.00 1.00 1.00 1.00 1.00
2014 Actual 1.00 1.00 1.00 0.00 1.00 2.00 1.00 0.00 0.00 0.00 1.00 1.00 1.00 1.00 1.00 1.00 0.00 1.00 1.00 1.00 1.00
2015 Estimate 1.00 1.00 1.00 1.00 1.00 1.00 0.00 1.00 1.00 1.00 0.00 1.00 0.00 1.00 0.00 0.00 1.00 1.00 1.00 1.00 0.00
2016 Proposed Revised Budget 1.00 0.00 1.00 1.00 1.00 1.00 0.00 1.00 1.00 1.00 0.00 1.00 0.00 0.00 0.00 0.00 1.00 1.00 1.00 1.00 0.00
Litigation Support Specialist Property and Casualty Claims Manager Risk Management and Wellness Technician Risk Manager Senior Assistant City Attorney Total Insurance Fund Positions Total Finance Department Positions HUMAN RESOURCES
106
proposed revised 2015-2016 PAY PLAN SCHEDULES INNOVATION AND TECHNOLOGY MANAGEMENT (continued) Services Technician Software Developer Storeskeeper Systems Administrator Technical Systems Project Manager Technology and Project Services Manager Technology Infrastructure and Operations Manager Telecommunication Network Administrator Web Systems Administrator Total General Fund Positions
2013 Actual 0.50 0.00 0.50 3.00 1.00 0.00 0.00 1.00 1.00 24.00
2014 Actual 1.00 0.00 0.00 3.00 1.00 0.00 0.00 1.00 1.00 24.00
2015 Estimate 1.00 0.00 0.00 3.00 1.00 1.00 1.00 1.00 1.00 24.00
Police Business Analyst Radio Communications Administrator Total Tax Initiative 22 Fund Positions
0.00 0.00 0.00
0.00 0.00 0.00
1.00 1.00 2.00
1.00 1.00 2.00
Desktop Virtualization Administrator Total Computer Fund Positions
1.00 1.00
1.00 1.00
1.00 1.00
1.00 1.00
1.00 1.00 2.00 27.00
1.00 1.00 2.00 27.00
1.00 1.00 2.00 29.00
1.00 1.00 2.00 29.00
2013 Actual 6.00 1.00 1.00 0.00 1.00 1.00 10.00
2014 Actual 7.00 1.00 1.00 0.00 1.00 1.00 11.00
2015 Estimate 6.00 1.00 1.00 1.00 1.00 1.00 11.00
2016 Proposed Revised Budget 6.00 1.00 1.00 1.00 1.00 1.00 11.00
2013 Actual 1.00 1.00 1.00 1.00 0.00 1.00 1.00 0.00 1.00
2014 Actual 2.00 1.00 1.00 1.00 0.00 1.00 1.00 0.00 1.00
2015 Estimate 2.00 1.00 0.00 1.00 1.00 0.00 1.00 3.00 1.00
2016 Proposed Revised Budget 2.00 1.00 0.00 1.00 1.00 0.00 1.00 2.00 1.00
Creative Services Designer Printing Technician Total Print Shop Fund Positions Total Information Technology Positions MUNICIPAL COURT Administrative Court Clerk Court Administrator Court Marshal Deputy Court Administrator Municipal Judge Teen Court Coordinator / Administrative Court Clerk Total Municipal Court Positions PARKS, GOLF & HOSPITALITY Administrative Coordinator City Forester Computerized Irrigation Specialist Computerized Irrigation Supervisor Computerized Irrigation System Administrator Craftsworker Director of Parks, Golf and Hospitality Services Forestry Technician Irrigation Crew Supervisor
107
2016 Proposed Revised Budget 1.00 1.00 0.00 4.00 1.00 1.00 1.00 1.00 1.00 24.00
proposed revised 2015-2016 PAY PLAN SCHEDULES PARKS, GOLF & HOSPITALITY (continued) Irrigation Maintenance Leadworker Irrigation Maintenance Worker Municipal Services Worker Nature Center Director Parks and Urban Design Manager Parks Maintenance Leadworker Parks Manager Parks Supervisor Parks Worker II Senior Landscape Architect Special Events Coordinator Total Parks Fund Positions
2013 Actual 1.00 4.00 1.00 1.00 1.00 6.00 1.00 4.00 18.00 2.00 1.00 47.00
2014 Actual 1.00 4.00 1.00 1.00 1.00 6.00 1.00 4.00 18.00 2.00 1.00 48.00
2015 Estimate 1.00 4.00 1.00 1.00 1.00 6.00 1.00 4.00 15.00 2.00 1.00 47.00
Environmental Education Specialist Total Water Fund Costing
0.00 0.00
0.00 0.00
0.75 0.75
0.75 0.75
Environmental Education Specialist Total Stormwater Fund Costing
0.00 0.00
0.00 0.00
0.25 0.25
0.25 0.25
0.00 1.00 1.00 0.00 0.00 0.00 2.00 1.00 1.00 1.00 0.00 1.00 1.00 1.00 1.00 2.00 1.00 14.00
0.00 1.00 1.00 0.00 0.00 0.00 2.00 1.00 1.00 1.00 3.00 1.00 1.00 1.00 1.00 2.00 1.00 17.00
0.00 1.00 1.00 0.00 0.00 0.00 2.00 1.00 1.00 1.00 3.00 1.00 1.00 1.00 1.00 2.00 1.00 17.00
1.00 1.00 1.00 0.30 0.15 0.45 2.00 1.00 1.00 0.00 3.00 1.00 1.00 1.00 1.00 2.00 1.00 17.90
1.00 1.00 2.00 1.00 1.00 1.00
1.00 1.00 2.00 1.00 1.00 1.00
1.00 1.00 2.00 1.00 1.00 1.00
1.00 1.00 1.70 0.85 0.55 1.00
Assistant Golf Course Superintendent Assistant Golf Manager Assistant Golf Professional Business Development Coordinator Business Development Manager Executive Chef Golf Course Computerized Irrigation Technician Golf Course Equipment Mechanic Leadworker Golf Course Equipment Specialist Golf Course Maintenance Leadworker Golf Course Maintenance Worker Golf Course Manager Golf Course Superintendent Golf Professional Head Golf Professional Hospitality Services Supervisor Manager of Golf Course Operations Total Golf Course Fund Positions Administrative Coordinator Assistant Banquet Manager Business Development Coordinator Business Development Manager Executive Chef Food Services Manager
108
2016 Proposed Revised Budget 1.00 4.00 1.00 1.00 1.00 6.00 1.00 4.00 18.00 2.00 1.00 49.00
proposed revised 2015-2016 PAY PLAN SCHEDULES PARKS, GOLF & HOSPITALITY (continued)
2013 Actual 1.00 8.00 69.00
2014 Actual 1.00 8.00 73.00
2015 Estimate 1.00 8.00 73.00
2016 Proposed Revised Budget 1.00 7.10 75.00
Animal Management Officer Animal Management Supervisor Chief of Police Communications Specialist Communications Supervisor Crime Analyst Criminalist Deputy Police Chief Emergency Management Coordinator Evidence Supervisor Evidence Technician Executive Assistant Lead Police Support Specialist Liquor Licensing Control Administrator Patrol Investigative Specialist Police Commander Police Officer Police Propery and Equipment Specialist Police Sergeant Police Services Technician Police Support Specialist Total General Fund Positions
2013 Actual 4.00 1.00 1.00 12.00 3.00 1.00 2.00 2.00 0.90 0.00 3.00 1.00 2.00 1.00 0.50 6.00 100.00 0.00 19.00 3.00 7.00 169.40
2014 Actual 4.00 1.00 1.00 12.00 3.00 1.00 2.00 2.00 0.00 0.00 3.00 1.00 2.00 1.00 0.50 6.00 100.00 1.00 19.00 3.00 7.00 169.50
2015 Estimate 4.00 1.00 1.00 11.00 4.00 1.00 1.00 2.00 0.00 1.00 2.00 1.00 0.00 1.00 0.50 6.00 101.00 1.00 19.00 3.00 9.00 169.50
2016 Proposed Revised Budget 4.00 1.00 1.00 11.00 4.00 1.00 1.00 2.00 0.00 1.00 2.00 1.00 0.00 1.00 0.50 6.00 101.00 1.00 19.00 3.00 9.00 169.50
Accreditation Specialist Animal Management Officer Communications Specialist Crime Analyst Custodian Financial Business Analyst Investigations Specialist Lead Police Support Specialist Police Officer Police Services Technician Police Support Specialist Public Relations Coordinator Records and Evidence Supervisor Records Supervisor Total Tax Initiative 21 Fund Positions
1.00 1.00 4.00 1.00 0.00 0.00 1.00 0.00 14.00 4.00 2.00 1.00 1.00 0.00 30.00
1.00 1.00 4.00 1.00 0.50 0.00 1.00 0.00 14.00 4.00 2.00 1.00 1.00 0.00 30.50
1.00 1.00 4.00 1.00 0.50 0.00 1.00 1.00 15.00 4.00 1.00 1.00 0.00 1.00 31.50
Hospitality Services Supervisor Total Food Service Fund Positions Total Parks, Golf, & Hospitality Positions PUBLIC SAFETY
109
0.00 1.00 4.00 1.00 0.00 1.00 0.00 1.00 17.00 4.00 1.00 1.00 0.00 1.00 32.00
proposed revised 2015-2016 PAY PLAN SCHEDULES PUBLIC SAFETY (continued) Animal Management Officer Communications Center Manager Communications Specialist Custodian Police Business Analyst Police Officer Police Sergeant Police Systems Technician Total Tax Initiative 22 Fund Positions Total Public Safety Positions PUBLIC WORKS Administrative Coordinator Administrative Specialist Associate Transportation Engineer Bicycle and Pedestrian Coordinator Building Craftsworker Building Maintenance Leadworker Building Maintenance Worker CAD / GIS Supervisor Chief Surveyor City Engineer Civil Engineer III Civil Engineer IV Construction and Inspection Supervisor Construction and Maintenance Supervisor Crew Supervisor Custodian Director of Public Works Electrician Engineering Services Manager Engineering Technician II Executive Assistant GEO Data Services Manager GIS Specialist GIS Technician II HVAC Specialist Manager of City Facilities Municipal Inspector I Municipal Inspector II Pavement Manager Senior Civil Engineer Senior GIS Analyst
2013 Actual 1.00 1.00 3.00 0.00 1.00 23.00 3.00 1.00 33.00 232.40
2014 Actual 1.00 1.00 3.00 0.50 1.00 23.00 3.00 1.00 33.50 233.50
2015 Estimate 1.00 1.00 3.00 0.50 0.00 26.00 3.00 0.00 34.50 235.50
2016 Proposed Revised Budget 1.00 1.00 3.00 0.00 0.00 32.00 3.00 0.00 40.00 241.50
2013 Actual 2.00 2.00 1.00 0.00 1.00 2.00 3.00 1.00 1.00 1.00 2.00 3.00 0.00 1.00 1.00 10.00 1.00 1.00 0.00 1.50 1.00 1.00 0.00 1.00 1.00 1.00 1.00 5.00 1.00 0.00 1.00
2014 Actual 2.00 2.00 1.00 1.00 1.00 2.00 3.00 1.00 1.00 1.00 2.00 3.00 0.00 1.00 1.00 10.00 1.00 1.00 0.00 1.50 1.00 1.00 0.00 1.00 1.00 1.00 1.00 5.00 1.00 0.00 1.00
2015 Estimate 2.00 2.00 0.00 0.00 1.00 2.00 3.00 1.00 1.00 0.00 3.00 0.00 1.00 1.00 1.00 10.00 1.00 1.00 1.00 1.50 1.00 1.00 1.00 0.00 1.00 1.00 1.00 5.00 1.00 1.00 1.00
2016 Proposed Revised Budget 2.00 2.00 0.00 0.00 1.00 2.00 3.00 1.00 1.00 0.00 3.00 1.00 1.00 1.00 0.00 10.00 1.00 1.00 1.00 1.50 1.00 1.00 0.00 1.00 1.00 1.00 1.00 5.00 1.00 1.00 1.00
110
proposed revised 2015-2016 PAY PLAN SCHEDULES Senior Traffic Engineer PUBLIC WORKS (continued)
0.00 2013 Actual 1.00 0.00 6.00 1.00 3.00 21.00 1.00 1.00 1.00 0.00 1.00 0.00 0.00 1.00 0.00 1.00 1.00 1.00 1.00 0.00 88.50
0.00 2014 Actual 1.00 0.00 6.00 1.00 3.00 21.00 1.00 1.00 1.00 0.00 1.00 0.00 0.00 1.00 0.00 1.00 1.00 1.00 1.00 0.00 89.50
1.00 2015 Estimate 1.00 1.00 6.00 1.00 3.00 20.00 1.00 1.00 1.00 0.00 0.00 1.00 1.00 0.00 0.00 1.00 1.00 1.00 1.00 1.00 89.50
Craftworker Total Parks Fund Positions
0.00 0.00
0.00 0.00
1.00 1.00
1.00 1.00
Custodian Total Police Tax Increment .21 Fund Positions
0.00 0.00
0.00 0.00
0.00 0.00
0.50 0.50
Custodian Total Police Tax Increment .22 Fund Positions
0.00 0.00
0.00 0.00
0.00 0.00
0.50 0.50
Custodian Total Water Fund 41 Positions
0.00 0.00
0.00 0.00
0.00 0.00
1.00 1.00
Building Maintenance Worker Total Buildings Fund Positions Total Public Works Positions
0.00 0.00 88.50
0.00 0.00 89.50
1.00 1.00 91.50
1.00 1.00 94.50
2013 Actual 1.00 1.00 1.00
2014 Actual 0.00 2.00 1.00
2015 Estimate 0.00 2.00 1.00
Soils Technician Special Projects Engineer Streets Foreman Streets Manager Streets Supervisor Streets Technician Survey Party Chief Survey Technician II Survey Technician III Traffic Foreman Traffic Engineer Traffic Engineer I / Bicycle and Pedestrian Coordinator Traffic Engineer III Traffic Engineering Manager Traffic Field Operations Supervisor Traffic Signs and Marking Technician Traffic Technician Transportation Engineer Transportation Engineering Assistant Utility System Technician Total General Fund Positions
UTILITIES Administrative Coordinator Administrative Specialist Assistant Building Official
111
1.00 2016 Proposed Revised Budget 1.00 1.00 6.00 1.00 3.00 21.00 1.00 1.00 1.00 1.00 0.00 1.00 1.00 0.00 1.00 1.00 1.00 1.00 0.00 0.00 90.50
2016 Proposed Revised Budget 0.00 2.00 1.00
proposed revised 2015-2016 PAY PLAN SCHEDULES UTILITIES (continued) Building Inspector I Building Inspector II Building Permit Coordinator Building Permit Technician Chief Building Official Plans Examiner I Plans Examiner II Software Application Support Specialist Total General Fund Positions Administrative Coordinator Administrative Specialist Chief Plant Operator Civil Engineer IV Custodian Customer Information Lead Customer Information Manager Customer Information Specialist Customer Information Supervisor Director of Utilities Electro Mechanical Technician Engineering Technician II Environmental Education Specialist Financial Systems Analyst GIS Specialist GIS Technician I Operations Support Supervisor Plant Operator Plant Supervisor - SCADA Public Works Project Manager Revenue Technician Revenue Technician Supervisor SCADA Process and Controls Technician Utilities Project Manager Utility Billing and Rates Manager Utility Foreman Utility Service Representative Utility Supervisor Utility System Technician Water Quality Administrator Water Quality Analyst Water Quality Manager Water Resources Administrator
2013 Actual 1.00 6.00 1.00 1.00 1.00 0.00 0.00 0.00 13.00
2014 Actual 1.00 6.00 1.00 1.00 1.00 0.00 0.00 0.00 13.00
2015 Estimate 1.00 7.00 2.00 0.00 1.00 0.00 0.00 1.00 15.00
0.00 1.00 5.00 1.00 1.00 0.00 0.00 0.00 0.00 1.00 5.00 1.00 0.75 0.00 0.00 0.50 0.00 5.00 1.00 1.00 0.00 0.00 0.00 0.00 0.00 8.00 2.00 5.00 14.00 1.00 2.00 0.50 1.00
1.00 0.00 5.00 1.00 1.00 0.00 0.00 0.00 0.00 1.00 5.00 1.00 0.75 1.00 0.00 0.50 0.00 5.00 1.00 1.00 4.00 1.00 0.00 0.00 1.00 8.00 2.00 5.00 14.00 1.00 2.00 0.50 1.00
1.00 0.00 5.00 1.00 1.00 1.00 1.00 4.00 1.00 1.00 4.00 1.50 0.00 0.00 1.00 0.00 1.00 5.00 1.00 0.00 0.00 0.00 1.00 1.00 0.00 8.00 2.00 5.00 17.00 1.00 2.00 0.00 1.00
112
2016 Proposed Revised Budget 1.00 7.00 0.00 0.00 1.00 1.00 1.00 1.00 15.00 1.00 0.00 5.00 0.00 0.00 1.00 1.00 3.00 1.00 1.00 1.00 1.00 0.00 0.00 0.00 2.00 1.00 5.00 1.00 0.00 0.00 0.00 4.00 2.00 0.00 8.00 2.00 4.00 15.00 1.00 3.00 0.00 1.00
proposed revised 2015-2016 PAY PLAN SCHEDULES UTILITIES (continued) Water Resources Analyst Water System Manager Water Treatment Manager Total Water Fund Positions Engineering Technician II GIS Technician I Streets Technician Utility Supervisor Utility System Technician Wastewater and Stormwater Manager Wastewater Collection Manager Total Wastewater Fund Positions Environmental Education Specialist Erosion Control Inspector Regulatory Analyst Regulatory Specialist Stormwater Analyst Stormwater and Environmental Administrator Utilities Project Manager Utility Supervisor Utility System Technician Wastewater and Stormwater Manager Water Quality Manager Total Stormwater Fund Positions Fleet Equipment Technician Fleet Manager Fleet Services Coordinator Parts Specialist Police Courier Police Property and Equipment Specialist Shop Supervisor Total Vehicle Fund Positions Total Utilities Department Positions Total Position Count
2013 Actual 0.50 1.00 1.00 59.25
2014 Actual 0.50 1.00 1.00 66.25
2015 Estimate 0.50 1.00 1.00 70.00
0.50 0.50 0.00 2.00 11.00 0.00 1.00 15.00
0.50 0.50 0.00 2.00 11.00 0.00 1.00 15.00
0.00 0.00 1.00 2.00 10.00 1.00 0.00 14.00
0.50 0.00 0.00 2.00 12.00 0.70 0.00 15.20
0.25 0.00 0.00 0.00 1.00 1.00 0.00 0.00 2.00 0.00 0.50 4.75
0.25 0.00 0.00 0.00 1.00 1.00 0.00 0.00 2.00 0.00 0.50 4.75
0.00 0.00 3.00 0.00 0.00 0.00 1.00 0.00 1.00 0.00 0.00 5.00
0.00 1.00 0.00 0.00 2.00 0.00 0.00 0.00 2.00 0.30 0.00 5.30
10.00 1.00 1.00 2.00 0.75 1.00 2.00 17.75 109.75 682.85
10.00 1.00 1.00 2.00 0.75 0.00 2.00 16.75 115.75 694.95
10.00 1.00 1.00 2.00 0.75 0.00 2.00 16.75 120.75 706.65
10.00 1.00 1.00 2.00 0.75 0.00 2.00 16.75 118.75 718.65
113
2016 Proposed Revised Budget 0.50 1.00 1.00 66.50
$ $ $ $ $
$ $ $ $ $ $ $ $ $
$ 41,733 $ 46,015 $ 50,736 $ 55,941 $ 61,681 $ 68,009 $ 74,987 $ 82,680 $ 91,163 $ 100,517 $ 110,830
$ 58,332 $ 84,795 $ 106,620 $ 122,248 $ 51,906 $ 53,562
EXEC1 EXEC2 EXEC3 EXEC4 EXEC5 EXEC6 EXEC7 EXEC8
INFT1 INFT2 INFT3 INFT4 INFT5
LTCU1 LTCU2 LTCU3 LTCU4 LTCU5 LTCU6 LTCU7 LTCU8 LTCU9
MGMT1 MGMT2 MGMT3 MGMT4 MGMT5 MGMT6 MGMT7 MGMT8 MGMT9 MGMT10 MGMT11
PD1 PD2 PD3 PD4 PR1 PR2
26,426 28,334 31,236 34,434 37,960 41,848 46,133 50,857 56,064
64,207 69,472 75,169 81,333 88,002
1 $ 76,355 $ 82,509 $ 89,159 $ 96,345 $ 104,111 $ 112,502 $ 121,570 $ 133,800
114
7.00% 4.55% 4.50% 2.50%
3.75% 3.75% 3.75% 3.75% 3.75% 3.75% 3.75% 3.75% 3.75% 3.75% 3.75%
3.75% 3.75% 3.75% 3.75% 3.75% 3.75% 3.75% 3.75% 3.75%
3.75% 3.75% 3.75% 3.75% 3.75%
3.75% 3.75% 3.75% 3.75% 3.75% 3.75% 3.75% 3.75%
27,417 29,397 32,407 35,726 39,384 43,417 47,863 52,764 58,167
66,615 72,078 77,988 84,383 91,302
$ 62,416 $ 88,654 $ 111,418 $ 125,304
$ 43,298 $ 47,740 $ 52,638 $ 58,039 $ 63,994 $ 70,559 $ 77,799 $ 85,781 $ 94,582 $ 104,286 $ 114,986
$ $ $ $ $ $ $ $ $
$ $ $ $ $
2 $ 79,218 $ 85,603 $ 92,503 $ 99,958 $ 108,015 $ 116,721 $ 126,129 $ 138,817
7.00% 3.35% 2.40% 2.10%
3.50% 3.50% 3.50% 3.50% 3.50% 3.50% 3.50% 3.50% 3.50% 3.50% 3.50%
3.50% 3.50% 3.50% 3.50% 3.50% 3.50% 3.50% 3.50% 3.50%
3.50% 3.50% 3.50% 3.50% 3.50%
3.50% 3.50% 3.50% 3.50% 3.50% 3.50% 3.50% 3.50%
28,377 30,426 33,541 36,976 40,762 44,936 49,538 54,611 60,203
68,947 74,600 80,717 87,336 94,498
$ 66,785 $ 91,623 $ 114,092 $ 127,935
$ 44,813 $ 49,411 $ 54,481 $ 60,070 $ 66,233 $ 73,029 $ 80,522 $ 88,783 $ 97,892 $ 107,936 $ 119,011
$ $ $ $ $ $ $ $ $
$ $ $ $ $
3 $ 81,991 $ 88,599 $ 95,740 $ 103,457 $ 111,795 $ 120,806 $ 130,543 $ 143,676
6.50% 3.25% 2.00% 2.04%
3.25% 3.25% 3.25% 3.25% 3.25% 3.25% 3.25% 3.25% 3.25% 3.25% 3.25%
3.25% 3.25% 3.25% 3.25% 3.25% 3.25% 3.25% 3.25% 3.25%
3.25% 3.25% 3.25% 3.25% 3.25%
3.25% 3.25% 3.25% 3.25% 3.25% 3.25% 3.25% 3.25%
29,299 31,415 34,631 38,178 42,087 46,397 51,148 56,385 62,159
71,187 77,025 83,341 90,175 97,569
$ 71,126 $ 94,601 $ 116,374 $ 130,545
$ 46,270 $ 51,017 $ 56,251 $ 62,023 $ 68,386 $ 75,402 $ 83,139 $ 91,669 $ 101,074 $ 111,444 $ 122,878
$ $ $ $ $ $ $ $ $
$ $ $ $ $
4 $ 84,655 $ 91,479 $ 98,852 $ 106,819 $ 115,429 $ 124,732 $ 134,786 $ 148,345
6.14% 3.25% 2.00% 2.00%
3.00% 3.00% 3.00% 3.00% 3.00% 3.00% 3.00% 3.00% 3.00% 3.00% 3.00%
3.00% 3.00% 3.00% 3.00% 3.00% 3.00% 3.00% 3.00% 3.00%
3.00% 3.00% 3.00% 3.00% 3.00%
3.00% 3.00% 3.00% 3.00% 3.00% 3.00% 3.00% 3.00%
30,178 32,357 35,670 39,323 43,350 47,789 52,682 58,077 64,024
$ 75,493 $ 97,676 $ 118,701 $ 133,156
$ 47,658 $ 52,547 $ 57,939 $ 63,883 $ 70,438 $ 77,665 $ 85,633 $ 94,419 $ 104,106 $ 114,788 $ 126,565
$ $ $ $ $ $ $ $ $
$ 73,323 $ 79,335 $ 85,841 $ 92,880 $ 100,496
5 $ 87,195 $ 94,223 $ 101,817 $ 110,024 $ 118,892 $ 128,474 $ 138,829 $ 152,796
6.00% 3.24% 2.00% 2.00%
3.00% 3.00% 3.00% 3.00% 3.00% 3.00% 3.00% 3.00% 3.00% 3.00% 3.00%
3.00% 3.00% 3.00% 3.00% 3.00% 3.00% 3.00% 3.00% 3.00%
3.00% 3.00% 3.00% 3.00% 3.00%
3.00% 3.00% 3.00% 3.00% 3.00% 3.00% 3.00% 3.00%
31,084 33,328 36,740 40,503 44,650 49,222 54,263 59,819 65,945
$ 80,023 $ 100,840 $ 121,075 $ 135,819
$ 49,087 $ 54,124 $ 59,677 $ 65,800 $ 72,551 $ 79,994 $ 88,202 $ 97,251 $ 107,229 $ 118,231 $ 130,362
$ $ $ $ $ $ $ $ $
$ 75,523 $ 81,716 $ 88,416 $ 95,666 $ 103,511
6 $ 89,811 $ 97,050 $ 104,872 $ 113,324 $ 122,458 $ 132,329 $ 142,994 $ 157,379
3.00% 3.00% 3.00% 3.00% 3.00% 3.00% 3.00% 3.00% 3.00% 3.00% 3.00%
3.00% 3.00% 3.00% 3.00% 3.00% 3.00% 3.00% 3.00% 3.00%
3.00% 3.00% 3.00% 3.00% 3.00%
3.00% 3.00% 3.00% 3.00% 3.00% 3.00% 3.00% 3.00%
ANNUAL
32,016 34,328 37,843 41,718 45,990 50,699 55,891 61,614 67,923
$ 50,560 $ 55,747 $ 61,467 $ 67,774 $ 74,727 $ 82,394 $ 90,848 $ 100,169 $ 110,446 $ 121,778 $ 134,273
$ $ $ $ $ $ $ $ $
$ 77,788 $ 84,167 $ 91,069 $ 98,536 $ 106,616
7 $ 92,505 $ 99,961 $ 108,018 $ 116,724 $ 126,132 $ 136,298 $ 147,284 $ 162,101
3.00% 3.00% 3.00% 3.00% 3.00% 3.00% 3.00% 3.00% 3.00% 3.00% 3.00%
3.00% 3.00% 3.00% 3.00% 3.00% 3.00% 3.00% 3.00% 3.00%
3.00% 3.00% 3.00% 3.00% 3.00%
2.50% 2.50% 2.50% 2.50% 2.50% 2.50% 2.50% 2.50%
2016 ANNUAL SALARY SCHEDULE
32,976 35,357 38,978 42,969 47,369 52,220 57,567 63,462 69,961 $ 52,077 $ 57,420 $ 63,311 $ 69,807 $ 76,969 $ 84,866 $ 93,573 $ 103,174 $ 113,760 $ 125,431 $ 138,301
$ $ $ $ $ $ $ $ $
$ 80,122 $ 86,692 $ 93,801 $ 101,492 $ 109,815
8 $ 94,818 $ 102,460 $ 110,718 $ 119,642 $ 129,285 $ 139,706 $ 150,966 $ 166,153
2.50% 2.50% 2.50% 2.50% 2.50% 2.50% 2.50% 2.50% 2.50% 2.50% 2.50%
2.50% 2.50% 2.50% 2.50% 2.50% 2.50% 2.50% 2.50% 2.50%
2.50% 2.50% 2.50% 2.50% 2.50%
2.50% 2.50% 2.50% 2.50% 2.50% 2.50% 2.50% 2.50%
33,801 36,241 39,952 44,044 48,554 53,526 59,007 65,049 71,710 $ 53,379 $ 58,855 $ 64,894 $ 71,552 $ 78,893 $ 86,988 $ 95,913 $ 105,753 $ 116,604 $ 128,567 $ 141,758
$ $ $ $ $ $ $ $ $
$ 82,125 $ 88,859 $ 96,146 $ 104,030 $ 112,560
9 $ 97,188 $ 105,022 $ 113,486 $ 122,633 $ 132,518 $ 143,198 $ 154,740 $ 170,307
2.50% 2.50% 2.50% 2.50% 2.50% 2.50% 2.50% 2.50% 2.50% 2.50% 2.50%
2.50% 2.50% 2.50% 2.50% 2.50% 2.50% 2.50% 2.50% 2.50%
2.50% 2.50% 2.50% 2.50% 2.50%
2.50% 2.50% 2.50% 2.50% 2.50% 2.50% 2.50% 2.50%
34,646 37,147 40,951 45,145 49,767 54,864 60,482 66,675 73,503 $ 54,713 $ 60,327 $ 66,516 $ 73,341 $ 80,866 $ 89,162 $ 98,311 $ 108,397 $ 119,519 $ 131,781 $ 145,302
$ $ $ $ $ $ $ $ $
$ 84,178 $ 91,081 $ 98,549 $ 106,630 $ 115,374
10 $ 99,618 $ 107,647 $ 116,323 $ 125,699 $ 135,831 $ 146,778 $ 158,609 $ 174,565
2.25% 2.25% 2.25% 2.25% 2.25% 2.25% 2.25% 2.25% 2.25% 2.25% 2.25%
2.25% 2.25% 2.25% 2.25% 2.25% 2.25% 2.25% 2.25% 2.25%
2.25% 2.25% 2.25% 2.25% 2.25%
2.25% 2.25% 2.25% 2.25% 2.25% 2.25% 2.25% 2.25%
35,425 37,983 41,873 46,160 50,887 56,098 61,843 68,175 75,156 $ 55,944 $ 61,684 $ 68,013 $ 74,991 $ 82,685 $ 91,169 $ 100,523 $ 110,836 $ 122,208 $ 134,746 $ 148,571
$ $ $ $ $ $ $ $ $
$ 86,072 $ 93,130 $ 100,767 $ 109,030 $ 117,970
11 $ 101,859 $ 110,069 $ 118,941 $ 128,527 $ 138,887 $ 150,081 $ 162,177 $ 178,493
2.00% 2.00% 2.00% 2.00% 2.00% 2.00% 2.00% 2.00% 2.00% 2.00% 2.00%
2.00% 2.00% 2.00% 2.00% 2.00% 2.00% 2.00% 2.00% 2.00%
2.00% 2.00% 2.00% 2.00% 2.00%
2.00% 2.00% 2.00% 2.00% 2.00% 2.00% 2.00% 2.00%
36,134 38,743 42,710 47,084 51,905 57,220 63,079 69,539 76,659 $ 57,063 $ 62,918 $ 69,373 $ 76,491 $ 84,339 $ 92,992 $ 102,533 $ 113,053 $ 124,652 $ 137,441 $ 151,543
$ $ $ $ $ $ $ $ $
$ 87,794 $ 94,993 $ 102,782 $ 111,210 $ 120,330
12 $ 103,897 $ 112,271 $ 121,320 $ 131,098 $ 141,664 $ 153,083 $ 165,421 $ 182,062
proposed revised 2015-2016 PAY PLAN SCHEDULES
$ $ $ $ $ $ $ $ $ $ $
$ $ $ $ $ $ $ $ $
PROF1 PROF2 PROF3 PROF4 PROF5 PROF6 PROF7 PROF8 PROF9 PROF10 PROF11
TBS1 TBS2 TBS3 TBS4 TBS5 TBS6 TBS7 TBS8 TBS9
27,305 30,076 33,129 36,492 40,195 44,275 48,769 53,719 59,172
34,969 38,640 42,698 47,181 52,135 57,609 63,658 70,342 77,728 85,889 94,908
1
3.75% 3.75% 3.75% 3.75% 3.75% 3.75% 3.75% 3.75% 3.75%
3.75% 3.75% 3.75% 3.75% 3.75% 3.75% 3.75% 3.75% 3.75% 3.75% 3.75%
$ $ $ $ $ $ $ $ $
$ $ $ $ $ $ $ $ $ $ $
28,329 31,204 34,371 37,860 41,703 45,936 50,598 55,734 61,391
36,280 40,089 44,299 48,950 54,090 59,769 66,045 72,980 80,643 89,110 98,467
2
3.50% 3.50% 3.50% 3.50% 3.50% 3.50% 3.50% 3.50% 3.50%
3.50% 3.50% 3.50% 3.50% 3.50% 3.50% 3.50% 3.50% 3.50% 3.50% 3.50% $ $ $ $ $ $ $ $ $
29,320 32,296 35,574 39,185 43,162 47,543 52,369 57,685 63,539
$ 37,550 $ 41,493 $ 45,849 $ 50,663 $ 55,983 $ 61,861 $ 68,357 $ 75,534 $ 83,465 $ 92,229 $ 101,913
3
3.25% 3.25% 3.25% 3.25% 3.25% 3.25% 3.25% 3.25% 3.25%
3.25% 3.25% 3.25% 3.25% 3.25% 3.25% 3.25% 3.25% 3.25% 3.25% 3.25% $ $ $ $ $ $ $ $ $
30,273 33,346 36,730 40,459 44,565 49,089 54,071 59,559 65,605
$ 38,770 $ 42,841 $ 47,339 $ 52,310 $ 57,803 $ 63,872 $ 70,578 $ 77,989 $ 86,178 $ 95,227 $ 105,225
4
3.00% 3.00% 3.00% 3.00% 3.00% 3.00% 3.00% 3.00% 3.00%
3.00% 3.00% 3.00% 3.00% 3.00% 3.00% 3.00% 3.00% 3.00% 3.00% 3.00% $ $ $ $ $ $ $ $ $
31,181 34,346 37,832 41,672 45,902 50,561 55,693 61,346 67,573
$ 39,933 $ 44,126 $ 48,760 $ 53,879 $ 59,537 $ 65,788 $ 72,696 $ 80,329 $ 88,763 $ 98,083 $ 108,382
5
3.00% 3.00% 3.00% 3.00% 3.00% 3.00% 3.00% 3.00% 3.00%
3.00% 3.00% 3.00% 3.00% 3.00% 3.00% 3.00% 3.00% 3.00% 3.00% 3.00% $ $ $ $ $ $ $ $ $
32,117 35,377 38,967 42,923 47,279 52,078 57,364 63,186 69,600
$ 41,131 $ 45,450 $ 50,222 $ 55,496 $ 61,323 $ 67,762 $ 74,877 $ 82,739 $ 91,426 $ 101,026 $ 111,634
6
3.00% 3.00% 3.00% 3.00% 3.00% 3.00% 3.00% 3.00% 3.00%
3.00% 3.00% 3.00% 3.00% 3.00% 3.00% 3.00% 3.00% 3.00% 3.00% 3.00%
ANNUAL
$ $ $ $ $ $ $ $ $
33,080 36,438 40,136 44,210 48,698 53,640 59,085 65,082 71,688
$ 42,365 $ 46,814 $ 51,729 $ 57,161 $ 63,162 $ 69,794 $ 77,123 $ 85,221 $ 94,169 $ 104,057 $ 114,983
7
3.00% 3.00% 3.00% 3.00% 3.00% 3.00% 3.00% 3.00% 3.00%
3.00% 3.00% 3.00% 3.00% 3.00% 3.00% 3.00% 3.00% 3.00% 3.00% 3.00%
2016 ANNUAL SALARY SCHEDULE
8
$ $ $ $ $ $ $ $ $
34,073 37,531 41,340 45,537 50,159 55,250 60,857 67,034 73,838
$ 43,636 $ 48,218 $ 53,281 $ 58,875 $ 65,057 $ 71,888 $ 79,437 $ 87,777 $ 96,994 $ 107,178 $ 118,432 2.50% 2.50% 2.50% 2.50% 2.50% 2.50% 2.50% 2.50% 2.50%
2.50% 2.50% 2.50% 2.50% 2.50% 2.50% 2.50% 2.50% 2.50% 2.50% 2.50%
9
$ $ $ $ $ $ $ $ $
34,925 38,469 42,374 46,675 51,412 56,631 62,379 68,710 75,684
$ 44,727 $ 49,423 $ 54,613 $ 60,347 $ 66,684 $ 73,686 $ 81,422 $ 89,972 $ 99,419 $ 109,858 $ 121,393 2.50% 2.50% 2.50% 2.50% 2.50% 2.50% 2.50% 2.50% 2.50%
2.50% 2.50% 2.50% 2.50% 2.50% 2.50% 2.50% 2.50% 2.50% 2.50% 2.50%
10
$ $ $ $ $ $ $ $ $
35,798 39,431 43,433 47,842 52,698 58,047 63,938 70,428 77,577
$ 45,845 $ 50,659 $ 55,978 $ 61,856 $ 68,351 $ 75,528 $ 83,458 $ 92,221 $ 101,904 $ 112,604 $ 124,428 2.25% 2.25% 2.25% 2.25% 2.25% 2.25% 2.25% 2.25% 2.25%
2.25% 2.25% 2.25% 2.25% 2.25% 2.25% 2.25% 2.25% 2.25% 2.25% 2.25%
11
$ $ $ $ $ $ $ $ $
36,603 40,318 44,411 48,918 53,883 59,353 65,377 72,013 79,322
$ 46,877 $ 51,799 $ 57,238 $ 63,248 $ 69,889 $ 77,227 $ 85,336 $ 94,296 $ 104,197 $ 115,138 $ 127,227 2.00% 2.00% 2.00% 2.00% 2.00% 2.00% 2.00% 2.00% 2.00%
2.00% 2.00% 2.00% 2.00% 2.00% 2.00% 2.00% 2.00% 2.00% 2.00% 2.00%
12
$ $ $ $ $ $ $ $ $
37,335 41,125 45,299 49,897 54,961 60,540 66,684 73,453 80,908
$ 47,814 $ 52,835 $ 58,382 $ 64,513 $ 71,286 $ 78,772 $ 87,043 $ 96,182 $ 106,281 $ 117,441 $ 129,772
proposed revised 2015-2016 PAY PLAN SCHEDULES
115
proposed revised 2015-2016 PAY PLAN SCHEDULES
116
2015-2016 Revised BIENNIAL OPERATING AND CAPITAL BUDGET
117
2015-2016 Revised BIENNIAL OPERATING AND CAPITAL BUDGET
118
2015-2016 Revised BIENNIAL OPERATING AND CAPITAL BUDGET
119
2015-2016 Revised BIENNIAL OPERATING AND CAPITAL BUDGET
120
2015-2016 Revised BIENNIAL OPERATING AND CAPITAL BUDGET
121
2015-2016 Revised BIENNIAL OPERATING AND CAPITAL BUDGET
122
GLOSSARY OF TERMS The City of Arvada Annual Budget and Program of Services is structured to be easily understood and meaningful to both the general public and the organization. This glossary is provided to assist those unfamiliar with budgeting terms and a few terms specific to the Arvada financial planning process. Accrual Basis: A basis of accounting in which transactions are recognized at the time they are incurred, as opposed to when cash is received or spent. Advance Refunding: The payoff and re-issuance of bonds to obtain better interest rates and/or bond conditions. Appropriation: A formal action by the City Council which approves the spending limits for the fiscal year for each fund. Assessed Valuation: A valuation set upon real estate or other property by the County Assessor as a basis for levying taxes. Asset: Resources owned or held that have monetary value. Assigned Fund Balance: These are amounts that a government intends to use for a specific purpose. Intent can be expressed by the governing body or by an official or body to which the governing body delegates authority. Attrition: A method of achieving a reduction in personnel by not refilling the positions vacated through resignation, reassignment, transfer, retirement or means other than layoffs. AURA: Stands for Arvada Urban Renewal Authority. AURA acquires and assembles property in order to redevelop blighted property located in the urban renewal district. The district in Arvada includes 5 active areas that are located throughout the City. Authorized Positions: Employee positions, which are authorized in the adopted budget, to be filled during the year. Bond: A long-term I.O.U. or promise to pay. Often bonds are issued to finance the construction of long term capital projects. It is a promise to repay a specified amount of money (the face amount of the bond) on a particular date (maturity date). Bonds come in two types: general obligation bonds are backed by the full faith, credit and taxing authority of the government and revenue bonds are backed only by a specific revenue stream, such as water user fees or sales tax. Budget: A plan of financial activity for a specified period of time (two years) indicating all planned revenues and expenditures for the budget period. Budgetary Basis: This refers to the basis of accounting used to estimate financing sources and uses in the budget. This generally takes one of three forms: Generally Accepted Accounting Principles (GAAP), cash, or modified accrual. Budgetary Control: The control or management of a government in accordance with the approved budget for the purpose of keeping expenditures within the limitations of available appropriations and resources. Capital Equipment: Assets of value greater than $5,000 and having a useful life greater than 36 months. Capital equipment is also called fixed assets.
123
GLOSSARY OF TERMS Capital Improvements Plan (CIP): The appropriation and spending plan for improvements to city facilities including buildings, streets, water , stormwater and sewer projects, drainage improvements, parks and trails. Capital Outlay: Classification of expenditures related to the purchase of capital equipment. Capital Project: Major construction, acquisition or renovation activities which add value to a government’s physical assets of significantly increase their useful life. Cash basis: A basis of accounting in which transactions are recognized only when cash is increased or decreased. CDBG: Stands for Community Development Block Grant, which is money given to cities from the federal government to improve blighted conditions and to assist low and moderate income persons. Committed Fund Balance: These are amounts constrained to specific purposes by a government itself, using its highest level of decision making authority. To be reported as committed, amounts cannot be used for any other purpose unless the government takes the same highest-level action to remove or change the restraint. Consumer Price Index (CPI): A statistical description of price levels provided by the U.S. Department of Labor. The index is used to measure the increase in the cost of living (economic inflation). Contingency: A budgetary reserve set aside for emergency or unanticipated expenditures and/or revenue shortfalls. Debt Service: The principal and interest payments on outstanding bonds. Depreciation: Expiration in the service life of capital equipment attributable to wear and tear, deterioration, action of the physical elements, inadequacy or obsolescence. Emergency Reserve: A term used in TABOR. TABOR requires Arvada to maintain 3% of total fiscal year spending as an emergency reserve. Encumbrance: The formal accounting recognition of commitments to expend resources in the future. Enterprise Fund: A separate set of financial records used for operations which are financed and operated in a manner similar to a private business enterprise. City enterprise funds are set up in order to pay ongoing costs of a program using ongoing revenues and fees generated by the program such as Arvada’s utility service. Fiscal Year: The one-year period designated by the city for the beginning and ending of financial transactions. This is the period covered by the budget and the financial report. The city’s fiscal year begins January 1 and ends December 31. Full Time Equivalent Position (FTE): A position converted to the decimal equivalent of a full-time position based on 2,080 hours per year. For example, a part-time typist working for 20 hours per week would be equivalent to .5 of a full-time equivalent. Full Faith and Credit: A pledge of the government’s taxing power to repay debt obligations. Fund: A fiscal and accounting entity with a self-balancing set of accounts recording cash and other financial resources, related liabilities and residual balances.
124
GLOSSARY OF TERMS Fund Balance: The difference between total assets and total liabilities for a fund. GASB: The Governmental Accounting Standards Board, which is the source of generally accepted accounting principles for public-sector entities like the City of Arvada. General Obligation (G.O.) Bond: This type of bond is backed by the full faith, credit and taxing power of the city. General Fund: A general purpose fund supported by taxes, fees and other revenues which may be used for any lawful purpose. This fund accounts for all financial resources except those required to be accounted for in another fund. Goal: A statement of broad direction, purpose or intention based on the needs of the community. A goal is general and timeless; that is, it is not concerned with a specific achievement in a given time period. Infrastructure(s): Facilities on which the continuance and growth of a community depend such as a road, water lines, sewer lines, public buildings, and parks. Infrastructure assets are immovable and of value only to the government. Internal Service Fund: This fund accounts for the financing of goods or services provided by one department or agency to other departments or agencies of the governmental unit. An example is the insurance fund. Liability: An obligation to pay an amount in money, goods, or services to another party. Line of Business: A set of Programs grouped together by common purpose or result. Lines of Business include a Purpose Statement and Key Results. Local Growth: A term defined by TABOR. Local growth is the net percentage change in actual value of all real property. Maintenance and Operation Costs: The day-to-day operation and maintenance costs of a municipality include such things as gas and electric utility bills, telephone expense, reproduction costs, postage and vehicle maintenance. Mill: Property tax rates that are based on the valuation of property are measured in units called mills. A tax rate of one mill produces one dollar of taxes on each $1,000 of assessed property valuation. Modified Accrual: A basis of accounting where revenues are recognized in the accounting period in which they become available and measurable, and expenditures are recognized in the accounting period when the liability is incurred, if measurable. Nonspendable Fund Balance: These are amounts that are not in a spendable form (such as inventory) or are required to be maintained intact (such as the corpus of an endowment fund). Operating Budget: A budget which contains the day-to-day costs of delivering city services. The operating budget is the spending plan for the entity. Operating Revenue: Funds that the government receives as income to pay for ongoing operations. It includes such items as taxes, fees from specific services, interest earnings and grant revenues. Operating revenues are used to pay for day-to-day services.
125
GLOSSARY OF TERMS Operating Expenditures: The cost for personnel, materials and equipment required for a department to function. Performance Measure: Data collected to determine how effective or efficient a program is in achieving its objectives. Personnel Expenditures: Expenditures for salaries, wages and fringe benefits for employees. Program: A set of Services grouped together by common purpose or result. Programs include a Purpose Statement and Family of Measures. Reserve: A portion of the fund balance that is not available for appropriation or expenditure. Reserve Funds: Separate sets of accounts established to account for funds that are reserved for a specific purpose. Resolution: A formal statement of a decision or expression of opinion put before or adopted by the city council. Restricted Fund Balance: These are amounts constrained to specific purposes by their providers (such as grantors, bondholders, and higher levels of government), through constitutional provisions or enabling legislation. Revenue Bond: This is a type of bond that is backed only by a particular source of revenue , such as water sales, road tolls, and sales taxes. Supplemental Appropriation: An additional appropriation made by the governing body after the budget year has started. TABOR: TABOR (Taxpayer Bill of Rights, Article X, Section 20 of the Colorado Constitution) is an amendment to Colorado’s State Constitution passed by election in 1992 that imposes revenue limitations for governments. TABOR Caps: The limits placed each year on how much money cities can receive. The caps are calculated on a yearly basis and are dependent upon local growth plus inflation. Taxes: Compulsory charges levied by a government for the purpose of financing services performed for the common benefit of the people. This term does not include specific charges made against particular persons or property for current or permanent benefit, such as special assessments. Tax Levy: The total amount to be raised by general property taxes as measured by mills. A mill equals $1,000 of assessed valuation. Transfer: An expenditure from one fund to be benefit of a receiving fund. User Charges: The payment of a fee for direct receipt of a public service by the party benefiting from the service is a user charge. Working Capital: The difference between the current assets and current liabilities in a fund. In other words, working capital is the amount of money available to pay for current operations.
126