Financial Report
2015 Third Quarter
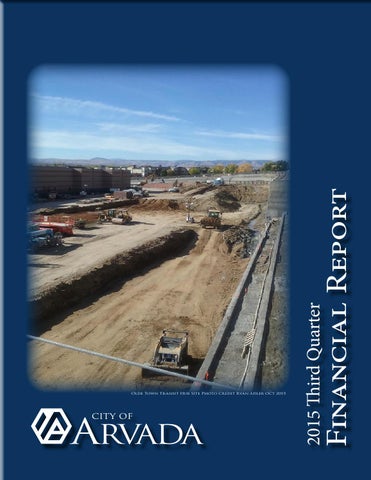
Olde Town Tr ansit Hub Site Photo Credit Ryan Adler Oct 2015
Table of Contents Overview.......................................................................................1 General Fund...............................................................................3 Arvada Center..............................................................................7 Parks Fund...................................................................................9 Special Revenue Funds........................................................... 11 Capital Improvements Projects Fund.................................... 13 Enterprise Funds...................................................................... 15 Internal Service Funds............................................................. 21 City of Arvada Investment Report.......................................... 25
OVERVIEW
2015 Third Quarter Report The Financial Report for the City of Arvada provides an unaudited overview of the major funds and how their revenues and expenditures performed in comparison to budget. This is not meant to be a complete accounting, but rather a quick look at the highlights. Revenues in the General Fund continue to be strong, with 9% year-over-year growth in 2015 as compared to 2014. All major revenue categories are participating, except property tax, led by building revenues and sales tax. Actual sales tax revenues are up 6.6% compared to the same time period in 2014. We are now in our sixth consecutive year of growth (2009-2015). The major categories of Fast-Casual Restaurants, Retail Hardware, Auto Care, Office Supplies, Office Equipment, Furniture, Appliances and Flooring lead the way with double-digit increases over 2014. The graph below represents building revenue and permits for the past five years. The pace of new construction continues to increase as 521 singlefamily building permits were issued through the third quarter of 2015. The Colorado economy is the fifth fastest growing economy in the United States and the Denver Metro region leads the way. Interestingly, the third quarter 2015 experienced the first quarter-over-quarter decline since the fourth quarter of 2011. We will continue to monitor single-family permits to see if this was an anomaly or a leading indicator of a housing slowdown.
General Fund Building Revenue through September $9,000,000
540
$8,000,000
Dollars
$6,000,000
360
$5,000,000 270
$4,000,000 $3,000,000
180
$2,000,000
90
$1,000,000 $0 GF Building Revenue Single-Family (Detached) Permits
2011 3,182,772
2012 4,044,707
2013 4,873,086
2014 7,087,076
2015 8,312,979
99
253
341
470
521
0
Auto Use tax revenue increased its growth pattern, now up 15.9% over 2014 actuals. We are in the middle of six years (2010-2015) of consecutive growth. Taking center stage as the Gold Line nears completion is the Olde Town Transit Hub. Shoring, excavating and water remediation are the tasks currently underway on this project. In the next few months, we will see the start of the parking structure emerging out of the ground. The other area of concentration in the capital fund for the third quarter has been “Taking Lasting Care�. Playground renovations at Meadowlake, Oak and Jack B. Tomlinson Parks will be completed by October. Updated traffic signals at five intersections will also be completed by the end of the year. Elimination of the summer musical was another part of the continued cost-control measures being put in place by the Arvada Center. This has led to a reduction in the overall revenue, as well as the corresponding expenditures. The Center is still struggling to meet its projected ticket sales along with projected fundraising. Current estimates put the year-end gap around $180,000.
1
Permits
450
$7,000,000
Currently, the Arvada Housing Authority is helping 465 families out of a an authorized maximum of 508. Savings are being used to offset the drastic increase in rental costs. This is a sign of how competitive the current rental market is and how the Authority is working to keep as many families in their homes as possible While rain was the story in the second quarter for the enterprise funds, the exact opposite was the story in the third quarter. This has enabled the Water Fund to close the gap on both consumption and water fees. Year-to-date revenues are now down 9.8% with year-end loss projections in the 5-6% range. West Woods Golf Club came roaring back with one of the best third quarters on record. Daily play, along with tournament rounds, increased significantly over 2014. This moved yearly revenue from 5% down in the second quarter to 2% up in the third quarter. Unfortunately, Lake Arbor Golf Club continues to struggle with rounds down 10% compared to 2014. The two restaurants have maintained their good start to the year, with revenues up 6.6% compared to the same time period in 2014. Investment income recorded its third consecutive quarter of growth, up to an annualized yield of .751%. This surpasses the benchmark of .570% by over 18 basis points and represents a well-diversified portfolio. Everyone is still waiting for the Federal Reserve to do something with rates. The economists are now targeting the time period between December 2015 and March 2016. The revised 2016 budget was approved by City Council on October 26. The updated budget includes some smaller line item changes, increased funding to help address some security risks and the addition of seven new police officers aided by a Department of Justice COPS grant. The City was the only local agency selected to receive this grant from the 17 that applied. Our commitment to sector-based policing was one of the items that set us apart from the other applicants. The City is in good financial condition as we close the third quarter of 2015. Assuming a strong finish, we should meet our revenue budget in most categories and exceed it in a few. This additional revenue will be dedicated to addressing some pressing capital needs.
M ajestic View Photo Credit Richard Assmus APR 2013
2
The General Fund pays for the City’s basic services. This includes police, street maintenance, planning, transportation planning, code enforcement, street light maintenance and costs, building activity and general administration. In addition, the General Fund also provides for the following: • Operational support to the Arvada Center • Operational support to the Parks Fund • General Debt Service payments • Transfer to the Capital Improvement Projects Fund for new parks, transportation and other infrastructure projects The following table provides a comparison of budgeted cash balances, revenues and expenditures to budget and prior year amounts in the same areas. 2015 Budget
As of 9/30/15
Beginning Fund Balance
$30,847,000
$30,847,000
REVENUES
$75,878,254
$58,905,986
$54,261,127
Ongoing
77,197,847
48,147,912
45,597,836
Capital
7,299,941
8,383,509
25,779
JPPHA
1,255,000
770,650
200,000
$85,752,788
$57,302,071
$45,823,615
1,603,915
8,437,512
General Fund
As of 9/30/14
EXPENDITURES
Expenditures Income/(Loss) Ending Fund Balance
(9,874,534) $20,972,466
$32,450,915
The General Fund began 2015 with a $30,847,000 fund balance. Some of this fund balance, $4,135,132, was dedicated to 2014 carry-over items not completed in 2014 and one-time requests. An additional $3,106,146 of one-time funds was added to the Capital Fund for the Olde Town Transit Hub improvements. We will also use $2,613,256 to balance the budget. These dollars will be taken from fund balance.
Hills at Standley Lake Garden Photo Credit Richard Assmus
Revenue Highlights Overall, revenues are up 9% compared to the same time period in 2014. In general, revenues are in line with the 2015 budget estimate for the majority of revenue categories that will exceed the 2015 budget estimate, except sales tax and building revenue. The major revenue categories of sales tax, use tax, property tax, building and intergovernmental revenues are discussed in more detail in the following tables and graphs. The investment report at the end of this document will provide details of the City’s investments. Investment revenue will continue to be low as the current investment environment is not expected to change until late 2015 or early 2016.
3
GENERAL FUND
General Fund Overview
GENERAL FUND REVENUES Sales Tax 49%
Property Tax 8%
Use Tax 1%
Auto Use Tax 7% Other 21% Franchise Fees Court Fines & Fees 4% 2%
Interest 1%
Sales Tax
The graph below shows actual third quarter sales tax collections from 2011 to 2015. Sales tax collections lag one month; therefore, collections through the third quarter represent sales tax collections for eight months. The City has now seen an increase in third quarter sales tax collections for six straight years (2009-2015).
Building Use Tax & Permits 7%
Sales Tax Collections
$50,000,000 $40,000,000 $30,000,000
Sales tax receipts for the first eight months of 2015 are 6.6% above 2014 actuals. Based on the positive trend of sales tax revenues, the sales tax budget was revised to $45,638,143 for 2015, representing a 5.5% increase over 2014 actual sales tax collections.
$20,000,000 $10,000,000 $0
09/30/2011 09/30/2012 09/30/2013 09/30/2014 09/30/2015 2015 Budget Sales Tax $23,156,589 $24,552,903 $25,953,189 $27,844,593 $29,688,649 $45,638,143
4
Use Tax The City has three primary use tax types: general, building and automobile. These are taxes paid in lieu of sales tax on purchases.
Use Tax Collections $14,000,000 $12,000,000
General use tax is slightly below 2014 actuals through eight months, but should meet the budget of $1,569,575.
$10,000,000
Building use tax for 2015 is at $4.1 million which exceeds the original budget of $2,100,000. Due to the continued growth in west Arvada, the budget for building use tax was increased to $4,950,000 for 2015. Based on the current pace, building use tax will meet the revised budgeted amount.
$6,000,000
Auto use tax collections are showing a 15.9% increase over 2014 collections. Auto use tax collections are on track to meet or exceed the revised 2015 budgeted amount of $6,000,000.
$8,000,000
$4,000,000 $2,000,000 $0 General
09/30/2011 $897,032
09/30/2012 $682,027
09/30/2013 $873,197
09/30/2014 $890,495
09/30/2015 $858,212
2015 Budget $1,569,575
Auto
$2,894,875
$3,239,957
$3,516,156
$3,914,175
$4,536,196
$6,000,000
Building
$1,495,301
$1,898,048
$2,348,796
$3,429,533
$4,142,569
$4,950,000
Building
Property Tax The City’s property tax rate is 4.31 mills per $100 of valuation. In Colorado, the mill rate is placed on the assessed valuation. The following graph illustrates the year-to-date collections for the current and past four years.
Auto
General
Property Tax Collections $5,000,000 $4,500,000 $4,000,000 $3,500,000 $3,000,000
Currently, property tax receipts are $73,621 more than the 2014 receipts for the first nine months of the year, but will likely be short of the original budgeted amount of $4,850,000. Therefore, the budget for property tax was revised to $4,650,000. Although many citizens have received a notice of a substantial increase to their property valuations, the increased valuation relates to the collection of property tax for 2016.
$2,500,000 $2,000,000 $1,500,000 $1,000,000 $500,000 $0 Property Tax
09/30/2011 $4,594,045
Intergovernmental Revenues This category is made up of two revenue sources: Highway Users Trust Fund (HUTF), which is the City’s share of State-collected gas tax revenue, and Road and Bridge, which is the City’s share of property tax collected by Jefferson County and dedicated to the maintenance of roads and bridges. Combined, these revenues have averaged between $4.5 million and $4.7 million in the past five years and are budgeted for a little less than $4.7 million in 2015. Road and Bridge funds are disbursed quarterly. The graph shows the first two disbursements received, one in April and one in July. HUTF funds are received monthly and the graph shows eight months of revenue. While these funds have been a stable revenue source, they have increased less than 1% in the past three years. Both revenues sources are on pace to meet their budget.
09/30/2012 $4,457,676
09/30/2013 $4,532,720
09/30/2014 $4,565,024
09/30/2015 $4,638,645
2015 Budget $4,650,000
Intergovernmental Revenues $5,000,000 $4,500,000 $4,000,000 $3,500,000 $3,000,000 $2,500,000 $2,000,000 $1,500,000 $1,000,000 $500,000 $0 HUTF Jefferson County
09/30/2011 $2,528,738
09/30/2012 $2,549,159
09/30/2013 $2,539,390
09/30/2014 $2,600,435
09/30/2015 $2,695,921
2015 Budget $3,944,230
$754,282
$834,335
$701,103
$715,791
$720,750
$751,750
Jefferson County
5
HUTF
Expenditure Highlights Ongoing expenditures rose 6% in 2015 over the same time period in 2014. The majority of the increase is made up of the purchase of the post office building at $1.11 million and the timing of the payment on the streets maintenance contract at $1.97 million. Personnel and other ongoing operating costs make up the rest of the difference, increasing at just over 3%. All of these items are in the budget for 2015. The transfer to the CIP fund, which makes up a majority of the Capital budget listed above, occurred in the third quarter 2015 versus the fourth quarter of 2014.
GENERAL FUND EXPENDITURES
Transfers 22%
Miscellaneous 2% Personnel 48%
Debt Service 1%
Contracts 13%
Supplies and Expenses 6%
Services and Charges 8%
Salary and Benefit Savings Salary & Benefits
2015 Budget
Salaries & Wages
$30,150,876
Vacancy Savings
As of 9/30/14
$19,716,205
$19,122,680
-
-
980,122
641,812
545,482
Group Insurance
6,036,792
3,744,563
3,486,183
Retirement
3,400,792
2,258,577
2,207,871
Medicare
374,106
250,418
232,997
Temporary Wages & SS
332,118
379,968
181,926
Other
359,185
255,471
249,096
$40,824,764
$27,247,015
$26,026,235
Overtime
Total
(809,226)
As of 9/30/15
6
Temporary Wages were up significantly in the first nine months of 2015, due primarily to the use of independent contractors by Public Works to help manage Transit-Oriented Development projects currently underway, as well as substantial increases in contract pay for relief judges in the Municipal Court. Increases in General Fund Overtime expenditures were due to elevated charges in both Public Works and the Police Department.
Overview The Arvada Center Fund accounts for all revenues and expenditures related to performing arts, development, marketing, education and gallery at the Arvada Center. Sources of revenue include grants, charges for services and transfers from the City’s General Fund. Through the third quarter 2015, the Arvada Center continued to decrease expenses compared to 2014. Total expenditures are down 7.3%. Revenue has also decreased 7.73% for the first nine months when compared to the first nine months of 2014. The Center is showing positive income through the third quarter even with the decrease in revenues. However, net income is $39,646 less than the first nine months of 2014. The fourth quarter is always the most difficult with so much competition for your entertainment dollars. It is estimated that the Center will finish the year with approximately $180,000 budget gap. Lower ticket revenues and fundraising shortfalls are the main contributors to this gap.
Arvada Center
2015 Budget
Beginning Fund Balance
As of 9/30/14
As of 9/30/15
$ 201,000
$ 201,000
$5,335,306
$3,419,858
$3,916,215
SCFD
1,029,553
833,656
768,407
City Cash Transfer
1,611,251
1,271,652
1,303,592
City In-Kind Transfer
2,225,881
-
-
$10,201,991
$5,525,166
$5,988,213
$7,819,253
$5,388,261
$5,811,662
REVENUES Generated
Total Revenues EXPENDITURES Ongoing In-Kind Total Expenditures
2,225,881
-
-
$10,045,134
$5,388,261
$5,811,662
156,857
136,905
176,551
Income/(Loss) Ending Fund Balance
$
357,857
$
337,905
Revenue Highlights Revenues decreased during the third quarter by 17.6% when compared to the third quarter of 2014. The largest contributor is the year-to-date decrease of 22% in ticket sales which is attributed to the cancellation of the summer musical. The summer musical has averaged $525,000 in revenue over the past five years. If you were to remove this revenue, year-over-year ticket sales would be flat. SCFD revenue, education classes, consignment art sales and Arts Day revenues have all seen increases in 2015, bringing the overall year-to-date revenue decrease to 7.73%.
Expenditure Highlights Compared to 2014, production costs decreased by approximately 22% from 2014. Expenses in Musical Theatre and Theatrical Plays have also decreased. Marketing expenses decreased by 9% and Patron Services decreased by 13% when compared to 2014. These decreases can be attributed to a number of factors, but primarily are due to the cancellation of the summer musical in 2015 coupled with the evolving approach to play productions that require less expense through cast, design and labor.
Saturday Night Fever, The Musical Photo Credit P. Switzer Photogr aphy SEPT 2015
7
ARVADA CENTER
Arvada Center
SCFD Revenue $1,200,000 $1,000,000 $800,000 $600,000 $400,000 $200,000 $SCFD
09/30/2011 $706,943
09/30/2012 $758,167
09/30/2013 $767,211
09/30/2014 $768,407
09/30/2015 $833,656
2015 Budget $1,029,553
The largest portion of the Scientific and Cultural Facilities District (SCFD) grant contributions was received in September. Currently, contributions are up 8.49% over 2014 and on track to meet the 2015 budget projection. The difficulty with projecting this grant revenue is that there is increased competition each year from other arts and cultural facilities. The Arvada Center continues to be the leader in the TIER 2 institutional category for funding.
City of Arvada Contributions $4,000,000 $3,500,000 $3,000,000 $2,500,000 $2,000,000 $1,500,000 $1,000,000 $500,000 $0 In-Kind Cash
09/30/2011 $1,475,453
09/30/2012 $1,573,123
09/30/2013 $1,587,997
09/30/2014 $1,530,000
09/30/2015 $1,669,411
2015 Budget $2,225,881
$886,982
$1,232,341
$1,232,341
$1,303,592
$1,271,652
$1,611,251
The City of Arvada increased the budget for its in-kind support of the Center in 2015 when compared to 2014 by $185,800. Budgeted cash support has remained level at $1,611,251, although additional cash contributions up to $400,000 have been made in 2012-2014.
8
Parks Fund Overview The Parks Fund accounts for costs associated with the acquisition, design, development, maintenance and beautification of parks, open space and trails within the City. Revenues are derived from the City’s General Fund, Grants Fund, Apex and Jefferson County Open Space funds.
Parks Fund Beginning Fund Balance
2015 Budget
As of 9/30/15
As of 9/30/14
$4,455,000
$4,455,000
$3,620,182
$2,232,455
$2,036,513
3,061,070
2,302,130
2,228,935
APEX Reimbursement
963,454
3,684
7,349
Other
213,076
221,421
213,130
$7,857,783
$4,759,690
$4,485,927
$8,169,022
$5,291,808
$5,125,862
-
-
-
$8,169,022
$5,291,808
$5,125,862
REVENUES Open Space City Cash Transfer
Total Revenues EXPENDITURES Ongoing Capital Total Expenditures Income/(Loss) Ending Fund Balance
(311,239) $4,143,761
(532,118)
(639,935)
$3,922,882
Revenue Highlights Jefferson County Open Space revenue, the largest source of income funding Arvada Parks operations, was almost 10% greater in 2015 compared to a similar period in 2014 and is representative of the robust growth in Jefferson County. All other revenue categories performed as expected - overall, a very strong quarter.
Expenditure Highlights
Arvada Reservoir Photo Credit Richard Assmus AUG 2013
Second quarter expenses are in line with previous year’s expenses for a similar time period. Griffith Station and Britton Parks were completed in the third quarter of 2015. Additional budget for the maintenance needs of these parks will be added to the 2016 budget.
9
PARKS FUND
PARKS FUND
PARKS FUND REVENUE
Parks Fund Revenue $8,000,000 $7,000,000 $6,000,000 $5,000,000 $4,000,000 $3,000,000 $2,000,000 $1,000,000 $-
09/30/12 $2,541
09/30/13 $-
09/30/14 $7,349
09/30/15 $3,684
2015 Budget $938,454
Cash Transfer
$2,130,205
$2,106,033
$2,162,659
$2,228,935
$2,302,130
$3,061,070
Open Space
$1,789,135
$1,867,491
$1,689,316
$2,036,513
$2,232,455
$3,620,182
APEX
Kipling PED Crossing Photo Credit Richard Assmus SEPT 2015
09/30/11 $2,040
10
Special Revenue Funds account for revenues that are to be used for specific purposes. The following funds are considered special revenue funds: • Tax Increment Funds • Community Development • Housing
Tax Increment Funds Overview There are two tax increment funds which account for the voter-approved sales tax increases to fund expanded police services. The first accounts for the .21 cent sales tax for police services and the second accounts for the .25 cent sales tax. Sources in the funds include sales tax, general use tax, auto use tax, building use and interest income. Since the tax increment is in addition to the City’s 3% sales tax, revenue trends in the tax increment fund will closely follow those in the general fund.
.21 and .25 Tax Increment Funds Beginning Fund Balance
2015 Budget
As of 9/30/15
As of 9/30/14
$7,449,000
$7,449,000
$6,811,046
$4,657,051
$4,403,165
1,475,580
1,470,257
1,264,835
117,000
143,054
268,565
$8,403,626
$6,270,362
$5,936,565
$8,198,926
$5,285,482
$4,816,859
420,000
23,017
2,524,736
$8,618,926
$5,308,499
$7,341,595
REVENUES Sales Tax/Audit Revenue Use Tax Other Total Revenues EXPENDITURES Ongoing Capital Total Expenditures Income/(Loss)
(215,299)
Ending Fund Balance
$7,233,701
961,863
(1,405,030)
$8,410,863
Revenue Highlights Sales Tax in the third quarter of 2015 reflects an increase of 5.77%. A combination of Auto, Building and Public Improvement Use Taxes has increased $205,422, or 16.24% over the third quarter 2014. Overtime reimbursements, due to participation in programs such as BATTLE through the Colorado Automobile Theft Prevention Authority Board, Rocky Mountain Regional Computer Foresics Lab, and High Visibility Impaired Driving (HVE), have increased 3.86% or $36,730 in comparison to 2014. Transfers from Capital Projects and Federal Grant revenues have decreased 85.97%.
Expenditure Highlights In comparison to the same time period in 2014, salaries and benefits in the third quarter of 2015 have increased 8.74%. Combined, assignment and on-call pay increased over $41,000, with the 2015 approved policy change. Shift differential pay, however, has decreased slightly at just under $1,500 during the same time period. Overtime saw an 28.51% increase, or $40,502 over third quarter 2014. With the completion of the comunity stations during the first quarter of 2014, Capital Expenditures continue to reflect a large decrease.
Arvada Police Officer Photo Credit Richard Assmus JUL 2013
11
SPECIAL REVENUE FUNDS
Special Revenue Funds Overview
Community Development
Community Development Fund
2015 Budget
As of 9/30/15
The Community Development Fund accounts for all entitlements, revenues and expenditures of the Community Development Block Grants (CDBG) program and the Home Rehabilitation program and Essential Home Repairs program.
Beginning Fund Balance
$6,299,000
$6,299,000
$ 114,737
$ 146,401 $ 103,398
Revenue Highlights
City Cash Transfer
A few substantial deferred loan re-payments caused the uptick in Recovered Revenues, while the considerable drop in Grants Revenue was primarily a consequence of the timing of City drawdowns from HUD.
Expenditure Highlights
Ongoing
Overview
A drop in year-to-date expenditures on energy efficiency audits and improvements represents much of the overall decreases in Ongoing Expenditures. Last year’s Capital Project Transfer reflects payments for the renovation of the Memorial Neighborhood Park Revitalization project, which was completed in 2014.
As of 9/30/14
REVENUES Recovered Grants
668,001
245,778
402,574
45,000
33,750
33,750
Interest/Other
9,000
37,590
7,487
Total Revenues
$ 836,738
$ 463,519
$ 547,209
$ 624,727
$ 426,580 $ 488,564
EXPENDITURES Essential Home Repairs
392,044
197,099
213,369
Loans
-
-
80,000
Capital Proj. Transfer
-
-
170,077
$1,016,771
$ 623,679
$952,011
(180,033)
(160,160)
(404,802)
$6,118,967
$6,138,840
2015 Budget
As of 9/30/15
Total Expenditures Income/(Loss) Ending Fund Balance
Arvada Housing Authority Overview
The Authority administers funds received for rent subsidy to low/ moderate income households under Section 8 of the U.S. Housing Assistance Payment Program.
Revenue Highlights The substantial jump in Grants Revenue was primarily due to the timing of receipts from the US Department of Housing & Urban Development. It is worth noting that the spread between year-todate 2015 and year-to-date 2014 revenue has dropped from 43% at midyear to 18% through September 30th.
Expenditure Highlights As of September 30th, the Arvada Housing Authority was assisting 465 families with monthly rent subsidies out of a maximum 508. These subsidies continue to constitute approximately 90% of the Fund’s expenditures. As with Grants Revenue, increased Rents Expenditures were due primarily to timing in the first half of the year. The drop in client families is notable due to the current rental market. Normally, when a family leaves the program, the Authority would fill the vacancy with another family. However, with drastic increases in rental costs, the AHA hasn’t been filling vacancies. Instead, it is using the cost savings to cover elevated costs for the remaining families in the program.
Arvada Housing Authority Beginning Fund Balance
$
16,000
$
16,000
$
19,178
$
12,273
As of 9/30/14
REVENUES Recovered Grants
$
18,139
3,939,000
2,976,810
2,518,163
82,400
50,000
50,000
Interest/Other
1,000
216
216
Total Revenues
$4,041,578
$3,039,299
$2,586,518
$ 381,443
$
267,185
$ 239,638
3,638,166
2,663,872
2,480,279
31,333
8,630
19,767
$4,050,941
$2,939,686
$2,739,684
(9,363)
99,613
(153,166)
6,637
$ 115,613
Transfers
EXPENDITURES Ongoing Rents Transfers Total Expenditures Income/(Loss) Ending Fund Balance
$
EOC ENERGY ASSISTANCE 2011-2015 through September - Dollars (Grants) $50,000
The City directly receives funding from Energy Outreach Colorado (EOC), a nonprofit corporation, and disburses it to low-income residents of Arvada as assistance with costs related to energy.
Total Dollars
$40,000 $30,000 $20,000 $10,000 $0 Series1
12
2011 $40,972
2012 $45,500
2013 $32,462
2014 $33,242
2015 $34,256
58th & Allison Street Resurface Photo Credit Ryan Adler AUG 2015
The Capital Improvement Projects Fund is where the City keeps track of capital projects for streets, traffic, parks and the Arvada Center.
Capital Projects Capital Improvement Fund
2015 Budget
As of 9/30/15
As of 9/30/14
Beginning Fund Balance
$ 38,551,182
$ 38,551,182
REVENUES
$ 7,528,952
$ 10,439,536
$ 2,114,681
CIP Administration
$ 10,011,960
$ 4,795,173
$ 5,010,676
CIP Street Projects
1,181,090
592,031
1,040,443
CIP Traffic Projects
2,269,479
1,291,992
1,524,139
CIP Park Projects
2,807,848
3,191,981
3,593,713
50,000
249,571
248,973
$16,320,377
$ 10,120,748
$11,417,944
EXPENDITURES
CIP Arvada Center Total Expenditures Income/Loss Ending Fund Balance
(8,791,425)
$318,788
$ 29,759,757
$ 38,869,970
(9,303,263)
Revenue Highlights In 2015, the majority of the revenue in the CIP Fund consists of transfers from the General Fund and Lands Dedicated Fund. The revenues also include a one-time transfer of $3,106,046 from the General Fund for the Olde Town Transit Hub and $90,000 for improvements to 82nd and Simms approved in the carry-over ordinance in March.
Expenditure Highlights Expenditures in the third quarter include costs for Britton and Griffith parks, park renovation projects, the Kipling underpass, traffic signal maintenance and the Olde Town Transit Hub.
13
CAPITAL IMPROVEMENT PROJECTS FUND
Capital Improvement Projects (CIP) Fund Overview
Project Highlights With a fund balance of over $38 million, there are many capital improvement projects happening in the City. While the new projects generally get most of the attention, there are projects that fall into the “Taking Lasting Care” category. These projects are equally important because we need to make sure that we take care of the City’s existing infrastructure. Playgrounds and traffic signals will be the focus of the third quarter Capital Improvement fund with additional details provided below. Playground Renovation: With 64 parks in the City of Arvada, it is a priority to make sure that we keep the parks maintained and safe for the citizens that visit these parks. In 2015, there are three parks that are undergoing a complete renovation. Meadowlake Park, Oak Park and Jack B. Tomlinson Park have all new playground equipment and refurbished site furnishings, including benches, picnic tables and trash receptacles. The City will spend almost $700,000 to renovate these three parks. Meadowlake and Oak Parks have been completed and Jack B. Tomlinson Park will open in late October.
Sidewalk Replacement R alston Road Photo Credit Ryan Adler OCT 2015
Sidewalk Replacement R alston Road Photo Credit Ryan Adler OCT 2015
Traffic Signal Maintenance: This project will reconstruct 5 of the City’s 112 traffic signals to modernize outdated equipment. New equipment will provide increased functionality including new cabinets, uninterruptible power supply (UPS) backup, traffic signal indications, detections systems and communication capabilities which are currently lacking. Construction will also include new structural equipment including new traffic signal poles, pedestrian signal poles and mast arms. Minor striping and sidewalk improvements with ramp modifications are also included. A total of $851,000 will be spent on the following traffic signals: • West 64th Avenue and Quay Street • West 55th AVenue and Marshall Street • West 64th Avenue and Carr Street • West 55th Avenue and Saulsbury Court • 57thAvenue immediately west of Zephyr Street
14
Overview The Water Fund accounts for all activities within the scope of the water utility operations including administration, operations, capital water projects, financing and related debt service and billing and collection. Water Fund Beginning Fund Balance
2015 Budget
As of 9/30/14
As of 9/30/15
$71,970,000
$71,970,000
$20,700,210
$11,558,516
$12,808,614
Tap Fees
8,329,106
7,035,678
5,663,693
Interest
329,438
240,334
187,239
Other
698,449
1,445,203
1,459,514
$30,057,203
$20,279,731
$20,119,060
$17,744,709
$12,144,174
$10,854,847
Debt Service
2,261,700
-
-
Major Capital Maintenance
4,087,564
2,723,816
3,187,542
Capital
5,058,656
1,549,641
1,021,453
$29,152,629
$16,417,631
$15,063,843
904,574
3,862,099
5,055,217
$72,874,574
$75,832,099
REVENUES Water Charges
Total Revenues EXPENDITURES Ongoing
Total Expenditures Income/(Loss) Ending Fund Balance*
Revenue Highlights
Arvada Reservoir Photo Credit Richard Assmus JUNE 2014
Revenues from Water Charges were down 9.8% through the first nine months of the year, with consumption down 22.3% due to prolonged stretches of wet weather earlier in the year. The difference between revenues and consumption was due to the timing of utility cycle batch postings. Tap Fees continued to pour in, reflecting ongoing substantial residential building activity.
Expenditure Highlights A majority of the increase in Ongoing Expenditures was due to the timing of a raw water payment to Denver Water and an increase in professional service expenses. The decrease in Major Capital Maintenance Expenditures was due to the timing of annual expenditures. The increase in Capital expenditures was due to work extending the City’s water system northwest to accommodate growth. Debt Service will be paid out in the fourth quarter. *$37,298,909 of the Fund Balance is a cash escrow reserved in Denver Water’s name for the Gross Reservoir expansion.
15
ENTERPRISE FUNDS
Water Fund
Water Consumption This chart, with data provided by Utilities, shows water consumption through September by year since 2011.
Thousands of Gallons
WATER CONSUMPTION As of September 4,500,000 4,000,000 3,500,000 3,000,000 2,500,000 2,000,000 1,500,000 1,000,000 500,000 -
1000s of Gallons
2011 3,386,517
2012 4,261,633
2013 3,536,589
2014 3,438,791
2015 2,671,070
This chart shows water tap fee revenue through September by year since 2011.
Dollars
WATER FUND - TAP FEES As of September $7,200,000 $6,400,000 $5,600,000 $4,800,000 $4,000,000 $3,200,000 $2,400,000 $1,600,000 $800,000 $Tap Fees
2011 $1,683,340
2012 $2,662,486
2013 $5,075,958
16
2014 $5,663,693
2015 $7,035,678
Wastewater Fund Overview The Wastewater Fund accounts for all activities necessary in the collection, transmission and disposal of sewage and wastewater. WasteWater Fund
2015 Budget
As of 9/30/15
$13,048,000
$13,048,000
$12,401,341
$7,746,218
$7,665,501
Tap Fees
555,211
777,170
546,327
Interest
128,674
82,806
72,310
Other
612,581
481,474
442,833
$13,697,807
$9,087,668
$8,726,971
$7,832,149
$5,874,112
$5,535,546
Ongoing
3,140,527
2,025,518
1,993,995
Major Capital Maintenance
2,720,762
1,771,024
593,844
Beginning Fund Balance
As of 9/30/14
Revenue Highlights Sewer Tap Fee Revenues remain high due to robust residential construction. Sewer Charges for 2015 are on pace to meet budget and are slightly ahead, 1%, over 2014.
REVENUES Sewer Charges
Total Revenues EXPENDITURES Metro District
Capital Total Expenditures
501,500
-
-
$14,194,938
$9,670,653
$8,123,384
Income/(Loss)
(497,131)
Ending Fund Balance
$12,550,869
(582,985)
Expenditure Highlights Treatment charges from the Metro Wastewater Reclamation District represented three-fifths of Total Expenditures through the first nine months of the year. The jump in Major Capital Maintenance Expenditures was due to the timing of payments on contract work.
603,586
$12,465,015
Wastewater Tap Fees This chart shows sewer tap fee revenue through September by year since 2011.
Dollars
WASTEWATER FUND - TAP FEES As of September $800,000 $720,000 $640,000 $560,000 $480,000 $400,000 $320,000 $240,000 $160,000 $80,000 $0 Tap Fees
2011 $152,845
2012 $356,045
2013 $555,486
17
2014 $546,327
2015 $777,170
Stormwater Fund Overview The Stormwater Fund accounts for all activities necessary to maintain a stormwater management plan. Stormwater Fund Beginning Fund Balance
2015 Budget
As of 9/30/15
As of 9/30/14
$5,565,000
$5,565,000
$3,326,374
$2,424,310
$2,342,044
32,341
52,313
193,410
$3,358,715
$2,476,623
$2,535,454
$2,056,716
$958,604
$855,707
933,288
699,966
699,600
1,635,000
1,660
1,104,096
Total Expenditures
$4,625,004
$1,660,229
$2,659,403
Income/(Loss)
(1,266,289)
Ending Fund Balance
$4,298,711
REVENUES Stormwater Fee Other Total Revenues EXPENDITURES Ongoing Debt Service Capital
816,394
(123,949)
$6,381,394
Revenue Highlights The City’s Stormwater Utility Fee rate rose by 2% as of the beginning of 2015, the first increase since 2009.
Expenditure Highlights The drop in Capital Expenditures was due to the absence of payments on the Garrison Street Bridge Replacement and related Ralston Creek channelization, which were wrapping up in early 2014. The increase in Ongoing Expenses was due to the timing of payments on miscellaneous drainage projects.
Hills at Standley Lake Garden Photo Credit Richard Assmus M AY 2014
18
Golf Fund Overview The Golf Course Fund accounts for all revenues and expenses of the Lake Arbor and West Woods Golf Courses, including food service operations.
Revenue Highlights
Golf Fund
After a challenging second quarter, with its unprecedented rains and subsequent negative impact on golf, rounds played roared back in the third quarter. Strong play, especially at West Woods Golf Club, boosted golf-related revenue from 5% down compared to 2014, to 2% up. West Woods Golf Club tournament rounds were up 30% in the third quarter and up 69% in September alone, compared to 2014, a result of a new tournament recruitment and a later aeration date which opened up the booking inventory. Rounds played at Lake Arbor Golf Club did not post the same results as West Woods Golf Club still down 10% for the year. Golf Restaurant revenue is 7% greater this year compared to year-to-date 2014. This was, overall, a very strong quarter.
2015 Budget
As of 9/30/15
$ 207,000
$ 207,000
Golf Courses
$3,489,178
$2,694,170
$2,625,535
Restaurants
1,228,929
1,235,407
1,158,278
215,759
174,156
157,106
$4,933,866
$4,103,733
$3,940,919
Golf Courses
$2,210,629
$1,532,435
$2,129,957
Restaurants
1,340,870
1,168,517
1,030,602
Administration
1,298,272
954,835
237,785
241,000
7,813
-
$5,090,770
$3,663,600
$3,398,344
(156,904)
440,133
542,575
$50,096
$647,133
Beginning Fund Balance
As of 9/30/14
REVENUES
City Cash Transfer Total Revenues EXPENDITURES
Capital Total Expenditures
Expenditure Highlights Third quarter expenses are in line with projections.
Income/(Loss) Ending Fund Balance
Westwoods
Variance
2014
2015
28,580
29,829
1,249
4%
Super Users Annuals
6,042
6,866
824
14%
Tournament
4,304
4,816
512
12%
486
678
192
40%
39,412
42,189
Player Support
Grow the Game Total
Lake Arbor
2,777
7%
Variance
2014
2015
Player Support
19,878
17,578
(2,300)
-12%
Super Users Annuals
13,417
11,841
(1,576)
-12%
Tournament
716
901
185
26%
Grow the Game
373
496
123
33%
34,384
30,816
Total
(3,568)
-10%
19
West Woods Golf Club Photo Credit Richard Assmus M AY 2014
Golf Rounds by Type - January - September
Hospitality Fund Overview The Hospitaliuty Fund accounts for all revenue and expenses associated with food service activities including the operation of banquet facilities at the Arvada Center for the Arts and Humanities and offsite catering.
Revenue Highlights Overall, Arvada Hospitality income posted a modest increase in the third quarter 2015 compared to a similar period in 2014. Although the Arvada Center and In-house Markets have continued to decrease each year (a decline of $63,000 annually over the past 5 years), the Association, Government, Religious, and Corporate segments have been maintained or increased. Through the third quarter, year-to-date performance has also increased, compared to 2014, in the Social, Government, and Wedding markets. The Education market continues to be at risk with budgetary constraints and re-evaluation of meeting dollars spent. All other revenue categories performed as expected.
Expenditure Highlights Total expenses are approximately 3% below 2014 levels and within established margins. Large capital expeditures, related to replacing aging equipment, have been placed on hold pending the results of the hospitality feasibility study.
Hospitality Fund Beginning Fund Balance
2015 Budget
As of 9/30/15
As of 9/30/14
$ 602,000
$ 602,000
$1,032,380
$
REVENUES Sales
517,686
$
438,299
Concession Services
192,444
135,873
138,422
Banquet and Guest Services
614,514
331,454
403,998
Total Revenues
$1,839,338
$
985,013
$
980,718
$
$
226,672
$
220,376
EXPENDITURES Administration Operations
724,055 1,296,310
651,541
686,117
Capital
-
-
-
Transfer to General Fund
-
-
20,601
Total Expenditures
$2,020,365
Income/(Loss)
$
(181,027)
Ending Fund Balance
$
420,973
878,214 106,800
$
$
927,094 53,624
708,800
Taste of Arvada Photo Credit Richard Assmus NOV 2012
20
We have five Internal Service Funds – Insurance Fund (Risk Management), Computer Fund, Print Services Fund, Vehicles Fund and Building Fund. Internal Service Funds charge internal programs and departments for use of goods and services. The Funds then pay for all associated costs of things such as purchasing insurance, vehicle purchases and maintenance, computer purchases and maintenance, and buildings maintenance.
Insurance Fund Overview The Insurance Fund, administered by the Risk Management Program of Finance, accounts for the City’s self-insurance against loss. It is funded with contributions by all City departments and programs based on their levels and types of exposure. The Fund is also used for loss prevention programs, the protection of City personnel and the preservation of City property and assets. Insurance Fund Beginning Fund Balance
2015 Budget
As of 9/30/15
As of 9/30/14
$4,065,000
$4,065,000
$1,817,992
$1,363,642
$1,524,655
72,120
65,690
65,820
$1,890,112
$1,429,332
$1,590,475
$2,126,669
$1,519,498
$1,242,416
426,889
302,102
283,709
$2,553,558
$1,821,600
$1,526,124
REVENUES Contributions Other Total Revenues EXPENDITURES Risk Mgmt Administration Risk Mgmt Operations Total Expenditures Income/(Loss) Ending Fund Balance*
(663,446) $3,401,554
(392,268)
64,351
$3,672,732
Revenue Highlights The reduction in Contributions Revenue was due to a 28% cut in charges for operations, which was hastened by the move of two City Attorney’s Office FTEs from the Insurance Fund to the General Fund. Charges for lines of coverage - Workers Compensation, General Liability, Auto Liability, Property, and Auto Physical - remained generally unchanged.
Expenditure Highlights Increases in claims expenses included a jump in Auto Physical claims due to a hail storm earlier in the year and settlements for General Liability claims stemming from a water main break in December 2014.
*Per GASB Statement 10, an additional $1,269,963 in cash is currently held in the Risk Management Fund to cover potentially incurred liabilities as of the beginning of the year. This figure was reached by Risk Management’s actuary for 2014.
21
INTERNAL SERVICE FUNDS
Internal Service Funds Overview
Computer Fund & Print Services Fund Overview The Computer Fund provides resources for both ongoing maintenance and replacement of the City’s computers, network hardware, and other electronic infrastructure. It is funded with contributions by all City divisions based on their levels of use of this technology. The Print Services Fund provides ongoing capital support for the City’s printing needs. Because these two funds operate to support combined activities within the Information Technology Department, the financial reporting is combined for these two funds. Computer Fund/ Print Services Fund
2015 Budget
As of 9/30/15
$6,240,000
$6,240,000
Maintenance
$ 950,006
$ 715,072
$ 719,734
Replacement
961,061
777,360
729,282
Print Shop
464,463
294,356
243,744
$2,375,530
$1,786,787
$1,692,759
Maintenance
$1,072,121
$ 603,729
$ 604,916
Replacement
2,323,213
487,441
500,075
450,581
242,747
284,706
$3,845,915
$1,333,917
$1,389,697
452,870
303,062
Beginning Fund Balance
As of 9/30/14
REVENUES
Total Revenues EXPENDITURES
Print Shop Total Expenditures Income/(Loss)
(1,470,385)
Ending Fund Balance
$4,769,615
$6,692,870
Revenue Highlights Revenues in the Maintenance and Replacement funds are on track as budgeted for 2015. In planning for 2016 we are seeing an increase in maintenance costs for some technologies that are priced based on capacity or performance. These will be worked into future budget plans. The Print Shop revenue is a little behind budget but should not be an issue as we are keeping pace with expenditures.
Expenditure Highlights Most expenditures are on track in the Maintenance and Replacement funds. Some replacement expenditures may get pushed into 2016. We are performing a longer evaluation process in order to effectively evaluate the proper replacement products. Some existing maintenace expenses have increased as the pricing model on certain systems (ie. backup software) is based on the performance capability of the hardware. These systems are in the process of being evaluated to determine if they are still appropriate for our changing environment. The Print Shop expenditures are below budget with no major changes expected between third quarter and the end of the year.
22
Vehicles Overview
Revenue Highlights
The Vehicles Fund provides resources for the maintenance of City vehicles and heavy equipment and/or replacement. It is funded with contributions by all City divisions based on their vehicle inventory and use.
Charges for Vehicle Maintenance services, which include personnel costs, rose 3% over 2014 levels. Charges for Vehicle Replacement contributions rose 1% over 2014 levels. Gains from the sale of retired units were the source of the increase in Other Revenues.
Vehicles Fund Beginning Fund Balance
2015 Budget
As of 9/30/15
$6,247,000
$6,247,000
As of 9/30/14
Expenditure Highlights
REVENUES Maintenance Transfers
$2,321,122
$1,740,841
$1,690,139
Replacement Transfers
1,130,947
848,210
839,813
144,378
269,103
125,072
$3,596,447
$2,858,155
$2,655,023
Maintenance
$3,056,258
$1,712,819
$1,462,576
Replacement
1,725,440
1,117,351
1,213,289
Total Expenditures
$4,781,698
$2,830,170
$2,675,865
Income/(Loss)
(1,185,251)
Ending Fund Balance
$5,061,749
$6,274,985
2015 Budget
As of 9/30/15
$2,368,000
$2,368,000
$ 446,814
$ 335,111
$ 323,476
136,312
133,700
130,096
$ 583,126
$ 468,810
$ 453,572
Replacement
$ 588,615
$
$
Capital Lease
120,918
86,526
$ 709,533
$ 108,015
Other Total Revenues EXPENDITURES
27,985
(20,842)
The rise in Maintenance Expenditures reflects both increased outlays for parts and fuller staffing of Fleet operations through the first nine months of 2015 versus 2014. Additionally, Fleet in January began keeping some personnel on-call during winter weather months to better ensure staff availability to service plow vehicles. This change will cost the Vehicles Fund approximately $25,000 a year. Budgeted Maintenance Expenditures include $500,000 for the construction of a new storage building at the Indiana Shops, which will include a police weapons testing range. Construction remains delayed and may be pushed out to 2016. There are currently 19 units up for replacement in 2015.
Buildings Building Fund Beginning Fund Balance
As of 9/30/14
REVENUES Replacement Transfers Other Total Revenues EXPENDITURES
Total Expenditures Income/(Loss) Ending Fund Balance
(126,407) $2,241,593
21,489
360,796
536 85,398
$
85,934 367,637
$2,728,796
23
Overview The Buildings Fund provides resources for maintaining major portions of facility infrastructure as replacement becomes necessary. The primary types of infrastructure are HVAC equipment, parking lots, roofs, and carpet. It is funded with contributions by all City divisions based on their facility occupancy.
Revenue Highlights Monthly replacement charges from contributing funds were generally increased by 3% for 2015, having been frozen since 2009.
Expenditure Highlights The Capital Lease Expenditures represent payments per an agreement with Siemens Building Technologies in 2004 for energy efficiency improvements at various City facilities. The term of this lease expires in 2016. Several HVAC replacements scheduled for the past couple of years are being deferred to 2016 in order to exploit better pricing with economies of scale. This represents the difference in the yearly budget and the current actual expenditures.
Arvada Economic Development Association (AEDA) Overview AEDA was established to encourage and stimulate all forms of economic development – commercial and industrial. The services provided by AEDA benefit both the City and citizens by providing information and services to existing and prospective businesses and industries. Funding for AEDA consists of compensation from the City for services it renders the City and its citizens. The City also provides administrative support for AEDA. A Board of Directors appointed by City Council governs AEDA. 2015 Budget
Beginning Fund Balance
$475,577
$475,577
Revenue
790,879
595,318
585,046
Expenditures
784,897
485,042
521,780
$481,559
$585,853
Ending Fund Balance
As of 9/30/15
As of 9/30/14
Operations
Revenue Highlights Revenue in the AEDA Operations Fund consists of a transfer from the general fund equal to the personnel and operating expenditures.
Expenditure Highlights Year-to-date expenditures in 2015 are at 62% of budgeted expenditures and are slightly less than 2014 expenditures. Salaries and benefits represent the largest expenditure at approximately 54% of the total expenditures.
Beginning Cash Balance Revenue Expenditures
9/30/2015 $579,836 790,614 (504,897)
Ending Cash Balance
865,553
Reserved for Job Creation Program
(18,000)
New Entrepreneur Program
(19,500)
Arvada Manufacturing Initiative
(5,400)
Commitments
(464,201)
Available Unallocated Cash Balance
$358,452
Revenue Highlights
Photo Credit Richard Assmus
Program
Revenues in 2015 consist of a cash contribution from the City of Arvada for $500,000, repayments from two loans and interest income.
Expenditure Highlights Expenditures in 2015 reflect 26 AEDA small business grants and one loan. The grants are used to help Arvada businesses improve signage, landscaping, facades and site improvements.
24
TOD Olde Town Station Photo Credit Ryan Adler SEPT 2015
Pursuant to the City’s investment policy, the primary objectives of the City’s investment activities, in priority order are safety, liquidity and yield. Consistent with this policy, the portfolio of securities is invested in US Treasuries, US Agency debt, local government investment pools (LGIP’s), commercial paper, and corporate debt subject to rating and concentration limits. The City’s investment portfolio is managed to provide sufficient liquidity to meet all reasonably anticipated operating cash needs without selling securities prior to maturity.
Investment Portfolio Overview The annualized yield on the City’s investment portfolio in the third quarter of 2015 was 0.751%, which is an increase of almost 10 basis points (bps) in comparison with the third quarter of 2014. The City’s portfolio has been consistently performing above the composite benchmark yield, which is calculated as a weighted average yield of relative securities of the same or similar class and maturity as in our portfolio. The year-to-date benchmark yield for the third quarter of 2015 was 0.570%. Overall, we can see a very modest but steady improvement in the City’s portfolio performance over the last few years but the rates are still anchored by the Federal Reserve’s near-zero target interest rate policy. There has been a lot of volatility in the market lately caused by uncertainty surrounding the global slowdown of growth (particularly in China) and the timing of the Federal Reserve’s first move to raise interest rates. The spreads over Treasuries have widened a little especially in the corporate debt sector. But good quality corporate bonds are hard to come by. The City’s investment portfolio increased by $10 million compared to the same time last year, which was primarily allocated to US Agencies. The balance in our savings and money market accounts were reduced to a minimum, since they only pay 3-6 bps. We have been keeping a large balance in our checking account to offset monthly banking fees. Now that the interest rates on LGIPs have been going up and currently yield 20 bps, we moved cash out of the checking account into LGIP funds to maximize the return on idling cash. During the third quarter of 2015 the portfolio saw only $18.6 million in calls. When reinvesting, we continue to focus on the shorter term securities and take advantage of longer term step-up bonds (with preset increases in coupon rate as the bonds approach maturity) to minimize the interest rate risk. Key information regarding the City’s portfolio is shown in the following tables and graphs:
25
CITY OF ARVADA INVESTMENT REPORT
Investment Portfolio Objectives
PORTFOLIO PERFORMANCE 09/30/2015 $940,590 0.751% 0.570% +18bps
YTD Interest Earnings Portfolio Yield Benchmark Yield Tracking Error
PORTFOLIO CHANGES 09/30/2015 $114,706 3,977,773 15,066,381 5,995,000 33,676,986 127,000,000 $185,830,846
Money Market Savings/ Cash CD Corporate LGIP US Agency Total
09/30/2014 $774,488 0.653% 0.420% +23bps
Difference $166,102 0.098% 0.150% -5bps
09/30/2014 $1,013,670 12,498,356 15,151,772 5,995,000 25,199,385 115,725,000 $175,583,183
Difference $(898,964) (8,520,583) (85,391)
ACCOUNT SUMMARY Par Value $185,830,846 Book Value $185,831,327 Market Value $185,960,021 Unrealized Gain/(Loss) $ 129,175
8,477,602 11,275,000 $10,247,663
PORTFOLIO ALLOCATION US Agency, 68.4%
PORTFOLIO CHARACTERISTICS Average Duration (yrs) 1.85 Average Coupon 0.837% Average Cost YTM 0.935% Average Market YTM 0.901%
LGIP, 18.1%
Corporate, 3.2%
MATURITY DISTRIBUTION 30.0% 25.0%
27.4%
24.1%
21.3%
20.0% 15.0%
10.5%
9.7%
10.0%
7.0%
5.0% 0.0%
0-.25
.25-1
1-2
Maturity (yrs)
26
2-3
3-4
4-5
Money Market, 0.1% CD, 8.1% Savings/ Cash, 2.1%
City of Arvada Investments as of September 30, 2015 The City’s portfolio as of September 30, 2015 is shown below, which includes credit ratings as of September 30, face value and actual interest earnings for 2015. Description
CUSIP/Ticker
Credit Rating 09/30/2015
Coupon Rate
Maturity Date
Ending Face
Interest
Amount/Shares
Dividends
SAVINGS/CHECKING JPMorgan Chase Savings
CHASE
N/A
0.03%
N/A
146,646
80
Wells Fargo Savings
WELLSFARGO
N/A
0.06%
N/A
136,275
214
0.30%
N/A
3,694,851
-
3,977,773
294
JP Morgan Checking Sub Total Savings/Checking CERTIFICATE OF DEPOSIT Vectra Bank
5791396061
N/A
0.55%
06/25/2016
5,025,145
13,913
Vectra Bank
5791396079
N/A
0.55%
06/25/2016
5,025,145
13,913
Vectra Bank
5791396095
N/A
0.55%
07/07/2016
1,007,320
2,320
Vectra Bank
5791396103
N/A
0.65%
08/29/2016
1,002,193
2,193
Vectra Bank
5791396111
N/A
0.65%
08/29/2016
1,002,193
2,193
Vectra Bank
5791396129
N/A
0.65%
08/29/2016
1,002,193
2,193
Vectra Bank
5791396137
N/A
0.65%
08/29/2016
1,002,193
2,193
15,066,381
38,917
Sub Total Certificate Of Deposit CORPORATE Apple, Inc
037833AH3
AA1
0.45%
05/03/2016
1,410,000
3,173
Exxon Mobil
30231GAA0
AAA
0.92%
03/15/2017
1,500,000
13,815
Berkshire Hathaway
084664BX8
AA2
0.95%
08/15/2016
3,085,000
29,308
5,995,000
46,295
Sub Total Corporate LOCAL GOVERNMENT INVESTMENT POOL C Safe LGIP
CSAFE
AAAm
0.19%
N/A
10,919,539
12,495
Colo Trust LGIP
COLOTRUST8001
AAAm
0.20%
N/A
17,847,323
13,177
Colo Trust LGIP
COLOTRUST8004
AAAm
0.20%
N/A
174,065
216
Colo Trust LGIP
COLOTRUST8008
AAAm
0.20%
N/A
4,554,990
5,123
Colo Trust LGIP
COLOTRUST8010
AAAm
0.20%
N/A
Sub Total Local Government Investment Pool
181,069
536
33,676,986
31,547
114,706
822
114,706
822
MONEY MARKET CSIP MM
CSIP
AAAm
0.15%
N/A
Sub Total Money Market US AGENCY FFCB 0.33 11/13/2015
3133ED7L0
AAA
0.33%
11/13/2015
5,000,000
8,250
FFCB 0.6 11/21/2016-13
3133EC3M4
AAA
0.60%
11/21/2016
3,000,000
9,000
FFCB 0.64 5/9/2017-14
3133ECP40
AAA
0.64%
05/09/2017
5,000,000
16,000
FFCB 1.09 2/26/2018-15
3133EEP46
AAA
1.09%
02/26/2018
6,000,000
16,350
FFCB 1.18 2/13/2018-15
3133EEK41
AAA
1.18%
02/13/2018
5,000,000
14,750
Chart continues next page
27
Description
CUSIP/Ticker
Credit Rating 09/30/2015
Coupon Rate
Maturity Date
Ending Face
Interest
Amount/Shares
Dividends
FFCB 1.41 3/1/2019-15
3133EFBP1
AAA
1.41%
03/01/2019
5,000,000
-
FFCB 1.6 9/23/2019-16
3133EFEL7
AAA
1.60%
09/23/2019
5,000,000
-
FFCB 1.73 8/12/2019-16
3133EE6U9
AAA
1.73%
08/12/2019
3,000,000
-
FFCB 1.98 6/29/2020-16
3133EE2S8
AAA
1.98%
06/29/2020
3,000,000
-
FHLB 0.6 4/24/2017
313382TR4
AAA
0.60%
04/24/2017
5,000,000
15,000
FHLB 0.75 3/27/2017-14
313382HT3
AAA
0.75%
03/27/2017
5,000,000
37,500
FHLB 0.75 8/15/2017-13
313382W25
AAA
0.75%
08/15/2017
5,000,000
18,750
FHLB 0.8 4/17/2017-13
313380U88
AAA
0.80%
04/17/2017
3,000,000
12,000
FHLB 1 1/29/2018-16
3130A5UN7
AAA
1.00%
01/29/2018
5,000,000
-
FHLB 1.05 5/30/2018
3130A5UU1
AAA
1.05%
05/30/2018
3,000,000
-
FHLB 2.125 12/28/2015
3133727K4
AAA
2.13%
12/28/2015
2,000,000
21,250
FHLB Step 11/20/2019-15
3130A3EG5
AAA
1.25%
11/20/2019
5,000,000
31,250
FHLB Step 4/30/2018-14
313382T78
AAA
1.00%
04/30/2018
3,000,000
9,375
FHLB Step 7/27/2018-15
3130A5UR8
AAA
0.50%
07/27/2018
5,000,000
-
FHLMC 0.65 12/23/2016-14
3134G56W0
AAA
0.65%
12/23/2016
5,000,000
16,250
FHLMC 0.7 4/28/2017-16
3134G6UC5
AAA
0.70%
04/28/2017
4,000,000
-
FHLMC 0.85 6/23/2017-15
3134G7ET4
AAA
0.85%
06/23/2017
3,000,000
-
FHLMC 1.15 12/26/2017-14
3134G5A21
AAA
1.15%
12/26/2017
5,000,000
28,750
FHLMC 1.25 3/22/2018-15
3134G7CQ2
AAA
1.25%
03/22/2018
5,000,000
15,625
FHLMC 1.25 5/25/2018-16
3134G6L76
AAA
1.25%
05/25/2018
5,000,000
-
FHLMC Step 7/22/2019-15
3134G7EQ0
AAA
1.50%
07/22/2019
5,000,000
-
FHLMC Step 8/17/2018-15
3134G7MU2
AAA
1.00%
08/17/2018
4,000,000
-
FHLMC Step 9/30/2020-16
3134G7XN6
AAA
1.25%
09/30/2020
5,000,000
-
FNMA 1.15 4/30/2018-15
3136G2G84
AAA
1.15%
04/30/2018
5,000,000
-
Subtotal Agency
127,000,000
270,100
Totals
185,830,846
387,975
Investment Management Focus - 2015 2015 continues to be a struggle for the capital markets as the Federal Reserve has kept interest rates low, which will likely continue through 2015. We will continue to monitor the two items of focus we have highlighted below. Diversification of Maturities: We will continue to keep LGIP and cash and savings balances at levels to meet operating and capital needs. We will focus on a blended strategy which calls for emphasis in short-term positions as well as some long-term positions (5 years in the City’s case), but also staggering maturities in between to smooth the revenue stream. This will allow ample cash should the City experience unexpected needs, allow us to take advantage of better coupons in longer maturity buckets and the ability to capitalize on investment opportunities if/when yields begin to recover. Agency spreads are tighter, callables will get better yield: Call provisions are a tool used by issuers to refinance debt at a more attractive rate. Our focus will be to purchase callable securities with a call “lockout” period of six months or more to enhance investment income over the LGIP funds, which are currently yielding 20bps.
28
TOD Hub Site Photo Credit Ryan Adler OCT 2015
Finance Department • 8101 Ralston Road • Arvada, Colorado 80002 720-898-7120 • www.arvada.org Contributors: Bryan Archer, Director of Finance Lisa Yagi, Assistant Director of Finance Ryan Adler, Budget Analyst Deanne Gibboney, Budget Analyst Debra Nielson, Controller Arlene Martinez, Executive Assistant Vesta Weinhauer, Treasury Analyst