CONTRACT FARMING SURVEY


This report presents an analysis of Contract Farming Agreements (CFAs), based on data collected from 113 farms across 18 counties. It offers insight into current performance, emerging trends, and the outlook for the year ahead. The agricultural sector continues to face persistent and widespread challenges, with financial returns showing little sign of meaningful recovery in the near term. Many of the trends identified in previous years remain evident and continue to evolve. A key concern heading into 2026 is the future of environmental schemes, which are playing an increasingly influential role in shaping Contract Farming Agreements.
Key findings include:
Contracting charges have continued to rise, reflecting ongoing cost pressures for contractors.
Farmers’ basic retention has declined, indicating tighter margins and reduced profitability. However, agreement terms appear less responsive to market conditions than initially perceived.
The area of land taken out of production is increasing, as farms seek to de-risk and struggle to produce profitable break crops.
Contract farming agreements are becoming more complex, with growing use of crop-specific contracting rates.
This report concludes that CFAs remain a viable option for landowners who wish to retain active involvement in their farming business. However, agreement structures must be carefully analysed and designed to ensure contractors remain incentivised to deliver high-quality service, and that profitability is achievable in challenging market conditions.
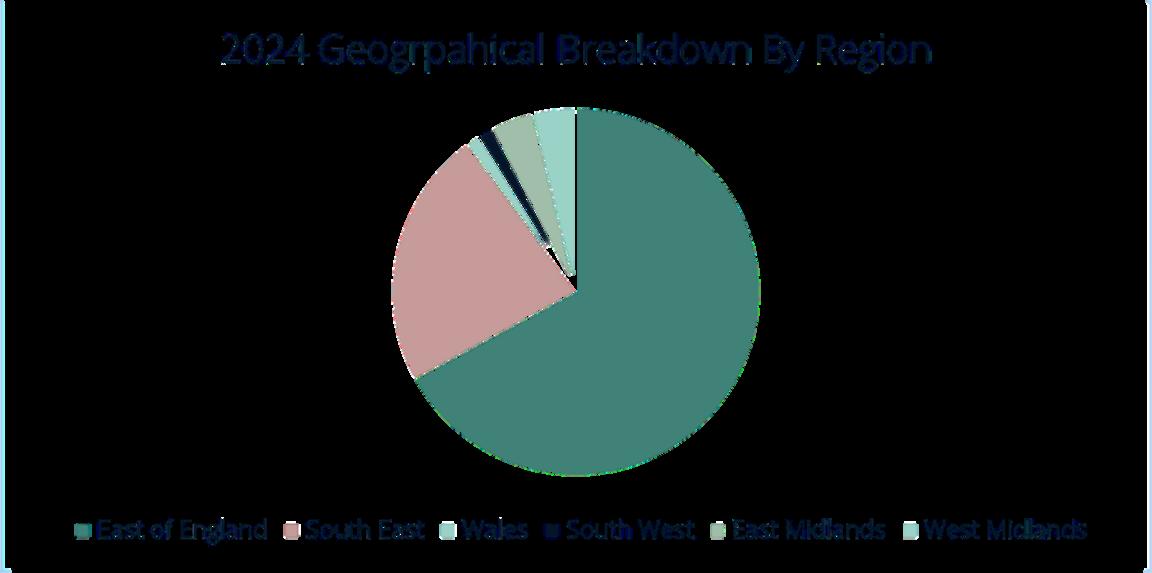
Figure 1. The 2024 geographical distribution of the CFAs included in this study


Contract Farming Agreements continue to support a wide range of farm sizes, from 30-hectare holdings to those exceeding 800 hectares. In 2024, the median farm size within the dataset was 165 hectares, with farms in the Southeast larger on average than those in the East of England.
As environmental schemes become more widely adopted, shifts in cropping patterns are beginning to emerge. Following a wet autumn, the wheat area declined in 2024 but has rebounded in 2025 with a 2% increase.
At the same time, the area of land taken out of production for environmental purposes is increasing significantly. In 2023, this accounted for 5% of all land in the data set, rising to 13% by 2025. When focusing only on farms participating in environmental schemes, the average proportion of land withdrawn from agricultural production increased from 16% in 2024 to 22% in 2025. This change illustrates a significant adjustment at the farm level, indicating that participating farms are committing a larger share of their land to environmental management activities over agricultural production.
This trend varies by region, with farms in the Southeast showing a notably higher average proportion of arable land out of production compared to those in the East. Overall, this supports anecdotal evidence that farms strategically using

Contractor charges have continued to rise steadily over recent years. In 2023, the average rate was £286 per hectare, increasing to £297 per hectare in 2024. Notably, the 2024 increase exceeded earlier forecasts, reinforcing the view that the sector is undergoing notable change. With rising costs and declining total returns, contractors are seeking higher upfront fees to ensure agreements remain fair and sustainable.
When contractor rates are differentiated by crop type, it becomes harder to determine the true average rate, especially given the changing cropping regimes as outlined earlier. Analysing rates at the individual crop level therefore provides essential context. For example, the contracting rate for winter combinables (seen in Table 1) continues to rise, which is important as it serves as a benchmark for many flat-rate agreements.
Table 1. Table showing contracting rates by crop type
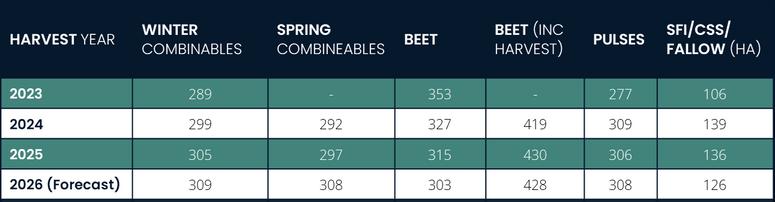
*SFI/CSS/Fallow £/ha average for farms where rates differ to standard arable rate.
*Prior to 2024 beet rates were inclusive of harvesting and excluding harvesting agreements.
Table 1 also presents the average rate for agreements where land taken out of production is priced separately. This is an increasing phenomenon as in 2023, only 11% of agreements were structured this way; by 2026, this figure has grown to 28%. The inclusion of agri-environmental scheme income within the divisible surplus calculation varies and will be explored later in this report.
Over recent seasons, the average Farmers’ Basic Return has shown a considerable decline year-on-year. This trend reflects expectations, as falling profitability has reduced farmers’ financial leverage within contract farming agreements.
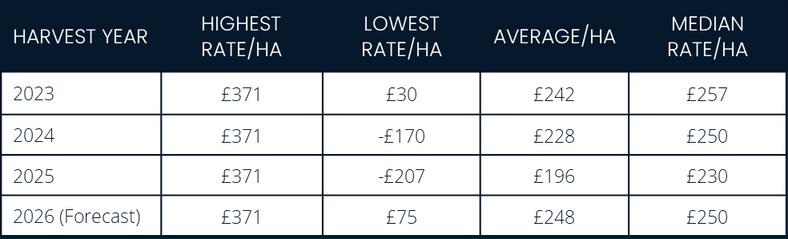
Whilst the forecast for 2026 suggests a recovery in basic returns, it is not directly comparable to the results from previous years. This is because the 2026 figure is a forecast, based on the assumption that all agreements will deliver the full basic return for next harvest. In contrast, the results from 2024 and 2025 reflect actual outcomes which in many cases fell short of the contract terms or even resulted in losses. Therefore, the apparent drop in rates during those years is more likely due to poor performance rather than changes in contract terms. In this context, using the median value is helpful, as it reduces the impact of extreme results caused by the challenging season.
To interrogate the true cause of these results we have tracked the number of agreements up for renewal and found that 21% changed terms for 2025, with a further 23% already adjusted for 2026. This leaves a significant proportion of agreements unchanged, but with the consistently challenging conditions of recent years we may continue to see fundamental restructuring of agreement terms.
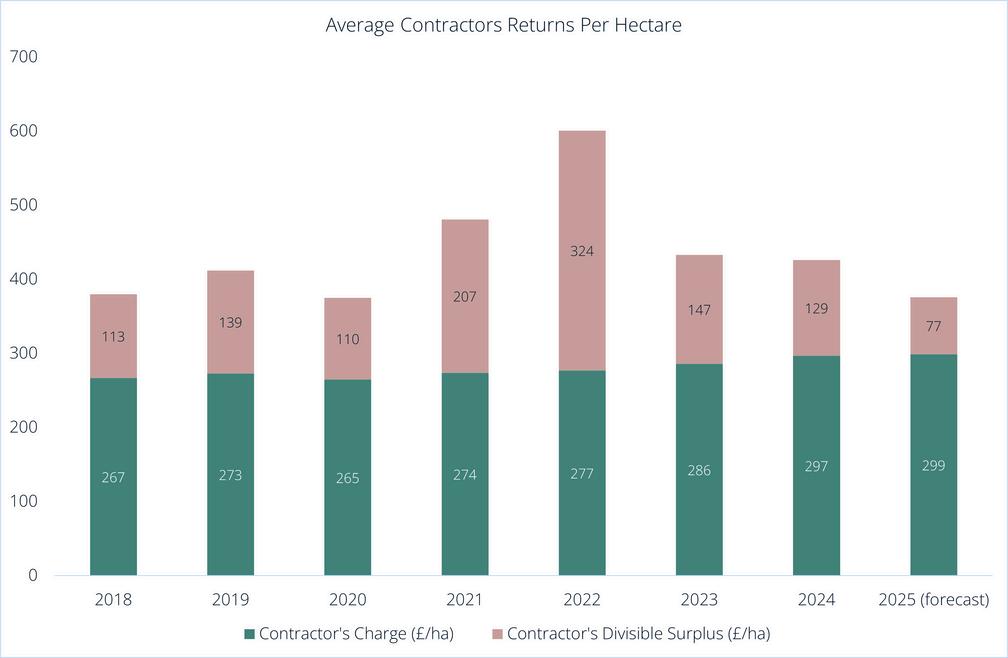
Figure 3. Average return to contractor 2018-2025
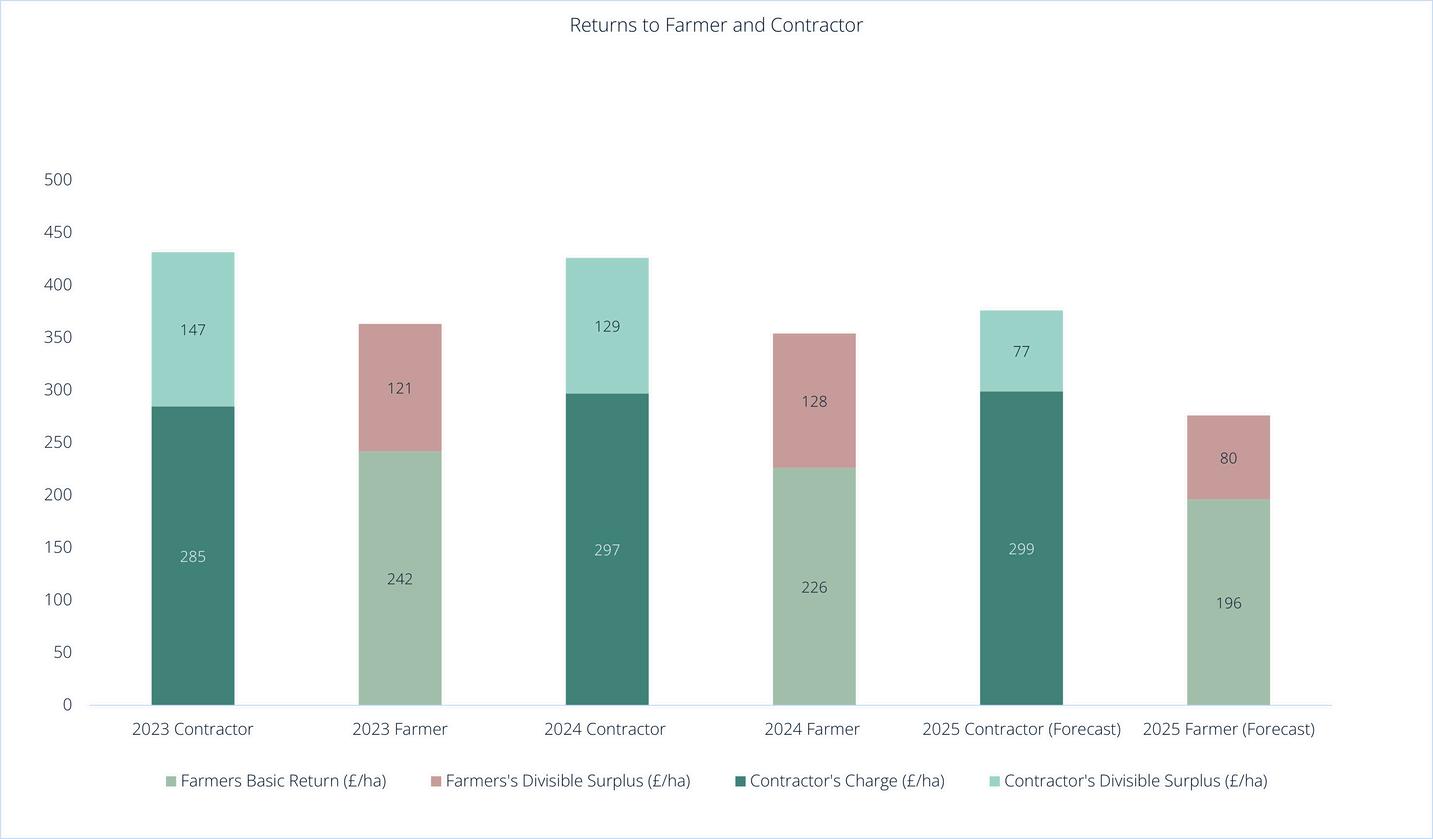
Figure 4. Average return to farmer vs. contractor 2023-2025
Over the past few years experiencing a “typical” farming season has become increasingly uncommon. Continued uncertainty around government support, extreme weather, and global economic pressures have created a challenging and unpredictable operating environment.
What is clear, as shown in Figure 4, is that total farm profitability has declined yearon-year. With rising contracting costs and fluctuating input prices, the ability of farms to generate sustainable profit is becoming more difficult. These pressures are compounding, making it harder for businesses to plan with confidence and maintain any sort of status quo.
Overall, although returns remain low, it is worth noting that the Farm Business Tenancy (FBT) market is also undergoing adjustment, with reductions in rental values, particularly for bare land, offering a useful point of comparison. In our experience, grain storage and sales strategy continue to play a critical role in overall farm profitability and should be integrated into broader business planning.
SIMILARLY TO THE MAIZE, THE COLD, WET SPRING MEANT THAT GROWTH WAS SLOW, DELAYING THE FI CUT OF SILAGE. SINCE THEN, WARM AND SHOWERY CONDITIONS HAVE BEEN CONDUCIVE TO GOOD GRASS GROWTH. THERE WAS ALSO A REASONABLE WINDOW IN JUNE FOR HAYMAKING TO BE CARRIE OUT HOPEFULLY, ADVANTAGEOUS CONDITIONS CONTINUE TO ENSURE THAT NOT ONLY YIELD IS HIGH BUT THAT QUALITY IS RIGHT FOR FERMENTATION AND ANIMAL NUTRITION CUTTING DATE IS KEY TO MEETING THE DEMANDS OF SILAGE FOR YOUR BUSINESS AND, THEREFORE, CLOSE ATTENTION SHOULD PAID TO EAR-EMERGENCE, PARTICULARLY WHILST CROPS ARE RACING THROUGH GROWTH STAGES
Participation in environmental schemes has grown significantly in recent years, as farms seek to offset the loss of Basic Payment Scheme (BPS) income and reduce the risks associated with increasingly unprofitable crop production. With confirmation that land used for environmental purposes will be treated in the same manner as productive agricultural land in relation to APR, landowners can confidently set aside less productive parts of their farm without fear of jeopardising any relief. In Harvest 2023, 80% of CFAs managed by Ceres Rural were enrolled in some form of public environmental grant scheme. By 2024, this figure rose to 96%, with a growing proportion participating in the Sustainable Farming Incentive (SFI). In contrast, figures suggest that only 34% of farms in England were in an SFI agreement as of January 2025.
With the current closure of new SFI applications and a one-year extension offered to mid-tier agreements expiring in 2025, the future landscape remains uncertain. New agreements are now only available on three-year terms, and frequent changes to scheme rules and prescriptions mean that strategic planning must be approached with caution. The next twelve months will see SFI agreements ending, any potential delay to replacement schemes may have a seismic impact on the profitability of CFAs.
Our professional view remains consistent: farms rarely lose out by participating in these schemes. However, understanding the true cost of participation, including hidden management costs is essential.

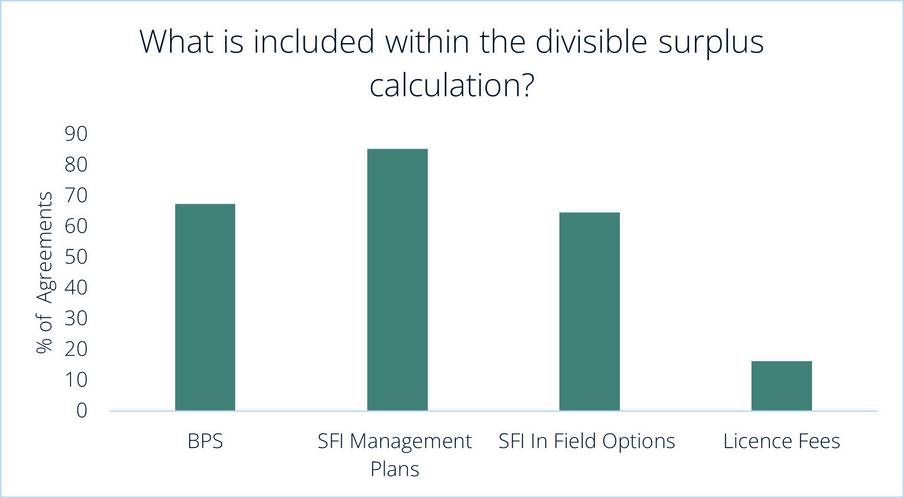
Figure 5 illustrates the proportion of agreements that include the following additional income within the divisible surplus calculation. The likely reasons for the inclusion of this “unearned” income is commonly due to the extra management and compliance costs, uncertainty over the future of schemes, for simplicity, and to incentivise the contractor to deliver a good service.
Overall, with many factors beyond our control, decisions must be grounded in data and approached with a clear understanding of both costs and potential return.
Contractors must be treated fairly; with recognition of rising costs and the oftenoverlooked value they bring. At the same time, it is essential to ensure their operations align with the specific needs of landowners, considering any unique selling points they may offer, such as grain storage facilities.
Environmental schemes should be embraced, but not without careful consideration of long-term implications, including management costs and scheme expiry dates.
Ultimately, CFAs remain a viable and flexible model, but success depends on thoughtful structuring, regular review, and a willingness to adapt to changing conditions.
If you would like to discuss any of the topics covered in this report, please do contact a member of the Team, or speak to the project leader, Charlie Fairs, via the details below.