DOWNTOWNS REBOUND
THE DATA DRIVEN PATH TO RECOVERY
DOWNTOWNS REBOUND
THE DATA DRIVEN
PATH TO RECOVERY
Introduction & Overview
*Atlanta, GA
*Austin, TX
*Boston, MA
Charlotte, NC
Chicago, Il
*Columbus, OH
Dallas, TX
*Washington DC
*Denver, CO
Fort Worth, TX
Houston, TX
*Indianapolis, IN Jacksonville, FL
Los Angeles, CA
Lower Manhattan, NYC Memphis, TN
Midtown Manhattan, NYC
*Nashville, TN Philadelphia, PA
*Phoenix, AZ
Portland, OR
San Antonio, TX
San Diego, CA
San Francisco, CA
San Jose, CA
Seattle, WA
*State Capital
Can downtowns in the United States rebound and prosper? This fundamental question lingers more than three years after the global pandemic, after public mandates to work from home and following civil unrest and crime increases that occurred in many U.S. cities in 2020.
From the early 1980s, American city centers steadily recovered from de-industrialization, suburbanization and the disinvestment that had left many as declining 9-to-5 workplaces with limited residents, diminished retail and minimal nightlife. By 2019, downtowns in nearly all major U.S. cities were thriving as mixed-use places for professional and financial services, information technology, education, research and health care, entertainment and culture, tourism, shopping, dining and as preferred places to live. Suddenly in 2020 and
2021, those old enough to remember experienced flashbacks to the 1970s as a barrage of news stories predicted “the death of downtowns” and a burgeoning, academic industry foretold a new, immiserating cycle of “urban doom loops.”1
For decades, mobile phones, email and texting had been untethering workers from fixed locations. The mandated shutdown in early 2020 was an unprecedented event. But widespread availability of new, web-based video-conferencing platforms for group meetings made the transition to remote work almost seamless. As a result, there was a dramatic drop in office occupancy, transit ridership, sidewalk vitality and retail sales. At the same time, international tourism was suspended and domestic travel dropped precipitously. The arts and culture sector shifted to virtual performances and exhibits, enabling the public to access cultural offerings
1. Stijn
Nieuwerburgh,
remotely. Evening vitality and restaurant table service evaporated, along with the sense of safety in numbers on sidewalks. Students left university and college campuses. Middle-class residents with second homes decamped from cities to beaches, mountains and rural areas. In Center City Philadelphia there was a 74% drop from February to April 2020 in the volume of people present downtown.
Various metrics of recovery—employment, office and hotel occupancy, retail sales, housing prices and rents—indicate steady progress during the last three years. But most cities have not fully restored 2019 levels of vitality. The duration of the shutdown enabled employees to grow comfortable with the convenience of remote and hybrid work. Another robust discussion has emerged around the push-and-pull between employers and employees, between mandates or incentives, between acquiescence or embrace of the virtual office. Employees point to reduced travel times and wardrobe costs and simplified day care. Some employers ask: can productivity, innovation and mentoring be sustained with diminished, human contact?2
We know that secondary industries that depend on the presence of office workers—building engineers and janitors, transit workers, lunch-hour restaurant workers, to name a few of the jobs that need to be performed in person—all have been adversely impacted. It remains an open question if downtowns (and the transit systems that serve them) will fully recover as centers of innovation and productivity for a broad range of workers at all educational and skill levels.
Urban policymakers, mayors, business leaders, property owners and downtown managers now confront basic questions. Can recovery be accelerated to restore sidewalk vitality and the tax revenues that support municipal services? Can transit systems restore service levels before federal relief funds expire? Can workers, audiences, tourists and shoppers be encouraged to return to in-person activities in downtown areas? More fundamentally, can (or should) we restore the status quo of 2019 or do downtowns need to reinvent themselves, learning to thrive under fundamentally changed conditions?
FIGURE 1 RESIDENTS, WORKERS AND VISITORS IN CORE DOWNTOWN IN 2023 Q2 COMPARED TO 2019 Q2
Residents, Workers and Visitors in Core Downtown in 2023 Q2 Compared to 2019 Q2
Combining workers, residents and visitors in each city, the recovery rate in 2023 ranged from 69% of 2019 levels in San Francisco and Washington, D.C. to 92% in San Jose and 100% in Nashville.
2. For the best overview of work-from-home patterns by industry: Jose Maria Barrero, Nicholas Bloom and Steven J. Davis, The Evolution of Work From Home, National Bureau of Economic Research, September 2023.
Source: Placer.ai
FIGURE 2 NON-RESIDENT WORKERS IN CORE DOWNTOWN IN 2023 Q2 COMPARED TO 2019 Q2
Non-Resident Workers in Core Downtown in 2023 Q2 Compared to 2019 Q2
Nashville and San Jose have the highest percentages of visitors, the highest percentages of jobs in hospitality and the highest worker recovery rates. The city with the lowest worker recovery rate, San Francisco, had the highest concentration of information technology employment, one of the most amenable to remote work in 2019.
Defining Downtown: This report seeks to assist in answering these questions by providing real time data on the impact of the pandemic and subsequent events on the state of recovery in 26 of the nation’s largest downtowns. Chapter 1 offers a standardized definition of downtowns, both the core commercial areas and the immediately adjacent, primarily residential areas, updating the same methodology the Center City District (CCD) developed for Downtown Rebirth: Documenting the Live-Work Dynamic in 21st Century U.S. Cities, published in October 2013 in partnership with the International Downtown Association.3
Analyzing Who Is There: Chapter 2 then focuses on three key groups who gather in these places: visitors, workers and residents. Recovery estimates are calculated using data aggregated by Placer.ai, a provider of place-specific estimates of the volume of people, based on the location of their mobile phone at different times of the day. Placer calculates the volume of three types of downtown users: residents of the area, workers in the area and the number who visit as tourists, concert or convention attendees, shoppers, diners or as visitors to doctors, dentists and other personal service providers.4
Placer.ai data is then used to compare trends in 2019 to those in 2023 for 26 defined downtown areas, crafted to enable comparisons among cities of different sizes, economic mix and urban form. Because of seasonality in the behavior of all three groups, the impact of the pandemic and the degree of recovery is measured by comparing the daily average volume of people downtown in the second quarter of 2019 to the second quarter of 2023.
Overview of Findings: For our 26 downtowns, there are substantial variations in the lasting impact of the events of 2020. The rates of recovery from 2019 to mid-2023 vary significantly among workers, residents and visitors and between our selected cities.
Combining workers, residents and visitors in each city, the recovery rate for the quarter ending June 30, 2023 ranged from 69% of Q2 2019 levels in San Francisco and Washington, D.C. to 92% in San Jose and 100% in Nashville—the only two cities exceeding 90% of their 2019 volumes. Only nine were at 80% or higher (Figure 1).
This report seeks to evaluate a number of possible factors that may drive these overall results and explain why some cities are
3. https://centercityphila.org/research-reports/downtown-rebirth-documenting-the-live-work-dynamic-in-21st-century-u-s-cities 4. https://www.placer.ai
Source: Placer.ai
FIGURE 3 VISITORS IN CORE DOWNTOWN IN 2023 Q2 COMPARED TO 2019 Q2
Visitors in Core Downtown in 2023 Q2 Compared to 2019 Q2
The visitor recovery rate appears to be influenced by what share of visitors to downtown in 2019 came from within their region or from across the country or around the globe.
recovering more quickly than others and why some sectors are rebounding faster than others. There are many variables, but in general, cities that have strong overall recovery rates tend to have a robust leisure and hospitality industry (where work needs to be performed in person), a lower dependence on certain industries like information technology and financial services (which lend themselves more to remote work) and a high downtown residential density, facilitating shorter commutes to work. But there are many more local nuances and variables.
Workers: In Q2 2023, the average number of non-resident workers in core downtown areas ranged from 52% of the 2019 level in San Francisco and Portland to 85% in San Antonio.5 Only two cities—Nashville and San Antonio—had reached an 80% worker recovery rate or higher. The median worker recovery rate was 65%. While there was no clear overall regional pattern across the 26 downtowns, the four cities with the lowest worker recovery rates were all in the West: San Francisco, Portland, Denver and Seattle (Figure 2). These are also cities with high concentrations of information technology firms, a sector in which a great deal of work had already been performed remotely before 2020. Chapter 4 will examine several other factors that may influence the rate of worker recovery.
Visitors: Recovery rates for visitors were generally higher than for workers, with Q2 2023 levels ranging from 66% of the pre-pandemic level in San Francisco to 103% in Nashville. The median visitor recovery rate was 81%, 16 percentage points higher than the median recovery rate for workers. Only three cities—San Diego, San Jose, and Nashville—had reached 90% or more of the pre-pandemic level of visitors. Two cities—San Francisco and Portland—were below 70%. As discussed in Chapter 6, some of this variation may reflect differences in recovery from visitors outside the region, rather than visitors from within the metropolitan area (Figure 3).
Residents: Residential recovery is the most advanced. Within the greater downtown area, the residential population in 2023 exceeded that of 2019 in every downtown except Phoenix, and ranged as high as 134% in Portland. The median city residential population stood at 111% of the pre-pandemic level (Figure 20). Chapter 5 will examine residential trends in greater detail.
These results suggest that the pace of recovery in each city is different, varying significantly by sector. Chapter 2 elaborates on this theme by demonstrating how the pace of recovery varies between workers, visitors and residents in each city. In general, downtown residents are back at levels that
Source: Placer.ai
exceed both visitors and workers, but they are the smallest component in all our downtowns.⁶ Visitor and shopper recovery, typically the largest segments of people present in downtowns in 2019, are generally running ahead of worker return. However, the variation in recovery rates across the 26 cities is substantial: residential recovery in the second quarter ranged from 93% to 134% of pre-pandemic levels; visitor recovery ranges from 66% to 103%; and worker recovery ranges from 52% to 85%.
This report not only focuses on those differences in terms of job and population mix, Chapter 4 compares the type of jobs, the density of jobs and residents and rates of growth of each. It also explores several alternative explanations for differential worker recovery rates. We look at the duration of mandated shutdowns, some statistics on public safety, the length of commute and the size of the downtown residential population in 2019. The purpose of this report is not to reach definitive conclusions on each topic, but rather to present data that individual cities can use as they explore other variables and strategies and to invite a national conversation around optimal paths to recovery.
Fundamentally, this report, like the organization that produced it, is place-focused and action-oriented, and asks how do we accelerate recovery in city centers? Downtowns have provided the broadest range of jobs at all educational and skill levels. Many of the high-skilled jobs that can be performed remotely tend to be jobs whose presence creates the demand for more mid-level and entry level jobs. In many cities, public transit makes these jobs accessible to neighborhood residents who may not be able to afford a car. Downtowns also host many of the destinations and icons that define the urban hospitality industry. By focusing on what may account for differences, we seek to highlight the most significant levers for change and to help leaders decide: what might we do today, tomorrow and next year?
Fortunately, the sense of fear, uncertainty, gloom and pessimism that dominated 2020 is largely behind us. With the perspective of just three years, we are reminded that cities are extraordinarily resilient and, over their long histories, they have rebounded from plagues, earthquakes, fires, floods, wars and acts of terrorism. This is not to minimize the deaths, violence, destruction and loss of jobs and real estate value that has occurred since 2020. Nor is it to ignore the fact that cities can and have failed.
But it is important to place the events of 2020 in historical context. In the 1970s, many American downtowns were given up for dead, but they rebounded. Acts of terrorism challenged several cities since the start of the 21st century, but they rebuilt. The threat of gun violence is more widespread, as are problems with drug addiction, homelessness and income inequality. But if history teaches anything, it is that cities are places that must continually reinvent themselves, places that must choose new directions, places that require determined leaders to fashion new futures. This report seeks to counter misinformation and provide some of the data that can assist when making those decisions and choosing those actions that best support a robust and inclusive process of recovery.
Paul R. Levy President & CEO
Center City District October 2023
The purpose of this report is not to reach definitive conclusions, but rather to present data that individual cities can use as they develop their own strategies.
Acknowledgements: This report was researched, designed, and published by staff at the Center City District. The team includes Stephen Camp-Landis, Vice President of Research and Policy; Prema Katari Gupta, Vice President of Parks and Public Realm; JoAnn Loviglio, Senior Director of Communications and Publications; Leo Manning, Digital Communications Manager; Colin Munro, Manager of GIS Mapping Services and Technology; Jimmy Salfiti, Manager of Retail Economic Development; Lauren Smith, Manager of Economic Development; Joanne Chen, Research Associate; and Bonnie Thompson, Senior Director of Digital Marketing. This document was designed by Amy Genda, CCD’s Senior Creative Director, and Senior Graphic Designer David Orantes.
6. Because the total number of residents in most of the downtowns are relatively small, Placer.ai’s cellphone sample size is somewhat less reliable than the sampling of workers and visitors and may show rates of growth that exaggerate real recovery trends. This is discussed further in Chapter 5.
Chapter One: Defining Downtown
In October 2013, the Center City District (CCD) published Downtown Rebirth: Documenting the Live-Work Dynamic in 21st Century U.S. Cities in partnership with the International Downtown Association.⁷ Drawing on data from 150 cities, the report focused on how downtowns, once shunned as empty, unsafe places at night, were being redeveloped at higher density, with more diverse land-use and were thriving after dark. The introduction set the stage: “Patrons of downtown regional destinations mingle with office workers and resident young professionals, empty-nesters, and, in many cities, an expanding number of families with children. The trends of diversification, densification, and adjacent residential revival are also occurring on and around urban colleges, universities, medical centers, and research parks as well as around other major employment nodes outside the traditional downtown.”⁸
Downtown revitalization had been written about extensively during the prior four decades, but it proved difficult to arrive at standard definitions to quantify and compare employment and population trends across the broad range of American downtowns, given their different histories and geographies. The new “live/work” downtowns were larger than traditional office-based central business districts (CBDs) that were routinely tracked by commercial brokerage firms. They were emerging in cities where education and health care, hospitality, entertainment and sports employment rivaled the size of traditional office employment. More problematic: while population was routinely mapped by the U.S. Census Bureau in standard census tracts, there was no accepted definition for what constituted a “downtown” residential neighborhood, nor a standard geographic unit for tracking and comparing employment at sizes below the city or county scale.
By 2013, however, a relatively new data-merging and mapping effort from the U.S. Census Bureau and state labor market information (LMI) agencies, called Longitudinal Employer-Household Dynamics (LEHD), with an associated online mapping tool, OnTheMap, made it possible to create standardized maps of dense employment nodes.⁹ In Downtown Rebirth, CCD used this data to map employment density within 150 American cities by superimposing the downtown employment nodes in these cities upon census tracts, which had been designed only to track residential settlement. Using this methodology, the report mapped concentrated employment nodes in traditional downtowns, anchor-institution districts formed around hospitals and universities, as well as urban research parks.
Across the 150 cities, jobs were and remain distributed in very different spatial patterns. Many cities have one dominant job cluster built around the historic downtown and a hub-andspoke transit system. Others have two significant employment nodes, the traditional downtown and a university or health care district. Several had more than one major employment cluster, such as New York, Atlanta and Los Angeles. Newer cities that came of age in the automobile era tend to have more decentralized patterns with multiple smaller job clusters spread across a large portion of the city’s area, such as Houston, Jacksonville and Phoenix.
Updating the Data: This report, 10 years later, applies a similar approach to define downtowns across a more limited group of cities: the 25 U.S. cities with the largest number of jobs as of 2019. We focus on the largest employment node in 24 of these cities. For New York, we examine two job clusters— Midtown Manhattan, and Lower Manhattan—because of the
7. Downtown Rebirth, https://centercityphila.org/research-reports/downtown-rebirth-documenting-the-live-work-dynamic-in-21st-century-u-s-cities
8. Downtown Rebirth, page 5
9. https://lehd.ces.census.gov/applications/help/onthemap.html#!what_is_onthemap
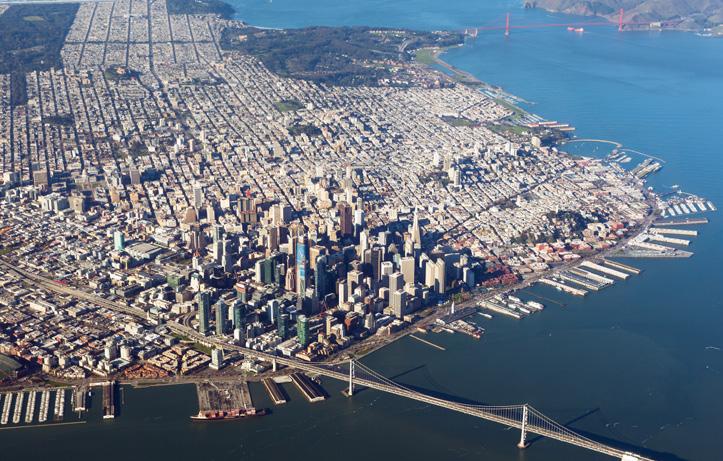













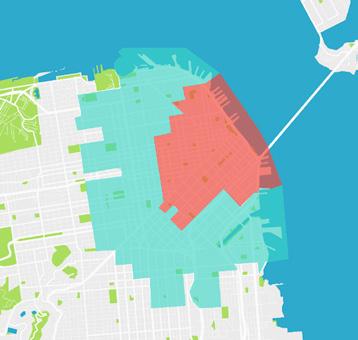
San Francisco is a city with one dominant job cluster, where employment density is by far the highest within a small area in the northeastern part of the city.
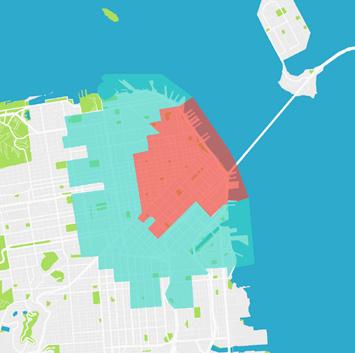
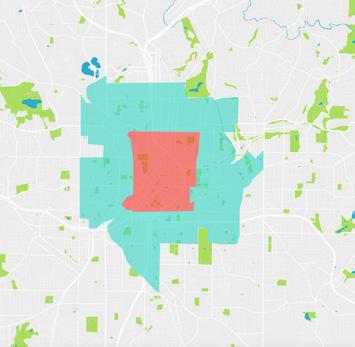
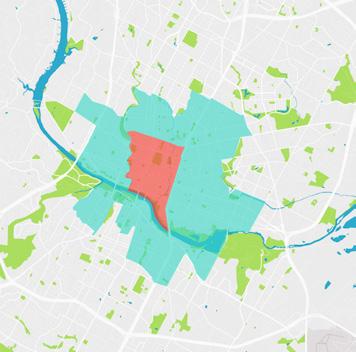
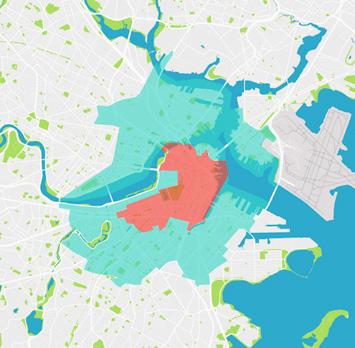
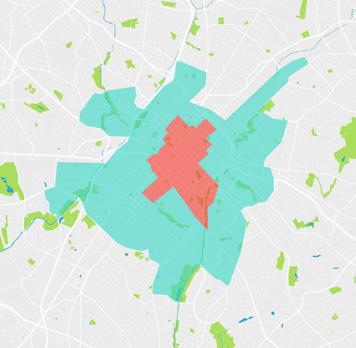
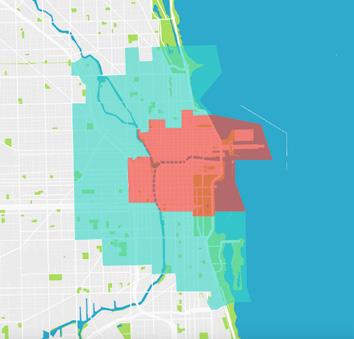
The core downtown tracts are outlined in red, the adjacent areas are outlined in teal. (More details on the process of defining the downtown areas and maps of all 26 downtowns are presented in the Appendix.)
FIGURE 4 PERCENTAGE OF GREATER DOWNTOWN EMPLOYED RESIDENTS WHO WORK IN GREATER DOWNTOWN, 2020
There is a significant variation across cities in how many people who work downtown live in adjacent neighborhoods.
size and significance of these employment centers. The report therefore analyzes a total of 26 downtowns.
To define downtown areas, we mapped employment density at the Census tract level in 2020—the most recent year of available LEHD data. Tracts with job density of 40 jobs per acre or more were generally included within the downtown, although physical boundaries, such as highways, rail lines or rivers, were also considered, and in some cases, tracts were included to ensure a coherent, contiguous area. The result was set of core downtown areas with significant variation in overall employment density, ranging from a high of 825 jobs per acre in Midtown Manhattan to a low of 29 jobs per acre in Memphis. These variations mirror differences in overall job density in their respective cities.
Mapping Live/Work Downtowns: As in the 2013 study, we also traced a one-mile adjacent area, not as a perfect circle, but based on Census tract boundaries, to define a set of primarily residential areas that are within close proximity to downtown and where a significant number of downtown workers live. Tracts were included within the adjacent area if their geographical center was within a mile of the core downtown
Source: Census Bureau, Longitudinal Employer-Household Dynamics
boundary. The adjacent areas typically have residential density that is comparable to that of the core downtown, but much lower job density. We designated as the greater downtown the zone that includes both the core and the adjacent tracts.¹⁰
By focusing on the larger greater downtown area, we sought to provide some insight into the impact of the pandemic and related events on both the core downtown and the adjacent neighborhoods, where, in many cases, a substantial number of downtown workers live. Further, we presumed that these areas, with a more residential character, were less adversely impacted by the decline in tourism or by the increase in remote and hybrid work. In fact, many of these neighborhoods benefited as the increase in work-from-home generated seven days per week demand for local neighborhood retail, restaurants and services.
In 14 of the greater downtowns, more than 30% of the employed residents within these areas work within them, ranging in 2020 from 60% in Midtown Manhattan and downtown Chicago and 53% in downtown San Francisco to 17% in San Diego and just 13% in San Jose. These variations appear to have impacted return to office trends (Figure 4).¹¹
10. In several cases, these boundaries do not exactly correspond the local definition of downtown. Even in Philadelphia’s case, the boundaries in this report are slightly smaller than our local definition of Greater Center City. (See https://centercityphila.org/research-reports/downtown-rebounds-greater-center-city-housing-trends-2023.) But we sought to achieve as much consistency as possible across 26 different downtowns. While we generated the data for both core and adjacent area, the report focuses in some cases only on the core and in others on greater downtown and only focuses on both if there is a significant difference in the findings. 11. An important qualification: while a high percentage of residents of greater downtowns worked within these areas, live-workers on average represent only about 6% of the total downtown workforce, reaching a high of more than 10% in Philadelphia, San Francisco, Midtown Manhattan and downtown Denver to less than 4% in Houston and Los Angeles. In
Chapter 2: Who was downtown in 2019?
Why did they come? Who came back in 2023?
This report focuses on three key segments of people who frequent downtowns: visitors, workers and those who live there. Employment and population data available from the Census Bureau usually depicts conditions from two to three years ago. Office and hotel occupancy, rents and rates are more current for specific components of the downtown economy, reflecting the last quarter. Transit ridership, parking garage counts, card-entry systems in buildings and on-street pedestrian sensors are helpful but their sample sizes vary, they may monitor only certain types of activity, and they don’t suggest the purpose of the journey of those who rode, parked or walked into downtown.
There is no perfect real-time data source. This report makes use of Placer.ai, a provider of place-specific estimates of the volume of people, based on the location of their mobile phone at different times of the day. Placer sorts this data into three buckets: residents of an area (where the phone usually
sleeps at night, though with specific locations anonymized), workers in an area (where the phone routinely goes during the workday) and those who come from elsewhere to visit the 26 downtowns as tourists, concert or convention attendees, shoppers, diners or as visitors to doctors and dentists. This report uses Placer.ai data to tabulate trends from 2019 through June 30, 2023 for 26 specifically defined downtown areas drawn to enable comparisons across cities of widely varied sizes, economic mixes and urban forms. Because of seasonality in the behavior of all three groups, the impact of the pandemic and the degree of recovery is measured by comparing the daily average counts in the second quarter of 2019 to the second quarter of 2023.
Differences in Downtown Mix: One way to understand the relative importance of these groups is with pie charts showing the combined, average daily mix of all people with cellphones
COMPOSITION OF POPULATION OF ALL 26 CORE DOWNTOWNS COMBINED
Aggregate Population in Core Downtowns by Type, 2019 Q2
Composition
Source: Placer.ai
FIGURE 5 2019 Q2, DAILY AVERAGE
FIGURE 6 2023 Q2, DAILY AVERAGE
in Q2 2019 in all 26 downtowns (Figure 5) and compare that to the average daily mix in Q2 2023 (Figure 6.)
In all 26 downtowns, visitors—defined as tourists, concert or convention attendees, shoppers, diners or customers of service and health care providers—formed the largest average, daily share of people in 2019. The Appendix displays individualized pie charts for all 26 downtowns for 2019 and 2023, demonstrating both the broad common parameters and the wide range of different types of people in our 26 downtowns.
Visitors ranged from an 80% share of all people in downtown San Antonio on an average day in the second quarter of 2019, and a 79% share in Nashville to a low of 54% in San Francisco. But they were still more than half of the total volume in all cities. Places with high volumes of visitors, like Nashville, logically have higher shares of workers in leisure and hospitality and that alone influences rates of worker recovery. Just as it was easy for visitors to avoid downtowns in 2020 and 2021, their decision to return requires a much lower commitment to place than renting an apartment or going to the office. Since much of the hospitality and entertainment industries, in particular, depend upon the on-site presence of employees, these cities have seen their worker levels rebound faster as well.
Non-resident workers ranged from a high of 38% of all persons in downtown Chicago in 2019 to a low of 18% in San Antonio and San Diego with only nine cities having worker shares of 33% or more in 2019.
Residents ranged in 2019 between 11% and 13% in Portland, Philadelphia, Seattle and San Francisco to a low of just 1% in San Antonio. Thus, despite the appropriate focus in both the real estate industry and media on the conversion of obsolete office buildings to residential and, despite significant success on this front in many cities, it will take an extraordinarily high number of new residents to compensate for any continuing absence of office workers. Office conversions remain a very important strategy for repurposing real estate and diversifying land-use, but they are far from a panacea.
The relative size of slices of the pie were dramatically altered by the events of the last three years but are slowly returning to something approaching 2019 shares. The simplest measure of recovery overall for all 26 downtowns can be gauged by comparing Figures 5 and 6, which show the cumulative average of visitors across the 26 downtowns by the end of Q2 2023 back at 79% of Q2 2019 levels; workers of all kinds back at 66%; and residents at 120%.
While downtown residents are extraordinarily important to the vitality of city centers, in 2019 they represented only 11% to 13% of the total volume of people downtown in Portland, Philadelphia, Seattle and San Francisco, the four cities with the largest residential share. By contrast, visitors in the 26 cities comprised on average a two-thirds share.
Chapter 3: Public Safety; Restoring Community Policing
Before focusing on individual cities and sectors, we start with a discussion of public safety, since it is frequently mentioned as a barrier to recovery. Given that workers, visitors and residents have multiple options within their regions, postindustrial downtowns need to create a safe, welcoming and high-quality public environment to remain competitive.
The development of amenity-rich, live-work-play settings had been building momentum for at least three decades. This was profoundly disrupted by the global pandemic in 2020 and related events. At the outset, it is misleading to use the word “pandemic” as an umbrella for everything that happened in 2020. To be sure, there was a global health crisis that made people afraid to be among other people. But there were also significant variations in the duration of government-mandated shutdowns and these differences apparently had some impact on degree of recovery. Second, the killings of George Floyd, Breonna Taylor, Ahmaud Arbery and other individuals commemorated in Black Lives Matter protests prompted civil unrest in some cities and vandalism and looting in others.
This stimulated a profoundly needed debate about the appropriate role of police and optimal ways to produce public safety, which led to rethinking and reformulating of public safety strategies in some cities. But it also generated demands to defund the police that were acted upon in several places, while in others it resulted in lower staffing levels as many officers chose to leave the profession or move to less contested communities. This impacted both the perception and reality of public safety in downtowns. Recent memories
of civil disruption, boarded-up businesses and diminished foot traffic that made the presence of the mentally ill and addicted appear more prominent—all combined to foster anxiety about safety downtown.
Looking Back to Move Forward: To respond to high levels of crime during the 1960s and 1970s, police tactics were incident driven, patrolling behind windows of air-conditioned cars, responding to 911 calls, jumping out to make arrests and then departing. Priority went to serious (Part 1) crimes: murder, rape, arson and armed theft. By the 1980s, despite decreases in serious crime, communities continued to tell pollsters across the country they did not feel safe. Partially, this reflected the omnipresence of guns in America and the way television and movies highlight violence. But many felt police were simply not focused on the problems that made them feel unsafe. An evocative metaphor—broken windows—helped to redefine “public safety.”12 Just as one untended broken window emboldens those with rocks to break the rest, ignoring petty crimes and misdemeanors conveys implicit permission to perpetrate more serious crimes. Put simply, when things feel out of control, anxiety rises and the sense of safety declines.
The focus on quality of life converged with community policing. With scarce resources, police were urged to rely less on Part 1 crimes as the organizing principal for patrol and instead to ask residents and businesses: “What makes you feel unsafe?” Rarely would anyone suggest that serious crimes be ignored. Rather, most communities wanted priority given to day-to-day disturbances and misdemeanors: drug
dealing on corners; retail theft; disruptive behavior and broken beer bottles in playgrounds; smashed car windows; graffiti on storefronts and in schoolyards. Most residents asked for visible, approachable officers on foot and on bikes. Rather than respond only to 911 calls, police were encouraged to be proactive and diagnostic, using computer mapping to analyze locations that generated repeat calls for lesser infractions. Not infrequently, situations like domestic disputes, usually beyond the purview of law enforcement, might degenerate into violence if left untended.13
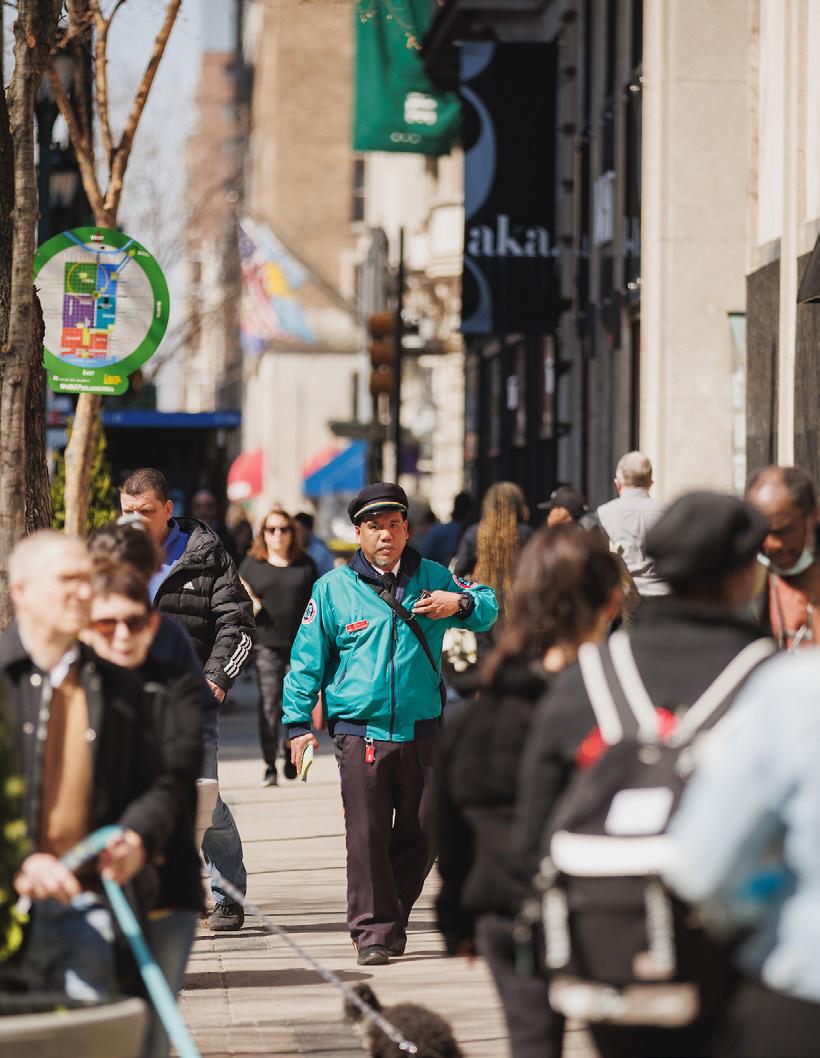
This is the context in which downtown recovery began in the 1980s and the policy climate in which many business improvement districts (BIDs) formed across the U.S. and Canada before spreading globally. In nearly all large cities, BIDs deploy uniformed cleaners and unarmed public safety patrols and these supplementary, quality of life services were welcomed by many urban police departments. From the beginning of the creation of Philadelphia’s Center City District in 1991, uniformed and unarmed Community Service Representatives, serving as goodwill ambassadors and as eyes and ears, were co-located with a police substation in CCD’s office to ensure close collaboration with sworn officers,
Violent
Crime Percentage Change 2019-2021
patrolling on foot and on bicycles. This resulted in sustained reductions in nearly all forms of crime.14
In 2002, the partnership substantially expanded, following the lead of the Times Square BID in New York, with the creation of Philadelphia’s Community Court. Under the jurisdiction of the First Judicial District, the court heard cases from across 10 police districts, spanning four City Council districts, home to 420,000 Philadelphia residents, or almost one-third of the city’s adult population. Traditional adversaries in the criminal justice system came together to focus collaboratively on crimes that usually fell below the radar: criminal mischief, vandalism, graffiti, theft from auto, obstructing the highway, prostitution, disorderly conduct, retail theft, defiant trespass, drug and weapon possession, and a range of theft of services offenses: fare jumping, nonpayment for taxis or meals.
Under one roof Assistant District Attorneys and Assistant Public Defenders worked cooperatively with police, drug and alcohol counselors, social service and medical professionals, staff from the CCD and professionals from the First Judicial District, addressing both the impact and the behavioral problems that led to crime. The court reduced these crimes
FIGURE 7 PART 1 CITYWIDE VIOLENT CRIME PERCENTAGE CHANGE, 2019–2021
Source: Federal Bureau of Investigation, Uniform Crime Reporting Program, Crime in the United States, 2019 available at https://ucr.fbi.gov/crime-in-the-u.s/2019/crime-in-the-u.s.-2019/topic-pages/tables/table-8/table-8.xls/view, and 2021, available at https://cde.ucr.cjis.gov/LATEST/webapp/#.
13. For a more sustained discussion of these themes, see Paul R. Levy, Rethinking Public Safety for Cities, The American Downtown Revitalization Review, Volume 2, 2021: centercityphila.org/ uploads/attachments/cllphpjkbb1cmomqd24jp7zpm-rethinking-public-safety-strategies-for-cities-prl-theadrr-v2-2021.pdf
14. Over the years, this partnership has grown as CCD, with Project Home, Philadelphia’s lead homeless service provider, and the police collaborate in a jointly-delivered homeless outreach program six days per week. CCD and the police also host biweekly coordination meetings that bring all public and private security groups downtown together to analyze and respond to trends.
Source: Federal Bureau of Investigation, Uniform Crime Reporting Program, Crime in the United States, 2019 available at https://ucr.fbi.gov/crime-in-the-u.s/2019/crime-in-the-u.s.-2019/topic-pages/tables/table-8/table-8.xls/view, and 2021, available at https://cde.ucr.cjis.gov/LATEST/webapp/#.
significantly by blending together disciplines that are traditionally siloed—criminal justice and social services. Using the authority of the court to provide needed services to individuals who committed these offenses, it focused less on punishment and more on preventing a downward spiral into more serious crime. It offered less expensive and more constructive alternatives to incarceration through community sentences. Supervised neighborhood and park cleanups and administrative work in social services offices were proscribed as a program of restorative justice, repaying the neighborhoods and commercial corridors in which the harm was done. The steady reduction in crime that followed went hand-in-hand within a sustained process of recovery.
Well before 2020, Patrick Sharkey’s 2018 book Uneasy Peace urged a renewed commitment to community policing, shifting the role and image of the police officer from warrior to guardian so that departments become more engaged in, and trusted by, the communities they serve. One can reject racist and illegal police actions and the over-investment in jails yet still affirm an appropriate role for well-trained police in concert with other service providers. It should be an essential part of the recovery strategy for every city.
Current Impact of Crime: Measurements of crime and perceptions of public safety are not simple. For reporting purposes, the FBI makes a distinction between serious Part 1 crimes and less severe Part 2 crimes.15 Within the scope of this project, we did not attempt to gather all that data for each of our 26 downtowns, since downtown boundaries rarely correspond to local police district boundaries and not all cities publish their crime data by neighborhoods. Further, there is much evidence that suggests, while the media understandably focuses on Part 1 crimes, perceptions of safety are very much influenced by Part 2 crimes, since these are the types of offenses that the general public is more likely to witness or come in contact with. These are also the types of infractions that most downtown organizations are able to positively impact through the deployment of uniformed, unarmed personnel.
To establish broad trends, we relied on FBI data that is available fora subset of our 26 cities—but only at the citywide level.16 What it shows is that in 11 of 14 cities, violent crime rose between 2019 and 2021, but during the same period of time property crime dropped in eight of 13 cities (Figures 7, 8).
life offenses, simple assault and threats.
16. 2019 data are from the FBI, Crime in the United States, 2019: https://ucr.fbi.gov/crime-in-the-u.s/2019/crime-in-the-u.s.-2019/topic-pages/tables/table-8/table-8.xls/view and 2021 data are from the FBI, Crime in the United States, 2021: https://cde.ucr.cjis.gov/LATEST/webapp/#
An analysis by The Brookings Institution of 16 cities found that crimes downtown accounted for a small share of citywide crime increases during this period. In a more detailed review of four downtowns (New York, Chicago, Seattle and Philadelphia), they found crime rates remained stable and in some cases decreased in downtown.17 But they noted that perceptions of safety were influenced by an increase in violent crimes during the pandemic in disadvantaged neighborhoods elsewhere in the city that were heavily covered in the media and that background anxiety could be triggered by encounters with addicts and mentally ill individuals on emptier downtown streets.
A Philadelphia Case Study: For more than three decades, the Center City District (CCD), a large business improvement district that serves the entire downtown commercial core of Philadelphia, has had a unique partnership with the Philadelphia police in which a Philadelphia police substation is co-located in the CCD’s operations headquarters and police officers are closely coordinated with CCD’s 45 uniformed, unarmed Community Service Representatives, planning deployment strategies and patrols. Since 2021, the CCD has also fielded a 35-person uniformed, unarmed bike patrol.18

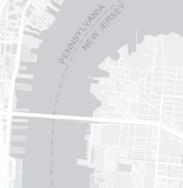
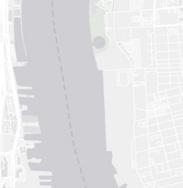
Like many cities, Philadelphia’s contingent of sworn police officers has declined since 2020 but the impact of nonuniformed personnel with a combined hospitality, information and public safety function has been significant. During a period of robust recovery, serious Part 1 crimes within CCD’s boundaries in the first eight months of 2023 decreased by 5% from the comparable period in 2019, while rising notably in specific portions of the surrounding 6th and 9th Police Districts that did not have the benefit of supplementary services.
A return to community policing is an essential component of the recovery of all cities.
17. Hanna Love and Tracy Hadden Loh, The Geography of Crime in Four U.S. Cities: Perceptions and Realities, Brookings Institution, April 3, 2023 https://www.brookings.edu/articles/ the-geography-of-crime-in-four-u-s-cities-perceptions-and-reality/ 18. For an overview of CCD’s public safety programs: https://www.centercityphila.org/ccd-services/public-safety
6th Police District 9th Police District
Center City District
Chapter 4: Employment Recovery
In the decade before 2020, private sector jobs grew in the core downtowns of 25 of the 26 cities. From 2011 to 2019, the average annual rate of growth ranged from 6.5% in San Jose to 0.2% in Houston to an average annual loss of 0.8% in just one city, San Antonio.
The events of 2020 reversed trends in most downtowns as private employment declined between 2019 and 2020 in all but Austin and Jacksonville. LEHD data does not extend beyond 2020.
The patterns for office jobs are somewhat different.19 Twentyfour of the 26 core downtowns added private sector office jobs from 2011 to 2019. Twenty-one of the 24 were able to sustain that momentum between 2019 and 2020, as many of those individuals had either the option or the requirement to work from home.
Placer.ai data documents that workers of all kinds who don’t live close to downtown were the slowest to return. Recovery rates of all non-resident workers in core downtowns in Q2 2023 varied from a high of 85% in San Antonio to a low of 52% in San Francisco. The median recovery rate was 65% in Boston (Figure 13).
Possible Explanations for the Differences: In addition to perceptions of public safety, which lingers as a challenge in many cities, several other factors seem to be in play. The duration of locally mandated or employer directed shutdowns probably contributed to whether workers had ample time to settle into the habit of working from home, but the decisions of hundreds of thousands of individual employers is harder to document (Figure 14).
Density: Job density in the core downtowns varies significantly across cities, ranging from 825 jobs per acre in Midtown Manhattan to 355 jobs per acre in Chicago to 29 in Memphis. But given that the core was defined for this study on the basis of tract level job density, it should not be surprising that in every city employment density in the core exceeds that in the surrounding area, and by a significant margin. Core job density ranges from four times that of the surrounding area in Lower Manhattan, Nashville and San Francisco to 19 times in Houston. In the neighborhoods adjacent to the core, jobs per acre ranged from 130 in Midtown Manhattan to 59 in San Francisco to four in Indianapolis. In terms of residential population density, the core area’s residents per acre exceeds the surrounding area in 19 out of 26 downtowns, accounted for by the much greater concentration of high-rise apartments and condominiums in downtowns than in adjacent neighborhoods. In the early months of the pandemic, when limited information about Covid-19 was available, density may have been a deterrent: people wanted to avoid other people if they could.
Geographically, the cities with the highest job and population density are in the Northeast Corridor (New York, Boston, Philadelphia), West Coast cities (San Francisco, Los Angeles, Seattle, Portland) and Chicago. In most of these cities, commuters who had relied heavily on public transit experienced the anxiety of being crowded together with strangers and, during the early stages of recovery, a sense of insecurity in emptier stations and transit shelters.
While there was no clear overall regional pattern across the 26 downtowns, the four cities with the lowest worker recovery rate were all in the West: San Francisco, Portland, Denver,
FIGURE 9 CORE DOWNTOWN PRIVATE EMPLOYMENT, AVERAGE ANNUAL PERCENTAGE CHANGE, 2011–2019
Job growth in nearly all downtowns was robust in the decade following the Great Recession.
Source: Census Bureau, Longitudinal Employer-Household Dynamics
and Seattle. These are also cities with a high concentration of Information Technology firms, a sector in which a great deal of work had been performed remotely long before 2020 and which ranks in current surveys as having the highest propensity for work-from-home at 2.55 days per week.21
While Barrero, Bloom and Davis argue that work-fromhome rises with density in many regions, cities with dense city center populations appear to gain some advantages in recovery, as downtown residents have the option to walk or bike to work. Figure 15 compares the rate of worker return in Midtown Manhattan, San Francisco and Austin based on the distance employees live from their place of work. In densely populated Midtown Manhattan and downtown San Francisco, those who live within two miles of their workplace are coming back at much higher rates than others. In less
dense and more auto-dependent Austin, distance appears to have little impact of return to work. The greater dependence on highway commuting within a metro area like Austin with a small downtown residential population may have an equalizing effect, since commute time may be relatively similar from close in or from further out compared to denser cities where a larger proportion of workers commute by transit, walking, or bicycle.
Industry Structure. Downtowns with a higher proportion of jobs in information technology finance and insurance, and professional and business services—sectors with high proportions of jobs that can be performed remotely— tend to have a lower rate of non-resident worker recovery. Correspondingly, those downtowns that were more dependent on leisure, entertainment and hospitality—industries based
20. Austan Goolsbee, Nicole Bei Luo, Roxanne Nesbitt, Chad Syverson, COVID-19 Lockdown Policies at the State and Local Level, Becker Friedman Institute, University of Chicago, August 26, 2020 https://bfi.uchicago.edu/working-paper/2020-116. This dataset for the
Barrero, Bloom and Davis, Figure 2 http://www.nber.org/papers/w31686
Lorem ipsum
Source: Census Bureau, Longitudinal Employer-Household Dynamics
After a decade of strong job growth downtown, nearly all cities lost employment in their city centers in 2020, as face-to-face jobs in retail, restaurants, entertainment and hospitality were most impacted by mandated shutdowns.
Office jobs rebounded faster than many other jobs, even as a significant share of these employees were working remotely. Many employers may have also been willing for the first time to hire fully remote employees.
around face-to-face experience—may have initially seen the greatest employment losses, but based on Placer's measure of non-resident workers who are present downtown, appear to have rebounded faster with a higher percentage of workers back on site. The top three cities in terms of overall recovery—San Antonio, Nashville and San Diego—are also the three cities with the highest share of leisure and hospitality employment.21
Dingel and Neiman (2020) estimated the proportion of jobs within each two-digit NAICS industry that could be performed from home and found that this covered about 37% of all jobs.22 Using these estimates and the 2019 distribution of core downtown employment by industry from LEHD, we estimated the proportion of pre-pandemic downtown jobs that could be performed remotely. The result was a wide variation across downtowns. But a clear pattern emerges on the upper left side of Figure 17 with those cities with a low percentage of jobs that can be performed remotely, also having the highest non-resident worker recovery rates.
Barrero, Bloom and Davis also note that the age of a city’s workforce is a significant variable in the intensity of work from home. “It is lowest among people in their early 20s and peaks among those in their 30s. People in their 20s have high returns to professional networking, on-the-job training, and mentoring—activities that benefit greatly from in-person interactions. Young workers may also place more value on socializing at the workplace or nearby. They are more likely to live in small or shared apartments, which reduces the appeal of work from home. People in their 30s and early 40s are more likely to live with children and face long commutes, raising the appeal of work from home. Older employees may be less keen to work from home because they no longer have childcare responsibilities, or simply because they like to socialize at the workplace.”
21. Barrero, Bloom and Davis tabulate work
and
services industry. 22. Jonathan Dingel and Brent Nieman, How
FIGURE 11 CORE DOWNTOWN PRIVATE OFFICE SECTOR JOBS, AVERAGE ANNUAL PERCENTAGE CHANGE, 2011-2019 Job growth in nearly all downtowns was robust in the decade following the Great Recession.
FIGURE 12 CORE DOWNTOWN PRIVATE OFFICE SECTOR JOBS, AVERAGE ANNUAL PERCENTAGE CHANGE, 2019–2020
https://bfi.uchicago.edu/working-paper/2020-116/
Source: Goolsbee, Austan, Nicole Bei Luo, Roxanne Nesbitt, and Chad Syverson. 2020. "COVID-19 Lockdown Policies at the State and Local Level." BFI Working Paper 2020-116,
Source: Placer.ai
Core Downtown Worker Recovery Rate versus Percentage of Jobs that Can be Done Remotely
FIGURE 17 CORE DOWNTOWN RECOVERY RATE VS PERCENTAGE OF JOBS THAT CAN BE DONE REMOTELY
Three of the four cities that rank near the top in job recovery have the highest share of jobs that can not be performed well remotely.
Chapter 5: Residential Recovery
One of the more notable, urban development patterns between 1990 and 2020 was the rapid growth in the downtown population and the number employed residents in most cities. While in 1990, downtowns were already major job centers, over the three decades from 1990 to 2020 they became increasingly residential, both with older buildings being converted to new uses and extensive new construction of townhouses and high-rise apartments and condos.
Residential density varies significantly among the 26 downtowns with residents per acre in core downtown areas ranging from 104 in Lower Manhattan to 4.5 in Jacksonville and San Antonio. In the adjacent tracts, population density ranged from 147 per acre in Midtown Manhattan to 3.9 in Fort Worth.
But according to LEHD, from 2011 to 2019, employed residents of the core downtowns generally grew more rapidly than employment in cities as a whole. Among the 26 core downtowns, the median average annual growth in employed residents was 3.9%, compared to a more modest median growth of 1% in jobs. In the greater downtown area, employed residents also tended to increase more rapidly than overall employment, suggesting employed individuals were moving closer to their jobs.
Live-Work Nexus: The growth of downtown population and employed residents 2011 to 2019 underscores the increasing proportion of downtown workers who lived downtown. In 23 of the 26 downtowns, the percentage of core downtown workers who live in the area increased from 2011 to 2019. Cities like Philadelphia, San Francisco, Seattle, Washington,
Boston, Denver, Midtown Manhattan and Portland have more than 20% of their downtown workforce living within two miles of the core downtown.
Many of these cities also have more than 40% of their greater downtown residents who work in their greater downtowns, reducing the length of commute or a dependence on public transit.
At the same time as downtowns were becoming more popular as places to work and live, they were also attracting residents who worked outside the downtown, either in other parts of the city or the region, but chose to live downtown because of the concentration of amenities and/or the presence of kindred spirits.
Residential Recovery: The Placer.ai data suggests that the residential population of downtown areas was impacted only temporarily by the pandemic. While there was net outmigration in 2020, most of the 26 downtown areas have seen net in-migration since that time and have larger populations today than they did in 2019. In Q2 2023 residential population in the core downtown areas ranged from 96% of Q2 2019 in Boston to 160% in San Antonio. Within the greater downtown, the average daily residential population in Q2 2023 also exceeded the 2019 level, but by a smaller margin, with cities ranging from 93% of the 2019 level in Phoenix to 134% in Portland.23 This represents a resumption of pre-pandemic trends, when population expansion between 1990 and 2020 in downtown areas was often greater than citywide trends.
The continuing growth of downtown residential populations not only helps with the diversification of city center land-use and the reuse of older office and warehouse buildings, it adds momentum to the return to office and support for all those jobs that rely on the presence of other workers.
FIGURE 18 DISTRIBUTION OF CORE DOWNTOWN NON-RESIDENT WORKERS BY DISTANCE OF HOME LOCATION FROM DOWNTOWN, Q2 2019
2019 Q2 Distribution of Non-Resident Workers by Home Location
Philadelphia has the largest share of downtown workers who live within two miles of their place of work.
Source: Placer.ai
Percentage of Greater Downtown Employed Residents who Work in Greater Downtown,
FIGURE 19 PERCENTAGE OF GREATER DOWNTOWN EMPLOYED RESIDENTS WHO WORK IN GREATER DOWNTOWN, 2020
Primary Jobs, 2019
There is a significant variation across cities in how many people who work downtown live in adjacent neighborhoods.
Net Migration to Core Downtown,
2020-2022
FIGURE 20 NET MIGRATION TO CORE DOWNTOWN, 2020–2022
Source: Census Bureau, Longitudinal Employer-Household Dynamics
While many cities briefly lost downtown residents in 2020, nearly all regained them in 2021 and most surpassed prior population levels by 2022.
Population Gain January 2021–December 2022
Population Change January 2020–December 2022
Source: Placer.ai
Source: Placer.ai
Chapter 6: Visitor Recovery
Visitors constituted the largest share of people downtown in all 26 cities in 2019 and, as noted earlier, the return of visitors requires a much lower commitment to place than signing an apartment or office lease or resuming the daily commute to work. The three cities that lead in overall recovery—Nashville, San Jose and San Diego—not surprisingly are among the cities with the highest share of daily visitors downtown in 2019 and correspondingly, the highest share of employment concentrated in leisure and hospitality. Nashville, San Jose and San Diego also experienced the highest rate of visitor recovery in 2023. A significant portion of jobs in their hotels, bars, restaurants, performing arts, sports, museums and historical sites, and casinos—are best performed in person.
There are variations in rates of visitor recovery even among cities with strong leisure and hospitality sectors. Perceptions of public safety and related media coverage are probably an important variable that are hard to document because there is not always a direct correspondence between actual crime trends, perceptions of safety and media coverage. The issue has also been highly politicized, complicating efforts to separate partisan rhetoric from reality.
There are also differences between cities based on how dependent their downtown hospitality industry was on regional, domestic or international visitors. Recall that Placer’s definition of visitors is broad and includes regional
Visitors in Core Downtown in 2023 Q2 Compared to 2019 Q2
FIGURE 22 VISITORS IN CORE DOWNTOWN IN Q2 2023 COMPARED TO Q2 2019
Source: Placer.ai
Local tourism professionals and downtown managers can calibrate
strategies based on their ability to reach these
shoppers and city residents coming downtown for concerts or for medical appointments, as well regional, national and international tourists. Using Placer’s information on the home location of these visitors, it is possible to separate visitors who live outside the metropolitan area (who are more likely to be tourists) from those who are regional residents. Figure 23 shows that distribution of downtown visitors in 2019. Figures 24 and 25 present, respectively, the recovery rates for regional resident visitors and those who come from outside the metropolitan area.
Recovery rates for regional visitors vary from a high of 100% in San Diego to a low of 71% in San Francisco. For those coming from outside the metro area, the variation is even larger, ranging from a high of 117% in Nashville to a low of 59% in Portland. In seven downtowns—Portland, San Francisco,
Lower Manhattan, Washington, Midtown Manhattan, Chicago, and San Diego—recovery of visitors from outside the region as of the second quarter of 2023 trailed recovery of regional visitors by 10 percentage points or more. In three cities—Fort Worth, Phoenix, and Nashville—recovery of visitors from outside the area exceeded regional visitor recovery by at least 10 percentage points.
Analyzing the reasons for these differences goes beyond the scope of this project and what can be derived from Placer’s data. But these variations should be fertile ground for local downtown managers and tourism professionals with more fine-grained knowledge of their local economies to explore as they develop marketing strategies for visitor and tourism recovery.
Source: Placer.ai
2 Downtown Visitors Living within the Region in Q2 2023 as a Percentage of Q2 2019
FIGURE 24 DOWNTOWN VISITORS LIVING WITHIN THE REGION IN Q2 2023 AS A PERCENTAGE OF Q2, 2019
3 Downtown Visitors Living Outside the Region in Q2 2023 as a Percentage of Q2 2019
FIGURE 25 DOWNTOWN VISITORS LIVING OUTSIDE THE REGION IN Q2 2023 AS A PERCENTAGE OF Q2 2019
Source: Placer.ai
Source: Placer.ai
Conclusion: Following the Data Driven Path to Recovery
The lines of recovery point upward in all 26 downtowns and continued to do so from July through September 2023, though rates of ascent vary considerably. For downtown managers, business, civic and elected leaders, it is essential to distinguish between the many factors examined in this report as to which are fully within local control, what might be influenced and those structural changes that might take decades. What’s most needed now are short-term strategies that produce visible gains and rebuilt confidence.
The sense of foreboding in 2009 at the depths of the Great Recession, as well as that in New York City in October 2001, took time to subside. Recovery is both economic and psychological. Times and technologies change. The national economy that rebounded rapidly from the deadly global influenza epidemic of 1918 was grounded in manual labor, industrial production and face-to-face work in offices in which the typewriter had only been widely introduced within the memories of many working adults.
In our digital and virtual age, the path to recovery will differ from those that followed prior health, terrorism or natural disasters. But all forms of human interaction still benefit from face-to-face encounters, especially in the workplace where they facilitate brainstorming, collaboration, innovation and mentoring. Even as firms structure special-purpose, planned days in the office, there will still be the missed, unplanned conversations in elevators, hallways and on street corners; the random meetings of colleagues from different departments or
competing companies that spark new ideas. There’s the loss of on-the-job learning that comes from being in the same room, especially for younger workers, who miss unplanned moments of apprenticeship. Those employers who choose more robust return-to-office policies will need to work harder to make that case, to fashion their incentives and to decide where along the hybrid continuum they choose to land.
For city center professionals, the tasks rise from the simple to the complex:
Clean and Safe: Focus first on what is within our control. Clean and safe downtowns were important before the pandemic and they are more essential now, with the added challenge of rethinking and rebuilding confidence in public safety programs. Marketing strategies and events should be designed to win back the hearts and minds of workers and visitors who were given many reasons to avoid downtowns. Highly visible streetscape, greening, park improvements and public space activations can yield major dividends. BIDs were made for this moment.
Downtown Land-Use Diversification:
The diversification that has been underway for the last three decades should accelerate. As Jane Jacobs put it simply 60 years ago, people have no reason to be on sidewalks they have no reason to use. Single-use districts are a formula for failure. The more we can comfortably mix offices, education and health care institutions, hotels and residential buildings, even within
City centers historically have been places for innovation, collaboration, the generation of new ideas, technologies and industries that create new opportunities for work and rising standards of living. The sooner they fully rebound, the more they restore their role in providing opportunities for workers at all skill levels.
the same development, the more animated our sidewalks, the safer our streets. The more we offer flexible zoning or financial incentives to facilitate the transition from office and warehouse to hotel, apartment or dormitory, the sooner our downtowns will fully rebound.
Repurposing Empty Offices: As noted in Chapter 2, the conversion of obsolete office buildings to residential is a hot topic in real estate and media circles. While many cities have made enormous progress on this front, the national average share of residents as a percentage of the total number of people downtown in 2019 was 7%, with highest shares found in Portland, Philadelphia, Seattle and San Francisco, ranging from 11% to 13%. Visitors constitute the lion’s share of foot traffic, but it is office, education, health care and laboratory workers who drive the local economy, whose buildings, businesses or workers contribute most to the urban tax base and who drive demand for public transit. It would take an extraordinarily high number of new residents to compensate for any continuing absence of workers. While downtown amenities are a major lure, proximity to work remains a prime driver for downtown living. Office conversions are a key strategy for repurposing real estate and diversifying land-use, but are hardly a panacea for the problems we confront.
Virtual meetings and file sharing platforms have enormously expanded the flexibility first offered by email and cellphones. They enable work-from-anywhere scenarios, beneficial to employers and employees. But few major technological changes come without downsides. Automobiles and suburbanization offered freedom to 1950s and 1960s middleclass families, increased homeownership and improved living
standards. But they left a legacy of unsustainable regional development patterns, an underside of urban redlining, the abandonment of cities, declining tax bases and concentrated poverty.
City centers, particularly those with strong transit systems, are places of opportunity for workers at all skill and educational levels. When office and other high-skilled workers are remote, they gain flexibility with childcare, reduce costs and time of commuting. But their absence limits the time they devote informally to mentoring the next generation of professionals and reduces both mid-level jobs and those in building maintenance, security, transportation, retail and restaurants— all of which rely on the presence of others. Unionized janitorial positions in downtown Philadelphia offices are off by a third.
City centers historically have been places for innovation, collaboration, the generation of new ideas, technologies and new industries that create new opportunities for work and rising standards of living.
This report opened with a basic question: “Can downtowns in the United States rebound, prosper and restore their primary generative functions?" The answer is most definitely “yes.” But only if we plan carefully for the goals we seek, base decisions on a clear understanding of local conditions, take informed risks and make the investments required for a vibrant and inclusive city future. The fate of downtowns, the largest, concentrated centers of employment in most regions, depend on the decisions we make today.
A
Appendix
*Atlanta, GA
*Austin, TX
*Boston, MA Charlotte, NC Chicago, Il
*Columbus, OH Dallas, TX
*Washington DC
*Denver, CO
Fort Worth, TX Houston, TX
*Indianapolis, IN Jacksonville, FL
Los Angeles, CA
Lower Manhattan, NYC
Memphis, TN
Midtown Manhattan, NYC
*Nashville, TN
Philadelphia, PA
*Phoenix, AZ
Portland, OR
San Antonio, TX
San Diego, CA
San Francisco, CA
San Jose, CA
Seattle, WA
*State Capital
Atlanta, Georgia
Austin, Texas
Boston, Massachusetts
Charlotte, North Carolina
Chicago, Illinois
Columbus, Ohio
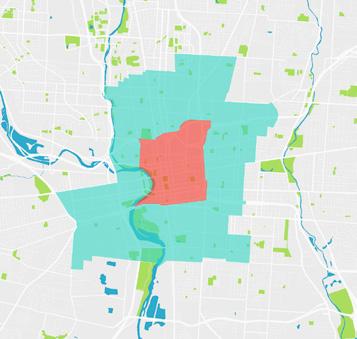
Dallas, Texas
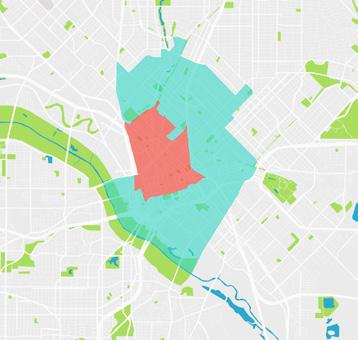
Denver, Colorado
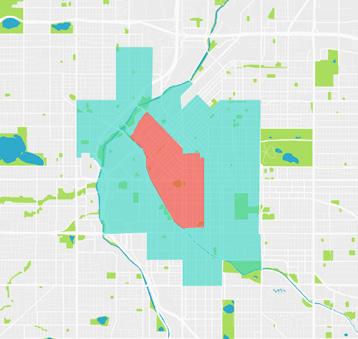
Fort Worth, Texas
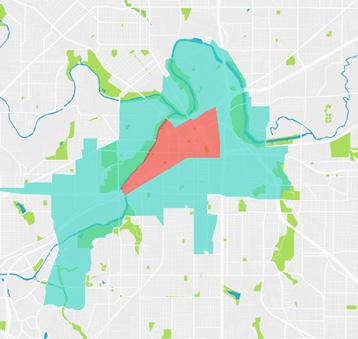
Houston, Texas
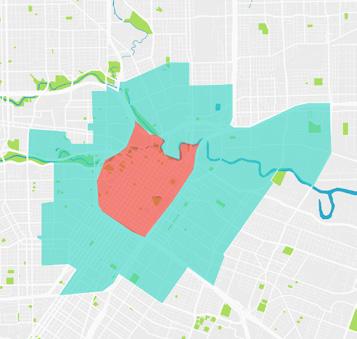
Indianapolis, Indiana
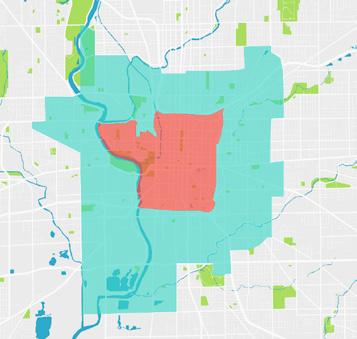
Jacksonville, Florida
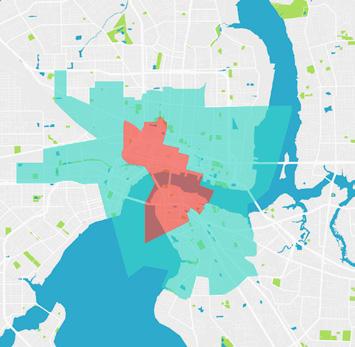
Los Angeles, California
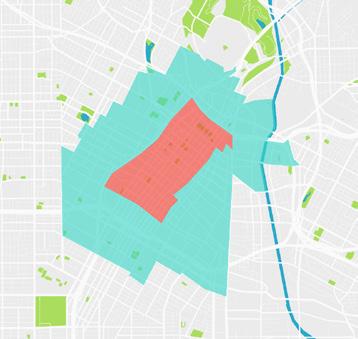
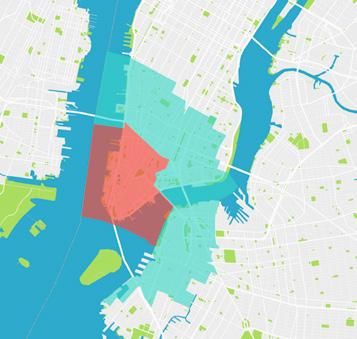
Lower Manhattan, New York
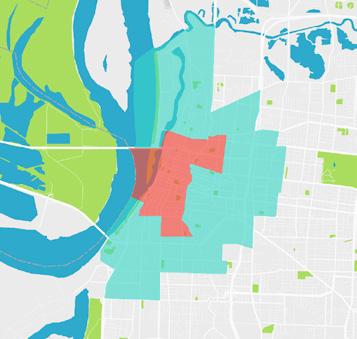
Memphis, Tennessee
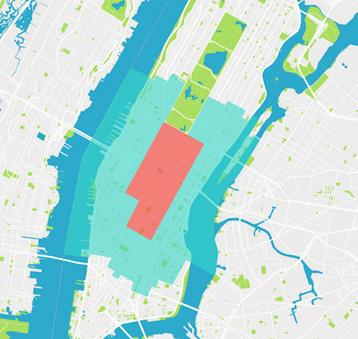
Midtown Manhattan, New York
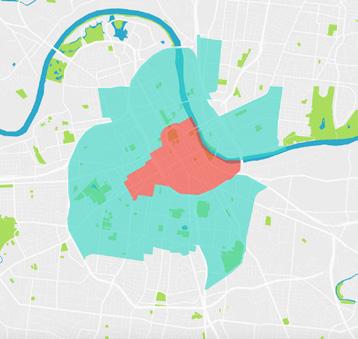
Nashville, Tennessee
Philadelphia, Pennsylvania
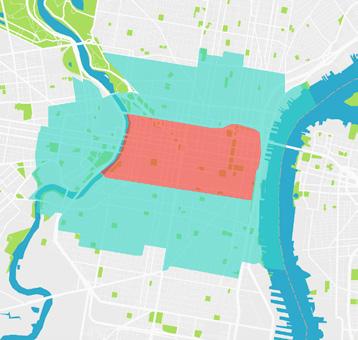
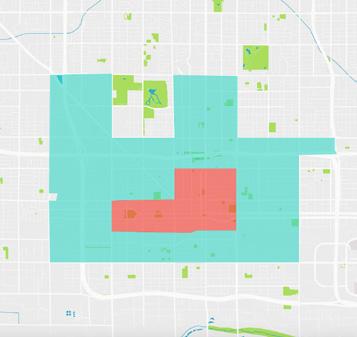
Phoenix, Arizona
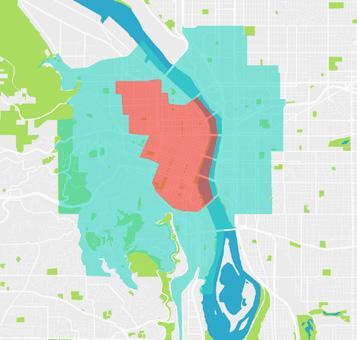
Portland, Oregon
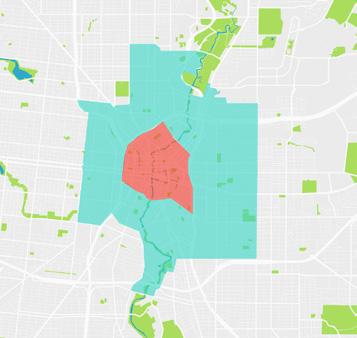
San Antonio, Texas
San Diego, California
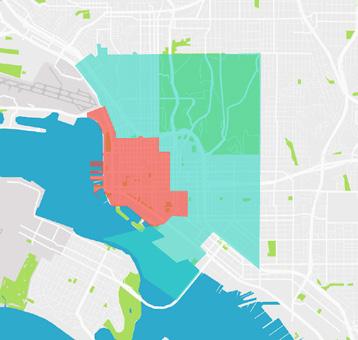
San Francisco, California
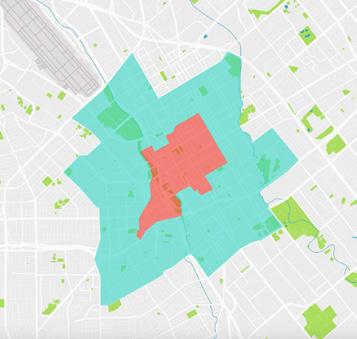
San Jose, California
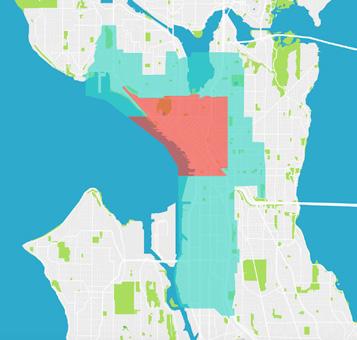
Seattle, Washington
Washington, D.C.
Appendix: Methodology
How Downtown Areas Were Defined. The group of downtown areas that are the focus of this report represent the high density, core commercial areas within the 25 cities that had the largest citywide employment as of 2019. The data were drawn from Census Bureau, Longitudinal EmploymentHousehold Dynamics Origin-Destination Statistics (LODES), available at https://lehd.ces.census.gov/data/#lodes. In the case of New York City, two core commercial areas were included, Midtown Manhattan and Lower Manhattan, because of the size and significance of these two employment nodes.
Definition of Core and Greater Downtown Areas. Core and greater downtown areas were defined on the basis of job density and jobs per resident at the Census tract level. The data necessary for these calculations included:
• Employment. Primary jobs from the LODES. Primary jobs are defined as the highest paying job for each worker during the year.
• Land Area. Land area for 2020 Census tracts was drawn from US Census Bureau TIGER/Line shape files database, available at https://www.census.gov/cgi-bin/geo/ shapefiles/index.php.
• Population. Population was drawn from the 2020 decennial census P. L. 94-171 Redistricting Data, available at https://www.census.gov/programs-surveys/decennialcensus/about/rdo/summary-files.html.
Tracts were included within the core downtown if their employment density was 40 jobs per acre or more or they had at least twice as many jobs as residents. A total of 229 tracts across the 26 downtown areas met one or both of these criteria. An additional 49 tracts were included in the core downtown to ensure a coherent overall shape for the area, typically in situations where a tract with low job density was surrounded by other tracts that met the criteria for inclusion in the downtown.
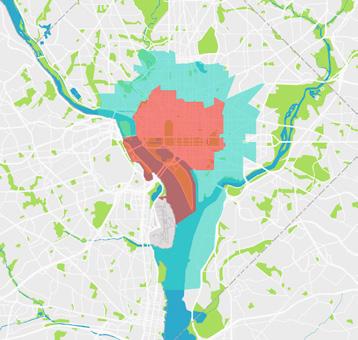
The adjacent area tracts were identified as those with a geographical center within one mile of the boundary of the core downtown. There were 788 tracts that met this criterion. Compared to the core downtown tracts, these adjacent tracts generally had lower employment densities but comparable population densities. High job density in some of the adjacent tracts occurred in situations where they covered employment nodes that were nearby but distinct from the downtown employment node. Core area + adjacent area = greater downtown.
Placer.ai Data. Once the core and greater downtown areas were determined, shape files representing these areas were provided to Placer.ai. Placer drew these areas as points of interest (POIs) on its platform. CCD downloaded population data for workers, residents, and visitors for each POI to create the data used in this report.
Live-Work Data. Employment, employed population, percentage of workers who live in the downtown, and percentage of employed residents who work in the downtown were derived from LODES and accessed by the OnTheMap website, located at:https://onthemap.ces.census.gov/.
Data from Placer, LEHD, and tract level data on employment, population, land area, and population and employment density are available from the Center City District website at: https://www.centercityphila.org/research-reports/downtownsrebound-report-2023.
The Center City District (CCD), Central Philadelphia Development Corporation (CPDC) and Center City District Foundation (CCDF) work together to enhance the vitality and competitiveness of Philadelphia’s downtown. In 1991 the business leadership organization CPDC created the CCD business improvement district to deliver daily services with the goal of making Center City clean and safe. This helped transform Center City into a vibrant 24-hour downtown, attractive to businesses, residents, students, shoppers and tourists.