
4 minute read
Propensity Score Matching


To measure the outcomes of the population that enrolled in the Cecelia Health diabetes management program against those who did not choose to enroll, a statistical technique known as propensity score matching (PSM) was leveraged to create a population of those who did not enroll that looks statistically similar to the population that did enroll. PSM uses logistic regression to calculate the log-likelihood that a member would enroll in the Cecelia Health program
The logistic regression regresses demographic information, total medical spend, medical spend by disease state, total healthcare utilization, and healthcare utilization by disease state to calculate the log-likelihood of a member enrolling in the Cecelia Health program. The loglikelihood of an individual who elected to enroll in the Cecelia Health program was then paired with an individual who did not enroll but, had the same or similar log-likelihood of enrolling with the understanding that the individuals resemble one another across many dimensions.
The generic mathematical representation of the logistic regression is represented by Equation 1. A truncated representation of the logistic regression model used for this study is represented by Equation 2 with Table 2 representing all the covariates (or member characteristics) used. Prior to PSM, all continuous covariates are scaled between 0 and 1.
Equation 1: Generalized Logistic Regression Formula
+
+ �������� ��������
Equation 2: Truncated Logistic Regression Formula Used for PSM enrolled���� = ����0 + ����1 �������������������� ���������������� ���� + ����2
���� + +
Propensity Score Matching Covariates
Member Age
Gender - Female
Language - English
Language - Spanish
Language - Arabic
Language - Hmong
Language - Somali
Language - Vietnamese
Total Medical Spend - Pre
Diabetes Medical Spend - Pre
Chronic Kidney Disease Medical Spend - Pre
Cancer Medical Spend - Pre
Surgical Medical Spend - Pre
Inpatient Medical Spend - Pre
Emergency Dept. Medical Spend - Pre
Outpatient Medical Spend - Pre
Urgent Care Medical Spend - Pre
Office Medical Spend - Pre
Telehealth Medical Spend - Pre
Inpatient Visit Count - Pre
Emergency Dept. Visit Count - Pre
Outpatient Visit Count - Pre
Urgent Care Visit Count - Pre
Office Visit Count - Pre
Telehealth Visit Count - Pre
After PSM, exploratory data analysis looks to ensure the balance between those enrolled in the Cecelia Health program and those not enrolled in the Cecelia Health program is statistically similar. Checking the distribution of propensity scores, or the log-likelihood that a member would enroll in the Cecelia Health program, demonstrates an even distribution between those who enrolled compared to those who did not enroll as seen in Figure 2
The resulting means of the variables used for the model after matching look more similar between those who enrolled in the Cecelia Health program compared to those who did not enroll, as shown in Table 4 The cohorts look much more similar to one another, with the average age of individuals in the cohort measuring as approximately 67 years old, the enrolled cohort having a PMPM within 2% of the not enrolled cohort, fulfilling the parallel slope assumption for the difference-in-differences (see below Difference-in-differences section), and both cohorts having similar emergency room utilization. While the Plan - Medicare and Plan - Medicaid covariates were considered but ultimately excluded from in the model, the prevalence of those plans is much more comparable now between the enrolled and not enrolled cohorts when comparing the balance between Table 3 and Table 4
Table 4: Post-Matched Means: Enrolled vs. Not Enrolled
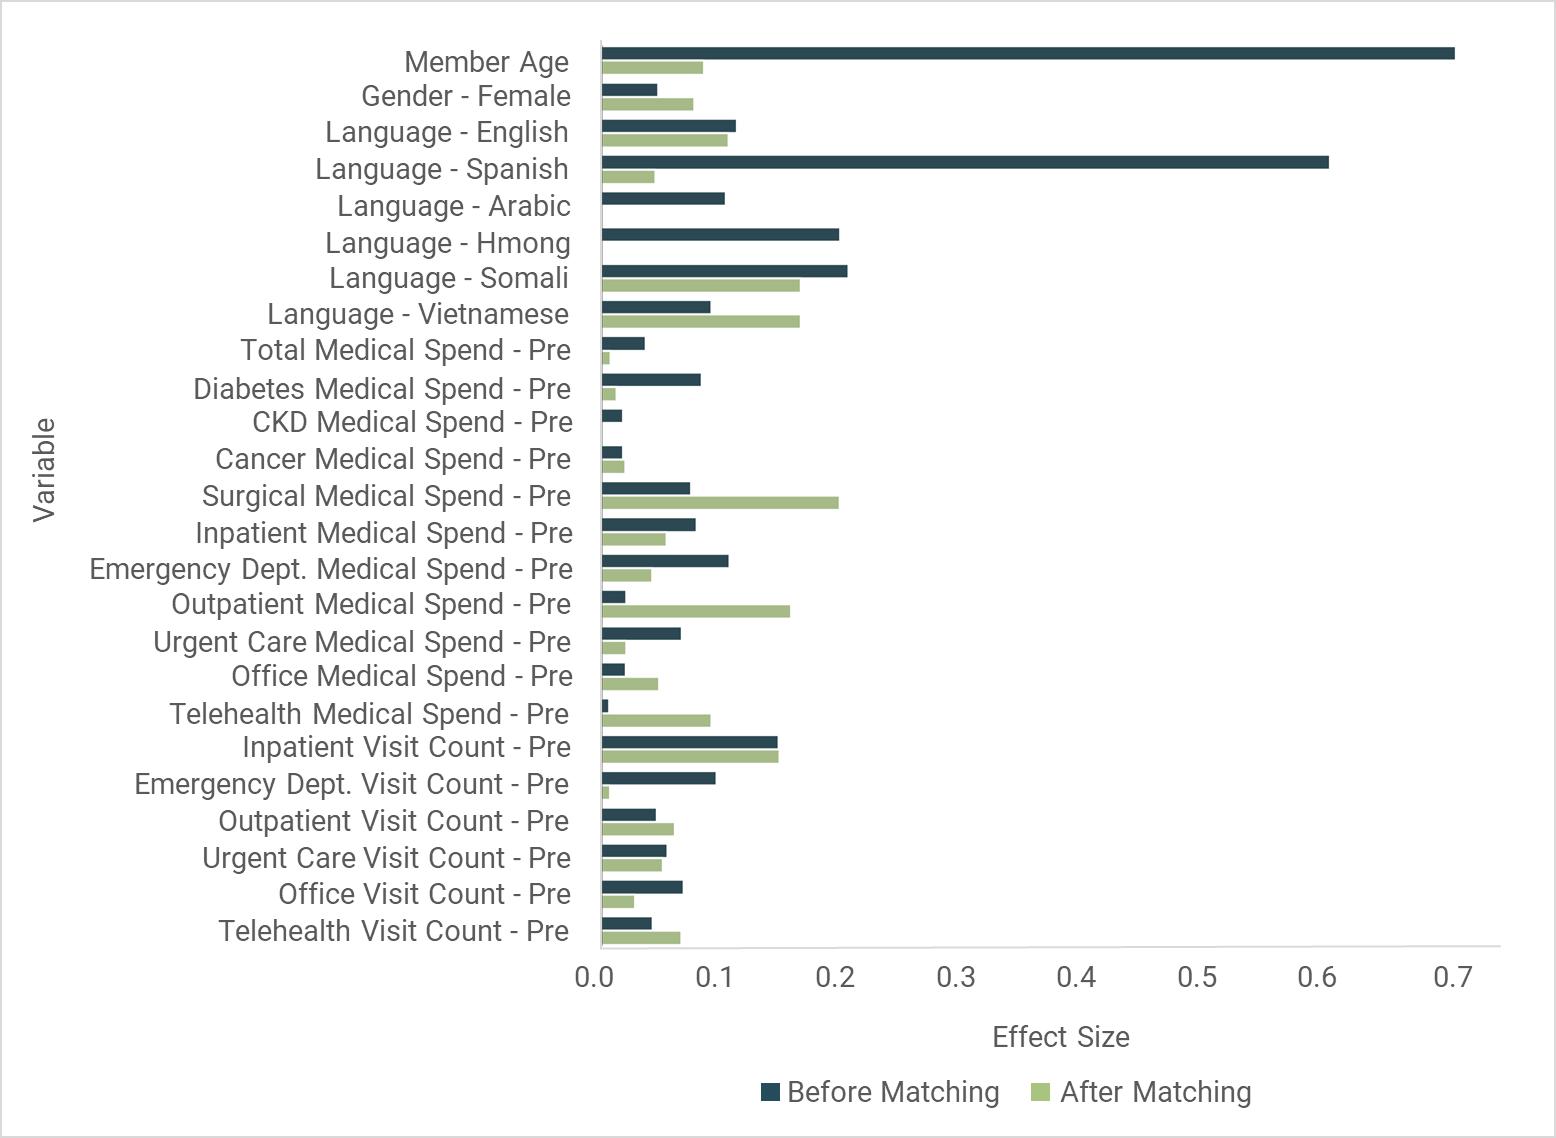
Standardized mean differences (or Cohen’s d) are measured for each covariate used in the PSM model to ensure the differences between each covariate will not have an oversized impact on the analysis. The most common interpretation for standardized mean difference was initially suggest by Jacob Cohen and updated by Shlomo S. Sawilowsky (Sawilowsky, S [2009]). Those values can be found in Table 5
Using this interpretation, it is observed that after matching, the standardized mean differences are all categorized as having a small or very small impact on the analysis as represented by Figure 3
Difference-in-differences
To measure the plan’s return on investment (ROI) for the Cecelia Health diabetes management program, a difference-indifferences was performed. Difference-indifferences attempts to measure the differential effect of the impact the Cecelia Health program has had on those who enrolled versus those who did not enroll but looks statistically similar to those who did. The main assumption for difference-indifferences is the “parallel trend assumption.” For the purposes of this study, the parallel trend assumption is the six (6)month medical spend in the pre-period for the enrolled population compared to the nonenrolled population. PSM is used to ensure the two populations have a similar six (6)month medical spend leading up to the program date.
Equation 3 through Equation 7 represents the difference-in-differences used to calculate the return on investment, where c represents the cohort (enrolled or not enrolled), and t represents the period (pre or post).
Equation 3: PMPM Equation for Difference-in-differences
Equation 4: Six-month Cost Differential Equation for Difference-in-differences
Equation 5: Gross Savings Equation for Difference-in-differences
Equation 6: Costs Equation for Difference-indifferences
Equation 7: ROI Equation for Difference-indifferences
������������������������������������������������������������������������
Results
Members who enrolled in February and March of 2022 demonstrate a six (6)-month total cost differential of $161,376. Those who did not enroll had a six (6)-month cost differential of -$135,792. The difference between the two is a gross savings of $297,168. For the enrolled population, there were 164 enrollments and 82 reenrollments for a total cost of $79,950. This reveals a return-on-investment of 3.72 : 1. Table 6 is a tabular representation of the equations laid out above (see Difference-in-differences section).
Analysis
Diving deeper into the outcomes, Table 7 represents the claims costs for the enrolled and not enrolled population where diabetes is the primary diagnosis. Both cohorts have similar PMPMs in the pre period. Those enrolled saw a 16% reduction in their PMPM in the post period where those not enrolled saw a 22% increase in PMPM.
Table 7: Claims Costs, Where Diabetes is Primary Diagnosis
Table 8 represents the claims costs for the enrolled and not enrolled population by place of service. The aim of the Cecelia Health diabetes program is to help members better manage their diabetes and other comorbidities to reduce the cost burden of inpatient and emergency department utilization Both cohorts have elevated PMPMs for inpatient hospital and emergency room places of service in the pre period. This is expected, as individuals who opt into disease management programs often have had an inpatient admission or an emergency department visit prior to enrollment. The enrolled population realized a 71% reduction in inpatient hospital PMPM compared to only a 7% reduction for the not enrolled population. The enrolled population also demonstrated a 3% reduction in emergency room PMPM compared to a 24% increase for the not enrolled population.
