3 minute read
Techniques for representing data


Mapping is a really effective technique for representing data in a visually striking manner when it comes to preparing outputs from a research project. But mapping is also very useful for analysing and interpreting data.
Plotting descriptive information like quantity, genre, audience size, frequency and timing on a map helps the researcher answer basic geographical questions about where and when different types of festivals and events take place across cities.
Advertisement
This kind of information, once mapped, then prompts more analytical questions about the differences revealed across space between festivals that differ by type and genre, happen at different times of the year and are located in different municipal districts. Maps are helpful in communicating potentially complex research findings to diverse kinds of audiences and can be easily turned into graphics that capture the key storylines emerging from data. Mapping was a key technique used by Festspace’s Barcelona team which produced an extensive series of detailed maps describing and analysing the complex geographies of festival space in the city.
FIlmic representations have become an increasingly important means of communicating the findings of research projects. Film facilitates powerful visual and auditory accounts and can be easily shared with audiences from within and outside of academia. In the Festspace project, a number of short films were produced as a means of sharing the insights generated from our case study cities. These films were produced by documentary filmmakers, hosted on Youtube and shared widely on social media channels.
When considering using film as a data gathering and communication tool, researchers should ensure that they have budgeted sufficiently to cover all elements of the production process.
Furthermore, it is important to be clear on the type of film being commissioned, whether that be a documentary or simply a representation of an event. Research conferences now commonly have space for film screenings and these can also be relatively easily hosted online with time for discussion built in. The filmmaker involved will also be keen to have their work shared and that can take research findings into a non—academic spaces which can extend the impact of the work.

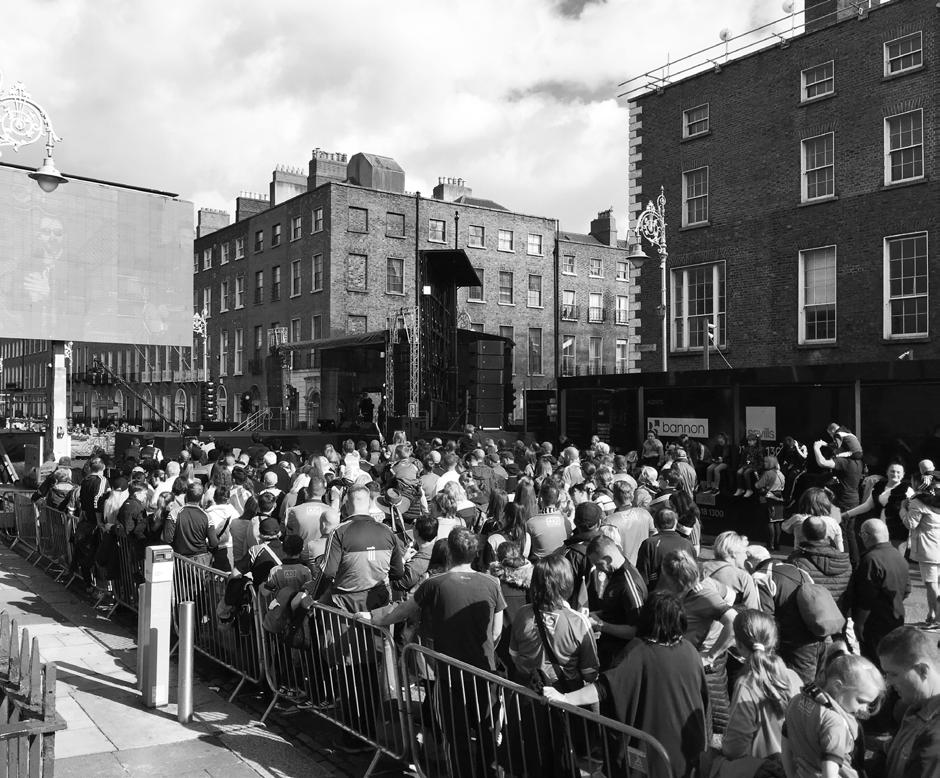
Photographs
In the academic community it is now common practice to include photographs in various forms of academic publications and when presenting research findings at conferences the use of visual representations is also becoming the norm.
Festivals and events are a fertile arena for taking photographs (with permission as required) and these can be used to communicate research findings effectively. When considering using this strategy, make sure to use a good quality camera so that your photographs have a high enough resolution to be used for publication purposes. Furthermore, ensure you have the permission to use the photograph and acknowledge this in all forms of publication and dissemination, including presentations. Images like those included here give an indication of the kinds of audiences in attendance, the size, nature and layout of the festival site, the type of festival activities ongoing, and hint at the prevailing festival atmosphere in their depiction of colours, movements, textures and other dynamics.


Illustrations
Illustrations and drawing are less commonly used in festival and event research, but they constitute another very effective means of both gathering and representing data.

In other fields of study, drawings are commonly used by researchers working with children because they are a useful means of accessing children’s experiences and perspectives.
Much potential exists to expand research on children and festivals, and the use of drawings as a research technique has much to offer in this respect. Drawings produced by child research participants, once anonymised, can then be used to illustrate study findings. Drawings and illustrations can also be used more widely as research tools.
Professional graphic illustrators, for example, can be employed to graphically harvest/ capture the key ideas emerging in data gathering contexts like facilitated workshops and focus group discussions. Illustrations capturing the main points emerging from the discussions can be captured almost in real time. The illustrations, in draft form, can then be displayed and further discussed and reviewed among the research participants, prompting feedback that serves to validate the data being gathered.

The Festspace team used this technique and found the final illustrations to be very effective in representing the research findings.
Visually, they have immediate appeal, inviting curiosity and continued engagement with the research question. They can be used to disseminate research outputs in traditional academic settings, including as teaching aids, but are also very useful in applied contexts.
The field of festival and events research has expanded rapidly in recent years, with the diversity, breadth and depth of empirical studies growing accordingly. This Handbook of Methods for Researching Event and Festival Spaces aims to serve as a resource for those interested in the complex and multi—faceted relationships between festivals, events and public space. It does not claim to be comprehensive but rather aims to offer insight into contemporary research practice in the field as well as some suggestions and guidance as to how data can be both gathered and represented. We hope that the Handbook will prove useful for those researchers who are just starting to ask questions about event and festival spaces as well as to those whose research has already contributed to making this research area a sophisticated and established field of enquiry. 39