Jacob Clark Wealth Advisor, Family Office Services
About Clearwater Capital Partners
Clearwater Capital Partners was founded in 2006 by John Chapman to address long standing shortcomings in the financial industry, including conflicts of interest, limited transparency, and unmet promises. From the beginning, the firm was built on the belief that investors deserve clear, honest guidance focused on real world needs, not fragmented sales driven solutions. That commitment to integrity and competence continues to guide every decision we make. Shaped by principles established at our founding, Clearwater has grown primarily through client referrals, reflecting deep trust and lasting relationships. Today, we are a well established and thriving firm, grounded in experience and driven by purpose.
The Clearwater Capital Team
Board of Directors
John Chapman
John Sleeting
Jeffrey DeHaan
Operating Committee
John Chapman
John Sleeting
Jeffrey DeHaan
James Chapman
Tyler Beachler
Katie Berganske-Frank
Danuta Garb
Kevin Nolte
Wealth Advisors
John Chapman
John Sleeting
Jeffrey DeHaan
Greg Davis
James Chapman
Melissa Dailey-Newman
Valerie Hogan
Jacob Clark
Kevin Rochford
Institutional Advisory Services
Kevin Carani
John Ellis
Carter King
Portfolio Management
Tyler Beachler
Rocky Byrd
Tyler Bertsche
Advanced Planning
Kevin Nolte
Conor Durkin
Phillip McCloskey
Global Strategies
Hunter Sims
Operations Specialists
Andrea Patterson
Phillip Richardson
Brand and Marketing
Katie Berganske-Frank
Hayley Holmes
Human Resources and Accounting
Danuta Garb
Client Experience
Katie Berganske-Frank Liza Alexanian
Hayley Holmes
Compliance and Risk Management
Jeffrey DeHaan
James Chapman
Rocky Byrd
Accounting Services
Danuta Garb
Erica Rangel
Our team’s expertise spans with designations that include: AIF®, AWMA®, CDFA®, CEPA®, CFA®, CFP®, CPA®, CPFA®, CTFA®, CRPS®, J.D., QKA®.
The Introduction
High Gear, Low Visibility
Progress, Pressure, and the Discipline to Stay Balanced
Every month, through our Private Client Letter, we write to tell you what we think. We share our reading of the economy, our observations on the markets, our reactions to policy developments, and the themes we believe deserve your attention. That monthly rhythm has become one of the defining practices of Clearwater Capital Partners, and it is how we stay in conversation with you between the reviews, meetings, and calls that make up the ordinary work of the practice.
Twice a year, in January and again in July, we set that rhythm aside to write at length. The January Outlook and the July Mid-Year Update are the two publications in which we take a deeper dive. We step back from the monthly cadence, gather the evidence, test our own thinking against the best outside sources we can find, and put on paper what we believe is worth saying about the year ahead or, in this case, about the year underway. This publication marks our twentieth cycle in that tradition, and if anything, we hold the exercise in higher regard now than we did when we began.
The Mid-Year Update you are about to read has been in preparation since the spring. Every conclusion in it has been tested against multiple independent sources. Every data point has been drawn from primary references we consider reliable. Where we cite third party commentators such as Brian Wesbury, Jeremy Siegel, Bob Doll, Ed Yardeni, and Tom Lee, we have read them for decades, and we cite them because they help us pressure test our own thinking, not because we agree with each of them all of the time.
We recognize that a document of this length arriving in your inbox on a summer afternoon is a real request for your attention. We do not send it lightly. We send it because we believe that clients who understand the framework behind the portfolios they own are better prepared for the volatility that inevitably comes, better able to distinguish signal from noise when markets move and better positioned to make sound decisions about their own financial lives when they matter most. The purpose of the Mid-Year Update is not to impress you with detail.
The purpose is to invite you into the reasoning behind the counsel we provide.
We would ask three things of you as you read. First, take your time. This report is intended to be read in sittings, not in a single scroll. Second, mark the passages that raise questions in your mind. We welcome the opportunity to discuss our perspectives in the context of your own plan, and there is no question about your portfolio or the economy that we would rather have on the agenda. Third, share the report with people in your life for whom the material would be useful. Adult children who are beginning to build wealth, family members who are approaching retirement, business partners and colleagues who wrestle with the same market questions are all welcome to receive it directly.
We exist to “inspire and empower our clients to live with confidence, joy, and a spirit of abundance,” and that mission is served whenever the reasoning behind our perspectives is clearly communicated to people who can benefit from it.
The monthly Private Client Letter is our steady voice. The Outlook and the Mid-Year Update are our deeper dives. Together, they are the way we invite you into our thinking across the full arc of the year. We hope you find in this edition evidence of the care we take on your behalf, and we look forward to discussing it with you in the weeks
Chief Executive Officer and Chief Investment Strategist
Executive Summary
Six months into 2026, the framework we described in January remains broadly intact, but its composition has shifted in ways worth understanding.
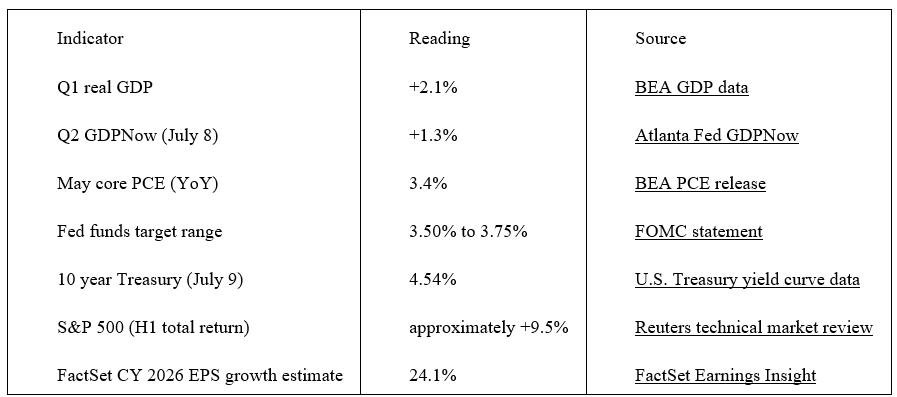
Growth is positive but slower than we had projected. Inflation is meaningfully hotter than we, and most forecasters, expected. The Federal Reserve has not delivered the rate cuts we anticipated. Yet corporate earnings have surprised sharply to the upside, artificial intelligence capital investment has grown from extraordinary to nearly incomprehensible in scale, and the S&P 500 gained approximately 9.5% through June (Sources: FactSet Earnings Insight; Reuters technical market review; BEA PCE release; Federal Reserve SEP).
We arrive at midyear with five conclusions that shape our thinking for the second half.
✓ First, our constructive realism framework has held. Innovation and earnings are real. Inflation, restrictive policy, elevated valuations, and unresolved geopolitical questions are equally real. Both statements remain true at the same time.
✓ Second, we were too optimistic on the timing of disinflation and rate cuts. Core PCE inflation stood at 3.4% in May, well above the midpoint 2% zone we expected by year end, and the Fed’s June projections imply essentially no cuts from the current target range through 2026 (Sources: BEA PCE release; Federal Reserve SEP). Rate cuts remain possible in 2026 yet will be highly dependent on the deescalation of military activity in the Middle East and lower oil prices.
✓ Third, we were too conservative on earnings. Analysts have raised full year 2026 S&P 500 earnings growth expectations to roughly 25%, from less than 16% at the start of the year, and the FactSet estimate is now 24.1% (Charles Schwab; FactSet Earnings Insight). Earnings, more than multiple expansion, powered the first half rally and this is a positive development relative to valuations.
✓ Fourth, market leadership has been narrower than we, or the market itself, should be comfortable with. Only about 17% of S&P 500 stocks outperformed the index over the trailing month, and the equity risk premium is thinner than at any point in the past two decades (Charles Schwab). This continues to be a concern.
✓ Fifth, the second half of 2026 offers less margin for error than the first. The market has effectively delivered our full year base case return in six months, before the most important policy and election questions have been resolved.
Our second half positioning follows from these conclusions. We remain meaningfully invested but ready to rebalance rather than chase. We emphasize quality over beta, intermediate duration over yield reaching, and tighter underwriting in private credit. We preserve liquidity so that midterm and policy volatility becomes an opportunity rather than a threat. In sum, our view is unchanged in spirit: constructive, but not complacent.
Outlook 2026: High Gear, Low Visibility
The title of this year’s report, Outlook 2026: High Gear, Low Visibility, Riding Between Confidence and Caution, was chosen deliberately. It captured the peculiar condition in which investors would find themselves as the year began. An economy still signaling healthy growth, an innovation cycle still gathering force, and a policy landscape still shrouded in fog. Six months later, the image is more apt than it was in January. The economy remains notably resilient, however, the path forward has not necessarily become any clearer.
We wrote at the start of the year that our framework for 2026 was one of constructive realism. Constructive because the tailwinds of earnings, artificial intelligence, and American business adaptability were real and durable. Realistic because the headwinds of sticky inflation, restrictive monetary policy, elevated valuations, and unresolved trade and geopolitical questions were equally real. At midyear, the balance of that judgment has held. The composition of these factors, however, has shifted in ways worth reviewing carefully.
The first half of 2026 delivered an unusual combination. Growth was positive but slower than our base case. Inflation was hotter than we, and most forecasters, expected. The Federal Reserve did not cut rates at all, a marked departure from the three cuts that formed part of our bullish scenario. And yet corporate earnings surprised meaningfully to the upside, the S&P 500 gained approximately 9.5% through June, and the AI capital investment cycle grew from extraordinary to nearly incomprehensible in scale (Sources: FactSet Earnings Insight; Reuters technical market review; BEA PCE release; Federal Reserve SEP).
We remind clients, as we always do, that forecasts are tools, not anchors. Our January report was a working thesis, and this Mid-Year Update is the honest revision of it in light of what we have learned. Some of our calls have been vindicated. Some have proven too conservative. Others need notable revision. In every case, our responsibility is the same. To interpret the evidence as clearly as we can, to communicate it plainly, and to align portfolios with client goals rather than with headlines.
First Half 2026 at a Glance
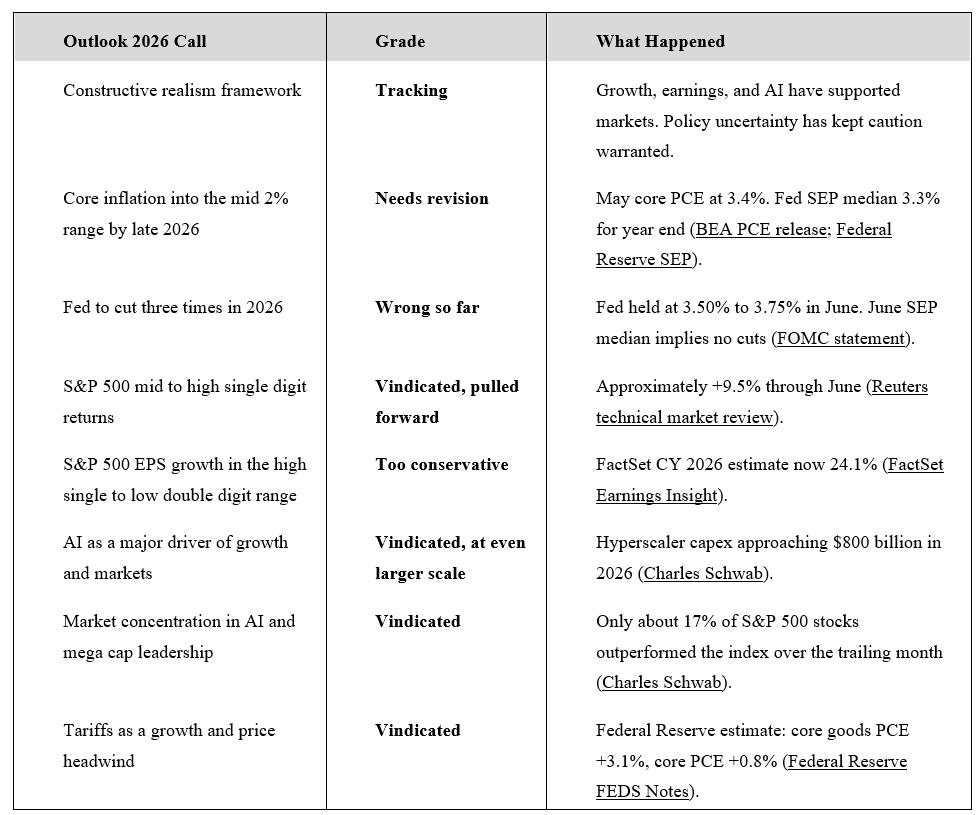
Report Card: Where Outlook 2026 Stands at Midyear
Before turning to the second half analysis, we owe our clients a candid accounting of our January forecasts. In the interest of transparency, a discipline we have tried to maintain across two decades of these publications, we grade the eight most consequential Outlook 2026 forecasts against what has actually unfolded through the first six months of the year.
Broadly, we were directionally right on the framework, too conservative on earnings and AI capital investment, and too optimistic on the timing of disinflation and rate cuts.
The lesson embedded in this scorecard is one we have written about before. A framework can be broadly right while individual calls miss the mark. The discipline of the investor is not to abandon a sound framework because of an incorrect forecast within it, but to update the framework where the facts warrant.
Will the Economic Engine Keep Running?
A year ago, our Outlook 2025 - Mid-Year Update asked, “Will he or won’t he?”, referring to the Federal Reserve and the question of rate cuts. This year the question is broader and, in some ways, more consequential. Will the economic engine keep running? Can earnings, artificial intelligence, and business adaptability continue to offset the drag from inflation, restrictive rates, tariffs, and policy uncertainty?
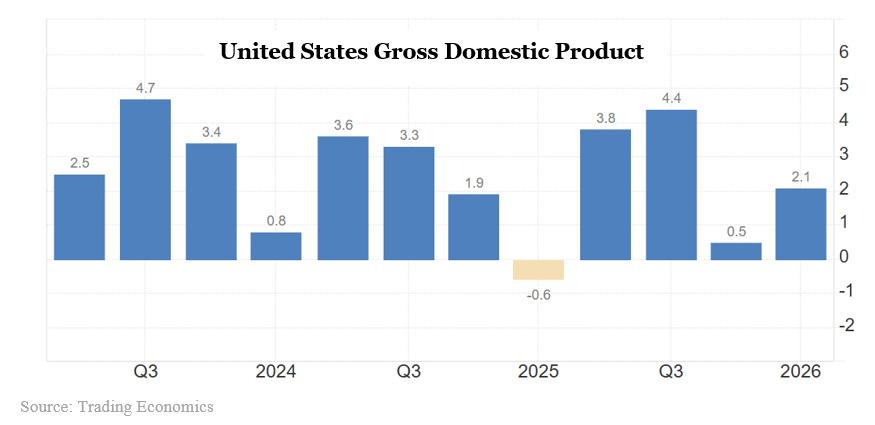
The evidence at midyear is encouraging but not conclusive. Real GDP grew 2.1% in the first quarter, and the Atlanta Fed’s GDPNow model estimated 1.3% for the second quarter as of July 8 (Sources BEA GDP data; Atlanta Fed GDPNow).
That is positive growth, but noticeably below the 2.5% to 3.0% range we had described in January. The Fed’s own June statement described economic activity as “expanding at a solid pace” and continued to note “strong productivity growth and capital investment,” even as it emphasized elevated uncertainty (Sources: FOMC statement).
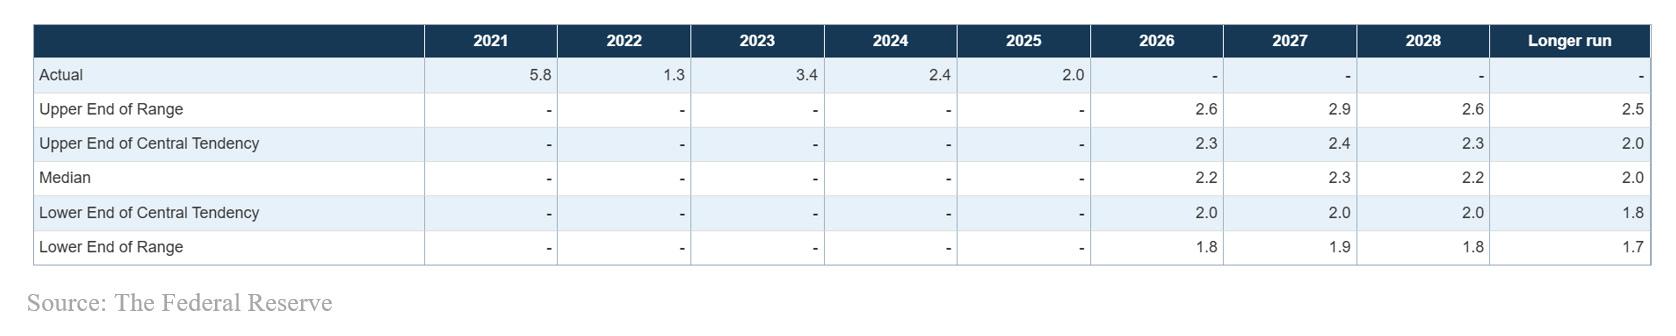
In conjunction with the Federal Open Market Committee (FOMC) meeting held on June 16–17, 2026, meeting participants submitted their projections of the most likely outcomes for real gross domestic product (GDP) growth. Their expectations are presented on the table below:
The most important support has come from a place we did not sufficiently credit in January: corporate earnings. FactSet’s June 30 report estimated second quarter S&P 500 earnings growth of 23.3% and full year 2026 growth of 24.1%, with the CY 2026 EPS estimate rising to $340.52 (Source: FactSet Earnings Insight).
Schwab notes that analysts have raised full year 2026 S&P 500 earnings growth expectations to 25%, up from less than 16% at the start of the year (Source: Charles Schwab). That is a very large upward revision in a short period of time, and it is the fundamental reason equities have absorbed a hawkish Fed and hotter than expected inflation without significant damage.
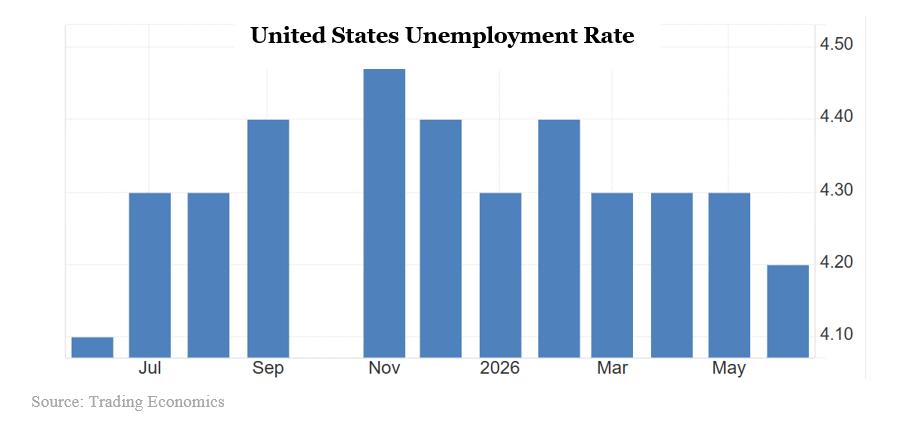
The labor picture is less flattering. June nonfarm payrolls rose just 57,000. May was revised down to 129,000 from 172,000. April was revised down to 148,000. Even so, the unemployment rate fell to 4.2%, but for the wrong reason. Roughly 720,000 people left the labor force, dropping participation to 61.5%, the lowest reading since March 2021 (Source: Reuters jobs report).
So the answer, for now, is yes. The economic engine is still running. However, it is running with less cushion than the market’s first half returns might suggest, and the composition of that growth has become narrower, more earnings dependent, and more sensitive to the trajectory of a small number of large firms. That is the tension we must carry into the second half.
Why Policy Still Matters
We wrote in our 2025 Mid-Year Update about why trade policy matters. The core insight then applies today, though the specific channels have evolved. In 2026, policy matters because it continues to shape three variables that determine investment outcomes. The cost of capital, the cost of goods, and the confidence with which businesses make long-term decisions.
✓ Tariffs behaved as we suggested they would, as a relative price shock and a tax. A Federal Reserve analysis published in April estimated that tariffs implemented through November 2025 raised core goods PCE prices by 3.1% through February 2026 and boosted core PCE prices by roughly 0.8% overall (Source: Federal Reserve FEDS Notes). The IMF’s Article IV statement noted that higher U.S. tariffs might raise about 0.75% of GDP in near term revenue but represent a negative supply shock to the U.S. and global economy (Source: IMF Article IV statement). Neither observation implies a wage price spiral, and the Fed’s own note is careful to describe first round effects rather than second round dynamics. But the message is clear. Tariffs have added measurably to the price level and have complicated the Fed’s task.
✓ The Fed has not delivered the easier policy path we, and most of the market, expected. The June 17 FOMC statement left the target range at 3.50% to 3.75%, and the Summary of Economic Projections showed a median 2026 fed funds projection of 3.8%, implying essentially no cuts from the current range through year end (Source: FOMC statement; Federal Reserve SEP). This is a meaningful hawkish reset from January expectations. Accordingly, we must revise our own view. Our base case no longer expects three cuts in 2026, and we plan our fixed income and duration positioning around a scenario in which the Fed remains patient through the second half.
✓ The 10-year Treasury has done roughly what we said it would do, but with more range. The yield moved from 4.19% on January 2 to 4.54% by July 9, with a year-to-date range of 3.97% to 4.67% (Source: U.S. Treasury yield curve data). The broad band thesis is holding. The volatility within that band is a reminder that bonds are still highly sensitive to inflation surprises and to fiscal deficit concerns.
✓ Finally, the midterms. We have argued consistently that clients should not trade election outcomes based on personal political views. That view is unchanged. Still, midterm election cycles have historically been the most volatile phase of the four-year presidential cycle, and this one is unfolding against an unusually complex policy backdrop, including tariffs, tax extensions, spending debates, and regulatory shifts that will affect specific sectors more than the aggregate index (Source: Nasdaq Dorsey Wright; Morgan Stanley; Capital Group).
Government policy does not determine every market outcome. It is also exceedingly difficult to predict, especially in the current environment. This said, in 2026 government policies will continue to shape the cost of capital, the cost of goods, and the confidence with which businesses make long term decisions. We would be poor stewards if we treated it merely as background.
The Iran Conflict: War as a Volatility Event
We cannot write a credible Mid-Year update without addressing the military conflict with Iran, originally known as Operation Epic Fury, which began on February 28 and has shaped every macro variable we track. In our March Special Edition Private Client Letter, we argued that war should be framed as a volatility event, not an investment thesis, that time horizon matters, and that the path of markets over the subsequent quarters is historically driven far more by growth, inflation, and monetary policy than by the conflict itself (Source: Clearwater Capital, Capital Markets in Times of War, March 2026).
The first four months of the conflict have, so far, been consistent with that framework, though the recent breakdown in the ceasefire is a reminder that the risk premium remains an important factor. The arc has been familiar. In the initial shock, Brent crude climbed from roughly $73 before the war to a peak above $118 per barrel in late April, WTI reached $111.54 on April 3, and headline CPI printed 4.2% in May with energy commodities up over 40% year over year (Sources: Plastics Industry Association summary of EIA and BLS data). Then, the World Bank cut its 2026 global growth forecast from 2.9% to 2.5%, its lowest projection since the pandemic, citing the war as the primary factor (Sources: Al Jazeera on World Bank Global Economic Prospects).
Eventually, the shock began to fade. A 14 point Memorandum of Understanding signed on June 17 committed both sides to a 60 day negotiating window, reopened the Strait of Hormuz to normal shipping, and pushed Brent back below $74 by late June, essentially erasing the geopolitical risk premium in energy (Sources: Stockwirex analysis of MOU; IMF via The Nation). US equities, which had absorbed most of their damage in a tight window around the initial shock, rebuilt through April and May and reached new highs in June. Then, on July 8, the President declared the MOU over after renewed exchanges of fire. Oil jumped roughly 5% back toward $78, the Dow fell more than 575 points, the dollar and Treasury yields rose, and the VIX repriced sharply higher (Sources: NPR; Reuters). One institutional strategist quoted in Reuters put the point plainly: this was always a very fragile peace process, and the fact that oil had already fallen back to prewar levels suggested the market was a little bit ahead of itself. Relative to the ongoing conflict, we make three observations for the balance of the year.
✓ First, the historical pattern is holding. Consistent with prior conflicts we cited in March, the bulk of the negative equity reaction was concentrated in a tight window around the initial shock, and much of the damage was retraced as the contours of the conflict and the policy response became clearer. That does not mean the conflict is settled. It means that markets have, so far, done what markets tend to do in war, which is reprice risk, absorb the initial uncertainty, and then return their attention to earnings, growth, and central bank behavior.
✓ Second, the inflation and policy channel remains the primary mechanism by which the war affects portfolios. Energy prices flow into headline CPI, headline CPI shapes inflation expectations, and inflation expectations shape the Fed’s reaction function. Kevin Warsh’s Fed has explicitly kept the door open to a hike, in part because it cannot rule out a second energy shock (Source: CNBC on June FOMC). Every escalation, and every step toward deescalation, is now also a monetary policy input.
✓ Third, the risk premium will persist until the conflict is fully resolved. The July 8 reversal is a reminder that a memorandum is not a treaty, that the Strait of Hormuz remains a chokepoint through which roughly 20% of global oil flows, and that markets that had priced the conflict as effectively over were forced to reprice within hours (Source: BBC). We are not recommending a defensive posture on the basis of headlines. However, we are recommending the same discipline we articulated in March. Stay diversified, stay invested in productive assets, and keep some dry powder for episodes when volatility resets valuations. Lastly, we are all well served in recognizing that the human toll of this war is far larger than any market conversation about it (Source: Clearwater Capital, March 2026).
War reshapes the distribution of risks at the margin. It rarely rewrites the long-term script all by itself. That was our view in March, and it remains our view at midyear.
The 2026 Midterms: What the Consensus Now Expects
With roughly four months until Election Day, the consensus among forecasters, prediction markets, and institutional research desks has converged on a working scenario. We flag it here not because clients should trade around it, but as previously mentioned because the range of policy outcomes it implies is already influencing how we think about second half positioning. The base case in the aggregators is a divided Congress. On the House side, Pollsmax simulates a 74% probability of Democratic control, VoteHub puts the number at 72%, The Argument and Split Ticket model puts it at 90%, and prediction markets on Kalshi and PredictIt cluster between 73% and 77% (Sources: Pollsmax House Forecast; Octagon prediction market summary; PredictionHunt).
The generic ballot sits near D+6 in the RealClearPolitics and Decision Desk HQ averages, roughly a nine point swing from the 2024 House result, and the President’s approval hovers near 39% to 40% (Source: Decision Desk HQ; The Crosscheck; US Polling Data). Aggressive Republican redistricting after the April Supreme Court ruling adds roughly a ten-seat advantage, but expert forecasters at Cook Political Report and Sabato’s Crystal Ball still project a likely Democratic majority.
The Senate picture is more competitive. VoteHub gives Republicans a 55% chance of retaining control, The Argument and Split Ticket model puts it at 53%, and UBS assigns a roughly 75% probability to Republicans holding the chamber (Source: UBS Election Watch 2026). The map is more favorable to Republicans this cycle.
A Democratic sweep of both chambers is a real but minority outcome, priced in the high 30% to low 40% range across venues. If the base case holds, the practical implication is a divided Washington from January 2027 forward. J.P. Morgan Asset Management describes the likely consequence as more constraint on the administration’s ability to expand fiscal policy to boost growth (Source: J.P. Morgan Asset Management, midterm outlook).
BlackRock notes that scenarios in which one party loses the trifecta have historically underperformed continued unified control or continued divided control in the six months following a midterm, largely because markets reprice the ability of government to legislate (Source: BlackRock). UBS and Morgan Stanley emphasize that the sector level implications will likely matter more than the index level, with debt ceiling debates, AI and data center regulation, and the fate of expiring tax provisions as the most obvious flashpoints (Sources: UBS Election Watch 2026; Strategas via Morningstar). Our working assumptions for the balance of the year are straightforward.
✓ First, we do not trade elections. History and our own experience suggest that clients who position portfolios around anticipated political outcomes reliably underperform those who position around fundamentals.
✓ Second, the consensus scenario of a divided Congress implies more legislative gridlock, more executive action, and a widening gap between what happens at the macro level and what happens at the sector level. This reinforces our preference for quality, capital discipline, and selectivity over broad index exposure.
✓ Third, midterm cycles have historically been the most volatile phase of the four-year presidential cycle, and we expect that pattern to hold. We are maintaining flexibility precisely so that policy driven volatility becomes an opportunity to reposition rather than a threat to endure.
As we noted in the January Outlook 2026 report, elections shape sentiment, but earnings, growth, and monetary policy shape returns. That order of operations has not changed.
Key Indicators
U.S. Economic Activity
Real GDP grew 2.1% in the first quarter, and the Atlanta Fed’s GDPNow model estimated 1.3% for the second quarter as of July 8 (Sources: BEA GDP data; Atlanta Fed GDPNow). The IMF’s July forecast left U.S. 2026 growth at 2.3%, and the Fed’s June SEP median was 2.2% (Sources: Reuters on IMF forecasts; Federal Reserve SEP). These readings sit below our January base case but comfortably above recession territory.
Inflation
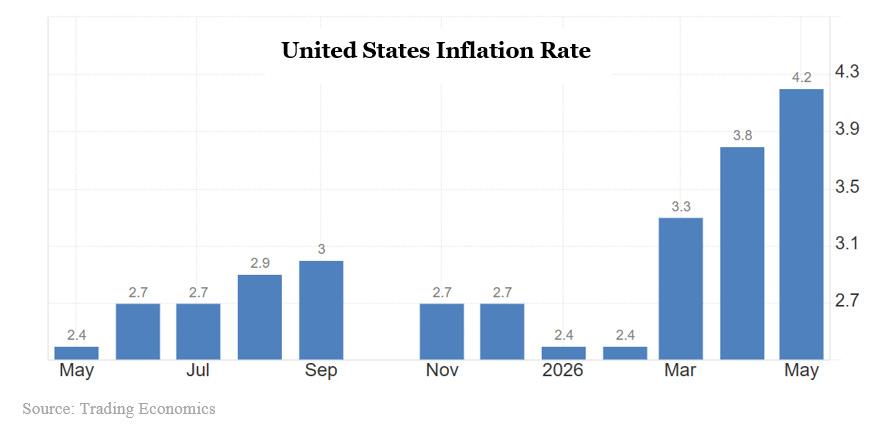
May CPI rose 4.2% year over year, and core CPI was 2.9% year over year (Source: BLS CPI release). The Fed’s preferred measure, PCE inflation, was 4.1% year over year in May, with core PCE at 3.4% (Source: BEA PCE release). Our January view that core inflation would settle into the midpoint 2% range by late 2026 has not been confirmed by the data, and the Fed’s own SEP median of 3.3% core PCE for the fourth quarter suggests policymakers do not expect it to be either. This is the single most important revision to our Outlook 2026 thesis.
U.S. Labor Market
June payrolls rose 57,000. Prior months were revised down. Unemployment fell to 4.2%, but participation dropped to 61.5%, and roughly 720,000 people left the labor force (Source: Reuters jobs report). The signals here are mixed. While the top-line unemployment rate looks benign, the underlying flow is one of a labor market that is cooling and, in places, disengaging.
Consumer and Credit
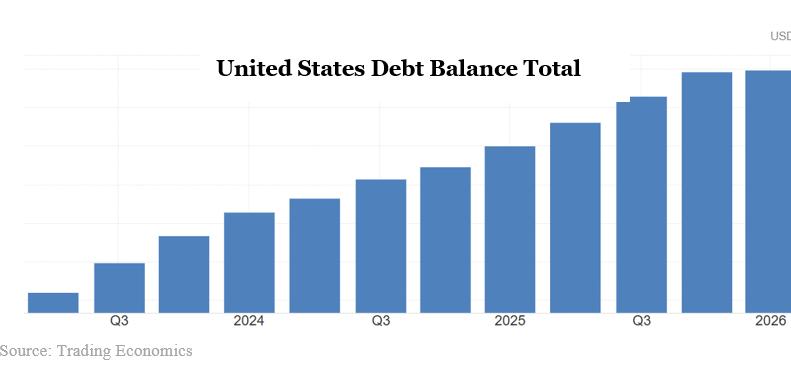
Household debt reached $18.794 trillion in the first quarter of 2026, with 4.8% of outstanding debt in some stage of delinquency (Source: New York Fed household debt). Credit card serious delinquencies stood at 7.10%. Credit card balances actually fell by $25 billion in the quarter, a sign that stress is real but that consumers are, at the margin, deleveraging where they can. This is the uneven consumer our Outlook 2026 report described, and the pattern has held.
U.S. Leading Economic Index
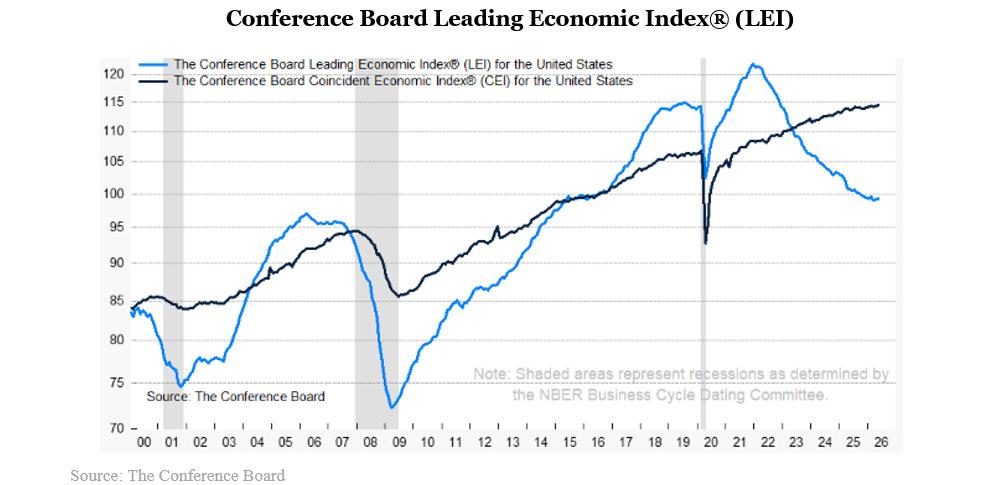
The Conference Board’s Leading Economic Index (LEI) rose 0.1% in May after a 0.2% increase in April, but the six- and twelvemonth growth rates remained negative (Source: Conference Board LEI). The New York Fed’s yield curve-based recession probability model, using data through June 2026, showed a 16% probability of recession twelve months ahead (Source: New York Fed recession probability). Our interpretation is unchanged. The US economy is slowing, but a recession remains unlikely in 2026.
U.S. Housing
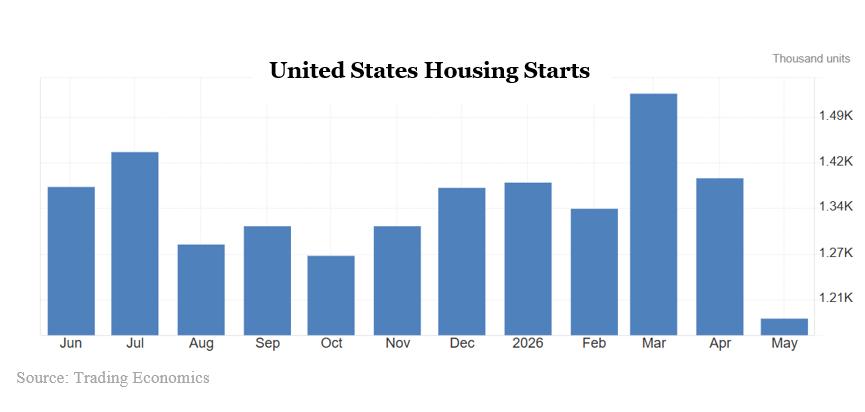
Bankrate reported an average 30-year mortgage rate of 6.48% in mid-June, down modestly from a month earlier but still well above the level at which most economists believe transaction volume rises meaningfully (Source: Bankrate). Fannie Mae’s June forecast projects 2026 total housing starts at 1.337 million SAAR (Seasonally Adjusted Annual Rate) and an average 30year mortgage rate of 6.3% for the year (Source: Fannie Mae). Housing remains interest rate constrained, as we forecast it would be.
Artificial Intelligence: From Capital Spending to Productivity
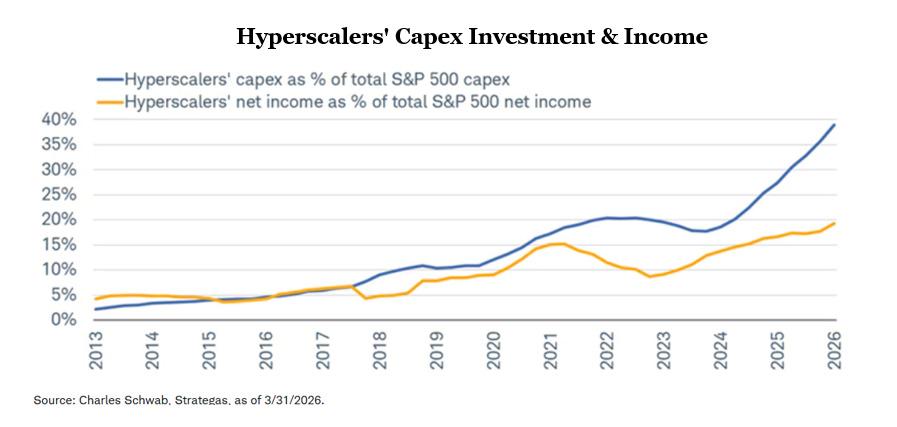
Our January Outlook 2026 report described AI as an economic force, not merely a market theme. Six months later, the phrase feels almost naively understated. Goldman Sachs estimated that public hyperscalers spent roughly $400 billion on capital expenditure in 2025, nearly 70% above 2024, and that AI capex is on track to represent about 75% of hyperscaler cash flows in 2026 (Source: Goldman Sachs). Schwab, citing Goldman’s estimates, notes that the largest hyperscalers could spend nearly $800 billion in 2026 and more than $900 billion in 2027 (Source: Charles Schwab). PIMCO argues that AI investment is now large enough to move the economy as a whole, rather than the activity of any single firm or industry. They also observe that AI, defense, and energy security investment together could add roughly $14 trillion to global capex over five years (Source: PIMCO).
Numbers of this magnitude carry an obligation to think carefully. As we wrote in January, our task as investors is not to bet on the label but to understand where the dollars are going, who is capturing the returns, and whether capital discipline is being maintained. There are three broad groups to consider.
✓ Infrastructure winners. The semiconductor firms, cloud providers, power producers, and network equipment companies whose earnings today are being driven by the capex cycle.
✓ Productivity beneficiaries. The broader universe of companies whose margins may expand meaningfully as AI is embedded into workflows, customer service, engineering, and drug discovery.
✓ Disrupted business models. The companies whose competitive positions may erode as AI native competitors emerge or as pricing structures reset.
We also want to acknowledge the emerging bottleneck that will define this cycle: power. The scale of hyperscaler capex is increasingly limited not by capital but by electricity generation, transmission, permitting, and data center location. This is a structural theme, not a passing one, and it has implications for utility, industrial, and real asset exposures we will explore more fully in the months ahead. Our conviction remains high that AI will matter.
Our discipline must remain focused on whether the dollars spent today will translate into higher productivity, increasing cash flow, and durable competitive advantage tomorrow. That is the difference between an investment cycle and a bubble, and it is a distinction that has to be earned quarter by quarter.
Equities: Stronger Earnings, Thinner Cushion
The S&P 500 gained approximately 9.5% in the first half of 2026, with more than 14% of that gain coming in the second quarter alone (Source: Reuters technical market review). Yahoo Finance reported first half gains of 9.6% for the S&P 500, more than 12% for the Nasdaq, 8.9% for the Dow, and nearly 22% for the Russell 2000 (Source: Yahoo Finance).
In other words, the market has already delivered, and modestly exceeded, the full year total return we had built into our January base case, and it did so in six months rather than twelve. That fact should shape how we think about the second half.
The support underneath these returns is fundamental, not speculative. FactSet’s June 30 report estimated CY 2026 S&P 500 earnings growth of 24.1%, and the forward twelve-month P/E stood at 20.4, above the five year average of 19.9 and the ten-year average of 18.4 (Source: FactSet Earnings Insight). Earnings, not multiples, have done most of the work. That is a healthier structure than a purely rerating rally, but it also means the market is now priced for continued earnings delivery.
Two features of the rally deserve attention.
✓ First, leadership has been narrow. Schwab reports that only about 17% of S&P 500 stocks outperformed the index over the trailing month, and that leadership remains concentrated in AI related technology and energy linked sectors (Source: Charles Schwab). This is the limited margin for error we described in January, and it has become more, not less, acute.
✓ Second, the equity risk premium is historically thin. With the 10-year Treasury above 4.5% and forward earnings yields on the S&P 500 in the low 5% range, the excess return investors are being paid for owning stocks over bonds is narrower than at any point in the past two decades (Source: Charles Schwab).
Importantly, we are not calling a market top. We are saying that the market has used up a meaningful portion of its margin for error before the year’s most important policy and election questions have been resolved. This said, the correct response is not to abandon equities. It is to rebalance where portfolios have drifted, to emphasize quality where valuations are stretched, and to prepare mentally for a second half that is more likely to reward selectivity than beta.
Fixed Income and Private Markets: Income Is Back, But Selectivity Matters More
The reset in global yields has restored the two roles fixed income historically played in balanced portfolios. Return generator and shock absorber – as opposed to performing solely as a ballast to portfolios. PIMCO noted that the Bloomberg U.S. Aggregate Bond Index yielded 4.71% as of June 4, a level at which high quality bonds again offer positive real returns and can act as a meaningful stabilizer against equity volatility (Source: PIMCO).
The 10-year Treasury’s 2026 range of 3.97% to 4.67% supports the broad band thesis we described in January, but it also reminds investors that rate volatility is a persistent feature of this environment (Source: U.S. Treasury yield curve data). Brown Brothers Harriman observed that the Bloomberg U.S. Aggregate Bond Index had a slightly negative return in the first quarter as rates and spreads rose modestly (Source: BBH). Coupon is doing the work. Duration is not, at least not yet.
On credit, our January quality bias has been vindicated. PIMCO describes spread levels across investment grade, high yield, and private credit as reflecting complacency rather than strength (Source: PIMCO). BlackRock similarly expects heightened dispersion across issuers, sectors, and vintages, rather than a broad credit event (Source: BlackRock Credit Outlook).
Private credit deserves particular attention. We continue to view it as a meaningful opportunity for appropriate clients, and we believe the structural drivers remain intact. Companies are staying private longer and banks continue to retreat from middle market lending. We are also seeing the first signs of stress that we flagged as risks in January. Going into the second half, manager selection, collateral quality, and liquidity terms must take priority over headline yield.
After more than a decade in which the search for yield forced allocators into progressively riskier corners of the credit universe, the current rate environment has restored something that many investors had almost forgotten. Still, investors should not confuse available yield with adequate compensation for every risk. The temptation is to see a high yield number on a fact sheet and assume the risk has been priced fairly. That assumption is where discipline breaks down.
The broader point extends beyond private credit. Public high yield spreads at roughly 300 basis points over Treasuries are near the tighter end of their historical range. Lower rated (CCC) paper is trading as if defaults will remain benign indefinitely. Eventually a stress point will emerge and spreads will widen. Complacent investors who have focused only on yield will likely feel significant pain.
Expert Perspectives
Regular readers on our commentary are familiar with the prominent economists, academics, and strategists that we pay attention to. However, we do not read outside commentary in order to imitate it. We read it to test our own views against the best thinking available. At midyear, the dispersion among five commentators we have followed for many years is instructive. Each has been in the arena long enough to have been humbled by markets, and each brings a distinct lens.
✓ Brian Wesbury (First Trust) continues to argue that real productivity gains are the most important development in the economy, with nonfarm business productivity running above 2% since the pandemic peak, though he cautions that three years is not yet enough evidence to declare a durable regime change. He attributes the recent inflation firmness to the Iran conflict rather than underlying demand, and reads the Fed as appropriately on hold, neither cutting nor hiking, until the data becomes more clear (Source: First Trust Monday Morning Outlook).
✓ Jeremy Siegel (Wharton, WisdomTree) views the US economy as showing remarkable resilience, pointing to firmer than expected labor markets, easing energy prices, and moderating headline inflation as an unusually constructive backdrop for equities. He interprets the rotation out of the most crowded Magnificent Seven names into cyclicals, financials, industrials, and healthcare as a sign of a healthier bull market rather than a top, and he continues to expect the Fed to lean toward easing once core inflation resumes its downtrend (Source: Asianet Newsable summary of Siegel commentary; WisdomTree).
✓ Bob Doll (Crossmark Global Investments) characterizes the environment as a high-risk bull market, with 2026 GDP tracking near 2.5%, inflation stubborn near 3%, and the ten year Treasury likely to trade in a high 3% to mid-4% range. He expects single digit returns rather than another double digit year, favors financials, technology, and communication services, notes that international equities could outperform for a second consecutive year. Doll warns that current valuations require things to go pretty perfectly (Source: Morningstar and MarketWatch on Doll).
✓ Ed Yardeni (Yardeni Research) has raised his year end 2026 S&P 500 target to 8,250 and lifted the probability of his Roaring 2020s scenario to 80%, framing the rally as earnings driven rather than an AI valuation bubble and pointing toward roughly 10,000 by the end of 2029. He now favors financials, industrials, and healthcare over the largest AI names, and observes that his forecast may still not be optimistic enough (Sources: TheStreet on Yardeni; Sahm Capital).
✓ Tom Lee (Fundstrat Global Advisors) has raised his S&P 500 year-end target to 8,000 with upside to the mid 8,000s, based on 2027 earnings tracking well above consensus and a still reasonable multiple. He argues the market is actually cheaper than it was on January 1, since earnings have outpaced price, but he also warns of a possible 10% to 20% drawdown between August and October tied to Fed leadership transition, margin debt up roughly 55% year over year, and event risk around energy and large IPO unlocks (CNBC on Fundstrat; 24/7 Wall St on Lee).
Interestingly, the common thread across these five voices is not one of consensus. Wesbury and Siegel emphasize structural resilience. Doll counsels tempered expectations from here. Yardeni sees a longer runway than most investors are currently seeing. Lee argues the fundamentals justify higher prices even as he prepares clients for a rough patch. What we take from the dispersion is a shared recognition that the second half of 2026 offers less margin for error than the first, and that selectivity, quality, and discipline will matter more than directional beta.
Views from the Largest Firms
Individual commentators can be nimble in their views. The largest firms speak with a different weight, because their published outlooks reflect committee level thinking, shape institutional positioning, and are read by boards, consultants, and allocators around the world. Still, we do not treat these views as authoritative. We treat them as a useful reflection of where the institutional consensus is settling at midyear, against which our own conclusions can be measured.
Goldman Sachs entered 2026 expecting a 12% S&P 500 total return with roughly 12% earnings growth, driven by resilient GDP and AI related productivity, while warning that elevated multiples magnify downside risk if earnings disappoint. As the year has progressed, the firm has emphasized broadening leadership beyond the largest technology names and continues to point to the equity risk premium as thin by historical standards (Source: Goldman Sachs 2026 outlook).
J.P. Morgan frames the second half around a rates picture that has been repriced meaningfully, with a year end 10-year Treasury target near 4.70% and a scenario range of roughly 4.20% to 4.80% depending on growth and inflation persistence. The firm’s investment committee continues to favor quality across both equities and fixed income (Source: J.P. Morgan MidYear Outlook).
Morgan Stanley argues that the coming midterm cycle may matter less at the macro level than investors think, but more at the sector level, with implications for fiscal policy, the consumer, healthcare, AI infrastructure, and funding fights on Capitol Hill. The firm continues to emphasize earnings quality, capital return, and selective exposure to durable growth rather than broad index beta (Source: Morgan Stanley Thoughts on the Market).
PIMCO captures the second half in a phrase we find useful: “resilience not reach”. The firm favors liquid high quality fixed income, up in quality credit exposures, global diversification, and selective real assets. It also flags emerging pressures in middle market direct lending, the same maturity extensions and payment in kind interest structures referenced above. This serves to reinforce our own caution and focus on discipline regarding private credit (Sources: PIMCO Rupture and Resilience).
BlackRock emphasizes dispersion in credit rather than widespread disruption, and continues to prioritize quality over reaching for spread. The firm also highlights the structural tailwinds behind private markets, including companies staying private longer, and banks retreating from middle market lending, while acknowledging that the opportunity set now demands more discrimination than it did two years ago (Sources: BlackRock Credit Outlook; BlackRock Private Markets).
What we notice across the commentary from the largest firms is that the tone has shifted. In January, most were leaning into growth and multiple expansion. At midyear, the language is more measured, the qualifiers are more explicit, and the emphasis on quality, income, and selectivity has become nearly universal. That convergence is itself information. When the biggest allocators in the world begin to sound alike, portfolios positioned for the previous narrative are the ones most exposed to disappointment.
What is Next?
We think about the second half through three scenarios. Our base case, as always, is not a prediction but a working thesis around which portfolios can be positioned and against which new evidence can be measured.
Scenario 1. Reacceleration
Growth stabilizes near 2.0% to 2.5%. Inflation resumes moderation as tariff and war related price effects fade. The Fed avoids further tightening, recent earnings revisions hold, and AI capex continues to support productivity sensitive sectors. In this environment, equities can grind higher, but gains are narrower and more earnings dependent than the second quarter rally (Sources: Federal Reserve SEP; FactSet Earnings Insight; PIMCO).
Scenario 2. Tread Water (Our Base Case)
Growth remains positive but uneven. Inflation stays stubbornly above target, but the Fed stays patient under the leadership of new Fed chair Kevin Warsh. Markets digest their first half gains through rotation, sector volatility, and a more selective earnings season. Risk remains elevated and investors should brace for a rise in volatility should some of the “best case scenarios” (currently priced into markets) fail to materialize. Multiple expansion appears unlikely and further gains for equities will likely be earnings dependent on individual companies. This is our base case because recession indicators point to slower expansion rather than imminent contraction, while valuations and policy uncertainty argue against complacency.
Scenario 3. Meaningful Correction
Inflation or energy prices force a more hawkish Fed. Labor weakness broadens. Credit stress spreads from private markets into public ones with widening spreads. The AI and productivity expectations reset from elevated levels and the market’s former leadership lead equity prices lower. In this scenario, elevated valuations and concentrated leadership could amplify downside, even if the economy avoids a formal recession (Sources: Charles Schwab; FactSet Earnings Insight; PIMCO).
Positioning Strategy for the Second Half of 2026
Against these scenarios, our second half positioning framework is as follows.
✓ Remain meaningfully invested in productive assets and selectively rebalance portfolios after first half strength rather than chase price momentum.
✓ Emphasize quality, meaning durable cash flows, pricing power, balance sheet strength, and credible AI or productivity exposure.
✓ Maintain balanced growth and value exposure, with selective international exposure as a valuation and diversification tool rather than a wholesale U.S. underweight.
✓ In fixed income, lock in attractive high-quality yields, favor intermediate duration, and avoid reaching aggressively for yield with tight credit spreads.
✓ In private markets, continue to use private credit and real assets for appropriate clients, but raise the underwriting bar and emphasize manager selection, documentation, collateral, and liquidity terms.
✓ Preserve liquidity for client-specific cash flow needs and for potential opportunities if midterm and policy volatility create dislocations.
Conclusion: High Gear, Low Visibility
The first half of 2026 validated the central tension we described in January. Innovation and earnings are real. This said, inflation, interest rates, policy uncertainty, and extended valuations are equally real. Both statements are true at the same time, and both must inform how portfolios are managed.
Our Outlook 2026 - Mid-Year Update is not meaningfully different in spirit from our view in January. We remain constructive, but not complacent. We remain impressed by the adaptability of American enterprise, but not indifferent to historically high valuations. We remain optimistic about the long-term potential of innovation but disciplined about the assumptions embedded in today’s elevated expectations. The strength the market has shown deserves respect, but complacency must be guarded against in this “no room for error” environment.
The economic engine is still running – even if slowing recently. The issue is the number of challenges on the horizon. This combination is not a reason to assume a “risk off” posture but it is a reason to proceed with a heightened awareness of current conditions and the humility to know that the next six months will reveal many critical developments that could materially reshape expectations for 2027.
A Final Thought
Our Outlook 2026 - Mid-Year Update is best closed with a moment of honest reflection on how the year has surprised us.
✓ Who could have imagined that the S&P 500 would gain approximately 9.5% in the first half of 2026 while core PCE inflation was still running at 3.4% and the Federal Reserve’s June projections implied no rate cuts for the remainder of the year (Sources: Reuters technical market review; BEA PCE release; Federal Reserve SEP).
✓ Who could have imagined that analysts would raise their full year 2026 S&P 500 earnings growth expectation from less than 16% at the start of the year to more than 24% by June, an upward revision larger than most analysts’ entire annual forecast range (Source: FactSet Earnings Insight; Charles Schwab).
✓ Who could have imagined that gold would cross above $5,500 an ounce intraday in January and then fall below $4,000 in late June, its largest quarterly decline in more than a decade (Source: World Gold Council; Reuters global markets).
✓ Who could have imagined that a soft June payroll report would show only 57,000 new jobs while the unemployment rate actually fell, because roughly 720,000 people left the labor force altogether (Source: Reuters jobs report).
✓ Who could have imagined that AI capital expenditure expectations, already extraordinary at the start of the year, would rise to nearly $800 billion for the largest hyperscalers in 2026 alone (Source: Charles Schwab).
The lesson, once again, is that we should always expect the unexpected when it comes to our world. Markets can look through many things, but they cannot look through everything forever. Our task, yours and ours together, is to remain positioned for the long term without losing sight of the near-term risks that shape the path to it.
We do this in the context of a world that continues to change in unprecedented ways. Many readers of our commentary are familiar my recurring observation that “the pace of change has never been this fast, and it will never again be this slow”. We live in exciting, extraordinary, and challenging times. The best we can do is remain vigilant and flexible as the future continues to unfold before us.
Thank You
As we mark Clearwater Capital Partners’ twentieth year of serving clients, we are more grateful than ever for the trust and partnership that has made this journey possible. While our responsibilities to you have expanded over the past two decades, some principles have not changed – and never will. We must face an ever-changing world with a focus on data, facts, and the deep experience necessary to sort out many conflicting signals. We must analyze the data, test our scenarios, and communicate our thinking clearly. We must act with the discipline that long-term wealth requires and do so with wisdom – not emotion.
We will continue to update our thesis as new information becomes available. The forecasts in the Outlook 2026 report were working this thesis. This Mid-Year Update is the honest revision of them. Our next report will be revised again, as it should.
Thank you for taking the time to consider our perspectives and forecasts. Should you have any questions or concerns, please reach out so that we can schedule time to engage more deeply with you. We look forward to continuing this journey together and remain deeply grateful for the trust and confidence you place in Clearwater Capital Partners.
John E. Chapman Chief Executive Officer Chief Investment Strategist
July
2026
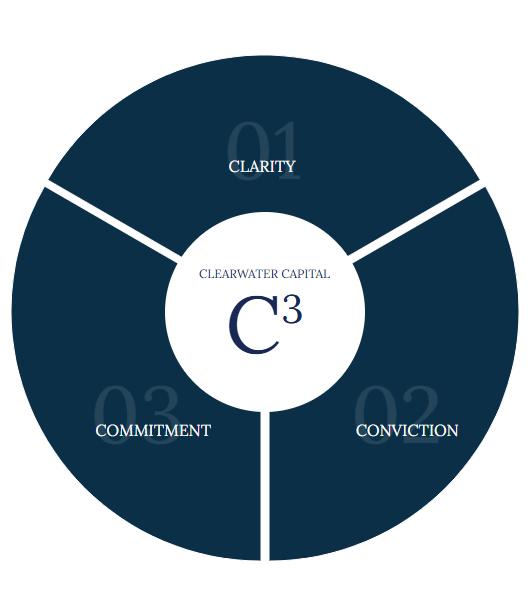
Clearwater Capital C3
Clarity. Conviction. Commitment.
Successful wealth management is the product of clear thinking, hard work, and consistent follow-through. At Clearwater Capital, we have developed a rigorous framework for decision-making that we call C3. This disciplined process guides successful individuals and families through the prioritization of long-term objectives, the evaluation of high impact tactics, and the deliberate execution of strategies designed to endure.
Clarity
01 Discovery Phase
Identify / Prioritize Objectives
Establish Assumptions
Collect / Organize Data
Conviction
02 Analysis Phase
Model and Test Scenarios
Interpret Findings
Establish Path Forward
Commitment
03 Execution Phase
Initiate Action Plan
Implement
Monitor / Maintain
The opinions presented are those of Clearwater Capital Partners and John Chapman, Chief Executive Officer, and Chief Investment Strategist, as of July 2026 and may change, without notice, as subsequent economic and market conditions vary.
This material is presented as opinion and commentary. It is not intended to be relied upon as forecast, research, or investment advice, and is not a recommendation, offer or solicitation to buy or sell any securities or to adopt any investment strategy. It is strictly intended for educational purposes only.
The information and opinions contained in this material are derived from proprietary and nonproprietary sources deemed by Clearwater Capital Partners to be reliable, are not necessarily all inclusive and are not guaranteed as to accuracy. Artificial Intelligence (QAI) tools were used in the sourcing of content for this report. All information originating using AI was critically evaluated, verified, and refined in the writing methodology of this report. The observations and conclusions included in this report reflect our own analysis and understanding of the economic topics covered.
Past performance does not guarantee future results. There is no guarantee that any forecasts made will come to pass. Reliance upon information in this material is at the sole discretion of the reader. No investment or investment strategy is risk free.
International investment involves additional risks, including risks related to foreign currency, limited liquidity, less government regulation and the possibility of substantial volatility due to adverse political, economic or other developments.
Index performance is referenced for illustrative purposes only. You cannot invest directly in an index. The Dow Jones Industrial Average is owned by S&P Global, the S&P 500 is a registered trademark of The McGraw-Hill Companies, and The Russell 3,000 Index is maintained by FTSE Russell. Because of their narrow focus, sector investing will be subject to greater volatility than investing more broadly across many sectors and companies.
The Conference Board Leading Economic Index (LEI) is a composite index of leading, coincident, and lagging indicators produced by The Conference Board serving as summary statistics for the U.S. economy. The Conference Board Leading Economic Index (LEI) is a trademark owned by the Conference Board, Inc. in the United States and other countries.
The two main risks related to fixed-income investment are interest rate risk and credit risk. Typically, when interest rates rise, there is a corresponding decline in the market value of bonds. Credit risk refers to the possibility that the issuer of the bond will not be able to make principal and interest payments.
High yield/junk bonds (grade BB or below) are not investment grade securities, and are subject to higher interest rate, credit, and liquidity risks than those graded BBB and above. They generally should be part of a diversified portfolio for sophisticated investors.
Municipal bonds are subject to availability and change in price. They are subject to market and interest rate risk if sold prior to maturity. Bond values will decline as interest rates rise. Interest income may be subject to the alternative minimum tax. Municipal bonds are federally tax-free but other state and local taxes may apply.
Government bonds and Treasury bills are guaranteed by the US government as to the timely payment of principal and interest and, if held to maturity, offer a fixed rate of return and fixed principal value.
The payment of dividends is not guaranteed. Companies may reduce or eliminate the payment of dividends at any given time.
Nothing contained herein is offered as tax advice. Please consult qualified professionals with any tax planning needs or tax questions you may have.
Please consult with a qualified investment professional before investing.
Investment Advice offered through Clearwater Capital Partners, a Registered Investment Advisor.