2 minute read
How Schools are Funded


California funds public schools using the Local Control Funding Formula (LCFF) with a focus on supplemental funding for high-needs students. The LCFF provides a base funding level connected to each district’s average daily attendance (ADA) and additional funding for low-income students, foster youth, and English learners. ADA is the number of attendance days divided by the number of days in the regular school year. A student attending school every day equals one ADA. The Local Control Accountability Plan (LCAP) is a planning tool used to set goals, plan actions, and leverage resources to improve student outcomes. The LCAP addresses the needs of all students, including specific student groups, and all districts must specifically address English learners, foster youth, and low-income students. In addition, the LCAP must address the state of California’s eight priority areas that include student academic achievement, school climate, student access to a broad curriculum, and parent engagement. Each district’s spending plan aligns to these priorities. Our Educational Services team, in partnership with Business Services, provides ongoing assistance to LEAs in our county to support them in achieving their identified goals, actions and services.
Acalanes Union High Antioch Unified Brentwood Union Byron Union Canyon Elementary John Swett Unified Knightsen Elementary Lafayette Liberty Union High Martinez Unified Moraga Mt. Diablo Unified Oakley Union Orinda Union
5,434 $93,908,267 $17,281 15,124 $239,713,178 $15,850 8,988 $113,100,780 $12,583 1,386 $18,532,912 $13,370 69 $1,094,798 $15,913 1,330 $20,371,178 $15,316 583 $7,560,485 $12,967 3,436 $52,328,411 $15,229 7,909 $111,017,553 $14,036 3,973 $51,804,813 $13,038 1,810 $25,807,497 $14,256 29.103 $425,731,639 $14,628 4,977 $66,020,677 $13,266 2,493 $35,852,871 $14,379 Pittsburg Unified 10,790 $173,739,534 $16,102 San Ramon Valley Unified 30,973 $395,805,985 $12,779 Walnut Creek 3,446 $43,824,586 $12,718 West Contra Costa Unified 26,576 $434,394,956 $16,346
District Total 158,401 $2,310,610,119 N/A
County Office of Education $80,809,744 County Total 158,401 $2,391,419,863 Data reported by districts, 2021-2022 unaudited actuals
Our team: • Assists LEAs in developing their LCAP • Provides financial advisory services to assist with budget and LCFF planning • Oversees compliance with State and Federal mandates • Provides technical support focused on improved outcomes for student groups • Supports LEAs with school climate and social emotional learning support
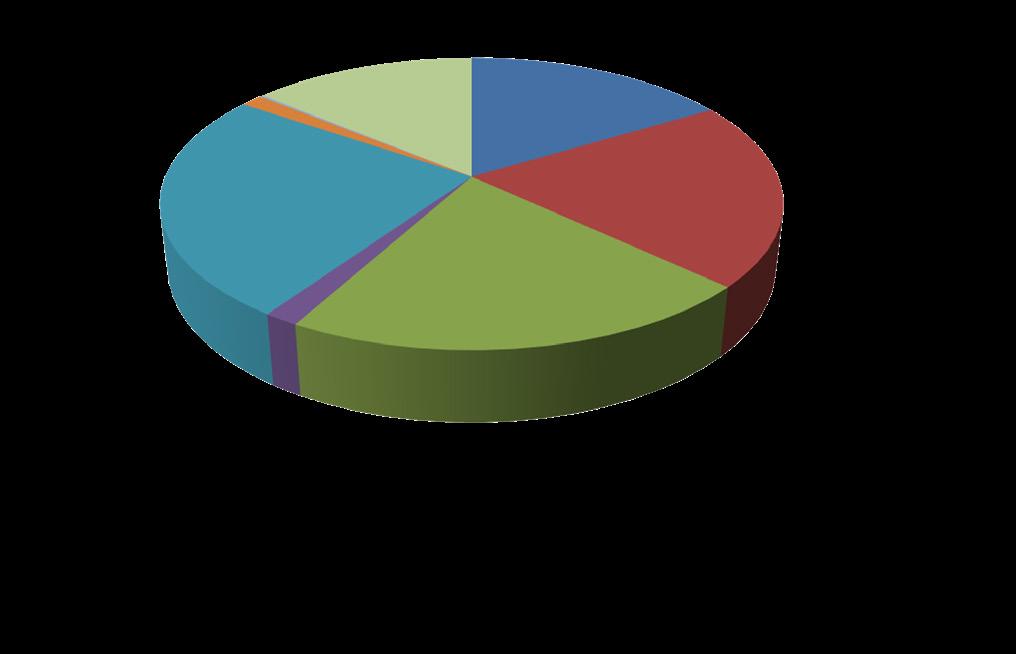
EXPENDITURES:
• Employee Benefits........21% • Classified Salaries.........21% • Certificated Salaries.....16% • Services/Other Operating Expenses....25% • Books & Supplies..........02% • Other Outgoing...............0% • Capital Outlay................01% • LCFF Sources.........39% • Local Revenues.....32% • State Revenue.......18% • Federal Reserve....12%

REVENUES


