












Co-founder & CEO, Cashify
Design innovations ruled the market in 2019. Be it full-screen displays or the triple and quad camera handsets, we saw some stunning launches this year, and more reasons to upgrade. As always, Cashify aimed to provide users an easy solution for putting used smartphones to a profitable use. Let's look at some insights from last year’s market and how re-commerce made a difference in the industry.
Co-founder & COO, Cashify
Last year was thrilling. Cashify became an omnichannel brand and a one-stop shop for all smartphone services. We took Cashify, an online brand, to local markets with our o cial Cashify Stores across cities. While we offer all-round mobile care, buyback continues to be the focus. Take a look at what our market study revealed about major OEMs, smartphone users and, of course, mobile re-commerce in 2019.
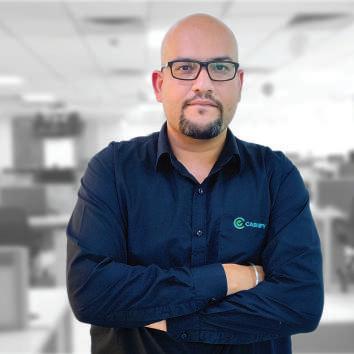

Amit Sethi
Co-founder & CTO, Cashify

Innovation remained a key factor in determining our way ahead in 2019. We penetrated new domains of services & products like mobile repair, refurbished smartphones, mobile accessories and partner-based apps with major OEMs. This year, we’re looking to bring more to the table using recent market trends and behaviours. The interesting figures and patterns we witnessed in 2019 are presented in this white paper.
Remember when the life expectancy of a device was almost similar to a PC or a television? As India rapidly moves towards clocking a total of 859 million smartphone users in 2022 (according to Business Standard), the average smartphone life cycle is dropping with every new launch. With 19% users upgrading their devices within the first year & 44% within 1-2 years, the shortening life span of mobile devices has not been more pronounced.
Smartphone penetration has never been greater in India. Boasting of a whopping 345 million smartphone users, the country has displayed immense progress in tech adaptability. Despite the slowing economy with 5% quarterly growth, lowest in 6 years, the 2019 Q2 smartphone shipment in India was estimated around 36.9 million units, a 9.9% year-over-year growth & 14.8% quarter-over-quarter growth. Major reasons for upgrade for most smartphone users have been connectivity (3G to 4G), gaming capacity, updates in mobile photography and so on.
With 19% users upgrading their devices within the first year & 44% within 1-2 years, the shortening life span of mobile devices has not been more pronounced.




Despite working fine, 20% users reported to have left their smartphones unused in their drawers.
The aspirational value of every new smartphone in circulation, makes its predecessor as less desired. Despite them working fine, 20% users reported to have left their smartphones unused in their drawers. The stowed away devices stop us from reusing potentially working tech. Be it for the lack of safety, simplicity, monetary gains or other factors, smartphone hoarders are naysaying to selling their used smartphones.
Taking these potential e-waste off the users’ hands at minimum hassle and maximum monetary returns & safety becomes a mandatory move for tech stakeholders. Recommerce uses technology to ease out the selling process so that the stashed devices can make their way back into the market at more affordable prices, offering the same experience they used to.
For users, buying a smartphone is just the tip of the iceberg. Maintaining them properly with timely repair, accessorizing and updating are crucial to take every mobile phone to its optimal value. The pain point here is the unavailability of a viable platform that helps users with all these solutions.
This white paper uses well-researched data and insights to decode the Indian smartphone market from the recommerce point of view. From OEM performance in both retail & resale market to user behaviour, a variety of details have been captured here for industry stakeholders and aficionados.
Research Methodology: Data presented here has been derived from independent surveys conducted with a leading research partner. External sources include International Data Corporation, Counterpoint Research, newspaper articles etc.
Numerous launches, more brand options, new price points and the overall aspirational value of an upgrade, are a few factors that led the second-hand smartphone industry to widen its turf in 2019. Be it selling or buying, a majority of Indian smartphone users have shed their inhibitions about pre-owned smartphones. With more people opening up to selling and buying used handsets, the recommerce industry has seen a definite surge in 2019; so much so that Counterpoint declared India as the fastest growing market for refurbished mobile phones.
Dominating in the entry level and sub-J10000 bracket, refurbished handsets exhibited a 9 percent Y-o-Y growth in the first half of 2019, according to Counterpoint. From 14 million shipments in 2018-19, refurbished handsets are expected to grow by 20-25 percent by 2020. The entire pre-owned smartphone market, on the other hand, is expected to almost double its sales to 48 million in 2020 from 26 million in 2016.
Speaking of the Great Sale Indian smartphone market, the festive season (September-October) was when refurbished handset sales had a field day in the market every day.
During said months, the refurbished handset market grew at 15 percent month-over-month. Buyback schemes held in the e-commerce marketplace were availed by 10X more customers than usual.
We’ve noticed a tide of Nokia and Tecno smartphone resale, since they were recently listed on Cashify, making them two of the most promising smartphone brands in the second-hand market for the upcoming year.
The section to follow reveals some of the key insights and pieces of information we drew about the Indian second-hand smartphone market- trends, user behaviour, top-selling cities and more.













New Delhi
Others
Noida
Pune
Kolkata
Chennai
Gurugram
Mumbai Bengaluru
Hyderabad

Smartphone users in a city who mentioned the actual condition of their devices while putting them up for sale online



Users


How major devices from smartphone brands shed their resale value with age






When the pricing is weak, it’s good to tweak. No one would vouch for it more than Apple. After staying out of the charts for about 2 years, Apple made a comeback this year with 51.3 percent market share in the J35,000+ smartphones segment in the Q3 of 2019, as reported by International Data Corporation.
It was already rough sailing for the Cupertian tech giant when its iPhone XR, priced at J76,900, was released in September, 2018. Cut to Q2 2019, Apple makes it to the top of the premium smartphone segment with 42.2 percent market share for skyrocketing sales of the iPhone XR.
Perhaps better acclimatization with the Indian price-sensitive market led the brand to reprice the device at J53,000 in April 2019.
September 2019, we see three more launches by the OEM, starting at J64,900. The iPhone 11, iPhone 11 Pro and iPhone 11 Pro Max were the mega launches for the brand this year. While the iPhone 11 has been very well-received by premium users, the iPhone XR hangover still goes on strong in the market. In terms of user demographic, 71 percent iPhone users are male.
iPhones are most favoured by females as they have 29 percent women users, higher than other major brands.
14 percent users reside in Bengaluru, which is followed by 13 percent in New Delhi and 10 percent in Mumbai. The age group of 25-34 years has the highest recorded number of iPhone users with 65 percent.
Recent developments indicate that the brand is also eyeing the native manufacturing market in India. Local manufacturing of devices are expected to rid the makers of the 30% import duty that results in higher Apple prices so far.
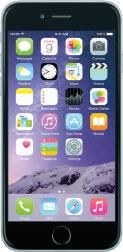
Looking at the second-hand scene, the response to iPhones is going on strong. 16.49 percent of total used devices sold by smartphone users in 2019 were iPhones, making Apple the second most resold brand of the year. Of which 20 percent, the largest number of pre-owned iPhone sales, took place in New Delhi. Mumbaikars came in second with a sales share of almost 11 percent. iPhone 6 was sold the most by its users, contributing about 28 percent of the total iPhones sold in the pre-owned market.


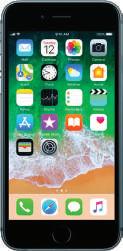
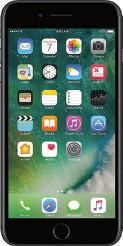





5 years down the lane since its arrival in India, much has changed for OnePlus. Although its 2015 offering, OnePlus 2, boasted outright of being a “2016 Flagship Killer”, the 2019 offerings seem more to be along the lines of being flagship smartphones themselves.
Competitive pricing, aggressive discounts, multiple launches and a massive community were all behind OnePlus’ 66 percent year-over-year shipment growth in 2019. The Counterpoint study also reveals the OEM has devoured the top market share in smartphones worth J30,000+ segment this year.
Occupying the largest chunk of market in the J30,000+ segment, OnePlus clocked up a whopping 35% market share by the end of Q3 2019.
Attributable to the May launches OnePlus 7 and OnePlus 7 Pro, the brand has rapidly made a mark for itself in the flagship category, contending with the iPhone XRs & Samsung S10s of the world.
The top user base of OnePlus is based out of Bengaluru as 15 percent users are from the city.
Mumbai comes next with 12 percent and New Delhi is the third with 11 percent. 74 percent of users are male and 65 percent are within the age group of 25-34 years.
Come October, we saw two more releases- the OnePlus 7T and OnePlus 7T Pro. With two more handsets that fall more and more into the flagship segment, things are certainly changing for the smartphone maker.
In the pre-owned handsets market, only 4.23 percent users sold their old OnePlus smartphones in 2019, a nominal change from 3.24 percent in 2018. The national capital topped here again with a contribution of nearly 20 percent into the total OnePlus sale of pre-owned devices. Bangalore ranked second with a share of about 16 percent. Additionally, 19 percent of total pre-owned OnePlus devices sold by users were OnePlus 5, the most resold OnePlus handset of 2019.
After the sweeping success in the premium segment, it didn’t come as a huge surprise that the OEM increased its prices by 96 percent in the flagship segment.

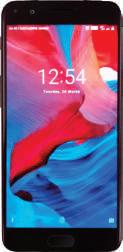

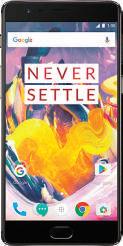
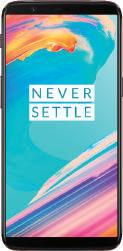
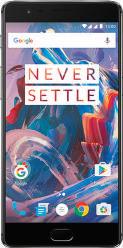





While its parent corporation, BBK Electronics which also owns Vivo, Realme and OnePlus, acquired an enormous 42 percent of Indian smartphone market in 2019, Oppo has not had much luck this year. According to a Counterpoint research, Oppo managed to cinch only 8 percent market share in Q3 2019. On the other hand, IDC reports 11.8 percent market share for Oppo by the end of the same quarter in India.
Although a tad overshadowed by its own sister brands Vivo and Realme, Oppo names India as its second biggest market after China.
The Chinese OEM has claimed a year-on-year growth of 92% in Q3 2019. The next big thing on the plate for the brand is pioneering 5G smartphones in India, after having taken a lead in China for said innovation.
From handsets ranging from mid-budget like the Oppo A series to premium segment like the Reno series, Oppo is available across the board. The refreshed versions of the Oppo A5 and A9, the Oppo A9 2020 and Oppo A5 2020 were the highlights from the brand in the mid-tier segment in 2019. Likewise, the Reno series, its offering in the premium segment, stirred only lukewarm response in users.
Compared to 2018, about 1 percent more users sold their pre-owned Oppo smartphones, bringing its resale market share to 4.2 percent in 2019 from 3.4 percent the previous year. About 16 percent of the sellers were Delhiites, followed by Mumbaikars with a contribution of nearly 12 percent. Notably, the Oppo F1s handsets outnumbered other Oppo devices with a share of 26 percent in resale market. The Oppo A57 came in next with 19 percent share. When it comes to pricing, Oppo, just like its sister-brand Vivo, has maintained a 50 percent price hike in the last 4 years.
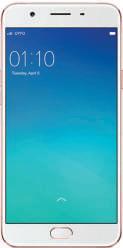

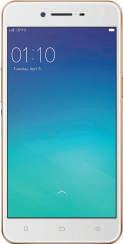


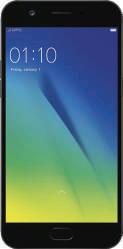





IDC has reported Realme as the fastest growing smartphone brand in Q3 2019. With a year-on-year shipment volume growth by over 400 percent, the Shenzhen-based smartphone maker witnessed a market share of 14.3 percent by the end of September 2019.
The sub-brand of Oppo left Oppo behind in Q3 2019 in terms of YoY growth. Aggressively priced handsets, channel focused marketing and a slew of budget to mid-range smartphone launches seemed to be the weapons in the brand’s favour. Began as a counterpart to parent company BBK Group’s o ine-focused Vivo and Oppo, Realme made a move to the o ine market by mid-2019, raising more sales than before.
Fondly referenced to as the underdog who made it big in a blink in the smartphone industry, Realme launched a host of budget handsets that turned out to be some of the brand’s bestsellers in 2019.
The Realme C2, Realme 3 Pro, Realme 5 and the Realme 3i series proved to be some of the most successful models for the makers. In the mid-tier segment, the Realme XT outshone some well-established tough contenders.
Although not as big, the brand did see a rise in the pre-owned mobile market as well. Our data reveals, as opposed to 0.04 percent in 2018, pre-owned Realme handsets were sold by 1.05 percent users in 2019. Delhiites registered maximum Realme sales in the recommerce market with a share of over 20 percent, followed by Bengaluru with 14 percent. Realme 1 was sold the most, by about 28 percent of users. It was followed by the Realme 2 Pro and Realme 2 with nearly 16 and 14 percent market share respectively.











For a brand with as diverse offerings as Samsung, the year in review looks truly competitive. One of the few OEMs that manufacture handsets ranging from feature phones to mid-tier and premium segments, 2019 was a lacklustre year.
The brand ruled in feature phone shipment with a market share of 22 percent by the end of Q3 2019, according to a study by Counterpoint.
However, the mid-tier and premium (handsets priced at J30,000+) segments could only retain the second positions with market shares of 18.9 percent and 23 percent following Xiaomi and OnePlus respectively.
In the mid-tier and entry segments, the Galaxy M and A series acted as saving grace for Samsung. With prices ranging from J7,999 to J20,000, the South Korean biggy came up with a slew of launches this year in said segments. In the premium segment, the Note 10+ and S10, S10+ and S10e contended against the iPhone XRs and OnePlus 7s of the world.
Samsung smartphones are mostly used by consumers within the age bracket of 25-34 years, as 63 percent users fall in this age group.
The brand has seen 72 percent male users and 28 percent female users in the past year. 12 percent of the entire Samsung smartphone usage in India comes from New Delhi. Second on the list is Bengaluru with 10 percent, followed by Mumbai with 9 percent
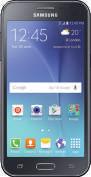
The brand’s market share saw a decline in the pre-owned mobile market as well. 20.30 percent of pre-owned smartphones sold by people in 2018 were Samsung, which fell to 16.44 percent in 2019. The largest portion, 25 percent, of these sales came from Samsung’s Delhi users, Mumbai users ranked second with a share of 10 percent. With a share of about 27 percent, the Samsung Galaxy J2 was sold by most users selling a Samsung smartphone, followed by Galaxy J7 with nearly 19 percent share.
Although, over the course of the last 4 years, Samsung has made a price hike of 35 percent in the flagship segment, there wasn’t any price alteration for its entry level models.

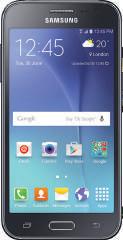






Vivo may have been amiss from most of the discussions one have had about the top-selling smartphones but Counterpoint seems to differ. A recent study by said research firm places Vivo on the third rank in Q3 2019 market share in the subcontinent. With a share of 17 percent, Vivo comes right after Xiaomi and Samsung.
Owned by BBK Electronics, the Chinese manufacturer has seen a growth of about 7 percent since the third quarter of 2018. Of late, the brand has widened its horizon in many dimensions. Be it the transition from playing in the J10,000-J 20,000 segment to making entry tier models like the Vivo Y91i, the OEM is pulling off the risk-game quite well. Its omnichannel availability- with presence across 70,000 outlets in India- can be attributed to its wild popularity in the budget and mid-budget segments, mainly in Tier 2 and Tier 3 cities.
A brand that didn’t get caught up in the budget-flagship segment, Vivo launched some top-selling models in its own price bracket in 2019. Models like the Vivo V17, Vivo Y91 and Vivo Z1 Pro stood out as the most popular offerings from the brand.
Besides, the Vivo S1 registered itself as the most Googled mid-range smartphone of the year, as per the search ‘Year in Search’.
While 74 percent Vivo smartphone users are male, 14 percent usage comes from New Delhi.
Again, the younger demographic dominates in the consumption of this brand with 65 percent users falling in this category.
In the pre-owned mobile market, Vivo smartphones were sold by about 5 percent users in 2019, as opposed to less than 3 percent in 2018. While a major chunk, 27 percent of the total Vivo sales in the pre-owned market took place in Delhi, almost 30 percent came from Tier 2 and Tier 3 cities. Vivo V9 turned out to be the most sold Vivo handset in 2019 with a share of about 22 percent, followed by Vivo V5 with 17 percent. Apart from this, the mid-level newcomers of Vivo have got a price rise of 50 percent in the last 4 years.


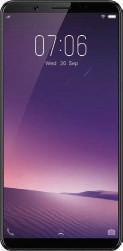


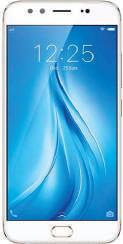

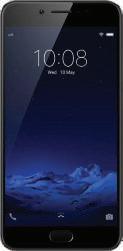



Vivo Y55s, Vivo Y53, Vivo V7, Vivo Y69, Vivo V3, Vivo Y51L
From pushing sales through exclusive flash sales to boasting of 2,500 Mi stores, 6,000 large-format stores and 75 Mi Home stores, the Chinese OEM has surely come a long way in India. Xiaomi has ruled the charts in the Indian smartphone scene- entry & mid-tier segments- for about two years now.
IDC reports that Xiaomi has clocked up a market share of 27.1 percent in the Q3 2019. Quicker updates, innovation, offbeat marketing, and most importantly, its super-competitive pricing are why the brand is enjoying immense popularity in the Indian market.
Be it the sub-J10,000 category or the J20,000+ segment, Xiaomi, along with its sub-brands Redmi and POCO, has made itself available across the spectrum.
Speaking of driving sales, the majority of the credit goes to the Redmi Note 7 Pro, Redmi Note 7A and Redmi Note 7S which collectively contributed about 50 percent to the brands’ overall shipments.
The Redmi K20 Series was just as impressive with a contribution of nearly 13 percent to total shipments.
Xiaomi has the highest user base in New Delhi as 12 percent of total Xiaomi smartphone consumption comes from the capital.
Bengaluru and Mumbai follow suit with 11 and 8 percent respectively. 28 percent of users in India are females and 62 percent fall in the age bracket of 25 to 34 years.
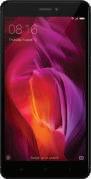
In the second-hand market, of all the pre-owned smartphones sold in 2019, about 26 percent were Xiaomi, a major jump from 18.43 percent in 2018. Delhi was the largest seller of pre-owned Xiaomi smartphones with a share of about 25 percent, followed by Bengaluru with a contribution of 10 percent. At the same time, about 23 percent of the sales came from Tier 2 and Tier 3 cities. The most sold model by its users was the Redmi Note 4 with a share of 21 percent, followed by the Redmi 4 with 18 percent.
In the mid-range segment, the Chinese maker has raised the prices by 45 percent over the last 4 years, while the entry level price increment stays low at 17 percent.
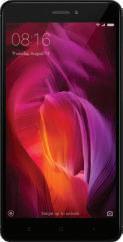

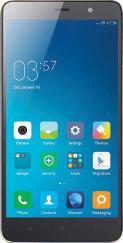

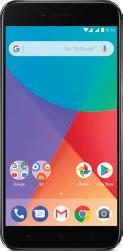
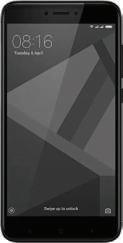

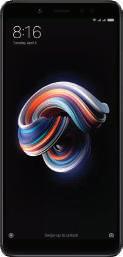


Redmi Note 5, Redmi 3s Prime, Redmi 4A, Redmi 5A, Mi A2, Redmi 3s, Redmi Note 6 Pro etc.
LEFT IT UNUSED IN A DRAWER
HANDED IT DOWN TO FAMILY/FRIENDS
IT FOR A NEW ONE
Who sold their used smartphones?
The average resale price of devices sold by users was L7,400 in 2019
Maximum users sold their phones on weekends
A majority of Indians have sold their smartphones between 12 and 1 PM in 2019
Oppo & Vivo handsets lost their resale value the fastest in 2019
Apple & OnePlus handsets went the slowest in resale price drop
Buyback transactions were the highest during the of every month in 2019 Last Week
During the festive season (Oct-Nov), there was an uplift of in smartphone buyback 3X Times Xiaomi was the most sold brand by smartphone users
Pan India, 20% pre-owned smartphones sold were iOS-based, 80% were Android devices



Delhiites seemed to be breaking their smartphone screens the most, with 33% among all Indian metro cities. Bengaluru came in second with 21%, followed by Gurugram with 19%
Write