The consumer upgrade cycle is influenced by a large number of parameters. It has been fun decoding and trying to predict who is going to be the next to sell. Brand and industry stakeholders could get some clues from this edition.
Nakul Kumar COO | Cashify.
Sustained progress in our data processing and analytic capability continues to yield greater insights into consumer behavior and flag the opportunities to present customers with timely and relevant value propositions.
Amit
Sethi CTO
| Cashify.
FOUNDER’S MESSAGE “
2016 was a year full of surprises, especially the last quarter which was no less than a roller coaster ride. We at Cashify like to call the year gone by as the year of ‘Affordability’. It saw the coming out of a league of new brands which gave healthy competition to flagship models of established brands with devices having brilliant technical specifications at a low cost. Oppo, Vivo and Xiaomi have done exceedingly well in the short span of time and continue to attract customers. Specifications like 4GB Ram, 3000+ mAH battery and large storage are no longer reserved for the INR 30k+ category.
The second half of previous year also saw a surge in e-commerce companies, brands, large format retail chains adopting exchange programs in an aggressive way. With the in-app diagnostic feature and instant discounting offers, a customer can now purchase the smartphone of his/her choice and part pay his purchase with his/her old device. The brands were also not far behind in rolling out attractive Exchange/Trade-in schemes with Apple, Samsung and LG leading the pack.
Although a brilliant move for the nation in the long run, the effects of demonetization were felt across industries with Re-commerce being no exception. For a month, the sales of refurbished/used smartphones was sluggish but as more and more people adopt digital payments, the demand for certified used smartphones has started seeing a surge. India is home to 600 million feature phone users, majority of whom are value conscious buyers presenting a huge opportunity for certified pre-owned smartphones. Hence 2017 will see mass movement of feature phone users to smartphones and provide a fertile ground for growth of the Re-commerce industry.
Culturally, we have been selling and buying used items for as long as you can remember. From newspapers to electronics to luxury cars, there is a market for everything re-usable (either organized or un-organized). Since electronics, especially smartphones are a relatively new phenomenon (as compared to cars for example), there has been a lack of research or reliable data sources around the re-sale/re-use of the same. Re-commerce times is our effort to bridge the gap and provide useful insights to consumers, brands, stakeholders in the ecosystem and the industry in general.
In this edition we present to you our primary research on top traded brands and models in the second hand market and some interesting facts and figures around device refresh rates, sale vs repair decisions, city stats etc. We have also made an attempt to de-code the user behavior or patterns on upgrade from one price bucket to another. I hope that you find these insights helpful.
Mandeep Manocha CEO | Cashify
BATTLE OF THE BRANDS
5
2016 saw the delta in second-hand market share dip from 10% to 3 % between the 2 brands. It’s going to be a close race in 2017.
Motorola managed to establish itself as a major player in the second-hand market moving up in the second quarter of 2016 and holding the 3rd position for the rest of the year. OnePlus at 8th position and Motorola at 3rd have been superlative examples of pureplay online brands garnering significant demand in the secondhand market. Product Quality, great specs and pricing have played out well for both these brands. Home grown Micromax along with HTC and Sony did not see a great year with demand continuing to slip quarter on quarter, Chinese manufacturers Xiaomi and Lenovo have successfully given them a run for their money.
MARKET
An exciting year for the exchange, trade-in and buyback market.
With numerous offers being rolled out during the year and adoption of exchange as a key sales driver by top eCommerce players, buyback numbers soared and the fight for market share continued to display interesting dynamics. Newer Brands have been seen upsetting some heavyweights and for some, the margin for error is getting pretty slim.
It takes two to tango and Samsung and Apple have been at it for quite a while. We saw the battle reaching an almost even ground as Samsung had to hold the fort against all new entrants and moreover against flagship rival Apple.
2016 TOP TRADED MODELS
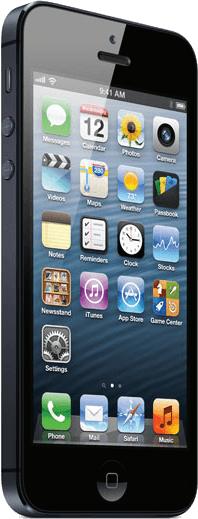
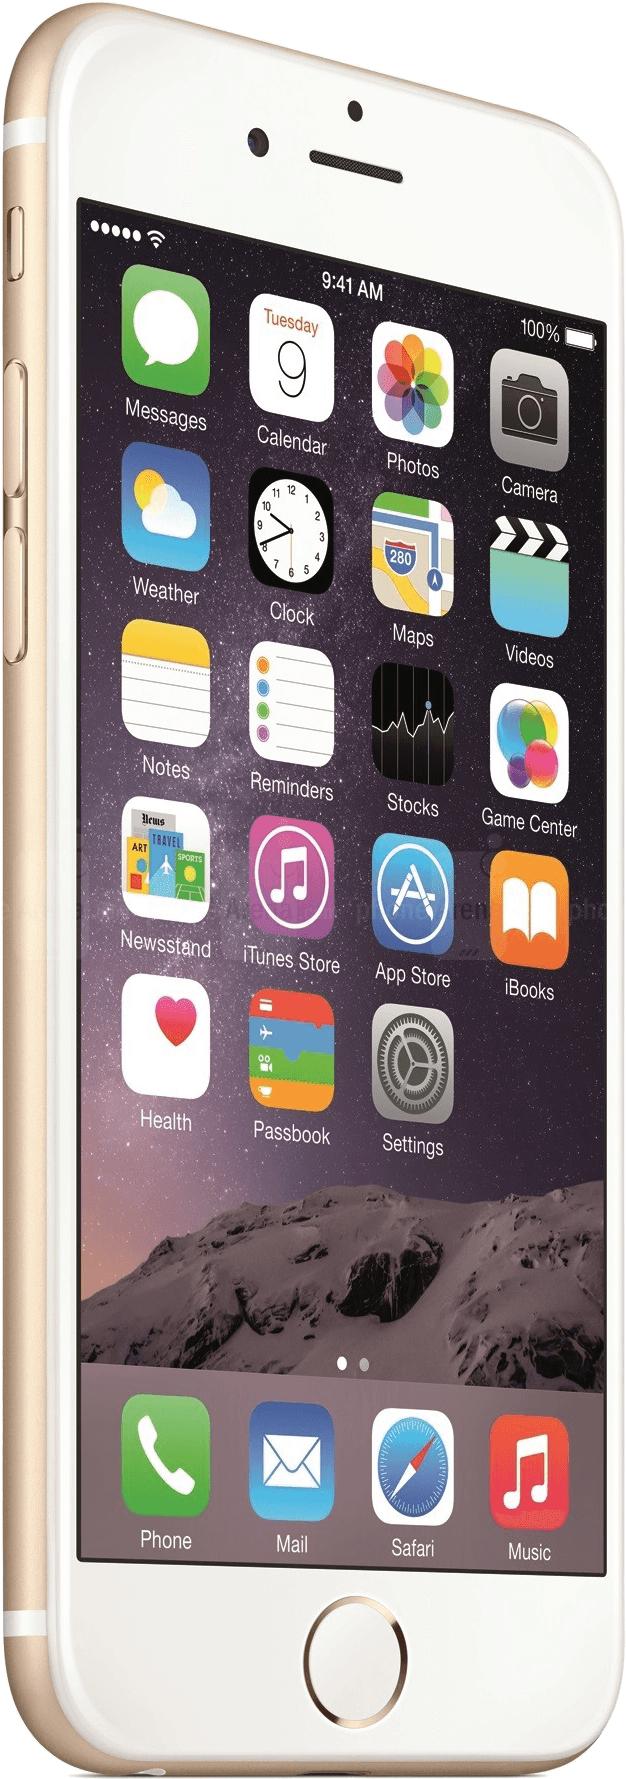
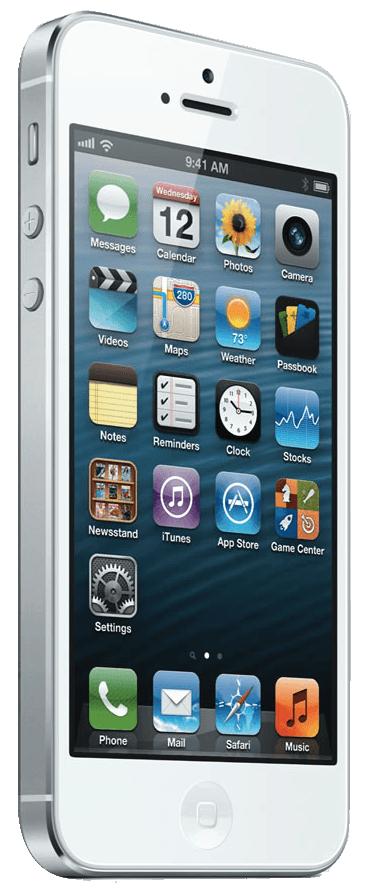
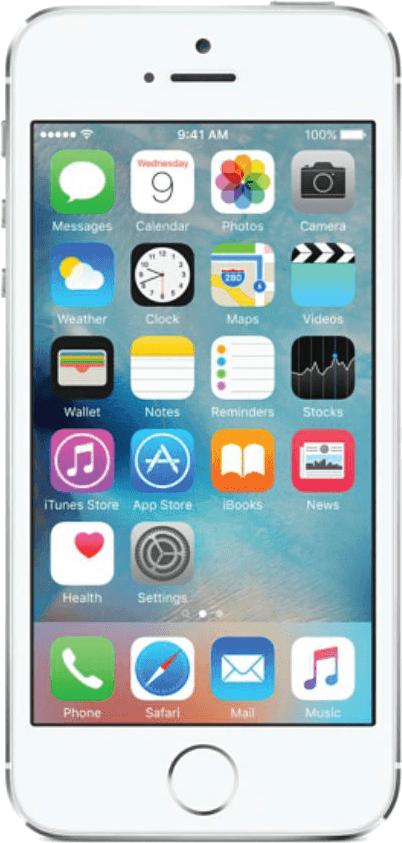
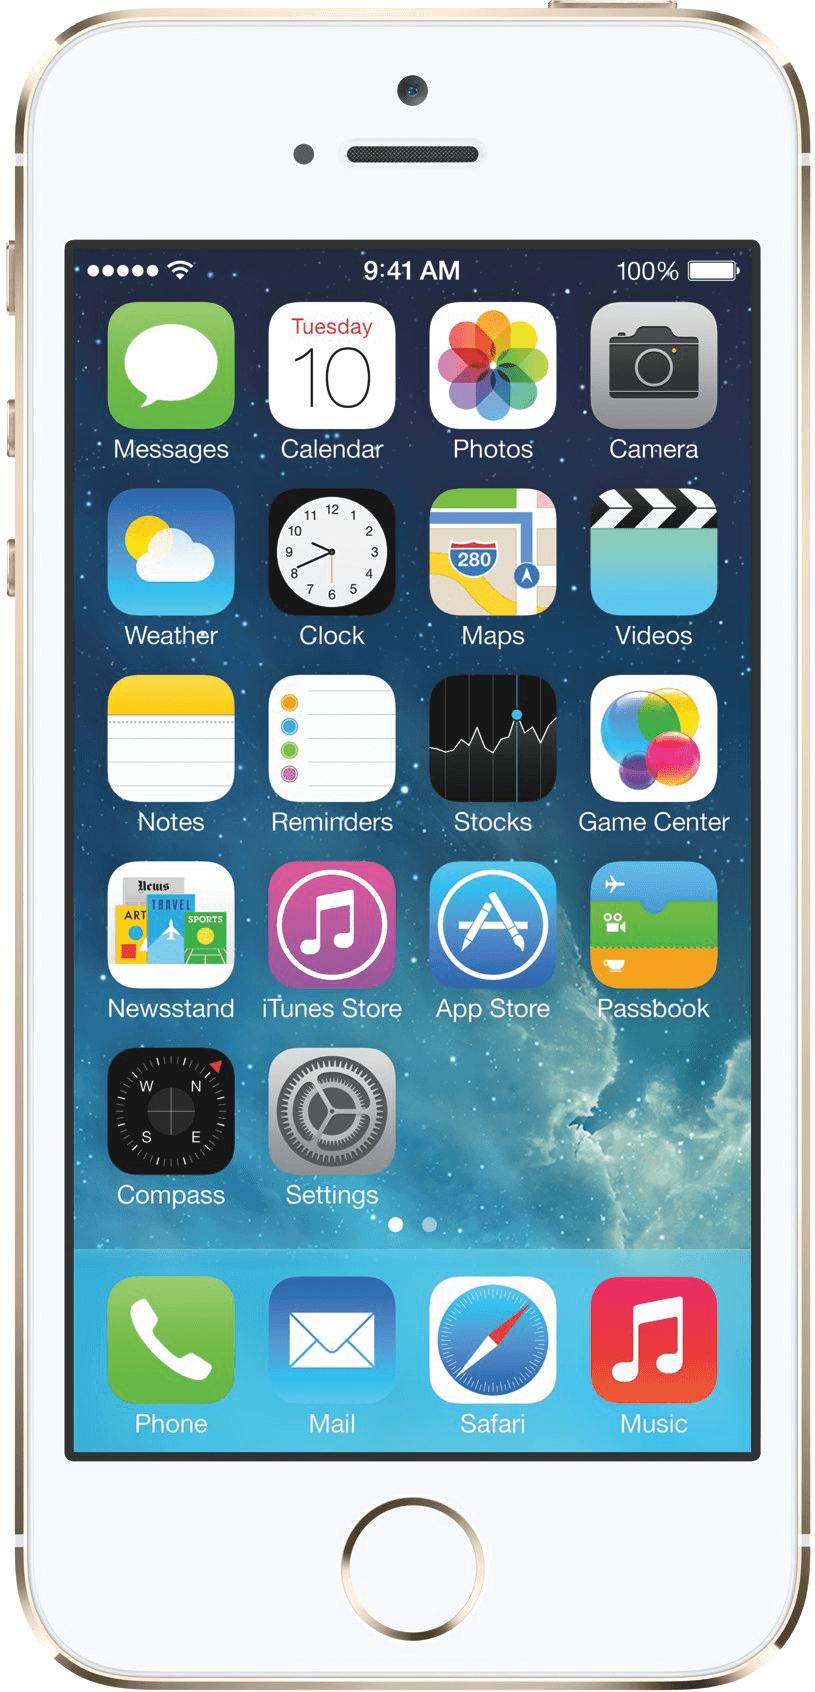
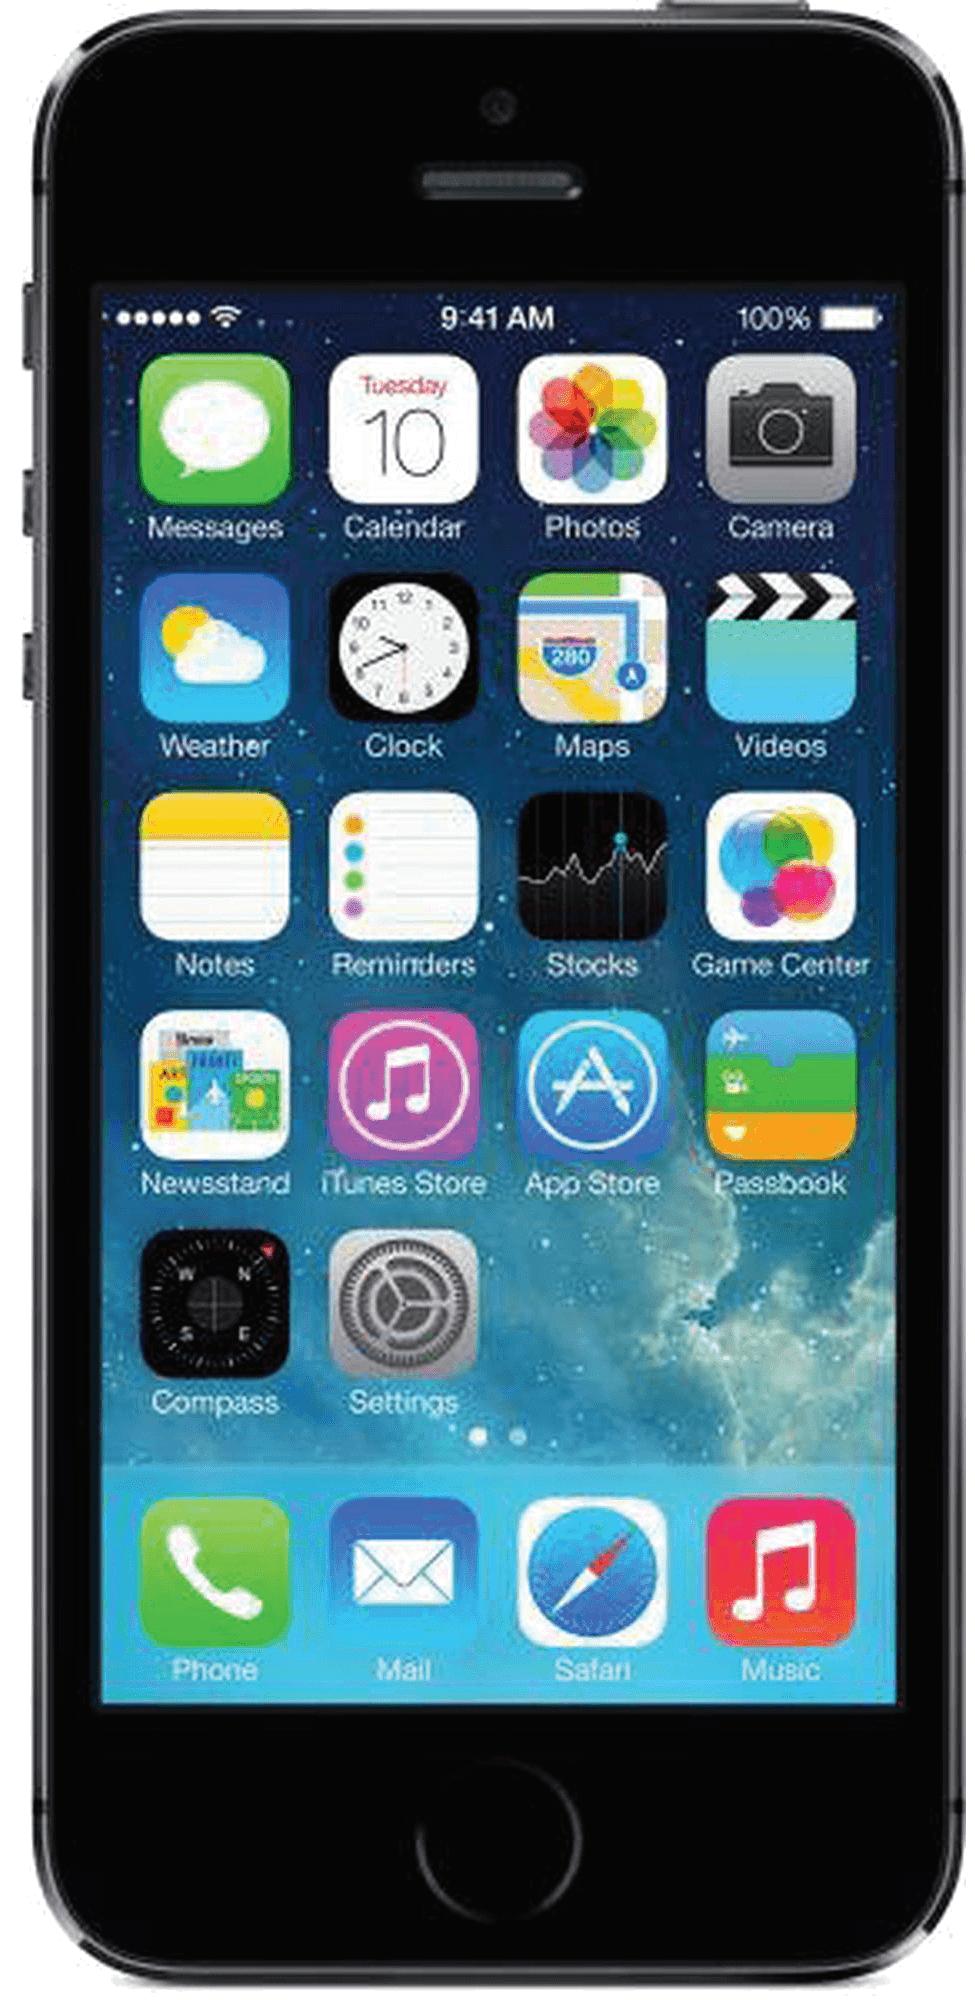
The Year ends with an Apple Moto sandwich at the top. A mega surprise on the number of Apple iPhone 5s 16 GB customer base bagging the top spot of second-hand devices traded online.
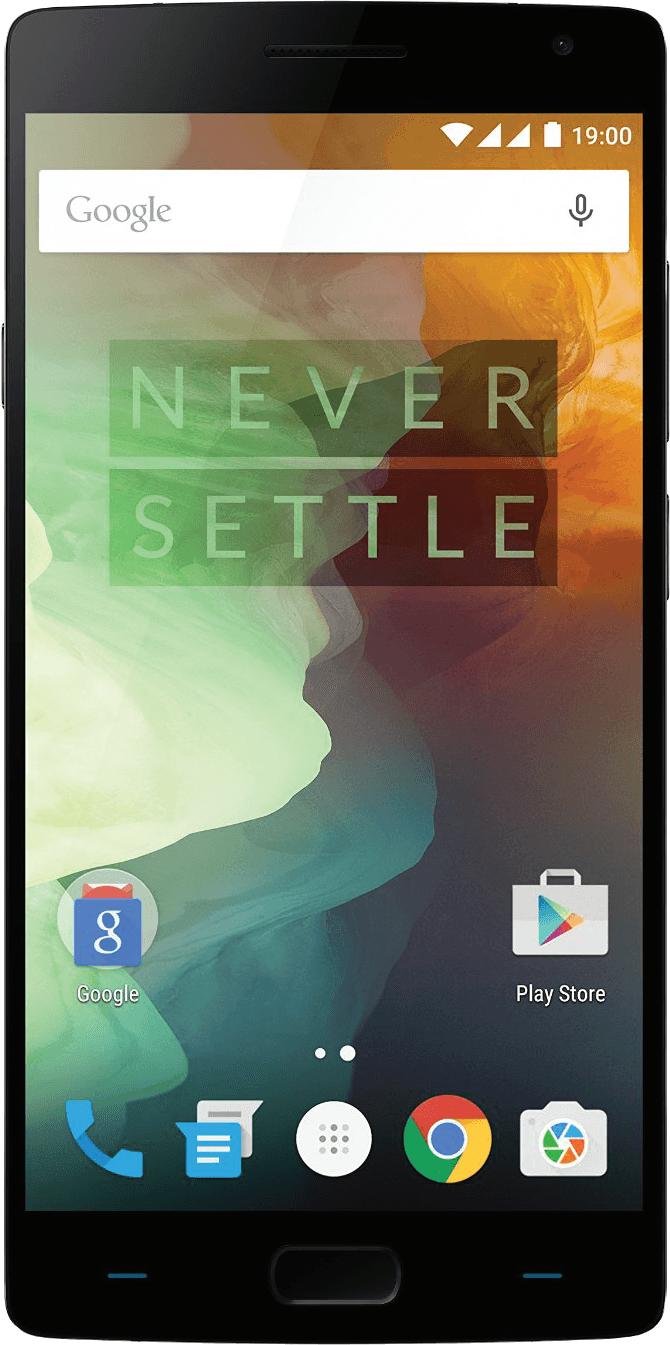
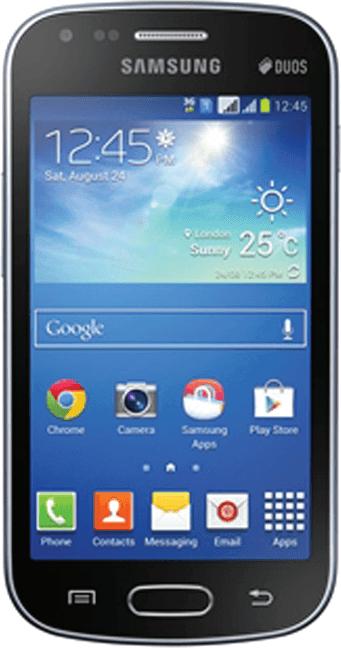
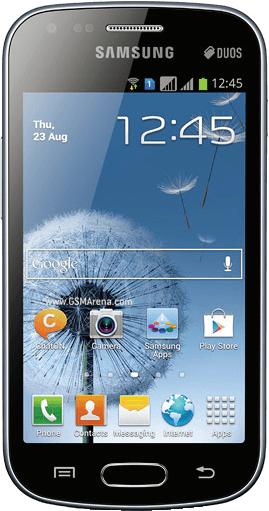
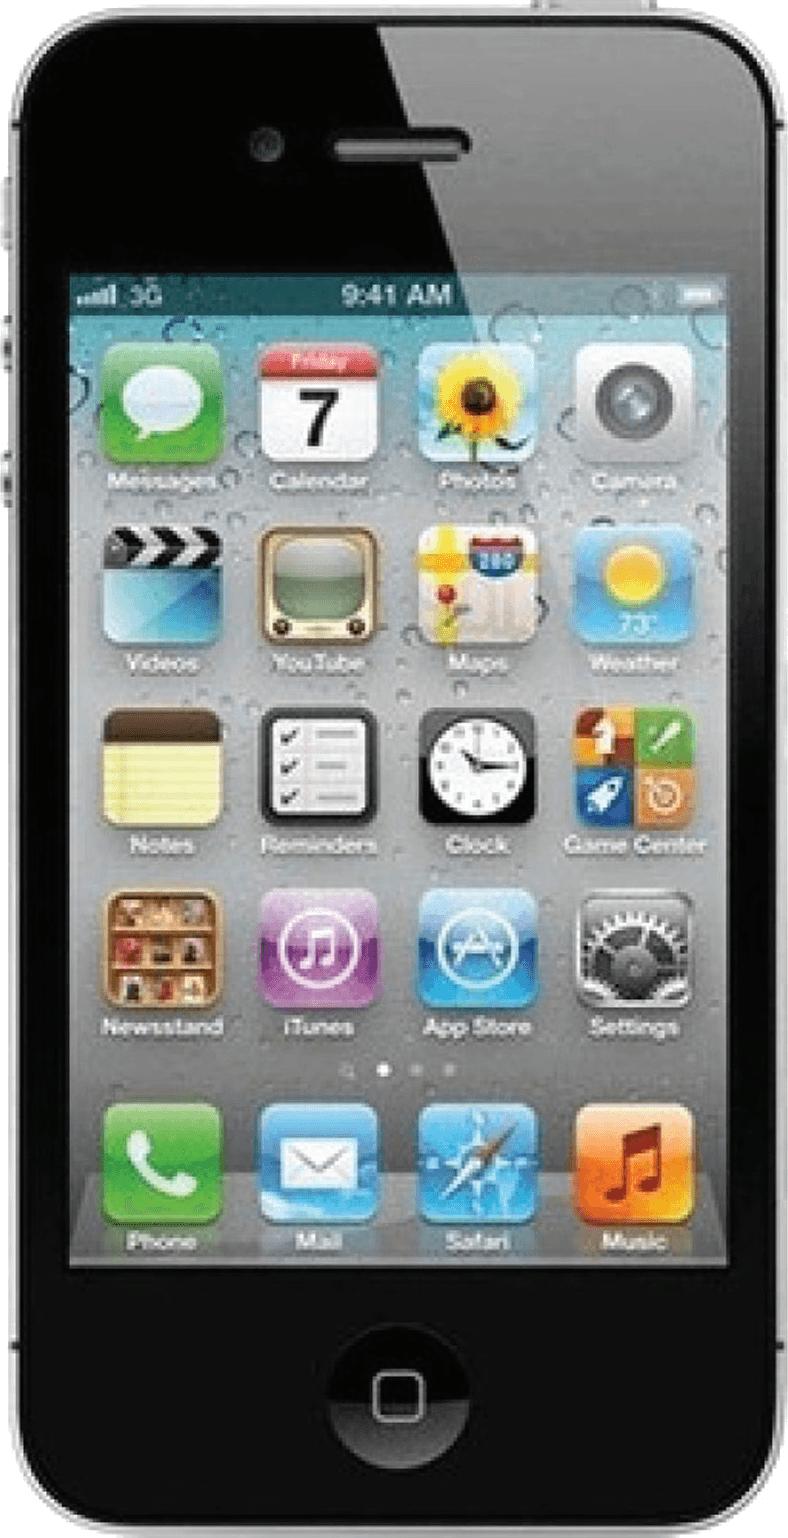
Demand for the Samsung Galaxy Grand Duos I9082 which retained the top position on an annualized basis, dropped dramatically post August while new launches from Apple and OnePlus seem to have triggered significant upgrade action in the second half of the year. Aside from new device users, a large number of Iphone 4/4s and 5/5s customers have upgraded to the iPhone 6/7 series. OnePlus also seems to have done a good job in upgrading its primary base to newer models.
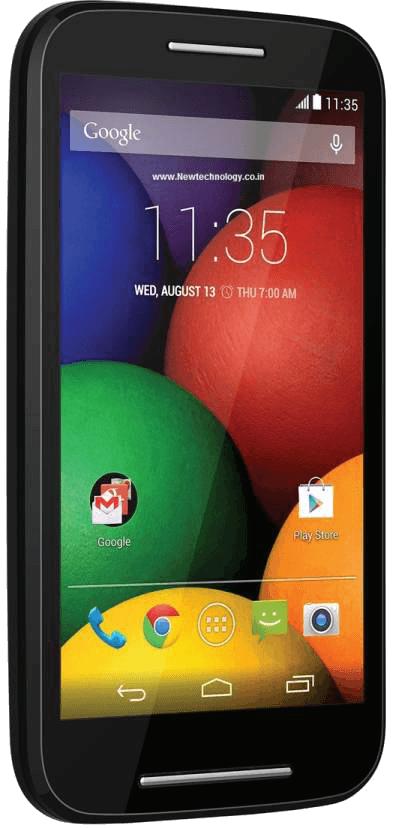
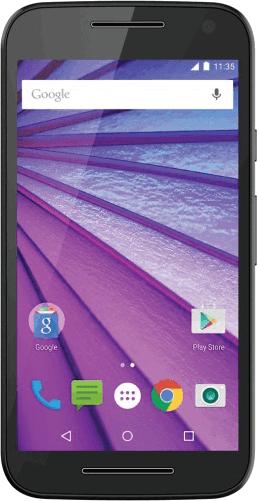
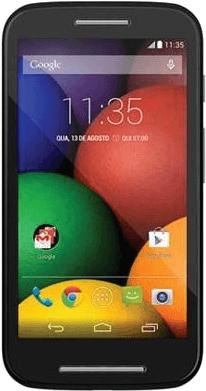
The Moto story continues with Moto E and G customers actively moving to their next device this year. Moto covered 3 of the top 15 positions this year.
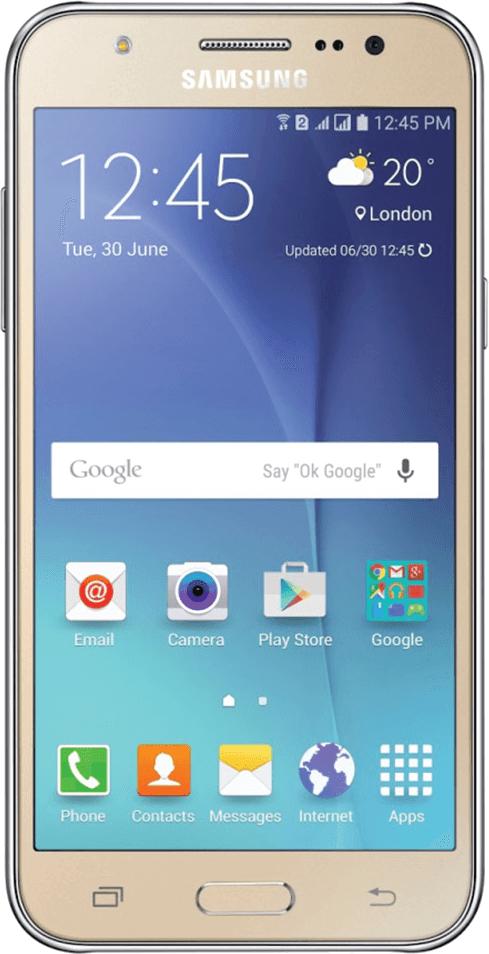
Samsung lead the pack with the most number of models (5) in the top 15, however, as is apparent from the trend, going forward the top traded models list in 2017 might not take much of a cue from the previous year.
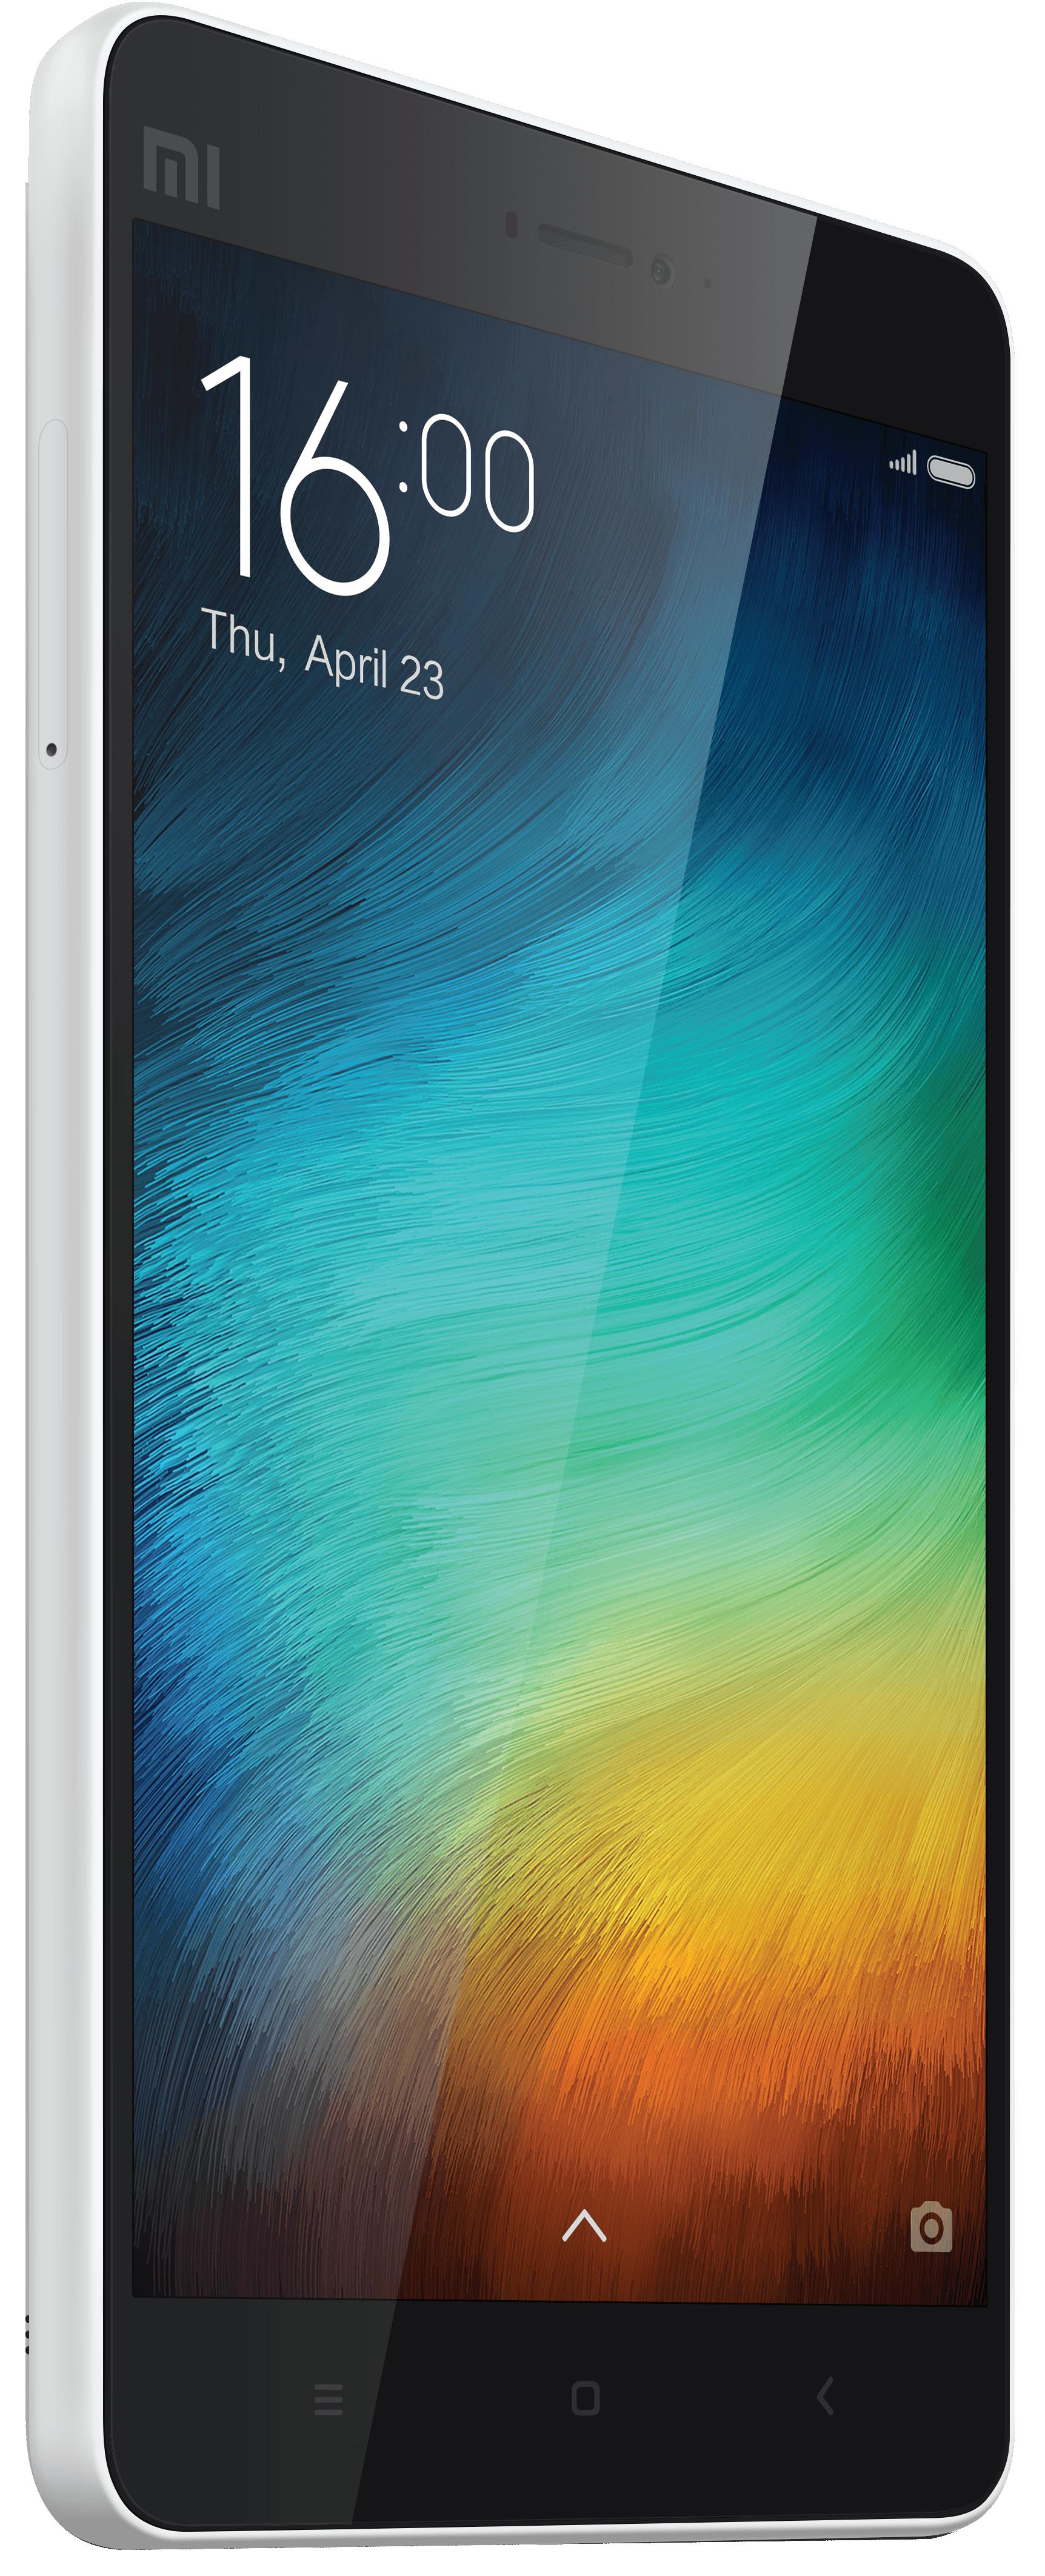
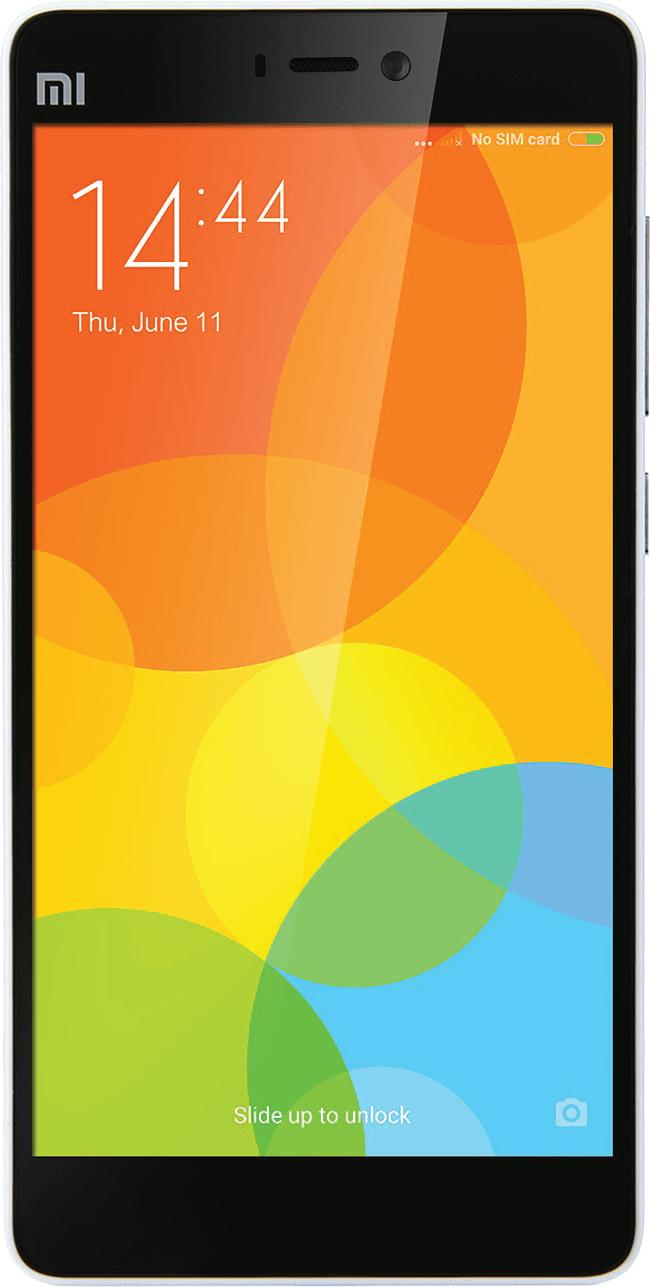
Xiaomi is an honorable mention here, managing 2 models back to back in the top 15. Looks like the brand has created a strong foot hold and is here to stay.
The top 10 traded devices constituted 20.57% of the total trade volume with a total of 762 unique models forming the bulk of the active portfolio of 2016.
Apple
CUSTOMER UPGRADE PATTERN
In an attempt to capture user upgrade behavior, an analysis of previously owned devices vs currently owned was conducted. Basis the last known Market Operating Price, trends in upgrade are represented here. The starting point indicates the price point of the previously owned device with the first block indicating how many customers remained in their previous price bucket. Subsequent blocks indicate the % of customers of the Initial bucket who upgraded to the respective new price buckets.
E.g – 22% of customers who owned a device in the 5k to 8K bucket bought a new device within the same price band while 64% upgraded to the 8-12K bucket and the balance 14% jumped to the 12-18K bucket.
FAST REFRESH
Top Devices Traded Under Warranty
Every year we witness devices that catch the market pretty fast but either tend to lose flavor with first time users or act as a leap frog for customers adopting newer devices as launches and exciting offers continue to shorten the refresh cycle.
We measure this by reviewing the number of devices traded back under warranty. Here are the top five by volume.
A Reflection of Retention vs Switchovers
Manufacturers/ Brands function on 2 basic premise, Acquisition of new users and where there is a degree of legacy, a large attempt is made to retain customers and ensure they upgrade as opposed to switch. Though all brands are not covered in the analysis, an attempt to provide a reflection of retention vs switchovers for a select 3 brands is covered here. Flagships Samsung, Apple and the disrupter, OnePlus were selected for analysis.
TROUBLE STARTERS
Why they were sold!
Device upgrade is not always the reason folks move to a new device. One is at times forced to do so in order to avoid the hassle of getting a device repaired in the event it starts to act up. Below is a list of functional issues that may be experienced during the life of the device along with a list of devices where the issue was reported most frequently at time of trade-in.
Data is based only on devices
CAMERA
FAULTY
CITY STATS
while
in its truth index. Go figure!
1
2
2
3
3 MUMBAI Mumbai gained 2.7% share, up from 11% to come in 3rd again. Trade-in customers gained 2% in their Truth Index. Encouraging signs for what’s to come.
4 5
GURGAON
The Urban star gained a spot moving up to 4th with 7.6% of devices traded. The city however followed Delhi’s trend with 7% drop in Truth index. Truly NCR!
5 7
HYDERABAD
Rising star Hyderabad gained 2 spots moving from 7th to 5th position with 6.8% market share. The city was a runner up with 82% truth index. Viva la Hyd!
6
4
CHENNAI
With 6.2% of total trade, Chennai dropped 2 ranks to come in 6th. The truth index was consistent at 69%, same as the previous period.
7
6
With a 1 spot drop to 7th and a 2 basis point drop in share to 6.1%. Pune still managed to jump 8%
its truth index to a happy
Low 8th on the list with a share of 3.8% Kolkata had the
truth index of the
8
Popular opinion would suggest the more recent surge in consumption patterns are driven primarily by easier access to cash and the increasing occurrence of equality in income to both genders. There still seems a long way to go though. Where electronics Re-Commerce is concerned, the trade-in market continues to be largely dominated by Men. Only 7.4% transactions initiated by the progressive sex.
Device Disposal
LADIES
Vs
GENTS
What are they doing with their devices?
Analysis indicated 28% of women would give away their old phone as opposed to only 13 % men. On the other hand a contributing factor to this would also be that women are more likely to be hanging on to their old devices. Men were more active in trading online while women were marginally more comfortable trading up at a local store. The infographic on the right shows how device disposal shape up between the two genders.
SELL or REPAIR
Polling the Sell vs Repair predicament, repair is fast becoming a popular choice. While men were about as likely to sell their damaged device. Women were clearly looking to hang on to their devices and get them repaired.
Further to the customer profile provided in the first edition of the Re-Commerce times, some gender based insights derived from data collected are represented here.
Fastest Phone refresh age group
18-24
Most likely purchase value
12-18K
Repair Vs Sell
Most likely to repair a damaged Phone
First point of information
Likely to own
Likely to switch to
Xioami
Fastest Phone refresh age group
24-35
Most likely purchase value
8-12K
Repair Vs Sell
Most likely to sell a damaged Phone
First point of information
Likely to own
Likely to switch to
Google Search Apple
WHO WE ARE
Cashify, formerly ReGlobe, is a registered trademark of Manak Waste Management Pvt Ltd and was co-founded by Mandeep Manocha and Nakul Kumar early in 2013. Cashify believes in offering a complete solution wherein customers can sell old or used gadgets hassle-free and get instant cash along with free home pick up. From picking up a customer’s call to making the final payment, everything at Cashify is aimed at providing the best, most convenient and secure user experience.
All product names, logos, and brands are property of their respective owners. All company, product and service names used in this website are for identification purposes only. Use of these names, logos, and brands does not imply endorsement.