

SEDAR
Southeast Data, Assessment, and Review
SEDAR 91
Stock Assessment Report
US Caribbean Spiny Lobster – Puerto Rico
September 2025
SEDAR
4055 Faber Place Drive, Suite 201 North Charleston, SC 29405
SEDAR
Southeast Data, Assessment, and Review
SEDAR 91
US Caribbean Spiny Lobster – Puerto Rico
SECTION I: Introduction SEDAR
4055 Faber Place Drive, Suite 201 North Charleston, SC 29405
Overview
SEDAR 91 addressed the stock assessment for US Caribbean Spiny Lobster – Puerto Rico The process consisted of an in-person Data Workshop, with several webinars before and after the workshop and a series of assessment webinars. The Review Workshop was cancelled because the center for independent experts (CIE) were not able to participate in the review of the assessment. The assessment was conducted by the SEFSC.
The Stock Assessment Report is organized into 4 sections. Section I – Introduction contains a brief description of the SEDAR Process, Assessment and Management Histories for the species of interest, and the management specifications requested by the Cooperator. The Data Workshop Report can be found in Section II. It documents the discussions and data recommendations from the Data Workshop Panel. Section III is the Assessment Process report. This section details the assessment model, as well as documents any changes to the data recommendations that may have occurred after the data workshop. Consolidated Research Recommendations from all stages of the process can be found in Section IV for easy reference.
The final Stock Assessment Report (SAR) for US Caribbean Spiny Lobster – Puerto Rico was disseminated to the public in September 2025. The Council’s Scientific and Statistical Committee (SSC) will review the SAR. The SSCs are tasked with recommending whether the assessments represent Best Available Science, whether the results presented in the SARs are useful for providing management advice and developing fishing level recommendations for the Council. An SSC may request additional analyses be conducted or may use the information provided in the SAR as the basis for their Fishing Level Recommendations (e.g., Overfishing Limit and Acceptable Biological Catch). The Caribbean Council’s SSC will review the assessment at its September 2025 meeting, followed by the Council receiving that information at its December 2025 meeting. Documentation on SSC recommendations is not part of the SEDAR process and is handled through each Council.
1 SEDAR PROCESS DESCRIPTION
SouthEast Data, Assessment, and Review (SEDAR) is a cooperative Fishery Management Council process initiated in 2002 to improve the quality and reliability of fishery stock assessments in the South Atlantic, Gulf of Mexico, and US Caribbean. SEDAR seeks improvements in the scientific quality of stock assessments and the relevance of information available to address fishery management issues. SEDAR emphasizes constituent and stakeholder participation in assessment development, transparency in the assessment process, and a rigorous and independent scientific review of completed stock assessments.
SEDAR is managed by the Caribbean, Gulf, and South Atlantic Regional Fishery Management Councils in coordination with NOAA Fisheries and the Atlantic and Gulf States Marine Fisheries Commissions. Oversight is provided by a Steering Committee composed of NOAA Fisheries representatives: Southeast Fisheries Science Center Director and the Southeast Regional Administrator; Regional Council representatives: Executive Directors and Chairs of the South Atlantic, Gulf of Mexico, and Caribbean Fishery Management Councils; a representative from the Highly Migratory Species Division of NOAA Fisheries, and Interstate Commission
representatives: Executive Directors of the Atlantic States and Gulf States Marine Fisheries Commissions.
SEDAR is normally organized around two workshops and a series of webinars. First is the Data Workshop, during which fisheries, monitoring, and life history data are reviewed and compiled. The second stage is the Assessment Process, which is conducted via a workshop and/or a series of webinars, during which assessment models are developed and population parameters are estimated using the information provided from the Data Workshop. The final step is the Review Workshop, during which independent experts review the input data, assessment methods, and assessment products. The completed assessment, including the reports of all 3 stages and all supporting documentation, is then forwarded to the Council SSC for certification as ‘appropriate for management’ and development of specific management recommendations.
SEDAR workshops are public meetings organized by SEDAR staff and the lead Cooperator. Workshop participants are drawn from state and federal agencies, non-government organizations, Council members, Council advisors, and the fishing industry with a goal of including a broad range of disciplines and perspectives. All participants are expected to contribute to the process by preparing working papers, contributing, providing assessment analyses, and completing the workshop report.
2 MANAGEMENT OVERVIEW
A Management History Database is being compiled, cataloged, and standardized by the National Oceanic and Atmospheric Administration (NOAA), National Marine Fisheries Service (NMFS), the Southeast Fisheries Science Center (SEFSC) Fisheries Statistics and Sustainable Fisheries Divisions in collaboration with the Cooperative Institute for Marine and Atmospheric Studies (CIMAS) of the University of Miami.
The Management History Database effort involves:
• Identifying Federal Register documentation associated with management actions affecting federally managed species throughout the Gulf of Mexico, South Atlantic, and U.S. Caribbean regions.
• Creating standardized records specifying the Fishery Management Plan (FMP), species, jurisdiction, and fishing sector (commercial and recreational) to which each management action is applied.
Once complete, the goal of the database is to provide a comprehensive and standardized record of published management actions to increase the efficiency of fisheries stock assessments, ACL monitoring, and ecosystem approaches. However, the database is still in development and is not yet available to the public. The intention of this working paper is not to replace current management history documents but to provide complementary tables of cited regulations.
We queried a prototype of the database for records related to Caribbean Spiny Lobster. The records associated with bag limits, size limits, prohibited gear, and closures were reviewed and are summarized here.
Table 1. Recreational bag limit regulations contained within the Management History Database for Caribbean Spiny Lobster.
Table 2. Size limit regulations for the commercial fishery and recreational and commercial fisheries combined (All) contained within the Management History Database for Caribbean Spiny Lobster.
1Size limit applies to non-egg-bearing spiny lobster
2Size limit applies to imported spiny lobster
Table 3. Gear restrictions for commercial and commercial and recreational fisheries combined (All) contained within the Management History Database for Caribbean Spiny Lobster.
Prohibited fileting fish at sea
Reef fish vessels required to recover anchor by its crown
Gillnets or Trammel
Ongoing Prohibit gillnets or trammel net for reef species1
Pots and Traps
Slurp Gun and Dip Nets
11/15/1993 11/27/2005
Include two degradable panels on opposite sides 56 FR 48755 Final
Include two degradable panels (sides no longer specified) 58 FR 53145
Include one degradable panel
Allow only slurp gun and hand-held dip nets for aquarium trade 58 FR 53145 70 FR 62073 Final Amendment 2 Final
1Gill nets and trammel nets used to fish other species must be tended at all times
by fishing
2Lang Bank (St. Croix) only starting 11/28/2005
3Bajo de Sico, Abrir La Sierra, Tourmaline, Mutton Snapper Spawning Aggregation Area, Lang Bank, Hind Bank Marine Conservation District, and Grammanik Bank
4Pots, traps, bottom longlines, gillnets, trammel nets
Table 4. Closure regulations for Caribbean Spiny Lobster contained within the Management History Database.
Region Affected
Caribbean Red Hind Spawning Aggregation West of Puerto Rico - Abrir La Sierra Bank
Region Affected
Caribbean Red Hind Spawning Aggregation West of Puerto Rico - Bajo De Sico
Region Affected
Caribbean Red Hind Spawning Aggregation West of Puerto Rico - Bajo De Sico
Caribbean
Bank Reef Fish Fishery Management Area
Caribbean Hind Bank Marine
Conservation District (MCD) Reef Fish Fishery Management Area
Region Affected
Caribbean Hind Bank Marine Conservation District (MCD) Reef Fish Fishery Management Area
Caribbean Mutton Snapper Spawning
Caribbean Red Hind Spawning
Croix Reef Fish Fishery Management Area
Region Affected
Caribbean Red Hind Spawning Aggregation East
Croix Reef Fish Fishery Management Area
Caribbean Red Hind Spawning
Aggregation
3 ASSESSMENT HISTORY AND REVIEW
Previous stock assessments for US Caribbean spiny lobster have attempted to quantify stock status using both traditional as well as data-limited stock assessment procedures. Morris et al. (2004) and also SEDAR (2005A) provide assessment histories that summarize various traditional assessments; e.g., stock production analyses (ASPIC), CPUE examinations, yield per recruit, landings and length frequency. During SEDAR 46, a data-limited management strategy evaluation was conducted to simulation-test mean-length, indicator-based control rules (2016). A table of past assessment model applications can be found in the SEDAR 57 Final Stock Assessment Report (2019). SEDAR 57 was the first application of Stock Synthesis 3.0 (SS3) in the US Caribbean (2019). During SEDAR 57, the Puerto Rico spiny lobster stock assessment models were subject to numerous sensitivity analyses including assumptions related to natural mortality, growth, and selectivity (SEDAR, 2019). The Puerto Rico assessment models developed during SEDAR 57 were fit to catch time series and length composition information from dive and pot/trap fisheries; this is considered a data-limited to moderate implementation of SS3. SEDAR 57 resulted in a satisfactory stock status determination for providing management advice (2019). A data-only update was conducted in 2022 to provide ABCs and ACLs through May, 2025. Two new data streams became available during the SEDAR 91 Data Workshop: length compositions obtained from SEAMAP-C dive surveys conducted off of the Southwest Puerto Rico coast during 2021-2023 (ref), and length compositions obtained from an HJR Reefscaping lobster trap survey conducted throughout Puerto Rico coastal waters during 20212022. The Assessment Panel recommended fitting the SEDAR 91 Puerto Rico stock assessment to both of these data streams.
REGIONAL MAPS
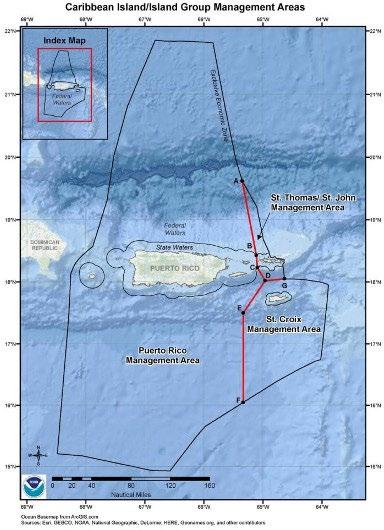
4.1 Jurisdictional boundaries of the Caribbean Fishery Management Council
Figure
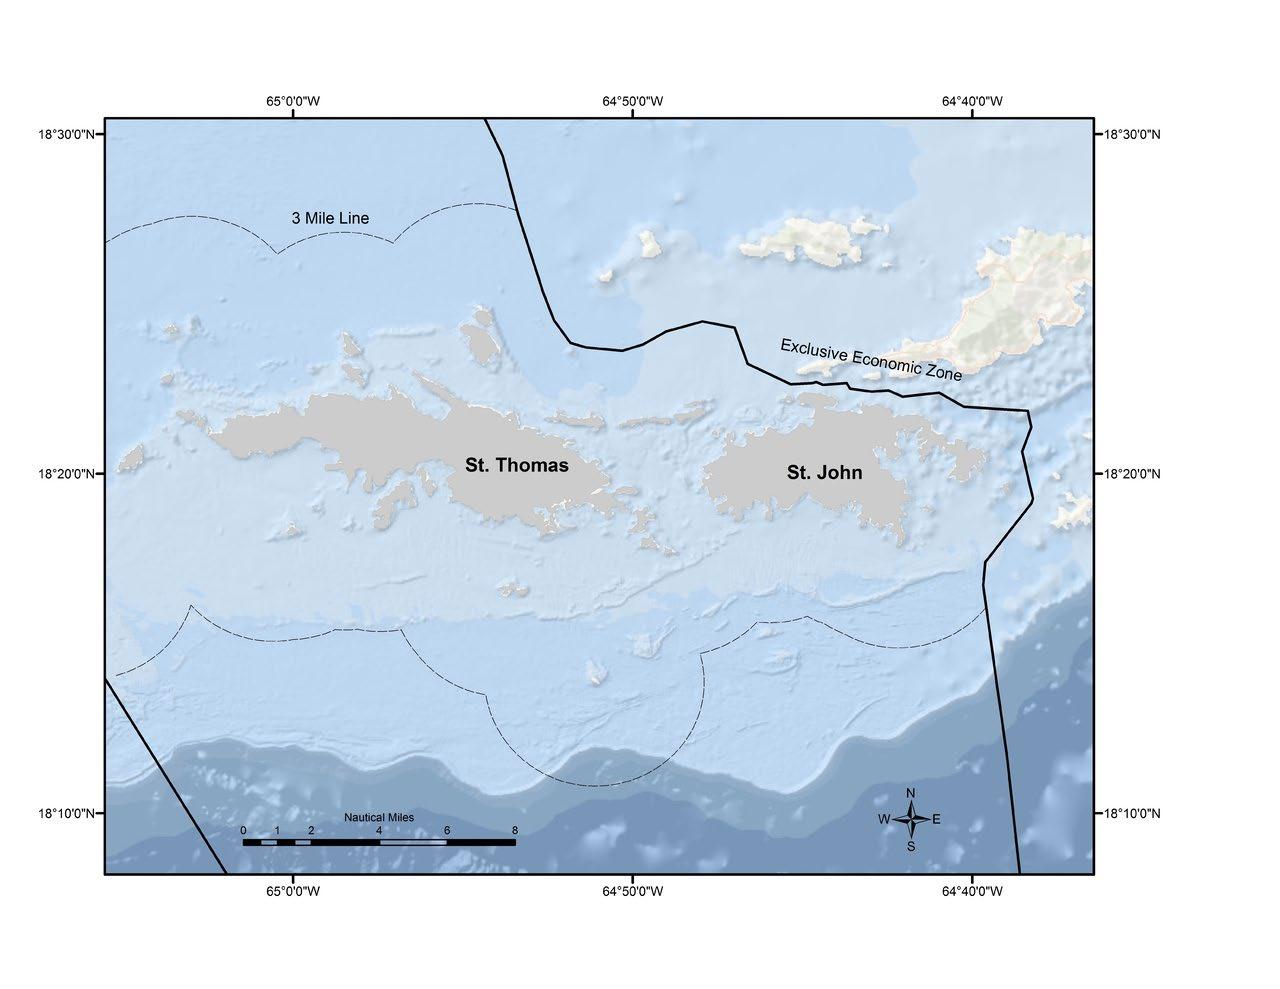
Figure 4.2: The U.S. Exclusive Economic Zone is defined as the federal waters ranging from 3 to 200 nautical miles (5.6 – 370 kilometers) from the nearest coastline point of the US Virgin Islands.
4 SEDAR ABBREVIATIONS
ABC Acceptable Biological Catch
ACCSP Atlantic Coastal Cooperative Statistics Program
ADMB AD Model Builder (software program)
ALS Accumulated Landings System: SEFSC fisheries data collection program
AMRD Alabama Marine Resources Division
APAIS Access Point Angler Intercept Survey
ASMFC Atlantic States Marine Fisheries Commission
B Biomass (stock) level
BAM Beaufort Assessment Model
B msy B capable of producing MSY on a continuing basis
BSIA Best Scientific Information Available
CHTS Coastal Household Telephone Survey
CFMC Caribbean Fishery Management Council
CIE Center for Independent Experts
CPUE Catch Per Unit Effort
EEZ Exclusive Economic Zone
F Fishing mortality (instantaneous)
FES Fishing Effort Survey
FIN Fisheries Information Network
F MSY F to produce MSY under equilibrium conditions
F OY F rate to produce OY under equilibrium
F XX% SPR F rate resulting in retaining XX% of the maximum spawning production under equilibrium conditions
F max F maximizing the average weight yield per fish recruited to the fishery
F o F close to, but slightly less than, Fmax
FL FWCC Florida Fish and Wildlife Conservation Commission
FWRI Florida Fish and Wildlife Research Institute
GA DNR Georgia Department of Natural Resources
GLM General Linear Model
GMFMC Gulf of Mexico Fishery Management Council
GSMFC Gulf States Marine Fisheries Commission
GULF FIN GSMFC Fisheries Information Network
HMS Highly Migratory Species
LDWF Louisiana Department of Wildlife and Fisheries
M natural mortality (instantaneous)
MARFIN Marine Fisheries Initiative
MARMAP Marine Resources Monitoring, Assessment, and Prediction
MDMR Mississippi Department of Marine Resources
MFMT Maximum Fishing Mortality Threshold: value of F above which overfishing is deemed to be occurring
MRFSS Marine Recreational Fisheries Statistics Survey: combines a telephone survey of households to estimate number of trips with creel surveys to estimate catch and effort per trip
MRIP Marine Recreational Information Program
MSA Magnuson Stevens Act
MSST Minimum Stock Size Threshold: value of B below which the stock is deemed to be overfished
MSY Maximum Sustainable Yield
NC DMF North Carolina Division of Marine Fisheries
NMFS National Marine Fisheries Service
NOAA National Oceanographic and Atmospheric Administration
OST Office of Science and Technology, NOAA
OY Optimum Yield
SAFMC South Atlantic Fishery Management Council
SC DNR South Carolina Department of Natural Resources
SEAMAP Southeast Area Monitoring and Assessment Program
SEDAR Southeast Data, Assessment and Review
SEFIS Southeast Fishery-Independent Survey
SEFSC Southeast Fisheries Science Center, NMFS
SERFS Southeast Reef Fish Survey
SERO Southeast Regional Office, NMFS
SRFS State Reef Fish Survey (Florida)
SRHS Southeast Region Headboat Survey
SPR Spawning Potential Ratio: B relative to an unfished state of the stock
SSB Spawning Stock Biomass
SS Stock Synthesis
SSC Scientific and Statistical Committee
TIP Trip Interview Program: biological data collection program of the SEFSC and Southeast States
TPWD Texas Parks and Wildlife Department
Z total mortality (M+F)
SEDAR
Southeast Data, Assessment, and Review
SEDAR 91
US Caribbean Spiny Lobster Puerto Rico
SECTION II: Data Workshop Report
January 2025
SEDAR
4055 Faber Place Drive, Suite 201 North Charleston, SC 29405
This information is distributed solely for the purpose of peer review. It does not represent and should not be construed to represent any agency determination or policy.
1. INTRODUCTION
1.1 WORKSHOP TIME AND PLACE
The SEDAR 91 Data Workshop was held November 13-15, 2024, in St Thomas, USVI. In addition to the in-person workshop, a series for webinars were held before (June and October 2024) the meeting.
1.2 TERMS OF REFERNCE
Data Workshop Terms of Reference:
1. Review available data inputs and provide tables and figures including, but not limited to:
a. Commercial and recreational catches and/or discards.
b. Length/age composition data
c. Life history and ecological information
d. Indices of abundance
e. Include data through at least 2022.
2. Provide recommendations for future research in areas such as sampling, fishery monitoring, and stock assessment. Include specific guidance on research goals, data to be collected, and how the research will inform stock assessment.
3. Prepare the Data Workshop report providing complete documentation of workshop actions and decisions in accordance with project schedule deadlines (Section II of the SEDAR assessment report).
1.3
LIST OF PARTICIPANTS
Data Workshop Participants
Matt Damiano (Lead Analyst) ...........................................................................NMFS/SEFSC
Adyan Rios NMFS/SEFSC
Sarah Beggerly ............................................................................................... NMFS/SEFSC
J.J. Cruz-Motta CFMC SSC, UPRM
Jorge R. Garciá ................................................................................................... CFMC SSC
Katherine Godwin ............................................................................................. UM-CIMAS
Sennai Habtes ................................................................................................... USVI DPNR
Daniel Matos-Caraballo ........................................................................................ PR DNER
Kevin McCarthy NMFS/SEFSC
Maggie Rios ...................................................................................................... USVI DPNR
M. Refik Orhun NMFS/SEFSC
Wilson Santiago Soler ..........................................................................PR Fisheries Liaison
Michelle Scharer ................................................................................................. CFMC SSC
Juan J. Agar ................................................................................................................ SEFSC
Danielle Olive DPNR/DFW
Eva M. Collazo Montarez .................................................................................. DPNR/DFW
Elizabeth Kadison UVI/SSC
Ana Medina ................................................................................................................ UPRM
Abdiel Connelly SAMAR
Daryl Bryan ............................................................................................. Stakeholder – STT
Nelson Crespo ............................................................................................. Stakeholder - PR
Staff
Julie A. Neer ............................................................................................................ SEDAR Staff
Graciela Garcia-Moliner CFMC Staff
Emily Ott ......................................................................................................... SEDAR Staff
Data Process Webinar Observers
Judd Curtis ..................................................................................................................... SAFMC
Maria López-Mercer ..................................................................................................................
Gerson Martinez Stakeholder STX
Martha Prada ...............................................................................................................................
Vanessa Martinez
Jesus Rivera .................................................................................................................................
Verónica Seda PR-DNER Fisheries Lab
Rachael Silvas........................................................................................................... SAFMC
Sarah Stephenson SERO
Ramirez Edgardo. .......................................................................................................................
Casey Butler ...............................................................................................................................
Cindy Grace-McCaskey
Kimberly Johnson ...............................................................................................NMFS/SEFSC
May Lehmensiek
Jesus Leon . ..................................................................................................................................
Martha Prada DRNA
Vanessa Ramirez .........................................................................................................................
Noemi Peña Alvard ............................................................................................... PR DNER
Aida Rosario ............................................................................................................... PR DNER
1.4 LIST OF DATA WORKSHOP WORKING PAPERS & REFERNCE DOCUMENTS
Document #
Title
Authors Date Submitted
Documents Prepared for the Data Workshop
SEDAR91-DW01 Summary of participatory modeling workshops to understand ecological, social and economic dimensions of the U.S. Virgin Islands lobster fishery
SEDAR91-DW02 Summary of participatory modeling workshops to understand ecological, social and economic dimensions of the Puerto Rican lobster fishery
SEDAR91-DW03 PR/DNER/Commercial Fisheries Statistics Program Report Signs of the Abundance of Spiny Lobster Panulirus argus Observed by Commercial Landings Reported during 2014-2023
SEDAR91-DW04
SEDAR 91 Trip Interview Program (TIP) Size Composition Analysis of Caribbean Spiny Lobster (Panulirus argus) in Puerto Rico, U.S. Caribbean, 1981-2023
SEDAR91-DW05 SEDAR 91 Trip Interview Program (TIP) Size Composition Analysis of Caribbean Spiny Lobster (Panulirus argus) in St. Thomas/St. John, U.S. Caribbean, 1981-2023
SEDAR91-DW06 SEDAR 91 Trip Interview Program (TIP) Size Composition Analysis of Caribbean Spiny Lobster (Panulirus argus) in St. Croix, U.S. Caribbean, 1981-2023
SEDAR91-DW07 SEDAR 91 Commercial Landings of Caribbean Spiny Lobster (Panulirus argus, Panulirus guttatus)
Juan Agar, Mandy Karnauskas, Kelsi Furman, Matt McPherson, Manoj Shivlani 11/1/2024
Mandy Karnauskas, Juan Agar, Matt McPherson, Kelsi Furman, Manoj Shivlani 11/1/2024
Daniel MatosCaraballo, Jesús León-Fernández, Luis A. RiveraPadilla, and Wilson SantiagoSoler 11/15/2024
Katherine Godwin, Adyan Rios 11/20/2024
Katherine Godwin, Adyan Rios 11/20/2024
Katherine Godwin, Adyan Rios 11/20/2024
M. Refik Orhun, Katherine Godwin, Kim Johnson, and 11/24/2024
in Puerto Rico, US Caribbean, 1983-2023
SEDAR91-DW08 SEDAR 91 Commercial Landings of Caribbean Spiny Lobster (Panulirus argus) in St. Thomas and St. John, US Caribbean, 1975-2023
SEDAR91-DW09 SEDAR 91 Commercial Landings of Caribbean Spiny Lobster (Panulirus argus) in St. Croix, US Caribbean, 1975-2023
Stephanie Martínez Rivera
M. Refik Orhun, Katherine Godwin, Kim Johnson, and Stephanie Martínez Rivera 11/24/2024
M. Refik Orhun, Katherine Godwin, Kim Johnson, and Stephanie Martínez Rivera 11/24/2024
Reference Documents
SEDAR91RD01 On the productivity and technical efficiency of the Puerto Rican queen conch Aliger gigas fishery
SEDAR91RD02 Socio-economic Profile of the Smallscale Dive Fishery in the Commonwealth of Puerto Rico
SEDAR91RD03 Determining the age-size relationship of Panulirus argus in the southwest area of Puerto Rico
SEDAR91RD04 Annual Juvenile Recruitment of Spiny Lobsters, Panulirus Argus (Decapoda, Palinuridae), in a Shallow Seagrass Bed and a Deeper Hard Bottom off Western Puerto Rico
SEDAR91RD05 Patterns of Spiny Lobster (Panulirus argus) Postlarval Recruitment in the Carribbean: A CRTR Project
Juan Agar and Daniel Solis 10/9/2024
Juan J. Agar and Manoj Shivlani 10/9/2024
Ana G. Medina Martinez 10/9/2024
Nilda M. Jiménez, Ernest H. Williams, Jr. and Aida Rosario 10/10/2024
Mark J. Butler IV, Angela M. Mojica, Eloy Sosa-Cordero, Marines Millet and Paul SanchezNavarro 10/10/2024
SEDAR91RD06 Developing a population assessment for Caribbean spiny lobster Panulirus argus in the United States Virgin Islands: lessons learned
SEDAR91RD07 Estimate of In-water Size Structure of Spiny Lobsters in St. Thomas
Lee Richter1 and Michael W Feeley2 11/7/2024
Tyler B. Smith, Sarah L. Heidmann, Rosmin S. Ennis, Viktor W. Brandtneris, 11/7/2024
SEDAR91RD08 Displaced juvenile and subadult Caribbean spiny lobsters show strong orientation toward home dens
Adeline Shelby, Jeremiah Blondeau
Michael J. Childress a,*, Coral Holt a, Rodney D. Bertelsen b 11/14/2024
SEDAR91RD09 Ocean acidification disrupts the orientation of postlarval Caribbean spiny lobsters
SEDAR91RD10 Relationships between postlarval settlement and commercial landings of Caribbean spiny lobster (Panulirus argus) in Florida (USA)
SEDAR91RD11 Gastric mill ossicles record chronological age in the Caribbean spiny lobster (Panulirus argus)
Philip M. Gravinese, Heather N. Pag, Casey B. Butler, Angelo Jason Spadaro, Clay Hewett, Megan Considine, David Lankes & Samantha Fisher 11/14/2024
Emily Hutchinson, Thomas R. Matthews , Gabrielle F. Renchen 11/14/2024
Emily Hutchinson, Thomas. R Matthews, Erica Ross, Samantha Hagedorn , Mark J. Butler IV, 11/14/2024
SEDAR91-12 Spiny Lobster SEAMAP Program Survey 2021-23
SEDAR91-13 Progress Report: Independent fishery data collection for lobster (Panulirus argus) and conch (Lobatus gigas) under the SEAMAP-C program
Department of Natural and Environmental Resources 11/14/2024
Juan J. Cruz Motta 11/14/2024
2. Life History
2.1 Overview
No new life history information was available for the SEDAR Panel to discuss during the data workshop. Therefore, sections 2.2-2.8 were carried over from SEDAR 57.
2.2 Stock Definition and Description
The Caribbean spiny lobster, Panulirus argus (hereafter referred to as spiny lobster), occurs in the Caribbean Sea, the Gulf of Mexico and the Western Central and South Atlantic Ocean. North Carolina marks its northernmost limit whereas Brazil marks its southernmost limit (Bliss 1982). The spiny lobster occurs from the extreme shallows of the littoral fringe to depths exceeding 100 meters (Kanciruk 1980; Munro 1974). CFMC (1981) reports that its distribution off Puerto Rico extends to the edge of the shelf, which is described as the 100−fathom contour (183 meters). Shallow areas with mangroves and seagrass (Thalassia testudinum) beds serve as nursery areas where available (Munro 1974). Generally, spiny lobsters move offshore when they reach reproductive size (Phillips et al. 1980). These animals are primarily carnivores, and serve as the major benthic carnivores in some ecosystems (Kanciruk 1980), feeding upon smaller crustaceans, mollusks and annelids (Cobb and Wang 1985).
2.3
Meristic & Conversion factors
Length-weight conversions were estimated using the Trip Interview Program (TIP) database. TIP records were filtered according to island platform (Puerto Rico, St. Thomas/St. John, and St. Croix). Records were further filtered such that retained records consisted only of those with paired length-weight measurements that had reported units of measure (e.g., mm or kg) and corresponding measurement type (e.g., carapace length or whole weight). A subsequent evaluation of data entry and/or measurement errors led to the removal of 33 records for Puerto Rico (Table 2.1.)
Length-weight (L-W) relationships were fit as log-linear functions in the R statistical computing software (Quinn and Deriso 1999, R Development Core Team 2012). The relationship for cephalothorax length (CL; mm) to weight (kg whole weight) is: ���� = ������������
Model fitting was carried out using linear regression on the log transformed equation: ������������(����) = ������������(����) + ���� ∗ ������������(����)
Resulting L-W relationships are found in Table 2.2. For Puerto Rico, a total of n=22,980 L-W observations were available from TIP (n male=12,019; n female=10,961) from 1980 to 2016 (Fig. 2.1). The largest individual by length was 196 mm CL, which was also the largest individual by weight (4.536 kg). Cephalothorax length to weight conversions by Island Platform are shown in Table 2.2.
Spatial analysis of Puerto Rico L-W data according to four Caribbean spatial areas suggested that L-W curves were not significantly different (p-value = 1.0; Table 2.3).
2.4 Natural Mortality
During SEDAR 8, various sources are referenced with respect to natural mortality, including Olsen and Koblic 1975, Medley and Ninnes 1996, and FAO 2001. Natural mortality was specified at 0.36 for adult lobsters and used for all ages during SEDAR 8. During SEDAR 46 (Spiny lobster St. Thomas/St. John and St. Croix), consideration was given to natural mortality estimates from tagging studies, with estimates typically varying between 0.26 and 0.44 year-1 for adult spiny lobster, with the most reliable estimates suggested to be in the range of 0.30 to 0.40 (FAO 2001). A point estimate of 0.34 year-1, calculated from a variant of Pauly’s equation, is also widely reported (Cruz et al. 1981). Point estimates based on longevity were also considered, but require evidence of maximum age, which is difficult to obtain for lobsters (Kanciruk 1980). This issue is reinforced by additional statements made by Olsen and Koblic (1975). Further discussion about spiny lobster longevity can be found on pg 27, SEDAR 46, Data and Assessment Workshop report (SEDAR 2016). Several spiny lobster stock assessments in the Caribbean have used 0.34 to 0.36 year-1 in base model runs (Cruz 2001; Gongora 2010; SEDAR 2005; Babcock et al. 2014). During the SEDAR 57 data workshop, participants identified a mark- recapture dataset from a study undertaken by the St. Thomas Fishermen’s Association (Olsen et al. 2017). Analysts determined obtaining an estimate of natural mortality from this study for use in the assessment was not feasible; this was potentially due to an underestimate of reporting practices stated by Olsen et al. (2017), which resulted in an unreasonably high (M > 2.0 year-1) estimates of natural mortality (see SEDAR 57 Final Assessment Report).
2.5 Reproduction
Die (2005) estimated a logistic maturity curve from TIP prior to 1990, when landing of egg bearing females was permitted. Data from Puerto Rico and St. Thomas/St. John were aggregated for the purpose of model fitting. Two model parameterizations were considered, in both cases, length at 50% maturity were similar being either 91 mm or 92 mm CL.
For SEDAR 8 (2005), fecundity-at-length was obtained for Cuba spiny lobster (FAO 2001): ���� = 0 5911����4 5677 , where E is number of eggs and L is carapace length in mm.
2.6
Age and Growth
During SEDAR 8, von Bertalanffy growth curves for males and females were obtained from Leon et al. (1994) for Cuba (SEDAR 2005). Since SEDAR 8, several additional publications have become available for von Bertalanffy growth curves from regions such as Cuba, Puerto Rico, and Mexico (Table 2.3). Also, during SEDAR 46 (Spiny lobster St. Thomas/St. John & St. Croix), von Bertalanffy growth parameters from Leon et al. (1995) were reviewed, noting similar values used in other stock assessment (i.e., Gongora 2010; Babcock et al. 2014). These point estimates were also compared to a more recent study by Leon et al. (2005) and analyses in SEDAR 46 were based on a single growth curve for both sexes. During the SEDAR 57 data
workshop, participants identified a mark-recapture dataset from a study undertaken by the St. Thomas Fishermen’s Association (Olsen et al. 2017). During SEDAR 57, analysts determined that obtaining a growth curve from this study for use in the assessment was not feasible. This was due to an absence of the largest size classes in the data set, though results verified that growth in Puerto Rico (Table 2.3) was generally consistent with growth in St. Thomas/St. John (see SEDAR 57 Final Assessment Report).
Table 2.1 Records manually removed from Puerto Rico TIP prior to CL-W model fitting.
Table 2.2 Fitted conversion functions from cephalothorax length (mm) to weight (kg whole weight) for Puerto Rico Island platform
Puerto Rico
Table 2.3 von Bertalanffy growth parameters, noting values used in SEDARs 8 and 46 (i.e., Leon et al. (1995)) and with emphasis on subsequent studies.
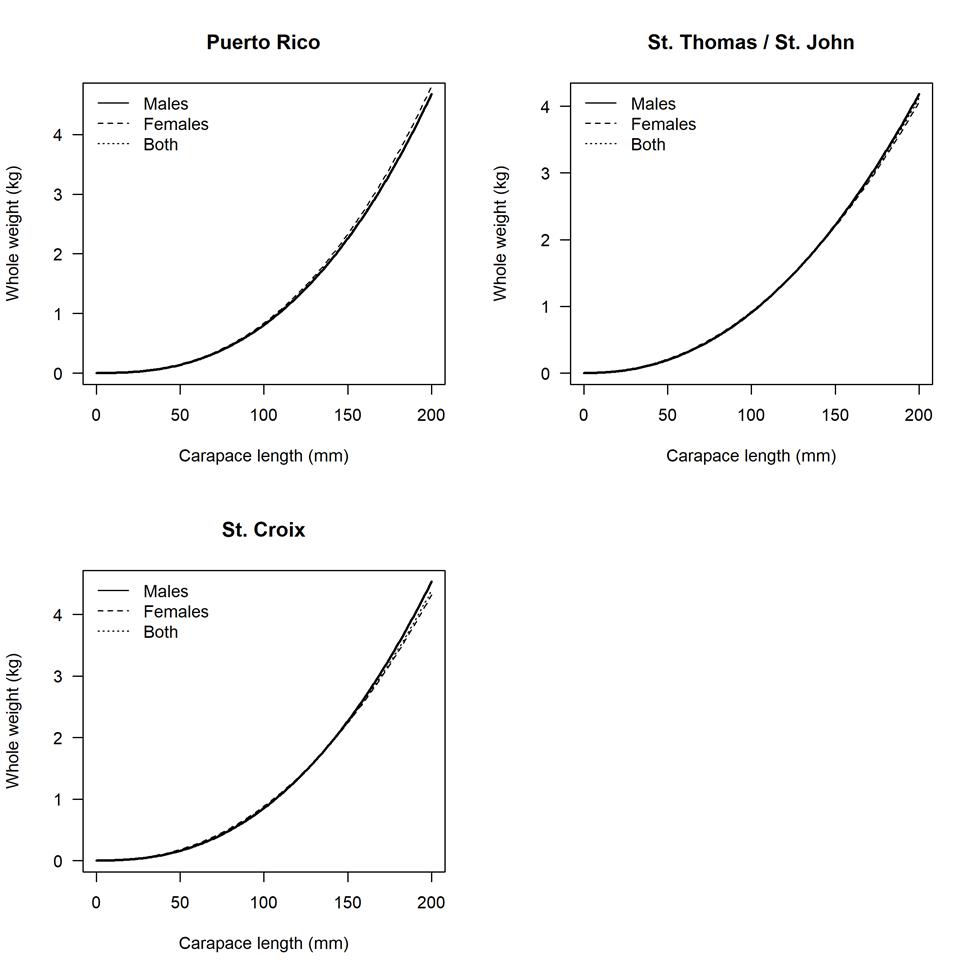
Figure 2.1 Length-weight curves for spiny lobster of Puerto Rico, St. Thomas/St. John, and St. Croix.
3. Commercial Fishery Statistics
3.1 Biological Sampling
3.1.1 Overview
The NOAA Fisheries, Southeast Fisheries Science Center Trip Interview Program (TIP) collects length and weight data from fish landed by commercial fishing vessels, along with information about fishing area and gear. Data collection began in the 1980s with frequent updates in best practices; the latest being in 2017. Data are collected by trained shore-based samplers (Beggerly et al., 2022).
3.1.2
Length Composition Sampling Intensity
The TIP data pertaining to Caribbean Spiny Lobster in Puerto Rico consists of 69,212 length observations across 7,894 unique port sampling interviews (Figure 3.1.1). Of the Caribbean spiny lobster measured, 69,065 were CL observations (99.8%). Plots and summary statistics of the currently available CL frequency data of Caribbean spiny lobster sampled from the predominant gears in Puerto Rico are included in the working paper (Godwin et al. 2024).
3.1.3 Length Distributions
A variety of fishing gears were used by Puerto Rico commercial fishers to catch Caribbean spiny lobster. A generalized linear mixed model (GLMM) was fit to TIP data to compare mean CL composition among gear types. The purpose of the analysis was to identify gear groups among the commercial fishing gears with groups based upon Caribbean spiny lobster size composition. Gears with size compositions that were not significantly different were assigned to the same gear group. The analysis identified no difference in mean size composition among gear specific size compositions and the gears with confidential data are provided in Table 3.1.1. Summary statistics produced by the GLMM analysis of the available length frequency data from 1981 to 2023 are also included in Table 3.1.1. Gear groups were identified based on GLMM analysis using a gamma-distributed dependent variable and a covariate to account for changes in mean CL over time. Random effects for interview ID and categorical year were included to account for non-independence of observations.
The aggregated density plot for all gears combined of Caribbean spiny lobster CL collected across the time series 1981-2023 are summarized in Figure 3.1.2. Aggregated density plots of Caribbean spiny lobster landed by nonconfidential gears are summarized in Figure 3.1.3.
3.1.4
Adequacy of Size Composition Data for Characterizing Catch
Due to reasonable levels of available data throughout the time series, TIP data can be considered to inform selectivity and annual population trends in the SEDAR 91 assessment. A weight-length analysis was not conducted to identify outliers in the TIP data. A cutoff of 2.5cm minimum and 25cm maximum CL was implemented to remove notable outliers in the TIP dataset (Godwin et al 2024).
Decisions:
- Consider TIP data to inform selectivity and annual population trends in the SEDAR 91 assessment.
- Compare SEAMAP-C data and data from two pilot studies (MER Consultants at sea size composition and HJR Reefscaping at sea CL composition studies) with TIP data.
- Supply complete TIP time series for use in SEDAR 91 analyses.
3.2 Commercial Landings
3.2.1
Overview
Commercial fishery landings in Puerto Rico, were obtained from self-reported fisher logbook data (Caribbean Commercial Logbook, CCL). Commercial fishery landings data for Caribbean Spiny Lobster in Puerto Rico were available for the years 1983-2023.
3.2.2 Outlier
Analysis
An outlier analysis was conducted by using a mean and standard deviation method. If the landings of Caribbean Spiny Lobster reported on a trip were greater than three standard deviations from the mean (i.e., 99.73% quantile), they were marked for removal from the dataset. Outliers were identified for each gear group across all years. Total landings with and without outliers are shown in Figure 3.2.1 and the percent change in landings with outliers removed is shown in Table 3.2.1.
Decisions:
- SEDAR 91 Panel decided to define as outliers trips with landings of 1,000 pounds or more. Reports from those trips should be investigated and if found errant, remove them from the commercial landings’ series for Puerto Rico.
- The panel recommended that the lead analyst be given the freedom to explore the assessment start year, tentatively recommending 1985. Members of the panel suggested that landings reported prior to 1985 may have included catches from outside of Puerto Rico’s EEZ
3.2.3
Adoption (partial) of Electronic Reporting Since 2020
Starting in 2020, commercial fishers have had an electronic reporting option for reporting landings on their fishing trips. According to DRNA the adoption rate of electronic reporting is estimated to be around 40%. Due to differences in variable names and other database issues, integration of those electronically reported data into the CCL, and ultimately the Accumulated Landing System (ALS), has been difficult and has necessitated many labor-intensive adjustments to integrate these to the landings datasets for each year since its adoption.
3.2.4
Expansion Factors and Calculation of Commercial Landings
Expansion factors to account for known underreporting and to better estimate commercial landings in Puerto Rico have been in use since landings data collection began in 1983. Port samplers go to a fishing landings center and record the landings of all vessels at that location.
The port sampler observed landings at each location/day are compared to the commercial logbooks with reported landings at the same location/day combination. The ratio of reported landings to observed landings, across all locations within a coast (as defined by DRNA) is the expansion factor for that coast. Expansion factors are not species specific. Expansion factors are usually smaller than 1, meaning not all landings observed by port agents are reported by the fisher:
Expansion Factor = Sum of Reported Landings/Sum of Observed Landing
The landings are then expanded by the inverse of the expansion factor (aka the expansion factor): Expansion Factor = 1/ Expansion Factor
From 1983 to 2002, one expansion factor was used for all of Puerto Rico to expand the reported commercial landings. Starting in 2003 expansion factors by coast were adopted; i.e., separate expansion factors estimated and used for North, East, South and West Coast, Figure 3.2.2 shows Municipalities of Puerto Rico. A more detailed map of the municipalities and Fishing Landings Centers is shown in Appendix 1.
Since the beginning of electronic reporting, data accessibility, and calculation of expansion factors has been challenging. To provide expansion factors for the years 2020-23 (years of electronic reporting), the mean coast specific expansion factors calculated over the years 20142019 were used to calculate the expanded landings.
3.2.5 Puerto Rico Caribbean Spiny Lobster Fishery
Commercial fishery landings in Puerto Rico were obtained from self-reported fisher logbook data (Caribbean Commercial Logbook, CCL) that are mailed or delivered to the Puerto Rico Department of Natural and Environmental Resources (DNER or DRNA in Spanish). Commercial landings were reported by species, fishing gear, and the fishing center where the catch was landed.
Commercial fishery landings data for Caribbean Spiny Lobster in Puerto Rico were available for the years 1983-2023. The gear grouping followed the recommendations of the prior Caribbean Spiny Lobster assessment and its update (SEDAR 57, 2019; SEDAR 57 Update, 2022) shown in Orhun et al. (2024) with the addition of “NETS” as separate gear group. The commercial landings were presented in pounds by year and fishing gear groups are shown in Table 3.2.2.
Decision:
- The SEDAR 91 panel decided to combine all net gears; i.e., cast net, gill net and trammel net as a separate “NETS” gear group. The panel also decided to give the lead analyst freedom to explore fleet structure in the assessment model.
3.3 Commercial Discards
Species-specific commercial discard reporting was not established in Puerto Rico for Caribbean Spiny Lobster during the period 1983-2023.
3.4 Commercial Effort
Commercial trips with reported Caribbean Spiny Lobster landings per year and gear group were compiled from 1983 to 2023 (Table 3.4.1).
Table 3.1.1 GLMM analysis summary results for Puerto Rico TIP Caribbean Spiny Lobster CL (cm) from 1981 to 2023. The column titled “group” indicates the group(s) where mean CL are not statistically different from other gears with matching group number(s). The “n” column indicates the number of unique lengths recorded for each gear. The “Percentage” column indicates the percent of the total recorded lengths for each gear. Only nonconfidential data shown.
AND TRAPS; FISH
POTS AND TRAPS; SPINY LOBSTER
Table 3.2.1 Comparison expanded landings before and after outlier removal of commercial landings of Caribbean Spiny Lobster in pounds for Puerto Rico.
Table 3.2.2 Commercial landings of Caribbean Spiny Lobster in pounds by gear group that reported Caribbean Spiny Lobster landings in Puerto Rico. ‘Expanded Lbs’ are the total landings of Caribbean Spiny Lobster in pounds estimated by applying the expansion factors. *Data are not confidential.
Table 3.4.1 Number of commercial trips reported by gear group that included Caribbean Spiny Lobster landings in Puerto Rico. *Data are not confidential.
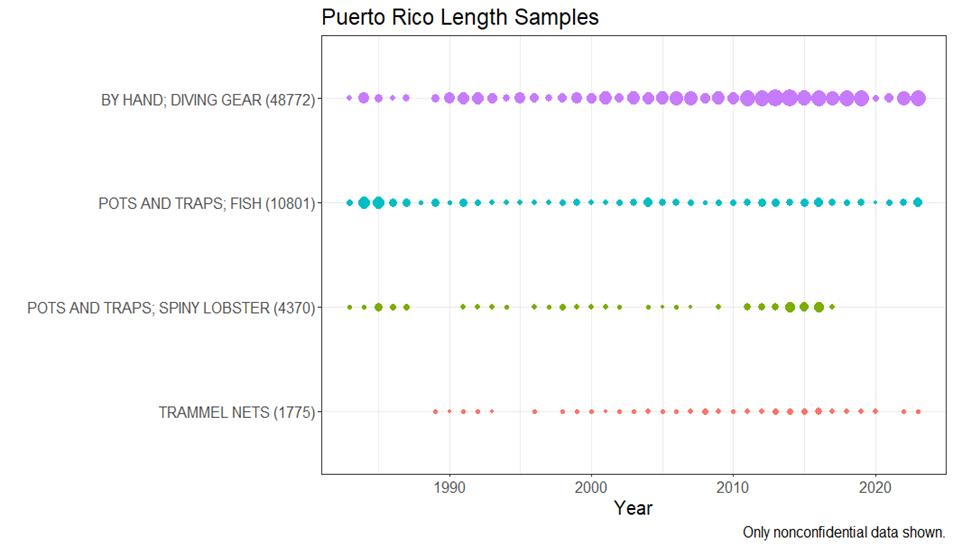
Figure 3.1.1 Plot showing relative number of Caribbean Spiny Lobster CL in Puerto Rico across time collected. Each point is color specific to the gear it represents. Gears are arranged from most to least abundant.
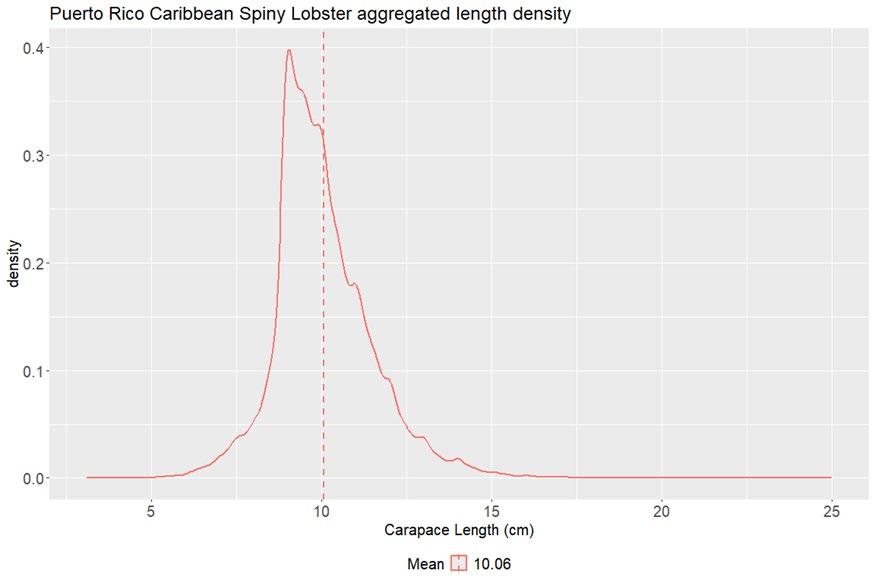
Figure 3.1.2 Aggregated density plot of cephalothorax lengths (cm) of Caribbean Spiny Lobster in Puerto Rico, all gears combined. Dotted line represents mean CL.
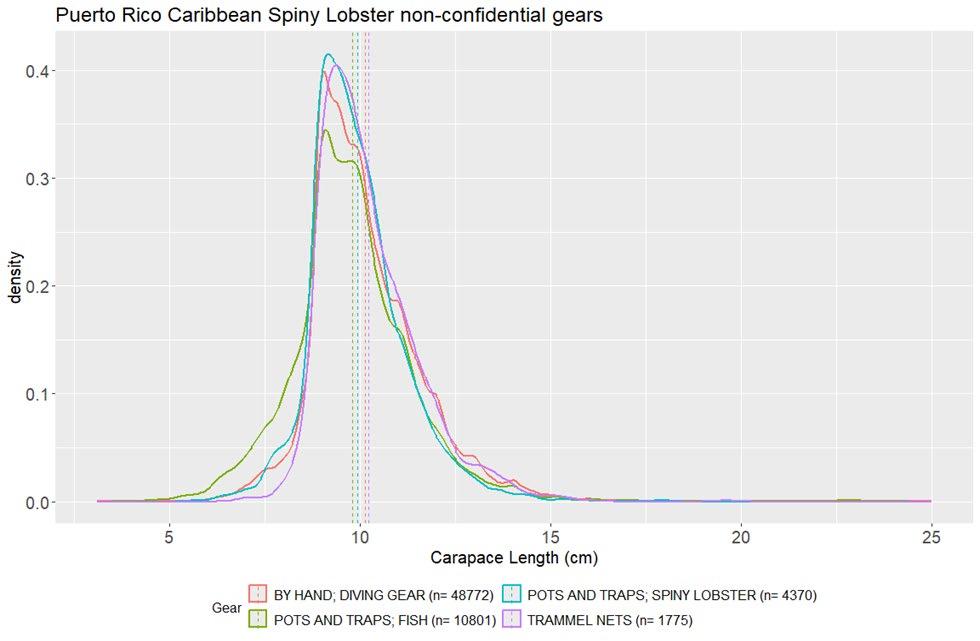
Figure 3.1.3 Aggregated density plot of cephalothorax length (cm) of nonconfidential gears recorded for Caribbean Spiny Lobster in Puerto Rico from 1981 to 2023. Dotted line represents mean CL. Mean lengths can be found in Table 3.1.1.
Figure 3.2.1 Commercial landings (pounds) of Caribbean Spiny Lobster of Puerto Rico with and without the outliers removed.
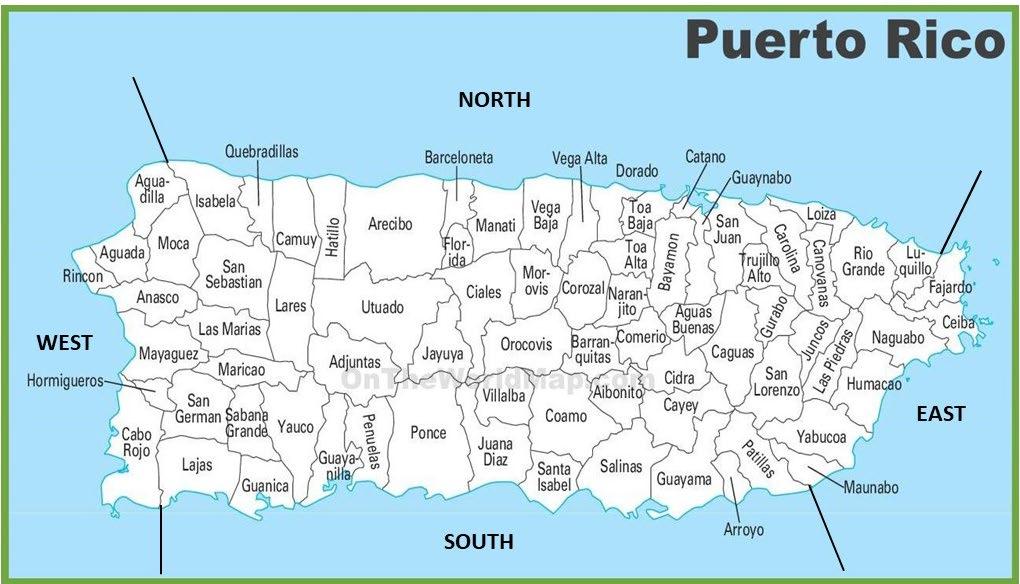
Figure 3.2.2 Map of the Municipalities of Puerto Rico.
4. Recreational Fishery Statistics
There are currently no data available on recreational landings in Puerto Rico
5. Measures of Population Abundance
5.1 Overview
The panel was presented with a summary of the fishery-independent research conducted by SEAMAP-C during 2021-2023 (RD-12). Concerns were raised about using the data for an index of relative abundance, principally due to short time series and unequal sample sizes among years. The panel recommended that the data not be considered for use as an index of relative abundance in the PR assessment model, but noted that the CL composition data from all three years were substantive and warrant consideration for model-fitting.
Concerning fishery-dependent information, rising landings and decreasing or flat effort trends in the self-reported commercial logbook data demonstrated potential signs of hyperstability in catch-per-unit-effort. Members of the panel noted that the number of trips is likely not the best measure of effort for trap fisheries, for which effort is best measured in number of traps, for trips reporting that gear. The panel discussed possible alternative explanations for the patterns in landings and effort, including years of potentially high recruitment. The panel discussed the feasibility of standardizing a fishery-dependent index of relative abundance using the landings divided by the number of traps. However, the panel agreed that although there may be consistent trap effort reporting in logbooks, there is no such means for dive fisheries or nets, and the mechanism(s) that would explain the trend are not likely to be discernable, even though standardization.
Decision:
- No data were recommended for use in constructing an index of abundance for spiny lobsters in Puerto Rico.
6. Research Recommendations
- When developing new research projects, consider how those projects can be designed to include data collection and/or analyses that would inform ecosystem models and analyses. The original objectives of the project should not be compromised, however.
6.1 Life History Research Recommendation
- Life history studies focused on the US Caribbean – generate region-specific parameters for growth, fecundity, natural mortality.
- Look for ongoing growth/aging work via SEAMAP-C and DNER who is involved in doing histology for reproductive analyses.
- Merge selectivity studies, life history data collection, and fishery-independent survey frameworks to determine how to get best data for stock assessment.
6.2 Commercial Fishery Statistics
6.2.1 Length Composition Research Recommendations
- Compare SEAMAP-C, HJR Reefscaping, and MER Consultants CL composition to TIP size composition.
6.1.1 Commercial Landings Research Recommendations
- Track number of fishers/year in relation to annual landings- how does it vary?
- Support connectivity studies – consider spiny lobster as one stock vs. by island (metapopulation).
- Investigate weak/lack of correlation between TIP and landings data
- Demand analysis: look at price per pound (survey), market preferences, trends and correlation with landings, and for all islands.
- Investigate species associations with spiny lobster.
- Investigate recruitment connectivity between island platforms; e.g., STX seeding PR and other “hypotheses”.
- Increase funding for port samplers to improve TIP data collection in PR.
- Increase IT support for automated expansion factors calculation for the landings.
6.2.3 Discards and Discard Mortality Research Recommendations
- Discard information in the catch reports does not allow data on length or sex in current reporting schema.
6.3 Indices Research Recommendations
- There were no recommendations from the panel regarding use of fishery-independent data in the Puerto Rico assessment model. However, the panel recommended that analysts not explore standardization of fishery-dependent data for use as an index of relative abundance
7. Literature Cited
Babcock, E.A., W.J. Harford, R. Coleman, J. Gibson, J. Maaz, J.R. Foley, and M. Gongora. (2014) Bayesian depletion model estimates of spiny lobster abundance at two marine protected areas in Belize with or without in-season recruitment. ICES Journal of Marine Science: fsu226.
Beggerly, Sara, Molly Stevens, and Heather Baertlein. 2022. “Trip Interview Program Metadata.” North Charleston, SC.
Bliss, D. 1982. Shrimps, Lobsters and Crabs . New Century Publishers, Piscataway, New Jersey. 242 pp.
Butler, M.J,, Mojica, A.M,, Sosa-Cordero, E,, Millet, M,, Sanchez-Navarro, P,, Maldonado, M.A,, Posada, J,, Rodriguez, B,, Rivas, C.M,, Oviedo, A,, Arrone, M,, Prada, M,, Bach, N,, Jimenez, N,, Garcia Rivas, M,, Forhan, K,, Behringer, D.C. Jr,, Matthews, T,, Paris, C. Cowen, R. 2010. Patterns of Spiny Lobster (Panulirus argus) Postlarval Recruitment in the Caribbean: A CRTR Project. -In: 62 Proceedings of the Sixty-Second Annual Gulf and Caribbean Fisheries Institute. pp. 360-369. Cumana Venezuela, November, 2009 CFMC. 1981. Draft Environmental Impact Statement/ Fishery Management Plan and Regulatory Analysis for the Spiny Lobster Fishery of Puerto Rico and the U.S. Virgin Islands. Caribbean Fishery Management Council. 7-15p.
Chen, Y., Jackson, D.A. and Harvey H.H. 1992. A comparison of von Bertalanffy and polynomial functions in modeling fish growth. CFFAS 49:1228-1235.
Cruz, R., R. Coyula and A.T. Ramirez. 1981. “Crecimiento y mortalidad de la langosta Espinosa (Panulirus argus) en la Plataforma suroccidental de Cuba. Rev. Cub. Inst. Pesq., 6(4): 89-119.
Die, D. Maturity of spiny lobsters in the US Caribbean. Caribbean Southeast Data Assessment Review Workshop Report SEDAR-RW-03. FAO. 2001. Report on the FAO/DANIDA/CFRAMP/WECAFC Regional Workshops on the Assessment of the Caribbean Spiny Lobster (Panulirus argus). Belize City, Belize, 21 April-2 May 1997 and Merida, Yucatan, Mexico, 1-12 June 1998. FAO Fisheries Report. No. 619. Rome, FAO. 2001. 381p.
Godwin, K., A. Rios. 2024. SEDAR 91 Trip Interview Program (TIP) Size Composition Analysis of Caribbean Spiny Lobster (Panulirus argus) in Puerto Rico, US Caribbean, 1981-2023. SEDAR-91-DW-04. 8pp.
Goedeke, T. L. , A. Orthmeyer, P. Edwards, M. K. Dillard, M. Gorstein, and C. F. G. Jeffrey. 2016. Characterizing Participation in Non- Commercial Fishing and other Shore-based Recreational Activities on St. Croix, U.S. Virgin Islands. NOAA Technical Memorandum NOS NCCOS 209. Silver Spring, MD. 93 pp.
Gongora, M. 2010. Assessment of the spiny lobster (Panulirus argus) of Belize based on fishery dependent data. Belize Fisheries Department, P.O. Box 148, Princess Margaret Drive, Belize City, Belize.
Kanciruk, P. and W. F. Herrnkind. 1976. Autumnal Reproduction In Panulirus argus at Bimini, Bahamas. Bulletin of Marine Science. 26: 417-432
Leon, M.E., R. Puga, and R. Cruz. 1995. Intensidad de pesca con refugios artificiales (pesqueros) y trampas (jaulones) sobre el recurso langosta (Panulirus argus) en el sur de Cuba. Rev. Cub. Inv. Pesq. 19(2): 22- 26.
Leon, M.E., J.L. Martinez, D.L. Cota, S.H. Vazquez, and R. Puga. 2005. Decadal variability in growth of the Caribbean spiny lobster Panulirus argus (Decapoda: Paniluridae) in Cuban waters. Revista de Biologia Tropical 53 (3−4): 475−486.
Mateo, I. 2004. Population dynamics for spiny lobster Panulirus argus in Puerto Rico: a progress report. Proceedings of the 55th Gulf and Caribbean Fisheries Institute.
Medina Martinez, A. (2024). Determining the age-size relationship of Panulirus argus in the southwest area of Puerto Rico. [SEDAR91-RD-03].
Medley, P.A.H. and C.H. Ninnes. 1997. A recruitment index and population model for spiny lobster (Panulirus argus) using catch and effort data. Canadian Journal of Fisheries and Aquatic Sciences 54: 1414-1421.
Munro, J. 1974. “The biology, ecology, exploitation and management of Caribbean reef fishes. Part VI – Crustaceans (Spiny lobsters and crabs). Univ. West Indies Zool. Dept. Res. Rept. 3: 1-57.
Olsen, D.A. and I.G. Koblic. 1975. Population dynamics, ecology, and behavior of spiny lobsters, Panulirus argus of St. John, U.S.V.I. Growth and Mortality. Bull. Nat. Hist. Mus. L.A. County, (20): 17-22.
Olsen, D.A., Nowlis, J., Bryan D. 2017. A study of the Virgin Islands spiny lobster fishery: growth, population size and mortality. Proceedings of the 66th Gulf and Caribbean Fisheries Institute.
Orhun, M. Refik, Katherine Godwin, Kim Johnson and Stephanie Martínez Rivera. 2024. SEDAR 91 Commercial Landings of Caribbean Spiny Lobster (Panulirus argus, Panulirus guttatus) in Puerto Rico, US Caribbean, 1983-2023. SEDAR91-DW-07. SEDAR, North Charleston, SC. 23 pp.
Phillips, B. F., J. S. Cobb, and R. W. George. 1980. “General Biology.” – In: The Biology and Management of Lobsters, Vol. I: Physiology and Behavior, pp 1639. J.S. Cobb and B.F. Phillips, Eds. New York: Academic Press.
Quinn TJ, Deriso RB (1999) Quantitative fish dynamics. Oxford University Press, New York, NY
R Development Core Team (2012) R: a language and environment for statistical computing. R Foundation for Statistical Computing, Vienna
Saul, S. 2004. A Review of the Literature and Life History Study of the Caribbean Spiny Lobster, Panulirus argus. Caribbean Southeast Data Assessment Review Workshop Report SEDAR-DW-05.
SEDAR 2005. Southeast Data, Assessment, and Review Stock Assessment Report of SEDAR 8 Caribbean Spiny Lobster. Charleston, SC.
SEDAR 2016. Southeast Data, Assessment, and Review Stock Assessment Report of SEDAR 46 Caribbean Data-Limited Species. North Charleston, SC.
SEDAR 57. 2019. “SEDAR 57 Stock Assessment Report U.S. Caribbean Spiny Lobster.” North Charleston SC. http://sedarweb.org/sedar-57. SEDAR, North Charleston, SC. 232 pp.
SEDAR 57 Update. 2022. “SEDAR 57 Stock Assessment Update St. Thomas and St. John Caribbean Spiny Lobster.” SEDAR, North Charleston, SC. 13 pp.
Valle-Esquival, M, and G. Díaz, G. 2004. An Update on the Reported Landings, Expansion Factors and Expanded Landings for the Commercial Fisheries of the United States Virgin Islands (with Emphasis on Spiny Lobster and the Snapper Complex).
NOAA/NMFS/SEFSC Miami Laboratory SFD-2004/051 (SEDAR-8-DW-09). 48pp.
Valle-esquivel, M., and R. J. Trumble. 2016. Pilot Study of the Recreational Queen Conch (Strombus gigas) and Spiny Lobster (Panulirus argus) Fishery in Puerto Rico for the Gulf States Marine Fisheries Commission. MRAG Americas, Inc. 136 pp.
Velazquez-Abunader, I., Gomez-Munoz, V.M., Salas, S., Ruiz-Velazco, J.M.J. 2015. Intercohort growth for three tropical resources: tilapia, octopus, and lobster. Rev. Biol. Trop. 63:617627.
Appendix – Fishing Landing Center Naming Conventions
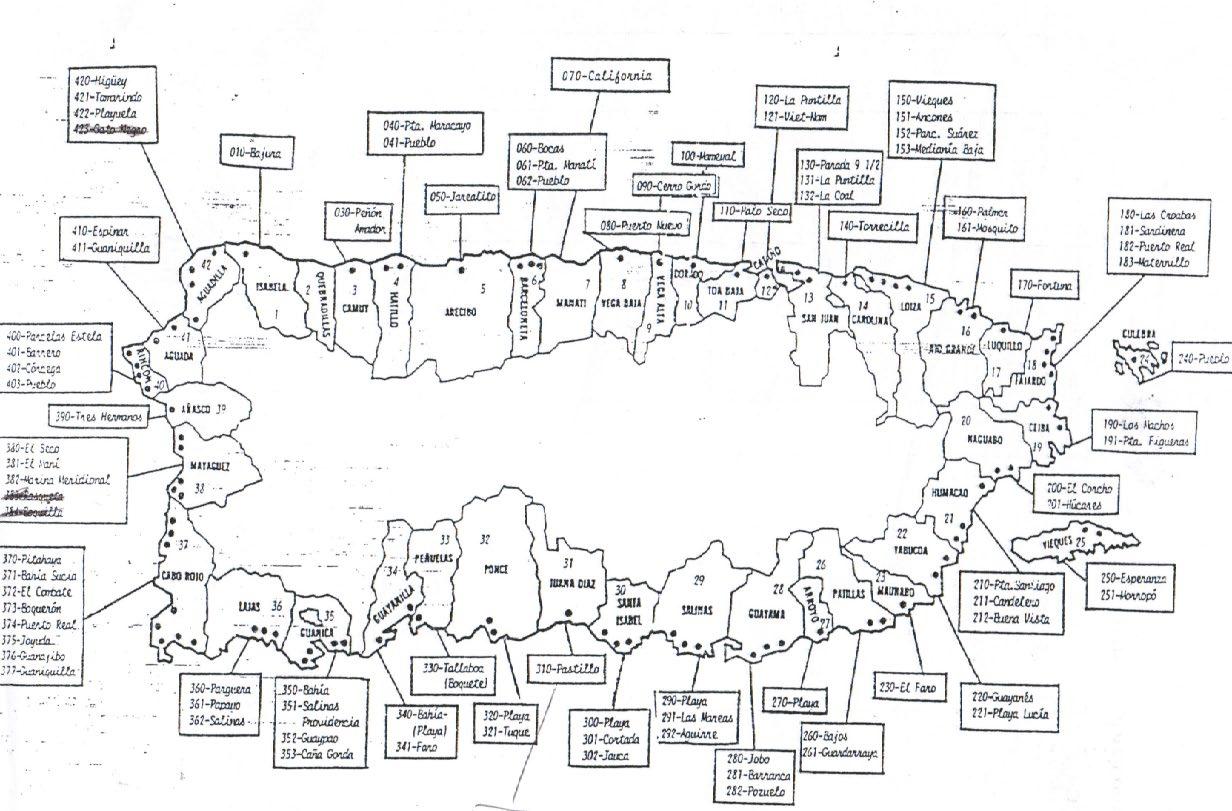
Figure Appendix 1. Map of Fishing Landing Centers in the Municipalities of Puerto Rico.

SEDAR
US Caribbean Spiny Lobster
Puerto Rico
SECTION III: Assessment Process Report
August 2025
SEDAR
4055 Faber Place Drive, Suite 201 North Charleston, SC 29405
This information is distributed solely for the purpose of peer review. It does not represent and should not be construed to represent any agency determination or policy.
1. EXECUTIVE SUMMARY
The SEDAR 91 Puerto Rico spiny lobster (Panulirus argus) stock assessment workshop consisted of four webinars between January 2025 and April 2025. The data available for the assessment included:
• An annual species-specific catch time series from commercial logbooks
• Fishery-dependent length compositions from commercial port sampling
• Fishery-independent length compositions obtained during 2021-2023 from the Puerto Rico SEAMAP-C dive survey program, and obtained during 2021-2022 from the HJR Reefscaping lobster trap survey
• Life history information carried over from the SEDAR 57 and SEDAR 57 update assessments
The assessment used Stock Synthesis, a statistical catch-at-age model (Methot et al., 2020). Stock Synthesis V3.30.12 models were fit to annual catch time series and annual length composition information for two fleets: dive and trap/pot fisheries and two sexes: females and males. Model development included stepwise fitting to catch and length composition; i.e., catch and then catch and length models were built, to ensure an analytical understanding of data impacts on model results. Model development included four models comprising the initial stages of development and the establishment of a single base model, and seven sensitivity analyses (Table 8.1; 12 models total). The selectivity analyses included: 1) each fleet selectivity was assigned a logistic (“flat-topped”) pattern, which was fixed or 2) estimable; 3) the Beverton-Holt stock-recruitment steepness parameter was fixed at 0.8; 4) the initial equilibrium catch for each fleet was set using the lowest and 5) the highest catch multiplier identified from the likelihood profile; 6) the coefficient of variation for the initial equilibrium catch was set to 0.3; and 7) growth and length-weight parameters for male and female lobster were fixed to male parameter values to approximate a single, combined sex model.
Model diagnostics assessed convergence, fit, and consistency using gradients, residuals, likelihood profiles, hindcast cross-validation, and jitter analyses. Those diagnostics indicated that the models were stable and converged on a global solution. Likelihood profiles suggested initial equilibrium catches for each fleet that were higher than the geometric mean calculated over landings values during 1985-1987. The minimum catch-multiplier value identified from the likelihood profiles was used in the base model. Model diagnostics are visually reported for the base model only for conciseness.
Sensitivity analyses for selectivity determined that fleet selectivity is dome-shaped for both dive and trap/pot fisheries. Initializing exponential logistic selectivity models with flattopped selectivity patterns and allowing the model to estimate selectivity parameters resulted in the same dome-shaped selectivity patterns estimated when selectivity models were initialized as dome-shaped. This suggests that the length composition information can inform fleet selectivity parameter estimation. The sensitivity analysis of steepness indicated that the steepness parameter affects the magnitude of estimated biomass, but the parameter itself is not likely to be well-estimated given the data limitations. The sensitivity analysis in which size dimorphism was eliminated suggested that the stock is unexploited with extreme uncertainty bounds; this demonstrates the need for quantifying size dimorphism in Puerto Rico spiny lobster population dynamics. The sensitivity analysis of length-weight relationship parameters indicated that the Puerto Rico-specific parameters do not produce radically different population dynamics than those estimated for the US Caribbean region. Sensitivity analyses of initial equilibrium catch assumptions demonstrated the models’ general sensitivity to initialization and the effects on stock status in the terminal year.
1.1 Background
US Caribbean spiny lobster (Panulirus argus) is a marine invertebrate that inhabits pelagic, nearshore vegetation, and coral reef habitats throughout its life history. Spiny lobsters inhabit the southeast US coast, Gulf of America, and greater Caribbean region. The Puerto Rico fishery targets adult spiny lobster on reef habitats.
2 INTRODUCTION
2.1 Workshop Time and Place
The SEDAR 91 Assessment Workshop was held via webinars from January to April 2025
2.2 Terms of Reference
Assessment Process Terms of Reference
1. Develop and apply assessment tools that are compatible with available data and consistent with standard practices. Document input data, model assumptions and configuration, and equations for each approach considered.
2. Characterize uncertainty in the assessment and estimated values.
a. Consider uncertainty in input data, modeling approach, and model configuration.
b. Provide appropriate measures of model performance, reliability, and ‘goodness of fit’.
c. Provide measures of uncertainty for estimated parameters and derived quantities such as biological reference points and stock status if feasible.
3. To the extent possible given data limitations, provide management benchmarks and status determination criteria, including:
a. Maximum Fishing Mortality Threshold (MFMT) = F MSY or proxy
b. MSY proxy = yield at MFMT
c. Minimum Stock Size Threshold (MSST) = SSB MSY or proxy
d. If alternative status determination criteria are recommended, provide a description of their use and a justification.
4. To the extent possible, develop projections to support estimates of maximum sustainable yield (MSY, the overfishing limit (OFL) and acceptable biological catch (ABC) as described below. If projections are not possible, and alternative management procedures are recommended, provide a description of their use and a justification.
a. Unless otherwise recommended, use the geometric mean of the three previous years’ fishing mortality to determine F Current
b. Project F MSY or proxy
c. If the stock is overfished:
i. Project F 0
ii. Project F Rebuild
5. Provide recommendations for future research and data collection.
6. Provide an Assessment Workshop Report to address these Terms of reference and fully document the input data and results.
2.3 List of Participants
Assessment Panel
Matt Damiano (Lead Analyst) ............................................................................... NMFS/SEFSC
Kevin McCarthy NMFS/SEFSC
Erik Williams NMFS/SEFSC
Jason Cope............................................................................................................. NMFS/NWFSC
Appointed Observers
Nelson Crespo ....................................................................................... CFMC Industry Rep
Julian Magras ........................................................................................ CFMC Industry Rep
Gerson Martinez.................................................................................... CFMC Industry Rep
Observers
Adyan Rios NMFS/SEFSC
Juan Agar.................................................................................................................. NMFS/SEFSC
Mandy Karnauskas ................................................................................................. NMFS/SEFSC
Maria Lopez-Mercer ............................................................................................... NMFS/SEFSC
Stephanie Martinez NMFS/SEFSC
Sarah Stephenson .................................................................................................... NMFS/SEFSC
Katherine Godwin ...................................................................................................... UM-CIMAS
Rachel Banton UM-CIMAS
Sarah Beggerly NMFS/SEFSC
M. Refik Orhun ........................................................................................................ NMFS/SEFSC
Sennai Habtes ............................................................................................................ USVI DPNR
Maggie Rios USVI DPNR
J.J. Cruz-Motta CFMC SSC, UPRM
Hannah Jacobs .......................................................................................................................... UM
Manuel Coffill-Rivera ............................................................................ University of South AL
Veronica Seda Matos PR DNER
Aida Rosario ...................................................................................................................PR DNER
Daniel Matos-Caraballo ................................................................................................PR DNER
Wilson Santiago Soler ..................................................................................PR Fisheries Liaison
Cristina Olan CFMC Staff
Staff
Emily Ott SEDAR
Julie A. Neer SEDAR
Graciela Garcia-Moliner ............................................................................................ CFMC Staff
2.4 List of Assessment Process Working Papers and Reference Documents Document # Title Authors Date Submitted
Documents Prepared for the Assessment Process
SEDAR91-AP01 Summary of Management Actions for Caribbean Spiny Lobster 19852023 Gaitlyn Malone 31 January 2025
Reference Documents
SEDAR91-RD14 Catch curve stock-reduction analysis: an alternative solution to James Thorson, Jason Cope
the catch equations
SEDAR91-RD15 Accounting for variable recruitment and fishing mortality in lengthbased stock assessments for datalimited fisheries
SEDAR91-RD16 A 50-Year Reconstruction of Fisheries Catch in Puerto Rico
SEDAR91-RD17 Final stock assessment and fishery evaluation (SAFE) report for the workshop on spiny lobster resources in the U.S. Caribbean San Juan, Puerto Rico, September 11-13, 1990
SEDAR91-RD18 Reflections of the way life used to be: Anthropology, History and the Decline of the Fish Stocks in Puerto Rico
2.5 Stock Structure and Management Unit
Merill Rudd, James Thorson
Richard Appeldoorn, Isle Sanders, Leonie Farber
James Bohnsack, Stephen Meyeres, Richard Appeldoorn, Jim Beets, Daniel Matos, To
Manuel Valdés-Pizzini
Puerto Rico spiny lobster is managed under the Puerto Rico Fishery Management Plan (Crabtree, 2019). In 2023, the Caribbean Fisheries Management Council transitioned from species-based to island-based fisheries management (Figure 9.1). The management measures in the new island-based fishery management plans became effective on October 13, 2022.
The Puerto Rico spiny lobster stock is managed as an independent population. Catch limits for Puerto Rico spiny lobster are based on a tiered acceptable biological catch (ABC) control rule; it is currently managed under Tier 3: acceptable assessment available, using the models developed during SEDAR 57 (2019) and SEDAR 57 update (2022) processes. The most recent annual catch limit (ACL) is 357,629 lbs., whole weight.
A SEDAR 91 Assessment Process working paper summarizes federal management actions for spiny lobster in Puerto Rico (Malone, 2025). On January 1, 1985, a 3.5-inch federal size limit was instituted as part of the original fishery management plan. The size limit applies to the U.S. Exclusive Economic Zone (EEZ) surrounding Puerto Rico, which is defined as the federal waters ranging from 9 to 200 nautical miles (nm) (16.7 – 370 kilometers [km]) from the nearest coastline point of Puerto Rico (Figure 9.1).
3 DATA INPUT AND MODEL CONFIGURATIONS
3.1 Data-Informed Modeling Decisions
The data available for use in the current assessment are documented in the SEDAR 91 US Caribbean spiny lobster Puerto Rico Data Workshop Report (SEDAR, 2025). Provided here is a summary of those data with a focus on the associated model configurations explored using SS3. Throughout this report, bolded text is used to highlight and summarize the model settings and configurations relevant to the various phases of model development. Additional details for each data input are available in their respective references:
1. Landings from self-reported commercial fisher logbooks (Orhun et al., 2024)
2. Length compositions from shore-based port sampling (Godwin and Rios., 2024)
3. Length compositions from the SEAMAP-C dive survey conducted in southwest Puerto Rico waters (Cruz Motta 2024)
4. Length compositions from HJR Reefscaping lobster trap survey conducted throughout Puerto Rico waters (Scharer et al. 2023)
Based on the available data, the assessment was configured with one area, one season, two sexes, two commercial fleets, and two survey fleets.
3.2. Commercial Fleet Data
3.2.1
Catch and Initial Equilibrium Catch Assumptions
Commercial fishery landings in Puerto Rico (PR) were obtained from self-reported fisher logbook data (Caribbean Commercial Logbook, CCL) (Orhun et al. 2024).
Commercial fishery landings data for Caribbean spiny lobster in PR were available for the years 1983-2023 (Figures 9.2 and 9.3).
Potential outliers were discussed during the Data Workshop and the decision was made to remove them prior to building the stock assessment models. See the PR Data Workshop Report for a description of the outlier analysis (SEDAR, 2025).
During the Data Workshop process, concerns were expressed over whether landings in PR made prior to 1985 consisted solely of lobsters caught within PR’s EEZ. Data Workshop panelists had recommended that the lead analyst be granted the flexibility to explore the start year of the model, with 1985 as the recommended start year. Due to known general sensitivity of statistical catch-at-age models to initial equilibrium catch assumptions, members of the Assessment Panel recommended that the analyst attempt a catch reconstruction to avoid the need for said assumptions.
A historical catch reconstruction was attempted based on the percentage of total PR catches during 1950-1984 that were shellfish and the percentage of shellfish that were spiny lobster derived by Appeldoorn et al. (2015), and the percentage of landings by pot/trap and
dive gear prior to 1985 that were identified by Bohnsack et al. (1990). Ultimately, the reconstruction was not possible due to the confounding of catches from other Caribbean island waters with those from PR’s EEZ prior to 1985 (Valdés-Pizzini et al. 2008).
Therefore, although the years of the available species-specific self-reported commercial fisher logbook landings and effort data included 1983-2023, the start and end years of the model were 1985 and 2023, respectively.
In the SEDAR 91 SS3 models, the catch was input as biomass (in metric tons) and was treated as if it occurred over an entire fishing season; i.e., each fishing year (Figure 9.2). Catches are assumed to be approximately known with a standard error of 0.01 for each fleet.
Fishing for spiny lobster by PR has occurred since at least the 1950s (Valdes-Pizzini 2008, Appeldoorn et al. 2015). In SEDAR 57, the initial equilibrium catch prior to 1983 was assumed to be 200 metric tons (mt); the pot/trap fishery was still in the early stages of development during the early 1980s, and the 200 mt was associated with the dive fleet, which was the only fleet for which an initial fishing mortality (F) was estimated (SEDAR 2019). Given the small magnitude of pot/trap landings at the time, this was a reasonable assumption. The init model configuration maintains this assumption (Table 8.1), but it became clear that this was no longer appropriate because the magnitude of pot/trap landings had increased substantially by 1985. In order to address this, the initial equilibrium catch was set to the geometric mean of each fleet’s respective catches during 1985-1987 and an initial F was estimated for each fleet (see 2Finit model configuration in Table 8.1).
Likelihood profiling of equilibrium catch (Figure 9.25) suggested that the global solution was somewhat larger than the combined geometric means. Therefore, the initial equilibrium catch was calculated by multiplying the geometric mean catches during 1985-1987 for each fleet by a catch multiplier such that their combination was equal to the global solution, and a separate initial F was estimated for the pot/trap and dive fleets, respectively.
Three sensitivities were conducted to explore the effect of alternative equilibrium catch assumptions. The first sensitivity set the initial equilibrium catch to the lowest value in the likelihood profile (see section 4.10; the second sensitivity set the initial equilibrium catch to the highest value in the likelihood profile; and the third sensitivity set the coefficient of variation for initial equilibrium catch to 0.3.
3.2.2 Size Composition, Quantile Analyses, and Gear Selectivity
Gear-specific annual length frequencies for the commercial fleet came from the commercial shore-based port-sampling Trip Interview Program (Godwin and Rios, 2024). The Puerto Rico Department of Natural Environmental Resources (PR DRNA), as part of the Trip Interview Program (TIP), collects length and weight data from fish landed by commercial fishing vessels, along with information about fishing areas and gears. Data collection began in the 1980s and are available for PR spiny lobster during 1981-2023 (Figure 9.3). The relative model weighting of each commercial fleet’s length compositions was based on the number of trips sampled
From 1981 - 2023, the TIP data contain 69,065 length observations across 7,894 unique port sampling interviews.
The TIP length compositions of the commercial fleets were assumed to be representative of the total catch. Although non-commercial fishing is reported to occur, it is assumed to be constant over time such the former assumption can hold.
An analysis of the length composition median quantiles was conducted for each fleet by sex to determine the relative estimability of fishing mortality and recruitment deviations (Figures 9.4:9.7). Median 10th, 25th, 50th, 75th, and 90th quantiles were calculated for female and male lobster each year for each commercial fleet. Median quantiles in the dive fishery over time are center consistently around the average size of spiny lobster with little to no trend for females and males (Figures 9.4, 9.5). Additionally, the shrinking of quantiles around 1999 follows the increased enforcement of the minimum size limit (Figures 9.4, 9.5). There is more of a pattern in the quantiles of the pot/trap TIP data for both females (Figure 9.6) and males (Figure 9.7). Similar to the dive fleet, the quantiles contract around the year 2000 due to increased enforcement of the minimum size limit (Figures 9.6, 9.7). The spike in female quantiles in 2008 (Figure 9.6) reflects a data point that was removed during SEDAR 57 (2019) and is not included in model-fitting. The contraction of quantiles in 2020 (Figures 9.6 and 9.7) was likely due to low TIP sampling effort resulting from the COVID-19 pandemic. Despite some limited contrast in the data, annual recruitment deviations are unlikely to be estimable. Median quantile analyses for both fleets suggest that fishing has not had an effect on the overall size structure of the population.
An exponential logistic function (Equation 1, Methot et al. 2020) was used to model the relative vulnerability of capture by length for the dive and pot/trap fleets (Figure 9.8):
The three-parameter exponential logistic function can be used to model both dome and logistic and flat-topped selectivity patterns. Additionally, a fixed time-varying knife-edged retention function was included to model the minimum-size limit and retention of male spiny lobsters in both the dive and pot/trap fisheries this model assumes that discarding of under-sized lobster occurs following the heavy enforcement of the size limit (1999-2000), but that no mortality from discarding occurs (Figure 9.9, 9.10).
SEAMAP-C length composition data were obtained by divers targeting all sizes of lobster off the Southwest coast of PR during 2021-2023 (Cruz Motta et al. 2024). A total of 558 unique length observations were recorded. Sampling occurred in all months during 2022 and some months during late 2021 and early 2023. Based on the recommendations from the Assessment Panel, all samples were aggregated into 2022 for model-fitting.
Due to the lack of selectivity information for SEAMAP-C, an exponential logistic function was used to model the relative vulnerability of capture by length for the SEAMAP-C survey with selectivity parameters estimated within the model. Selectivity parameters were initialized at the same values as the dive fleet.
HJR Reefscaping length composition data were obtained by licensed fishers participating in a pot/trap survey targeting lobsters 50-89 millimeters carapace length, and conducted as part of a cooperative research program with the Southeast Fisheries Science Center during 2021-2022 (Scharer et al. 2023). A total of 808 samples were collected from the Southwest, East and Northeast waters of PR, and the majority of sampling occurred during January – September, 2022. Based on the recommendations of the Assessment Panel, all samples were aggregated into 2022 for model-fitting.
Due to the lack of selectivity information for the HJR survey, an exponential logistic function was used to model the relative vulnerability of capture by length for the HJR Reefscaping survey with selectivity parameters estimated within the model. Selectivity parameters were initialized at the same values as the pot/trap fleet.
3.3 Life History Data
The life history data used in the assessment included an island-specific length-weight conversion estimated from 22,980 length-weight observations in the TIP data. No other empirical life history
information was used in the model. See the PR Data Workshop Report for additional detail. Based on the available information, the spiny lobster population was modeled from age 0 through age 15, which was treated as a plus group, and from 5 to 250-millimeters (mm) carapace length. Note that only lobsters 51 mm or larger were observed in the TIP data. Note that SS3 assumes that inputs are in centimeters. However, if length data and life history relationships are input and parameterized using millimeters, SS3 will produce consistent results. This was the approach in both SEDAR 57 and the 2022 update (SEDAR 2019, 2022). Also note that length-related SS3 outputs will automatically generate figures with centimeter units, but for the purposes of this assessment, it should be interpreted in millimeters.
3.3.1 Growth
The SS3 growth formulation requires five parameters:
1. Length at the youngest age
2. Length at the maximum age
3. Von Bertalanffy growth parameter (K)
4. Coefficient of variation at the youngest age
5. Coefficient of variation at the maximum age
Based on feedback from the Data Workshop, growth model parameters were carried over from SEDAR 57 with no recommended changes. Von Bertalanffy growth function parameters were sex-specific and assumed fixed. Length at the youngest age was fixed at 5 mm for both males and females, and the length at the maximum age was fixed at 155 and 184 mm, respectively. K was fixed at 0.22 and 0.24 for males and females, respectively. The coefficient of variation at the youngest age was set to 0.1, and oldest age at 0.043 for both males and females. These parameters remain unchanged from SEDAR 57 (2019). Note that the length at maximum age for each sex is treated as an average by the model; larger lobsters have been observed in the data and can be estimated by the model.
The Assessment Panel expressed some concerns about the need for sex-specific growth parameters in the model. Therefore, a sensitivity was conducted in which all five growth parameters for female and male lobster were fixed at the male parameter values, and length-weight parameters for each sex were fixed to male parameter values: this forces the model to assume that there is no size dimorphism in the population dynamics, and that the male growth pattern represents all growth processes.
3.3.2
Length-Weight Conversion
The relationship between weight in kilograms and carapace length in millimeters was estimated using a linear regression on the log-transformed exponential equation fit to the TIP data. The original length-weight relationship for males was W = 6.8 x 10⁻⁵ * L2.54, and was W = 7.6 x 10⁻⁵ millimeters. * L2.52 for females with weight (W) in kilograms and length (L) in millimeters.
During SEDAR 91 model development, it was discovered that the PR models in SEDAR 57 and the update assessment had been parameterized with the lengthweight relationship parameters estimated for St. Croix. Additionally, because the PR length-weight relationship had been calculated from TIP data that include samples taken prior to 1985 (SEDAR 2025), new length-weight relationship parameters were estimated for PR. The new length-weight relationship parameters were estimated using the log-scale linear regression model described in the PR Data Workshop Report (SEDAR 2025), but applied to TIP data during 1985-2024 in order to update the relationship and exclude any lobster potentially caught outside of PR, i.e., lobster caught prior to 1985. The new length-weight relationship for males was W = 1.1 x 10⁻⁵ * L2.44, and was W = 9.4 x 10⁻⁶ millimeters. * L2.475 for females with weight (W) in kilograms and length (L) in millimeters.
One sensitivity model was explored for the length-weight relationship. Lengthweight parameters for the entire US Caribbean region were estimated using the same linear regression method (SEDAR 2025), but applied to data from PR during 19852024. The sensitivity analysis were applied these regional length-weight parameter estimates to determine if there are population-level differences when island-specific vs. regional estimates of length-weight parameters were applied. The regional length-weight relationship for males was W = 1.1 x 10⁻⁵ * L2.44, and was W = 9.4 x 10⁻⁶ millimeters. * L2.475 for females with weight (W) in kilograms and length (L) in millimeters.
3.3.3
Maturity and Fecundity
Maturity was modeled as a logistic function and parameters were treated as fixed inputs to the model. Parameter estimates for maturity were estimated using TIP data prior to 1990 when harvest of egg bearing females was allowed (Die 2005). The fecundity of spiny lobster is modeled as a power function with parameter estimates from Cuba spiny lobster (FAO 2001):
where E is number of eggs and L is carapace length in mm. Fecundity parameters were treated as fixed inputs to the model.
3.3.4 Stock Recruitment
A Beverton-Holt stock-recruit function was used to parametrize the relationship between spawning output and resulting recruitment of age-0 lobster. The stock-recruit function requires three parameters:
• Steepness (h) characterizes the initial slope of the ascending limb (i.e., the fraction of recruits produced at 20% of the unfished spawning biomass).
• The virgin recruitment (R 0 ; estimated in log space) represents the asymptote or unfished recruitment levels.
• The variance term (sigma R) is the standard deviation of the log of recruitment and describes the amount of year-to-year variation in recruitment.
Only the virgin recruitment (R 0 ) was estimated. Sigma R and steepness were fixed at 0.7 and 0.99, respectively. The 0.7 sigma R reflects slightly high variation in recruitment. A value of 0.6 is a moderate level of recruitment variability, with lower values indicating lower variability and more predictable year-to-year recruitment. The primary assumption for steepness was that this stock is not a closed population, so recruitment may not be strongly tied to the local spawning stock biomass. Due to the low contrast in length composition data, annual deviations from the stock-recruit function were not estimated. A sensitivity indicated that recruitment deviations cannot be estimated well and resulted in nearly identical estimates of the four model parameters. Steepness and R 0 were explored via likelihood profiling.
3.3.5 Maximum Age and Natural Mortality
Natural mortality was treated as a fixed model input set to 0.34: the same value used in SEDAR 57 (2019). This value is based on a point estimate calculated from a variant of Pauly’s equation (Cruz et al. 1981). Past considerations of natural mortality are discussed in the Data Workshop Report Section 2.4 (SEDAR, 2025).
Empirical estimates of natural mortality (M) can be derived using life history information such as longevity, growth, and maturity. The Assessment Panel recommended that the Natural Mortality Tool (Cope & Hamel, 2022) be used to determine if 0.34 is still a reasonable value for natural mortality. Parameters for maximum age, the Von Bertalanffy
growth parameter (K), and asymptotic size (L∞), for females and males that are used in the current assessment were treated as inputs to the Natural Mortality Tool to obtain values of M from various empirical estimators. Maximum age was assumed to be 16 to approximate the age 15 plus group, and a lognormal coefficient of variation of 0.2 was included for uncertainty. The empirical estimators can be broken into two groupings: those based on maximum age (“Then_nls,” “Then_lm,” “Hamel_Amax”) and those based on the von Bertalanffy growth function (“Then_VGBF,” “Hamel_k,” “Jensen_k1,” “Jensen_K2”; see Cope and Hamel, 2022 for additional details on estimators). The average estimated natural mortality across estimators was very close to 0.34 for both sexes (Figures 9.11, 9.12), and therefore no changes to the fixed parameter input were considered.
3.4 Summary of Data-Informed Modeling Configurations
Based on the available data, the assessment was configured with one area, one season, two sexes, two commercial fleets, and two survey fleets SS3 models were configured using annual commercial catch time series and size compositions by fleet.
3.4.1
Commercial Fleets
• The catch was input as biomass (in metric tons) and was treated as if it occurred over the calendar year.
• The start and end years of the model were 1985 and 2023, respectively.
• The input standard error for the landings was set to 0.01.
• The equilibrium initial catch for each fleet was based on the geometric mean of landings during 1985-1987 multiplied by the catch multiplier associated with the global minimum solution for initial equilibrium catch from the likelihood profile (Figure 9.25).
• The input coefficient of variation for initial equilibrium catch was 0.1 for both dive and pot/trap catches.
• Initial F was estimated individually for dive and pot/trap fleets.
• The relative model weighting of the commercial fleet length compositions was based on the number of trips sampled.
• The length compositions of the commercial fleets were assumed to be representative of the total catch.
• An exponential logistic function was used to model the relative vulnerability of capture by length for the dive fleet.
• An exponential logistic function was used to model the relative vulnerability of capture by length for the pot/trap fleet.
• The assessment assumed a time-varying retention function for the pot/trap fishery, but assumed
no mortality from discards.
• The assessment assumed a time-varying retention function for the dive fishery, but assumed no mortality from discards.
• A sensitivity was conducted in which initial equilibrium catch was set to the lowest value in the likelihood profile.
• As sensitivity was conducted in which initial equilibrium catch was set to the highest value in the likelihood profile.
• A sensitivity was conducted in which the coefficient of variation for initial equilibrium catch was set to 0.3.
3.4.2
Survey Fleets
• An exponential logistic function was used to model the relative vulnerability of capture by length for the SEAMAP-C dive survey; parameters were initialized using the dive fleet selectivity parameters and allowed to estimate.
• An exponential logistic function was used to model the relative vulnerability of capture by length for the HJR Reefscaping survey; parameters were initialized using the pot/trap fleet selectivity parameters and allowed to estimate.
• A sensitivity was conducted in which each fleet’s exponential logistic function parameters were initialized with a logistic selectivity pattern and the asymptote and 2nd limb parameters fixed (part of the same sensitivity for commercial fleets).
• A sensitivity was conducted in which each fleet’s exponential logistic functions were initialized with a logistic selectivity pattern and allowed to estimate all three parameters (part of the same sensitivity for commercial fleets).
3.4.3
Life History
• The spiny lobster population was modeled from age 0 through age 15, which was treated as a plus group, and from 5 to 250-millimeters carapace length, in 5milimeter bins.
• Growth parameters for females and males were treated as fixed model inputs and carried over from SEDAR 57.
• Coefficients of variation for younger and older ages were initially set to 0.1 and 0.043 for both sexes.
• The length-weight relationship for male lobster was W = 1.1 x 10^-5 L^2.44, and W = 9.4 x 10^-6 L^ 2.475 for female lobster, with weight in kilograms and length in millimeters.
• A natural mortality value of 0.34 was used in the initial model runs.
• Maturity was modeled as a logistic function and fecundity was modeled as a power function with parameters treated as fixed model inputs.
• A Beverton-Holt stock-recruit function was used to parametrize the relationship between spawning output and resulting recruitment of age-0 lobster.
• Sigma R and steepness were fixed at 0.7 and 0.99, respectively.
• In model configurations, annual deviations from the stock-recruit function were not estimated.
• A sensitivity was conducted in which steepness was fixed at 0.8.
• A sensitivity was conducted in which the von Bertalanffy growth parameters and lengthweight relationship parameters are the same for males and females; the model assumes a male growth pattern.
• A sensitivity was conducted in which regional length-weight parameter estimates were applied instead of the PR island-specific parameters.
4. STOCK ASSESSMENT MODEL RESULTS
4.1 Overview
This report summarizes and discussed the results of five models that were developed sequentially: init, 2Finit, seamapc, hjr, culminating in the base model: new_eq (Table 8.1). The init model configuration was configured nearly identically to the SEDAR 57 updated assessment (2022), but fit to commercial landings and TIP data during 1985 – 2023; the 2Finit model addressed the need for initial equilibrium catch assumptions for the pot/trap fleet, and therefore required estimation of fleet-specific initial F; the seamapc configuration added the aggregated SEAMAP-C length composition data for the model to fit to during 2022; the hjr configuration added the aggregated HJR Reefscaping length composition data for the model to fit to during 2022; and after exploring a likelihood profile of total initial equilibrium catch (Figure 9.25) the new_eq model configuration assumed equilibrium catches for each fleet that were consistent with the global minimum likelihood profile, and was recommended by the Assessment Panel as the model framework from which to conduct future analyses (Table 8.1). Results are presented for the base model, new_eq. The stock assessment analyst investigated alternative stock assessment modeling frameworks designed specifically for marine invertebrates, however, the lack of an index of relative abundance for spiny lobster precluded the application of alternative frameworks to SS3. Therefore, the SS3 models remain the best benchmark stock assessment approach for US Caribbean spiny lobster.
Additionally, this report summarizes eight sensitivity analyses. Two sensitivities related to all fleet selectivities were conducted: the selex1 model refers to the sensitivity in which the exponential logistic function is initialized with a logistic selectivity pattern and the asymptote and 2nd limb parameters are fixed, and selex2 refers to the model in which the logistic selectivity pattern is initialized but all three parameters are estimated. Three sensitivities related to life history were conducted: the steep model, which explored the effect of the steepness parameter value being fixed at 0.8, and the combsex model, which explored the effects of treating growth patterns for both sexes set to that of male lobster. The lw model is a sensitivity in which US Caribbean-wide parameter estimates for each sex were applied instead of the PR-specific length-weight relationship parameters. Three sensitivities related to initial equilibrium catch assumptions were conducted: eq_hi and eq_lo, which collectively explored the effect of high and low magnitude of initial equilibrium catch, respectively, and eq_cv_hi, which explored the effect of a larger cv (0.3) associated with the initial equilibrium catches by fleet in new_eq
4.2 Model Diagnostics
Model diagnostics aimed to follow the conceptual process described by Carvalho et al. (2021). Their approach includes evaluating goodness of fit, information sources and structure, prediction skill, convergence, and model plausibility. To that effect, model diagnostics included likelihood profiles, retrospective, and jitter analyses.
4.3 Convergence
Three approaches were used to check for model convergence. They were investigating for the presence of (1) bounded parameters, (2) high final gradients, and (3) a positive definite hessian. As described by Carvalho et al. (2021) checking for bounded parameters can indicate discrepancies with data or model structure. Additionally, small final gradients and a positive definite hessian can indicate that the objective function achieved good convergence.
The models presented in this report all had a positive definite Hessian, indicating that each reached a local minimum and a locally optimal fit. None of the models had parameters that were bounded, suggesting the optimization was not constrained by parameter limits. Finally, the parameter gradients in all models were small and well below 0.001 (Table 8.2).
4.4
Correlation Analysis
High correlation among parameters can lead to flat response surfaces and poor model stability. By performing a correlation analysis, modeling assumptions that lead to inadequate configurations can be identified. Because of the highly parameterized nature of stock assessment models, some parameters are expected to be correlated (e.g., stock recruit parameters). However, many strongly correlated parameters suggest reconsidering modeling assumptions and parameterization.
No high correlations (correlation coefficients greater than 0.95 or less than -0.95) were observed. Correlations primarily occurred between selectivity parameters (Table 8.3). These correlations were expected.
4.5 Evaluating Variance
To check for parameters with high variance, parameter estimates are reported with their resulting standard deviations (stdev). Table 8.2 presents the eq_new model-estimated values and standard deviations for the main active parameters. Parameters estimates ranged from precise (stdev <= 0.1) to relatively precise (0.1 < stdev < 0.3), to imprecise (stdev > 0.3 (Table 8.2). Most parameters, e.g., R 0 , initial F for dive and pot/trap fleets, and fleet/survey selectivity parameters were estimated with relative precision (Table 8.2) within their respective probability density functions (Figure 9.13). The most imprecise parameter estimates were selectivity parameters associated with the SEAMAP-C and HJR Reefscaping survey fleets; this was not unexpected given that there is only one year of data to which the model is fitted in order to estimate selectivity. Model outputs of interest to management, e.g., relative biomass (biomass relative to the target level), spawning biomass, F, and recruitment are shown for the new_eq model in Figure 9.14.
4.6 Jitter Analysis
Jitter analysis is a relatively simple method that can be used to assess model stability and to determine whether the search algorithm has found a global, as opposed to local, solution. The premise is that all starting values are randomly altered (or ‘jittered’) by an input constant value, and the model is rerun from the new starting values. If the resulting population trajectories across many runs converge to the same solution, this provides support that a global minimum has been obtained. This process is not fault-proof; no guarantee can ever be made that the ‘true’ solution has been found or that the model does not contain misspecification. However, if the jitter analysis results are consistent, it provides additional support that the model is performing well and has come to a stable solution. Furthermore, jitter analyses, when jittered at appropriately high values, can provide insight into whether a
more optimal solution space exists, i.e., a lower total negative log-likelihood. For this assessment, a jitter value of 0.5 was applied to the starting values, and 40 runs were completed. The jitter value defines a uniform distribution in cumulative normal space to generate new initial parameter values (Methot et al., 2020).
Consistent with earlier results indicating that the models reached local minima (positive definite Hessian), the jitter analysis also performed well, indicating that nearly all models converged to the same solution (Figure 9.15). Some jitter runs produced higher likelihoods, but importantly, no jitter runs produced a lower likelihood than the best fit already identified for each model.
4.7 Residual Analysis
The primary approach to investigate model performance was a residual analysis of model fit to each data set. Any temporal trend in model residuals or disproportionately high residual values can indicate model misspecification and poor performance. Ideally, residuals are randomly distributed, conform to the assumed error structure for that data source, and are not of extreme magnitude. Any extremely positive or negative residual patterns indicate poor model performance and potential unaccounted-for process or observation error.
4.7.1 Catch
SS3 uses a hybrid implementation of Pope’s approximation to internally tune the model such that fishing mortality need not be an estimated parameter, but an internallytuned coefficient to produce values of fishing mortality associated with a perfect fit to catch data (Figure 9.14c) (Richard Methot, NOAA Fisheries Directorate, personal communication). Therefore, observed and predicted catches match more or less exactly.
4.7.2
Length compositions
Figure 9.16 shows the cumulative fit across all years between the observed and predicted length composition for the base model by sex, and fleet, and Figures 9.17 and 9.18 show the individual fits to length composition by year for the dive and pot/trap, respectively. Note that SS3 assumes that length composition data are in centimeters (cm) and generate plots to this effect; all measurements are in mm. Cumulative fits were reasonable with some overestimation of 100 mm females (Figure 9.17); this pattern was likely driven by poor model fits to data during years with low sample sizes (Figure 9.17, 9.18). Years in which sample sizes were sufficiently large resulted in close fits to the length composition data (Figure 9.17, 9.18).
4.8 Retrospective Analysis
A retrospective analysis is a helpful approach for investigating the consistency of terminal year model estimates (e.g., SSB) and is often considered a sensitivity exploration of impacts on key parameters from changes in data. The analysis sequentially removes a year of data and reruns the model. Suppose the resulting estimates of derived quantities such as SSB or recruitment differ significantly. In such a case, serial over- or underestimation of important quantities can indicate that the model has an unidentified process error and could require reassessing model assumptions. It is expected that removing data will lead to slight differences between the new terminal year estimates and the estimates for that year in the model with the complete time series of data. Estimates in years before the terminal year may have increasingly reliable information on cohort strength. Therefore, slight differences are usually expected between model runs as more years of size composition data are sequentially removed. Ideally, the difference in estimates will be slight and randomly distributed above and below the estimates from the model with complete data set time series. The results of a five-year retrospective analysis for SSB are plotted in Figure 9.19, which shows no evidence of a retrospective pattern.
4.9 Hindcast Cross-validation
Hindcast cross-validation uses SS3’s forecast file to calculate the expected values of the observed data based on forward projections (Carvalho et al. 2021), which can be used to test the model’s ability to predict mean values, e.g., length composition, by projecting a number of years backward from the terminal year. Model prediction ability is diagnosed with mean absolute square error (MASE) scores. Scores less than 1.0 indicate some predictive ability while values of 1.0 or greater indicate that the model performs equivalently with a random walk model, i.e., does not have predictive ability.
Hindcast cross-validation was applied to the length composition data for each commercial fleet. MASE scores indicate that the model can predict mean length composition for pot/trap fleet (Figure 9.20). Although the MASE score is greater than 1.0 for the diving fleet, i.e., not indicative of predictive ability greater than a random walk model, the hindcasted values for mean length still match those of observed mean length (Figure 9.20).
4.10 Likelihood Profiles
Profile likelihoods are used to assess the stability of parameter estimates by examining changes in the negative log-likelihood for each data source and evaluating the influence of
each source on the estimate. The analysis is performed by holding a given parameter at a constant value and rerunning the model. The model is run repeatedly over a range of reasonable parameter values. Ideally, the graph of change in likelihood values against parameter values will yield a well-defined minimum. When the profile plot shows conflicting signals or is flat across its range, the given parameter may be poorly estimated.
Typically, profiling is carried out for key parameters, particularly those defining the stock-recruit relationship (steepness, virgin recruitment, and sigma R). However, due to the extensive sensitivity analyses conducted during SEDAR 57 (2019), profiles were exclusively explored for unfished recruitment (R 0 ), steepness, initial F for the dive fleet, initial F for the pot/trap fleet, and initial equilibrium catch.
4.10.1 Unfished Recruitment (R0)
Figure 9.21 shows the profile likelihood for the natural log of the unfished recruitment parameter of the Beverton – Holt stock-recruit function for PR spiny lobster (new_eq model only). The base model log-scale R 0 profile indicates a well-defined minimum occurring at the base model estimate of R 0 (Table 8.2). The scale of the profile, however, indicates that other values of R 0 may be nearly as probable.
4.10.2 Steepness
Figure 9.22 shows the profile likelihood for the steepness parameter of the Beverton –Holt stock-recruit function for PR spiny lobster (new_eq model only). The base model profile indicates that the global solution for the steepness parameter is around 0.85, closely followed by 0.9, which was slightly less probable. Multiple values of steepness could be equally probable in describing PR spiny lobster population dynamics, but it is more likely that steepness is not estimable given the limitations of the data.
4.10.3 Initial Fishing Mortality (Dive)
Figure 9.23 shows the profile likelihood for the initial F for the PR spiny lobster dive fishery (new_eq model only). The dive initial F profile indicates that a global minimum solution was obtained for the parameter.
4.10.4 Initial Fishing Mortality (Pot/trap)
Figure 9.24 shows the profile likelihood for the initial F for the PR spiny lobster pot/trap fishery (new_eq model only). The pot/trap initial F profile indicates that a well-
defined global minimum solution was obtained for the parameter.
4.10.5 Initial Equilibrium Catch
Figure 9.25 shows the profile likelihood for the total initial equilibrium catch for PR spiny lobster (base model only). The likelihood profile indicates that the global minimum estimate of initial equilibrium catch occurs at approximately 160 mt. The catch multiplier associated with this value was applied to the geometric mean catches by fleet used in the four initial stage models to create the new_eq base model. Similar to the R 0 profile, the scale of the initial equilibrium catch profile is relatively low, and therefore the model will consider higher and lower values as nearly as probable. The effects of alternative initial equilibrium catch assumptions (magnitude and cv) are also illustrated in Figure 9.26
4.11 Sensitivity Runs
Seven sensitivity analyses were conducted. Two sensitivity analyses were conducted to determine the estimability of selectivity for all fleets. Selex1 explored initializing each fleet’s exponential logistic function with parameters that generate a logistic selectivity pattern, and treats the asymptote and 2nd limb parameters as fixed inputs. Selex2 explored initializing all fleets’ exponential logistic functions with parameters that generate a logistic selectivity pattern, but allows the model to estimate all three parameters. Estimated selectivity patterns each of the SEDAR 91 models (new_eq (base), selex1, selex2) are provided in Figure 9.8. Assuming fixed logistic selectivity for all fleets results in dramatically reduced relative biomass (Figure 9.26) due to higher estimates of initial F and an associated lower estimate of R 0 (Table 8.5); this was expected because the logistic selectivity and retention functions overlap and tell the model that no lobsters are discarded and survive. Despite the relatively low resolution in the median quantiles of the length composition data, the exponential logistic function in selex2 estimates nearly identical parameters as the base model, resulting in the same dome-shaped selectivity patterns (Figure 9.8).
Three sensitivity analyses related to life history were conducted. The steep model fixed the stock-recruitment steepness parameter to 0.8. This resulted in a slightly lower estimate of relative biomass over time (Figure 9.26). Assuming a steepness value of 0.8 still allows the model to generate a large number of recruits per spawner, but it is no longer oneto-one as it would be with a value of 0.99. The combsex model assumed that von Bertalanffy growth parameter inputs and length-weight relationship parameters were equal to male lobster values for both male and females to approximate a combined sex model; this was done to explore the effect of removing size dimorphism assumptions from the model. This resulted in an estimate of relative biomass that was essentially unexploited over time,
but extremely uncertain (Figure 9.26). The estimates of initial F were low and the estimate of R0 was correspondingly high (Table 8.5). The results of this sensitivity analysis indicate the importance of including sex dimorphism in the model, particularly with respect to von Bertalanffy growth parameter inputs; to which the model is highly sensitive (SEDAR 2019). The length-weight relationships do not differ greatly between islands (see PR Data Workshop Report), and lw sensitivity produced nearly identical population dynamics to the new_eq model, albeit with marginally lower R0 (Table 8.5).
Three sensitivity analyses related to initial equilibrium catch assumptions were conducted. The eq_hi model assumed that initial equilibrium catch was approximately 230 mt, and the eq_lo model assumed that initial equilibrium catch was approximately 70 mt, resulting in the model initializing at higher and lower levels of relative depletion (Figure 9.26); both models resulted in higher terminal estimates of relative biomass than the base model (Figure 9.14a), however, the former is likely driven by the high degree of compensation driven by the steepness parameter being set to 0.99, while the latter is likely due to small predicted impact of fishing mortality over time (Table 8.5). The eq_cv_hi model set the initial equilibrium catch coefficient of variation (cv) to 0.3, an increase from the base model’s 0.1. This resulted in a much more uncertain initialization (Figure 9.26), but otherwise identical model results (Figure 9.14a).
5. DISCUSSION
This assessment presents a total of 13 model configurations, using an integrated framework and several model diagnostics in order to characterize the stock status of spiny lobster in PR. The results broadly indicate that overfishing is occurring, but the stock is not overfished (Figure 9.14a, Table 8.6). Estimated catch at the MSY proxy target did not differ radically among the five primary models (Table 8.7). Catches have increased in recent years (Figure 9.2), but PR Department of Natural and Environmental Resources have reported evidence of high abundance in PR’s EEZ (Matos-Caraballo et al. 2024). The results of the quantile analysis suggest that fishing has not affected the size structure of the population (Figures 9.4-9.7), therefore it is unclear whether the level of exploitation occurring in PR waters is at a higher or lower level of population biomass. The results of the R0, steepness, and initial equilibrium catch likelihood profiles (Figures 9.21, 9.22, 9.25) suggest a broad range of possible parameter values that can describe PR spiny lobster population dynamics, and in some instances, change the scale of depletion over time (Figure 9.26). Taken together, the evidence presented in this report and related documents suggest that the PR spiny lobster fishery is sustainable (Table 8.6), but that the magnitude of exploitable biomass is highly uncertain.
The SEDAR 91 model for PR spiny lobster is an advancement of the same framework applied during SEDAR 57 and its update (2019, 2022). The assessment model was fit to two new fishery-independent sources of length composition data, included a more realistic start year for fishing occurring within PR’s EEZ, and estimated an additional seven parameters: initial F for the pot/trap fishery, and three exponential logistic selectivity parameters for the SEAMAP-C and HJR Reefscaping survey fleets, respectively. Uncertainty in selectivity, life history, and initial equilibrium catch was quantified via model diagnostics and sensitivity analyses. Sensitivities from SEDAR 57 not explicitly analyzed during SEDAR 91 hold for SEDAR 91 because the underlying SS3 model framework is nearly identical.
The models assume a Beverton-Holt stock-recruitment relationship with a steepness values of 0.99 – this effectively decouples spawning stock biomass and recruitment and defaults to a “null” stock-recruitment relationship (Brooks, 2024). Assuming this null relationship, coupled with the inability to estimate annual recruitment deviations (Figure 9.14) from the TIP data, R0 becomes one of the most influential model parameters. R0 is highly sensitive to model initialization, i.e., estimates of initial F (Table 8.5). Higher and lower estimates of initial F have an inverse relationship with the magnitude of estimate R0, as evidenced by model estimates of initial SSB (Tables 8.2, 8.8), and sensitivities in which initial equilibrium catch is explored, and sexes combined (Figure 9.26). This illustrates both the general sensitivity to and importance of model initialization. Future sociological investigations, e.g., oral histories or semi-structured interviews, could benefit future stock assessment by seeking information on what proportion of fishing by PR fleets occurred in PR waters prior to 1985. This information could complement the efforts made during this assessment to reconstruct historical catch, and potentially avoid the need to make initial equilibrium assumptions during future assessments.
There are several additional avenues for future US Caribbean spiny lobster research worth considering. Continued collection of length composition data from the SEAMAP-C dive survey, and/or the HJR Reefscaping cooperative research focused on collecting information on juvenile or sub-adult lobster, will be important to provide the model information on smaller lobsters that are either not vulnerable to the gear of the fishery, or caught and discarded for being undersized. Those data will further inform selectivity parameter estimates, and potentially annual recruitment deviations if cohorts can be identified. Further investigation into age structure of Caribbean spiny lobster via gastric ossicle mills, such studies conducted by Hutchinson et al. (2024) and Medina Martinez (2024) provide a specific age-length key for spiny lobster should length-based statistical catch-at-age models continue to be the primary tool for assessing stock status. Given the generally discrete growth process of marine invertebrate, i.e., molting, should future analysts
wish to consider a size-based assessment, there are generalized and lobster-specific frameworks available. For example, the Alaska Fisheries Science Center developed A Generalized Size-Based Assessment Modeling Approach for Alaskan Crab Stocks (GMACS) that may be worth applying to spiny lobster should an index of relative abundance become available in the future. Multiple stock assessment methods for Northeast American lobster (Homarus americanus) are also currently in development, but require an index of relative abundance (Burton Shank, NEFSC, personal communication), and would similarly benefit from more information on smaller lobsters.
Other sources of uncertainty suggest that US Caribbean spiny lobster may also benefit from a management strategy evaluation (MSE) approach. MSE is warranted when uncertainty threatens the efficacy of the current management approach (Walter et al. 2023). The magnitude of non-commercial harvest in PR waters remains highly uncertain, and that harvest remaining stable over time is a fundamental assumption of the SEDAR 91 model. MSE would offer an appropriate means of testing this assumption, and a simulated noncommercial fleet and associated selectivity in the operating models could be informed by expert opinion. Additionally, should local ecological knowledge-based data streams such as an index of relative perceived abundance (Shaff et al. 2023) become available, MSE is an appropriate framework for testing their utility in future stock assessment. Furthermore, environmental drivers of lobster population dynamics and the effects of market dynamics on the fisheries were primary concerns identified during participatory modeling in PR (Karnauskas et al. 2024). The effects of environmental nonstationarity on the performance of management procedures can be tested using MSE, as can the effects of market dynamics on fishing (Damiano et al., in prep).
6.
RESEARCH RECOMMENDATIONS
• Continue the SEAMAP-C and HJR Reefscaping data collection programs for collecting spiny lobster size composition data.
• Leverage sociological research to obtain information on the proportion of PR landings were caught in PR waters prior to 1985.
• Consider the use of management strategy evaluation to explore the uncertainty in noncommercial catches.
7. REFERENCES
Appeldoorn, R. S., Sanders, I. M., Farber, L. (2015). A 61 year reconstruction of fisheries catch in Puerto Rico. SEDAR 91-RD-16.
Bohnsack, J., Meyers, S. Appeldoorn, R., Beets, J., Matos, D., Sadovy, Y. (1990). Final stock assessment and fishery evaluation (SAFE) report for the workshop on spiny lobster resources in the U.S. Caribbean. SEDAR 91-RD-17.
Brooks, E. N. (2024). Pragmatic approaches to modeling recruitment in fisheries stock assessment: A perspective. Fisheries Research, 270, 106896. https://doi.org/10.1016/j.fishres.2023.106896
Carvalho, F., Winker, H., Courtney, D., Kapur, M., Kell, L., Cardinale, M., Schirripa, M., Kitakado, T., Yemane, D., Piner, K. R., Maunder, M. N., Taylor, I., Wetzel, C. R., Doering, K., Johnson, K. F., & Methot, R. D. (2021). A cookbook for using model diagnostics in integrated stock assessments. Fisheries Research, 240, 105959. https://doi.org/10.1016/j.fishres.2021.105959
Cope, J., & Hamel, O. S. (2022). Upgrading from M version 0.2: An application-based method for practical estimation, evaluation and uncertainty characterization of natural mortality. Fisheries Research, 256, 106493. https://doi.org/10.1016/j.fishres.2022.106493
Crabtree, R. E. (2019). Comprehensive Fishery Management Plan for the Puerto Rico Exclusive Economic Zone Including Environmental Assessment, Regulatory Impact Review, and Fishery Impact Statement https://repository.library.noaa.gov/view/noaa/45274
Cruz, R., R. Coyula and A.T. Ramirez. (1981). “Crecimiento y mortalidad de la langosta Espinosa (Panulirus argus) en la Plataforma suroccidental de Cuba. Rev. Cub. Inst. Pesq., 6(4): 89-119.
Cruz Motta, J. J. (2024). Independent fishery data collection for lobster (Panulirus argus) and conch (Lobatus gigas) under the SEAMAP-C program. SEDAR91-RD 12.
Damiano, M.D., Rios, A., McCarthy, K., Peterson, C. (In prep). (Re)Introducing management strategy evaluation into the US Caribbean. Intent to submit to Marine Policy Fall 2025
Die, D. Maturity of spiny lobsters in the US Caribbean. Caribbean Southeast Data Assessment Review Workshop Report SEDAR-RW-03.
FAO. 2001. Report on the FAO/DANIDA/CFRAMP/WECAFC Regional Workshops on the Assessment of the Caribbean Spiny Lobster (Panulirus argus). Belize City, Belize, 21 April-2 May 1997 and Merida, Yucatan, Mexico, 1-12 June 1998. FAO Fisheries Report. No. 619. Rome, FAO. 2001. 381p.
Godwin, K., A. Rios. 2024. SEDAR 91 Trip Interview Program (TIP) Size Composition
Analysis of Caribbean Spiny Lobster (Panulirus argus) in Puerto Rico, US Caribbean, 1981-2023. SEDAR-91-DW-04. 8pp.
Hutchinson, E., Matthews, T. R., Ross, E., Hagedorn, S., & Butler, M. J. (2024). Gastric mill ossicles record chronological age in the Caribbean spiny lobster (Panulirus argus). Fisheries Research, 277, 107083. https://doi.org/10.1016/j.fishres.2024.107083
Karnauskas, Mandy, Juan Agar, Kelsi Furman, Matt McPherson, and Manjoj Shivlani. (2024). Summary of Participatory Modeling Workshops to Understand Ecological, Social and Economic Dimensions of the Puerto Rican Lobster Fishery. SEDAR91-DW02. SEDAR, North Charleston, SC. 13 pp.
Malone, Gaitlyn. 2025. Summary of Management Actions for Caribbean Spiny Lobster (Panulirus argus) as documented within the Management History Database (1985-2023). SEDAR91-AP-01. SEDAR, North Charleston, SC. 11 pp.
Matos-Caraballo, Daniel, Jesús León-Fernández, Luis A. Rivera-Padilla, and Wilson SantiagoSoler. 2024. PR/DNER/Commercial Fisheries Statistics Program Report: Signs of the Abundance of Spiny Lobster Panulirus argus Observed by Commercial Landings Reported during 2014-2023. SEDAR91-DW-03. SEDAR, North Charleston, SC. 6 pp.
Medina Martinez, A. (2024). Determining the age-size relationship of Panulirus argus in the southwest area of Puerto Rico. [SEDAR91-RD-03].
Methot, R. D., & Wetzel, C. R. (2013). Stock synthesis: A biological and statistical framework for fish stock assessment and fishery management. Fisheries Research, 142, 86–99. https://doi.org/10.1016/j.fishres.2012.10.012
Methot, R. D., Wetzel, C. R., Taylor, I. G., & Doering, K. (2020). Stock synthesis
user manual: Version 3.30.15. Northwest Fisheries Science Center (U.S.). https://doi.org/10.25923/5WPN-QT71
Orhun, M. Refik, Katherine Godwin, Kim Johnson and Stephanie Martínez Rivera. 2024. SEDAR 91 Commercial Landings of Caribbean Spiny Lobster (Panulirus argus, Panulirus guttatus) in Puerto Rico, US Caribbean, 1983-2023. SEDAR91-DW-07. SEDAR, North Charleston, SC. 23 pp.
SEDAR. (2016). SEDAR 46 Caribbean data-limited species stock assessment report https://sedarweb.org/documents/sedar-46-final-stock-assessment-report-caribbean-datalimited-species/
SEDAR. (2019). SEDAR 57 Stock Assessment Report U.S. Caribbean Spiny Lobster 232. http://sedarweb.org/sedar-57
SEDAR 57 Update. (2022). “SEDAR 57 Stock Assessment Update Puerto Rico Caribbean Spiny Lobster.” SEDAR, North Charleston, SC. 13 pp.
SEDAR. (2022). SEDAR 80 U.S. Caribbean queen triggerfish Puerto Rico final stock assessment report. https://sedarweb.org/documents/sedar-80-us-caribbeanqueen- triggerfish-puerto-rico-final-stock-assessment-report/
Shaff, J. F., Medina Santiago, I. A., Elías Ilosvay, X., Tovar-Ávila, J., Ojea, E., Beaudreau, A. H., Caselle, J. E., & Aceves Bueno, E. (2023). Documenting historical changes in shark fisheries near Islas Marías, Mexico, using fishers’ local ecological knowledge. Fisheries Research, 265, 106748. https://doi.org/10.1016/j.fishres.2023.106748
Scharer, M., Agosto, E., Ruiz, H. (2023). Improving spiny lobster management in cooperation with local fishing communities in Puerto Rico. Final Report.
Valle-Esquival, M, and G. Díaz, G. (2004). An Update on the Reported Landings, Expansion Factors and Expanded Landings for the Commercial Fisheries of the United States Virgin Islands (with Emphasis on Spiny Lobster and the Snapper Complex). NOAA/NMFS/SEFSC Miami Laboratory SFD-2004/051 (SEDAR-8-DW-09). 48pp.
Valdés-Pizzini, M. (2008). Reflections of the way life used to be: Anthropology, History and the Decline of the Fish Stocks in Puerto Rico. SEDAR 91-RD-18
8 TABLES
Table 8.1: Summary of models for SEDAR 91.
Stage Code
Initial init
Initial 2initF
Initial seamapc
Model description
Model fit to catch and length composition data updated through 2023; start year changed to 1985; all model parameters remain unchanged from SEDAR 57
Same as init, but an initial fishing mortality parameter is estimated for each fleet: dive and pot/trap, and equilibrium initial catches are set to the geometric mean of landings during 1985-1987 from each fleet
Same as 2initF but is fit to length composition data from the Puerto Rico SEAMAP-C dive survey. SEAMAP-C data are aggregated into a single year: 2022, and exponential logistic selectivity parameters are estimated for the SEAMAP-C “fleet.”
Initial hjr
Base new_eq
Sensitivity selex1
Sensitivity selex2
Sensitivity steep
Sensitivity combsex
Sensitivity lw
Sensitivity eq_hi
Sensitivity eq_lo
Sensitivity eq_cv_hi
Same as seamapc, but is fit to length composition data from HJR Reefscaping. HJR data are aggregated into a single year: 2022, and exponential logistic selectivity parameters are estimated for the HJR “fleet.”
Same as hjr, but equilibrium initial catches for each fleet are set to the global minima obtained from the equilibrium initial catch likelihood profile
Same as new_eq, but the exponential logistic function for the dive fishery is initialized with logistic selectivity pattern; only 1st limb parameter is allowed to estimate
Same as new_eq, but the exponential logistic function for dive fishery is initialized with logistic selectivity pattern; all three parameters are allowed to estimate
Same as new_eq, but steepness is fixed to 0.8
Same as new_eq, but female von Bertalanffy growth parameters and weight-length relationship parameters are set to male values to approximate a single male sex model
Same as the new_eq, but uses the length-weight parameters estimated for the entire US Caribbean region
Same as hjr but equilibrium initial catches are set to the highest values obtained from the equilibrium initial catch likelihood profile
Same as hjr but equilibrium initial catches are set to the lowest values obtained from the equilibrium initial catch likelihood profile
Same as new_eq but the equilibrium initial catch cv is set to 0.3
Table 8.2: Puerto Rico spiny lobster parameters, standard deviations (SD), and coefficient of variation (CV) by model scenario: init, 2initF, seamapc, hjr, new_eq CV is calculated as the SD divided by the parameter estimate.
1st
Pot/trap selectivity 1st limb
selectivity asymptote
HJR selectivity 2nd limb
Unfished Recruitment (R0)
Table 8.3: Puerto Rico spiny lobster correlations between estimated parameters for the new_eq (base) model in descending magnitude of correlation. Scenario
Table 8.5: Puerto Rico spiny lobster parameters, standard deviations (SD), and coefficient of variation (CV) for dive initial F, pot/trap initial F, and R0 by sensitivity model scenario: selex1, selex2, steep, eq_hi, eq_lo, eq_cv_hi, combsex, and lw. CV is calculated as the SD divided by the parameter estimate. If values are too small to be rounded to the second decimal point, then they are rounded to the third decimal point.
Unfished Recruitment (R0)
Table 8.6: Puerto Rico spiny lobster fishing mortality rate and spawning stock biomass ratios relative to the rate and biomass of the stock associated with the MSY proxy (based on SPR 30%) for the init, 2initF, seamapc, hjr and new_eq(base) models. The relative fishing mortality ratio is expressed as a three-year geometric mean of the annual fishing mortality rates for 2021-2023 divided by the fishing mortality rate associated with MSY SPR 30%. The relative stock biomass ratio is expressed as the 2023 spawning biomass divided by the spawning stock biomass at MSY SPR 30%.
F Current / F SPR 30%
SSB 2023 / SSB SPR 30%
Table 8.7: Puerto Rico spiny lobster derived quantities of the MSY proxy (based on SPR 30%) in metric tons for the initial model (init), 2initF, seamapc, hjr, and base model (new_eq). CV is calculated as the SD divided by the parameter estimate.
Table 8.8: Puerto Rico spiny lobster derived quantities for unfished and initial spawning stock biomass in metric tons (mt) along with standard deviations (SD) and coefficient of variation (CV) for the base model. CV is calculated as the SD divided by the parameter estimate. Derived Quantity
9 FIGURES
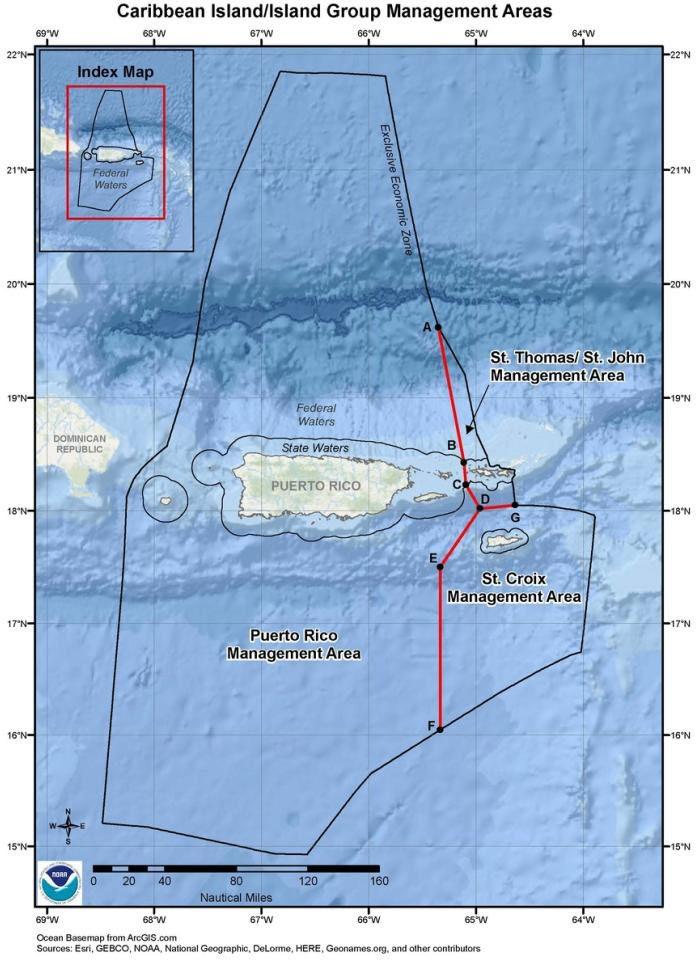
9.1: Jurisdictional boundaries of the Caribbean Fishery Management Council
Figure
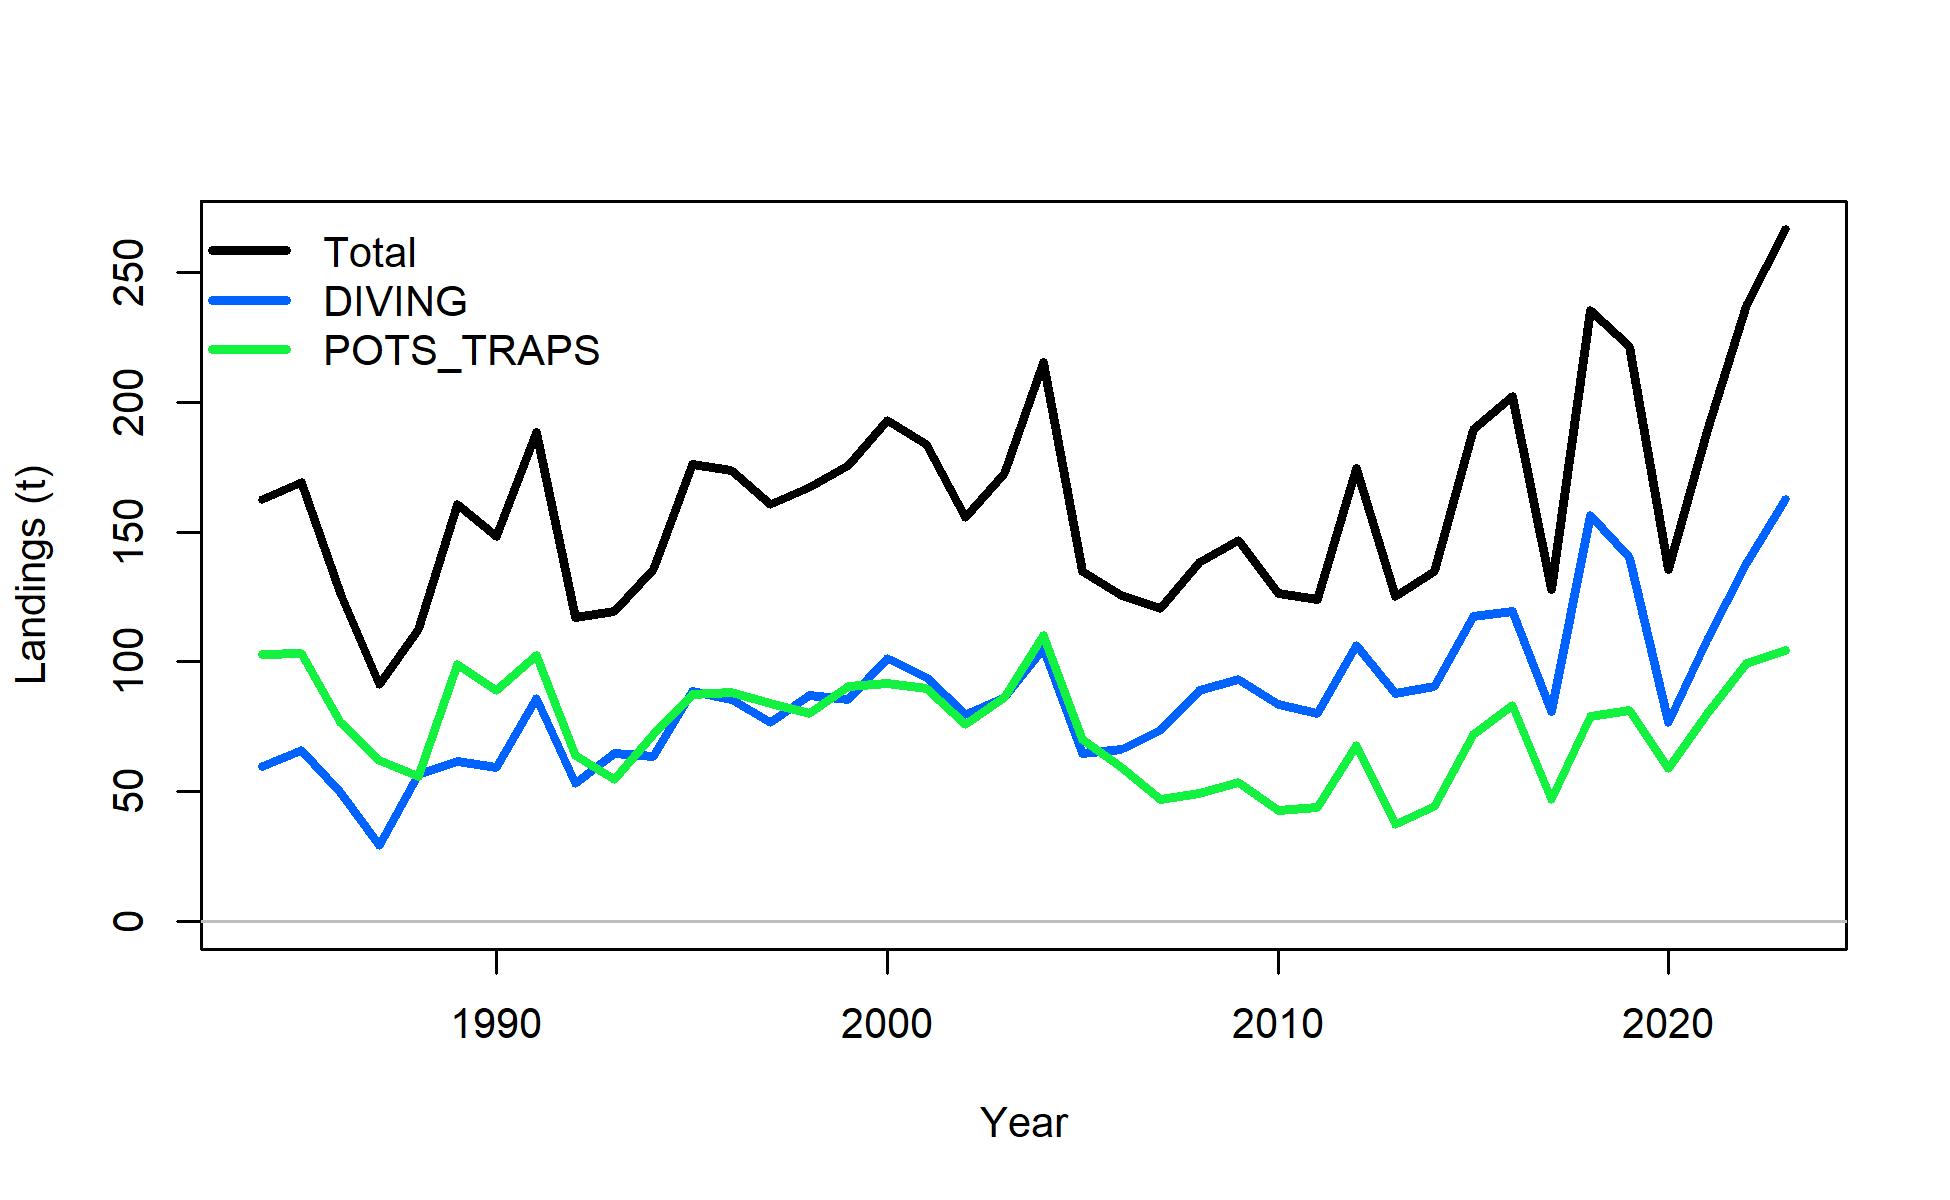
Figure 9.2: Puerto Rico spiny lobster landings (mt) during 1985-2023 by fleet: dive (blue), pot/trap (green), total (black).
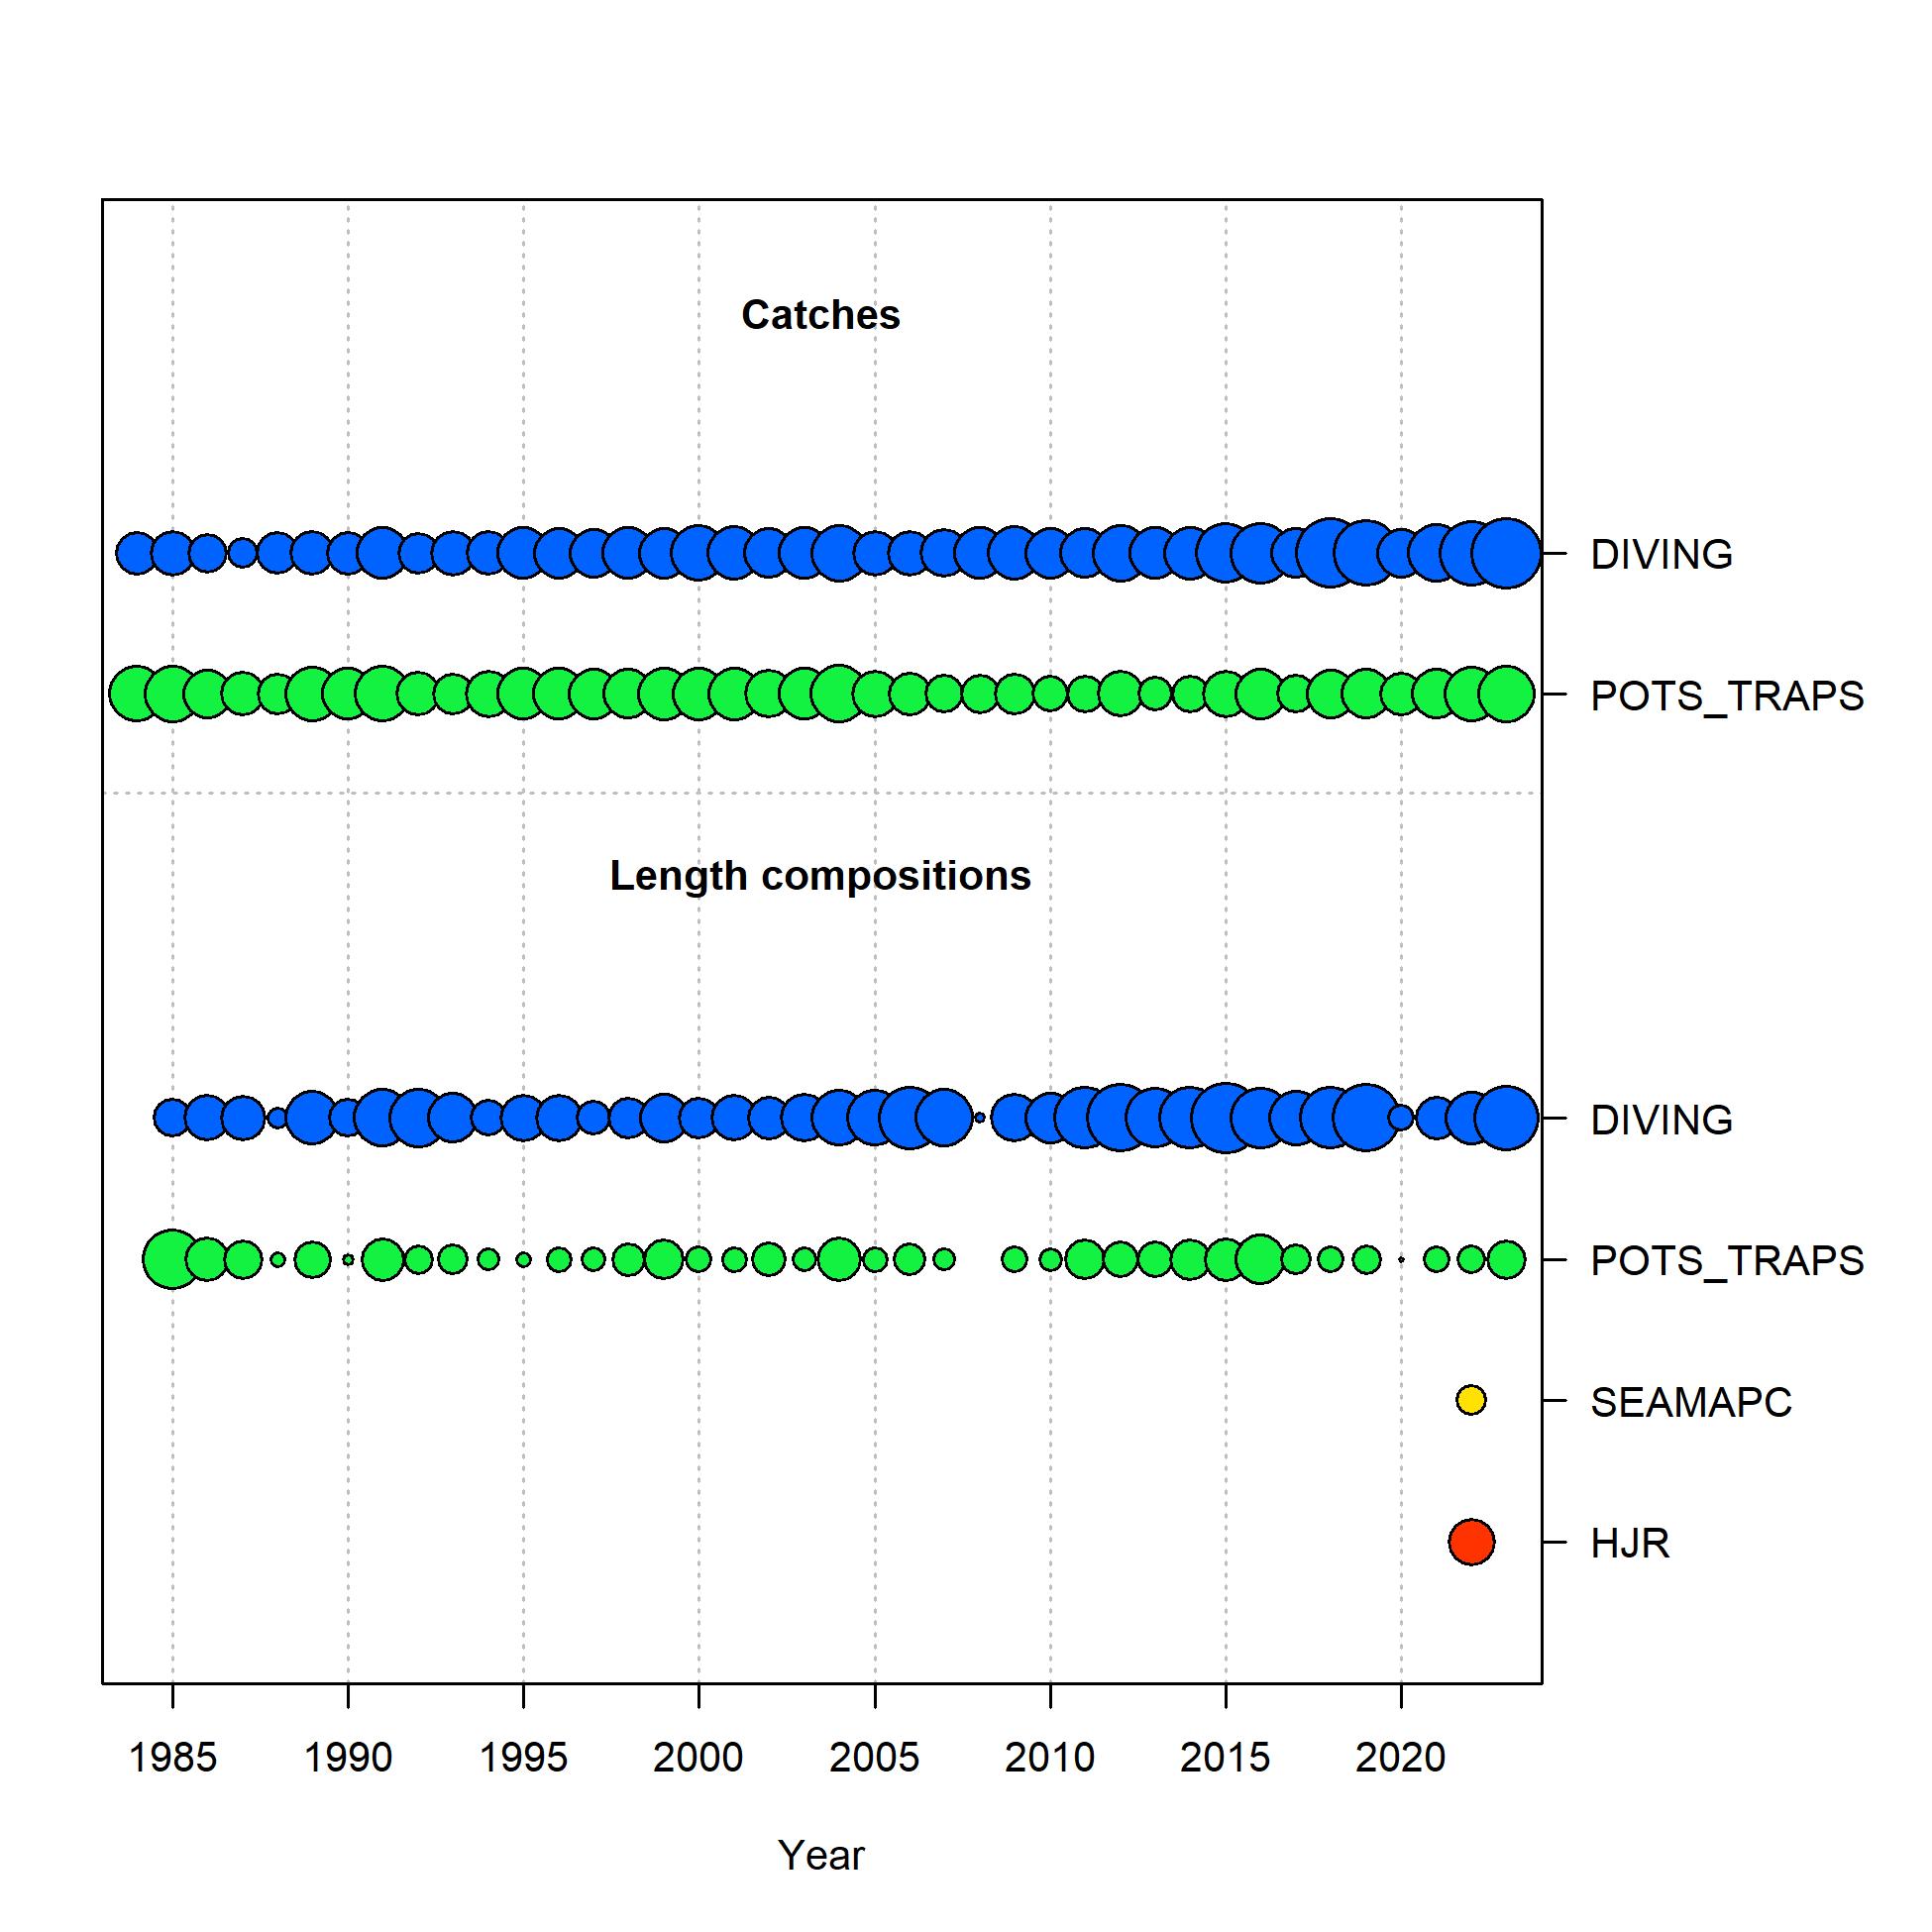
Figure 9.3: Puerto Rico spiny lobster catch (top) and length composition (bottom) data by fleet: dive (blue), pot/trap (green), SEAMAP-C (yellow), and HJR Reefscaping (red); circle size is indicative of the magnitude of catches (top) and sample sizes (effective sample size = the square root of the number of sampled trips) (bottom), respectively.
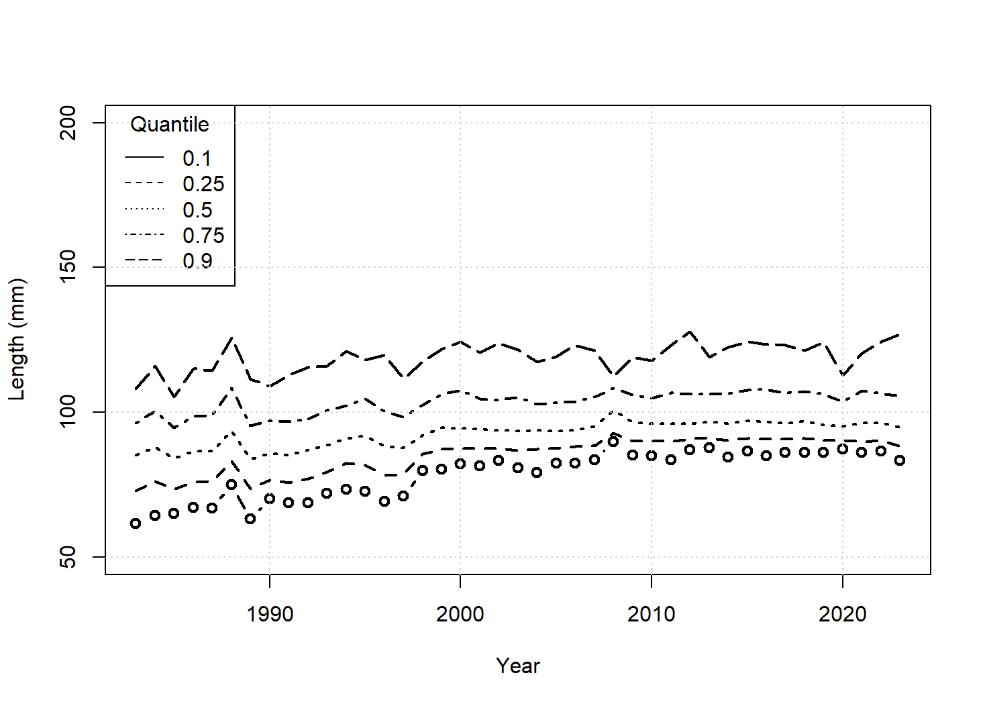
Figure 9.4: Median 10th, 25th, 50th, 75th, and 90th quantiles of length composition data (mm) for female Puerto Rico spiny lobster in the dive fishery during 1983-2023.
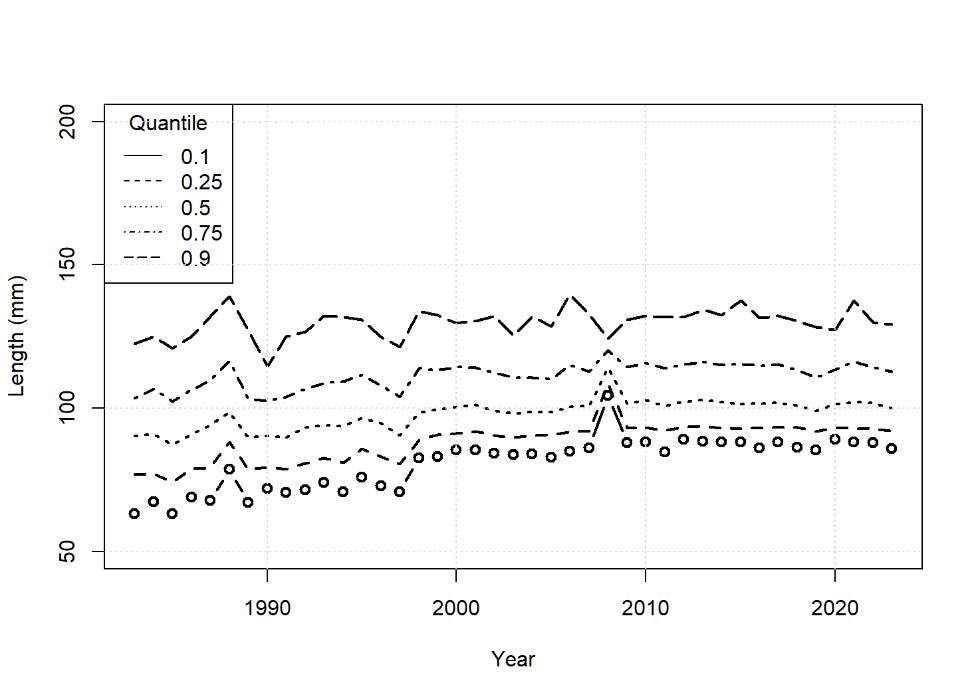
Figure 9.5: Median 10th, 25th, 50th, 75th, and 90th quantiles of length composition data (mm) for male Puerto Rico spiny lobster in the dive fishery during 1983-2023.
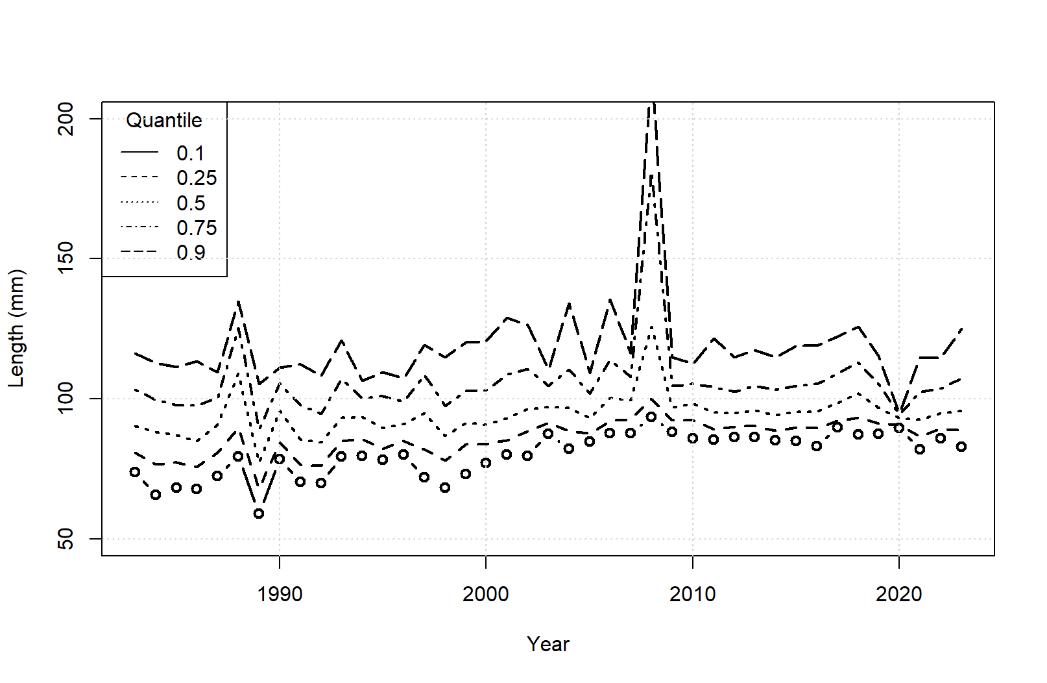
Figure 9.6: Median 10th, 25th, 50th, 75th, and 90th quantiles of length composition data (mm) for female Puerto Rico spiny lobster in the pot/trap fishery during 1983-2023. Data from 2008 were not included in model fitting.
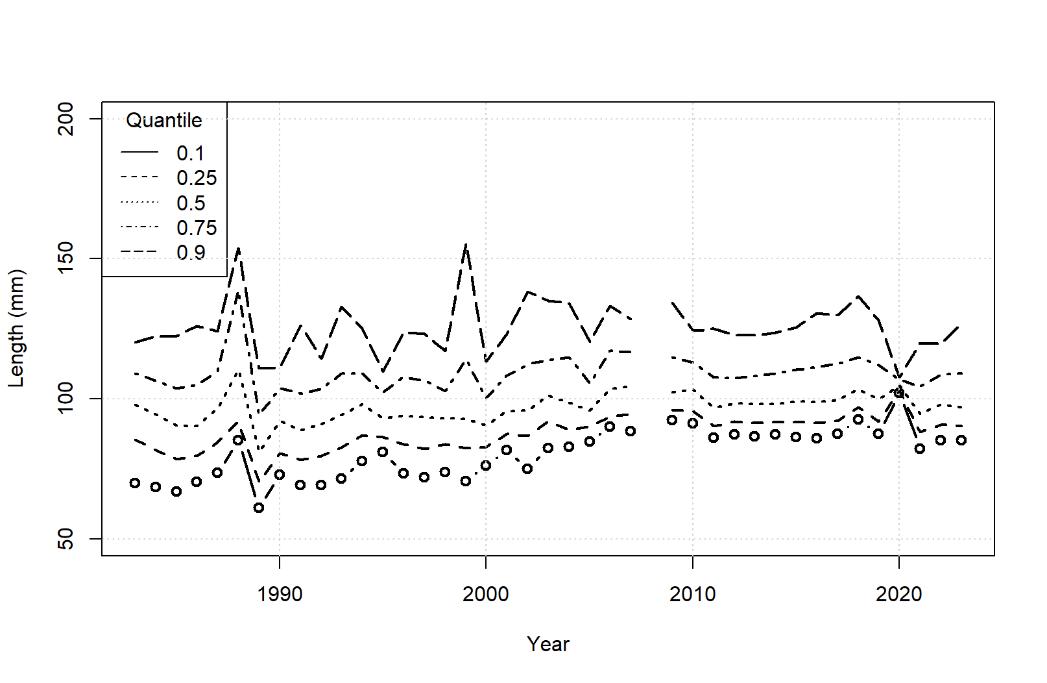
Figure 9.7: Median 10th, 25th, 50th, 75th, and 90th quantiles of length composition data (mm) for male Puerto Rico spiny lobster in the pot/trap fishery during 1983-2023. Data from 2008 were not included in model fitting.
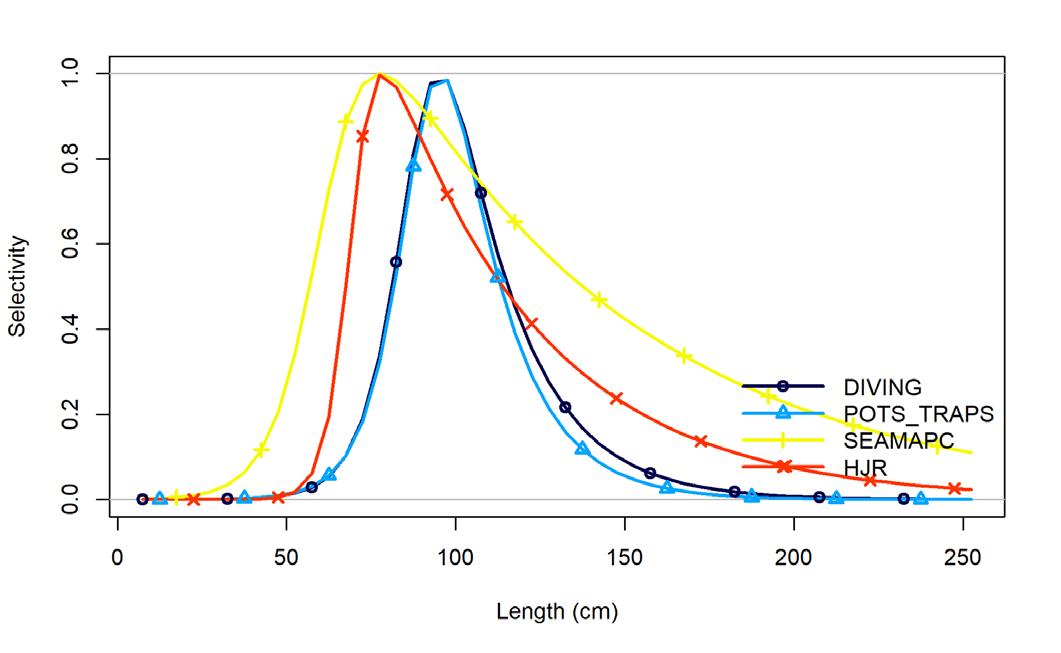
)
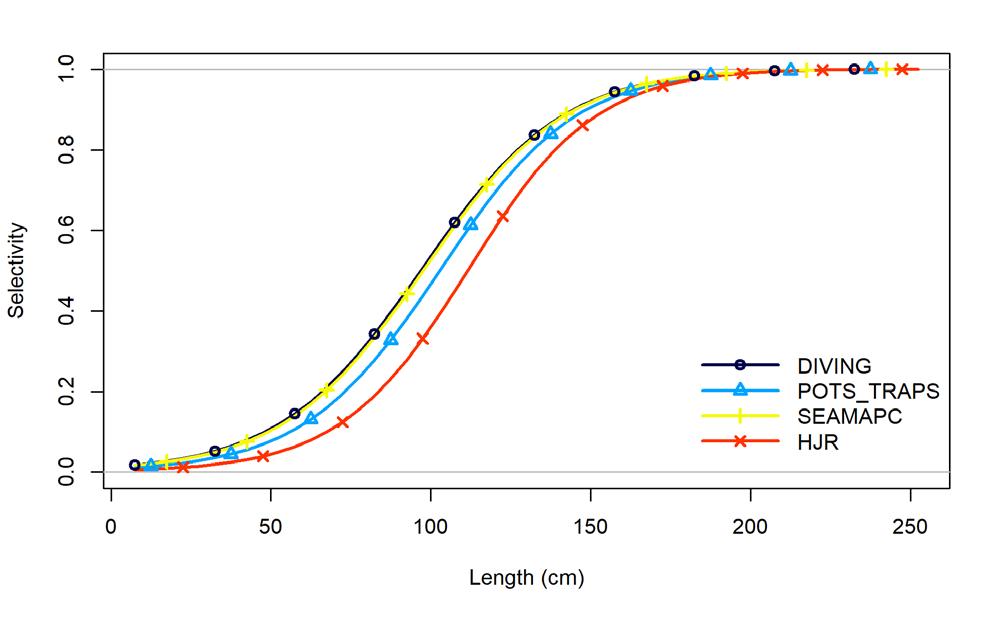
(selex1)
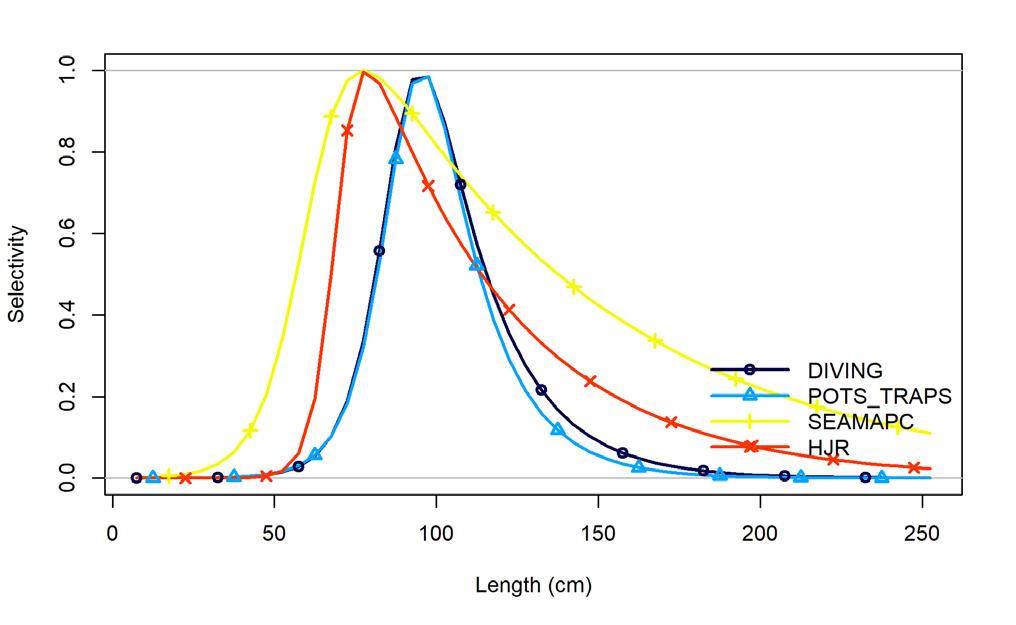
(selex2)
Figure 9.8: Puerto spiny lobster selectivity by model scenario: new_eq (top), selex1 (middle), selex2 (bottom), and by fleet: dive (dark blue), pot/trap (light blue), SEAMAPC (yellow), and HJR Reefscaping (red).
(new_eq
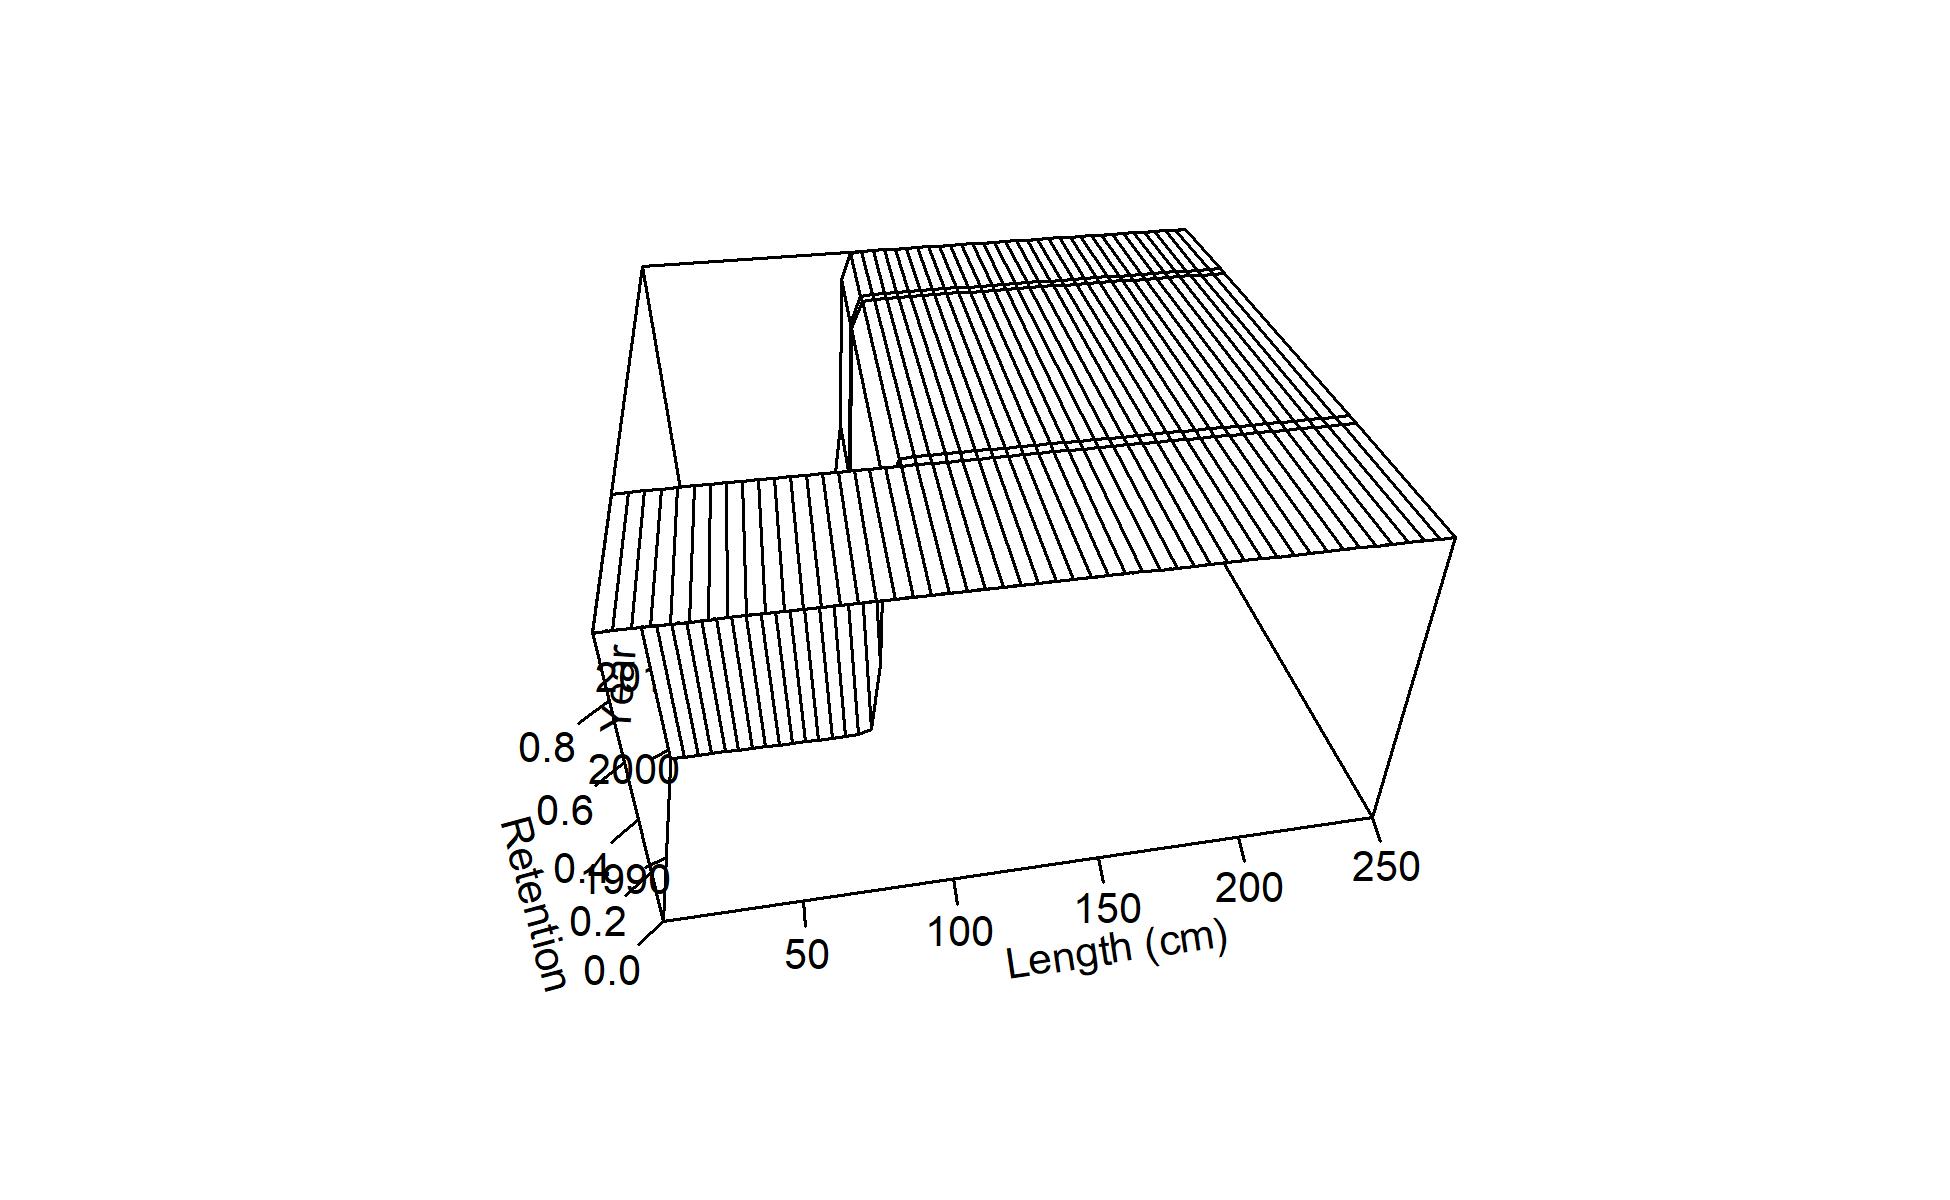
Figure 9.9: Time-varying retention curve surface for the first time-block (front) and second time-block (back) for female (top) and male (bottom) Puerto Rico spiny lobster in the dive fishery.
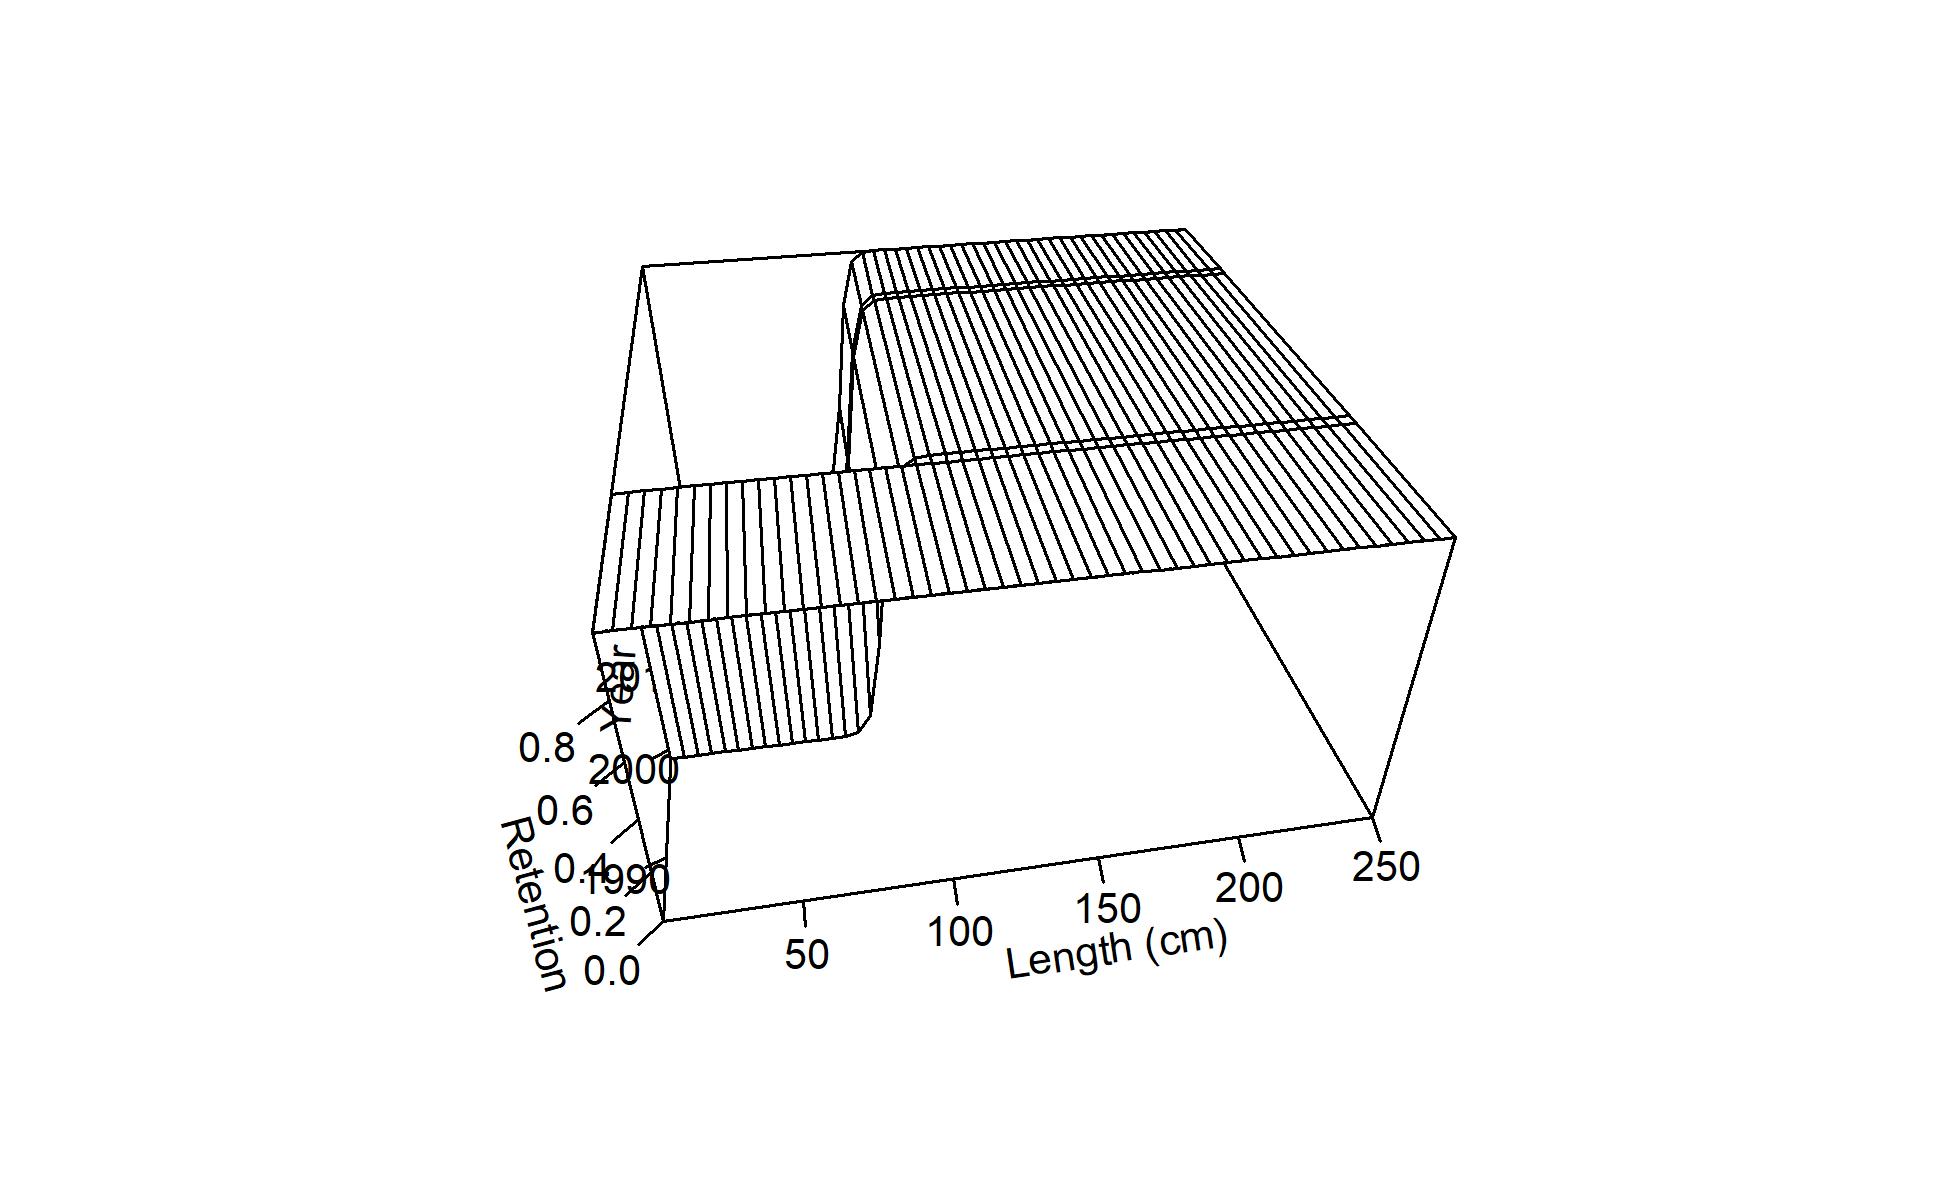
Figure 9.10: Time-varying retention curve surface for the first time-block (front) and second time-block (back) for female (top) and male (bottom) Puerto Rico spiny lobster in the pot/trap fishery.
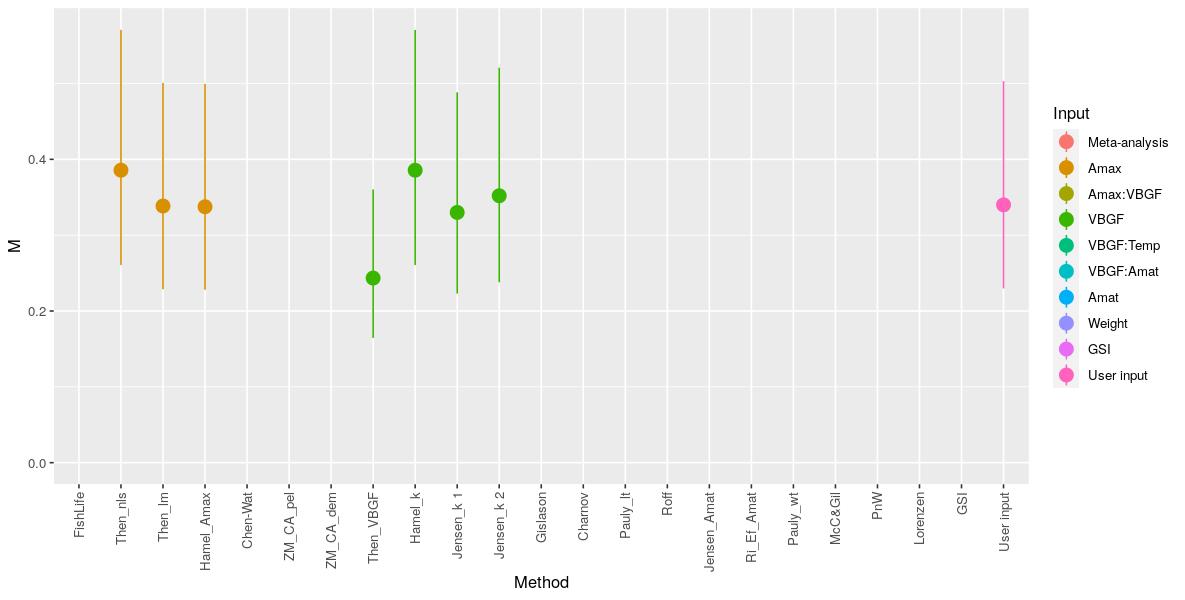
Figure. 9.11: Empirical estimates of natural mortality (M) based on maximum age and von Bertalanffy parameters for female Caribbean spiny lobster.
Figure 9.12: Empirical estimates of natural mortality (M) based on maximum age and von Bertalanffy parameters for male Caribbean spiny lobster.
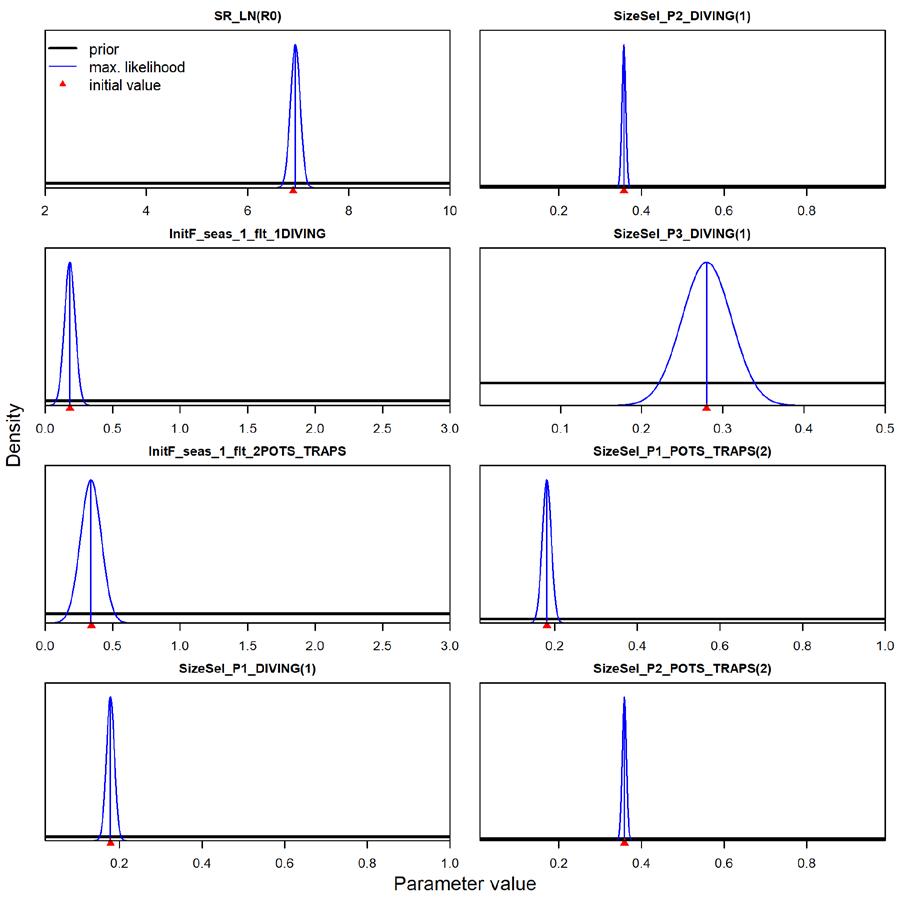
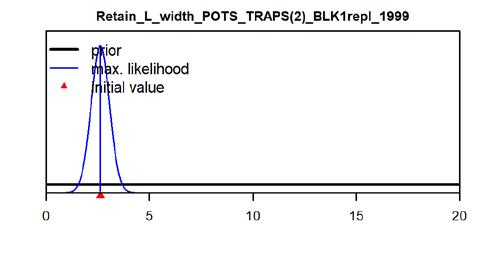
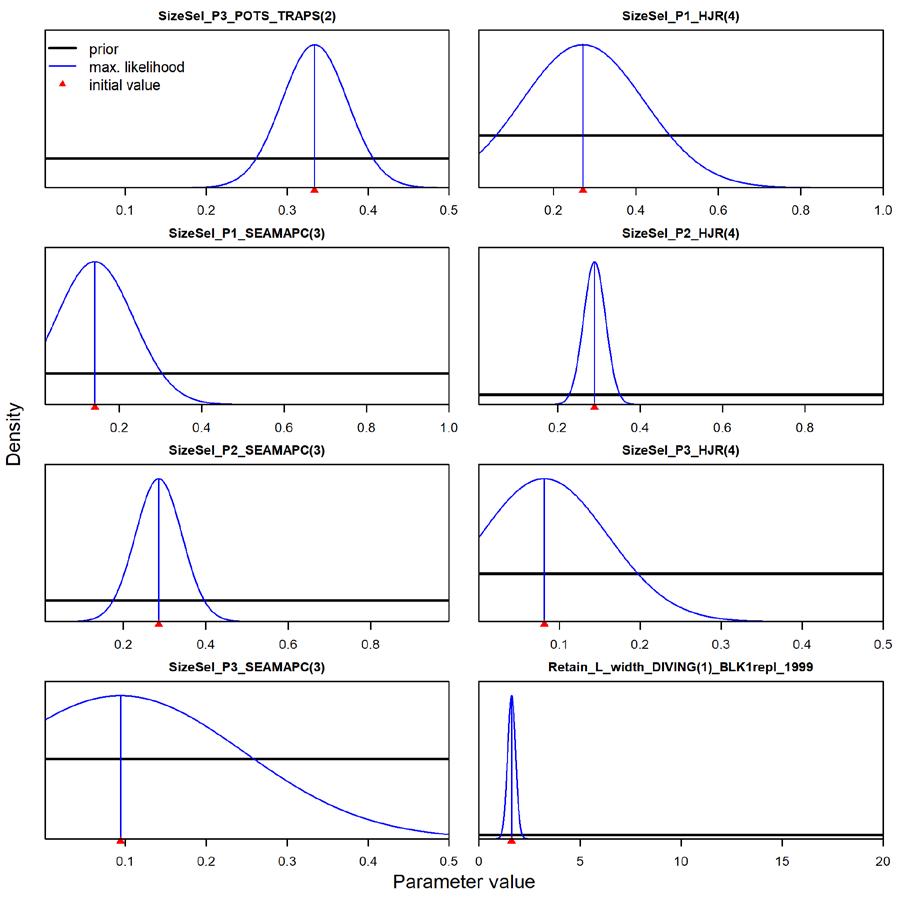
Figure 9.13: Puerto Rico spiny lobster parameter distribution for, in descending order from left to right, the natural log of the unfished recruitment parameter of the Beverton – Holt stock-recruit function, initial fishing mortality for the dive fishery, initial fishing mortality for the pot/trap fishery, the 1st limb parameter of the exponential logistic selectivity function for the dive fleet, the retention parameter for the pot/trap time-varying selectivity, the asymptote parameter of the exponential logistic selectivity function for the dive fleet, and the 2nd limb parameter of the exponential logistic selectivity function for the dive fleet, the 1st limb parameter of the exponential logistic selectivity function for the pot/trap fleet, the asymptote parameter of the exponential logistic selectivity function for the pot/trap fleet, and the 2nd limb parameter of the exponential logistic selectivity function for the pot/trap fleet, the 1st limb parameter of the exponential logistic selectivity function for the SEAMAP-C survey fleet, the asymptote parameter of the exponential logistic selectivity function for the SEAMAP-C survey fleet, and the 2nd limb parameter of the exponential logistic selectivity function for the SEAMAP-C survey fleet, the 1st limb parameter of the exponential logistic selectivity function for the HJR Reefscaping survey fleet, the asymptote parameter of the exponential logistic selectivity function for the HJR Reefscaping survey fleet, and the 2nd limb parameter of the exponential logistic selectivity function for the HJR Reefscaping survey fleet, and the retention parameter for the time-varying dive selectivity.
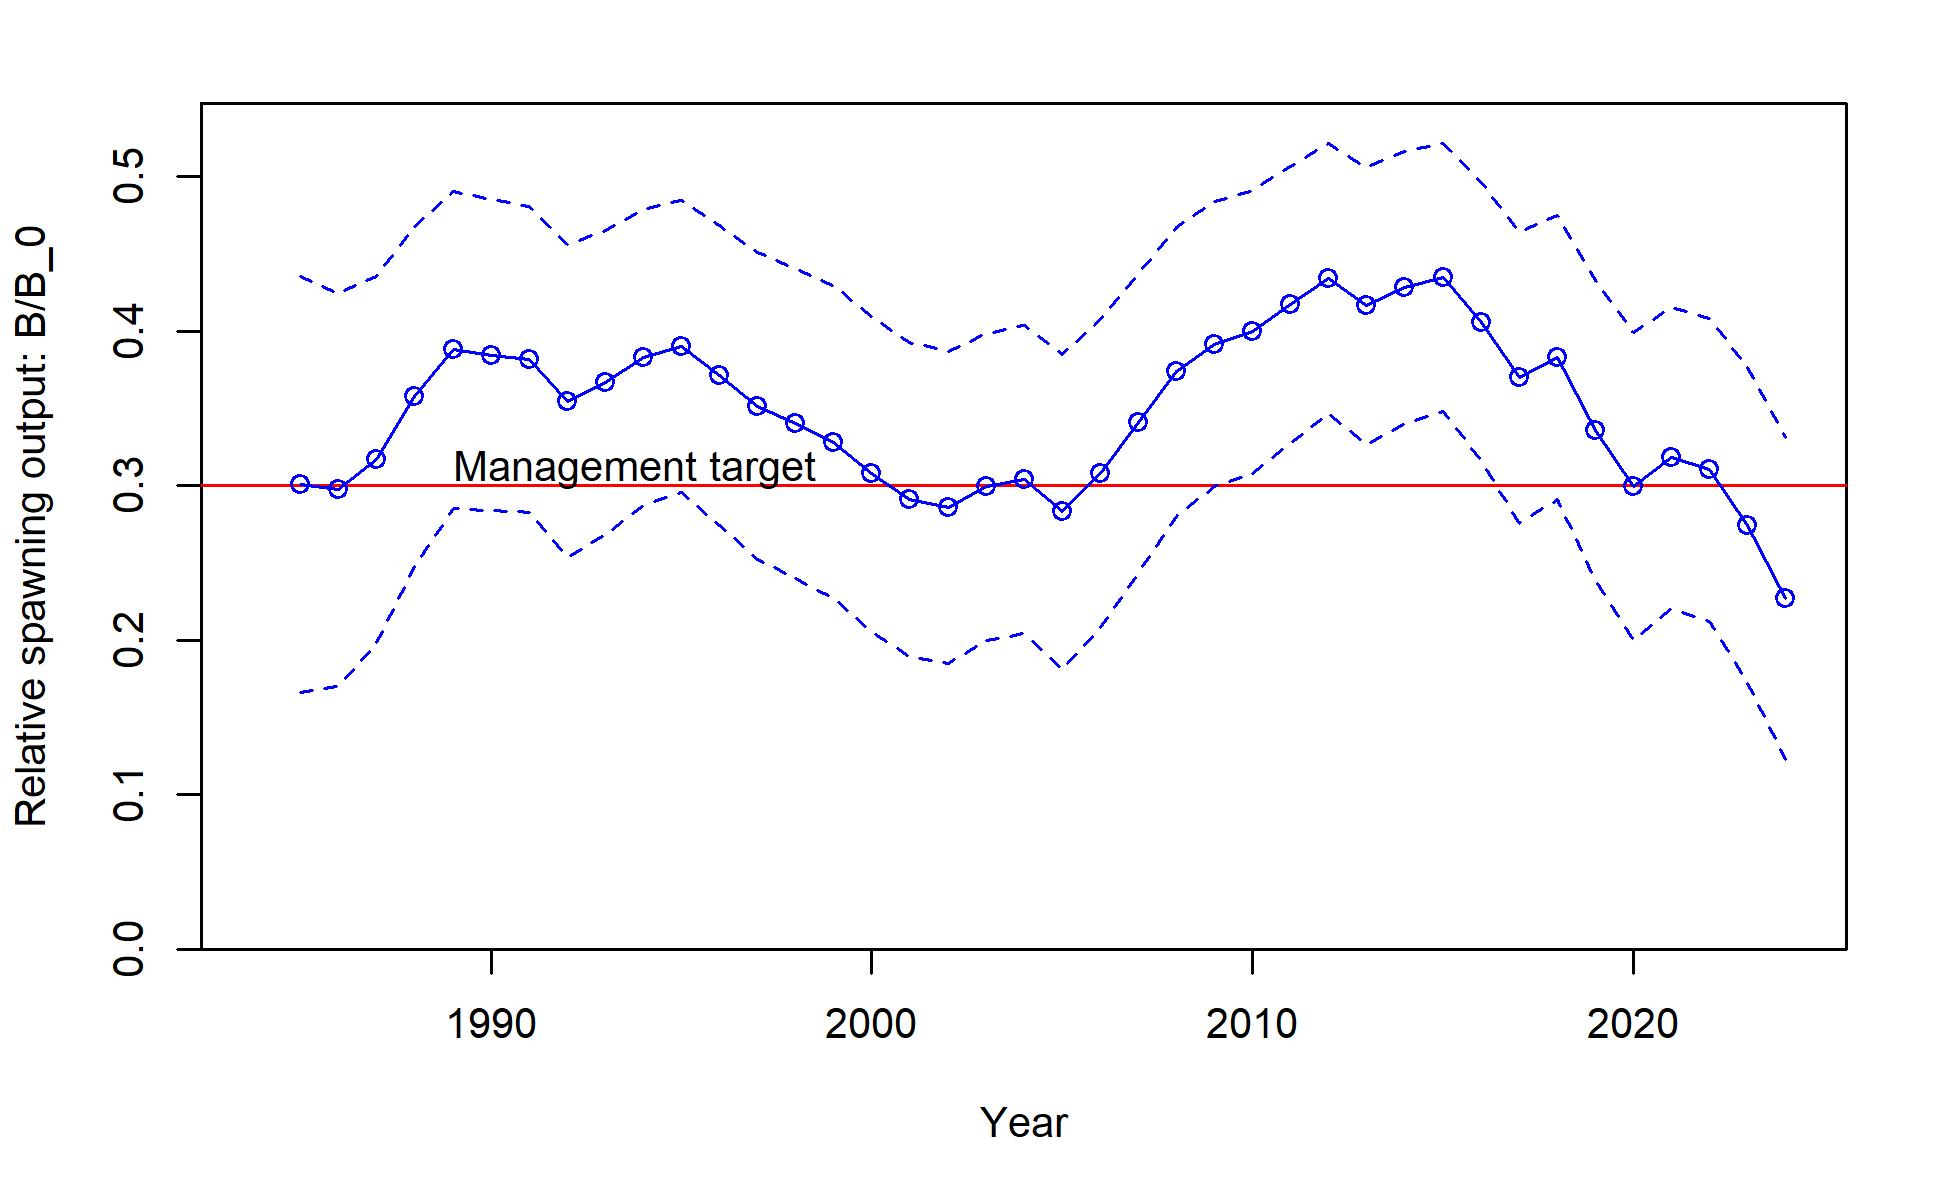
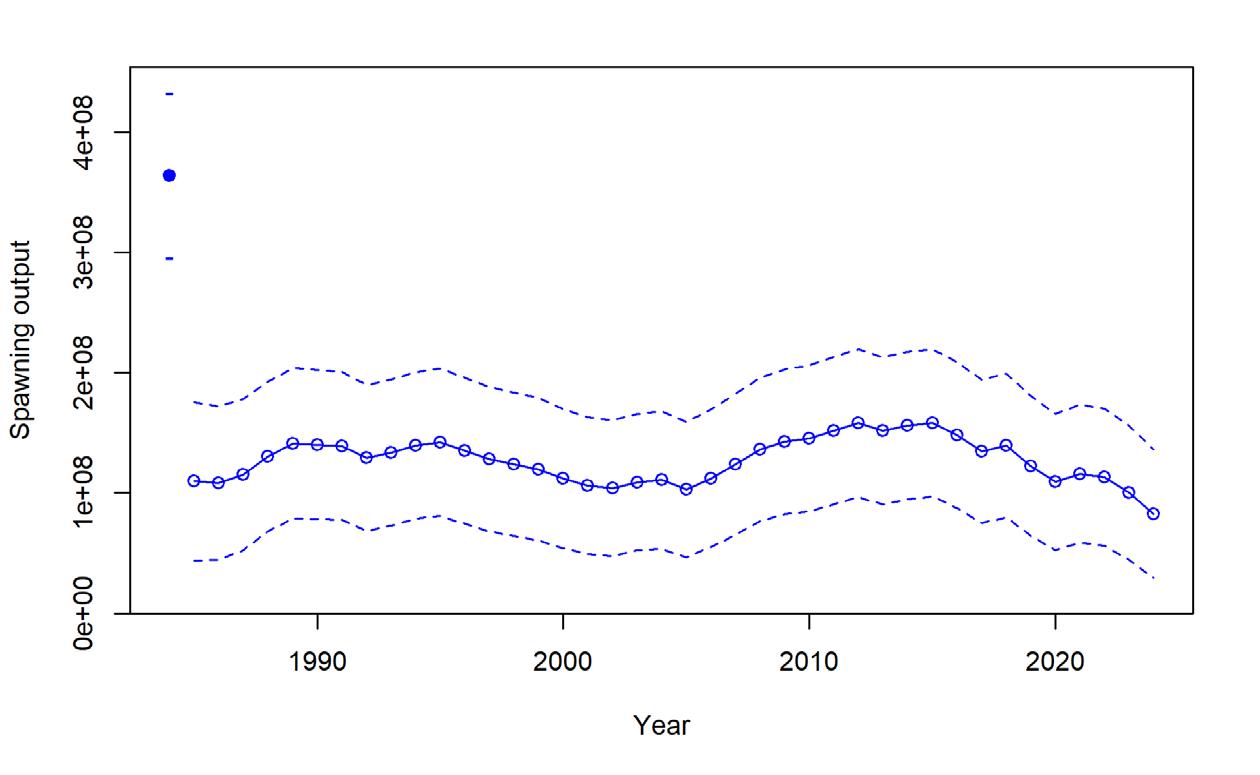
a. Spawning Biomass Ratio
b. Spawning Biomass
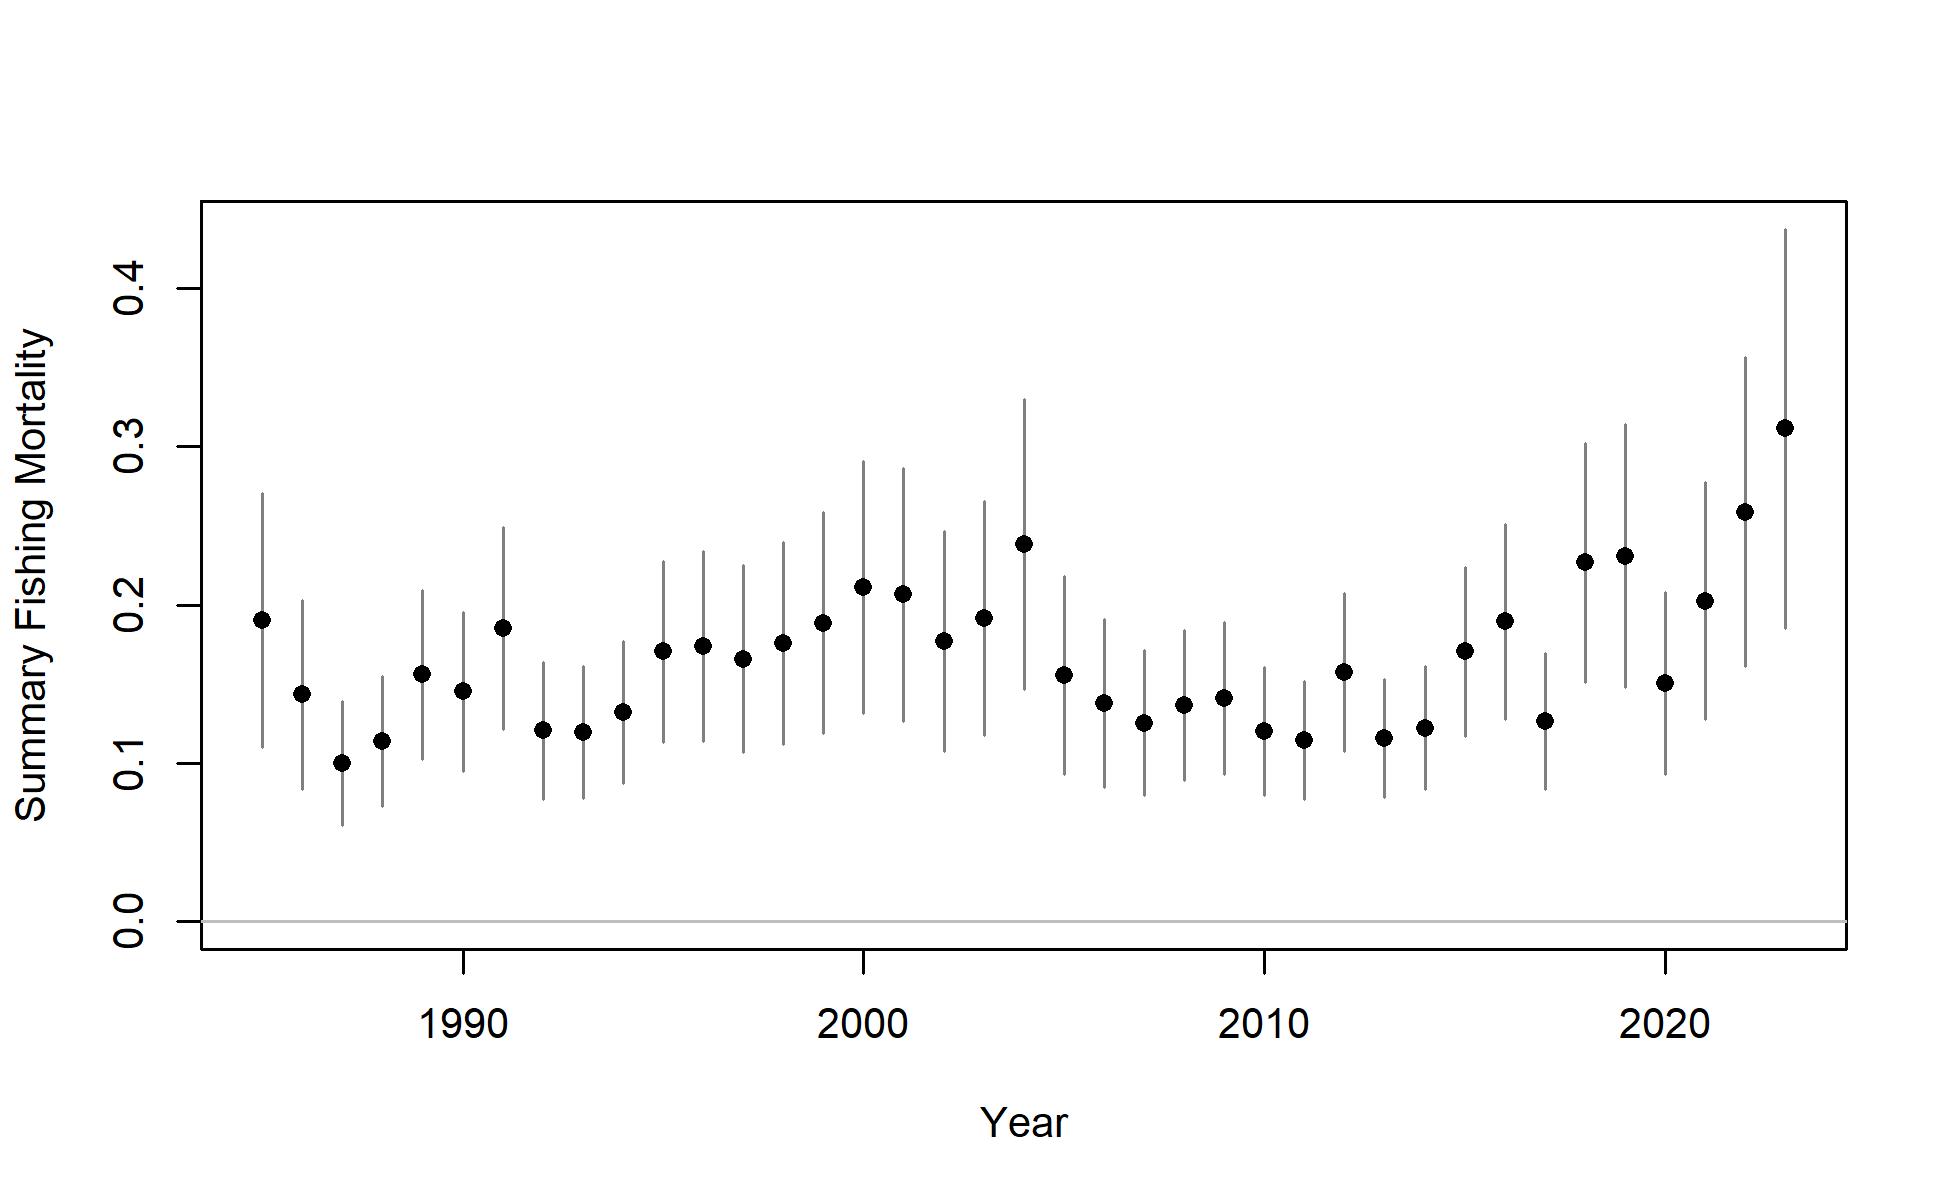
c. Fishing Mortality
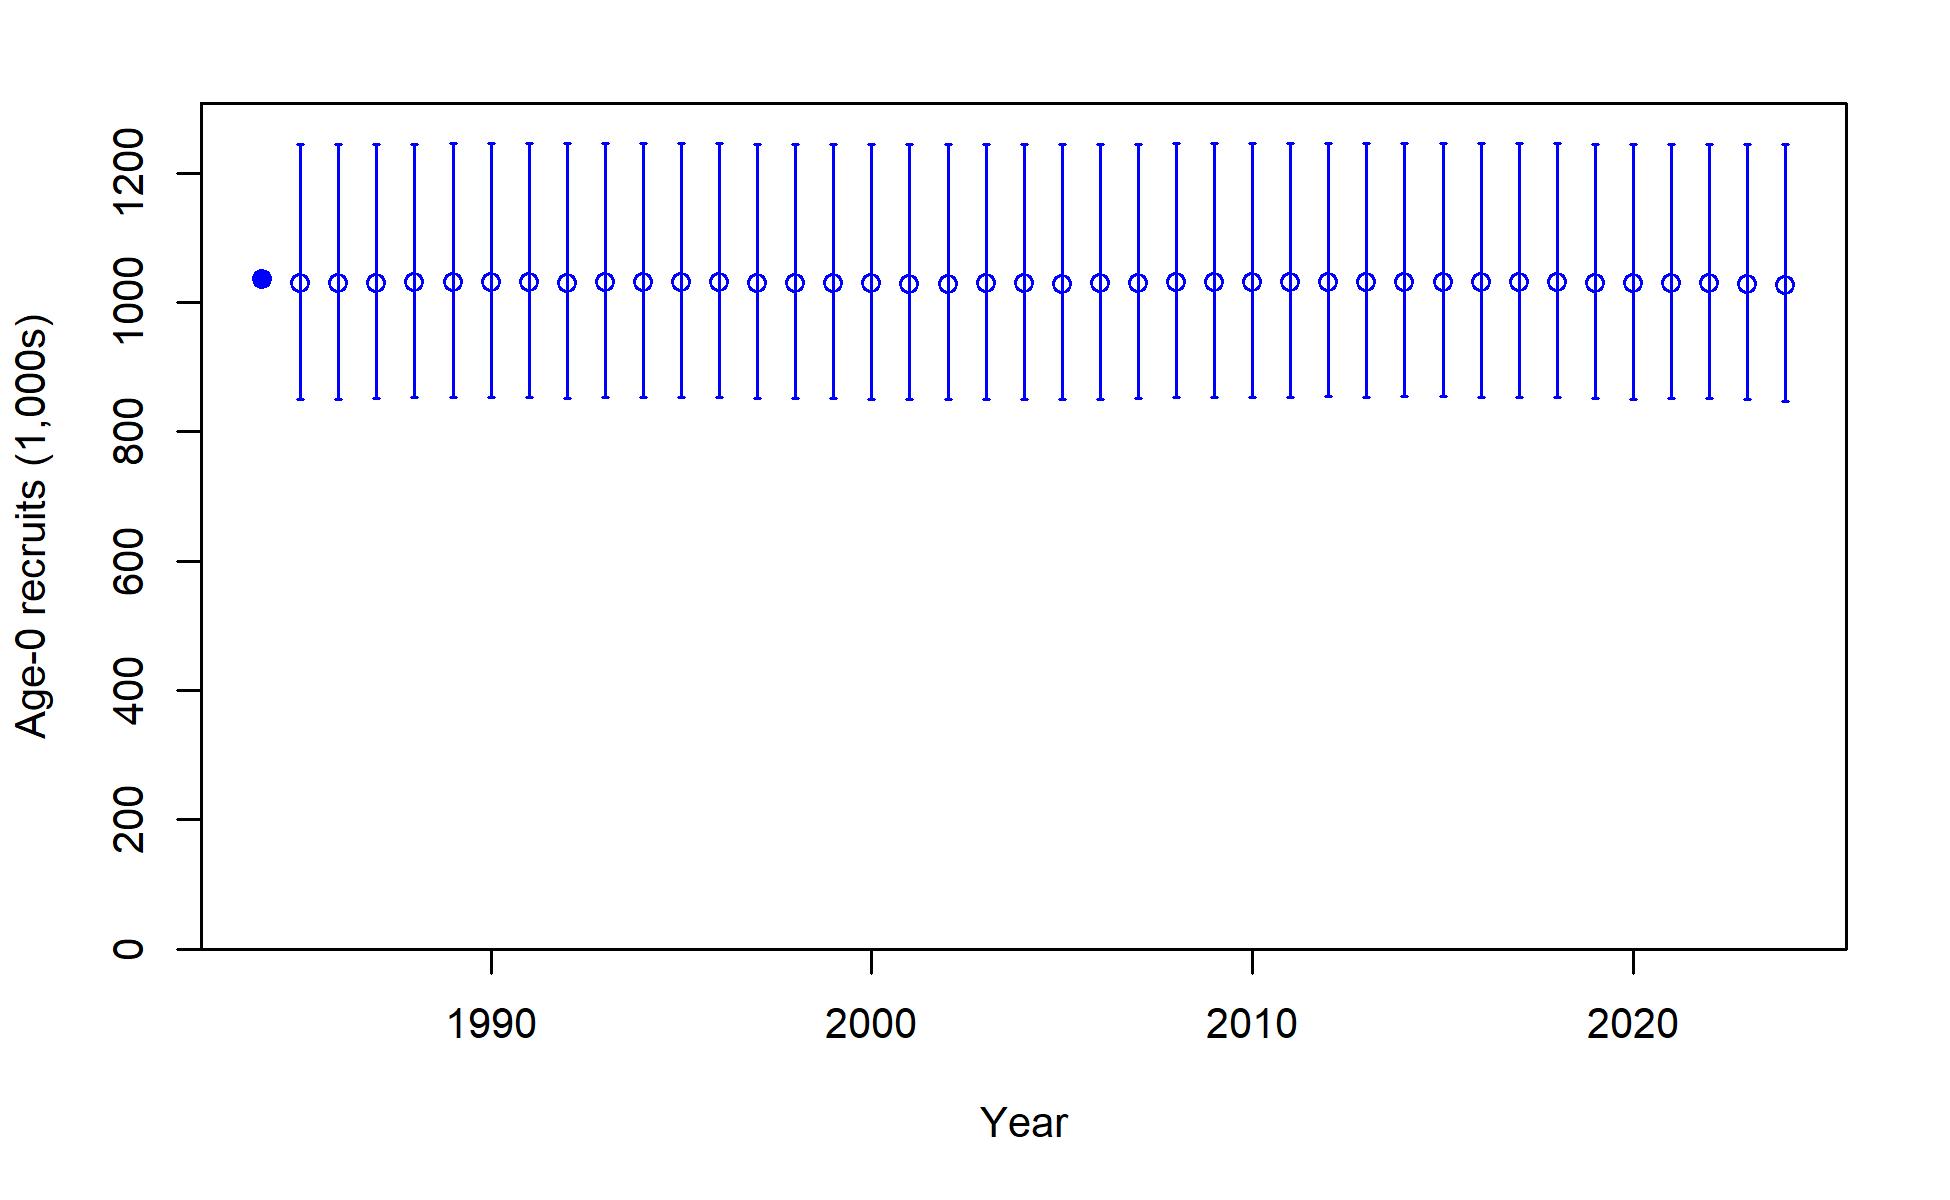
d. Recruitment
Figure 9.14: St. Puerto Rico spiny lobster derived quantity time series from the base (new_eq) model. Derived quantities plotted over time for (a) the spawning biomass ratio (total biomass / unfished spawning stock biomass), (b) spawning stock biomass in metric tons, (c) fishing mortality (total biomass killed / total biomass), (d) and recruitment in thousands of fish. The shaded areas and vertical bars in the derived quantities time series represent 95% confidence intervals.
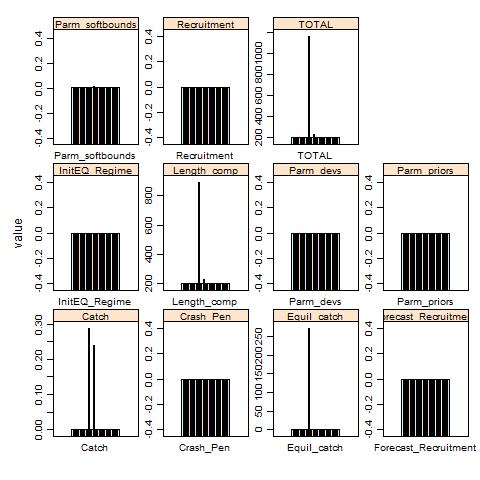
Figure 9.15: Puerto Rico spiny lobster jitter analysis total likelihood for the base (new_eq) model. Each panel gives the results of 40 runs of the corresponding model scenario where the starting parameter values for each run were randomly changed by 50% from each model’s predicted values using a uniform distribution in cumulative normal space.
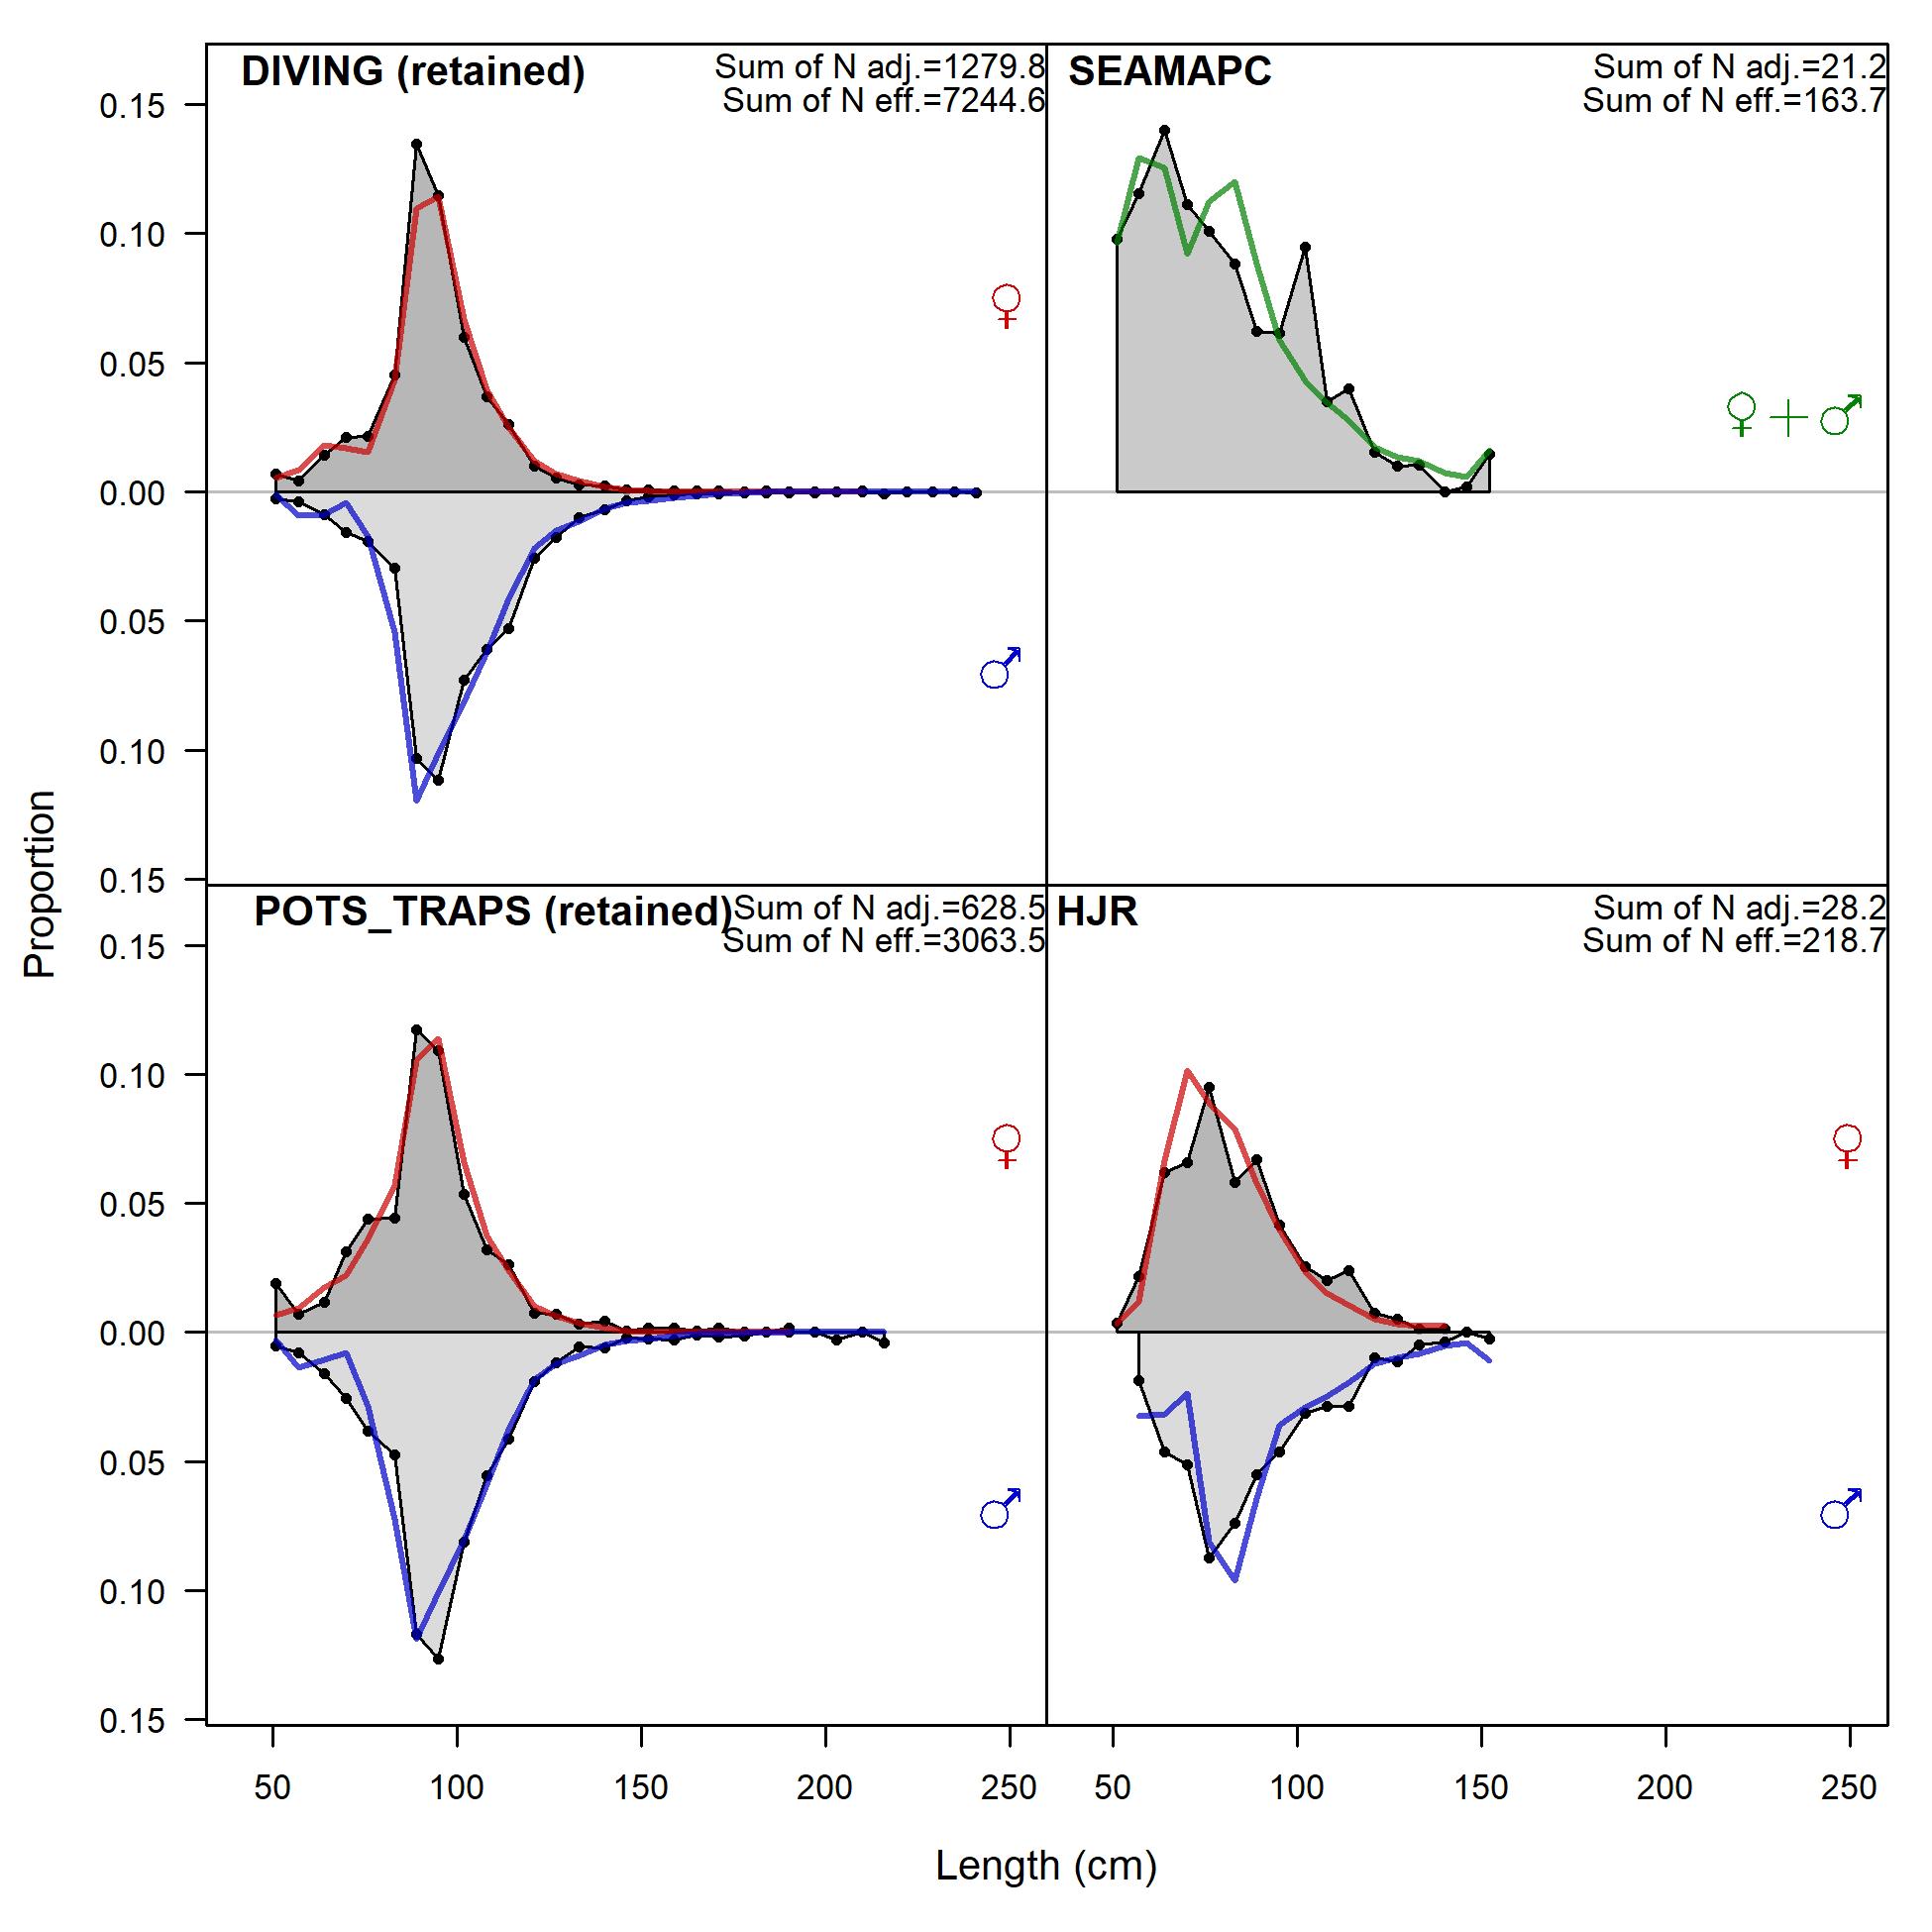
Figure 9.16: Puerto Rico spiny lobster observed and predicted length distributions (new_eq) in millimeters. Red and blue solid lines represent predicted length compositions, while gray regions represent observed length compositions. The effective sample sizes used to weight the length composition data are provided by N adj (the input sample size) and N eff (the calculated effective sample size) and are shown in the upper right corners. N adj and N eff are summed over sex.
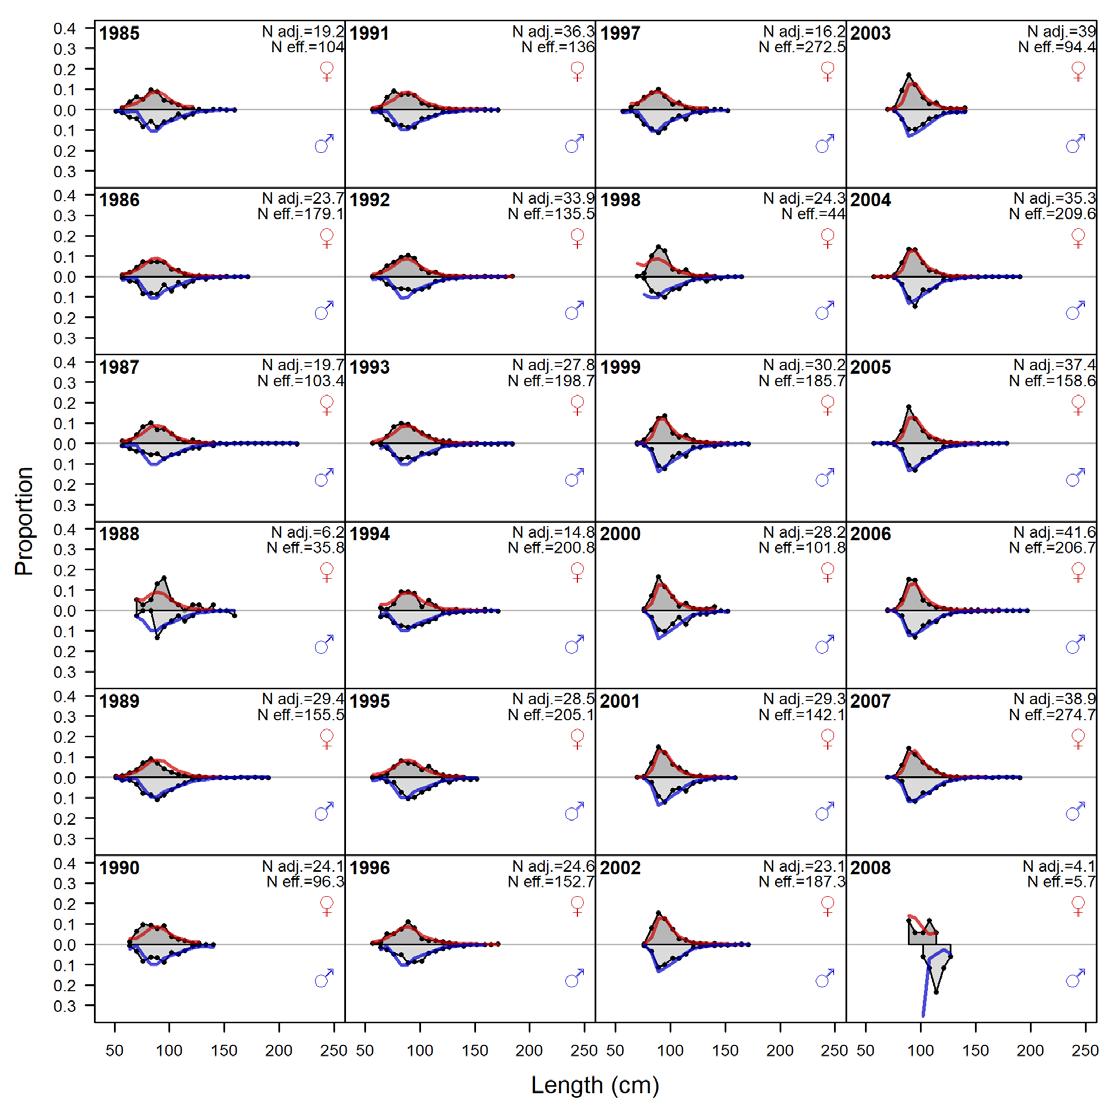
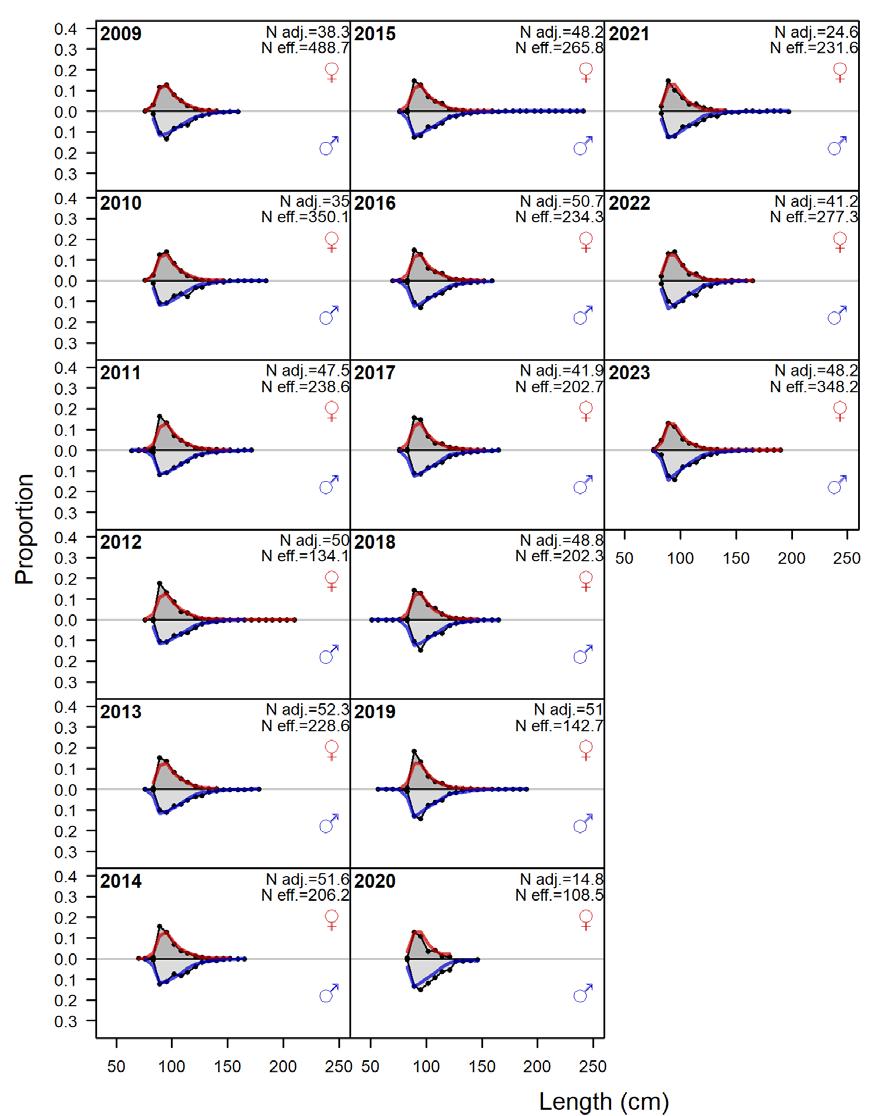
Figure 9.17: Puerto Rico spiny lobster observed (grey) and predicted (solid line) dive fleet length composition (new_eq) by individual year and sex: females (red) and males (blue). The effective sample sizes used to weight the length composition data are provided by N adj (the input sample size) and N eff (the calculated effective sample size) and are shown in the upper right corners. N adj and N eff are summed over sex.
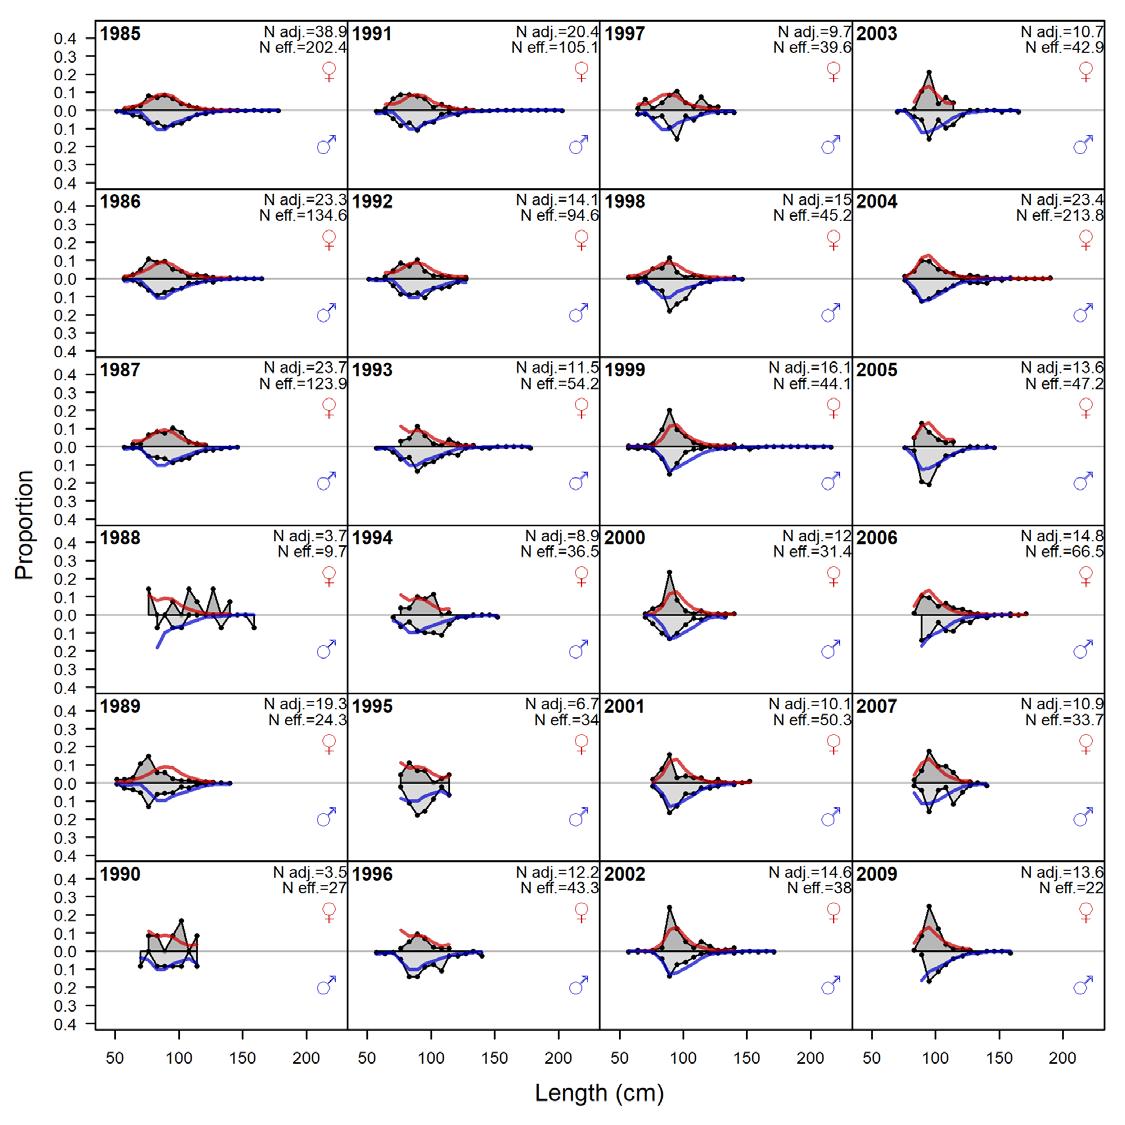
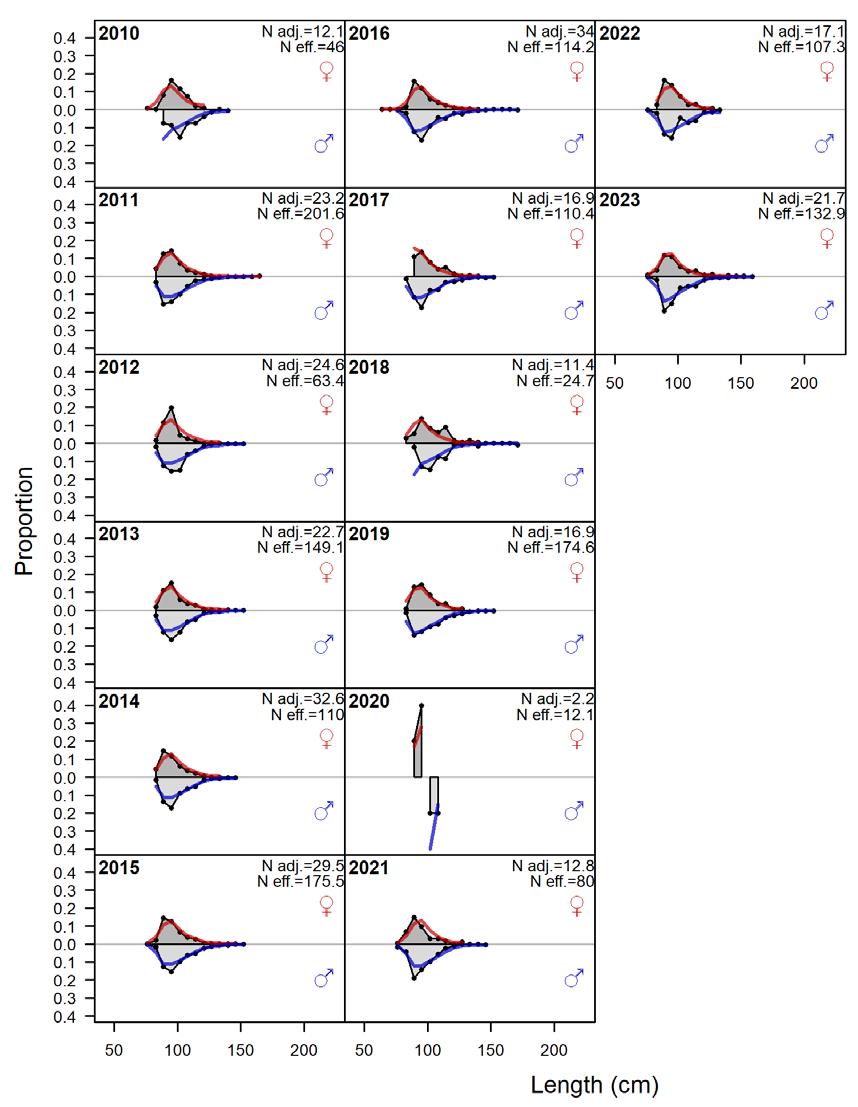
Figure 9.18: Puerto Rico spiny lobster observed (grey) and predicted (solid line) pot/trap fleet length composition (new_eq) by individual year and sex: females (red) and males (blue). The effective sample sizes used to weight the length composition data are provided by N adj (the input sample size) and N eff (the calculated effective sample size) and are shown in the upper right corners. N adj and N eff are summed over sex.
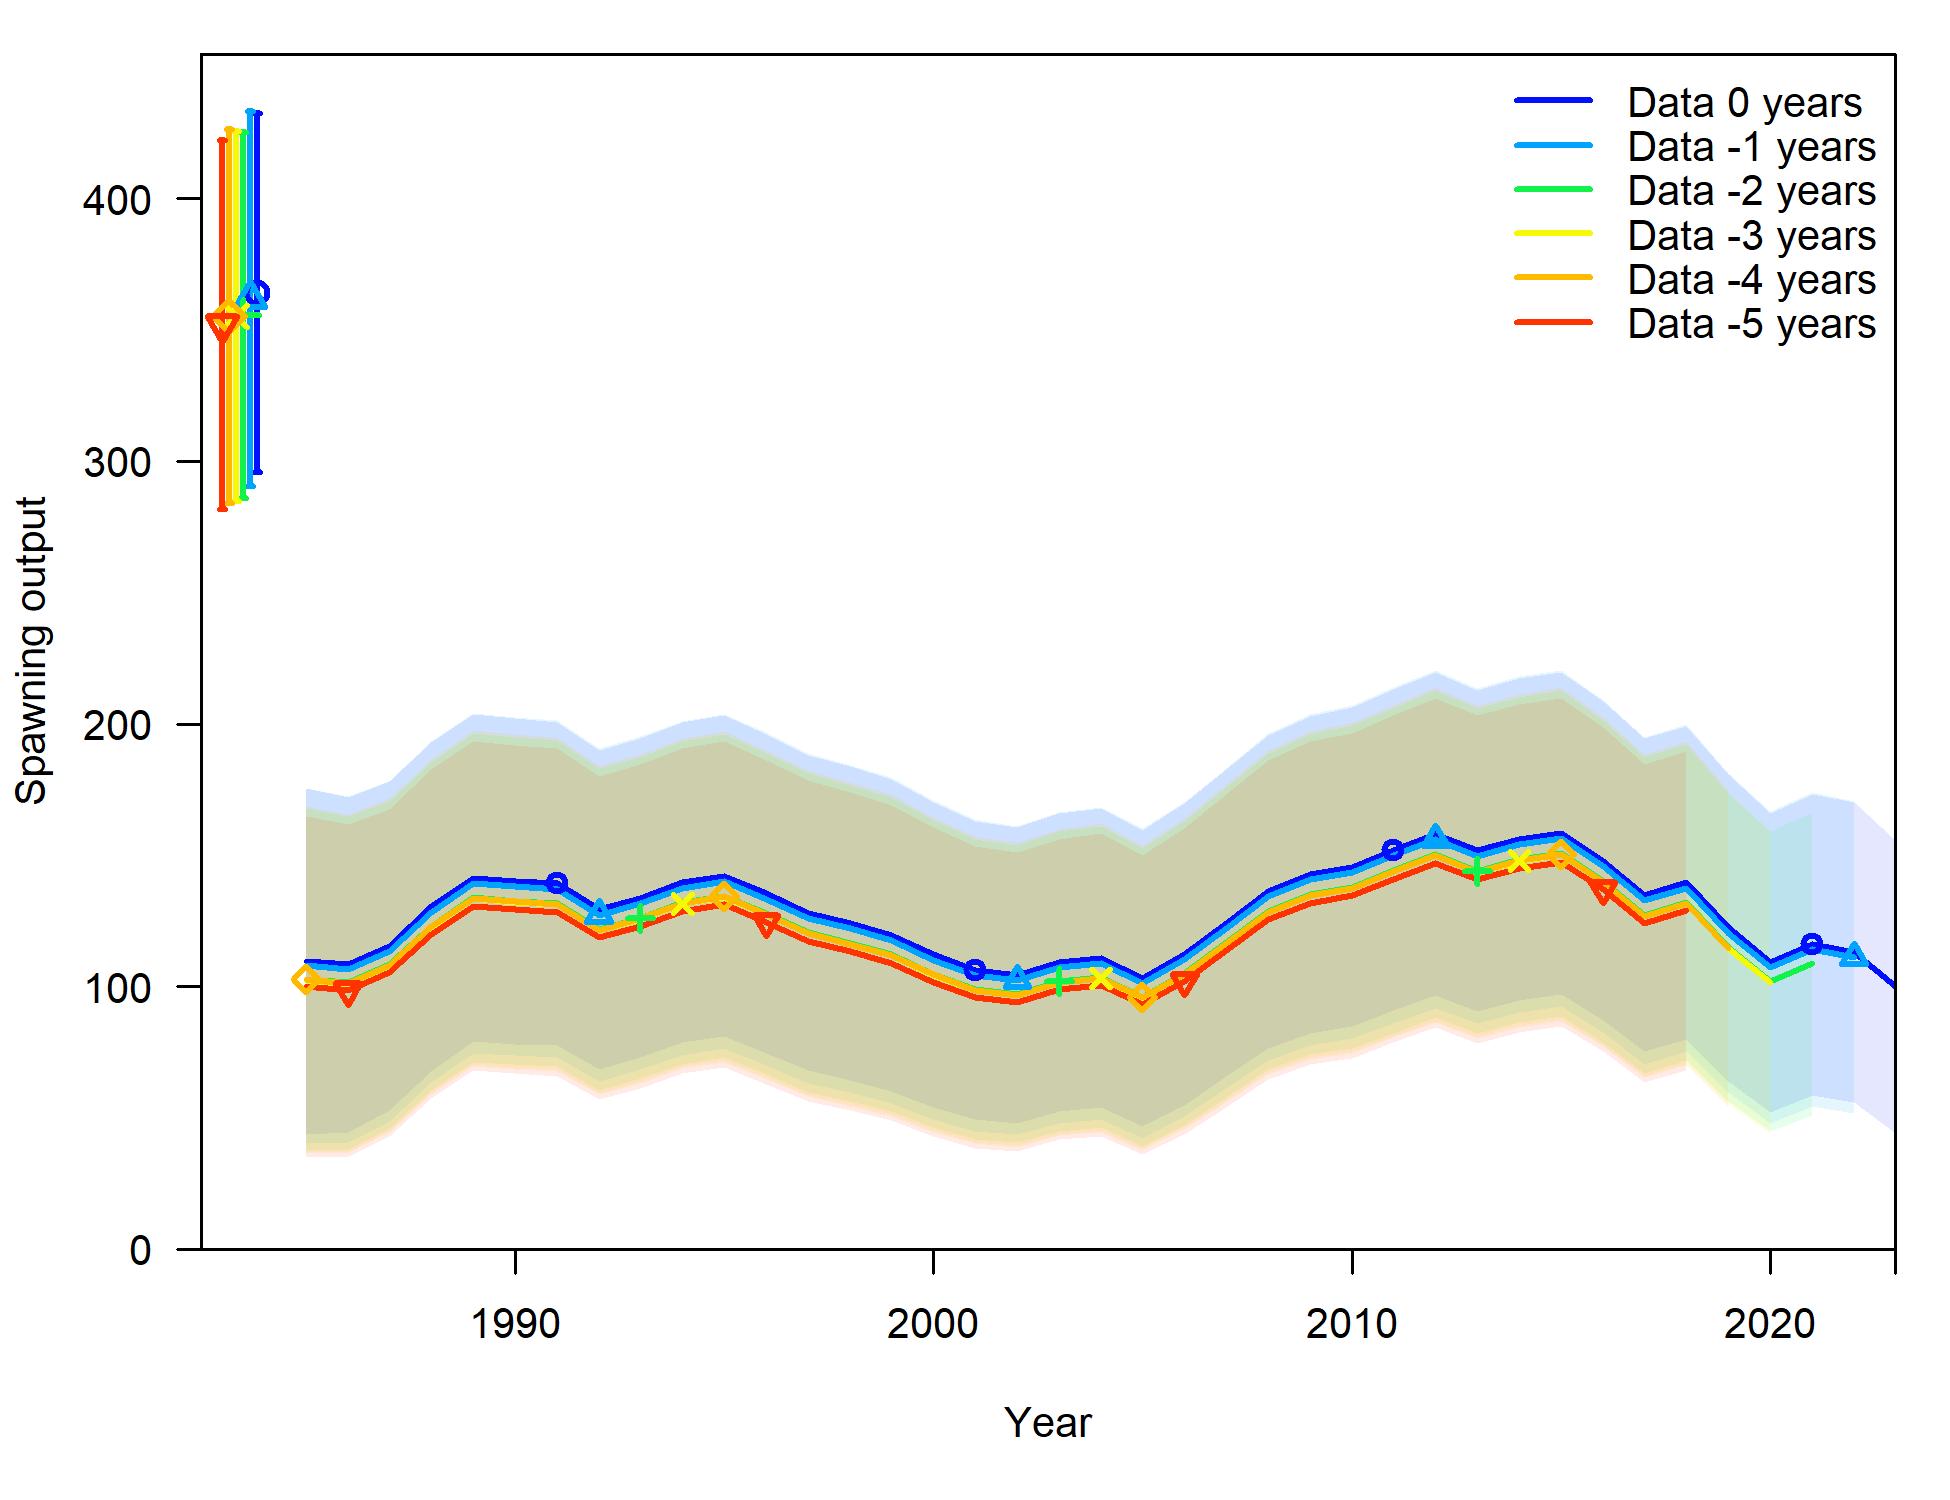
Figure 9.19: Puerto Rico spiny lobster retrospective analysis of spawning stock biomass (SSB) (new_eq) conducted by refitting models after removing five years of observation, one year at a time sequentially. Grey shaded areas are the 95% confidence intervals.
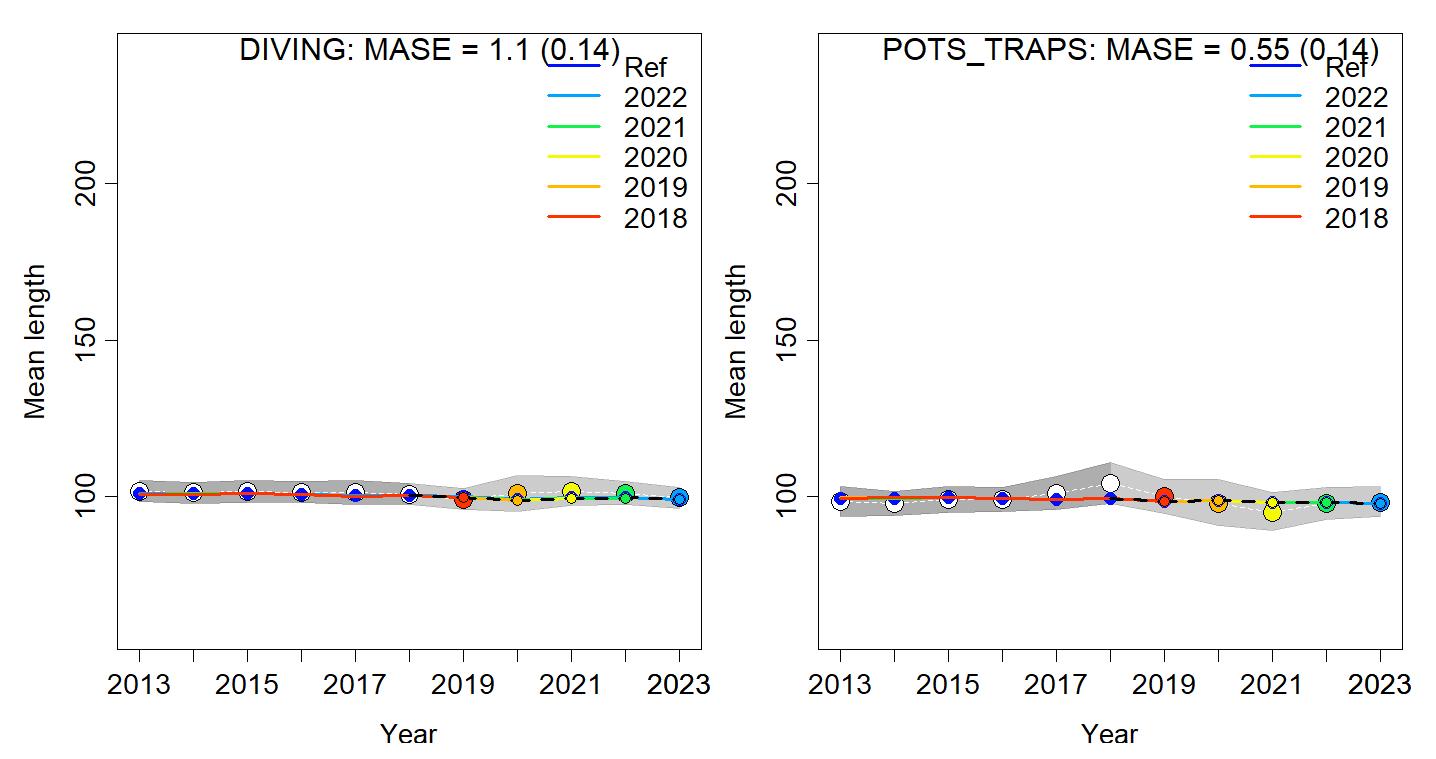
Figure 9.20: Puerto Rico spiny lobster hindcast cross-validation plots of mean absolute scaled error (MASE) from hindcast model prediction of length composition time series by fleet: dive fleet (left) and pot/trap fleet (right).
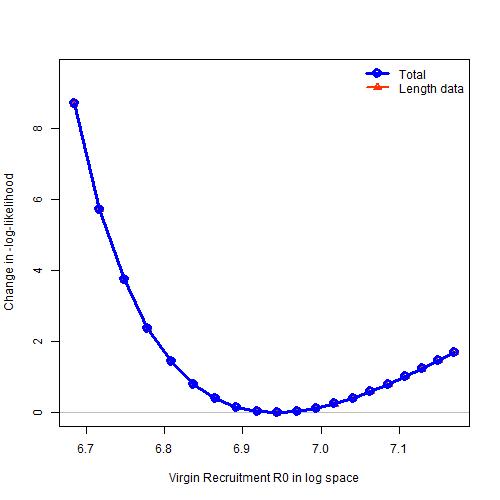
Figure 9.21: The profile likelihood for the natural log of the unfished recruitment parameter of the Beverton – Holt stock-recruit function for Puerto Rico spiny lobster (new_eq). Each line represents the change in negative log-likelihood value for each of the data sources fit in the model across the range of fixed unfished recruitment values tested in the profile diagnostic run.
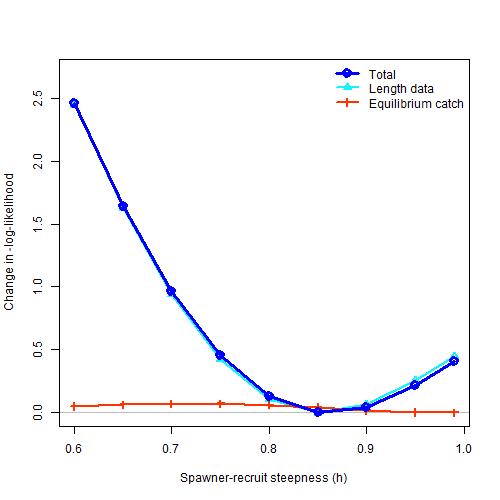
Figure 9.22: The profile likelihood for the steepness parameter of the Beverton –Holt stock-recruit function for Puerto Rico spiny lobster (new_eq). Each line represents the change in negative log-likelihood value for each of the data sources fit in the model across the range of fixed steepness values tested in the profile diagnostic run.
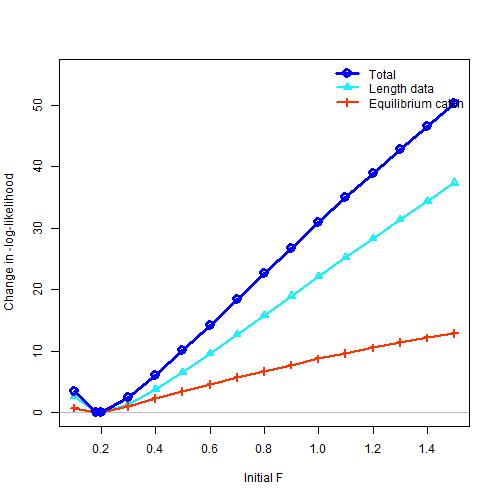
Figure 9.23: The profile likelihood for initial fishing mortality parameter for the Puerto Rico spiny lobster dive fleet (new_eq). Each line represents the change in negative log-likelihood value for each of the data sources fit in the model across the range of fixed steepness values tested in the profile diagnostic run.
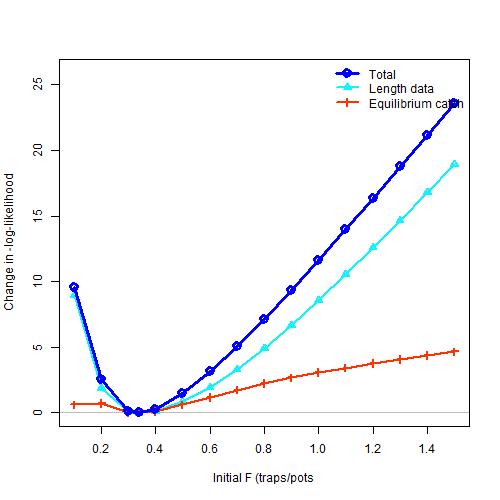
Figure 9.24: The profile likelihood for initial fishing mortality parameter for the Puerto Rico spiny lobster pot/trap fleet (new_eq). Each line represents the change in negative log-likelihood value for each of the data sources fit in the model across the range of fixed steepness values tested in the profile diagnostic run.
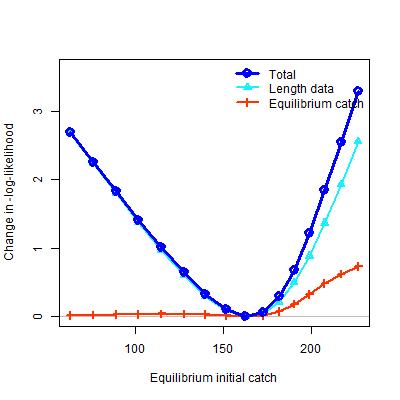
9.25: The profile likelihood for initial equilibrium catch for Puerto Rico spiny lobster (new_eq). Each line represents the change in negative log-likelihood value for each of the data sources fit in the model across the range of fixed steepness values tested in the profile diagnostic run.
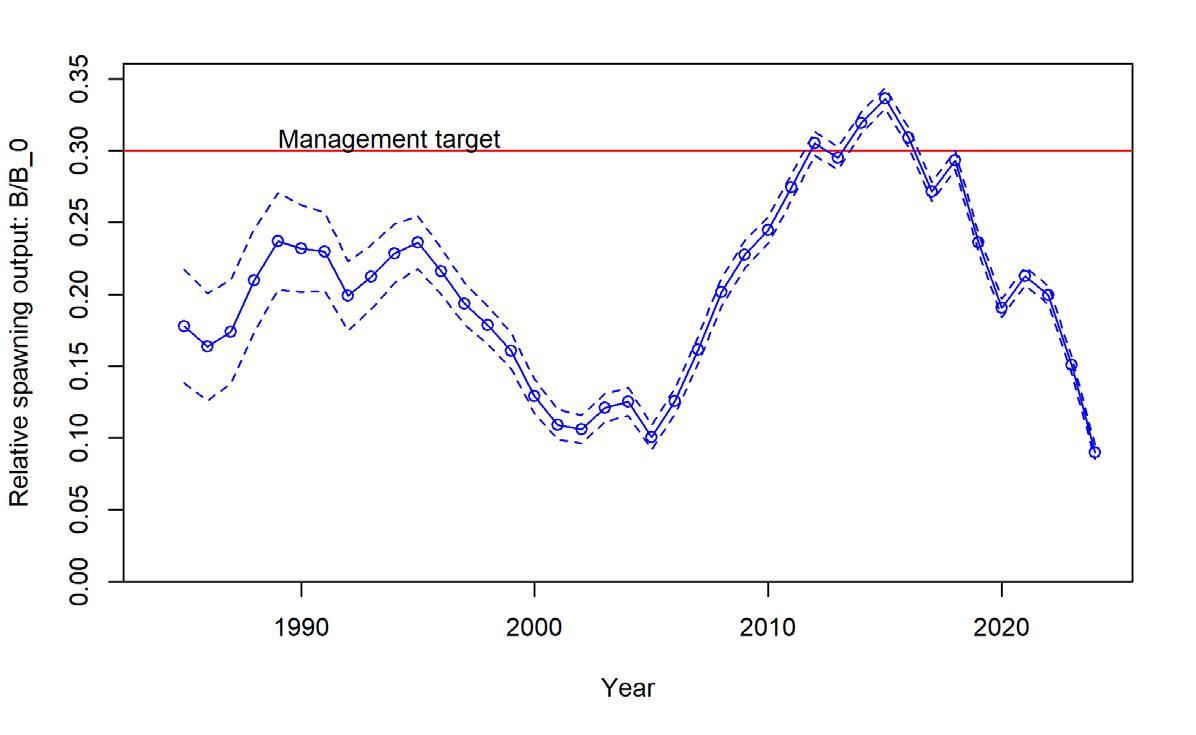
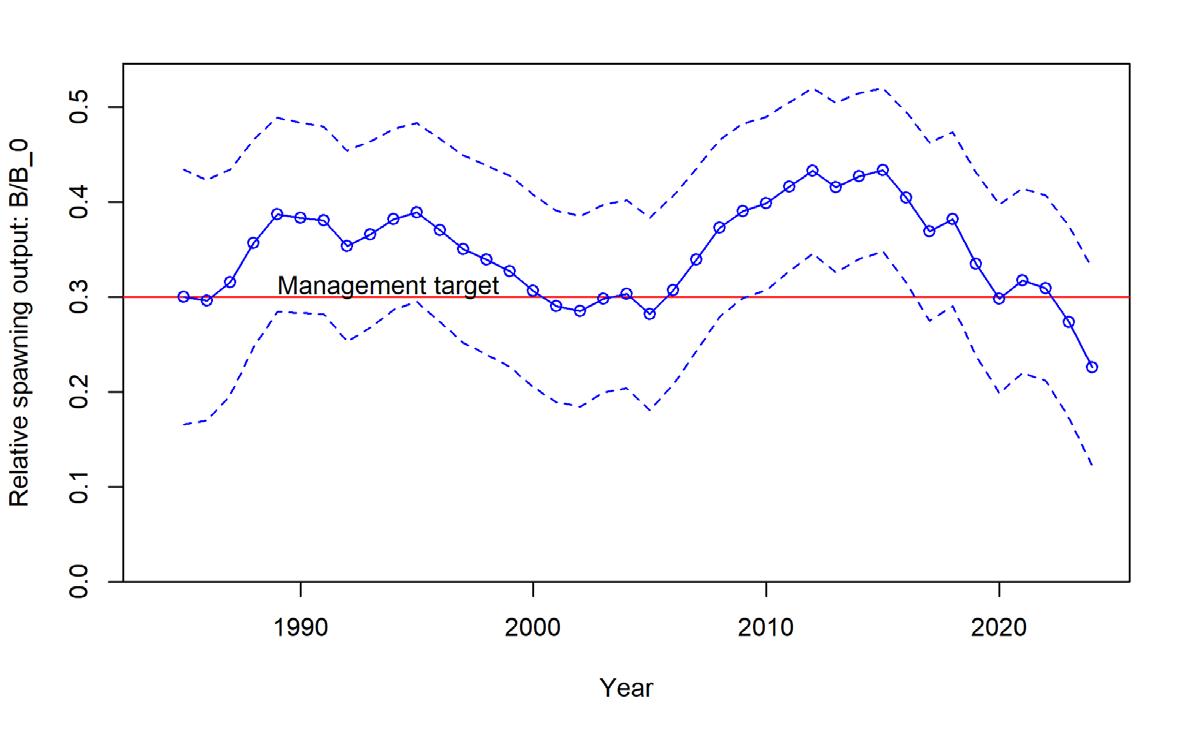
(selex1)
(selex2)
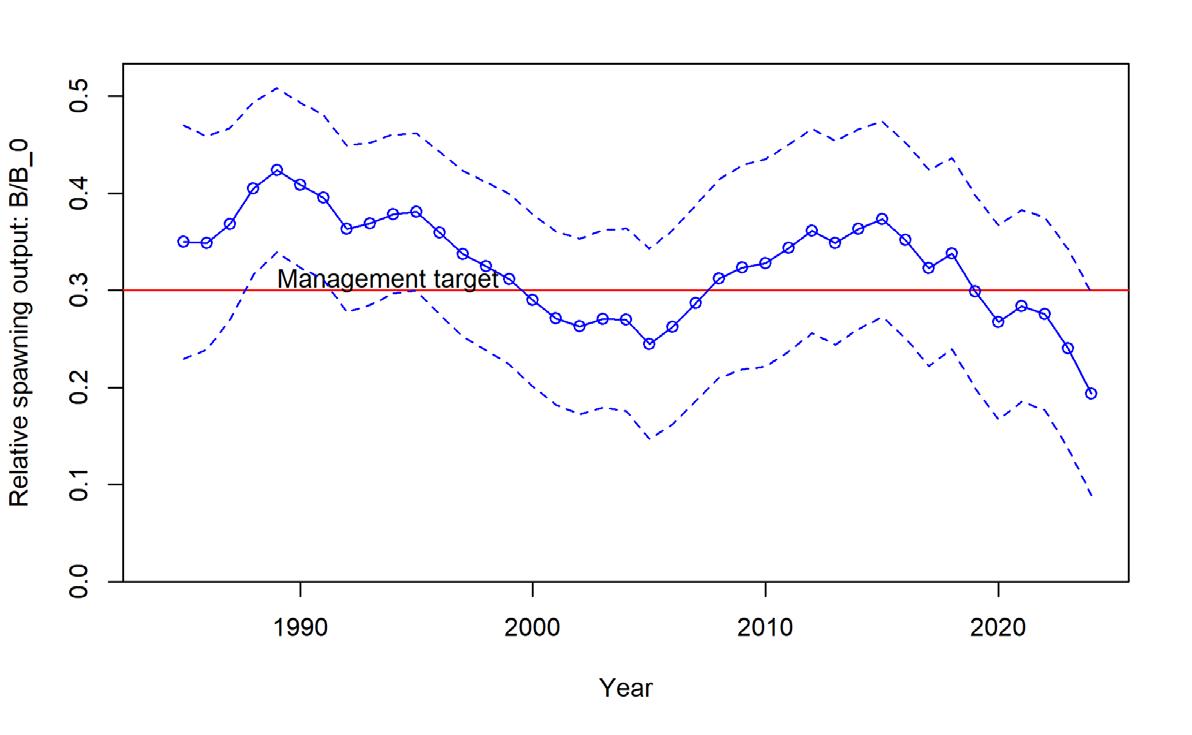
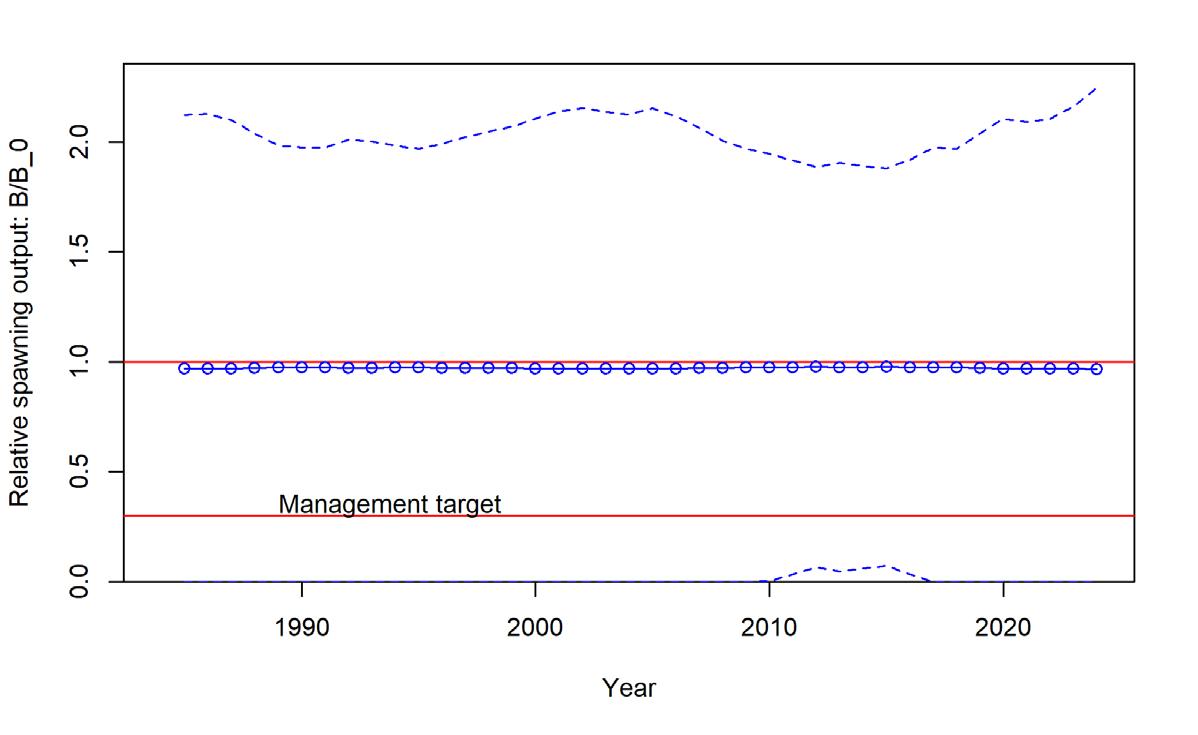
(steep)
(combsex)
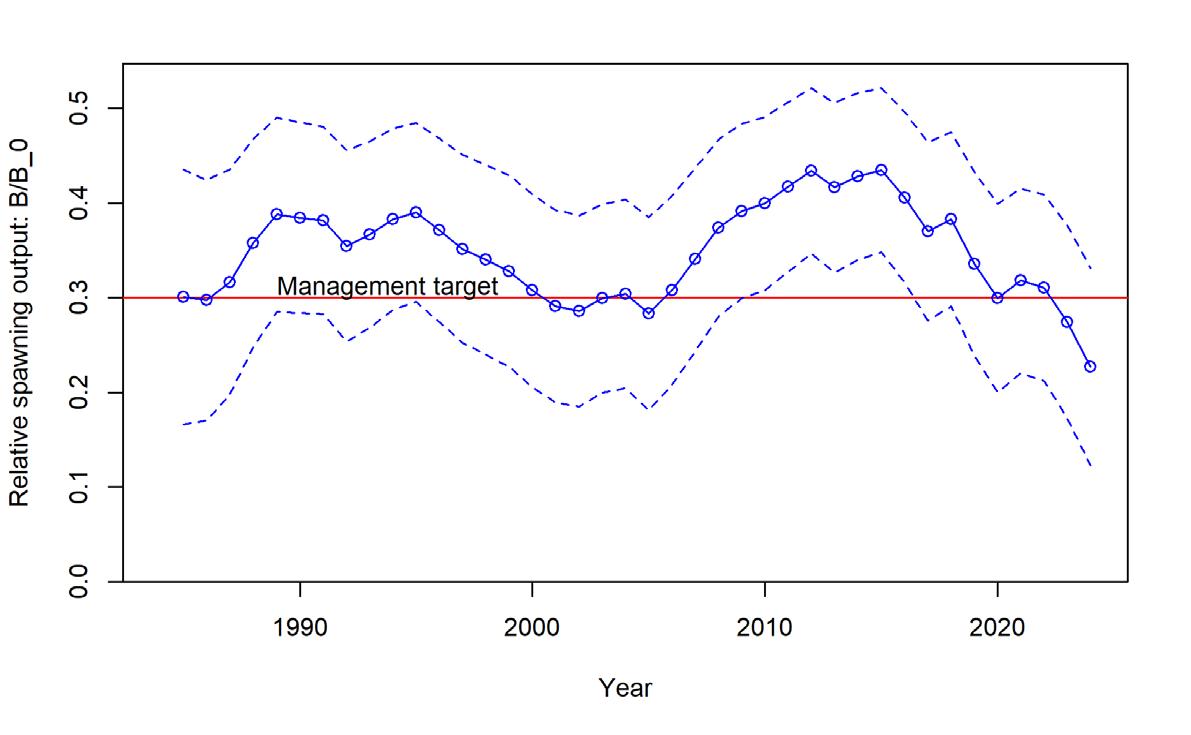
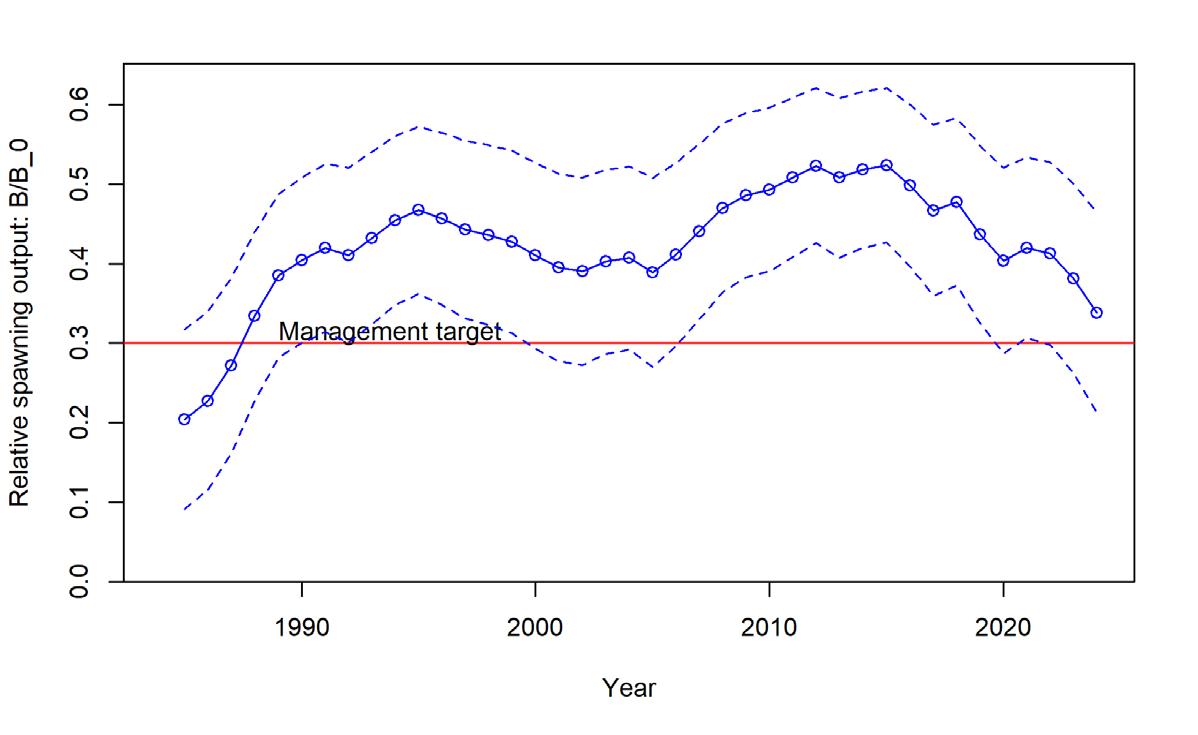
(lw)
(eq_hi)
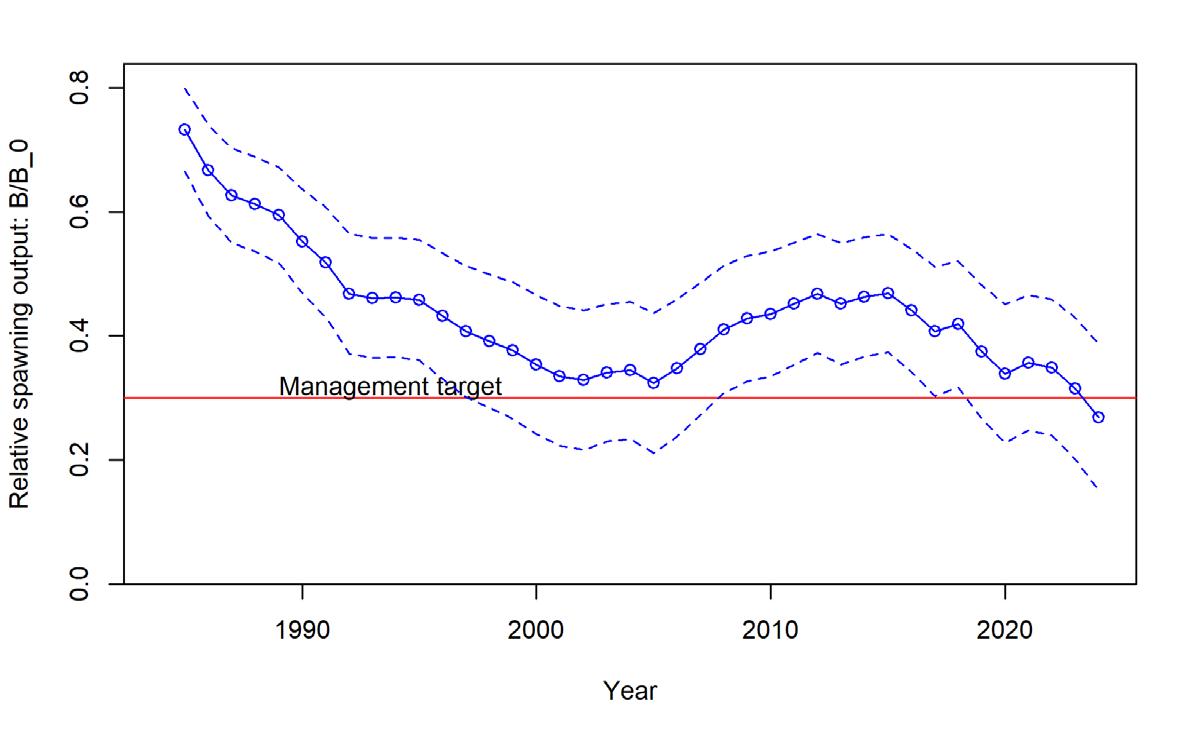
(eq_lo)
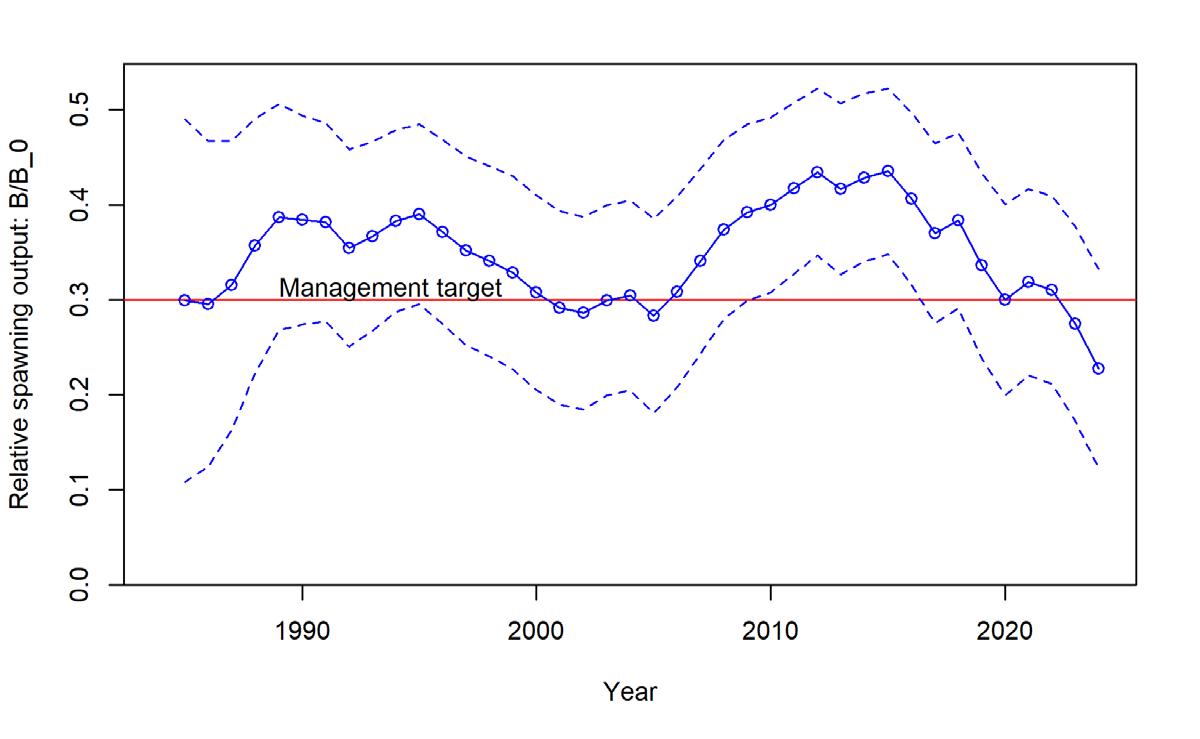
(eq_cv_hi )
Figure 9.26: Puerto Rico spiny lobster estimated relative spawning output (biomass/unfished biomass) from sensitivity models: selex1, selex2, steep, combsex, lw, eq_hi, eq_low, and eq_cv_hi in descending order.
4055 Faber Place Drive, Suite 201 North Charleston, SC 29405
- When developing new research projects, consider how those projects can be designed to include data collection and/or analyses that would inform ecosystem models and analyses. The original objectives of the project should not be compromised, however.
1.1 LIFE HISTORY RESEARCH RECOMMENDATIONS
- Life history studies focused on the US Caribbean – generate region-specific parameters for growth, fecundity, natural mortality.
- Look for ongoing growth/aging work via SEAMAP-C and DNER who is involved in doing histology for reproductive analyses.
- Merge selectivity studies, life history data collection, and fishery-independent survey frameworks to determine how to get best data for stock assessment. 1.2
COMMERCIAL FISHERY STATISTICS RESEARCH RECOMMENDATIONS
1.2.1 Length Composition Research Recommendations
- Compare SEAMAP-C, HJR Reefscaping, and MER Consultants CL composition to TIP size composition.
1.2.2 Commercial Landings Research Recommendations
- - Track number of fishers/year in relation to annual landings- how does it vary?
- Support connectivity studies – consider spiny lobster as one stock vs. by island (metapopulation).
- Investigate weak/lack of correlation between TIP and landings data
- Demand analysis: look at price per pound (survey), market preferences, trends and correlation with landings, and for all islands.
- Investigate species associations with spiny lobster.
- Investigate recruitment connectivity between island platforms; e.g., STX seeding PR and other “hypotheses”.
- Increase funding for port samplers to improve TIP data collection in PR.
- Increase IT support for automated expansion factors calculation for the landings.
1.3 DISCARDS AND DISCARD MORTALITY RESEARCH RECOMMENDATIONS
- Discard information in the catch reports does not allow data on length or sex in current reporting schema.
1.4 RECREATIONAL FISHERY STATISTICS RESEARCH RECOMMENDATIONS
No research recommendations were provided.
1.5
MEASURES OF POPULATION ABUNDANCE RESEARCH RECOMMENDATIONS
- There were no recommendations from the panel regarding use of fishery-independent data in the Puerto Rico assessment model. However, the panel recommended that analysts not explore standardization of fishery-dependent data for use as an index of relative abundance.
2. ASSESSMENT PROCESS RESEARCH RECOMMENDATIONS
- Continue the SEAMAP-C and HJR Reefscaping data collection programs for collecting spiny lobster size composition data.
- Leverage sociological research to obtain information on the proportion of PR landings were caught in PR waters prior to 1985.
- Consider the use of management strategy evaluation to explore the uncertainty in non-commercial catches.
3.
REVIEW PANEL RESEARCH RECOMMENDATIONS
The Review Workshop was cancelled so there were not review panel research recommendations compiled.