
SEDAR
Southeast Data, Assessment, and Review
SEDAR 84
Stock Assessment Report
US Caribbean Yellowtail Snapper – St. Thomas/ St. John August 2025
SEDAR
4055 Faber Place Drive, Suite 201 North Charleston, SC 29405
SEDAR
Southeast Data, Assessment, and Review
SEDAR 84
US Caribbean Yellowtail Snapper – St. Thomas/ St. John SECTION I: Introduction
4055 Faber Place Drive, Suite 201 North Charleston, SC 29405
Overview
SEDAR 84 addressed the stock assessment for US Caribbean Yellowtail Snapper – St. Thomas & St. John. The process consisted of an in-person Data Workshop, with several webinars before and after the workshop, series of assessment webinars, and an in-person Review Workshop. The assessment was conducted by the SEFSC.
The Stock Assessment Report is organized into 6 sections. Section I – Introduction contains a brief description of the SEDAR Process, Assessment and Management Histories for the species of interest, and the management specifications requested by the Cooperator. The Data Workshop Report can be found in Section II. It documents the discussions and data recommendations from the Data Workshop Panel. Section III is the Assessment Process report. This section details the assessment model, as well as documents any changes to the data recommendations that may have occurred after the data workshop. Consolidated Research Recommendations from all stages of the process can be found in Section IV for easy reference. Section V documents the discussions and findings of the Review Workshop (RW). Finally, Section VI – Addenda and Post-Review Workshop Documentation consists of any analyses conducted during or after the RW to address reviewer concerns or requests. It may also contain documentation of the final RW-recommended base model, should it differ from the model put forward in the Assessment Report for review.
The final Stock Assessment Report (SAR) for US Caribbean Yellowtail Snapper – St. Thomas & St. John was disseminated to the public in August 2025. The Council’s Scientific and Statistical Committee (SSC) will review the SAR. The SSCs are tasked with recommending whether the assessments represent Best Available Science, whether the results presented in the SARs are useful for providing management advice and developing fishing level recommendations for the Council. An SSC may request additional analyses be conducted or may use the information provided in the SAR as the basis for their Fishing Level Recommendations (e.g., Overfishing Limit and Acceptable Biological Catch). The Caribbean Council’s SSC will review the assessment at its December 2025 meeting, followed by the Council receiving that information at its December 2025 meeting. Documentation on SSC recommendations is not part of the SEDAR process and is handled through each Council.
1 SEDAR PROCESS DESCRIPTION
SouthEast Data, Assessment, and Review (SEDAR) is a cooperative Fishery Management Council process initiated in 2002 to improve the quality and reliability of fishery stock assessments in the South Atlantic, Gulf of Mexico, and US Caribbean. SEDAR seeks improvements in the scientific quality of stock assessments and the relevance of information available to address fishery management issues. SEDAR emphasizes constituent and stakeholder participation in assessment development, transparency in the assessment process, and a rigorous and independent scientific review of completed stock assessments.
SEDAR is managed by the Caribbean, Gulf, and South Atlantic Regional Fishery Management Councils in coordination with NOAA Fisheries and the Atlantic and Gulf States Marine Fisheries Commissions. Oversight is provided by a Steering Committee composed of NOAA Fisheries representatives: Southeast Fisheries Science Center Director and the Southeast Regional Administrator; Regional Council representatives: Executive Directors and Chairs of the South
Atlantic, Gulf of Mexico, and Caribbean Fishery Management Councils; a representative from the Highly Migratory Species Division of NOAA Fisheries, and Interstate Commission representatives: Executive Directors of the Atlantic States and Gulf States Marine Fisheries Commissions.
SEDAR is normally organized around two workshops and a series of webinars. First is the Data Workshop, during which fisheries, monitoring, and life history data are reviewed and compiled. The second stage is the Assessment Process, which is conducted via a workshop and/or a series of webinars, during which assessment models are developed and population parameters are estimated using the information provided from the Data Workshop. The final step is the Review Workshop, during which independent experts review the input data, assessment methods, and assessment products. The completed assessment, including the reports of all 3 stages and all supporting documentation, is then forwarded to the Council SSC for certification as ‘appropriate for management’ and development of specific management recommendations.
SEDAR workshops are public meetings organized by SEDAR staff and the lead Cooperator. Workshop participants are drawn from state and federal agencies, non-government organizations, Council members, Council advisors, and the fishing industry with a goal of including a broad range of disciplines and perspectives. All participants are expected to contribute to the process by preparing working papers, contributing, providing assessment analyses, and completing the workshop report.
2 MANAGEMENT OVERVIEW
St. Thomas and St. John Yellowtail Snapper are managed under the St. Thomas and St. John Fishery Management Plan (Crabtree, 2019). In 2023, the Caribbean Fisheries Management Council transitioned from species-based to island-based fisheries management (Figure 4.1). The management measures in the new island-based fishery management plans became effective on October 13, 2022.
Currently, the allowable biological catch for Yellowtail Snapper was established using Tier 4a of the 4-tiered control rule. The allowable biological catch and the annual catch limit are 93,634 and 88,952 pounds whole weight, respectively. In the U.S. Virgin Islands, recreational landings data are not available, so annual catch limits are based on commercial landings data. The annual catch limits apply to all harvest for the stocks and stock complexes in federal waters, whether commercial or recreational.
A SEDAR 84 Data Workshop working paper summarizes relevant federal management actions relevant to Yellowtail Snapper in St. Thomas and St. John (Malone, 2024). On September 21 1986, a federal size limit was instituted with the implementation of the Reef Fish Fishery FMP. The regulation prohibited the take of Yellowtail Snapper that measured less than 8 inches total length for the first fishing year, and was increased one inch per year until the limit reached 12 inches on September 22, 1989. The size limit only applies to the U.S. Exclusive Economic Zone (EEZ), which is defined as the federal waters ranging from 3 to 200 nautical miles (5.6 – 370 kilometers) from the nearest coastline point of the U.S. Virgin Islands (Figure 4.2).
Additionally, a condition that Yellowtail Snapper possessed in the EEZ must have their heads, fins, and tails intact became effective November 29, 1990. Finally, a federal recreational bag
limit became effective on January 30, 2012. The limit is 5 per person per day, and 15 per vessel per day, if 3 or more people are aboard. No regulations exist for Yellowtail Snapper in territorial waters.
References
Crabtree, Roy E. (2019). Comprehensive Fishery Management Plan for the St. Thomas and St. John Exclusive Economic Zone Including Environmental Assessment, Regulatory Impact Review, and Fishery Impact Statement. https://repository.library.noaa.gov/view/noaa/45276
Malone, G. (2024). Summary of Management Actions for Yellowtail Snapper (Ocyurus chrysurus) from Puerto Rico and St. Thomas/St. John (1985 - 2021) as Documented within the Management History Database. SEDAR84-WP-06. SEDAR, North Charleston, SC. 31. https://sedarweb.org/documents/sedar-84-dw-06-summary-of-management-actions-foryellowtail-snapper-ocyurus-chrysurus-from-puerto-rico-and-st-thomas-st-john-1985-2021-asdocumented-within-the-management-history-database/
3 ASSESSMENT HISTORY AND REVIEW
Before the current SEDAR 84 assessment, three assessments had been attempted for Yellowtail Snapper in the U.S. Caribbean (Appledorn et. al., 1992; SEDAR, 2005, SEDAR, 2016). The first, by Appeldoorn et al. (1992), was part of a broader assessment of shallow water reef fish using length frequency analyses. In 2005, SEDAR 08 investigated CPUE trends and examination of changes in length frequency. Due to the lack of data with which to parameterize models, the earlier evaluations resulted in unsatisfactory determinations of stock status. In 2018, the SEDAR 46 evaluations were performed using the Data-Limited Methods Toolkit (Carruthers, 2018). The approach applied data-limited stock assessment models and management procedures, for six species and island units, including Yellowtail Snapper in Puerto Rico. Ultimately, the SEDAR 84 results were not used for management advice.
References
Appeldoorn, Richard & Beets, J. & Bohnsack, James & Bolden, S. & Matos, D. & Meyers, S. & Rosario, Aida & Sadovy, Yvonne & Tobias, W.. (1992). Shallow water reef fish stock assessment for the U.S. Caribbean. NOAA Tech. Mem.. 1-70. https://repository.library.noaa.gov/view/noaa/6063
Carruthers, T. R., & Hordyk, A. R. (2018). The Data-Limited Methods Toolkit (DLMtool): An R package for informing management of data-limited populations. Methods in Ecology and Evolution, 9(12), 2388–2395. https://doi.org/10.1111/2041-210x.13081
SEDAR. (2005). Stock Assessment Report of SEDAR 8 Caribbean Yellowtail Snapper. https://sedarweb.org/documents/sedar-08-stock-assessment-report-caribbean-yellowtail-snapper/
SEDAR. (2016). SEDAR 46 Caribbean data-limited species stock assessment report. https://sedarweb.org/documents/sedar-46-final-stock-assessment-report-caribbean-data- limitedspecies/
4 REGIONAL MAPS
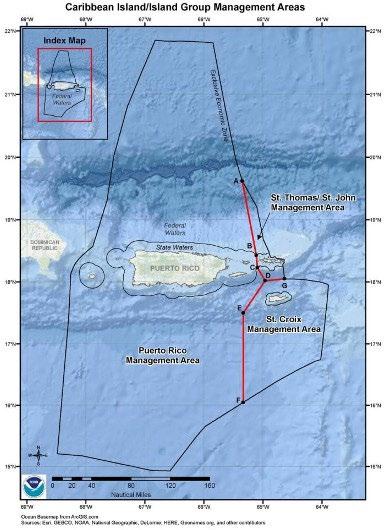
Figure 4.1 Jurisdictional boundaries of the Caribbean Fishery Management Council.
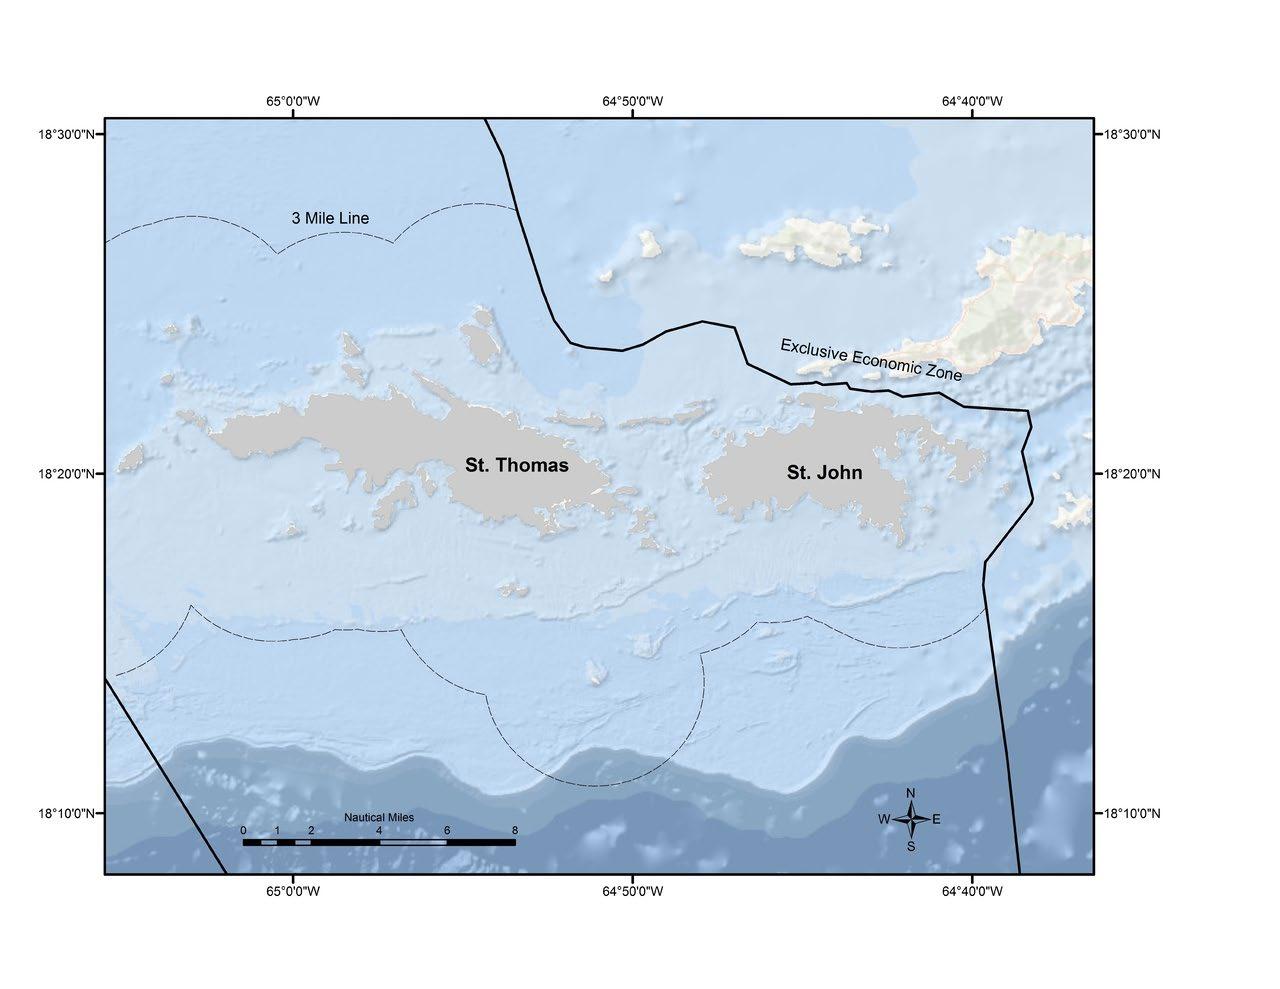
Figure 4.2: The U.S. Exclusive Economic Zone is defined as the federal waters ranging from 3 to 200 nautical miles (5.6 – 370 kilometers) from the nearest coastline point of the US Virgin Islands.
5 SEDAR ABBREVIATIONS
ABC Acceptable Biological Catch
ACCSP Atlantic Coastal Cooperative Statistics Program
ADMB AD Model Builder (software program)
ALS Accumulated Landings System: SEFSC fisheries data collection program
AMRD Alabama Marine Resources Division
APAIS Access Point Angler Intercept Survey
ASMFC Atlantic States Marine Fisheries Commission
B Biomass (stock) level
BAM Beaufort Assessment Model
B msy B capable of producing MSY on a continuing basis
BSIA Best Scientific Information Available
CHTS Coastal Household Telephone Survey
CFMC Caribbean Fishery Management Council
CIE Center for Independent Experts
CPUE Catch Per Unit Effort
EEZ Exclusive Economic Zone
F Fishing mortality (instantaneous)
FES Fishing Effort Survey
FIN Fisheries Information Network
F MSY F to produce MSY under equilibrium conditions
F OY F rate to produce OY under equilibrium
F XX% SPR F rate resulting in retaining XX% of the maximum spawning production under equilibrium conditions
F max F maximizing the average weight yield per fish recruited to the fishery
F o F close to, but slightly less than, Fmax
FL FWCC Florida Fish and Wildlife Conservation Commission
FWRI Florida Fish and Wildlife Research Institute
GA DNR Georgia Department of Natural Resources
GLM General Linear Model
GMFMC Gulf of Mexico Fishery Management Council
GSMFC Gulf States Marine Fisheries Commission
GULF FIN GSMFC Fisheries Information Network
HMS Highly Migratory Species
LDWF Louisiana Department of Wildlife and Fisheries
M natural mortality (instantaneous)
MARFIN Marine Fisheries Initiative
MARMAP Marine Resources Monitoring, Assessment, and Prediction
MDMR Mississippi Department of Marine Resources
MFMT Maximum Fishing Mortality Threshold: value of F above which overfishing is deemed to be occurring
MRFSS Marine Recreational Fisheries Statistics Survey: combines a telephone survey of households to estimate number of trips with creel surveys to estimate catch and effort per trip
MRIP Marine Recreational Information Program
MSA Magnuson Stevens Act
MSST Minimum Stock Size Threshold: value of B below which the stock is deemed to be overfished
MSY Maximum Sustainable Yield
NC DMF North Carolina Division of Marine Fisheries
NMFS National Marine Fisheries Service
NOAA National Oceanographic and Atmospheric Administration
OST Office of Science and Technology, NOAA
OY Optimum Yield
SAFMC South Atlantic Fishery Management Council
SC DNR South Carolina Department of Natural Resources
SEAMAP Southeast Area Monitoring and Assessment Program
SEDAR Southeast Data, Assessment and Review
SEFIS Southeast Fishery-Independent Survey
SEFSC Southeast Fisheries Science Center, NMFS
SERFS Southeast Reef Fish Survey
SERO Southeast Regional Office, NMFS
SRFS State Reef Fish Survey (Florida)
SRHS Southeast Region Headboat Survey
SPR Spawning Potential Ratio: B relative to an unfished state of the stock
SSB Spawning Stock Biomass
SS Stock Synthesis
SSC Scientific and Statistical Committee
TIP Trip Interview Program: biological data collection program of the SEFSC and Southeast States
TPWD Texas Parks and Wildlife Department
Z total mortality (M+F)

SEDAR
Southeast Data, Assessment, and Review
1 INTRODUCTION
1.1 WORKSHOP TIME AND PLACE
The SEDAR 84 Data Workshop was held January 23-25, 2024, in San Juan, Puerto Rico. In addition to the in-person workshop, a series for webinars were held before (July and December 2023) the meeting.
1.2 TERMS OF REFERNCE
Data Workshop Terms of Reference:
1. Develop a stock assessment model for Puerto Rico and St. Thomas/St. John Yellowtail Snapper and St. Croix Stoplight Parrotfish stocks using an appropriate approach.
2. Review available data inputs and provide tables and figures including, but not limited to:
a. Commercial and recreational catches and/or discards.
b. Length/age composition data
c. Life history and ecological information
d. Indices of abundance
3. Construct a stock assessment model that is appropriate for the available data.
4. Provide recommendations for future research in areas such as sampling, fishery monitoring, and stock assessment. Include specific guidance on research goals, data to be collected, and how the research will inform stock assessment.
5. Prepare the Data Workshop report providing complete documentation of workshop actions and decisions in accordance with project schedule deadlines (Section II of the SEDAR assessment report).
1.3 LIST OF PARTICIPANTS
Data Workshop Participants
Adyan Rios (Lead Analyst) ........................................................................... NMFS/SEFSC
Noemi Peña Alvardo ............................................................................................ DNER, PR
Sarah Beggerly ............................................................................................... NMFS/SEFSC
Jeremiah Blondeau ......................................................................................... NMFS/SEFSC
J.J. Cruz-Motta ...................................................................................... CFMC SSC, UPRM
Kyle Dettloff .................................................................................................. NMFS/SEFSC
Carlos Farchette .......................................................................................Stakeholder - STX
Jorge R. Garciá................................................................................................... CFMC SSC
Katherine Godwin ............................................................................................. UM-CIMAS
Sennai Habtes................................................................................................... USVI DPNR
Marcos Hanke ............................................................................................Stakeholder – PR
Walter Ingram ................................................................................................. NMFSSEFSC
Kimberly Johnson .......................................................................................... NMFS/SEFSC
Julian Magras ................................................................................................. DAP STT/STJ
Gaitlyn Malone ................................................................................................. UM-CIMAS
Gerson N. Martinez ............................................................................................... DAP STX
Stephanie Martinez-Rivera ............................................................................ NMFS/SEFSC
Daniel Matos-Caraballo ........................................................................................ PR DNER
Vivian Matter ................................................................................................. NMFS/SEFSC
Kevin McCarthy............................................................................................. NMFS/SEFSC
Maggie Motiani ................................................................................................ USVI DPNR
M. Refik Orhun .............................................................................................. NMFS/SEFSC
Jesus M. Rivera-Hernández ..................................................................................... Univ SC
Grisel Rodriguez-Ferrer ........................................................................................ PR DNER
Wilson Santiago Soler.......................................................................... PR Fisheries Liaison
Michelle Scharer ................................................................................................ CFMC SSC
Derek Soto .............................................................................................................................
Staff
Julie A. Neer ............................................................................................................ SEDAR
Albert Fort ...................................................................................... Tech Support/Recording
Liajay Rivera Garciá .......................................................................................... CFMC Staff
Graciela Garcia-Moliner .................................................................................... CFMC Staff
Meisha Key ...................................................................................................... SEDAR Staff
Kiara Matias ....................................................................................................... CFMC Staff
Workshop Observers
Jerald S. Ault ..................................................................................................Univ of Miami
Angel Normandia ....................................................................................... Stakeholder - PR
Angel E. Normandia .................................................................................. Stakeholder - PR
Data Process Webinar Observers
Edgardo Agosto
Edwin Javier Arroyo ..............................................................................................................
Rachal Banton ........................................................................................................................
David Behringer .....................................................................................................................
Manuel Coffill-Rivera ............................................................................................................
Sophia Costa ..........................................................................................................................
Carly Daiek ............................................................................................................................
Todd Gedamke .......................................................................................... MER Consultants
Nicole Greaux ................................................................................. OEAP Liaison STT/STJ
Keisha Correa Vélez Hedalgo ................................................................................................
Mariangeline León .................................................................................................................
Maria López ...........................................................................................................................
Cristina Olán ...................................................................................................... CFMC Staff
Emmanuel Maldonado ...........................................................................................................
Efrai Maraguez.......................................................................................................................
Martha Prada ..........................................................................................................................
Yamitza Rodriguez .................................................................................................... DRNA
Aurea E. Rodriguez Santiago .................................................................................................
Virginia Shervette .................................................................................................... Univ SC
Wilfredo .................................................................................................................................
1.4 LIST OF DATA WORKSHOP WORKING PAPERS & REFERNCE DOCUMENTS
Document # Title Authors Date
Submitted
Documents Prepared for the Data Workshop
SEDAR84-DW-01 Radiocarbon Age Validation for Caribbean Parrotfishes Jesus Rivera Hernández and Virginia Shervette 9 January 2024 Updated: 5 March 2024
SEDAR84-DW-02 SEDAR 84 Commercial fishery landings of Yellowtail Snapper (Ocyurus chrysurus) in St. Thomas and St. John, US Caribbean, 20122022
SEDAR84-DW-03 SEDAR 84 Commercial fishery landings of Stoplight Parrotfish (Sparisoma viride) in St. Croix, US Caribbean, 2012-2022
Stephanie Martínez Rivera, Kimberley Johnson, and M. Refik Orhun
Stephanie Martínez Rivera, Kim Johnson, and M. Refik Orhun
18 January 2024 Updated: 21 February 2024
18 January 2024 Updated: 21 February 2024
SEDAR84-DW-04 Analysis of SEAMAP-C hook and line survey data for yellowtail snapper in Puerto Rico (1992-2020)
SEDAR84-DW-05 Summary of Management Actions for Stoplight Parrotfish (Sparisoma viride) from St. Croix (19852021) as Documented within the Management History Database
SEDAR84-DW-06 Summary of Management Actions for Yellowtail Snapper (Ocyurus chrysurus) from Puerto Rico and St. Thomas/St. John (1985 - 2021) as Documented within the Management History Database
SEDAR84-DW-07 Addressing Critical Life History Gaps for U.S. Caribbean Yellowtail Snapper: Bomb radiocarbon of age estimation method and a summary of the regional demographic patterns for size, age, and growth
SEDAR84-DW-08 U.S. Caribbean Yellowtail Snapper Population Demographics, Growth, and Reproductive Biology: Addressing Critical Life History Gaps
SEDAR84-DW-09 SEDAR 84 Trip Interview Program (TIP) Size Composition Analysis of Yellowtail Snapper (Ocyurus chrysurus) in Puerto Rico, U.S. Caribbean, 1983-2022
SEDAR84-DW-10 SEDAR 84 Trip Interview Program (TIP) Size Composition Analysis of Yellowtail Snapper (Ocyurus chrysurus) in St. Thomas/St. John, U.S. Caribbean, 1983-2022
SEDAR84-DW-11 SEDAR 84 Trip Interview Program (TIP) Size Composition Analysis of Stoplight Parrotfish (Sparisoma viride) in St. Croix, U.S. Caribbean, 1983-2022
SEDAR84-DW-12 SEDAR 84 Commercial fishery landings of Yellowtail Snapper
Walter Ingram, Refik Orhun, and Carlos M. Zayas Santiago
19 January 2024
G. Malone 22 January 2024
Updated: 21 February 2024
G. Malone 22 January 2024 Updated: 21 February 2024
Virginia Shervette, Jesus Rivera Hernandez, Sarah Zajovits 22 January 2024 Updated: 15 February 2024
Virginia Shervette, Jesus Rivera Hernandez, Noemi Pena Alvarado 18 February 2024
Katherine Godwin, Adyan Rios, Kyle Dettloff 21 February 2024
Katherine Godwin, Adyan Rios, Kyle Dettloff 21 February 2024
Katherine Godwin, Adyan Rios, Kyle Dettloff 21 February 2024
Stephanie Martínez Rivera, Kimberley 21 February 2024
(Ocyurus chrysurus) in Puerto Rico, US Caribbean, 2012-2022
SEDAR84-DW-13 Length-Frequency Snapshot of Yellowtail Snapper from Image Analysis in Puerto Rico
SEDAR84-DW-14
SEDAR84-DW-15
SEDAR84-DW-16
Fishery-Independent Reef Fish Visual Survey Population Density and Length Composition for Stoplight Parrotfish in the St. Croix
Fishery-Independent Reef Fish Visual Survey Population Density and Length Composition for Yellowtail Snapper in the Puerto Rico
Fishery-Independent Reef Fish Visual Survey Population Density and Length Composition for Yellowtail Snapper in St. Thomas/John
Reference Documents
SEDAR84-RD01 Selectividad Pesquera del Buche (Seno) en Chinchorros de Playa con mallas de 2.5, 2.0 y 1.0 pulgadas, a lo largo de la costa Oeste y Noreste de la Isla de Puerto Rico
SEDAR84-RD02 Monitoring of Mesophotic Habitats and Associated Benthic and Fish/Shellfish
Communities from Abrir la Sierra, Bajo de Sico, Tourmaline, Isla Desecheo, El Seco and Boya 4, 2018-20 Survey
SEDAR84-RD03 Population Size, Growth, Mortality and Movement Patterns of Yellowtail Snapper (Ocyurus chrysurus) in the U.S. Virgin Islands Determined Through a Multi institutional Collaboration
Johnson, and M. Refik Orhun
Derek Soto, Alejandro Carrera Montalvo, Todd Gedamke 22 February 2024
Laura Jay W. Grove, Jeremiah Blondeau, and Jerald S. Ault 16 February 2024
Laura Jay W. Grove, Jeremiah Blondeau, and Jerald S. Ault 16 February 2024
Laura Jay W. Grove, Jeremiah Blondeau, and Jerald S. Ault 16 February 2024
Edgardo Ojeda Serrano, Omayra Hernandez Vak, and Samuel Garcia Vazquez
Jorge R, Garcia-Sais, Stacey Williams, Evan Tuohy, Jorge Sabater-Clavell and Milton Carlo
St. Thomas Fishermen’s Association
SEDAR84-RD04
S8-DW-09: An Update on the Reported Landings, Expansion Factors and Expanded Landings for the Commercial Fisheries of the United States Virgin Islands (with Emphasis on Spiny Lobster and the Snapper Complex)
SEDAR84-RD05
SEDAR84-RD06
SEDAR84-RD07
SEDAR68-DW-13: Marine Recreational Information Program Metadata for the Atlantic, Gulf of Mexico, and Caribbean regions
Nearshore habitats as nursery grounds for recreationally important fishes, St. Croix, U S. Virgin Islands
Seasonal Patterns of Juvenile Fish Abundance in Seagrass Meadows in Teague Bay Bank Barrier Reef Lagoon, St. Croix, U.S. Virgin Islands
SEDAR84-RD08 The Distribution of Herbivorous Coral Reef Fishes within Fore-reef Habitats: the Role of Depth, Light and Rugosity
SEDAR84-RD09 The Use of Vertical Distribution Data in the Identification of Potential Spawning Sites and Dispersal Pathways for Parrotfish (Genera Sparisoma and Scarus) within Territorial Waters of the U.S. Virgin Islands
SEDAR84-RD10
2 Life History
2.1 Overview
Evaluating the impact of invasive seagrass Halophila stipulacea on settlement, survival, and condition factor of juvenile yellowtail snapper, Ocyurus chrysurus, in St. Thomas, USVI
Mónica Valle-Esquivel and Guillermo Díaz
Vivian M. Matter and Matthew A. Nuttall
Ivan Mateo
Ivan Mateo and William J. Tobias
Michael Nemeth and Richard Appeldoorn
Kristen A. Ewen
Sophia Victoria Costa
Table 2.1 provides a summary of parameters, definitions, nomenclature, and units for the life history parameters included within this report. Yellowtail Snapper life history data were provided in Shervette et al. (2024b).
2.2 Stock Definition and Description
The Yellowtail Snapper stock was defined by the CFMC Island-based Fishery Management Plan. The St. Thomas/St. John (SSTJ) stock is defined as the population within the U.S. Virgin Island’s territorial waters; i.e., the island platforms of St. Thomas and St. John and the adjacent EEZ.
2.3 Meristic & Conversion factors
The length-length and length-weight relationship equations with parameters for Yellowtail Snappers collected 2013-2023 for the combined sexes (Shervette et al. 2024) are shown in Table 2.2.
2.4 Natural Mortality
The DW panel recommended that the assessment team explore various methods of estimating natural mortality (M) based on life history parameters. This may include methods that apply one point estimate to the entire age range of the fish, such as Hewitt and Hoenig (2005) or Then et al. (2015). Additional, and perhaps preferred methods, include using the methods of Charnov et al. (2013) which features age-varying natural mortality as a function of size of the fish. The age specific M may be calculated using the von Bertalanffy population growth parameters, L∞ and K, and the predicted fork length at the mid-point of each age. The midpoint of each year class can be used to represent the mean size of the fish in a calendar year.
2.5 Reproduction
Yellowtail Snapper reproductive data were provided in Shervette et al. (2024). The overall male to female sex ratio was estimated to be 1:1.04. A total of 892 mature female and 856 mature male Yellowtail Snapper had reproductive phase information. The months with the greatest proportion of spawning capable females were March and April. Males with testes in the spawning capable phase occurred in all months of the year. Yellowtail snapper from the U.S. Caribbean exhibit year-round spawning with peak spawning from March-April.
A total of 454 female Yellowtail Snapper samples were evaluated for maturity and indicators of active spawning to use in estimating spawning fraction, spawning interval, and spawning frequency. Female Yellowtail Snapper spawning fraction overall was 0.13; overall spawning interval, defined as the number of days between spawning events in a female, was 7 days, indicating that a female spawns approximately 49 times over the estimated ~365-day spawning season.
When examining trends in spawning fraction, interval and frequency by length, spawning frequency increased with increasing length class. Females in the smallest fork length (FL) class had an estimated spawning frequency of six times over the spawning season, while females in the largest FL class had an estimated spawning frequency of 69 times over the
spawning season. Similar increases in spawning frequency occurred when examined by age classes. Females in the oldest age class (13+ y) spawned approximately 85 times a year.
A total of 949 U.S. Caribbean Yellowtail Snapper samples with length, age, and sexual maturity information were used to obtain estimates of length and age at 50, 90, and 95% maturity (Shervette et al. 2024). Results are shown in Tables 2.3a (length at maturity) and 2.3b (age at maturity).
2.6 Age and Growth
Table 2.4 provides the results of fitting the von Bertalanffy (VB) growth parameters for various length variables (Shervette et al. 2024). Figure 2.1 shows the fishery-dependent (FD) and fishery independent length-at-age data and the predicted overall VB growth curve. A summary list of available life history inputs is provided in Table 2.5; from Shervette et al. (2024).
2.7 SEDAR Panel Discussions on Use of Life History Data for Assessment Analyses
Table 2.6 shows the life history parameters used in SEDAR 46 and those provided in Shervette et al. (2024).
Issue 1: Are sufficient life history data available?
Options:
- Use recent and regionally relevant life history data made available in SEDAR working papers.
- Use previously established life history parameters obtained from literature reviews.
Decision:
- Tentatively accept the life history parameters presented. The life history team will work with the assessment team to finalize the working paper.
- Aggregate the maturity data from USCA and SEAMAP-C.
Rationale:
- Both datasets show a reproduction peak from March to June, suggesting that the data can be combined.
- We are tentatively accepting the life history parameters provided. Providing the submission of the working paper, the team will review the results.
2.8 Life History Tables
Table 2.1 Summary of parameters, definitions, nomenclature and units for model parameters included within this report.
Parameter Definition Management Real world Units Strategy evaluation data input Stock Input
L∞ Asymptotic length Linf vbLinf mm FL
K Brody growth coefficient K vbK year -1
t0 Theoretical age at length 0 t0 vbt0 years
α Weight-length scalar a wla dimensionless
β Weight-length power b wlb dimensionless
W∞ Asymptotic weight -- -- g
Lm Length at maturity L50 L50 mm FL
tm Age at maturity -- -- years
tλ Maximum age Max. age Max. Age years
Lλ Mean length of Max age -- -- mm FL
M Natural mortality M Mort year -1
Sλ Survivorship to Max age -- -- dimensionless
Table 2.2 Regression equations for U.S. Caribbean Yellowtail Snapper length-length and length-weight relationship. n=number of fish.
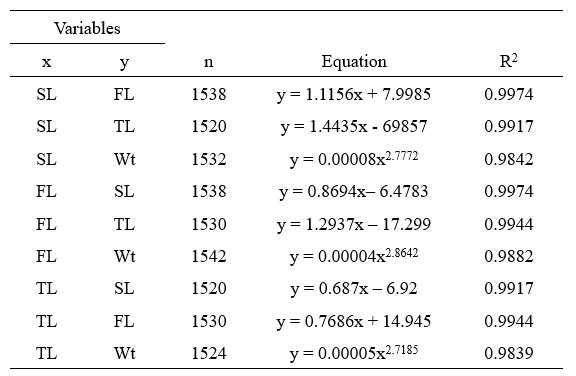
Table 2.3a,b Caribbean Yellowtail Snapper a) lengths (mm FL) and b) ages (years) as sexual maturity. Values in parentheses are 95% prediction intervals. a)
(189 - 199)
(233 - 242)
(246 - 258)
(202 - 211)
(238 - 249)
(248 - 264)
(174 - 190)
(221 - 235)
(235 - 253)
Table. 2.4 U.S. Caribbean Yellowtail Snapper VBGF results. Parameter estimates are provided using FL and TL. Also provided are computed parameter estimates using to=0.96 for comparison with the Caribbean study by Manooch and Drennon (1987) and using to= -1.93 for comparison with growth parameter estimates for Florida Yellowtail Snapper as reported in SEDAR 64.
Model Loo(mm) K to R2 FLmm 508 (479-547) 0.12 (0.10-0.14) -2.73 (-3.29- -2.26) 0.70
TLmm 653 {635-648) 0.11 (0.10-0.13) -2.67 (-3.18- -2.18) 0.70
FL mm to-fixed Carib 424 (415-434) 0.23 (0.22-0.24) -0.96 0.68
FL mm to-fixed Fla 467 (454-481) 0.16 (0.15-0.18) -1.93 0.70
Table 2.5 Summary of Yellowtail Snapper studies focused on estimating growth parameters. * indicates that a fixed t0 value of -0.96 was used so that other growth parameters results from the Shervette et al. 2024 study could be compared to results from Manooch and Drennon (1987) ** indicates that a fixed t0 value of -1,93 was used so that other growth parameter results from the Shervette et al. 2024 study could compared to results from Florida (SEDAR 64/Stevens et al. 2019).
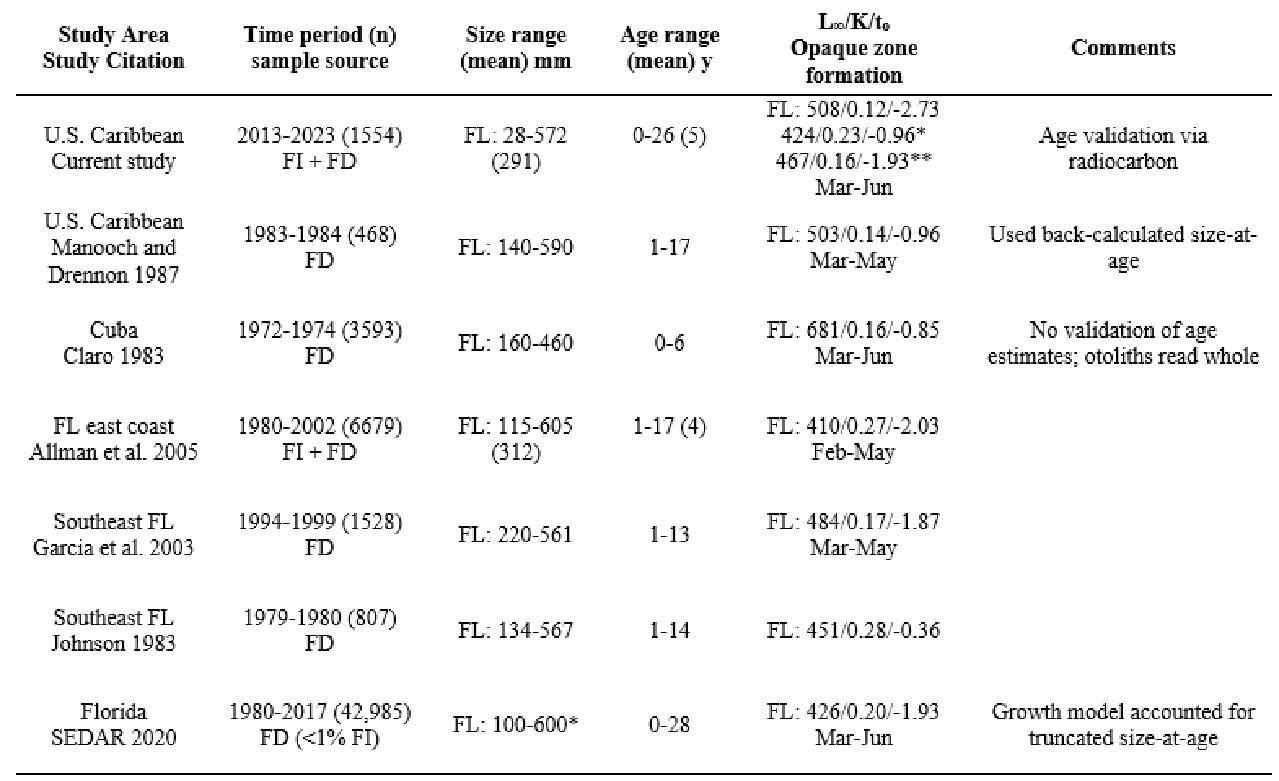
Table 2.6 Life history parameter values for Yellowtail Snapper provided by Shervette et al., 2024 and those used in SEDAR46. Values provided include the mean and CVs. Units are defined in Table 2.1 Asterisks denote values where the CV was not reported in the literature and instead imputed by SEDAR 46 Life History Working Group.
Parameter
Yellowtail Snapper (Shervette et al. 2024)
Yellowtail Snapper (SEDAR 46)
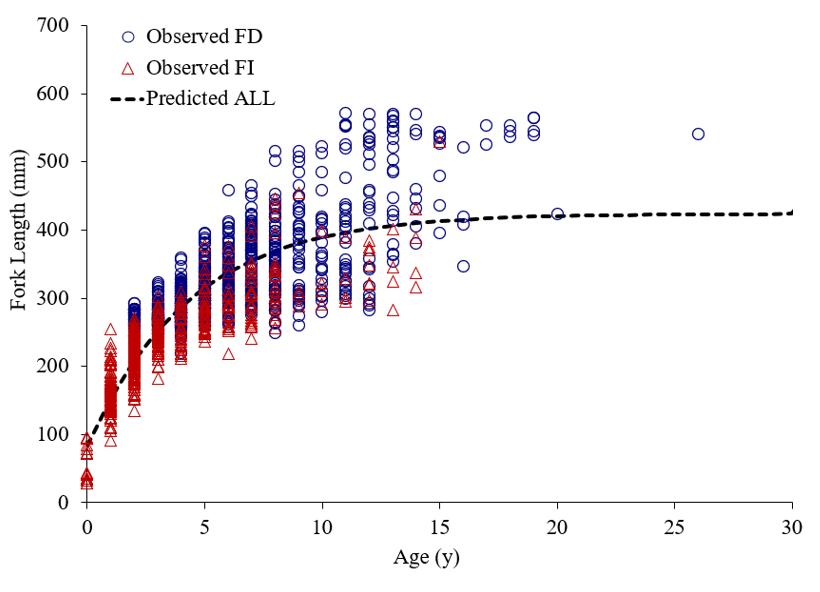
Figure 2.1 U.S. Caribbean Yellowtail Snapper length-at-age for FD and FI samples and van Bertalanffy growth based on t0 = - 0.93.
3 Commercial Fishery Statistics
3.1 Commercial Landings
3.1.1 Overview
Commercial fishery landings in St. Thomas and St. John (STTJ) were obtained from selfreported fisher logbook data (Caribbean Commercial Logbook, CCL). Reporting of Yellowtail Snapper by species and fishing gear did not begin until July 2011 in the U.S. Virgin Islands, therefore, the first complete year of species-specific data is 2012. Logbook data is recorded by fishing year, which runs from July 1 through June 30 of the following year. However, data in this report are recorded in calendar year. Commercial fishery landings data for Yellowtail Snapper in STTJ were available for the calendar years 20122022 (Martinez et al. 2024). Commercial fishery landings in pounds of Yellowtail Snapper in STTJ by year and gear group are provided in Table 3.1.1.
3.1.2 Outlier removal
Outlier removal was conducted by using a mean and standard deviation method. If the landings of Yellowtail Snapper reported on a trip were greater than three standard deviations from the mean (i.e., 99.73% quantile), they were removed from the dataset. Two methods were used to identify outliers: Method 1, the values to define outliers were calculated by gear group across all years (Table 3.1.2), and Method 2, the values to define outliers were calculated by year and gear group (Table 3.1.2). Due to the outlier removal, the yearly commercial landings for Yellowtail Snapper compiled in SEDAR84 may not match landings provided for previous SEDARs.
3.1.3 Snapper Fishery
Beginning in 1997 part of commercial landings were reported by species group (e.g., snappers, groupers, parrotfishes, surgeonfishes, etc.), and by gear (hook and line, gill net, SCUBA, trap, etc.). All commercial fishery data reports included species groups beginning in 2000. In July of 2011, commercial landings were reported by species and gear. Snapper complex (1997-2011) and species-specific snapper (2011-2022) landings are summarized in Table 3.1.3 and Figure 3.1.1. Note that landings prior to 2000 may be incomplete.
3.2 Commercial Discards
Commercial discards reported by calendar year were not significant (Martinez et al. 2024).
3.3 Commercial Effort
Commercial trips with reported Yellowtail Snapper landings per year were compiled from 2012 to 2022 (Table.3.3.1). The table includes the number of trips by year and fishing gear.
3.4 Biological Sampling
3.4.1 Overview
The NOAA Fisheries, Southeast Fisheries Science Center Trip Interview Program (TIP) collects length and weight data from fish landed by commercial fishing vessels, along with information about fishing area and gear. Data collection began in 1983 with frequent updates in best practices; the latest being in 2017. Data are collected by trained shore-based samplers (Beggerly, Stevens, and Baertlein 2022).
3.4.2 Length Composition Sampling Intensity
The TIP data pertaining to Yellowtail Snapper in St. Thomas/St. John are comprised of 20,064 length observations across 1,078 unique port sampling interviews during the period 1983-2022. Of the Yellowtail Snapper measured, 19,927 are fork lengths (99.3%). Figure 3.4.1 displays the sample availability by year and gear. Plots and summary statistics of the currently available length frequency data of Yellowtail Snapper sampled from the predominant gears in St. Thomas/St. John are included in the working paper (Godwin et al. 2024).
3.4.3
Length Distributions
A variety of fishing gears were used by STTJ commercial fishers to catch Yellowtail Snapper. An analysis was conducted to establish gear groups among the many commercial fishing gears with groups based upon Yellowtail Snapper size composition differences among the gears. The resulting groups are recorded in Table 3.4.1. Summary statistics produced by a generalized linear mixed model (GLMM) analysis of the available length frequency data from 2012 to 2022 (the years corresponding to species specific reporting of commercial landings data) are found in Table 3.4.1. Gear groups were identified based on GLMM analysis using a gamma-distributed dependent variable and a covariate to account for changes in mean size over time. Random effects for interview ID and categorical year were included to account for non-independence of observations. The aggregated density plots of Yellowtail Snapper fork lengths collected across three or more unique interviews per gear groups across the time series (years with species specific commercial landings data) are summarized in Figures 3.4.2. Aggregated density plots of gears representing 2% or more of the samples are summarized in Figure 3.4.3.
3.4.4 Adequacy of Size Composition Data for Characterizing Catch
Due to reasonable levels of available data after 2012, TIP data can be considered to inform selectivity and annual population trends in the SEDAR 84 assessment pending an investigation into the comparison of interview and catch report quantities by gear groups and year. If the proportion of TIP trips interviewed compared to CCL trips reported by gear is low or highly variable, the workshop panel recommended combining TIP data across all years to inform commercial fleet selectivity, not annual population trends.
The landings data collected before 2012 were not species-specific, and current model configurations do not require length composition data before the first year of landings data. However, all length composition data should be supplied to the analytical team, allowing them to investigate other potential models. Further investigation into the filtering process will need to be executed to understand the high number of length and weight pairs flagged as
possible outliers. As necessary, the analysts will communicate the high uncertainty across the measurement units associated with the TIP data for Yellowtail Snapper.
3.5 SEDAR Panel Discussion of Commercial Statistics Data for Assessment Analyses
3.5.1 Adequacy of Commercial Landings Data
Issue 1: Are analysis-ready commercial landings data available for SEDAR 84?
Options:
- Use all available data (including data before 2012 and hindcast partitioning of landings recorded as species groups)
- Only use data starting in 2012, the first full year of species-specific reporting of the snapper group
Decision:
- Do not hindcast landings before 2012
- Provide a full-time series associated with the total landings of the snapper group over all years of available landings data
Rationale:
- Due to inconsistent levels of Yellowtail Snapper among all snappers after 2012, we cannot hindcast.
Issue 2: What should the gear fleets be for the commercial landings data?
Options:
- Use one fleet (handline) while including an explanation of gears within the fleet.
- Use gear groups informed by the TIP data (handline, traps, and rod and reel) with others parsed in for modeling but separate for reporting.
Decision:
- Gear groups of “Fish Traps,” “Handline,” and “Rod and Reel” were established, with all other gears allocated to fleets proportionally.
Rationale:
- Results of GLM analyses of gear-specific size composition and expert opinion regarding gear similarities indicate three potential gear groups (Fish Traps, Handline, and Rod and Reel).
- The length data from all other gears was insufficient to characterize the size composition of the landings from those gears.
Issue 3: How uncertain are the commercial landings from 2012 - 2022?
Options:
- Consider uncertainty around the landings (e.g. +/- 5% for 2016-present, +/-15% 20122015)
- Consider directional bias (e.g. + 5% for 2016-present, +15% 2012-2015)
Decision:
- Consider directional bias (e.g. + 5% for 2016-present, +15% 2012-2015)
Rationale:
- During 2012-2015, the commercial logbook forms lacked the option to select Yellowtail Snapper. Instead, fishermen had to write it in as an additional species. Inconsistent reporting of write-in species suggests underreporting in those years.
- From 2016 to now, Yellowtail Snapper appears on all logbook forms in the US Virgin Islands.
Issue 4: Should data outliers in the commercial landings be flagged for additional investigation?
Options:
- Identify and flag outliers
- Do not identify and flag outliers
Decision:
- Conduct outlier analysis flagging by year and gear
Rationale:
- Through the flagging process, we can identify outliers to investigate further, allowing us to understand the situations occurring within the fishery and their potential impact. For example, a significant jump in outliers could be attributed to the new style of fishing, indicating that these outliers are still valid trips.
3.5.2 Adequacy of Discard and Discard Mortality
Data
Issue 1: Do we have estimates of commercial discards and estimates of discard mortality?
Options:
- Use the available reported discards data.
- Do not use the available reported discards data.
- Use expert opinion to inform estimates of discard mortality.
- Use discard mortality estimates in the published literature.
Decision:
- Discards of Yellowtail Snapper are assumed to be negligible, with minimal discard mortality.
Rationale:
- Discarding is negligible within the Yellowtail Snapper STTJ fishery to the point that the mortality of discards is insignificant.
- Commercial logbook forms did not have species-specific discards before July 2015; therefore, discards before that time are unknown.
3.5.3 Adequacy of Length Composition Data
Issue 1: Are analysis-ready size data available for SEDAR 84?
Options:
- Use filtered TIP lengths available by year from 1983 to 2022
- Use filtered TIP lengths available by year from 2012 to 2022
- Use filtered TIP lengths combined across years from 2012 to 2022 to inform selectivity
- Do not recommend using TIP lengths for any year
Decision:
- Use TIP data after 2012 to inform selectivity and annual population trends in SEDAR 84 assessment pending an investigation into comparing interview and catch report quantities by gear groups and year.
- Apply filtering based on the condition factor.
- Supply complete TIP time series for SEDAR 84 investigations.
- Investigate how the length-weight relationship varies by month and year (seasonality and reproduction).
- Try to obtain tagging research data on St. Thomas.
- Try to acquire the National Parks Service dataset for St. John. This dataset documents when fishing was allowed in the National Parks.
- Try to obtain the life history information from a 1987 age and growth study of Yellowtail Snapper.
Rationale:
- If the proportion of TIP trips interviewed compared to CCL trips reported by gear is low or highly variable, combine TIP data across all years to inform commercial fleet selectivity, not annual population trends.
- The landings data collected before 2012 were not species-specific, and current model configurations do not require length composition data before the first year of landings data. However, all length composition data should be supplied to the analytical team, allowing them to investigate other potential models.
- Investigate the filtering process further. The high number of flagged pairs of length and weights need to be better understood. Alternatively, communicate high uncertainty across the measurement units associated with the TIP data for Yellowtail Snapper.
3.6 Commercial Statistics Tables
Table 3.1.1 Commercial landings of Yellowtail Snapper in St. Thomas/St. John from 2012-2022 reported in pounds by year and gear group.
Table 3.1.2 Comparison of commercial landings of Yellowtail Snapper in St. Thomas/St. John from 2012-2022 in relation to the outlier removal methods.
Table 3.1.3 Commercial landings of all snapper species reported in St. Thomas/St. John from 1997-2022 by year. Note that landings prior to 2000 may be incomplete.
Table 3.3.1 Commercial trips that reported Yellowtail Snapper landings in St. Thomas/St. John from 2012-2022 reported by year and gear group.
Table 3.4.1 Generalized linear mixed model (GLMM) analysis summary results for the TIP data of Yellowtail Snapper fork lengths in St. Thomas/St. John from 2012 to 2022. The column “group” indicates the group(s) where mean lengths are not statistically different from other gears with matching group number(s). The “n” column indicates the number of unique lengths recorded for each gear. The “Percentage” column indicates the percent of the total recorded lengths for each gear. Gears that make up less than 2% are shaded in gray.
3.7 Commercial Statistics Figures
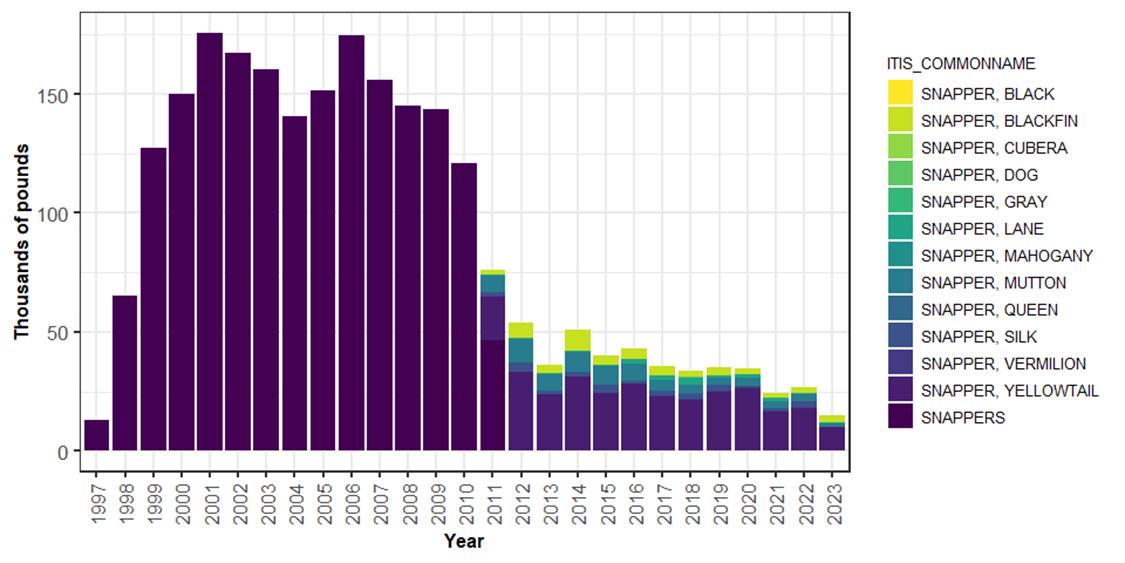
Figure 3.1.1 Commercial landings of all snapper species reported in St. Thomas/St. John from 1997-2022 by year.
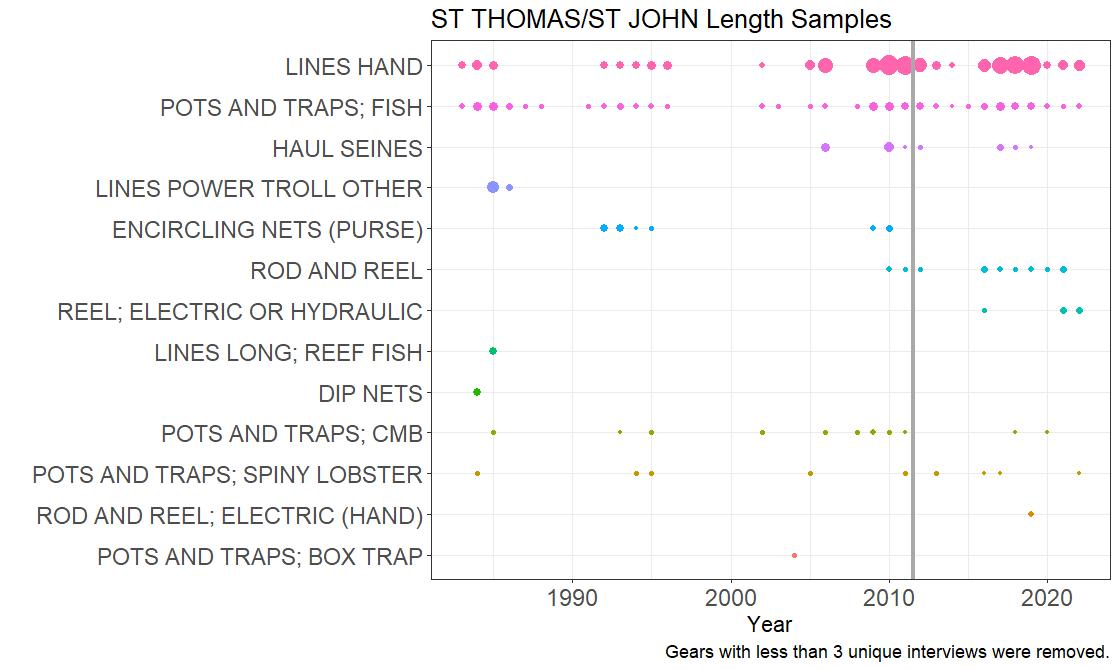
Figure 3.4.1 Plot showing relative number of Yellowtail Snapper in St. Thomas /St. John over time. Each point is color specific to the gear it represents. Gears are arranged from largest to smallest sample size of individual recorded lengths. Gray vertical line denotes the beginning of the truncated time series in 2012 (those years with species specific commercial landings data).
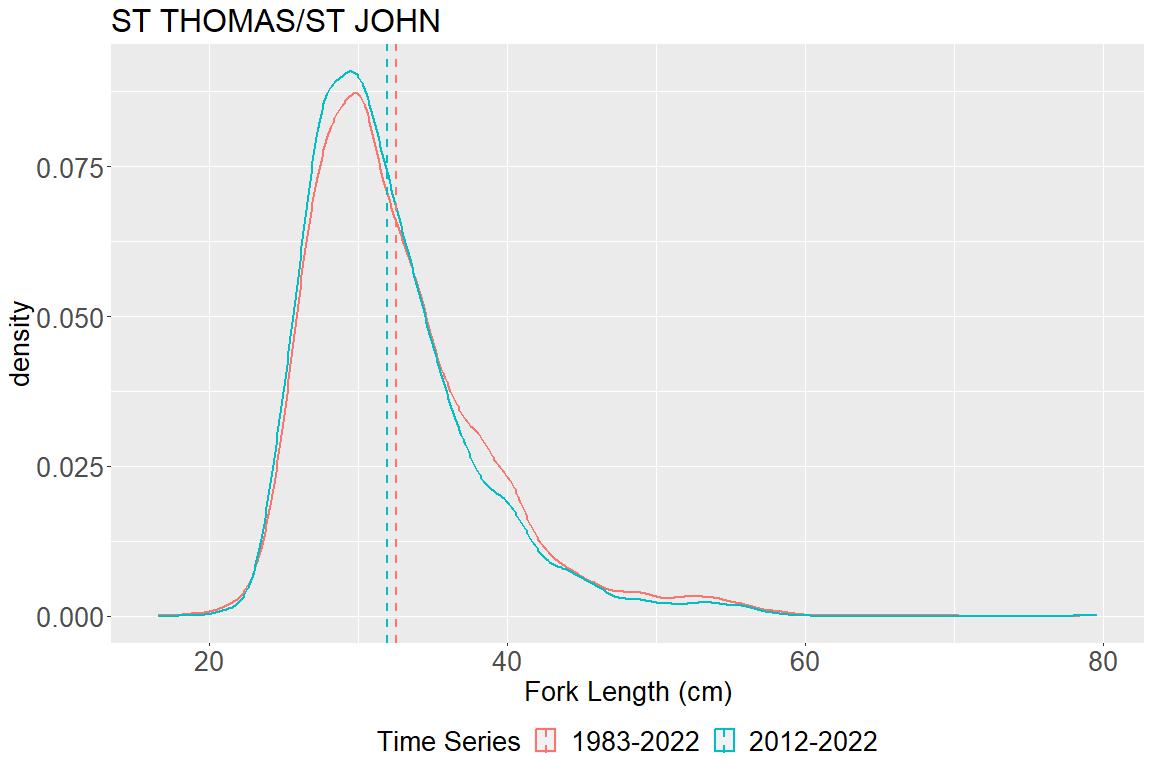
Figure 3.4.2 Aggregated density plot of lengths (cm) of Yellowtail Snapper in St. Thomas /St. John, all gears combined. Dotted line represents mean length. The period 1983-2022 includes all years with TIP data. The period 2012-2022 includes those years with corresponding species-specific commercial landings data.
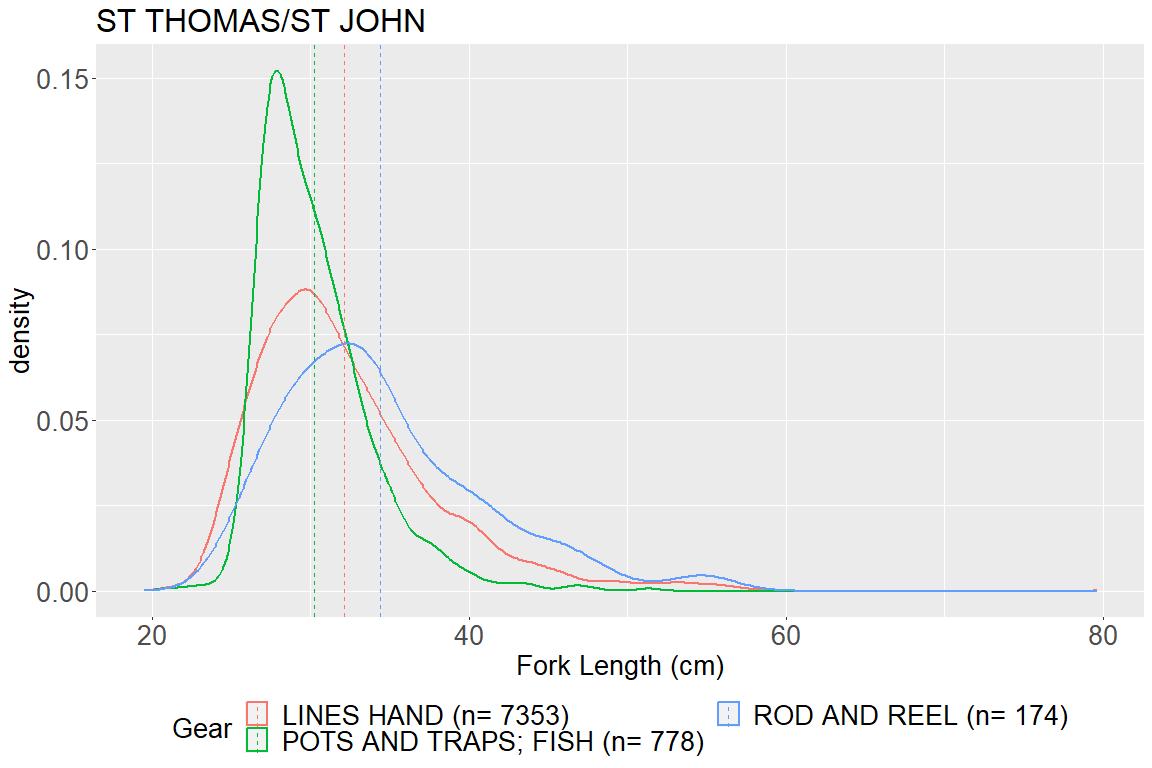
Figure 3.4.3 Aggregated density plot of lengths (cm) by gears with greater than 2% of total samples for Yellowtail Snapper in St. Thomas/St. John from 2012 to 2022. Dotted line represents mean length.
4 Recreational Fishery Statistics
4.1 Overview
U.S. Virgin Islands fishing tournament data were collected by the USVI Department of Planning and Natural Resources, Division of Fish and Wildlife staff serving as official weighmasters. Tournaments consist of kid’s tournaments, spearfishing tournaments, and rod & reel/trolling tournaments. Data collected includes tournament name, date, vessel name, captain name, length of tournament, species landed, species weight, and species length.
Data were available for the years 2000-2022 from a total of 30 tournaments over the time series with data collected from 1-4 tournaments per year. A total of 1,074 Yellowtail Snapper were caught across all 30 tournaments. Of those observed fish, 671 were weighed and 198 lengths were measured. From 0 to 67 Yellowtail Snapper were measured per year and fewer than 10 fish were measured in 16 years of the 21 year time series (tournaments were not sampled in every year). From 0 to 206 Yellowtail Snapper were weighed per year with fewer than 10 fish weighed in 11 years of the time series.
4.2 SEDAR Panel Discussion of Recreational Landings Data for Assessment Analyses
Issue 1: Can tournament data inform recreational removals?
Options:
- Investigate tournament data from 2000-2022 further.
- Do not use the tournament data.
Decision:
- Do not use the tournament data. The limited tournament data available for Yellowtail Snapper in St. Thomas and St. John is considered negligible.
Rationale:
- Tournament data with Yellowtail Snapper is only available for 12 unique tournaments.
- Tournament data is a fraction of a percent of the commercial landings data; therefore, the utility of this data for the current analysis is negligible.
- Time series runs from 2000-2022, however years in which there are consecutive data are 2002-2003, 2010-2015, and 2019-2022 showing a lack of consistency across time.
- Across time series, there are 877 records in which lengths and/or weights cannot be verified due to a lack of units.
- Most data come from kid’s tournaments which landed mainly juvenile and subadult yellowtail snapper.
- There is a lack of data for CPUE analysis due to the low number of records with gear type identified.
- Tournament data is negligible for this SEDAR; however, this dataset could be applicable to future SEDAR’s.
5 Measures of Population Abundance
5.1 Overview
The SEDAR 84 DW Panel reviewed several measures of abundance from both fishery independent and fishery dependent data sources during the workshop. The following sections briefly summarize these data or provide references that summarize the methods and data.
5.2 Review of Working Papers
SEDAR84-DW-15 (Grove et al. 2024): NCRMP FI Survey of Yellowtail Snapper (Ocyurus chrysurus) in St. Thomas/St. John, U.S. Virgin Islands, summarized NCRMP survey data for Yellowtail Snapper from 2014 to 2022.
5.3 National Coral Reef Monitoring Program - NCRCMP
5.3.1 Methods, Gears, and Coverage
This document outlines the data and methodologies used to estimate density and abundanceat-length compositions for the SEDAR84 Yellowtail Snapper Assessment for St. Thomas and St. John.
For more background details about the reef visual survey program (historic and NCRMP), methodology, data, and sampling coverage including maps of all survey sites completed by year (2001–2019) in each U.S. Caribbean sampling domain (Puerto Rico, St. Thomas/St. John, and St. Croix) see SEDAR80-WP-02 (Grove et al. 2021). Sampling in 2021 had similar island-wide coverage for each of the island assessments as previous NCRMP surveys. Total samples were reduced in St. Thomas and St. John in 2021 to 165 as a result of weather (Figure 5.3.1)
Two levels of calibration were needed to incorporate historical transect data. First, we analyzed the regionally restricted transect data from 2001 to 2011 in Virgin Island National Park and Virgin Islands Coral Reef National Monument in St. John. We determined that similar density distributions existed within strata between the regional data and whole islandwide data, and that each strata was represented in the sampling for proper area weighting. Secondly, a robust method calibration was conducted to convert belt transect (BT) densities (2001–2015) to RVC stationary point count (RVC-SPC) densities (2017–2021). In short, paired BT and RVC-SPC sampling was conducted a number of times within each survey strata. Density and occurrence were modeled in a two-stage GLM regression using a “delta” framework for estimation of the gear correction (method calibration) factors. The method calibration factor was then applied to the BT dataset prior to any domain level estimations (Ault et al. 2020). For more details, see Grove et al. 2022 Appendix I.
The National Coral Reef Monitoring Program (NCRMP) has a sampling depth limit of 30 m, and thus only represent shallow water fish populations. However, a majority of the fisheries areas, particularly on the northern and southern shelf of St. Thomas and St. John, are in depths between 30-65 m (Kadison et al., 2017). The Coral Reef Conservation Program (CRCP) funded a pilot survey to target the upper mesophotic habitats of St. Thomas and St. John from 2020–2022. The DCRMP program used NCRMP survey design and sampling methodologies for direct comparisons (Figure 5.3.2). For more details about the DCRMP program, data and sampling coverage see Grove et al. (in press).
Domain-wide density and variance estimates were calculated using standard stratified random design-based principles (Smith et al. 2011). Metric estimates and associated variance were computed in each strata and multiplied by the stratum weighting factor. Area weighted stratum density and variance was then summed across all strata for the final domain wide estimate. All density data are presented as reef visual census stationary point count (RVCSPC) estimates (number per 178 m2, ±1). For more details, see Grove et al. 2022 Appendix II. Three different time series estimates of density are presented in this working paper and made available as complete datasets; 1) population-level estimates include all sizes of Yellowtail Snapper surveyed, 2) pre-exploited density estimates filters sizes to only include those that are less than minimum size limit (12 inches TL), set by management, in federal waters and 3) exploited density estimates filters sizes to include all sizes greater than or equal to 12 inches TL (or, 25cm FL). Time series indices and length frequency compositions were analyzed and presented separately for NCRMP and DCRMP surveys.
5.3.2
Sampling Intensity – Time Series
Sampling Intensity and the time series of the NCRMP reef survey in St. Thomas/St. John is illustrated in Table 5.3.1. Sampling began in 2001 and was conducted every year from 2001 to 2012 and then from 2014, 2016, 2019 and 2021. Samples were divided to 0-12m and the 12-30m strata. Sampling was only conducted on hard-bottom strata which were distinguished into five categories (shown in alphabetical order)
- Aggregate
- Bedrock
- Patch
- Pavement
- Coral/Rock
Additional information of sampling intensity consisted of total number observations of Yellowtail Snapper and the number of lengths measured, each by year.
The upper mesophotic zone DCRMP survey time series data from 2020 to 2022 is shown in Table 5.3.2. Here only habitat types are distinguished in the survey:
- Aggregate
- Patch
- Pavement
5.3.3 Size Data
Length size frequency distribution of Yellowtail Snapper population in St. Thomas and St, John from the NCRMP survey are shown for 2017, 2019, and 2021 in Figure 5.3.3 and for the DCRMP survey for the years 2020 to 2022 are shown in Figure 5.3.4
5.3.4 Catch Rates in Numbers per Area Sampled
The time series of estimated mean Yellowtail Snapper population density in numbers per sampled area; i.e., per 178 m2 +/- SE, is shown Figure 5.3.5. In addition, a time series of estimated population density of the pre-exploited phase; i.e., fish <25cm fork length, was constructed and compared to that of the exploited phase fish; i.e., > 25cm, in Figure 5.3.6 which also included the 2020-2022 from the DCRMP survey.
5.4 Fishery-Dependent Measures
5.4.1 Overview
US Caribbean commercial logbook (CCL) landings and effort were used to construct nominal indices of abundance. CCL data are self-reported. Species specific reporting in the U.S. Virgin Islands landings started in 2012 (1st full year) and the time series from 20122022 was considered. After calculating the proportion positive Yellowtail Snapper trips by gear group (Table 5.4.1) and examining the reported landings by gear group (Table 3.1.1), only hook & line gear had sufficient data to explore the construction of an index of abundance.
5.4.2 Methods of Estimation
Effort variables explored for constructing a nominal index of abundance included,
- Hours fished
- Lines count -Hooks per line count
The following units of effort considered
- Hook hours (hours fished * lines count * hooks per line count)
- Fishing lines hours (hours fished * lines count)
- Hooks per line hours (hours fished * hooks per line count)
- Hours fished
Based on the exploratory analysis of the relationship between CPUE (calculated as pounds of landed Yellowtail Snapper/unit of fishing effort; e.g., per hook hour, per hour fished, etc.) and effort (Figure 5.4.1). Hook hours was deemed as the most appropriate effort measure to calculate CPUE (Fig. 5.4.1)
5.4.3 Sampling Intensity
All commercial fishers are required to report landings and effort to CCL. CCL reporting is therefore considered to be census of commercial landings and fishing effort. Any underreporting has not been quantified.
5.4.4 Size/Age data
CCL includes only landed fish, therefore TIP data provides size composition data for this index
5.4.5 Catch Rates – Number and Biomass
Catch rates were consistent throughout the time series, approximate 5 pounds of Yellowtail Snapper landed per hook hour fished (Figure 5.4.2). Nominal catch rates are shown; i.e., this CPUE series has not been standardized to account for fishing practices and other effects that may mask true trends in Yellowtail Snapper abundance.
5.4.6 Uncertainty and Measures of Precision
Coefficients of variance (CV) around the nominal CPUE index were rather were large throughout the time series (Figure 5.4.2).
5.5 SEDAR
Panel Discussion of Indices Data for Assessment Analyses
Issue 1: Should the fishery-independent density estimates from NCRMP be used in SEDAR 84?
Options:
- Use the density estimates and length composition data from 2013 forward, which includes years calibrated to account for the transition from belt transect to cylinder survey method.
- Use all years of data, 2001-2022, with the caveat that data from 2001-2011 was not an island-wide survey.
Decision:
- Use the NCRMP data from 2013 to 2022.
- Ensure the length at first capture used to define the exploited population aligns with the lengths observed in the port sampled data. (SEFSC TASK)
- Include the DCRMP information separately. Document caveat that there are other areas where larger fish can occur not captured in these surveys
Rationale:
- The NCRMP survey is the most consistent island-wide survey available.
Issue 2: Should fishery-dependent information (commercial logbooks) be considered to conduct abundance indices?
Options:
- Consider this information.
- Do not consider this information.
- Investigate the dataset further.
Decision:
- Do not consider this information for an abundance index.
Rationale:
- Time spent fishing does not necessarily translate to nominal CPUE, equating to where you could look at patterns over time. Experienced commercial fishermen know how to target the species effectively, which may differ from inexperienced fishermen. Therefore, we must include other aspects within the index to make it more representative.
5.6 Measure of Population Abundance Tables
Table 5.3.1 Number of reef fish visual survey sites by hard-bottom strata and depth categories per year from the reef fish visual surveys in the St. Thomas and St. John coral reef ecosystem (2001–2021). Empty cells indicate zero samples. Length totals represent the number of individual length observations recorded.
Table 5.3.2 Number of DCRMP reef fish visual survey sites (left column) and number of Yellowtail Snapper (Ocyurus chrysurus) length observations (right column) by hard-bottom strata from the reef fish visual surveys in St. Thomas and St. John coral reef ecosystem (2020–2022).
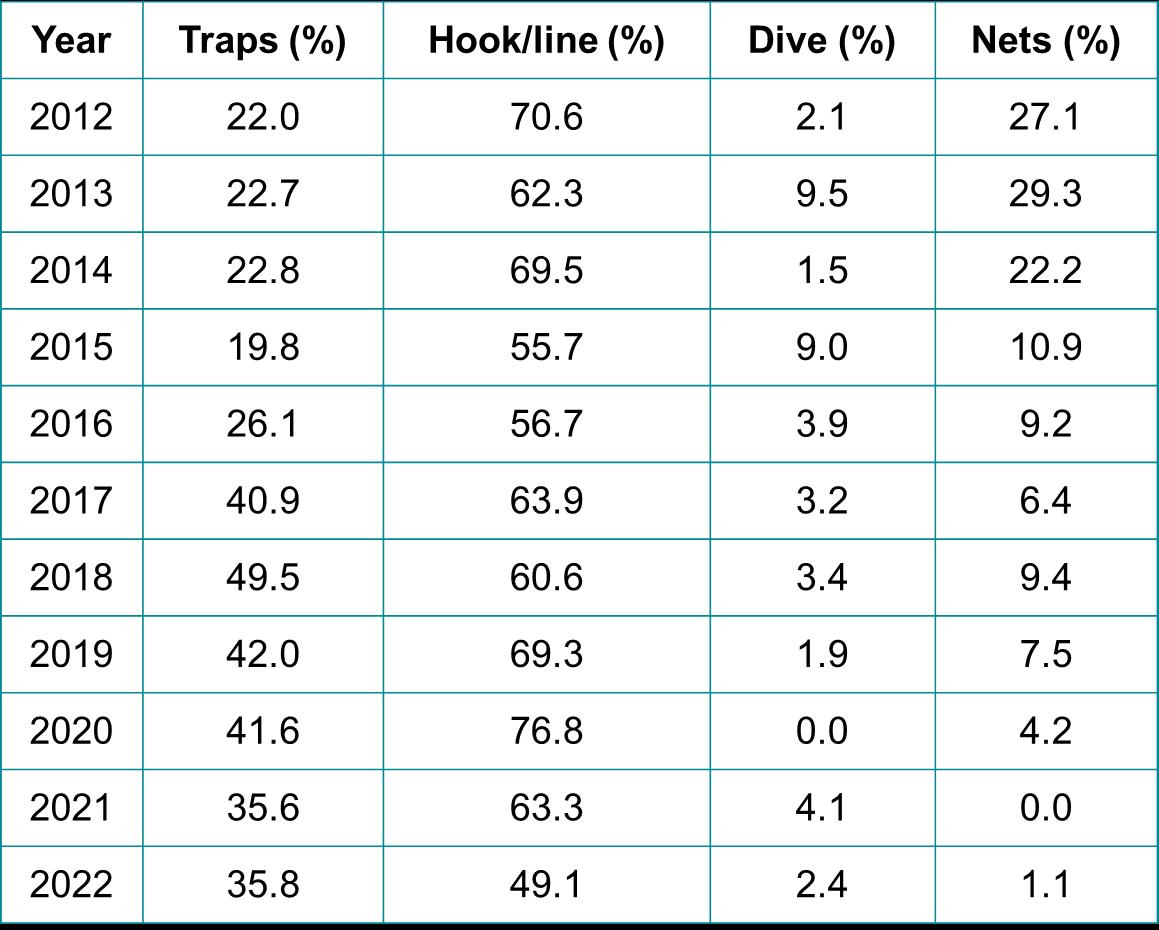
Table. 5.4.1 Number trips that reported Yellowtail Snapper landings in St. Thomas/St. John by year and gear group expressed as a percentage of the total trips of Yellowtail Snapper landed by gear group and year.
5.7 Measure of Population Abundance Figures
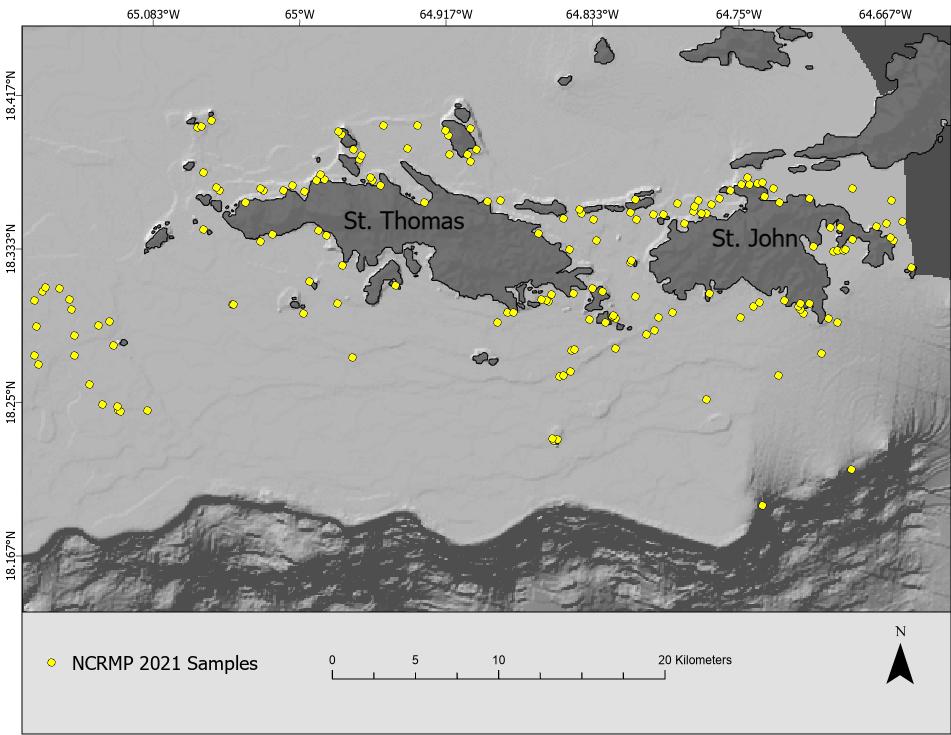
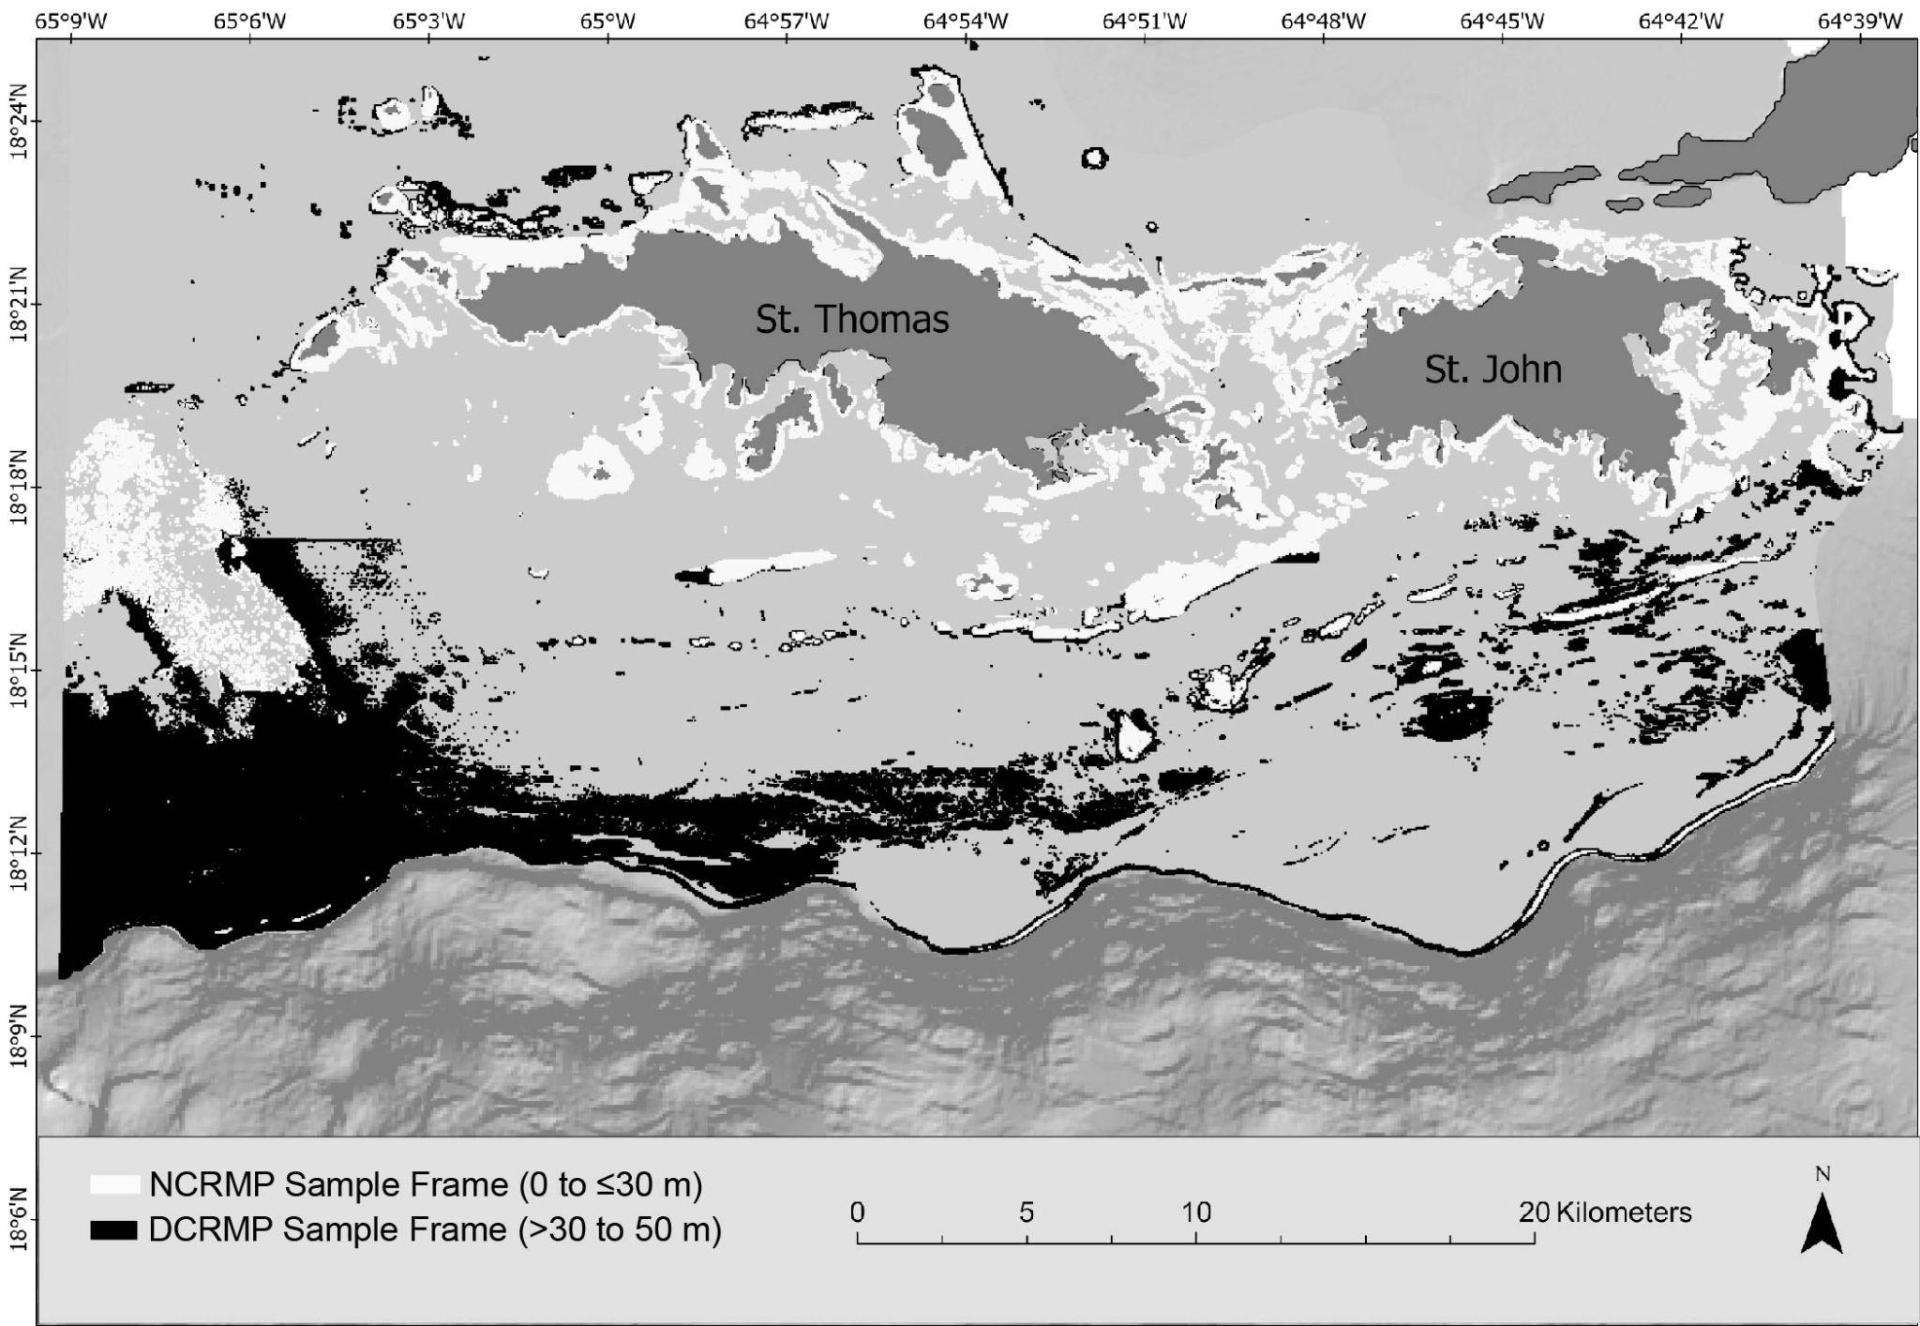
Figure 5.3.1 St. Thomas and St. John NCRMP sampling sites 2021 (n = 165).
Figure 5.3.2 St. Thomas and St. John NCRMP (white) and DCRMP (black) sampling domain.
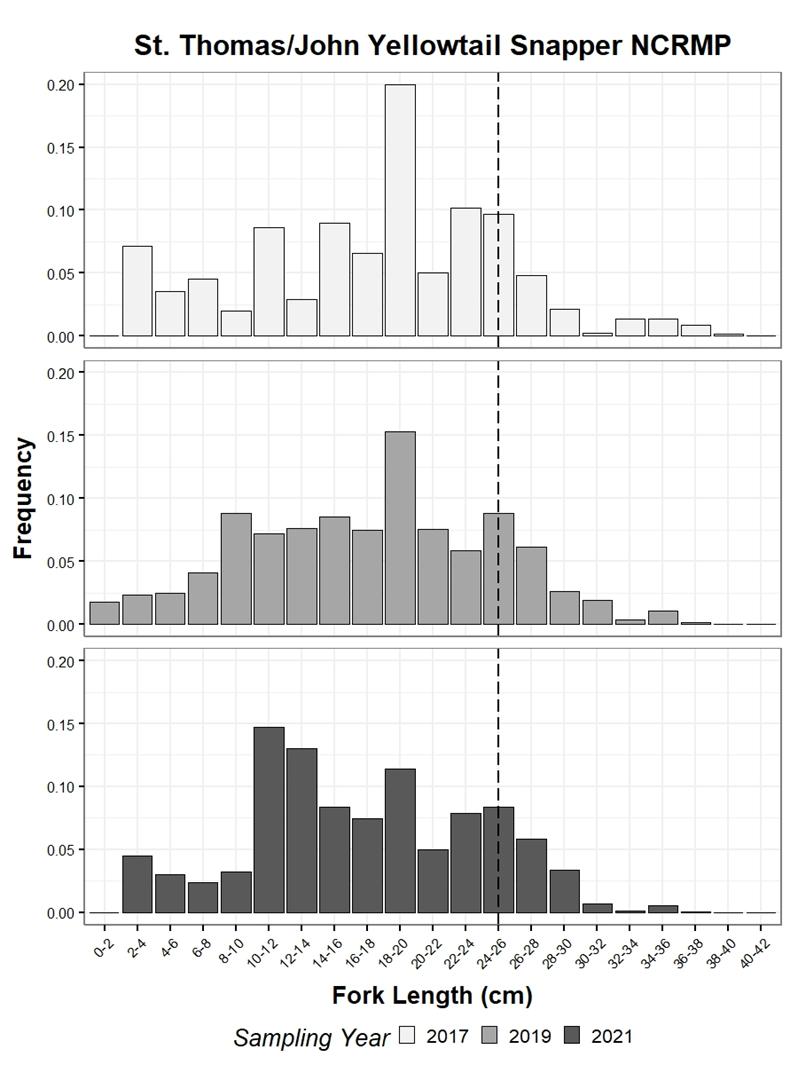
Figure 5.3.3 Yellowtail Snapper population size-frequency distribution at 2-cm bins from the 2017 - 2021 NCRMP RVC-SPC St. Thomas and St. John surveys. Vertical dashed line is length at capture (25.0 cm fork length).
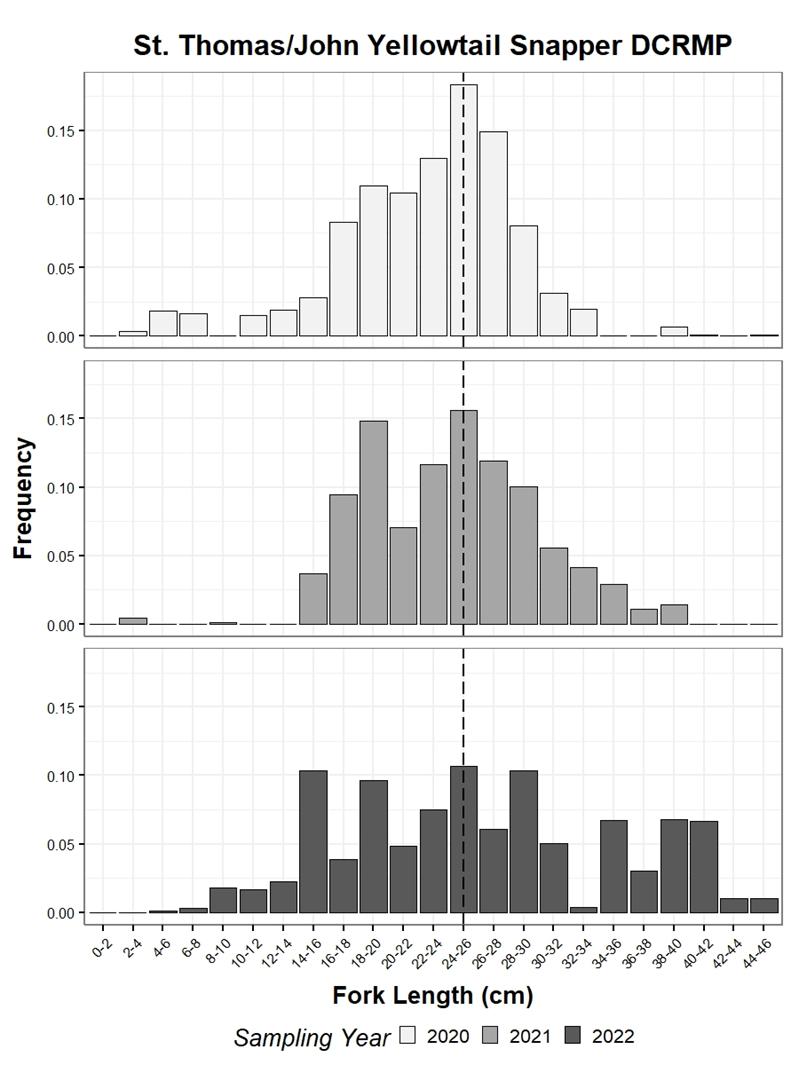
Figure 5.3.4 Yellowtail Snapper population size-frequency distribution at 2-cm bins from the 2020 - 2022 DCRMP RVC-SPC St. Thomas and St. John surveys. Vertical dashed line is length at capture (25.0 cm fork length).
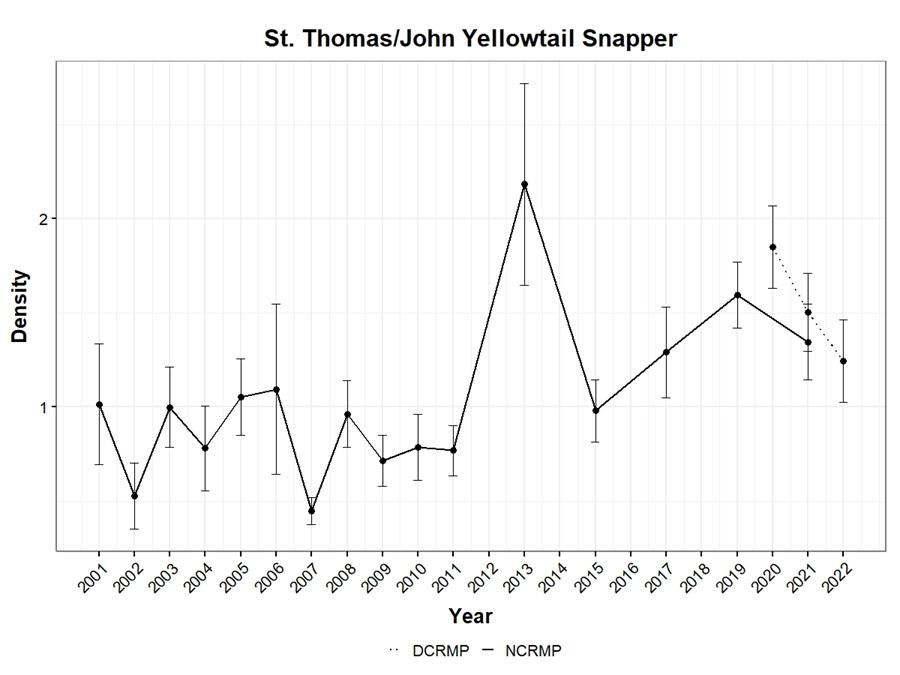
Figure 5.3.5 Time series (2001–2021) of Yellowtail Snapper (Ocyurus chrysurus) mean population density (number per 178 m2, ± SE) from the NCRMP (solid line) and DCRMP (dotted line) reef fish visual surveys in the St. Thomas and St. John coral reef ecosystem.
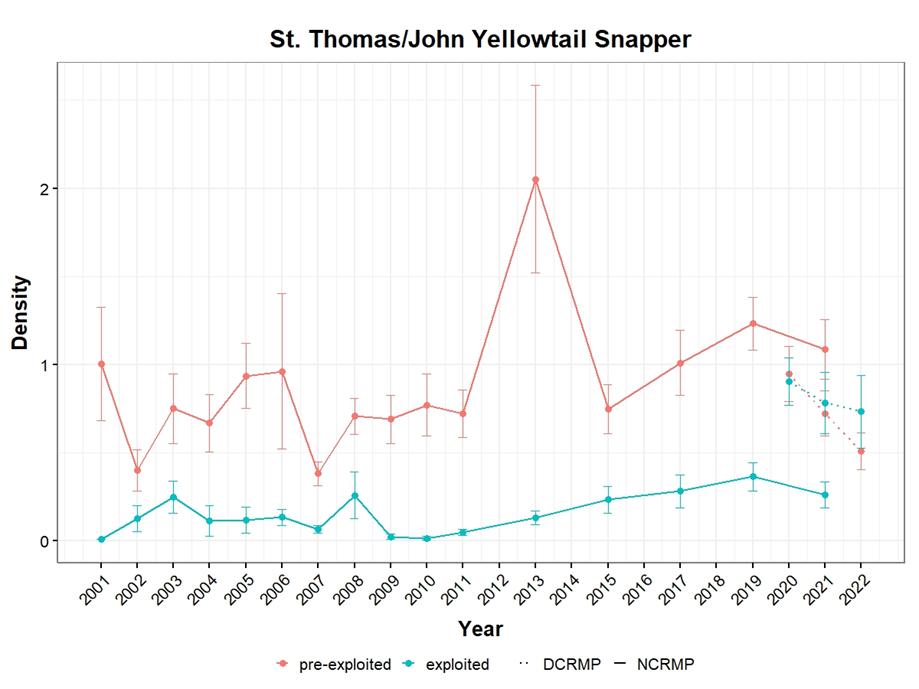
Figure 5.3.6 Time series (2001–2022) of Yellowtail Snapper (Ocyurus chrysurus) mean population density (number per 178 m2, ± SE) from the NCRMP (solid line) and DCRMP (dotted line) in the pre-exploited (blue, < 25 cm) and exploited (red, ≥ 25 cm) reef fish visual surveys in the St. Thomas and St. John coral reef ecosystem.
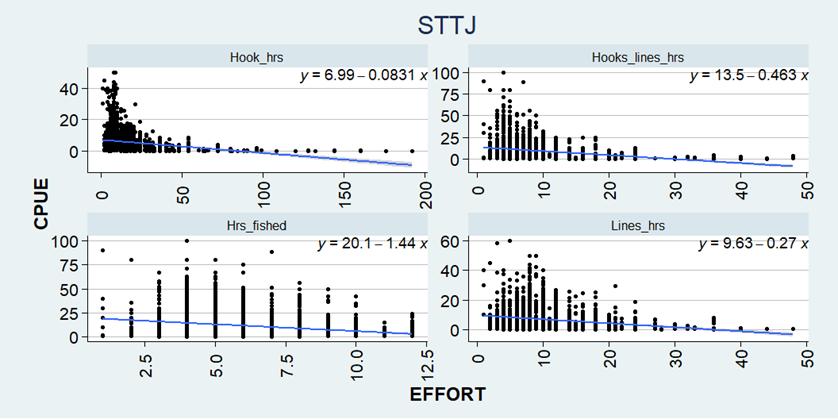
Figure 5.4.1 Exploratory analysis of different variables for suitability as a measure of effort. Hook hours (upper left) was chosen due to the minimal change in CPUE over increasing effort (hook hours); i.e., slope of the line is lowest (-0.0831).
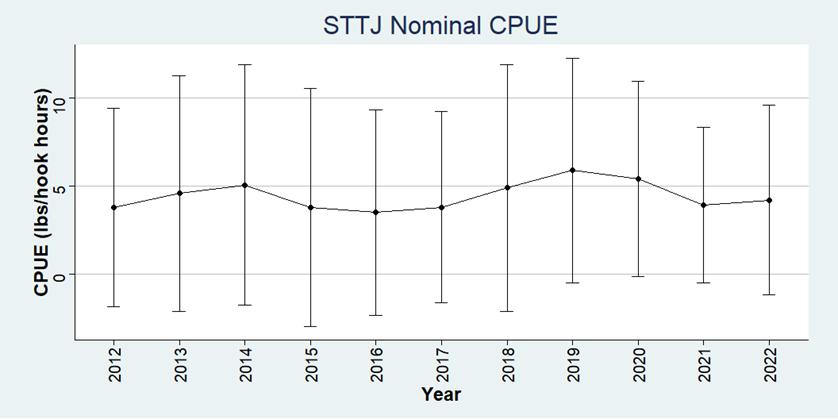
Figure 5.4.2 Nominal CPUE index in pounds per hook hours landed for the commercial Yellowtail Snapper fishery in the St. Thomas/St. John from 2012 to 2022,
6 SEDAR Panel Research Recommendations
6.1 Life History Research Recommendations
Issue 1: Are sufficient life history data available? Research recommendations:
- Life history sampling should be done with statisticians to ensure more efficient collection programs (e.g., optimizing sample sizes within size bins).
- Ensure statistically robust sample sizes of small and large size classes of fish.
6.2 Commercial Statistics Research Recommendations
6.2.1 Commercial Landings Research Recommendation
Issue 1: Are analysis-ready commercial landings data available for SEDAR 84?
- Investigate trends in effort, major socioeconomic and environmental events, and associated effects on the demographics, gears used, and species landed.
- Increased port sampling is needed in St. Thomas and St. John to enable analyses required for quantifying removals.
- Conduct recreational fishery port sampling surveys to determine removals due to recreational fishing.
- Investigate the applicability of hindcasting for all snappers combined or other applicable future assessments.
Issue 2: What should the gear fleets be for the commercial landings data?
- Investigate cases where there may be a miscommunication between databases, which can impact the gear types (i.e., hook and line unknown)
- Operationalize a gear grouping process for future SEDAR assessments.
Issue 3: How uncertain are the commercial landings from 2012 - 2022? No research recommendation.
Issue 4: Should data outliers in the commercial landings be flagged for additional investigation?
- Operationalize an outlier flagging process for future SEDAR assessments.
6.2.2 Length Composition Research Recommendation
Issue 1: Are analysis-ready size data available for SEDAR 84?
- Increase collection efforts to increase sample size in TIP.
- Work with port samplers and fishers to implement the trip interview program better and ensure critical fishing times are captured adequately (e.g., at night).
- Develop a data management system to link TIP to CCL. A linked system would require changing the overarching structure of collecting fishery-dependent data. A fishery information network system for the US Caribbean could comprehensively resolve this issue.
- Operationalize an outlier flagging process for future SEDAR assessments.
- Investigate if relative weight at a given length has changed across years or clusters of years.
- Examine the number of trips when considering the representativeness of TIP samples; do not limit the investigation to the number of fish or the weight of the catch, samples, and trips.
- Going forward, we need a recommendation on how to do a new sampling strategy that is more holistic.
6.3 Recreational Fishery Statistics Research Recommendations
Issue 1: Can tournament data inform recreational removals?
- This data type would be valuable for pelagic species, like wahoo and mahi, with consistent effort and catch. Therefore, this dataset should continue to be explored and standardized for future assessments. There is consistent participation in and support for these tournaments by participants.
6.4
Measures of Population Abundance Research Recommendations
Issue 1: Should the fishery-independent density estimates from NCRMP be used in SEDAR 84?
- Continue DCRMP work in the future.
- Look into National Parks transect data and compare it to the NCRMP data
- Provide RVC to DCRMP comparison for the 2021 year. If they are similar in that year, then what we see in 2022 is more a pulse of large fish than a difference in where the fish are.
Issue 2: Should fishery-dependent information (commercial logbooks) be considered to conduct abundance indices?
- Look into environmental patterns or fisher behavior as an assignment of CPUE or effort that we can use to look into changes in the population.
- Request for USVI fisher to provide their logbooks to further investigate the fisher behavior as an index assignment for CPUE.
7 Literature Cited
Ault, JS, GA Diaz, SG Smith, J Luo, and JE Serafy. 1999. An efficient sampling survey design to estimate pink shrimp population abundance in Biscayne Bay, Florida. North American Journal of Fisheries Management 19: 696–712.
Ault, J, SG Smith, BL Richards, AJ Yau, BJ Langseth, JM O’Malley, CH Boggs, MP Seki, GT DiNardo. 2018. Towards fishery-independent biomass estimation for Hawaiian Islands deepwater snappers. Fisheries Research 208: 321-328.
Ault, JS, SG Smith, MW Johnson, LJW Grove. 2020. Gear calibration factors for U.S. Caribbean coral reef fish visual surveys. Final Technical Report on NOAA Grant No. NA15OAR4320064 SEFSC CREU. 56 p.
Beggerly, S, M Stevens, H Baertlein. 2022. Trip Interview Program Metadata. SEDAR74-DW14. SEDAR, North Charleston, SC. 10pp.
Bryan, DR, AJ Atkinson, JS Ault, ME Brandt, JA Bohnsack, MW Feeley, ME Patterson, BI Ruttenberg, SG Smith, and BD Witcher. 2013. A cooperative multi-agency reef fish monitoring protocol for the U.S. Virgin Islands coral reef ecosystem. Natural Resource Report NPS/SFCN/NRR—2013/672. National Park Service, Fort Collins, Colorado.
Bryan, DR, SG Smith, JS Ault, MW Feeley, CW Menza. 2016. Feasibility of a region-wide probability survey for coral reef fish in Puerto Rico and the U.S. Virgin Islands. Marine and Coastal Fisheries 8(1): 135–146.
Cochran, WG. 1977. Sampling Techniques. Third edition, John Wiley and Sons, New York.
Charnow, E, H Gislason, JG Pope. 2012. Evolutionary assembly rules for fish life histories. Fish Fisheries Vo.14(2): 213-224.
Godwin, K, A Rios, K Dettloff. 2024. SEDAR 84 Trip Interview Program (TIP) Size Composition Analysis of Yellowtail Snapper (Ocyurus chrysurus) in St. Thomas/St. John, U.S. Caribbean, 1983-2022. SEDAR84-DW-10. SEDAR, North Charleston, SC. 10pp.
Grove, LJW, J Blondeau, JS Ault. 2024. Fishery-Independent Reef Fish Visual Survey Population Density and Length Composition for Yellowtail Snapper in St. Thomas/John. SEDAR84-WP-15. SEDAR, North Charleston, SC. 15pp.
Grove, LJW, J Blondeau, JS Ault. 2022. Fishery-Independent Reef Fish Visual Survey Population Density and Length Composition for Queen Triggerfish in the U.S. Caribbean. SEDAR80-WP-08. SEDAR, North Charleston, SC. 32 pp.
Grove, LJW, J Blondeau, JS Ault. 2021. National Coral Reef Monitoring Program’s Reef Fish Visual Census Metadata for the U.S. Caribbean. SEDAR80-WP-02. SEDAR80, North Charleston, SC. 55 p.
Grove, LJW, J Blondeau, D Swanson, S Heidmann, SG Smith, M Johnson, V Brandtneris, S Sagarese, TB Smith. (in press). Expansion of an established fishery-independent survey into the US Virgin Islands’ upper mesophotic zone: feasibility and management implications. Bulletin of Marine Science.
Hewitt, DA and JM Hoenig. 2005 Comparison of two approaches for estimating natural mortality based on longevity. Fishery Bulletin of the United States of America, 103, 433437.
Kadison, E, M Brandt., R Nemeth, J Martens, J Blondeau, T Smith. (2017). Abundance of commercially important reef fish indicates different levels of over-exploitation across shelves of the U.S. Virgin Islands. PLOS ONE 12(7)
Law, AM. 2007. Simulation modeling and analysis. Fourth edition, McGraw Hill, New York. Lohr, SL. 2010. Sampling: Design and Analysis. Second edition, Brooks/Cole, Boston.
Martínez, S, K Johnson, MR Orhun. 2024. SEDAR 84 Commercial fishery landings of Yellowtail Snapper (Ocyurus chrysurus) in St. Thomas and St. John, US Caribbean, 2012-2022. SEDAR84-DW-02. SEDAR, North Charleston, SC. 15pp.
Robson, DS. 1966. Estimation of the relative fishing power of individual ships. ICNAF Research Bulletin 3: 5–15.
Shervette, V, J Rivera-Hernandez, Noemi Pena Alvarado. 2024. U.S. Caribbean Yellowtail Snapper Population Demographics, Growth, and Reproductive Biology: Addressing Critical Life History Gaps SEDAR84-WP-08. SEDAR, North Charleston, SC. 29 pp. Southeast Data Assessment and Review (SEDAR) 46 SAR v2 2016. SEDAR 46 Stock Assessment Report Caribbean Data-Limited Species. April 2016, SEDAR, North Charleston, SC 373 pp. Available from https://sedarweb.org/documents/sedar-46-final-stock-assessmentreport-caribbean-data-limited-species/
Smith, SG, JS Ault, JA Bohnsack, DE Harper, J Luo, and DB McClellan. 2011. Multispecies survey design for assessing reef-fish stocks, spatially explicit management performance, and ecosystem condition. Fisheries Research 109:25–41.
Then, AY., JM Hoenig, NMG Hall, A Hewitt. 2015. Evaluating the predictive performance of empirical estimators of natural mortality rate using information on over 200 fish species. ICES Journal of Marine Science, Volume 72, Issue 1, January 2015, Pages 82–92, https://doi.org/10.1093/icesjms/fsu136
Valle-Esquival, M, and G Díaz. 2004. An Update on the Reported Landings, Expansion Factors and Expanded Landings for the Commercial Fisheries of the United States Virgin Islands (with Emphasis on Spiny Lobster and the Snapper Complex). NOAA/NMFS/SEFSC Miami Laboratory SFD-2004/051 (SEDAR-8-DW-09). 48pp.

AssessmentProcessReportSummary
TheSEDAR84St.ThomasandSt.JohnYellowtailSnapper(Ocyuruschrysurus)stock assessmentprocessconsistedoffourwebinarsbetweenApril2024andOctober2024.The dataavailablefortheassessmentincluded:
• Anannualspecies-specificcatchtimeseriesfromcommerciallogbooks
• Fishery-dependentlengthcompositionsfromcommercialportsampling
• Fishery-independentlengthcompositionsfromtworeeffishsurveys
• Fishery-independentindicesofabundancefromtworeeffishsurveys
• Lifehistoryinformationfromotolithanalysisandgonadhistology
TheassessmentusedStockSynthesis,astatisticalcatch-at-agemodel(Methotetal.,2020). StockSynthesisV3.30.22modelswereinitiallyconfiguredwithanannualcatchtimeseries, whilelengthcompositiondatafromeachsourcewereaggregatedacrossallavailableyears. Modeldevelopmentproceededstepwisefromthesimplestconfigurationtothoseofmoderate complexity.Thosesequentialstepsincludedtheinclusionofdome-shapedselectivity,indices ofabundance,andannualfishery-independentlengthcompositions.Modelswererunwith andwithouttheestimationofrecruitmentdeviations.Finally,sensitivitiesofassessment outcomeswereinvestigatedusingalternativeinputsforlongevity-informednaturalmortality, coefficientofvariationongrowth,anduncertaintyoninitialequilibriumcatch.
Modeldiagnosticsassessedconvergence,fit,andconsistencyusinggradients,residuals, likelihoodprofiles,hindcastcross-validation,andjitteranalyses.Thosediagnosticsrevealed that,althoughdatacontrastwaslimitedandrecruitmentestimateswerehighlyuncertain, theavailablelengthandcatchdata—particularlyfromfishery-independent sources—providedinformationthatthemodelscanusetodeterminepotentialcatchadvice, particularlyinagridormodelensembleapproachthataccountsforkeymodelassumptions anddata-limitedcaveats.
Sensitivityanalysesevaluatedtheeffectsofassumptionsaboutnaturalmortality,growth variability,andinitialequilibriumcatchconditions.Whilethesescenariosshowedthatkey uncertaintiescaninfluenceestimatedproductivityandbiologicalreferencepoints,nearlyall modelsacrossthesuitesupportedtheconclusionthatoverfishingisnotoccurringandthe stockisnotoverfished.Afewsensitivityrunsdidindicatepotentialconcernunderspecific combinationsofassumptions,particularlywithlowerinitialequilibriumcatchandhigher naturalmortality.
1Introduction
1.1WorkshopTimeandPlace
TheSEDAR84AssessmentProcesswasheldviawebinarsfromApriltoNovember2024.
1.2TermsofReference
1. Developandapplyassessmenttoolsthatarecompatiblewithavailabledataand consistentwithstandardpractices.Documentinputdata,modelassumptionsand configuration,andequationsforeachapproachconsidered.
2. Totheextentpossiblegivendatalimitations,providemanagementbenchmarksand statusdeterminationcriteria,including:
a. MaximumFishingMortalityThreshold(MFMT)=FMSY orproxy
b. MSYproxy=yieldatMFMT
c. MinimumStockSizeThreshold(MSST)=SSBMSY orproxy
d. Ifalternativestatusdeterminationcriteriaarerecommended,providea descriptionoftheiruseandajustification.
3. Totheextentpossible,developprojectionstosupportestimatesofmaximum sustainableyield(MSY,theoverfishinglimit(OFL)andacceptablebiologicalcatch (ABC)asdescribedbelow.Ifprojectionsarenotpossible,andalternativemanagement proceduresarerecommended,provideadescriptionoftheiruseandajustification.
a. Unlessotherwiserecommended,usethegeometricmeanofthethreeprevious years’fishingmortalitytodetermineFCurrent
b. ProjectFMSY orproxy
c. Ifthestockisoverfished:
i. Project F0
ii. ProjectFRebuild
4. Providerecommendationsforfutureresearchanddatacollection.
5. ProvideanAssessmentWorkshopReporttoaddresstheseTermsofreferenceandfully documenttheinputdataandresults.
SEDAR84SARSectionIII 5 AssessmentProcessReport
1.3ListofParticipants
AssessmentPanel
AdyanRios(LeadAnalyst) NMFS/SEFSC
RichardAppeldoorn SSC
J.J.Cruz-Motta CFMCSSC,UPRM
MattDamiano NMFS/SEFSC
SennaiHabtes USVIDPNR
WalterKeithly SSC/LSU
KevinMcCarthy NMFS/SEFSC
M.RefikOrhun NMFS/SEFSC
KyleShertzer NMFS/SEFSC
VirginiaShervette UnivSC
DerekSoto MER
AppointedObservers
CarlosFarchette Stakeholder-STX
JulianMagras DAPSTT/STJ
Observers
JeraldS.Ault UnivofMiami
RachelBanton NMFS/SEFSC
SarahBeggerly NMFS/SEFSC
DavidBehringer NMFS/SEFSC
JeremiahBlondeau NMFS/SEFSC
ChipCollier SAFMCStaff
CarlyDaiek NMFS/SEFSC
KatherineGodwin UM-CIMAS
JenniferGranneman NOAA
JayGrove NMFS/SEFSC
WalterIngram NMFS/SEFSC
StephanieMartinez-Rivera NMFS/SEFSC
MariaMcGirl FWC
JenniferPytka
MaggieRios USVIDPNR
JesusM.Rivera-Herdández UnivSC
GriselRodriguez-Ferrer PRDNER
WilsonSantiagoSoler PRFisheriesLiaison
June2025
Observers
SarahStephenson
USCaribbeanYellowtailSnapper–St.Thomas
NMFS/SEFSC
JoyahWatkins RiceUniversity
Staff
JulieA.Neer
SEDAR
LiajayRiveraGarciá CFMCStaff
GracielaGarcia-Moliner CFMCStaff
1.4ListofAssessmentProcessWorkingPapersandReference Documents
1.4.1DocumentsPreparedfortheAssessmentProcess
Document# Title
SEDAR84-AP-01ReportonthestatusofU.S. Caribbeanstoplightparrotfish Sparisomavirideage,growth, andreproductivebiologyfor theSEDAR84Stock Assessment
1.4.2ReferenceDocuments
Document# Title
Authors
DateSubmitted
JesúsM.Rivera Hernándezand VirginiaShervette 6July2024
SEDAR84-RD11TheCommercialYellowtailSnapper FisheryoffPuertoRico,1983-2003
SEDAR84-RD12S8-DW-08:Thecommercialreeffish fisheryinPuertoRicowithemphasison yellowtailsnapper,Ocyuruschrysurus: landingsandcatchperunitofeffort from1983through2003
SEDAR84-RD13TheNetBuybackandBaninSt.Croix, U.S.VirginIslands
Authors
NancieJ.Cummings
NancieJ.Cummingsand DanielMatos-Caraballo
JuanJ.Agar,FlaviaTonioli, ChloeFleming
SEDAR84SARSectionIII 7
AssessmentProcessReport
2Data-InformedModelingDecisions
ThedataavailableforuseinthecurrentassessmentaredocumentedintheSEDAR84U.S. CaribbeanYellowtailSnapperSt.ThomasandSt.JohnDataWorkshopReport(SEDAR, 2024).Providedhereisasummaryofthosedatawithafocusontheassociatedmodel configurationsexploredusingStockSynthesis.Throughoutthisreport, boldedtext isused tohighlightandsummarizethemodelsettingsandconfigurationsrelevanttothevarious phasesofmodeldevelopment.
Additionaldetailsforeachdatainputareavailableintheirrespectivereferences:
1. Landings fromself-reportedcommercialfisherlogbooks(MartínezRiveraetal.,2024)
2. Lengthcompositions fromshore-basedportsampling(Godwinetal.,2024)
3. Lengthcompositions fromtwofishery-independentsurveysofreeffish(Groveetal., 2024)
4. Indicesofabundance fromtwofishery-independentsurveysofreeffish(Groveetal., 2024)
5. Lifehistoryinformation fromotolithanalysisandgonadhistology(Shervette, RiveraHernández,&PeñaAlvarado,2024;Shervette,RiveraHernández,&Zajovits, 2024)
Basedontheavailabledata,theassessmentwasconfiguredwithonearea,one season,onecommercialfleet,andtwofishery-independentsurveys.
2.1CommercialFleetData
2.1.1Catch
ThecatchdataforthecommercialfleetcamefromtheCaribbeanCommercialLogbook program(MartínezRiveraetal.,2024).Beginningin1996,partofthecommerciallandings wasreportedbyspeciesgroups(e.g.,snappers,groupers,parrotfishes,surgeonfishes,etc.), andbygear(hookandline,gillnet,SCUBA,trap,etc.).Allcommercialfisherydatareports includedspeciesgroupsbeginningin1998.InJulyof2011,commerciallandingswere reportedbyspeciesandgear.
Thehandlinegeargroupmadeup72%ofthereportedlandingscatchofYellowtailSnapper inSt.ThomasandSt.John.Allgears(handline,trap,rodandreel,andother)were
includedintoasinglecommercialfleet(Table 7.1).Potentialoutliersdiscussedduringthe assessmentwebinarswereinvestigatedandretainedasvalidtrips.
IntheSEDAR84StockSynthesismodels, thecatchwasinputasbiomass(inmetric tons)andwastreatedasifitoccurredoveranentirefishingseason;i.e.,each fishingyear.
Theyearsoftheavailablespecies-specificself-reportedcommercialfisherlogbooklandings andeffortdatadeterminedthestartandendyearsoftheStockSynthesismodels. The startandendyearsofthemodelwere2012and2022,respectively.
Itisimportanttonotethatthestockwasnotunexploitedatthestartyearoftheavailable catchtimeseries.ThecommerciallandingsofallsnapperspeciesreportedinSt.Thomas andSt.Johnin2012wasundergoingameaningfuldecline.Combinedsnapperlandings droppedbyover55%injustoneyear,from121,187poundsin2010to76,193poundsin2011, followedbyanother30%decreasein2012(SEDAR(2024),Table3.1.3).InitialFwas estimatedforthecommercialfleetandacorrespondinginitialequilibriumcatch.Acommon optiontodefinereferencepointfortheinitialequilibriumcatchistousethegeometricmean ofthefirstthreeyearsofavailablecatches.However,becauseofthedeclineprecedingthe startyearoftheassessment,theassessmentpanelagreedonusingavaluehigherthanthe geometricmeanofthefirstthreeyears. Theinitialequilibriumcatchwasconfigured ininitialrunsas25metrictons,alittleundertwicethegeometricmeanofthecatches from2012-2014,whichwas26.4metrictons).
Theinputstandarderrorforthelandingswassetto0.3. Whenimplementedwith fewdatainputs,Synthesisstronglyprioritizesfittingtheannuallandingstimeseries,often replicatingtheobservedvaluesalmostexactly,particularlywhensmallstandarderrors(e.g., 0.01)areused.Theinitialconfigurationswithlowinputuncertaintyresultedinthemodel tightlyfittingboththeobservedlandingsandtheinputinitialequilibriumcatch.Toallow themodelgreaterflexibilityinestimatingtheinitialequilibriumcatch,andavoidanchoring ittoocloselytotheinputvalue,ahigherstandarderrorof0.3wasspecifiedfortheinitial equilibriumcatch.Thisincreaseduncertaintyenablesthemodeltobalancetrade-offsamong otherdatasourcesandinternaldynamicswhenestimatinginitialconditions.Adescriptionof thesequentialmodelconfigurationsanddevelopmentprocessisprovidedlaterinthis report.
Ahigherstandarderrorof2wasexploredaspartofthesensitivityanalysistoevaluatethe influenceofextremeuncertaintyintheinitialequilibriumcatchinput.Thisvaluewas intentionallyselectedtorepresentascenariowithminimalconfidence,allowingthemodelto substantiallydown-weightthisinputandrevealhowstronglymodeloutputsdependonthe assumedprecisionoftheinitialequilibriumcatch.
CommercialdiscardsreportedbycalendaryearbyMartínezRiveraetal.(2024)were minimal.Basedonexpertjudgmentandavailableinformation,discardsofYellowtail SnapperintheSt.Thomas/St.Johncommercialfisheryareconsiderednegligible,with minimalassociatedmortality(SEDAR(2024)).Additionally,species-specificdiscarddata
werenotcollectedincommerciallogbookspriortoJuly2015,leavingdiscardsfromearlier yearsunquantified.Giventhislimiteddataandtheexpectationoflowdiscardrates, discardswerenotexplicitlyincludedinthemodelinputsorparameterized througharetentionfunction.Theassessmentassumedfullretentionofcatch. Alternativemodelconfigurationsassociatedwiththecommercialfleetdataaredescribed laterinthisreport.Theyincluded:
• Theinitialequilibriumcatchwasexploredvialikelihoodprofiling.
• Ahigherstandarderrorof2wasexploredviasensitivityanalysis.
2.1.2LengthComposition
Gear-specificannuallengthfrequenciesforthecommercialfleetcamefromthecommercial shore-basedport-samplingTripInterviewProgram(Godwinetal.,2024).TheTripInterview Program(TIP)managesdatafromtheU.S.VirginIslandscollectedbyDivisionofFishand Wildlifepersonnel.Portsamplingpersonnelcollectlengthandweightdatafromfishlanded bycommercialfishingvessels,alongwithinformationaboutgeneralareaofcaptureandgear used.Datacollectionbeganin1983withfrequentupdatesinbestpractices;thelatestbeing in2017.TheYellowtailSnapperlengthdatafromSt.ThomasandSt.Johnincluded20,064 lengthobservationsacross1,078uniqueportsamplinginterviews. Althoughthecatchdatacanbeseparatedintohandlineandnon-handlinerelatedgears,85% ofthelengthmeasurementsforSt.ThomasandSt.JohnYellowtailSnapperfrom2012-2022 wereassociatedwithhandlines.Thosedatawereusedtocharacterizethecommercialfleet’s length-basedselectivitypattern.Sincemultiplefishlengthmeasurementscanbeobtained fromasinglesampledtrip,eachlengthdoesnotrepresentanindependentobservation. The relativemodelweightingofthecommercialfleetlengthcompositionswasbased onthenumberoftripssampled.
From2012-2022,thedataincluded7,351shore-basedlengthmeasurementsobtainedacross 208trips.Twotripswereflaggedandremovedaspotentialoutlierswithunusuallylarge lengths. Duetolowsamplesizesofbothfishandtrips,thefishery-dependent commercialfleetlengthcompositiondatawerecollapsedacrossallyears 2012-2022 byimplementingthesuper-periodapproachinStockSynthesis.
TheTripInterviewProgramlengthcompositionsofthecommercialfleetwere assumedtoberepresentativeofthetotalcatch. Althoughafederalminimumsize limitexists,itdoesnotapplyinUSVIterritorialwatersextendingfromlandto3nautical milesoffshore.Discussionatthedataworkshopemphasizedthatthefederalregulationsdoes affectretention,howeverthereareinsufficientdataonthelengthsofdiscardedfishtoinform length-basedretention.
Adoublenormalfunctionwasusedtomodeltherelativevulnerabilityofcapture bylengthforthecommercialfleet. However,onlytwoparameterswereestimated,
effectivelydescribingalogisticselectivityforthecommercialfleet.Thedoublenormal functionallowsfordomedorlogisticselectivity.Itcombinestwonormaldistributions;the firstdescribestheascendinglimb,whiletheseconddescribesthedescendinglimb.Achieving thelogisticshapewiththedoublenormalStockSynthesispatternfacilitatedmodel configurationsforSEDAR84.Thetwoparametersusedtoachievealogisticselectivityshape werethelengthassociatedwithpeakselectivityandthewidthoftheascendinglimb.Domed selectivitywasexploredforthefisheryindependentsurveydatadescribedinthefollowing section.
2.2SurveyData
2.2.1IndexofAbundance
TheNationalCoralReefMonitoringProgram(NCRMP)supportsreeffishsamplingon hard-bottomhabitatsfrom0to30metersdepth(Groveetal.,2021).InSt.Thomasand St.John,NCRMPsamplingbeganin2001andwasconductedeveryyearfrom2001to2011 andtheneveryotheryearstartingin2013.ThedatausedinSEDAR84werefrom nonconsecutiveyearsduring2013-2022whenthesurveywasconductedisland-wide.Data collectedpriorto2017werecalibratedtoaccountforatransitionfrombelttransecttoa cylindersurveymethod.
From2020-2022,theCoralReefConservationProgram(CRCP)fundedapilotsurveyto targettheuppermesophotichabitatsofSt.ThomasandSt.John.TheDeep-NCRMP (DCRMP)hasasamplingdepthlimitof60m(Groveetal.,2024).
AnnualmeandensityandassociatedstandarderrorsforNCMPandDCRMPforSEDAR84 wereprovidedbyGroveetal.(2024).InStockSynthesis,thetimeseriesofmeandensity acrossallobservedlengths wereinputasanindexinnumberswithalognormal errordistribution.Theassociatedlengthcompositiondata,describedinthefollowing subsection,suggestedthat theindexreflectedtheabundanceofjuvenilesbutdidnot observethelargeradultsconcurrentlyobservedinthecommercialcatchdata
2.2.2LengthComposition
TheNCRMPandDCRMPsurveysinSt.ThomasandSt.Johnprovidedcountsby individuallengthsestimatedtothenearestcentimeter. Thelengthdatainputsforboth thecommercialfleetandthesurveysused3-centimeterbins,despite1-centimeter databeingavailable.Thislevelofaggregationiscommonpracticeinstockassessments,asit helpsreducenoiseandoverfittingassociatedwithfine-scalevariabilitythatmaynotbe informativeformodelestimation.Using1-centimeterbinscanintroducespuriousdetaildue tomeasurementerrororsmall-samplefluctuations.The3-centimeterbinswereusedtostrike
abalancebetweenpreservingkeypatternsinthesizecompositionwhileconsideringmodel stability.
AlargeproportionofsmallfishwereobservedintheNCRMPsurvey. Thesmallesttwo bins,(2-5centimeters)and(5-8centimeters),werecollapsedintoasinglebin (2-8centimeters).
Sincemultiplefishcanbeobservedduringasingledive,individuallengthsarenot independentobservations. TherelativemodelweightingoftheNCRMPsurveyand DCRMPsurveylengthcompositionsacrossyearswasbasedonthenumberof paireddives.
Thelengthcompositiondataprovidedreasonablesupportthatyoungerfishwereavailableto theNCRMPsurvey.OverhalfofthelengthsfromtheNCRMPsurveyweresmallerthan20 centimetersforklength,and99%werebelow32centimetersforklength.Meanwhile,the lengthcompositiondataalsoprovidedsupportthatlargerfishwereavailabletotheDCRMP. OverhalfofthelengthsfromtheDCRMPsurveyweresmallerthan26centimetersfork length,and98%werebelow41centimetersforklength. Dome-shapedselectivitywas exploredforboththeNCRMPandDCRMPsurveys.
ModelswereinitiallyconfiguredinStockSynthesiswithlengthcompositiondataaggregated acrosstheavailableyearsforeachsourceoflengthdata.Investigationofadditionalmodel configurationsproceededstepwisefromthesimplestconfigurationtothoseofmoderate complexity.Thestepsincludedtheinclusionofannualfishery-independentlength compositions.Thesequentialmodelconfigurationsaredescribedlaterinthisreport.
2.3LifeHistoryData
Thelifehistorydatausedintheassessmentincludedlongevity-informednaturalmortality, growth,length-weight,andmaturityanalyzedfrom1,554samplesofYellowtailSnapper collectedacrosstheU.S.Caribbeanfrom2013to2023(Shervette,RiveraHernández,&Peña Alvarado,2024;Shervette,RiveraHernández,&Zajovits,2024).Thelargestfishwas57.2 centimetersforklengthandtheoldestwas26yearsold.
Basedontheavailableinformation, theYellowtailSnapperpopulationwasmodeled fromage0throughage26,andfrom0to56-centimetersforklength,in 1-centimeterbins,withthelargestvaluesforeachasplusgroups.
NotethatSS3allowsthelengthbinsofthedatainputstobelargerthanthebinsusedinthe populationmodel. Thebinsizeofallthelengthdatainputswere3centimeters, themodel’ssimulatedpopulationbinsizewas1-centimeterbins. Whenthe populationismodeledatahigherresolutionconcerningbinsize,thelikelihoodfunction, whichaimstomatchtheobserveddatainputsandthesimulatedpopulationestimates, operatesattheresolutionofthedatainputs.
2.3.1Growth
TheSS3growthformulationrequiresfiveparameters:
• Lengthattheyoungestage
• Lengthatthemaximumage
• VonBertalanffygrowthparameter(K)
• Coefficientofvariationattheyoungestage
• Coefficientofvariationatthemaximumage
ParameterestimatesforVonBertalanffygrowthparameter(K)andthelength atmaximumage(L∞)werebasedon1,554samplesofYellowtailSnapper collectedacrosstheU.S.Caribbeanfrom2013to2023(Shervette,Rivera Hernández,&PeñaAlvarado,2024). Whent0 wasfixedto-0.96,Kwas0.23,andL∞ was42.4centimetersforklength.Whent0 wasestimated,itwas-2.73,Kwas0.12,andL∞ was50.8centimetersforklength.
TheSEDAR84assessmentmodelswereconfiguredusingtheparameterestimatesassociated withthefixedt0.Furthermore, theestimatedlengthatagezerofromotolithanalysis byShervette,RiveraHernández,&PeñaAlvarado(2024)wasmodifiedinStock Synthesissothatthelengthoftheyoungestage,age0,wassettozero. Without thismodification,themodelwouldbeunabletofitthesubstantialamountsofsmall(<10cm) YellowtailSnapperobservedinthesurveylengthcompositiondata.
Coefficientsofvariationforbothyoungerandolderageswereinitiallysetto 0.15. Ideally,growthcoefficientsofvariationshouldbederivedfromobservedlength-at-age data,however,theassumedvaluesareconsistentwithspeciesofmoderategrowthvariability (Onoetal.,2015;Schemmeletal.,2022).
Alternativemodelconfigurationsassociatedwiththegrowthdataaredescribedlaterinthis report.Theyincluded:
• Ahighergrowthcoefficientofvariationof0.25foryoungerageswasexploredvia sensitivityanalysis.
2.3.2MorphometricConversion
TherelationshipbetweenweightingramsandlengthinmillimetersprovidedbyShervette, RiveraHernández,&PeñaAlvarado(2024)wasconvertedtoweightingramsandlengthin centimetersandusedasafixedmodelinput. Thelength-weightrelationshipwasW= 2.93x10⁻⁵ *L2.8642,withweight(W)inkilogramsandlength(L)in centimeters.
2.3.3MaturityandFecundity
Maturitywasmodeledasalogisticfunction. Parameterestimatesformaturitywere basedon1,876samplesofYellowtailSnappercollectedacrosstheU.S.Caribbeanfrom2013 to2023(Shervette,RiveraHernández,&PeñaAlvarado,2024). Thefecundityof YellowtailSnapperwasestimatedwithaproxy(bodyweight*maturityat age).
2.3.4StockRecruitment
ABeverton-Holtstock-recruitfunctionwasusedtoparametrizetherelationship betweenspawningoutputandresultingrecruitmentofage-0fish. Thestock-recruit functionrequiresthreeparameters:
• Steepness(h)characterizestheinitialslopeoftheascendinglimb(i.e.,thefractionof recruitsproducedat20%oftheunfishedspawningbiomass).
• Thevirginrecruitment(R0;estimatedinlogspace)representstheasymptoteor unfishedrecruitmentlevels.
• Thevarianceterm(sigmaR)isthestandarddeviationofthelogofrecruitmentand describestheamountofyear-to-yearvariationinrecruitment.
Onlythevirginrecruitment(R0)wasestimated. SigmaRandsteepnesswerefixedat 0.7and0.99,respectively. The0.7sigmaRreflectsslightlyhighvariationinrecruitment. Avalueof0.6isamoderatelevelofrecruitmentvariability,withlowervaluesindicating lowervariabilityandmorepredictableyear-to-yearrecruitment.Theprimaryassumptionfor steepnesswasthatthisstockisnotaclosedpopulation,sorecruitmentmaynotbestrongly tiedtothelocalspawningstockbiomass. Ininitialmodelconfigurations,annual deviationsfromthestock-recruitfunctionwerenotestimated. SteepnessandR0 wereexploredvialikelihoodprofiling.
ContinuousrecruitmentwasparameterizedinSS3usingfoursettlementevents. Equalproportionsofrecruitswereassignedtoeachsettlementevent,andtheywerespaced suchthatrecruitmentwouldhappeninmonths1,4,7,and10.Thisallowedgrowthtobe staggered,reflectingacloserapproximationoftheobservedstockdynamicofyear-round spawningactivity.
2.3.5MaximumAgeandNaturalMortality
Empiricalestimatesofnaturalmortality(M)canbederivedusinglifehistoryinformation suchaslongevity,growth,andmaturity.Forthisassessment,theNaturalMortalityToolwas usedtoestimateM(Cope&Hamel,2022).Variousmethodswereexplored,incorporating
factorssuchasmaximumage,theVonBertalanffygrowthparameter(K),theoreticalageat lengthzero(t0),asymptoticlength(L∞),andageat50%maturity.
InputsfortheNaturalMortalityToolweresourcedfromShervette,RiveraHernández,& PeñaAlvarado(2024),whichobservedamaximumageof26yearsforYellowtailSnapperin theU.S.Caribbean.However,themeanageof1,554sampledfishwas5years.
Table 7.2 summarizestheempiricalmethodsusedtoestimateMbasedonavailablelife historydata.Theprimaryapproachfordeterminingnaturalmortalityinthisassessmentwas longevity-based(Hamel&Cope,2022).
Anaturalmortalityvalueof0.208wasusedintheinitialmodelruns.Thisvalue correspondswiththemaximumageof26yearsreportedbyShervette,RiveraHernández,& Zajovits(2024).ModelconfigurationsincorporatinganalternativeMvalueassociatedwitha slightlyhighermaximumagewereexploredthroughsensitivityanalyses,whicharediscussed laterinthisreport.
2.4SummaryofData-InformedModelingConfigurations
• Basedontheavailabledata,theassessmentwasconfiguredwithonearea,oneseason, onecommercialfleet,andtwofishery-independentsurveys.
2.4.1CommercialFleet
• Thecatchwasinputasbiomass(inmetrictons)andwastreatedasifitoccurredover anentirefishingseason;i.e.,eachfishingyear.
• Thestartandendyearsofthemodelwere2012and2022,respectively.
• Basedonexpertinputandlimiteddata,discardswerenotmodeled.Theassessment assumedfullretentionofcatch.
• Theinputstandarderrorforthelandingswassetto0.3.
– Ahigherstandarderrorof2wasexploredviasensitivityanalysis.
• Theinitialequilibriumcatchwasconfiguredininitialrunsas25metrictons.
– Theinitialequilibriumcatchwasexploredvialikelihoodprofiling.
• Therelativemodelweightingofthecommercialfleetlengthcompositionswasbasedon thenumberoftripssampled.
• Duetolowsamplesizes,thefishery-dependentcommercialfleetlengthcomposition datawerecombinedacrossallyears.
• Thelengthcompositionsofthecommercialfleetwereassumedtoberepresentativeof thetotalcatch.
• Adoublenormalfunctionwasusedtomodeltherelativevulnerabilityofcaptureby lengthforthecommercialfleet.
2.4.2Survey
• TheNCRMPindexreflectedtheabundanceofjuveniles.
• TheDCRMPindexreflectedlargerfishthantheNCRMPindex.
• Thesurveyswereconfiguredasanindexinnumberswithalognormalerrordistribution
• Therelativemodelweightingofthesurveyslengthcompositionsacrossyearswere basedonthenumberofpaireddives.
• Thelengthdatainputsused3-centimeterbins.
• Themodel’ssimulatedpopulationbinsizewas1-centimeterbins.
• Thesmallesttwobins,(2-5centimeters)and(5-8centimeters),werecollapsedintoa singlebin(2-8centimeters).
• Thesurveysweresetupinthemodelswithdome-shapedselectivity.
2.4.3LifeHistory
• TheYellowtailSnapperpopulationwasmodeledfromage0throughage26,andfrom0 to56-centimetersforklength,in1-centimeterbins,withthelargestvaluesforeachas plusgroups.
• ParameterestimatesforVonBertalanffygrowthparameter(K)andthelengthat maximumage(L∞)werebasedonsamplesofYellowtailSnappercollectedacrossthe U.S.Caribbeanfrom2013to2023.
• TheestimatedlengthatagezerofromotolithanalysisbyShervette,RiveraHernández, &PeñaAlvarado(2024)wasmodifiedinStockSynthesissothatthelengthofthe youngestage,age0,wassettozero.
• Coefficientsofvariationforbothyoungerandolderageswereinitiallysetto0.15.
– Ahighergrowthcoefficientofvariationof0.25foryoungerageswasexploredvia sensitivityanalysis.
• Thelength-weightrelationshipwasW=2.93x10^-5L^2.8642,withweightin kilogramsandlengthincentimeters.
• Anaturalmortalityvalueof0.208wasusedintheinitialmodelruns.
– AlternativeMvalueswereexploredthroughsensitivityanalyses.
• Maturitywasmodeledasalogisticfunction.
• ThefecundityofYellowtailSnapperwasestimatedwithaproxy(bodyweight* maturityatage).
• ABeverton-Holtstock-recruitfunctionwasusedtoparametrizetherelationship betweenspawningoutputandresultingrecruitmentofage-0fish.
• SigmaRandsteepnesswerefixedat0.7and0.99,respectively.
• Ininitialmodelconfigurations,annualdeviationsfromthestock-recruitfunctionwere notestimated.
• ContinuousrecruitmentwasparameterizedinSS3usingfoursettlementevents.
3ModelDevelopment
3.1Framework
StockSynthesisV3.30.22wasthemodelingapproachappliedinthecurrent SEDAR84assessmentbecauseofcompatibilitywiththeavailabledataand consistencywithstandardpractices.
StockSynthesisisastatisticalcatch-at-agemodelthatusesapopulationmodel,an observationmodel,andanestimationmodelandappliesalikelihoodfunctioninthe estimationprocess(Methotetal.,2020).StockSynthesis,commonlyreferredtoasSS3,has beenappliedextensivelyworldwideforstockassessmentevaluations(Methot&Wetzel, 2013).Ithasalsobeenusedforpreviousdata-limitedanddata-moderateSEDAR assessments,includingtheSEDAR57assessmentsandsubsequentupdatesforCaribbean SpinyLobster(Panulirusargus),andtheSEDAR80assessmentsforQueenTriggerfish (Balistesvetula)(SEDAR,2019,2022).
TheStockSynthesismodelingframeworkisacompatibletoolforSEDARstockassessments intheU.S.Caribbeanbecauseitcanaccommodateawiderangeofmodelcomplexities,from data-limitedtohighlydetailedassessments(Cope,2024).StockSynthesisallowsforthe characterizationofstock,fishingfleet,andsurveydynamicsthroughvariousparameters, whichcanbeeitherfixedbasedonexternaldataorestimatedwhensufficientassessment dataareavailable.Additionally,itcanincorporatecomplexbiologicaldynamics,suchas continuousrecruitment,whichisappropriateforaccuratelyassessingSt.Thomasand St.JohnYellowtailSnapper.
Finally,Rpackagessuchasr4ssandss3diagsfacilitatecriticalevaluationsofmodel reliabilityandmodelcomparisons(Carvalhoetal.,2021;Tayloretal.,2021).Forexample, R4SSprovidesvisualizationanddiagnostictoolstosummarizeandinterpretfit,convergence, andkeyoutputmetrics.SS3diagsfocusesonretrospectiveanalyses,hind-casting,and residualpatternevaluations.Theintegrationofthesetoolsallowsrigorousuncertainty analysis,streamlinedsensitivityanalyses,andenhancedtransparencyindecision-making.
StockSynthesismodelswereinitiallyconfiguredusinganannualcommercialcatchtime seriesandlengthcompositionsdatathatwereaggregatedacrosstheavailableyearsforeach sourceoflengthdata.Modeldevelopmentproceededstepwisefromthesimplest configurationtothoseofmoderatecomplexity.
3.2Overview
TheSEDAR84modeldevelopmentprocessstartedwithsimpledata-limitedconfigurations, followedbyexploringdata-moderateconfigurations,individuallyandcombined.Thesimplest configurationsaggregatedlengthcompositionsacrossyearsbyimplementingthesuper-period approachinStockSynthesis.Whenusingsuper-periods,theestimationmodelgenerates annualvalues,butthelikelihoodfunctionwillcomparetheexpectedcompositetothedata compositeacrossthesuper-period.Whenusingthisapproachonthelengthcomposition data,StockSynthesismodelswillstillaimtoidentifyparametervaluesforselectivitythat achieveafitbetweenthepredictedandobserveddata.
Theinitialsetupstepsanddescriptionofthemodelingscenariosdocumentedinthisreport arelistedinTable 7.3.FortheSEDAR84YellowtailSnapperassessment,thedata-moderate considerationsexploredincluded:(a)indicesofabundance,(b)annualfishery-independent lengthcompositions,(c)dome-shapedselectivity,and(d)recruitmentdeviations.Additional modelconfigurationswerenotpursued.Forexample,annualfishery-dependentlength compositiondatawerenotconsideredduetolowsamplesizes.
TheStockAssessmentContinuumToolwasusedtodeveloptheinitialmodelsetupby importingCSVinputfilesandutilizingitsShinyapplicationinterface(Cope,2024).Starting fromtheContinuumTool(ct)model,aseriesofsequentialmodificationswereappliedto representthreekeybiologicalanddata-relatedcomplexities:adjustedlengthatagezero (m1),continuousrecruitment(m2),andincreasedcatchuncertainty(m3).
Thisreportfocusesontheresultsandsensitivitiesassociatedwiththem3models,evaluated underthevariousdataconfigurationssummarizedinsec-data-summary.Whileafull discussionofsensitivityrunsisprovidedlaterinthereport,theyarealsosummarizedin Table 7.3 tohelpfamiliarizethereaderwiththeterminologyusedthroughout.Forinstance, model v4_m3_s1 referstothefourthscenario(v4,whichincludesanindexand dome-shapedselectivity),thethirdlevelmodification(m3,reflectingcontinuousrecruitment andhighercatchuncertainty),andthefirstsensitivityscenario(s1,higheruncertaintyon growth).
Duetothelackofanestimablespawner-recruitrelationshipacrosstheexploredmodels,a commonlyused40%spawningpotentialratio(SPR)wasusedasaproxyforMaximum SustainableYield(MSY)andasthebasisformanagementreferencepoints(Shertzeretal., 2024).TheSPRproxyreflectstheratioofexpectedlifetimereproductivepotentialunder fishedconditionscomparedtovirginconditions.
4ModelDiagnostics
ModeldiagnosticsaimedtofollowtheconceptualprocessdescribedbyCarvalhoetal.(2021). Theirapproachincludesevaluatinggoodnessoffit,informationsourcesandstructure, predictionskill,convergence,andmodelplausibility.AlthoughCarvalhoetal.(2021)advise detoursandadditionalmodelexplorationswheninitialdiagnostictestsfail,advanced diagnostics,suchaslikelihoodprofiles,retrospective,andjitteranalyses,wereconducted evenwheninitialtestsfailedtocomprehensivelycommunicatethevariousmodel configurationsexplored.
4.1Convergence
Threeapproacheswereusedtocheckformodelconvergence.Theywereinvestigatingforthe presenceof(1)boundedparameters,(2)highfinalgradients,and(3)apositivedefinite hessian.AsdescribedbyCarvalhoetal.(2021),checkingforboundedparameterscan indicatediscrepancieswithdataormodelstructure.Additionally,smallfinalgradientsanda positivedefinitehessiancanindicatethattheobjectivefunctionachievedgood convergence.
ThemodelspresentedinthisreportallhadapositivedefiniteHessian,indicatingthateach reachedalocalminimumandalocallyoptimalfit.Noneofthemodelshadparametersthat werebounded,suggestingtheoptimizationwasnotconstrainedbyparameterlimits.Finally, theparametergradientsinallmodelsweresmallandwellbelow0.001,whichiscommonly usedintheR4SSRpackagetoidentifylargegradients(Table 7.7).
4.2CorrelationAnalysis
Highcorrelationamongparameterscanleadtoflatresponsesurfacesandpoormodel stability.Byperformingacorrelationanalysis,modelingassumptionsthatleadto inadequateconfigurationscanbeidentified.Becauseofthehighlyparameterizednatureof stockassessmentmodels,someparametersareexpectedtobecorrelated(e.g.,stockrecruit parameters).However,manystronglycorrelatedparameterssuggestreconsideringmodeling assumptionsandparameterization.
Highcorrelations(correlationcoefficientsgreaterthan0.95orlessthan-0.95)wereobserved acrossnearlyallm2modelscenarios(Table 7.4).Oneparticularlynoteworthycorrelation wasbetweentheestimatesofinitialfishingmortality(InitialF)andunfishedrecruitment (R0),whichexceeded-0.99inallmodelsexceptforversionv19_m2,whereitwasslightly lowerbutstillsubstantialat-0.94.
Intheinitialdefaultconfigurationsofboththem1andm2modelscenarios,thestandard errorontheinitialequilibriumcatchwasfixedatalowvalueof0.01.Thistightly constrainedthemodeltotheinputcatchof25metrictonseffectivelylimitingflexibilityin estimatingthecorrespondinginitialfishingmortality.Toaddressthisissue,thestandard errorwasincreasedto0.3,allowingtheestimatedinitialcatchtodivergefromthefixedinput value(Table 7.6).ThisadjustmentreducedtheoverlystrongcorrelationbetweenInitialF andR0byrelaxingtheconstraintoninitialfishingmortality.Theeffectsofincreasingthe standarderrorbeyond0.3arediscussedfurtherinthesensitivityanalysessection.
Thev4_m2andv4_m3modelscenariosshowedhighcorrelations(>0.95)betweenthetwo parametersusedtodefinethecommercialfleetlogisticselectivity:thelengthatpeak selectivityandthewidthoftheascendinglimb.Correlationsbetweentheseselectivity parametersisexpected.Whileestimatedvaluesvariedslightlyamongmodels,theyproduced similarlength-basedselectivitycurvesforthecommercialfleet(Figure 8.1).
4.3EvaluatingVariance
Tocheckforparameterswithhighvariance,parameterestimatesarereportedwiththeir resultingstandarddeviations.Table 7.7 presentsthemodel-estimatedvaluesandstandard deviationsforthemainactiveparameters.Whileit’simportanttoconsiderthescaleofeach parameter,theresultssuggestthatkeyparametersarenotbeingestimatedwithhigh precision.Inparticular,thecoefficientsofvariationforinitialfishingmortalityarerelatively highacrossallmodels,indicatingconsiderableuncertaintyintheseestimates.
Figure 8.2 illustrateshowtheestimateanduncertaintyfortheunfishedrecruitment(R0)and virginspawningstockbiomasschangethroughoutthesequentialstepsofmodeldevelopment. Ingeneral,increasingthecomplexityofthemodelwithannualfishery-independentlength compositiondata(modelsv8_m3andv19_m3)resultsinslightlyhighervaluesforbothof
theseparameters.Theuncertaintyacrosstheresponsesurfaceforkeyparametersisfurther examinedlaterinthereportusinglikelihoodprofiles.
StockSynthesisalsoprovidesestimatesandstandarddeviationsforderivedquantitiessuch asunfishedspawningstockbiomass,initialyearspawningbiomass,andtheinitialdepletion. Initialdepletionisdefinedastheinitialbiomassdividedbytheunfishedbiomass.Table 7.5 showsthisinformationanditisalsoplottedinFigures 8.3a and 8.3b
Comparedtotheotherm3modelscenarios,Modelv19_m3exhibitedthehighestinitial depletionreflectedinthelowestspawningbiomassratio(SSBInitial/SSBUnfished) reportedinTable 7.5.Thisratioisalsoplottedasatimeseriesoftotalbiomassrelativeto virginspawningbiomassinFigure 8.3a.Thesensitivityrunsdescribedlaterfurtherexplore theuncertaintyassociatedwiththesemodelscenarios.
4.4JitterAnalysis
Jitteranalysisisarelativelysimplemethodthatcanbeusedtoassessmodelstabilityandto determinewhetherthesearchalgorithmhasfoundaglobal,asopposedtolocal,solution. Thepremiseisthatallstartingvaluesarerandomlyaltered(or‘jittered’)byaninput constantvalue,andthemodelisrerunfromthenewstartingvalues.Iftheresulting populationtrajectoriesacrossmanyrunsconvergetothesamesolution,thisprovidessupport thataglobalminimumhasbeenobtained.Thisprocessisnotfault-proof;noguaranteecan everbemadethatthe‘true’solutionhasbeenfoundorthatthemodeldoesnotcontain misspecification.However,ifthejitteranalysisresultsareconsistent,itprovidesadditional supportthatthemodelisperformingwellandhascometoastablesolution.Forthis assessment,ajittervalueof0.2wasappliedtothestartingvalues,and30runswere completed.Thejittervaluedefinesauniformdistributionincumulativenormalspaceto generatenewinitialparametervalues(Methotetal.,2020).
Consistentwithearlierresultsindicatingthatthemodelsreachedlocalminima(positive definiteHessian),nojitterrunsproducedalowerlikelihoodthanthebestfitalready identifiedforeachmodel.However,withmodelsfrequentlyconvergingathigherlikelihoods, thejitteranalysissuggestssomeinstabilityinthemodelscenarios(Figure 8.4).
4.5ResidualAnalysis
Theprimaryapproachtoinvestigatemodelperformancewasaresidualanalysisofmodelfit toeachdataset(e.g.,catch,lengthcompositions,indices).Anytemporaltrendinmodel residualsordisproportionatelyhighresidualvaluescanindicatemodelmisspecificationand poorperformance.Ideally,residualsarerandomlydistributed,conformtotheassumederror structureforthatdatasource,andarenotofextrememagnitude.Anyextremelypositiveor
negativeresidualpatternsindicatepoormodelperformanceandpotentialunaccounted-for processorobservationerror.
4.5.1Catch
Allmodelscloselymatchedtheobserved2012–2022catchdata,asexpectedgiventhe data-limitedconfigurations.Intheseconfigurations,StockSynthesisreliesheavilyonthe inputcatchdata,withminimaladditionalinformationtosupportestimationofvaluesthat differfromtheobservations.Theeffectofincreasingthestandarderroronthecatchto0.3 duringthemodeldevelopmentm3scenariowastogivethemodelmoreflexibilityin estimatinginitialequilibriumcatchandcorrespondinginitialfishingmortality.This adjustmentallowedthemodeltoexplorealternativefitswhileremaininginformedbythe assumptionofalargerlevelofhistoricallysustainedcatch.Increasingthestandarderror from0.01inthem2modelscenariosto0.3inthem3modelscenariosresultedinhigher estimatesoftheinitialequilibriumcatch(Table 7.6).Thistopicwillberevisitedinthe sensitivityanalyses,wheremodelrunswithevenhighercatchstandarderrorof2are compared.Additionaljustificationsforfurtherallowingtheestimatedinitialequilibrium catchtodifferfromtheassumedinitialequilibriumcatchof25metrictonsisfurther investigatedvialikelihoodprofiles(SeeSection 4.7.2).
4.5.2Indices
Forthemodelswithoutrecruitmentdeviationbeingestimated(modelscenariosv4_m2,and v8_m2),thepredictedNCRMPandDCRMPindicesareflat(Figures 8.5 and 8.6).Inthe modelscenarioswithestimatedrecruitmentdeviations(v19_m3),thereissomeaslight overalldeclineintheestimatedindices.Notably,highuncertaintyintheindexwasobserved in2013oftheNCRMPindex(Figure 8.5).
4.5.3LengthCompositions
Figure 8.7 showsthecumulativefitacrossallyearsbetweentheobservedandpredicted lengthcompositionforthemodelscenariothathadaggregatedlengthdata(v4_m3).Figures 8.8 and 8.9 providethecumulativeandtheyear-specificlengthcompositionsforthemodel scenariosthatincludedannualfishery-independentlengthdata(v8_m3,andv19_m3).
Amongthemodelswiththeannualfishery-independentlengthdata(v8_m3,andv19_m3), themodelwithrecruitmentdeviationbeingestimated(v19_m3),hasimprovedfitstothe annualNCRMPandDCRMPlengthcompositiondata(Figure 8.9b).Inthescenarios withoutrecruitmentdeviations(v8_m3),thepredictedNCRMPcompositionisidentical acrossyearsandsimilartocumulativefitwhenthelengthdatawereaggregatedinmodel v4_m3.Finally,Figure 8.10 showstheobservedandpredictedmeanlengthbyyear.
4.6RetrospectiveAnalysis
Aretrospectiveanalysisisahelpfulapproachforinvestigatingtheconsistencyofterminal yearmodelestimates(e.g.,SSB,Recruits,Fs)andisoftenconsideredasensitivity explorationofimpactsonkeyparametersfromchangesindata.Theanalysissequentially removesayearofdataandrerunsthemodel.Supposetheresultingestimatesofderived quantitiessuchasSSBorrecruitmentdiffersignificantly.Insuchacase,serialover-or underestimationofimportantquantitiescanindicatethatthemodelhasanunidentified processerrorandcouldrequirereassessingmodelassumptions.Itisexpectedthatremoving datawillleadtoslightdifferencesbetweenthenewterminalyearestimatesandtheestimates forthatyearinthemodelwiththecompletetimeseriesofdata.Estimatesinyearsbefore theterminalyearmayhaveincreasinglyreliableinformationoncohortstrength.Therefore, slightdifferencesareusuallyexpectedbetweenmodelrunsasmoreyearsoflength compositiondataaresequentiallyremoved.Ideally,thedifferenceinestimateswillbeslight andrandomlydistributedaboveandbelowtheestimatesfromthemodelwithcompletedata settimeseries.
Theresultsofafive-yearretrospectiveanalysisareplottedinFigure 8.11.Allretrospectives showwide95%confidenceintervals.Theretrospectivepatternwasmostdivergentinthe scenariowithrecruitmentdeviationsandannualfishery-independentlengthdata,model v19_m2.Inthisscenario,thespawningbiomassshowssensitivitytotheremovalof2019and 2018data.
4.7LikelihoodProfiles
Profilelikelihoodsareusedtoassessthestabilityofparameterestimatesbyexamining changesinthenegativelog-likelihoodforeachdatasourceandevaluatingtheinfluenceof eachsourceontheestimate.Theanalysisisperformedbyholdingagivenparameterata constantvalueandrerunningthemodel.Themodelisrunrepeatedlyoverarangeof reasonableparametervalues.Ideally,thegraphofchangeinlikelihoodvaluesagainst parametervalueswillyieldawell-definedminimum.Whentheprofileplotshowsconflicting signalsorisflatacrossitsrange,thegivenparametermaybepoorlyestimated.
Typically,profilingiscarriedoutforkeyparameters,particularlythosedefiningthe stock-recruitrelationship(steepness,virginrecruitment,andsigmaR).Profileswereexplored acrossvirginrecruitment(R0),initialequilibriumcatch,andsteepness.
4.7.1UnfishedRecruitment(R0)
Figure 8.12 showstheprofilelikelihoodforthenaturallogoftheunfishedrecruitment parameteroftheBeverton–Holtstock-recruitfunctionforSt.ThomasandSt.John
YellowtailSnapperacrossmodelscenarios(v4,_m3,v8_m3andv19_m3).Allmodelsshow conflictingsignalsandrelativelypoorlydefinedminimums,witharangeofequallyplausible valuesreflectedbyonlysmallchangesinlikelihood.Figure 8.13 showsthecorresponding changeintheMaximumSustainableYieldProxybasedonSPR40%acrosstherangeof unfishedrecruitmentvaluesexplored.
4.7.2InitialEquilibriumCatch
Figure 8.14 showstheprofilelikelihoodfortheinitialequilibriumcatchforSt.Thomasand St.JohnYellowtailSnapperacrossmodelscenarios(v4_m3,v8_m3,andv19_m3).The modelssuggestimprovedfitassociatedwithlargervaluesoffixedinitialequilibriumcatch. Figure8.14showstheprofilelikelihoodfortheinitialequilibriumcatchforSt.Thomasand St.JohnYellowtailSnapperacrossmodelscenarios(v4_m3,v8_m3,andv19_m3).The profilesindicateimprovedmodelfitwithlargerfixedvaluesofinitialequilibriumcatch.A fewofthesensitivityruns,specificallytwofromthev4_m3scenarioandthreefromthe v19_m3scenario,appearaspeaksorspikesinthelikelihoodprofile.Thesereflectlocal minimawherethemodelsettledonalternativeestimatesoftheDCRMPselectivityend parameter.Althoughtheyaffectthesmoothnessoftheprofile,thesepeaksarenot consideredaconcernfortheoverallanalysis.Figure 8.15 showsthecorrespondingchangein theMSYSPR40%acrosstherangeofinitialequilibriumcatchvaluesexplored.This suggeststhatgivenfurtherflexibilitytheinitialequilibriummaybeestimatedhigher.This wasfurtherexaminedthroughsensitivityrunsfurtherrelaxingtheinformationthatinforms theinitialmodelconditions.
4.7.3Steepness
Figure 8.16 showstheprofilelikelihoodforthesteepnessparameteroftheBeverton–Holt stock-recruitfunctionforSt.ThomasandSt.JohnYellowtailSnapperacrossmodelscenarios (v4_m3,v7_m3,andv19_m3).Thelowestlikelihoodsarepredominantlyassociatedwith thelowestvaluesofsteepness,drivenbythefittothelengthdata.Figure 8.17 showsthe correspondingchangeintheMSYSPR40%acrosstherangeofsteepnessvaluesexplored.
4.8SensitivityRuns
Sensitivityanalyseswereconductedtoevaluatetheimpactofkeymodelassumptionson derivedquantities.DetailsoftheprocessandnamingconventionsareprovidedinTable 7.3 TheanalysesexploredalternativeassumptionsfortheCVongrowth,fixedinputfor maximumage-informedmortality,andthestandarderrorappliedtocatchdata.
Foreachmodelscenarioandsensitivityrun:
• Table 7.6 providestheinitialequilibriumcatch
• Tables 7.8 and 7.9 providetheMSYproxy(basedonSPR40%)
• Table 7.10 summarizesthefishingmortalityrateandspawningstockbiomassratios relativetotherateandbiomassofthestockassociatedwiththeMSYproxy(basedon SPR40%)
4.8.1GrowthCV
Thefirstsensitivityscenario(s1)assumedthecoefficientofvariation(CV)foryoungfishwas increasedfrom0.15to0.25.Them3_s1sensitivitiesresultedinaslightchangetothe derivedquantitiesrelativetothecorrespondingm3sensitivitymodelconfigurations(Tables 7.6, 7.8, 7.9,and 7.10).Growthisacriticalprocessinallstockassessmentmodels,andin thisassessment,theCVforyoungfishwasaparticularlyrelevantsensitivitytoexaminedue tothelargenumberofsmallindividuals(lessthan8cm)observedintheNCRMP fishery-independentsurveylengthcompositions.Whileadditionalsensitivitiesrelatedto growthwereconsidered,theywillberevisitedinthediscussionsectionaspartofthe researchrecommendations.Thecurrentmodelsusethebestavailablegrowthparameters fromShervette,RiveraHernández,&PeñaAlvarado(2024).
4.8.2NaturalMortality
Thesecondsensitivityscenario(s2)exploredaslightlylowernaturalmortalityof0.193, correspondingtoahighermaximumageof28years(SEDAR,2020).Thishighermaximum age,observedalongthenorthernrangeofthespecies(offNorthCarolinaandSouth Carolina),isonlyslightlyolderthanthemaximumageof26yearsobservedbyShervette, RiveraHernández,&Zajovits(2024).Althoughthetruemaximumageisoftenlargerthan themaximumageobserved,particularlyforspeciesthathavesustainedhistoricalfishing pressure,theHamel(2015)methodestimatesnaturalmortalitybasedonthemaximum observedage.Inthisassessment,ageistheonlyfactorusedtoinformtheestimateof naturalmortality,makingitimportanttoconsidertheimplicationsofassumingalowerM, whichreflectsalessproductivestock.Them3_s2sensitivitymodelsshowedtheonlyslight differencesfromthecorrespondingm3configurations.Thesedifferencesincludedlower spawningstockbiomassratios,andhigherfishingmortalityratiosandsimilarequilibrium catchandestimatesofmaximumsustainableyieldproxy(Tables 7.6, 7.8, 7.9,and 7.10).
4.8.3StandardErroronCatch
Thethirdsensitivityscenario(s3)examinedtheeffectoffurtherrelaxingtheinformation thatinformstheinitialmodelconditions.Inthem3modelscenarios,astandarderrorof0.3 wasappliedtothelandingsdata(seeSection 2.1.1).Comparedtothem2modelscenarios, thisresultedinhigherestimatesofinitialequilibriumcatch.However,likelihoodprofiles(see
Section 4.7.2)showedimprovedfitatevenhigherfixedestimatesofequilibriumcatch.This ledtotheexplorationofincreasedinputuncertaintyusingastandarderrorof2.0associated withtheinputequilibriumcatch.
Effectively,thisprovidesgreaterflexibilityinestimatinginitialconditions,whichareknown tobedifficulttoresolvewithoutlongertimeseries.Them3_s3sensitivitiesproduced extremelyhigherestimatesofinitialcatchandMaximumSustainableYield,lowerfishing mortalityratios,andmoderatelyhighbiomassratioscomparedtothem3models(Tables 7.6, 7.8, 7.9,and 7.10).
Theseresultshighlightthesignificanceofuncertaintyininitialconditionsandunderscores thevalueoflongerhistoricaldataseries.Withoutthem,thereisconsiderableuncertaintyin definingtheinitialconditions,andthem3_s3resultsimplythatifearlylandingswerelarger thanassumedinthem3models,thestockmaybemoreproductive.
Figure 8.18 showsthattheestimatesandassociateduncertaintyforunfishedrecruitment (R0)andvirginspawningstockbiomassinthem3_s3sensitivityscenariosareshifted towardshighervaluescomparedtothem3modelresults(SeeFigure 8.2).Thetimeseriesof derivedquantitiesforthem3_s3scenariosareprovidedinFigure 8.19 andappearbroadly similartothosefromthem3modelsshowninFigure 8.3,withtheexceptionofthescaleand notablyhigheruncertainty.
4.8.4StandardErroronCatchandNaturalMortality
Thefourthsensitivityscenario(s4)exploredthecombinedimplicationsoftwosensitivities: increaseduncertaintyaroundinitialequilibriumcatchandlowernaturalmortalityassociated withhighermaximumage.Byevaluatingbothassumptionssimultaneously,thisscenario investigatesthecompoundinguncertaintyassociatedwiththebaselinem3model configurations.
Thecombinedeffectofthesechangesweresimilartothethirdsensitivityscenarioexploring onlythestandarderroroncatch(Tables 7.6, 7.8, 7.9,and 7.10).AsshowninFigure 8.20, theestimatesanduncertaintyforunfishedrecruitment(R0)andvirginspawningstock biomassinthem3_s4modelsarealsosimilartothoseofthepriorsensitivityplottedin Figure 8.18.ThetimeseriesofderivedquantitiesinFigure 8.21 indicatethatthem3_s4 modelsconvergeondrasticallyhigherspawningoutputandlowerfishingmortalityrelativeto them3scenarios.
5Discussion
Thisassessmentpresentsaseriesofmodelconfigurationsdevelopedtoaddresskey uncertaintiesinboththedataandmodelstructure,usinganintegratedframeworkto evaluatethestockstatusofYellowtailSnapperinSt.ThomasandSt.John.Acrossthewide rangeofscenariosexplored,allmodelconfigurationsconsistentlyindicatedthatthestockis notoverfishedandthatoverfishingisnotoccurring(Table 7.10).However,diagnosticsand sensitivityanalysesrevealedimportantcaveats,primarilyduetothestronginfluenceoffixed parameterassumptionsincludinginitialconditionsandgrowth.
Amajorsourceofuncertaintystemsfromunknowninitialcatchlevels,whicharestrongly tiedtotheresultinglevelsofsustainableyield.Becausethesedynamicsremainconfounded westronglyrecommendeitherextendingthecatchhistoryifareliablecatchtimeseries extendingbacktotheunexploitedstateisavailableorexploringmethodsthatdecouplethe estimationofinitialfishingmortalityandstartingyeardepletionlevel.
Amongallsensitivityanalyses,assumptionsabouthistoricalcatchlevelshadthegreatest influenceonmodeloutcomes.Theseresultshighlighttheimportanceofstructuredsensitivity testingtobetterunderstandhowuncertaintyaffectsmodelresults.Futureresearchshould exploretheuseofmodelgridsorensembleapproachestoformallyincorporateuncertainty andimprovethereliabilityofmanagementadvice.
Growthisakeybiologicalinputthatinfluencesestimatesofstockproductivityand selectivity.Alternativegrowthcurvesshouldbeconsidered,potentiallybyincorporating broaderregionaldatasetsandaccountingforthelengthandagedistributionofsamples. ThevariabilityofsizeatageforYellowtailSnappernotedinShervette,RiveraHernández,& Zajovits(2024)isanimportantconsideration,thusrevisitingthegrowthinputsviaadditional sensitivitiescouldstrengthenthebiologicalrealismandperformanceoffutureassessments.
Recruitmentdeviations,whenestimated,wereparticularlyuncertain,giventhelimitedyears ofavailabledata.However,theavailabilityoffishery-independentlengthdatafromthe NCRMPandDCRMPsurveysprovidesavaluableinformationsource.Theobserved abundanceofsmallfishmayallowbetterinferenceofrecruitmentinfutureassessments. Finerresolutiondata(e.g.,using1cmbinsforspecificyears)couldimprovemodel performanceandreduceuncertainty.
IntegratedmodelssuchasStockSynthesisarepowerfulnotonlyforsynthesizingmultiple datasourcesbutalsoformakingkeyassumptionsexplicitandtestable.Withoutthis
flexibility,assessmentsriskproducingoutputsthatmustbetakenatfacevalue,withlittle opportunitytoevaluatetheeffectsofunderlyingassumptions.
Whilenoteveryspecieswillhavesufficientdataforanintegratedassessment,wherever possible,structuredscenariotestingshouldbepursuedtoexplorealternativehypothesesand betterunderstandthedriversofpopulationdynamics.Sucheffortsstrengthenthescientific foundationformanagementadviceandhelpbalancetheneedforbothrigorousandpractical assessmentframeworks.
Thisassessmentassumesanopenpopulationwithrecruitmentnottightlylinkedtolocal spawningstock.Thisassumptioncouldbenefitfromfutureexplorationofregional connectivity,asithasimplicationsforbothmodelstructureandmanagementscale.If connectivityacrossislandsisstrong,larger-scalestockdefinitionsorspatiallyexplicit metapopulationmodelingapproachesmaybewarranted.
Finally,thestepwisemodelingapproachusedinthisassessmentoffersaframeworkthat couldbeappliedtootherCaribbeanspecies.Expandingtheapproachthroughtargeteddata collectionandmethoddevelopmentcouldimprovethetimelinessandrobustnessofstock assessmentsacrosstheregion.Thiswillrequirecontinuedsupportforlong-termmonitoring programs,higher-resolutiondatacollection,andinvestmentinmodeldevelopmentand bridgingexercisestodeliverscience-based,real-timemanagementadvice.
6AssessmentProcessResearch Recommendations
Tomitigatesomeofthedatauncertaintiesitisrecommendedto:
• Expandfishery-independentsurveytimeseriesandresolution(e.g.,retainanduse1-cm lengthbindatawhereavailable).
• Furtherevaluatenaturalmortalityandgrowthassumptions.Collectandanalyze additionallifehistorydatatoevaluatetheaccuracyaroundgrowthandnatural mortalityrates.
• Conductfocusedresearchonhistoricalcatchesandfishinghistorytoinformand constrainearlymodelconditions.
• Considerusingsimplerproductionmodelsorage-structuredmodelswithfixed selectivitytoisolateandevaluatedifferentdatainputs.
• Developandevaluatemodelensemblesoruncertaintygridstoguidecatchadviceunder differentplausiblescenarios.
• Investigatestockconnectivitytobetterunderstandlocalversusregionalrecruitment dynamicsandtheirimplicationsforinformingsteepness.
• Researchmethods,includingsimulations,to“right-size”modelcomplexitytomatch dataavailability,avoidingoverparameterizationindata-limitedcontexts.
• SupportManagementStrategyEvaluationsthatarerobusttokeyuncertaintiesto guideharvestadvice.
• Ensurethecontinuationoffishery-independentsurveyprograms(e.g.,NationalCoral ReefMonitoringProgram)withconsistentspatialandtemporalcoverage.
• Maintainandexpandcommercialcatchmonitoringprograms.Expandportsampling andotherfishery-dependentdatacollectiontofillgapsinlengthcompositionandeffort data.
• Theuseofinitialcatchinthisassessmentwasintendedtoinformaninitialstarting depletionforthepopulation.However,modelevaluationsshowitalsostronglyinforms maximumsustainableyieldestimates.Thisisanundesirableoutcomeandadditional
researchintohowtodecoupletheseimpactswouldsignificantlyimprovemodelresult reliability.
• Atthedataworkshop,workshopparticipantsemphasizedthatfederalregulationsdo affectretention,howevertherewereinsufficientdataonthelengthsofdiscardedfishto informlength-basedretention.Exploreparameterizingretentiontoimproveselectivity ofthecommercialfleetandinterprettheapparenthighselectivityoflargerindividuals thatarepoorlyestimatedbythecurrentmodels.
7Tables
Table7.1: CommerciallandingsofYellowtailSnapperreportedinSt.ThomasSt.Johnfrom 2012-2022inmetrictonsandpoundsbyyear,alongwiththepercentageofthetotal commerciallandingsthatcamefromeachgeargroup.
Table7.2: Empiricalestimatesofnaturalmortality(M)derivedusinglifehistoryinformation andtheNaturalMortalityTool(Cope&Hamel,2022).Allmodelsincludedinthisreport utilizethenaturalmortalityestimateof0.208correspondingwiththemaximumage observedbyShervette,RiveraHernández,&PeñaAlvarado(2024),excepttwoofthe sensitivityscenarios(s2ands4)whichutilizethe0.193naturalmoralitycorresponding withtheestimatedmaximumagefromSEDAR(2020).
InputSource InputType Input MMethod
SEDAR(2020) Maximumage 28 0.193 Hamel_Amax Shervette,Rivera Hernández,&Peña Alvarado(2024) Maximumage 26 0.208 Hamel_Amax
Meta-analysis Scientificname
Table7.3: Summaryofprocessandnamingconventionsusedacrossdifferentmodel developmentstagesoftheSEDAR84St.ThomasandSt.JohnYellowtailSnapperstock assessment.
Stage CodeSequentialmodelingsteps
Initial ctmodelinitializedwithcontinuumtool(ct)
Initial m1ct+adjustedlengthatagezero
Initial m2m1+continuousrecruitment
Initial m3m2+catchuncertainty
Scenarionullcatchandsuper-yearlengthdata
Scenarioaindex
Scenariov1index+annualfishery-independentlengthdata
Scenariov4index+dome-shapedselectivity
Scenariov8index+annualfishery-independentlengthdata+dome-shaped selectivity
Scenariov19index+annualfishery-independentlengthdata+dome-shaped selectivity+recruitmentdeviations
Sensitivitys1higherCVongrowthyoung
Sensitivitys2higherageandlowerm
Sensitivitys3highercatchuncertainty
Sensitivitys4s2+s3
Table7.4: St.ThomasandSt.JohnYellowtailSnappercorrelationsbetweenestimated parametersacrossthem2andm3modelscenarios.Thetableshowscorrelationsgreater than0.9orlessthan-0.9.Correlationsthataregreaterthan0.95orlessthan-0.95are showninred.
Table7.5: St.ThomasandSt.JohnYellowtailSnapperderivedquantitiesforunfishedand initialspawningstockbiomassinmetrictons(mt)alongwithstandarddeviations(SD) andcoefficientofvariation(CV)bymodelscenario(v4_m3,v8_m3,andv19_m3).CVis calculatedastheSDdividedbytheparameterestimate.
SSBUnfished(mt)
SSBInitial(mt)
Table7.6: St.ThomasandSt.JohnYellowtailSnapperestimatedinitialequilibriumcatchin metrictonsbymodelscenarioincludingacrosssensitivityruns.Theinputvaluewas25 metrictonswithastandarderrorof0.3.
Table7.7: St.ThomasandSt.JohnYellowtailSnapperparameters,standarddeviations (SD),andcoefficientofvariation(CV)bymodelscenario(v4_m3,v8_m3,andv19_m3). CViscalculatedastheSDdividedbytheparameterestimate.
CommercialSelectivityAsend.
CommercialSelectivityPeak
DCRMPSelectivityEnd
DCRMPSelectivityPeak
DCRMPSelectivityTop
NCRMPSelectivityEnd
NCRMPSelectivityPeak
UnfishedRecruitment(R0)
Table7.8: St.ThomasandSt.JohnYellowtailSnapperderivedquantitiesoftheMSYproxy (basedonSPR40%)inmetrictonsbymodelscenario(v4_m3,v8_m3,andv19_m3)and correspondingeachmodelscenario’sfoursensitivityruns.CViscalculatedastheSD dividedbytheparameterestimate.EstimatesoftheMSYproxyarealsopresentedin poundsinTable 7.9.
Table7.9: St.ThomasandSt.JohnYellowtailSnapperderivedquantitiesoftheMSYproxy (basedonSPR40%)inpoundsbymodelscenario(v4_m3,v8_m3,andv19_m3)and correspondingeachmodelscenario’sfoursensitivityruns.
Table7.10: St.ThomasandSt.JohnYellowtailSnapperfishingmortalityrateandspawning stockbiomassratiosrelativetotherateandbiomassofthestockassociatedwiththeMSY proxy(basedonSPR40%).Therelativefishingmortalityratioisexpressedasa three-yeargeometricmeanoftheannualfishingmortalityratesfor2020-2022dividedby thefishingmortalityrateassociatedwithMSYSPR40%.Relativefishingmortalityrates thatareaboveoneareshowninredfont.Therelativestockbiomassratioisexpressedas the2022spawningbiomassdividedbythespawningstockbiomassatMSYSPR40%. Relativefishingmortalityratiosthatarebelow0.75areshowninredfont.
Metric
8Figures
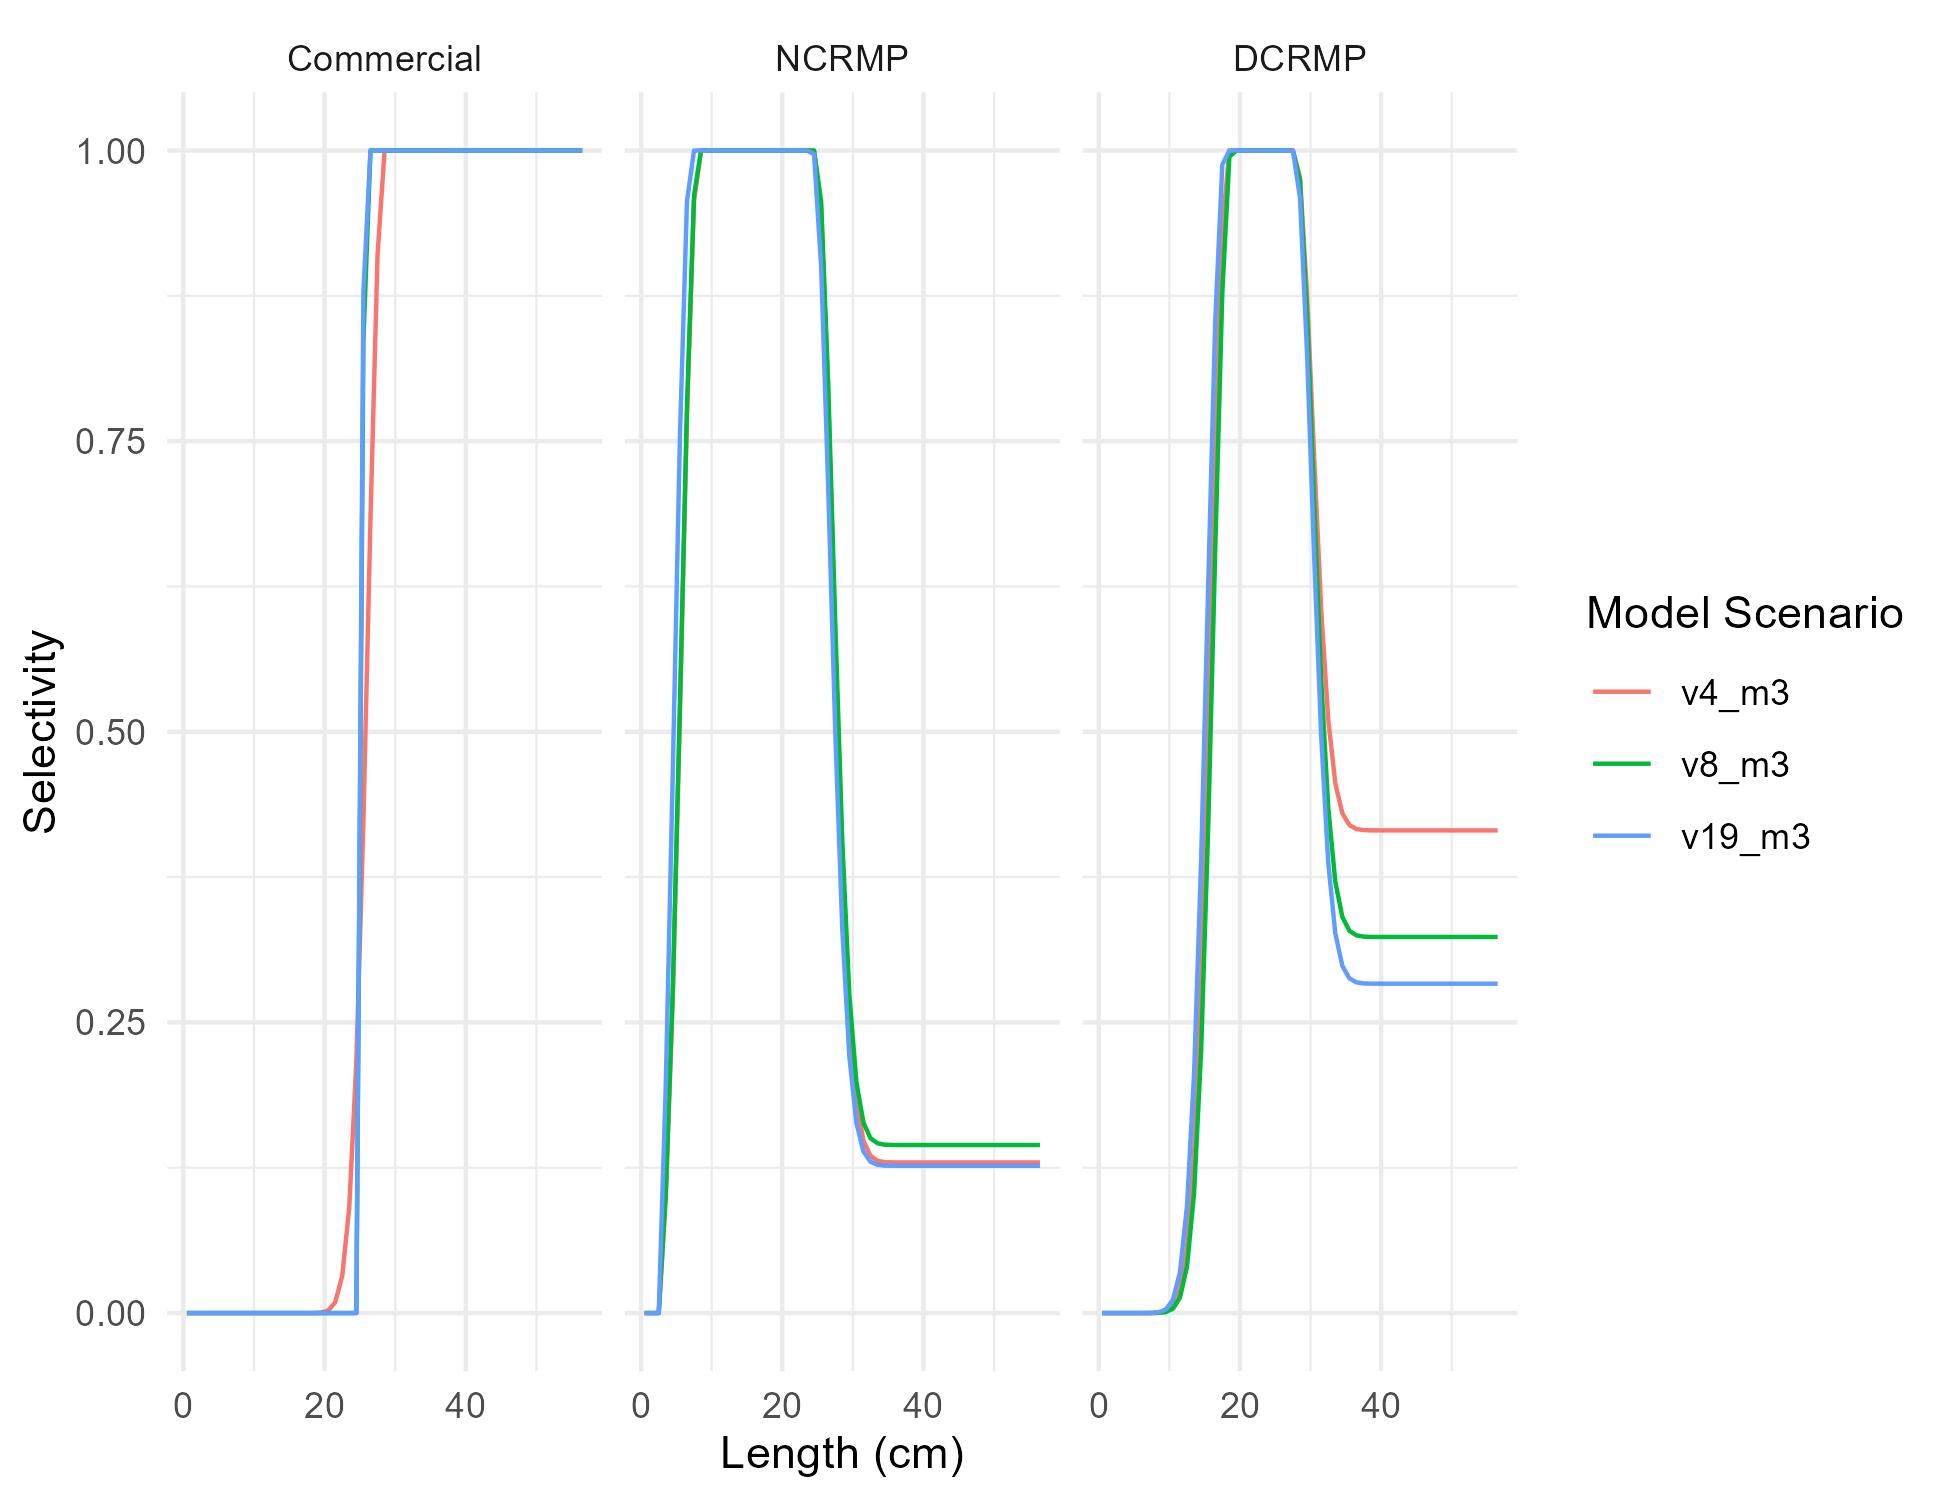
Figure8.1: St.ThomasandSt.JohnYellowtailSnappercommercialfleetlogisticselectivity andNationalCoralReefMonitoringSurvey(NCRMP)andDeepCoralReefMonitoring Survey(DCRMP)domedselectivityacrossmodelscenarios(v4_m3,v8_m3,andv7_m3). Selectivitypatternsreflecttheprobabilitythatafishofagivenlengthwillbecaughtbya particularfishingfleetorobservedinagivensurvey.
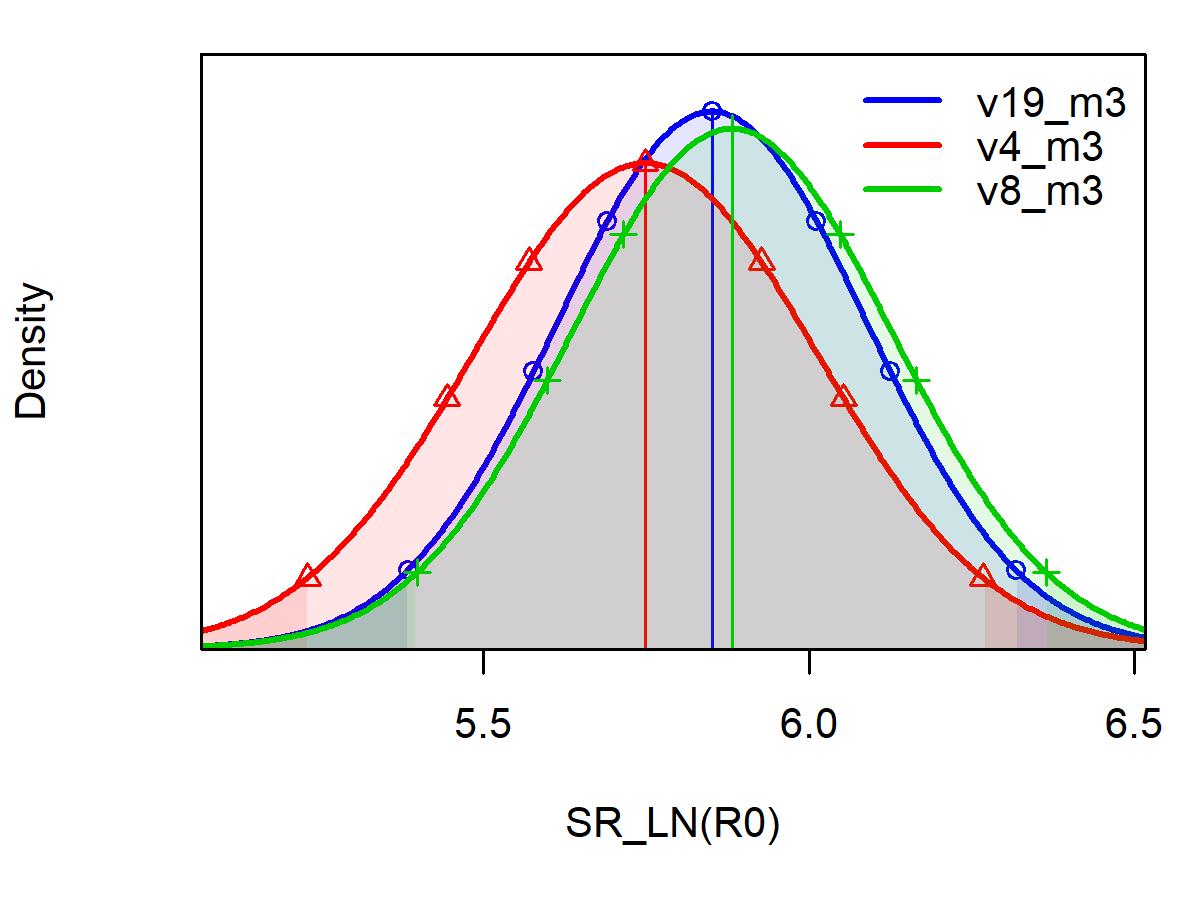
(a) Unfishedrecruitment
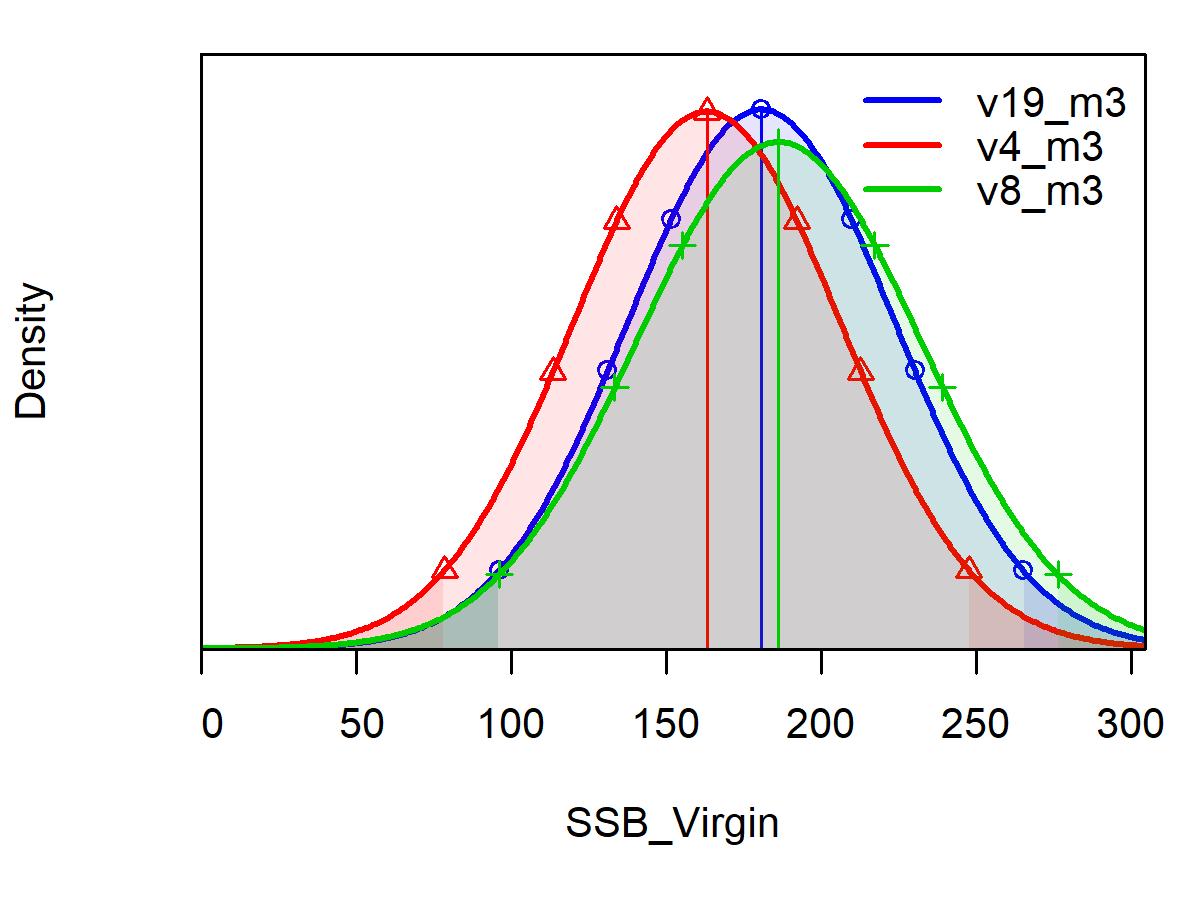
(b) VirginSpawningStockBiomass
Figure8.2: St.ThomasandSt.JohnYellowtailSnapperparameterdistributionfor(a)the naturallogoftheunfishedrecruitmentparameteroftheBeverton–Holtstock-recruit functionand(b)virginspawningstockbiomassinmetrictonsacrossmodelscenarios (v4_m3,v8_m3,andv19_m3).
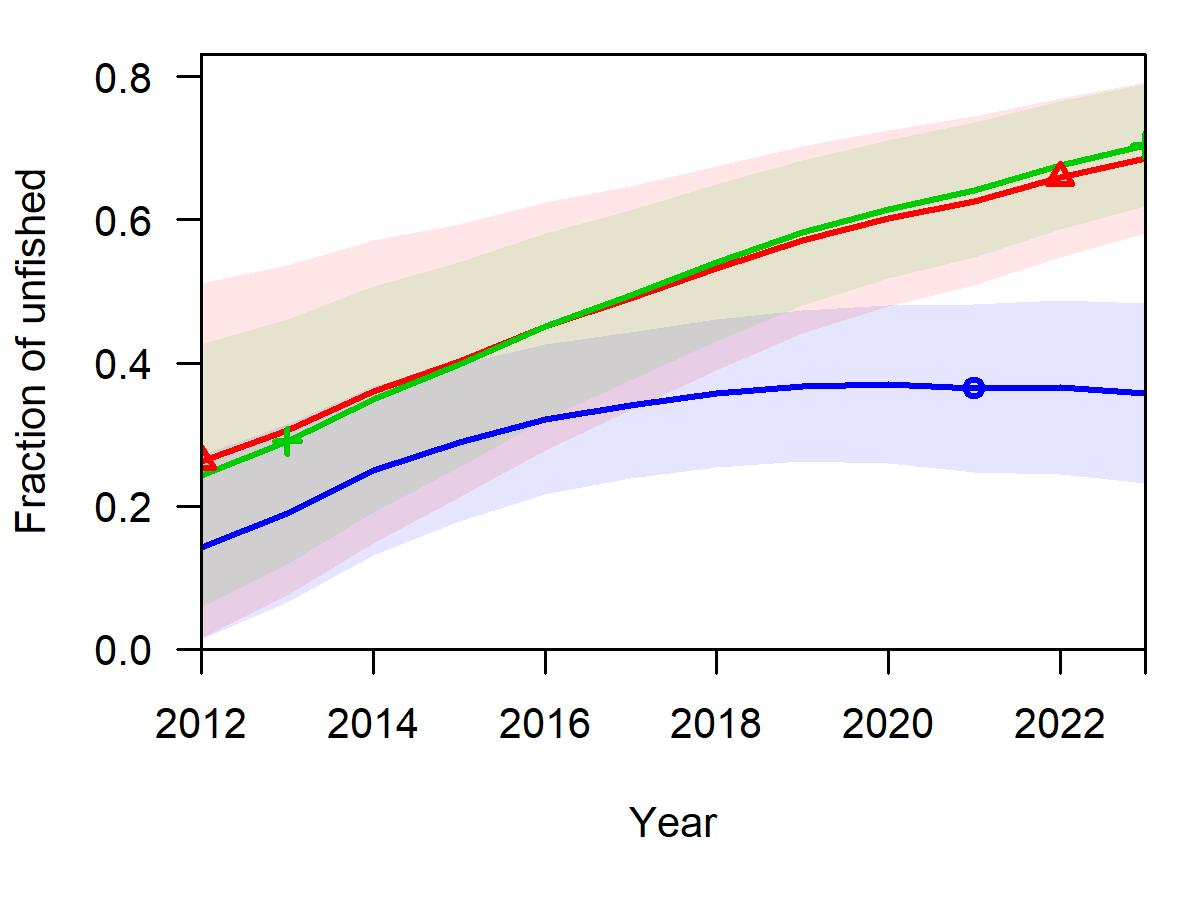
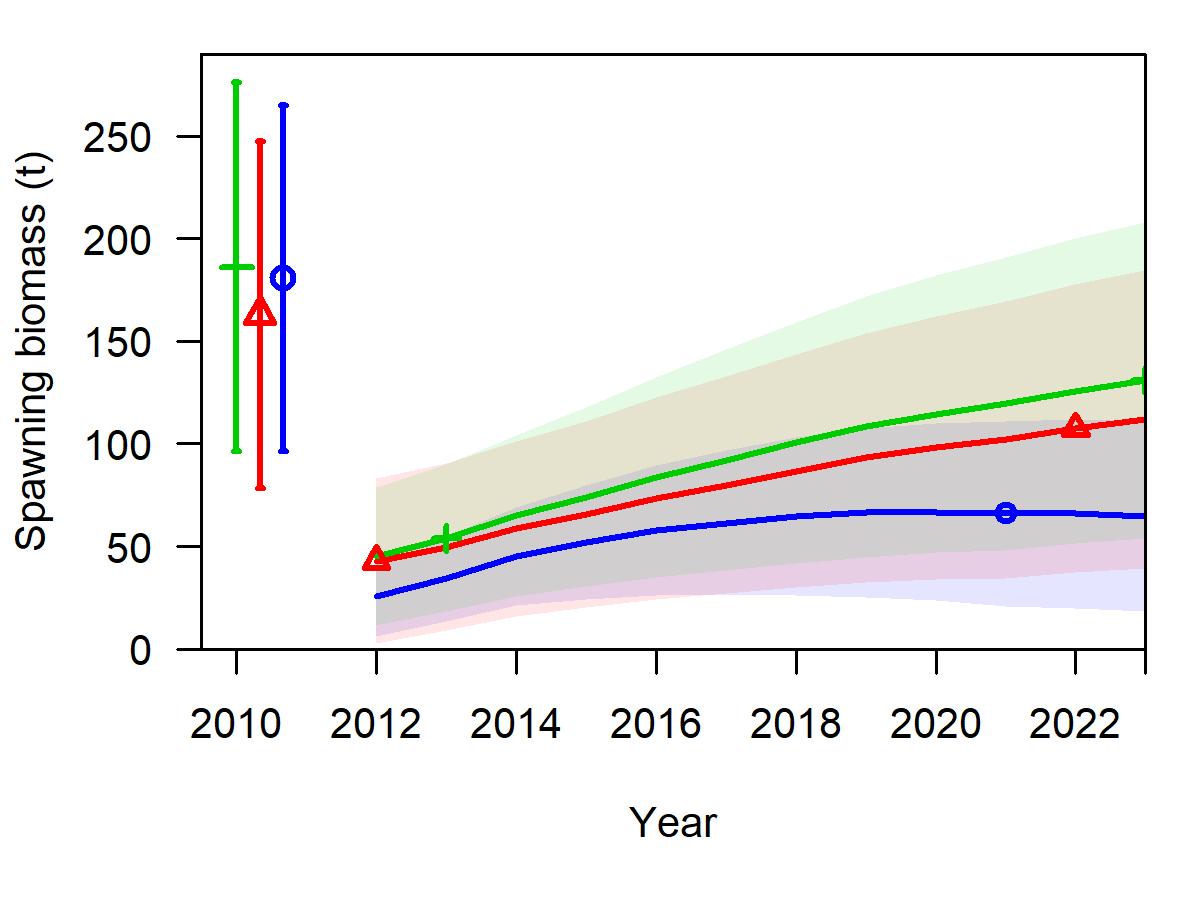
(a) SpawningBiomassRatio (b) SpawningBiomass
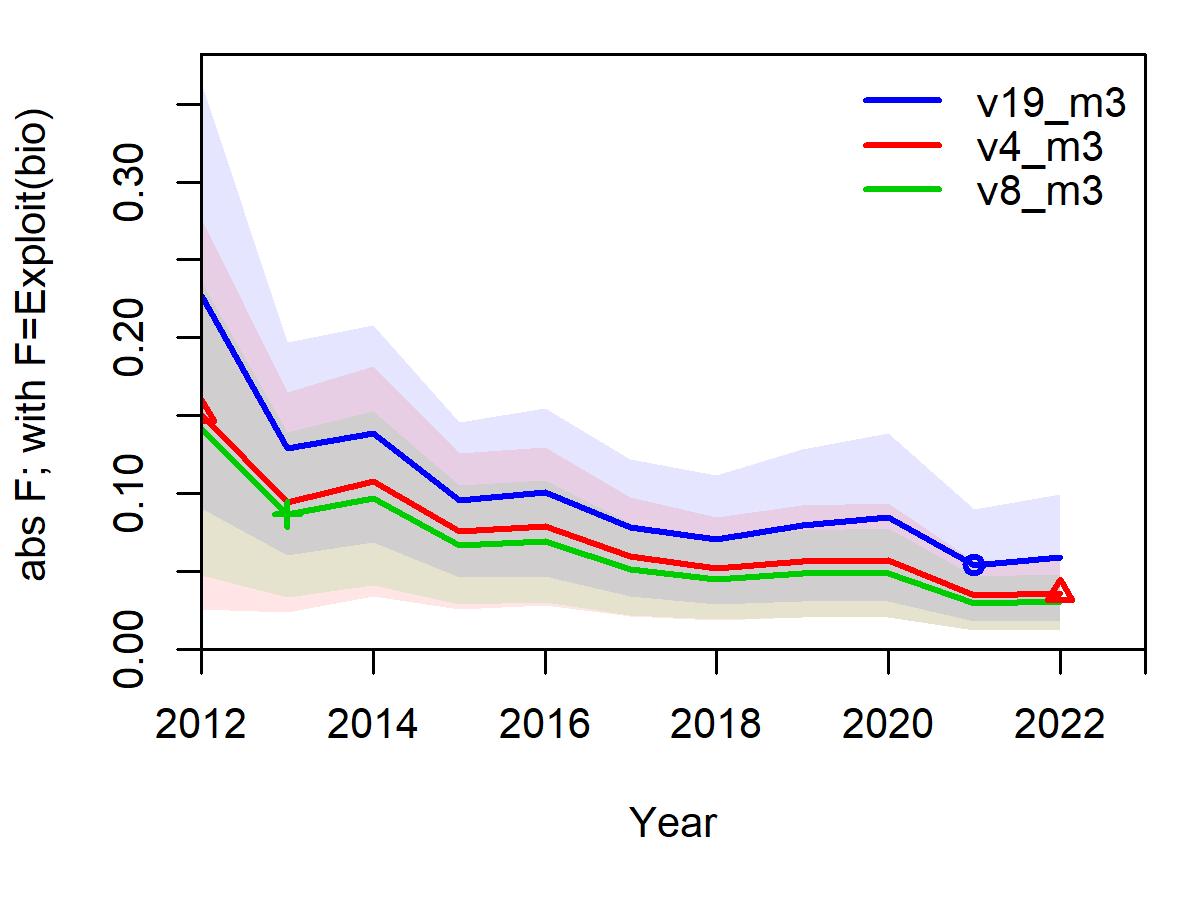
(c) FishingMortality
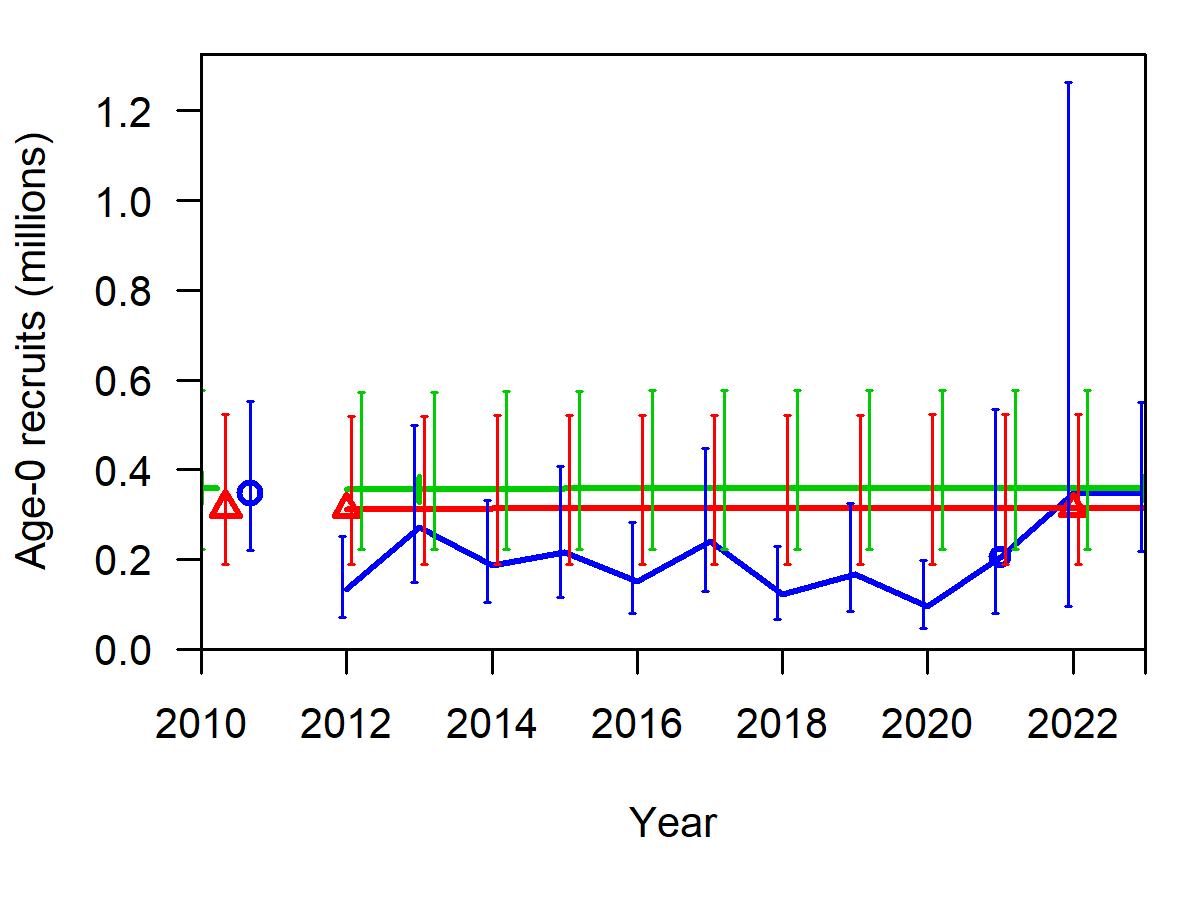
(d) Recruitment
Figure8.3: St.ThomasandSt.JohnYellowtailSnapperderivedquantitytimeseriesacross modelscenarios(v4_m3,v8_m3,andv19_m3).Derivedquantitiesplottedovertimefor (a)therelativespawningstockbiomass(totalbiomass/virginspawningstockbiomass), (b)spawningstockbiomassinmetrictons,(c)fishingmortality(totalbiomasskilled/ totalbiomass),(d)andrecruitmentinmillionsoffish.Theshadedareasandverticalbars inthederivedquantitiestimeseriesrepresent95%confidenceintervals.Thevaluesplotted priortothemodelstartyearof2012reflecttheunfishedconditionsandassociated95% confidenceintervals.
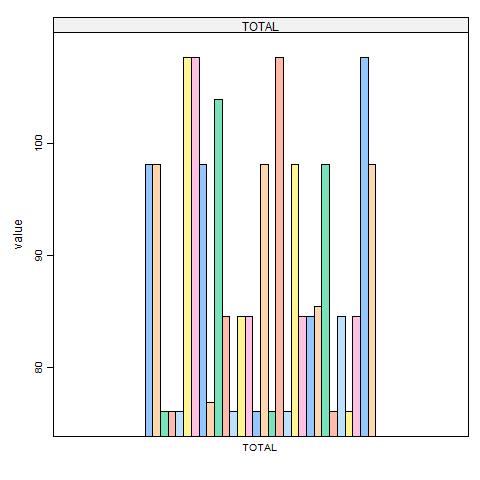
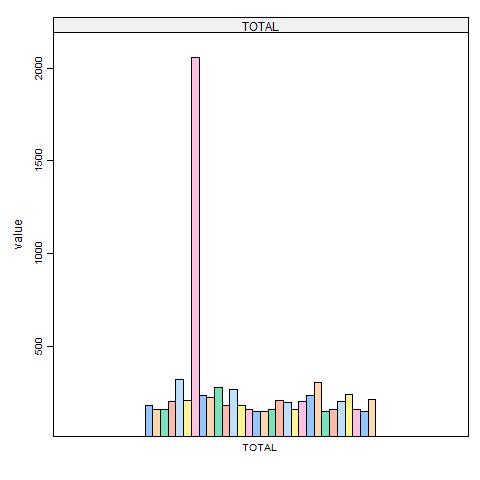
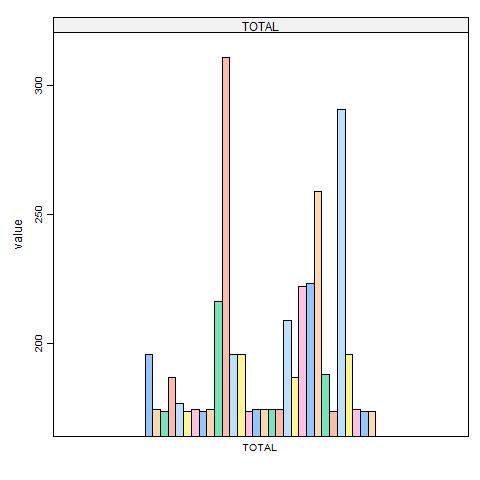
Figure8.4: St.ThomasandSt.JohnYellowtailSnapperjitteranalysistotallikelihoodacross modelscenarios(v4_m3,v8_m3,andv19_m3).Eachpanelgivestheresultsof30runsof thecorrespondingmodelscenariowherethestartingparametervaluesforeachrunwere randomlychangedby20%fromeachmodel’spredictedvaluesusingauniformdistribution incumulativenormalspace.
(a) Modelv4_m3
(b) Modelv8_m3
(c) Modelv19_m3
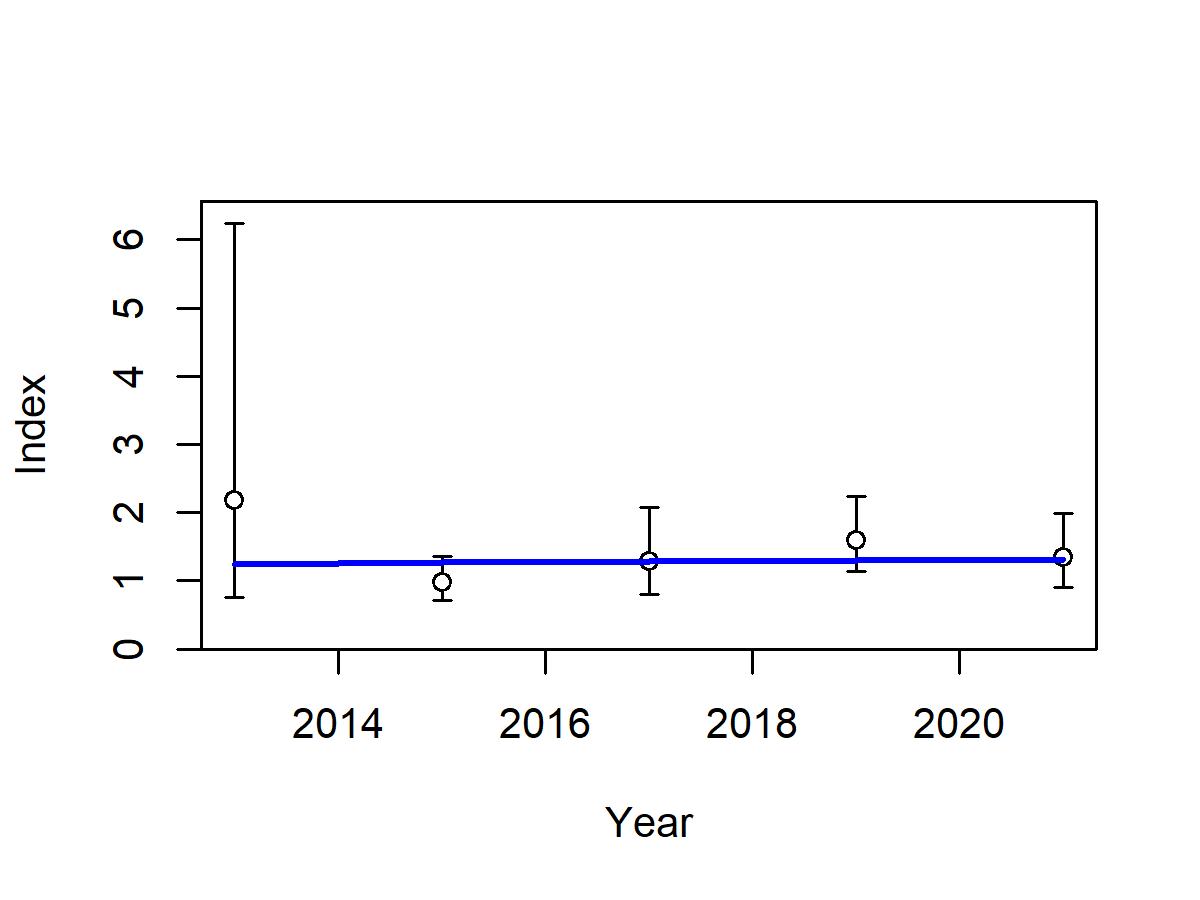
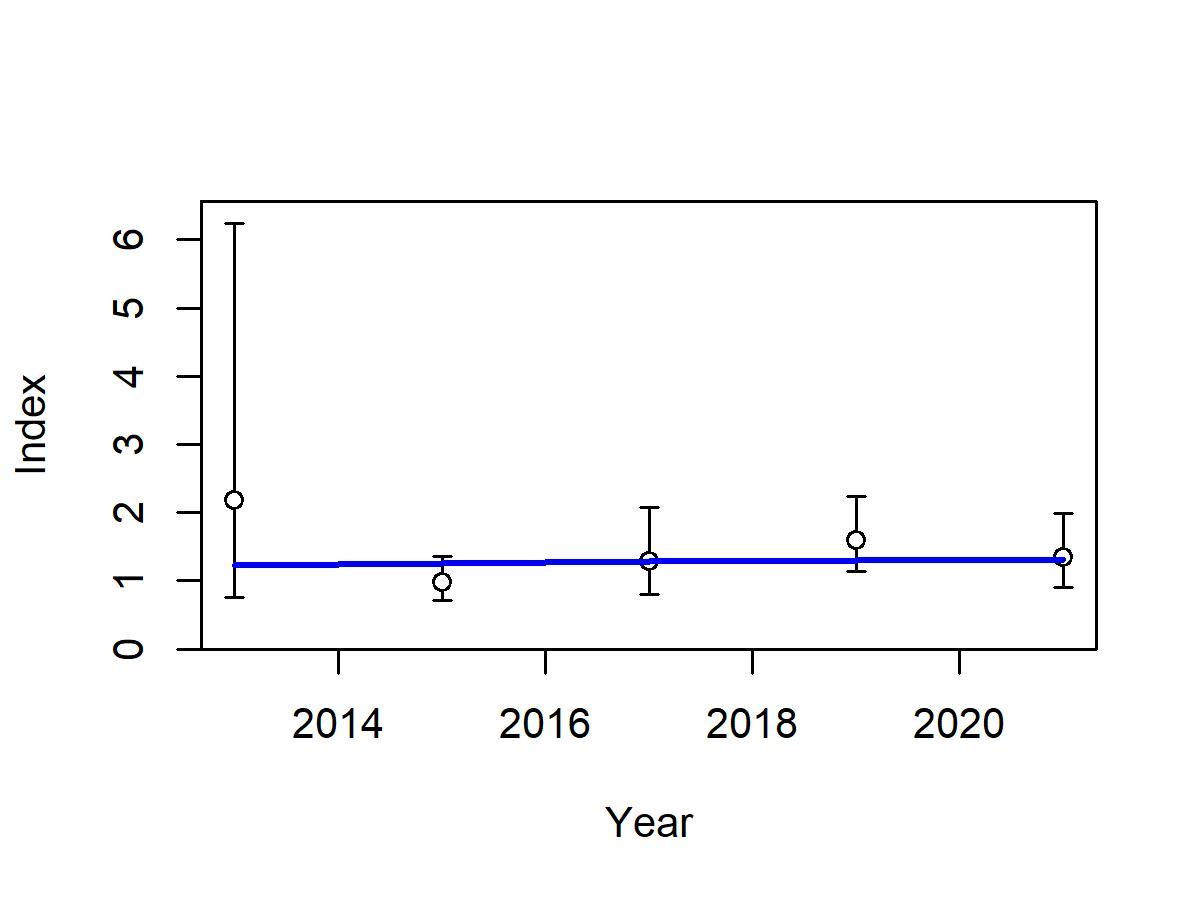
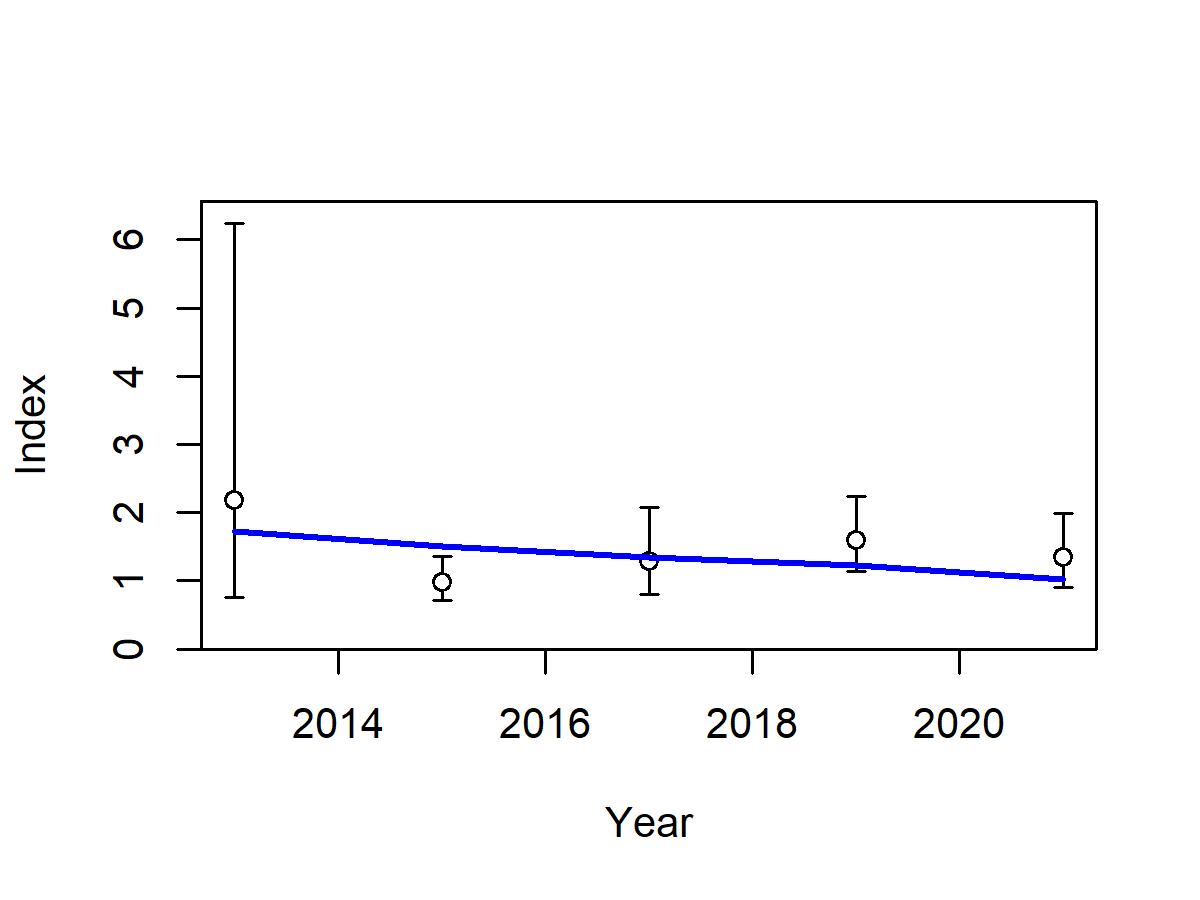
(c) v19_m3
Figure8.5: St.ThomasandSt.JohnYellowtailSnapperNationalCoralReefMonitoring Program(NCRMP)observed(opencircles)andpredicted(blueline)indicesofrelative abundanceandassociatedstandarderrorsacrossmodelscenarios(v4_m3,v8_m3,and v19_m3).Errorbarsindicatea95%uncertaintyintervalaroundobservedindexvalues basedonthemodelassumptionoflognormalerror.Modelscenariosv4_m3andv8_m3do notestimaterecruitmentdeviations,whilemodelscenariosv19_m3does.
(a) v4_m3
(b) v8_m3
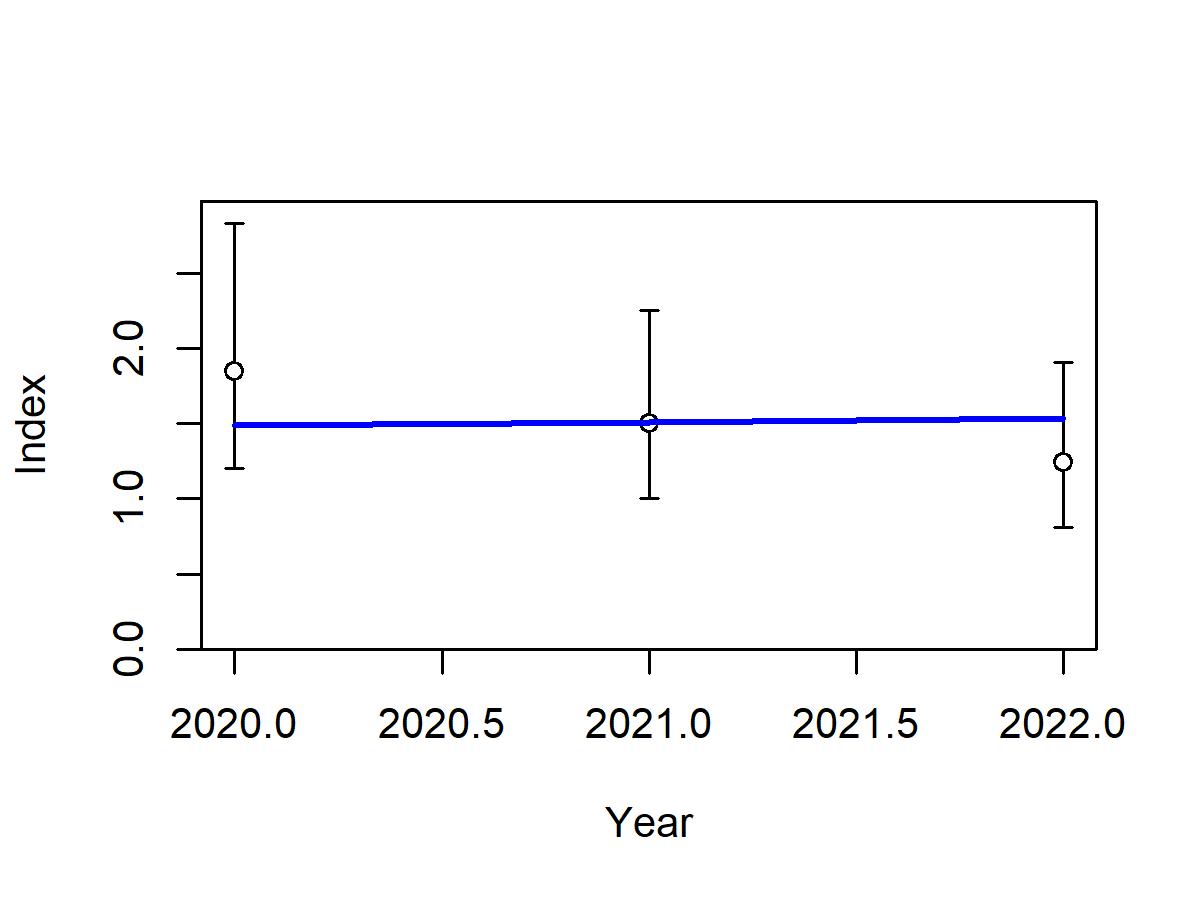
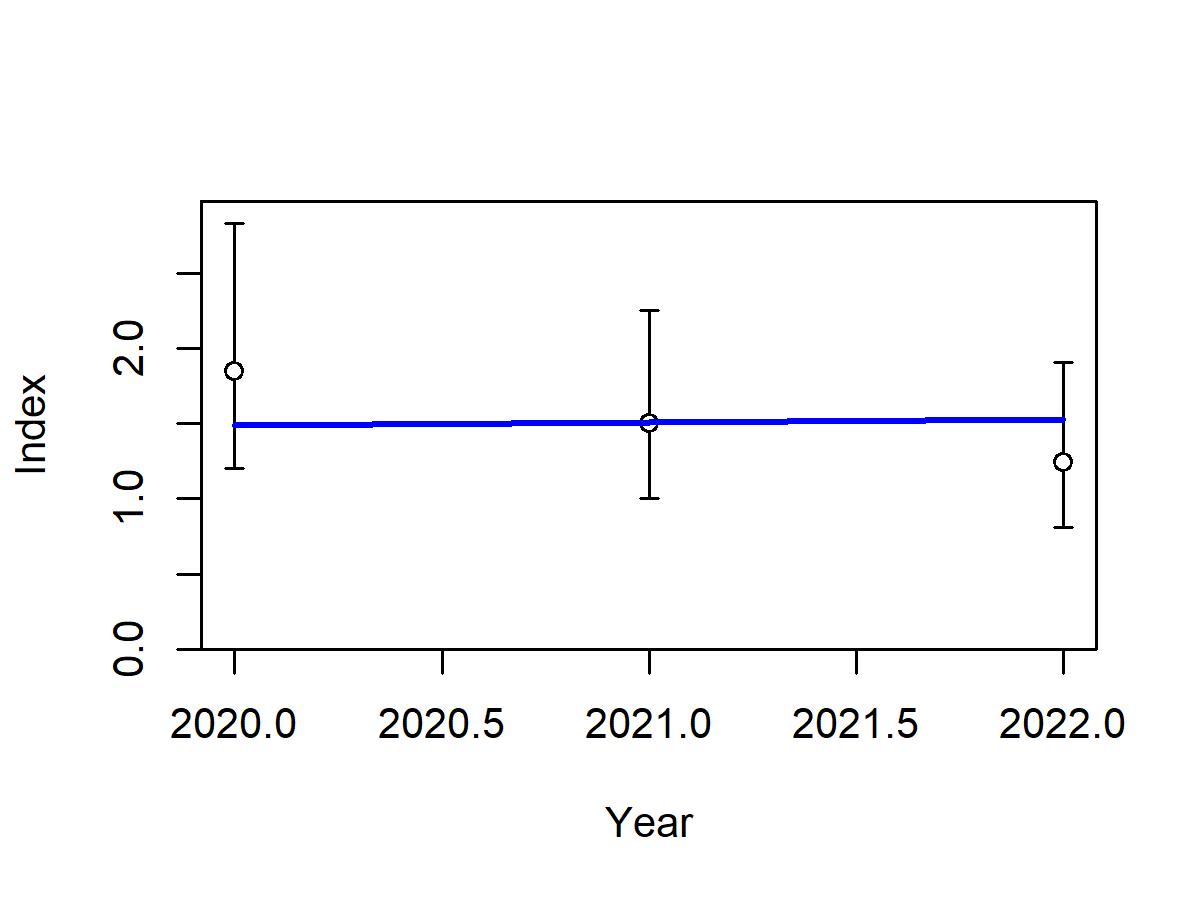
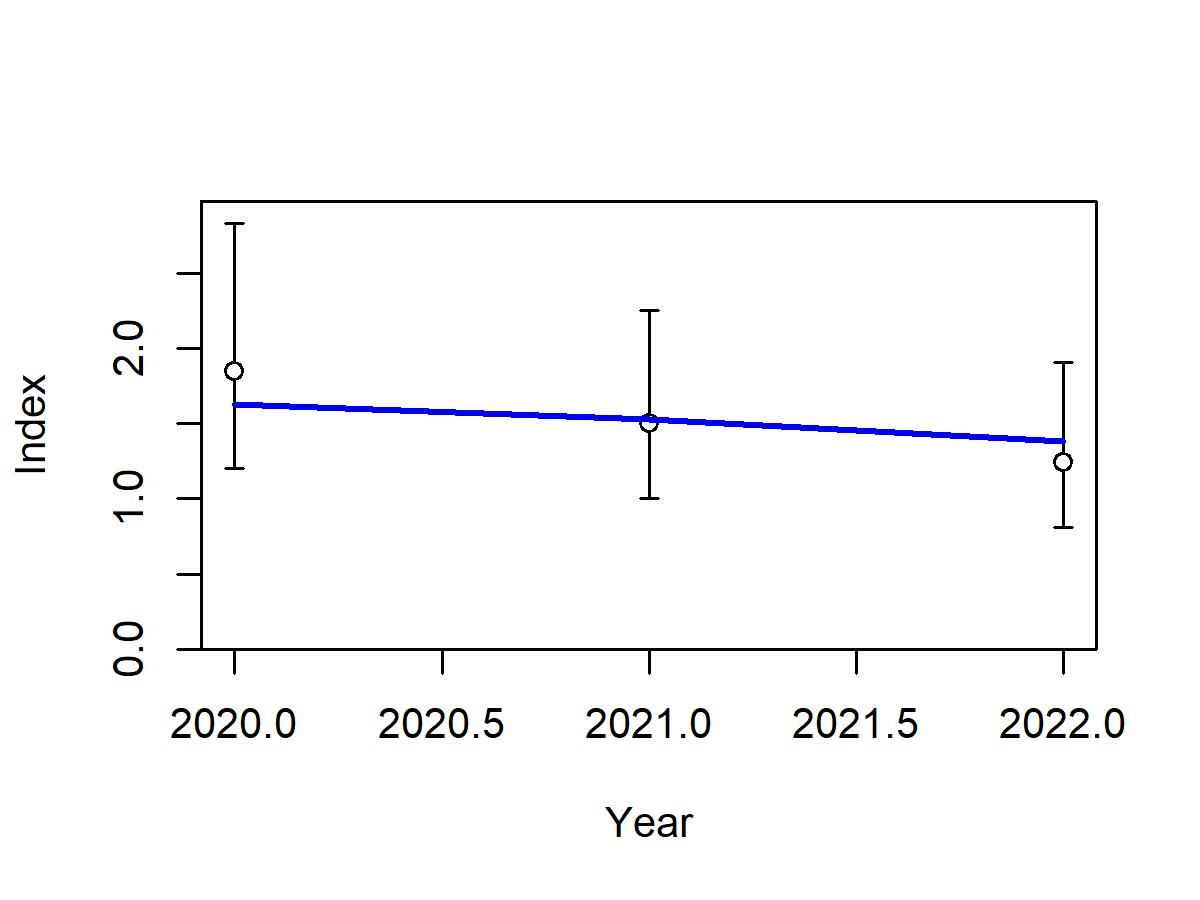
(c) v19_m3
Figure8.6: St.ThomasandSt.JohnYellowtailSnapperDeepNationalCoralReef MonitoringProgram(DCRMP)observed(opencircles)andpredicted(blueline)indicesof relativeabundanceandassociatedstandarderrorsacrossmodelscenarios(v4_m3,v8_m3, andv19_m3).Errorbarsindicatea95%uncertaintyintervalaroundobservedindex valuesbasedonthemodelassumptionoflognormalerror.Modelscenariosv4_m3and v8_m3donotestimaterecruitmentdeviations,whilemodelscenariosv19_m3does.
(a) v4_m3
(b) v8_m3
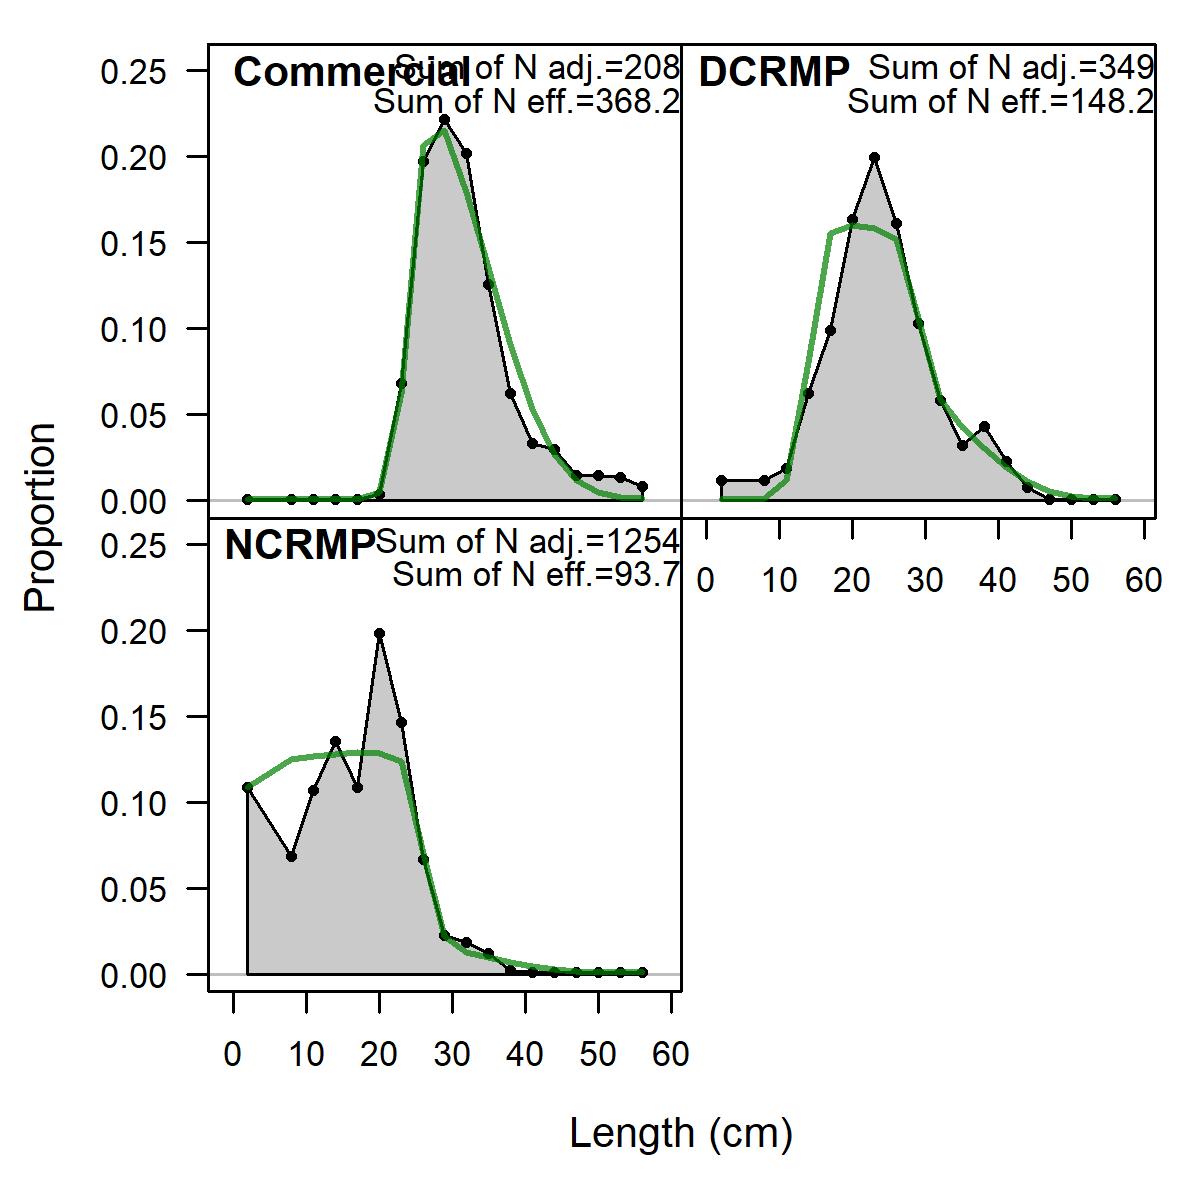
(a) v4_m3acrossallyears
Figure8.7: St.ThomasandSt.JohnYellowtailSnapperobservedandpredictedlength distributionsincentimetersaggregatedacrossyearsfortheCommercial(TIP),National CoralReefMonitoringSurvey(NCRMP)andDeepCoralReefMonitoringSurvey (DCRMP)lengthcompositionsforthe(a)v4_m3modelscenario.Greenlinesrepresent predictedlengthcompositions,whilegrayregionsrepresentobservedlengthcompositions. TheeffectivesamplesizesusedtoweightthelengthcompositiondataareprovidedbyN adj(theinputsamplesize)andNeff(thecalculatedeffectivesamplesize)andareshown intheupperrightcorners.Sincesuperyearsareutilizedforthecommercialfleet,NCRMP, andDCRMPsurveyinthesemodelscenarios,thefitstoannualdataarenotshown.
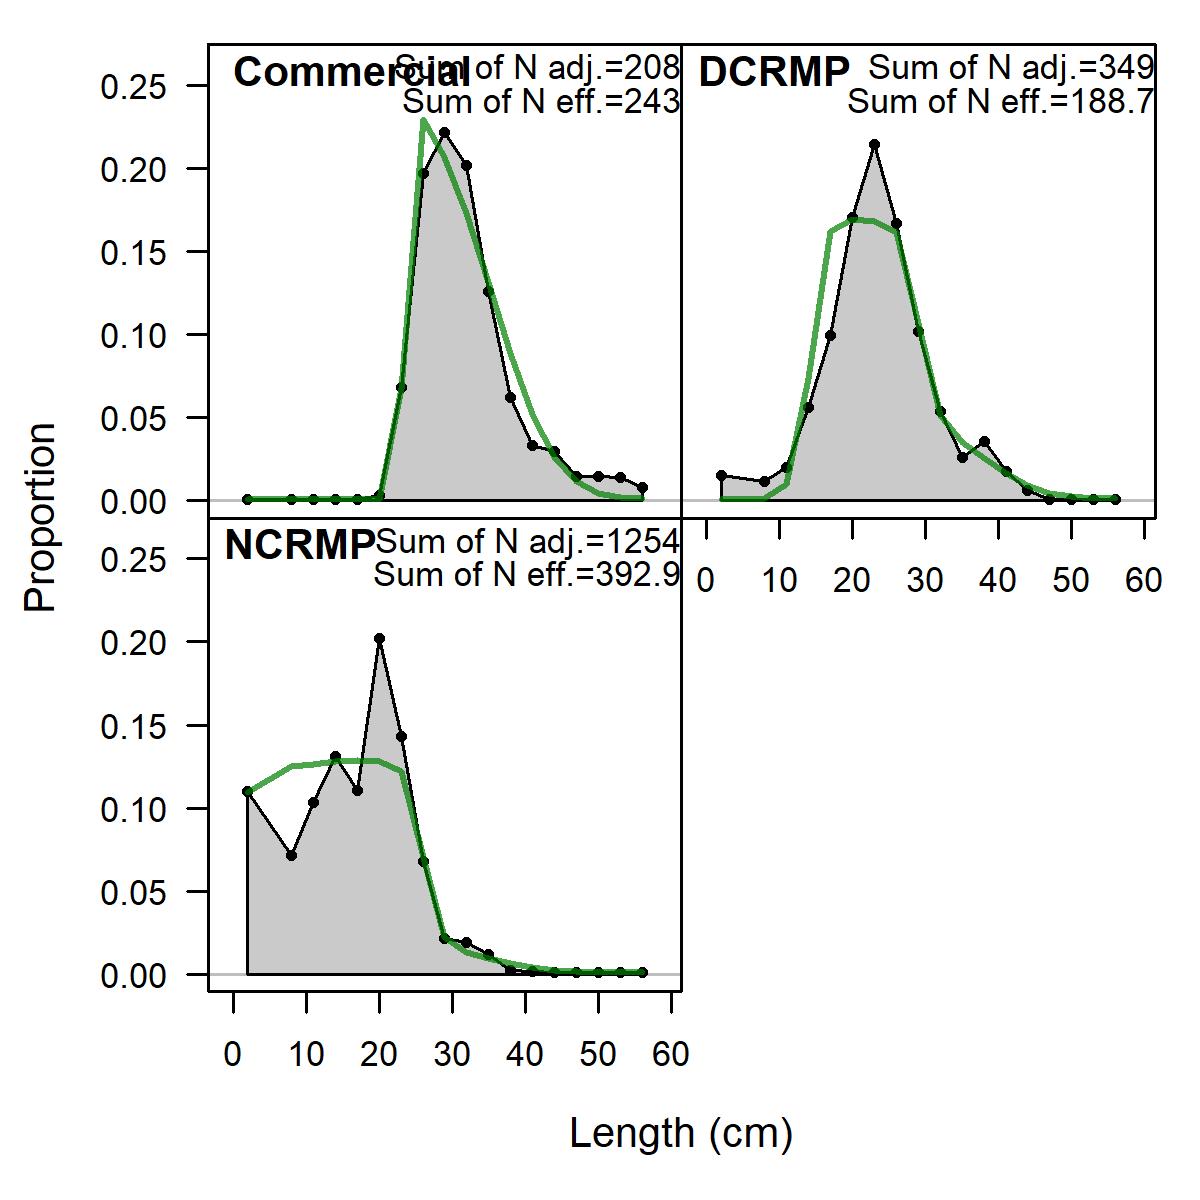
(a) v8_m3acrossallyears
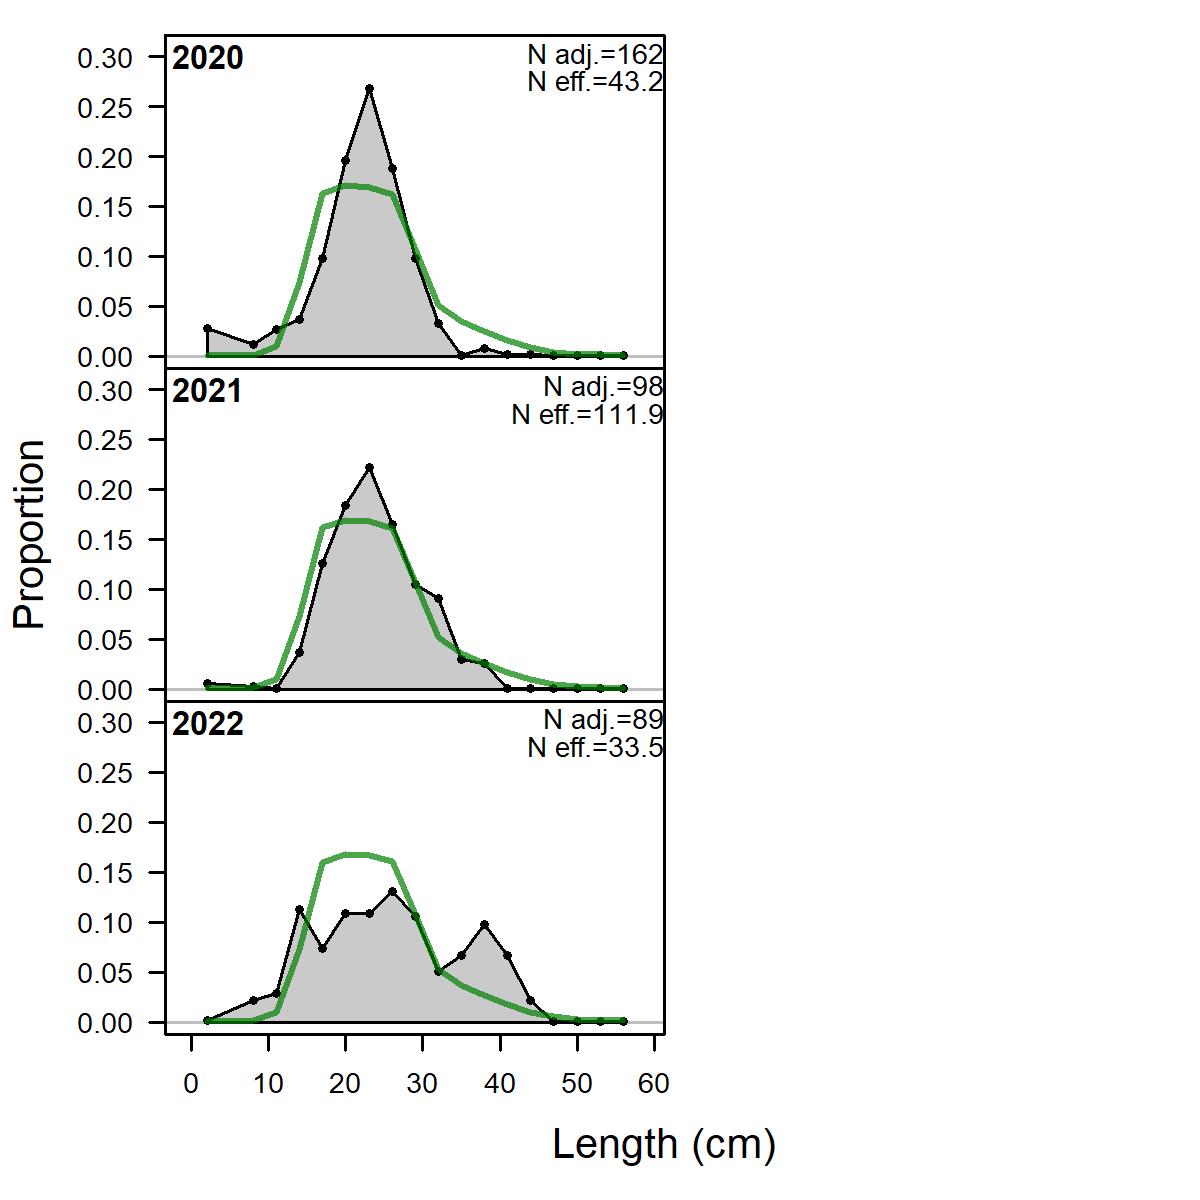
(c) v8_m3DCRMPbyyear
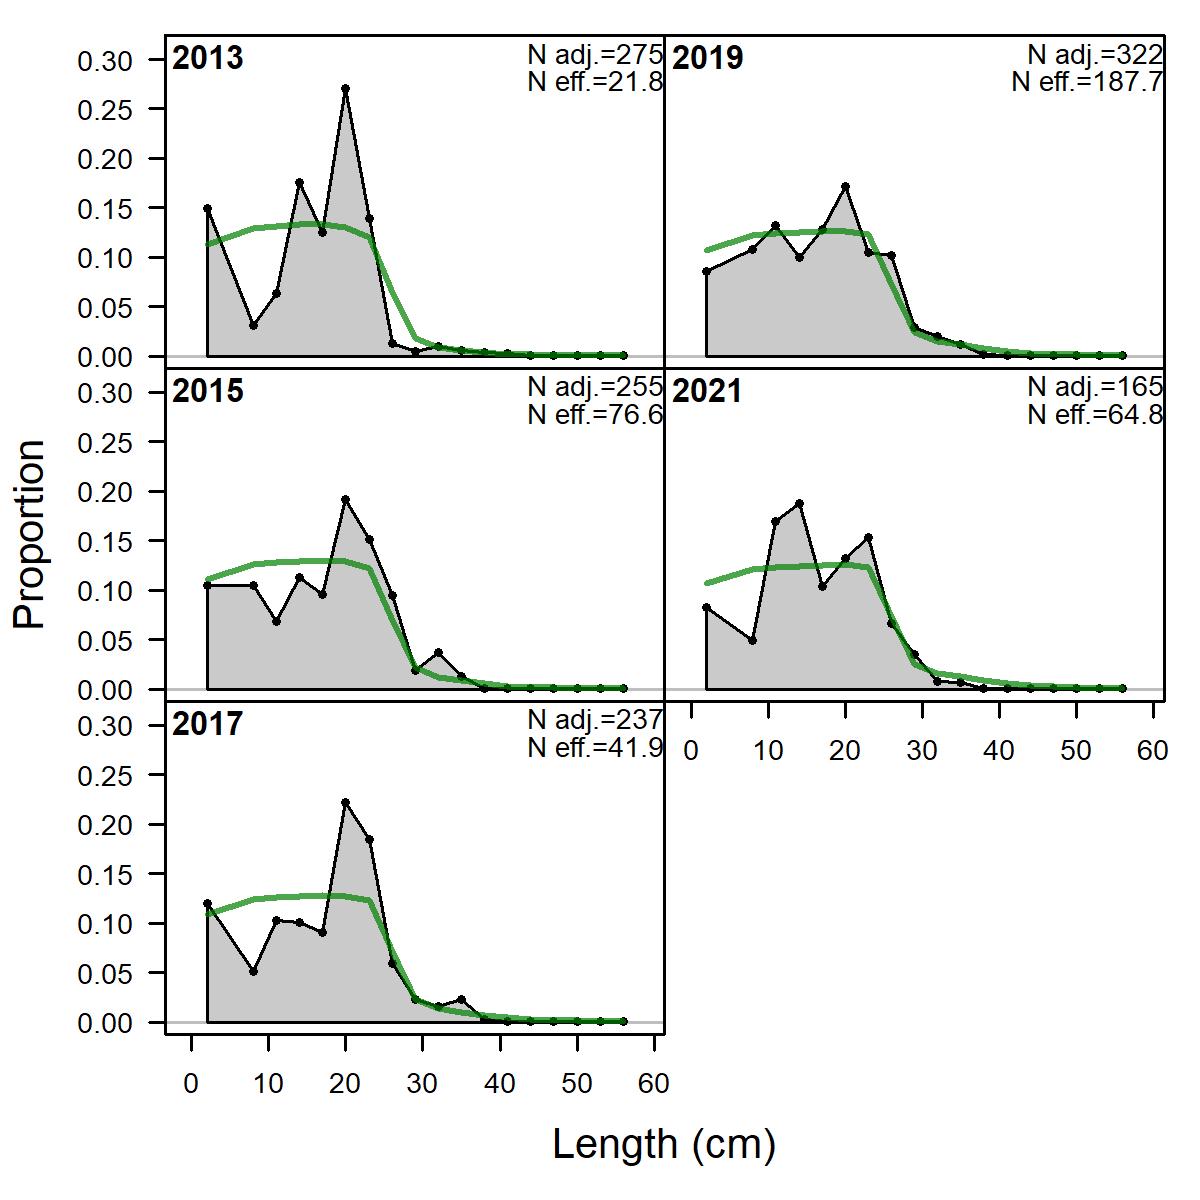
(b) v8_m3NCRMPbyyear
Figure8.8: St.ThomasandSt.JohnYellowtailSnapperobservedandpredictedlength distributionsincentimeters(a)aggregatedacrossyears,(b)byyearfortheNationalCoral ReefMonitoringSurvey(NCRMP),and(c)byyearfortheDeepCoralReefMonitoring Survey(DCRMP)lengthcompositionsforthev8_m3modelscenarios.Greenlines representpredictedlengthcompositions,whilegrayregionsrepresentobservedlength compositions.Theeffectivesamplesizesusedtoweightthelengthcompositiondataare providedbyNadj(theinputsamplesize)andNeff(thecalculatedeffectivesamplesize) andareshownintheupperrightcorners.
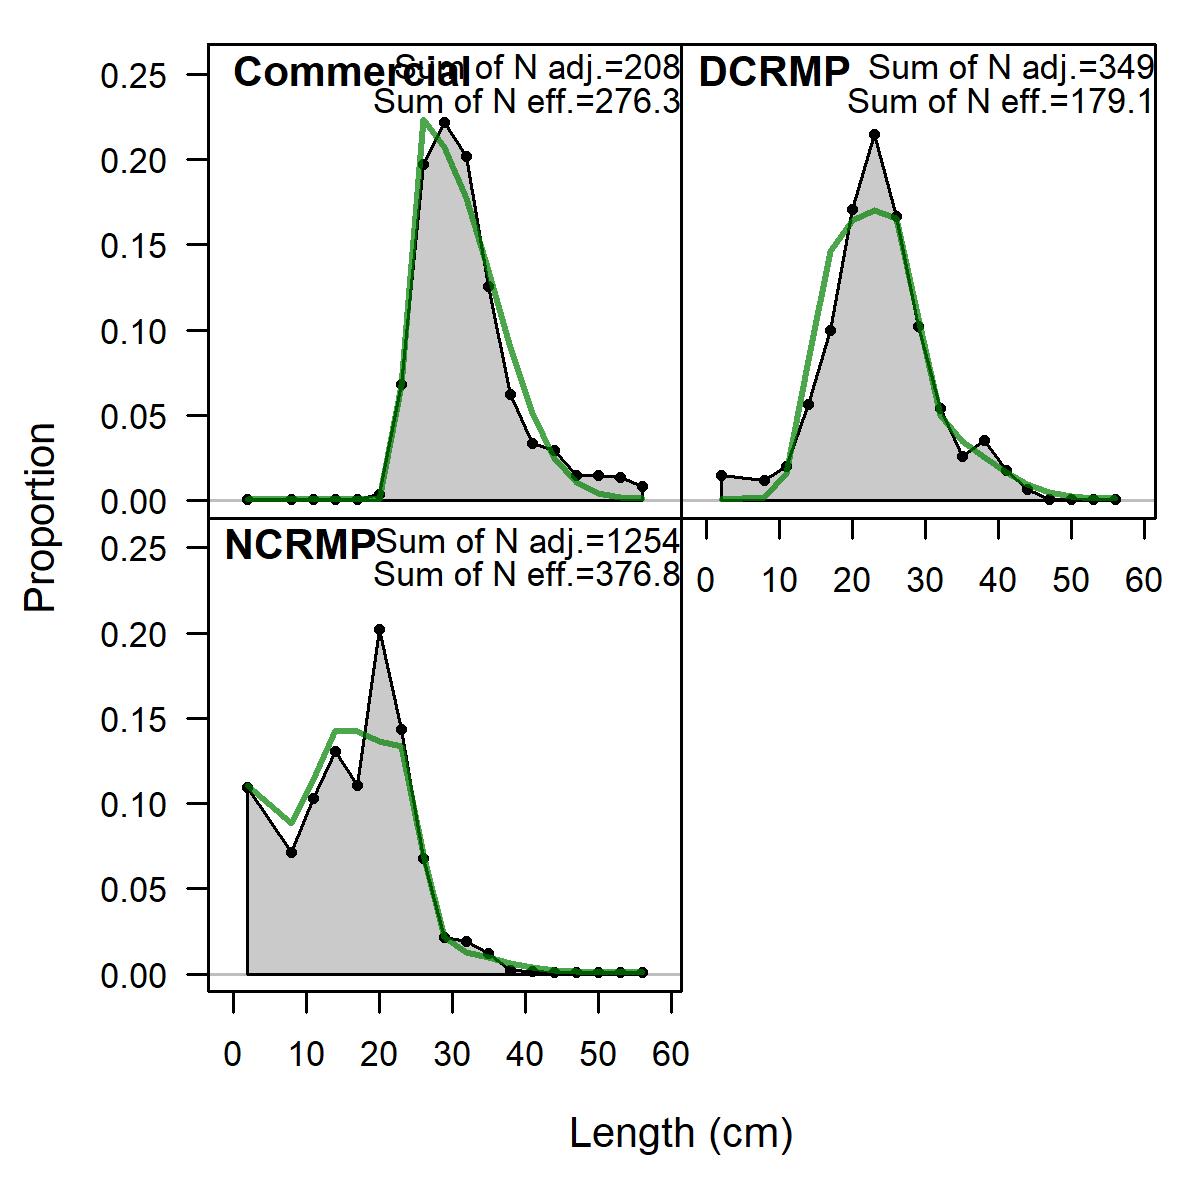
(a) v19_m3acrossallyears
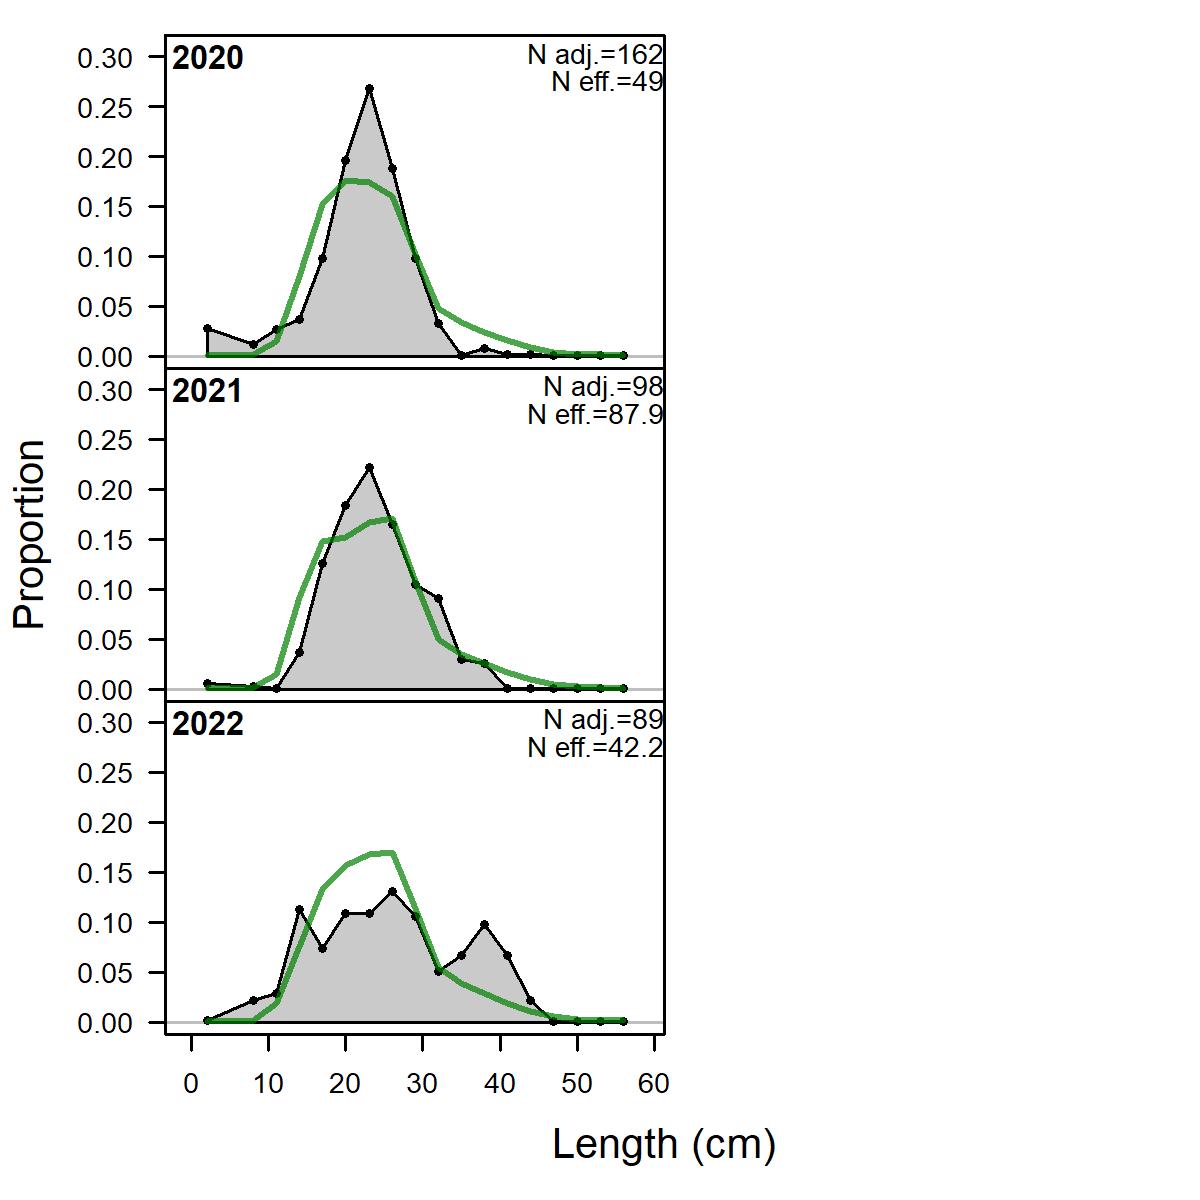
(c) v19_m3DCRMPbyyear
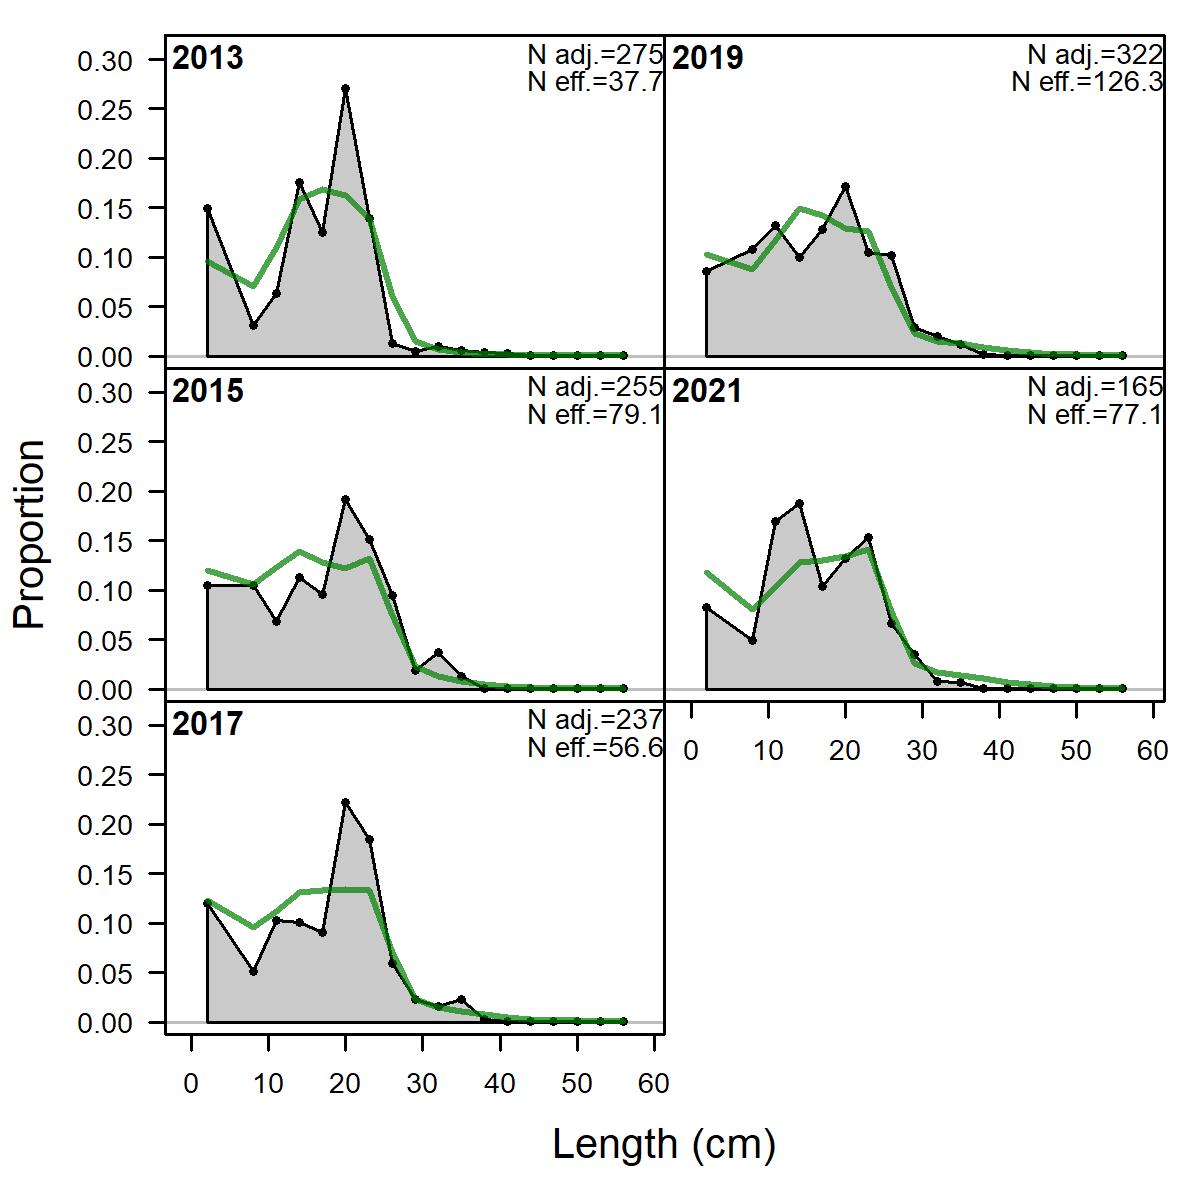
(b) v19_m3NCRMPbyyear
Figure8.9: St.ThomasandSt.JohnYellowtailSnapperobservedandpredictedlength distributionsincentimeters(a)aggregatedacrossyears,(b)byyearfortheNationalCoral ReefMonitoringSurvey(NCRMP),and(c)byyearfortheDeepCoralReefMonitoring Survey(DCRMP)lengthcompositionsforthev19_m3modelscenarios.Greenlines representpredictedlengthcompositions,whilegrayregionsrepresentobservedlength compositions.Theeffectivesamplesizesusedtoweightthelengthcompositiondataare providedbyNadj(theinputsamplesize)andNeff(thecalculatedeffectivesamplesize) andareshownintheupperrightcorners.
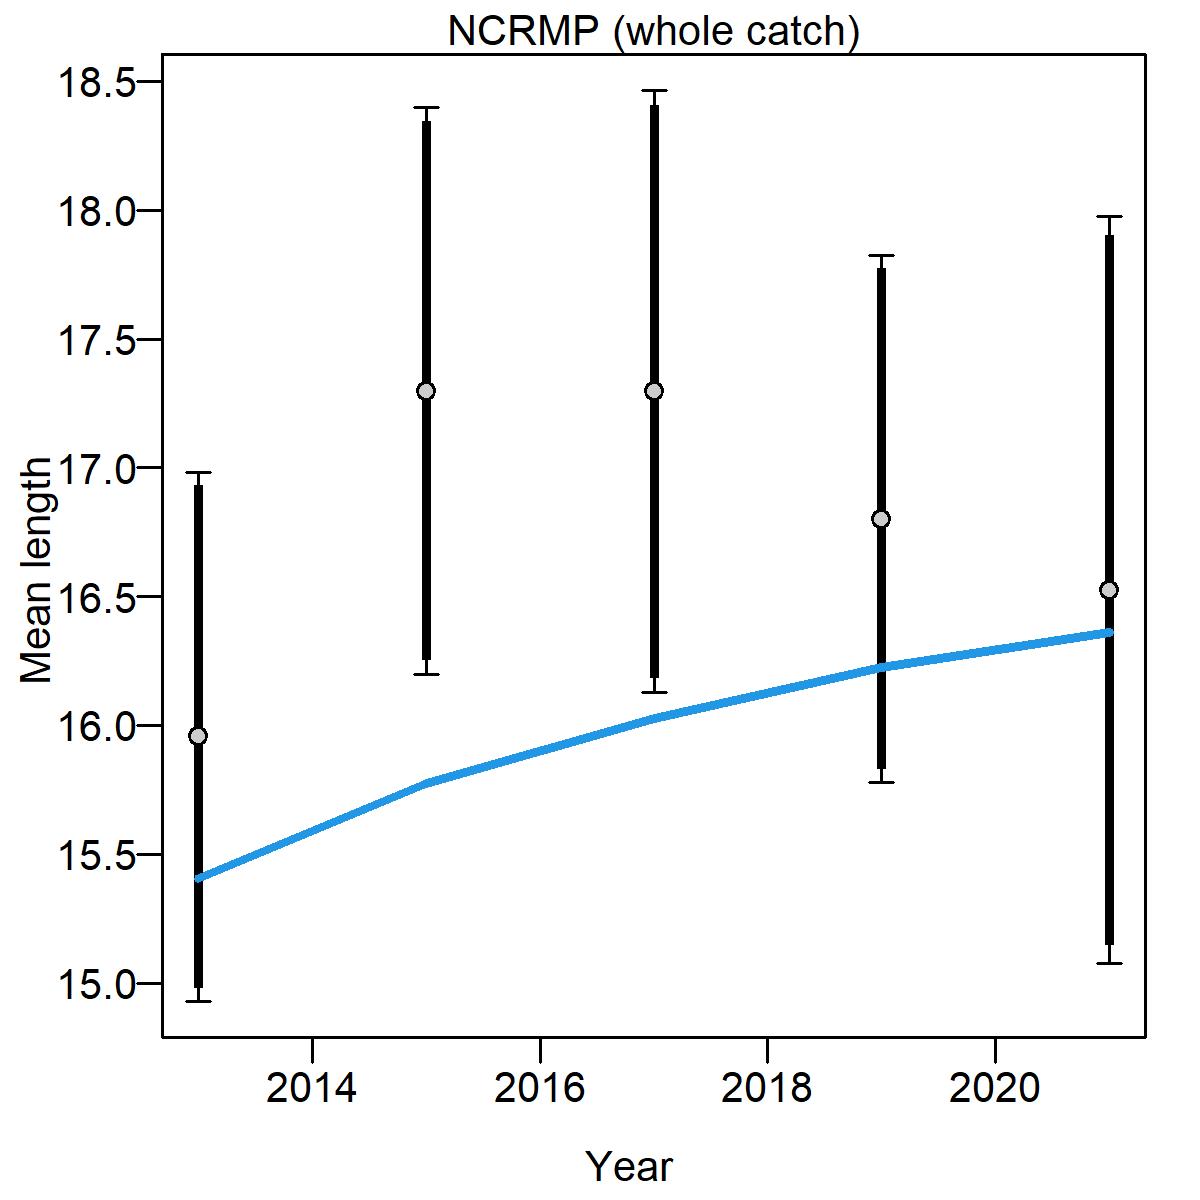
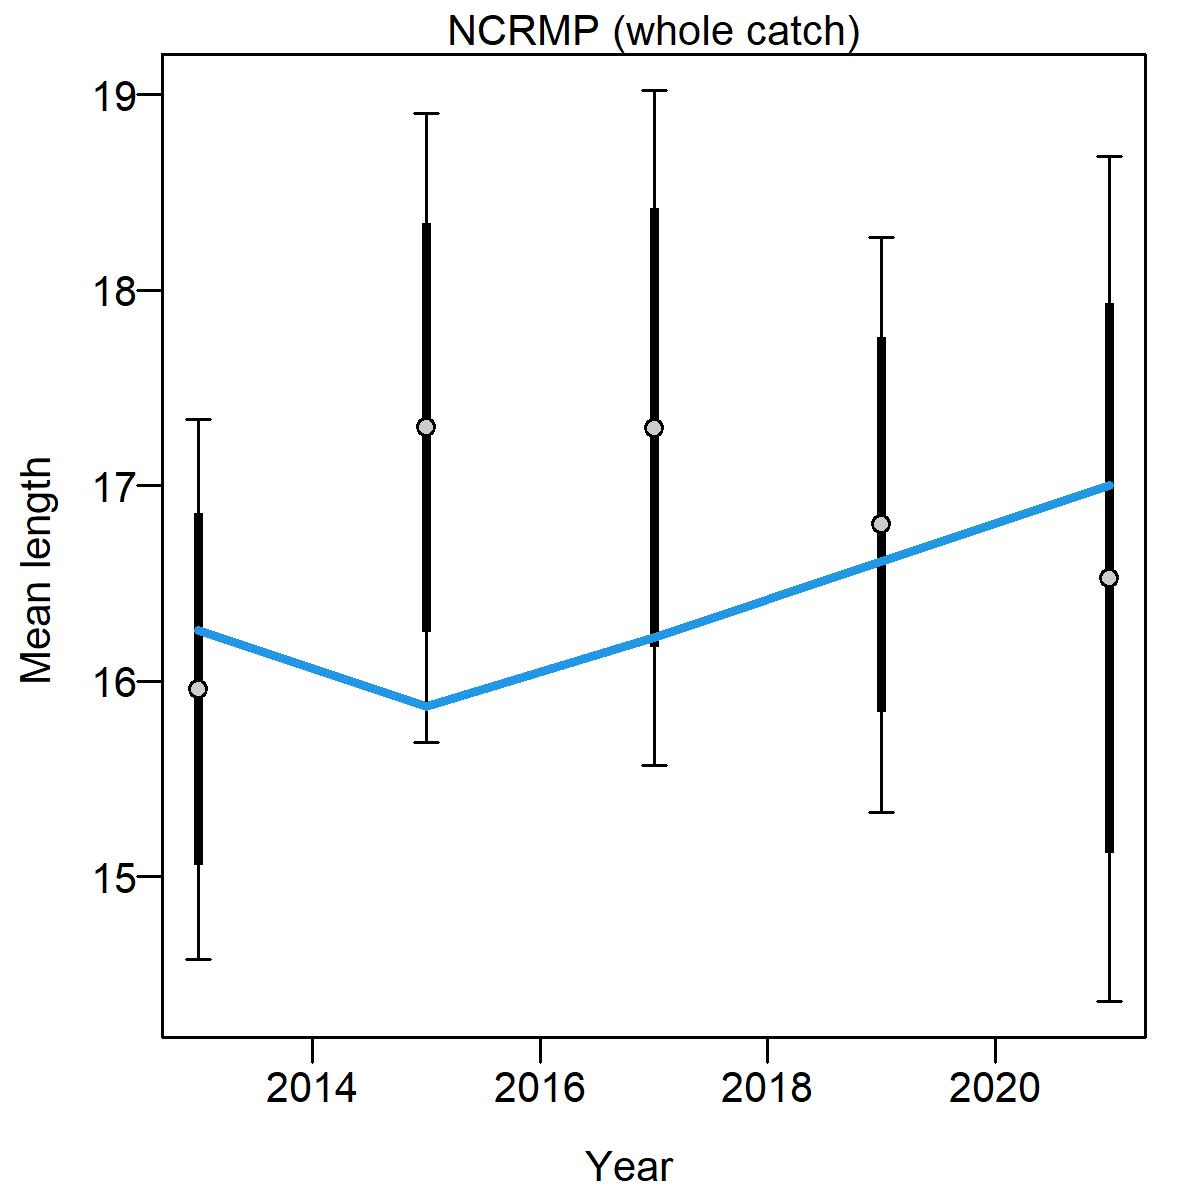
Figure8.10: St.ThomasandSt.JohnYellowtailSnapperobserved(opencircles)and predicted(blueline)meanlengthincentimetersbyyearacrossmodelscenariosthat includeannualfishery-independentNationalCoralReefMonitoringSurvey(NCRMP) datawithoutrecruitmentdeviations(v8_m3)andwithrecruitmentdeviations(v19_m3).
(a) v8_m3
(b) v19_m3
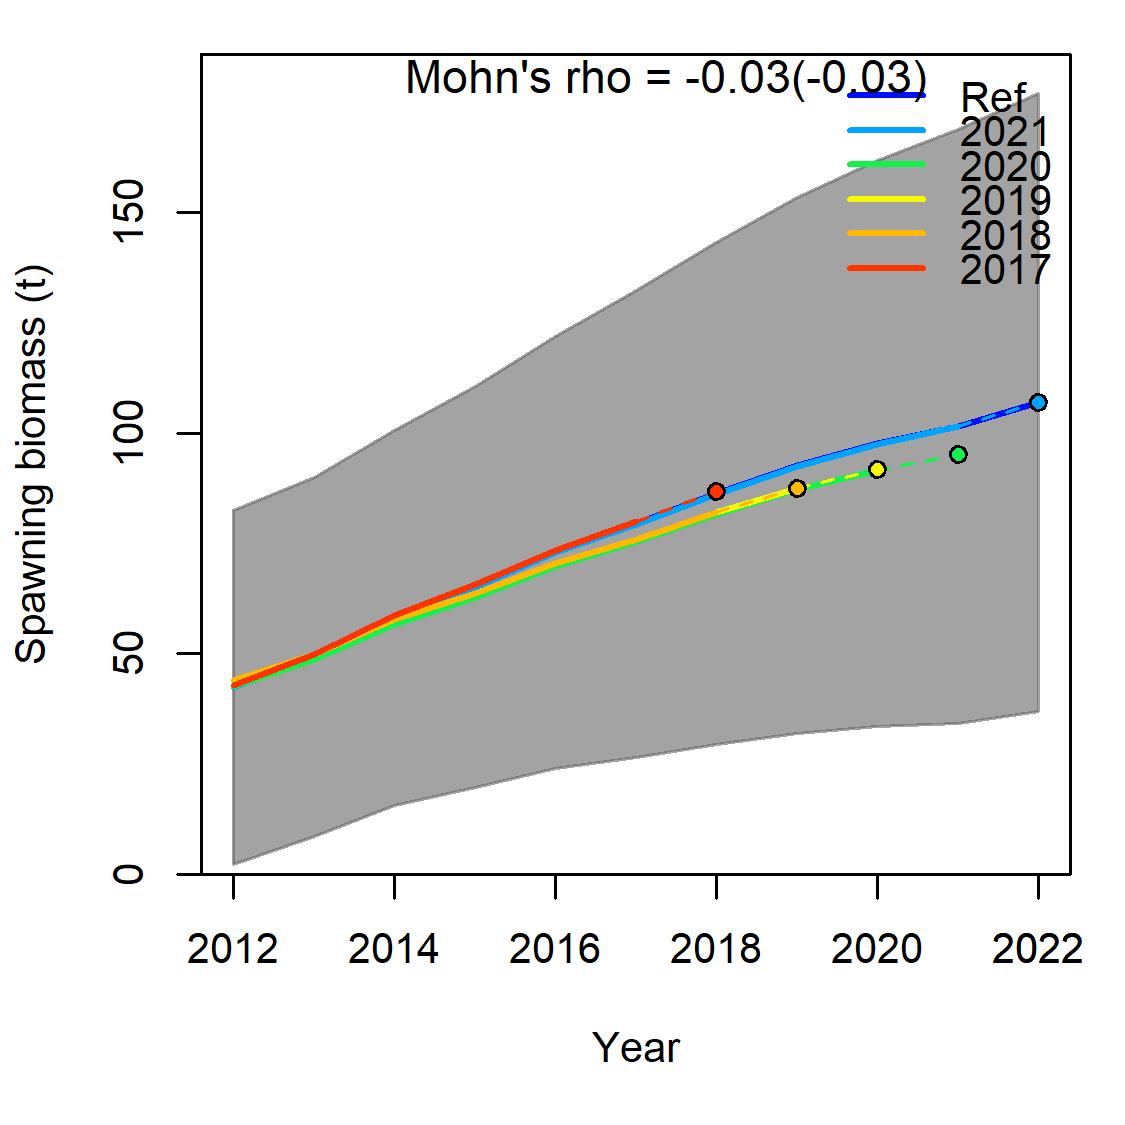
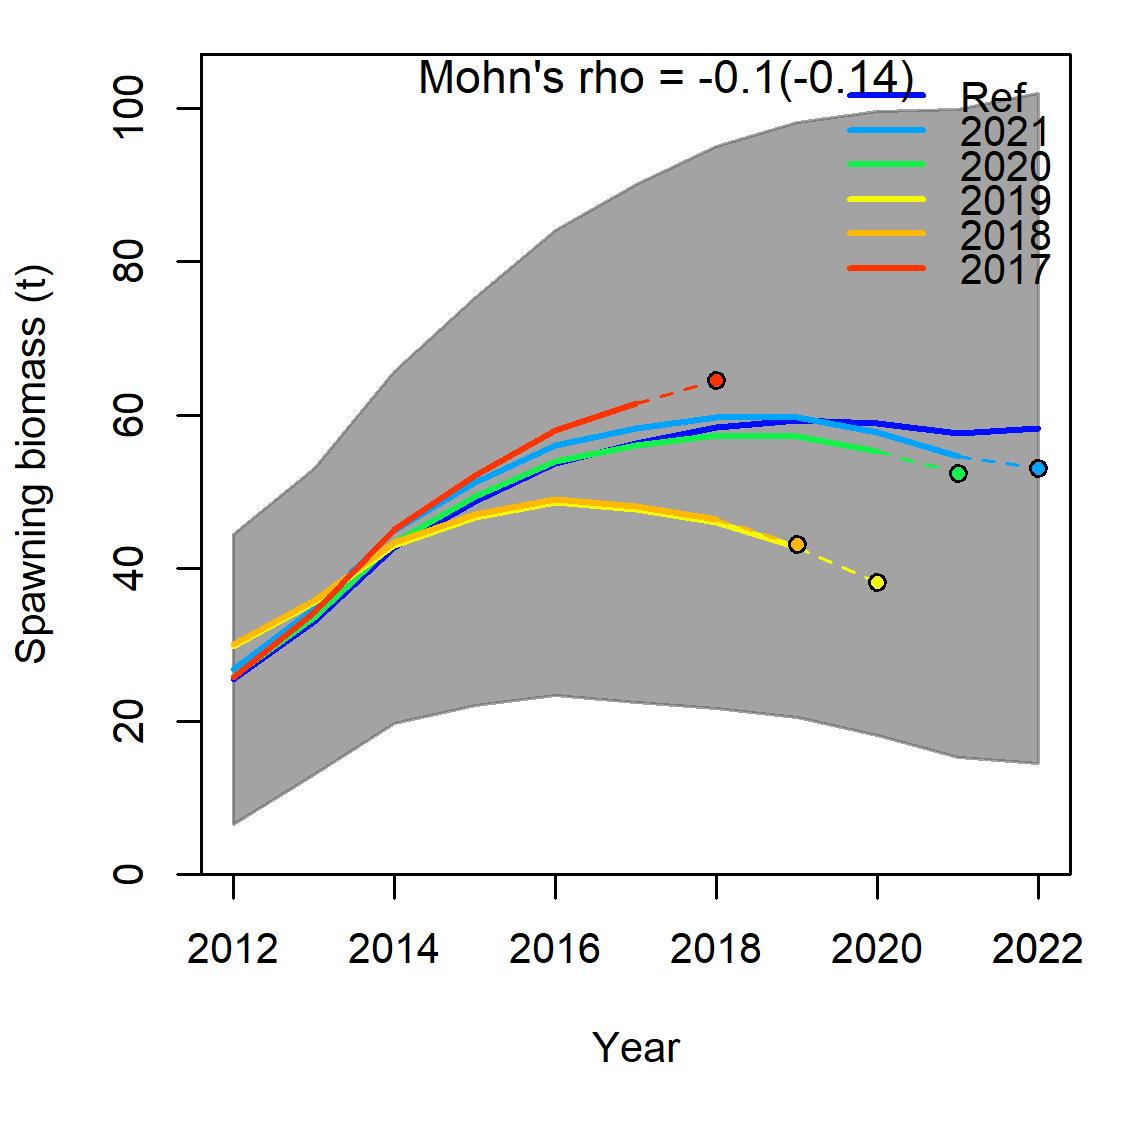
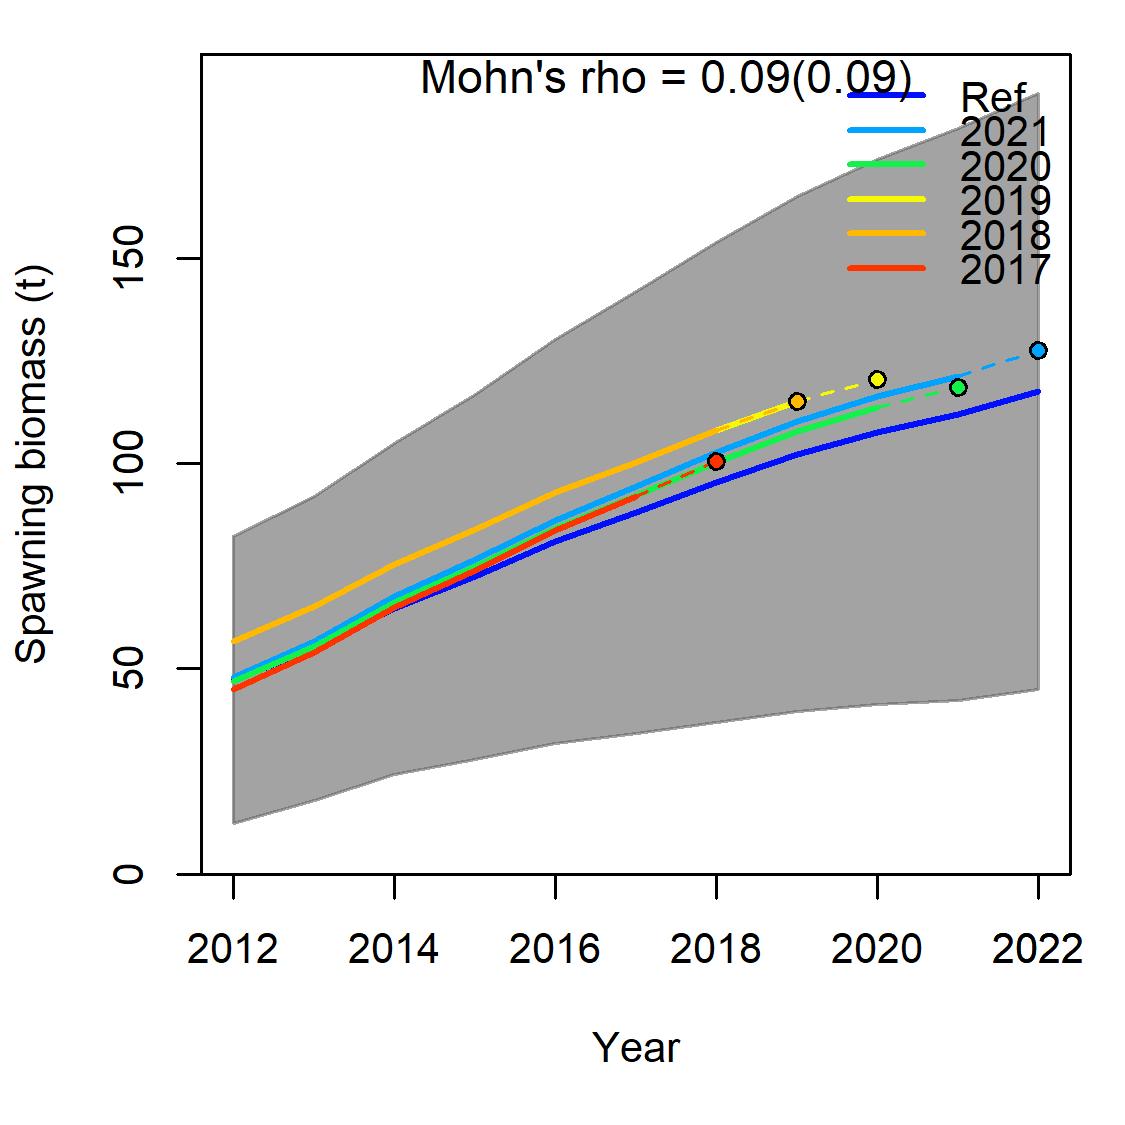
Figure8.11: St.ThomasandSt.JohnYellowtailSnapperretrospectiveanalysisofspawning stockbiomass(SSB)conductedbyrefittingmodelsafterremovingfiveyearsofobservation, oneyearatatimesequentially.Mohn’srhostatisticsandthecorresponding“hindcastrho” measuretheseverityofretrospectivepatterns.Thereferencemodels(Ref)includethefull timeseriesendingin2022.One-year-aheadprojectionsaredenotedbycolor-codeddashed lineswithterminalpoints.Greyshadedareasarethe95%confidenceintervals.
(a) v4_m3
(b) v8_m3
(c) v19_m3
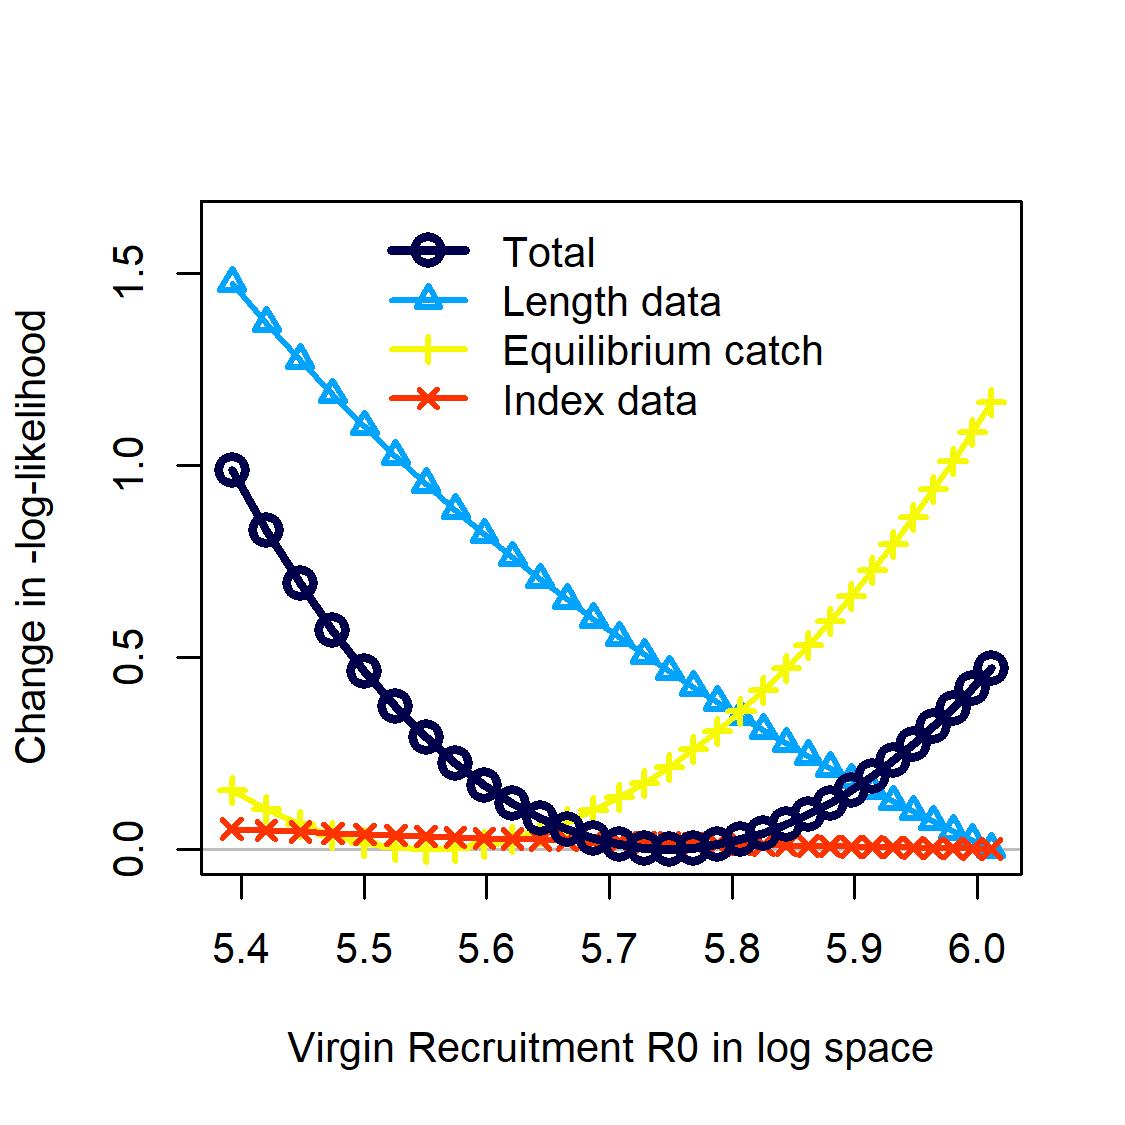
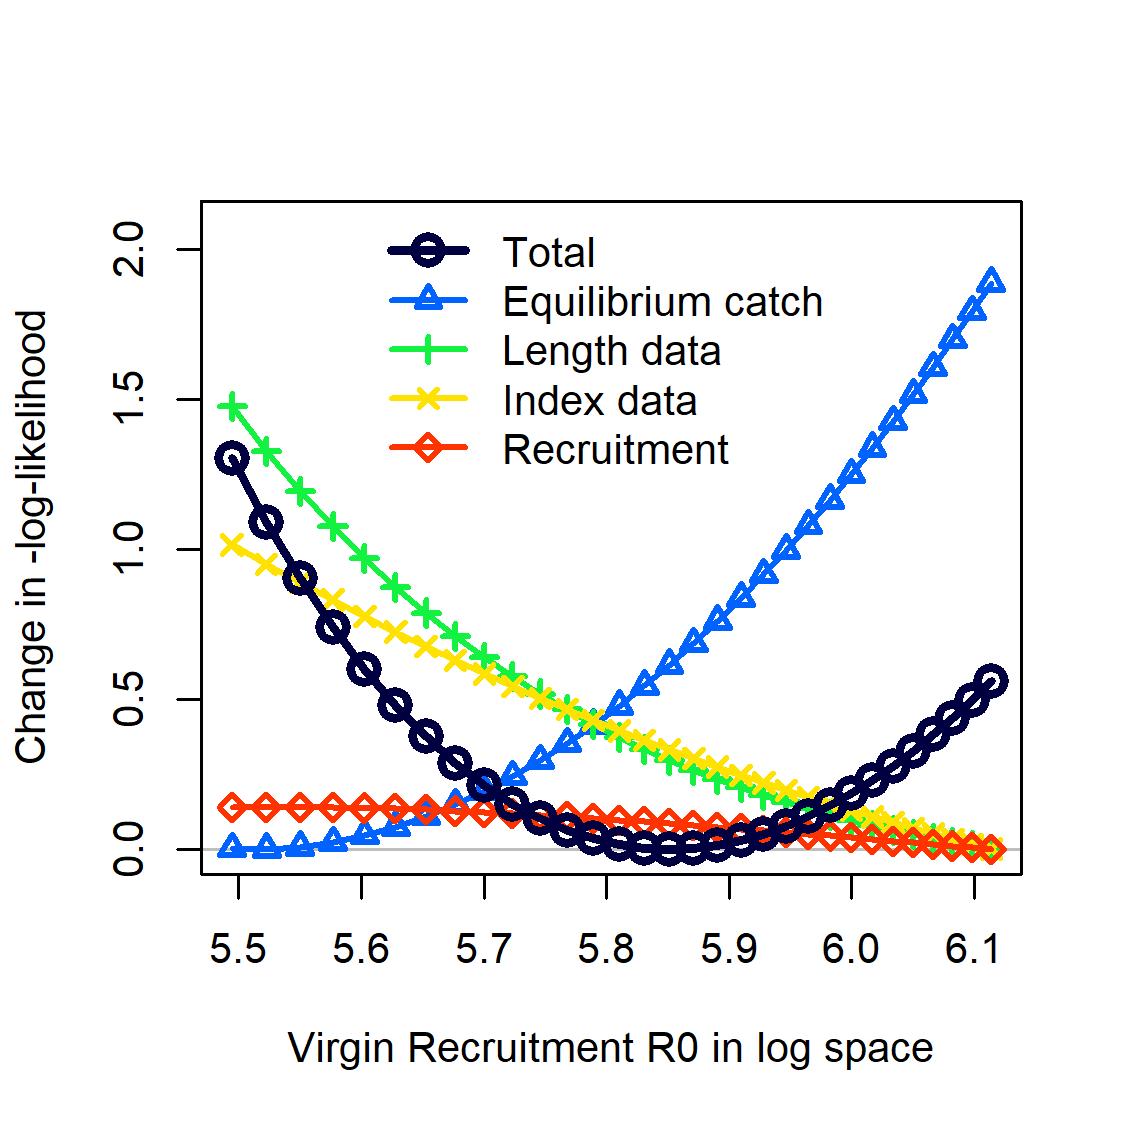
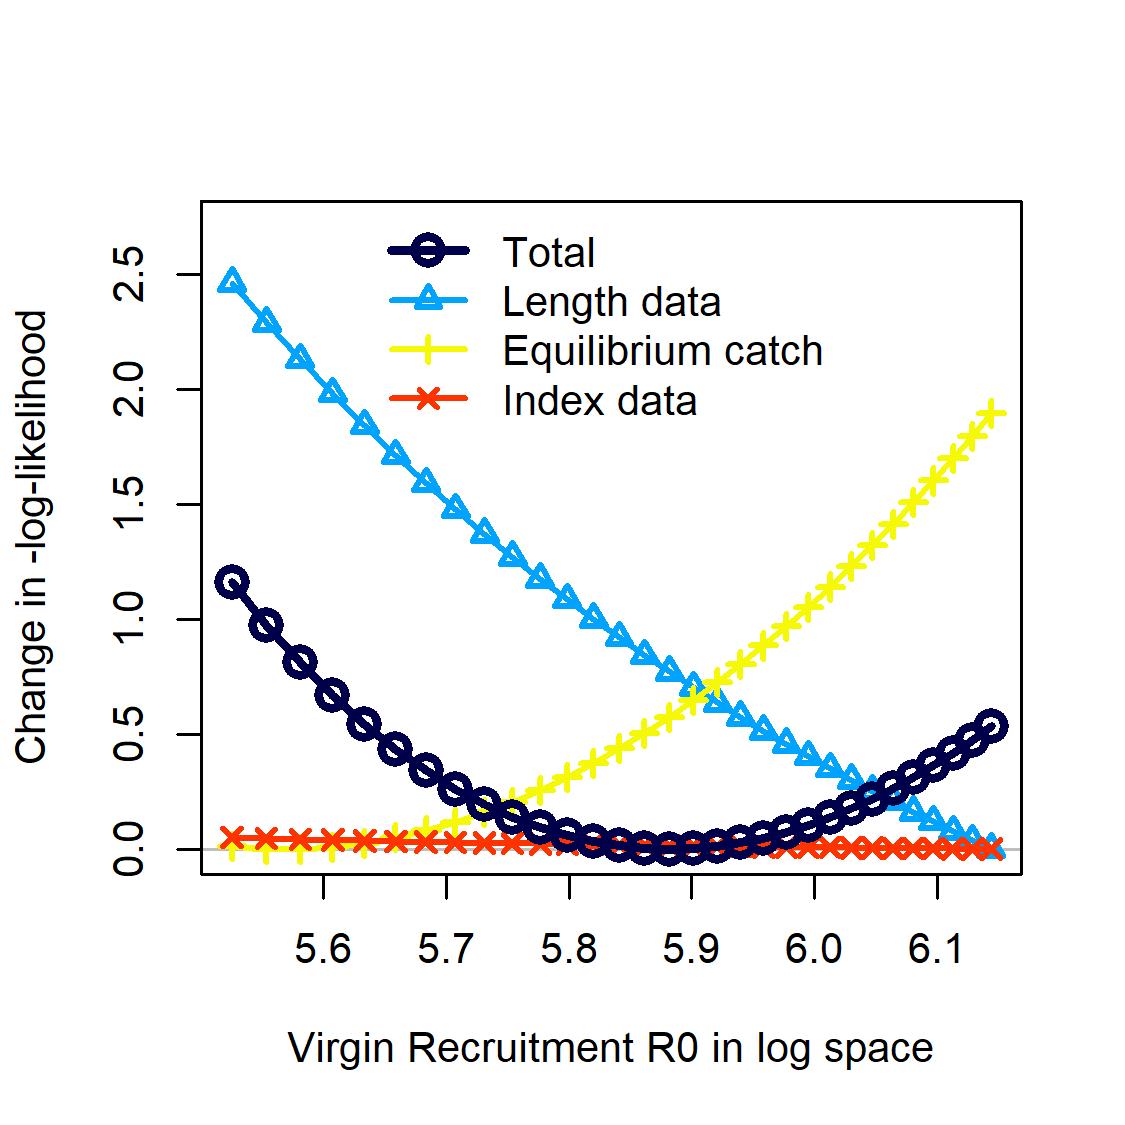
Figure8.12: Theprofilelikelihoodforthenaturallogoftheunfishedrecruitmentparameter oftheBeverton–Holtstock-recruitfunctionforSt.ThomasandSt.JohnYellowtail Snapperacrossmodelscenarios(v4_m3,v8_m3,andv19_m3).Eachlinerepresentsthe changeinnegativelog-likelihoodvalueforeachofthedatasourcesfitinthemodelacross therangeoffixedunfishedrecruitmentvaluestestedintheprofilediagnosticrun.
(a) v4_m3
(b) v8_m3
(c) v19_m3
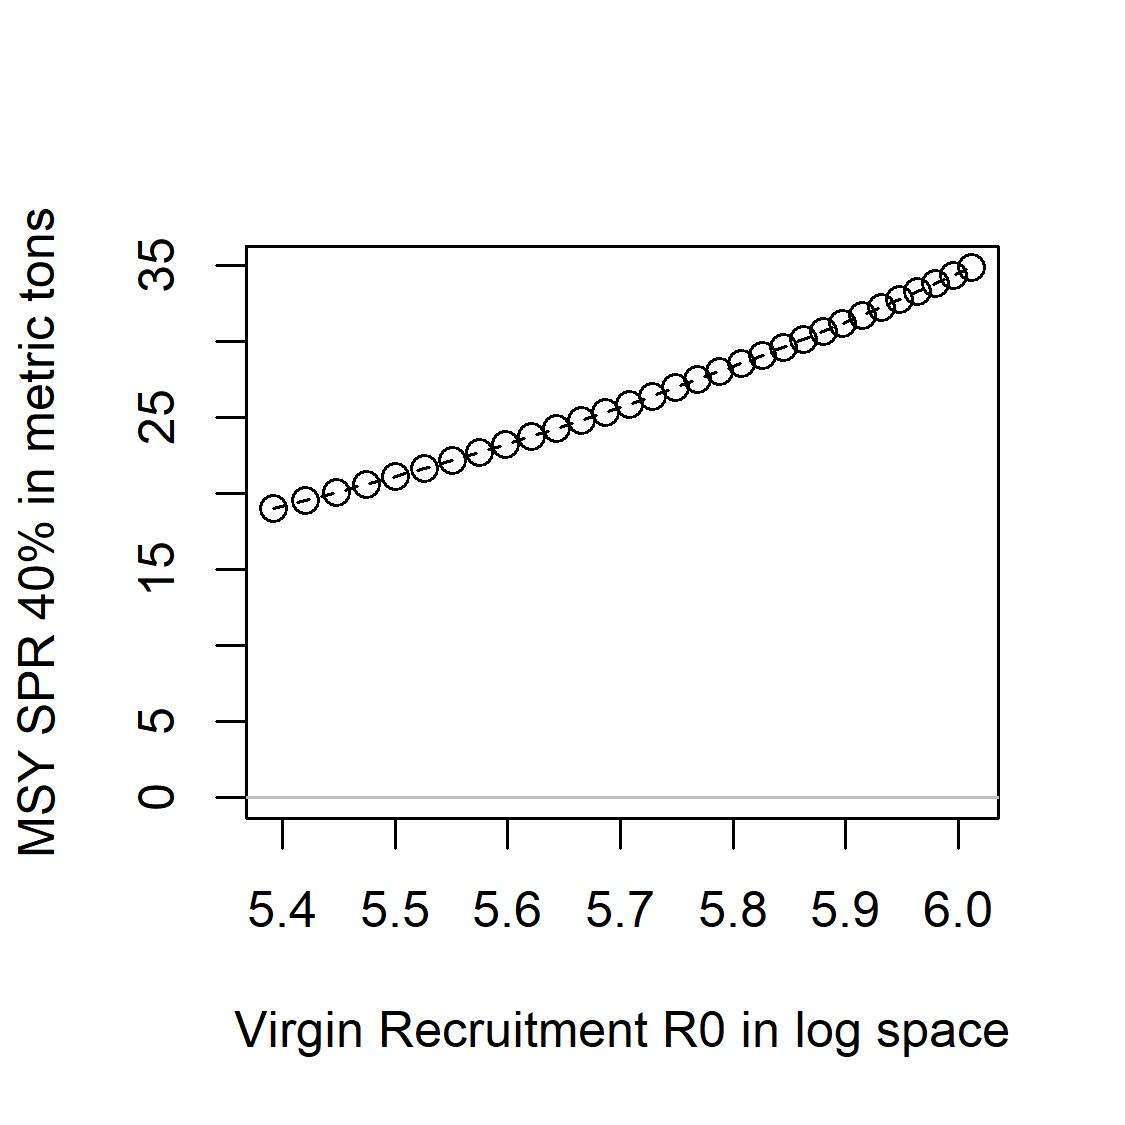
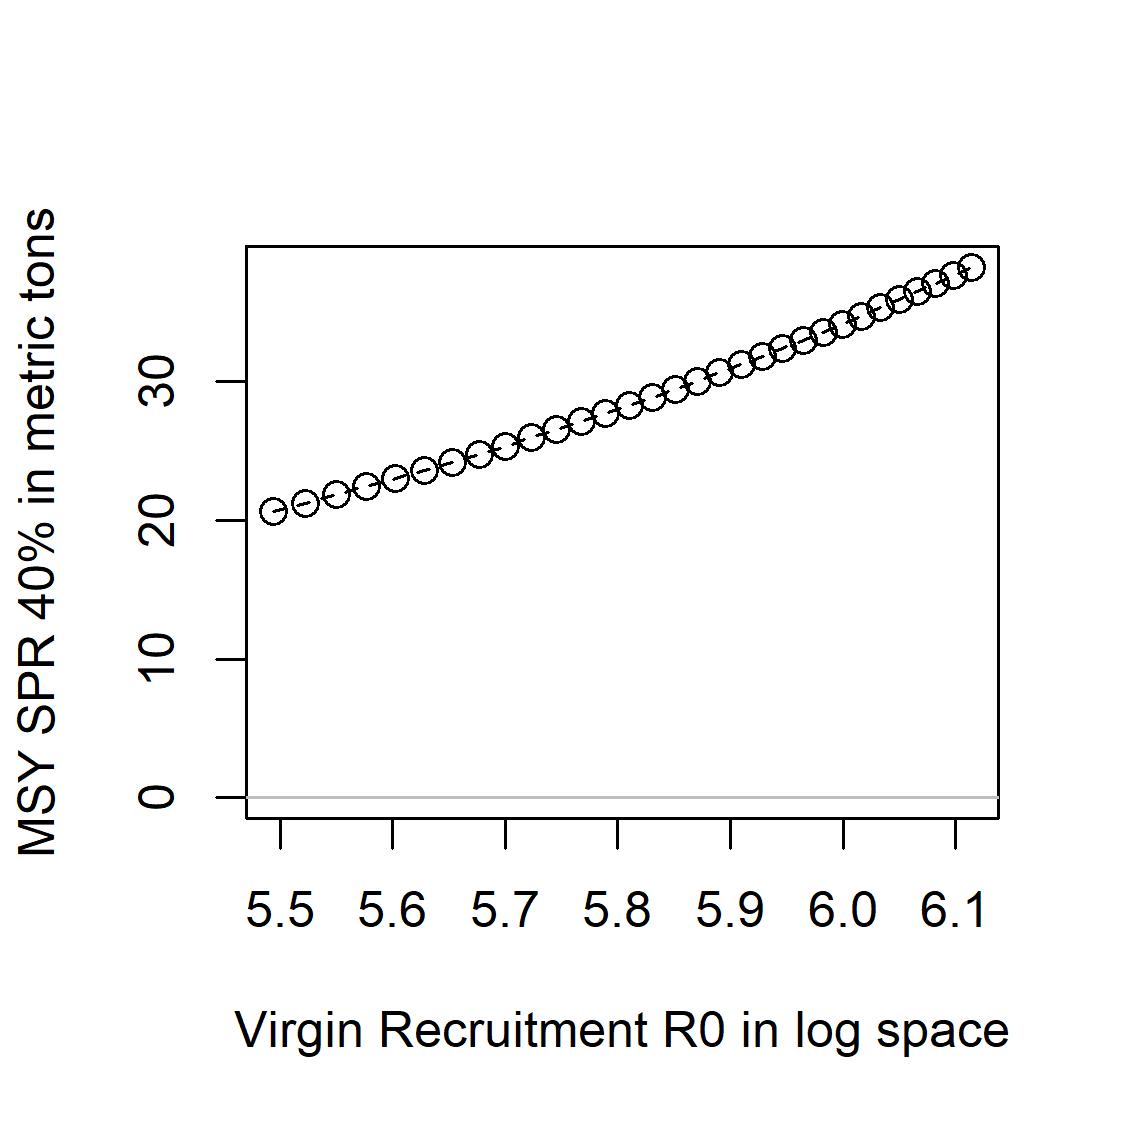
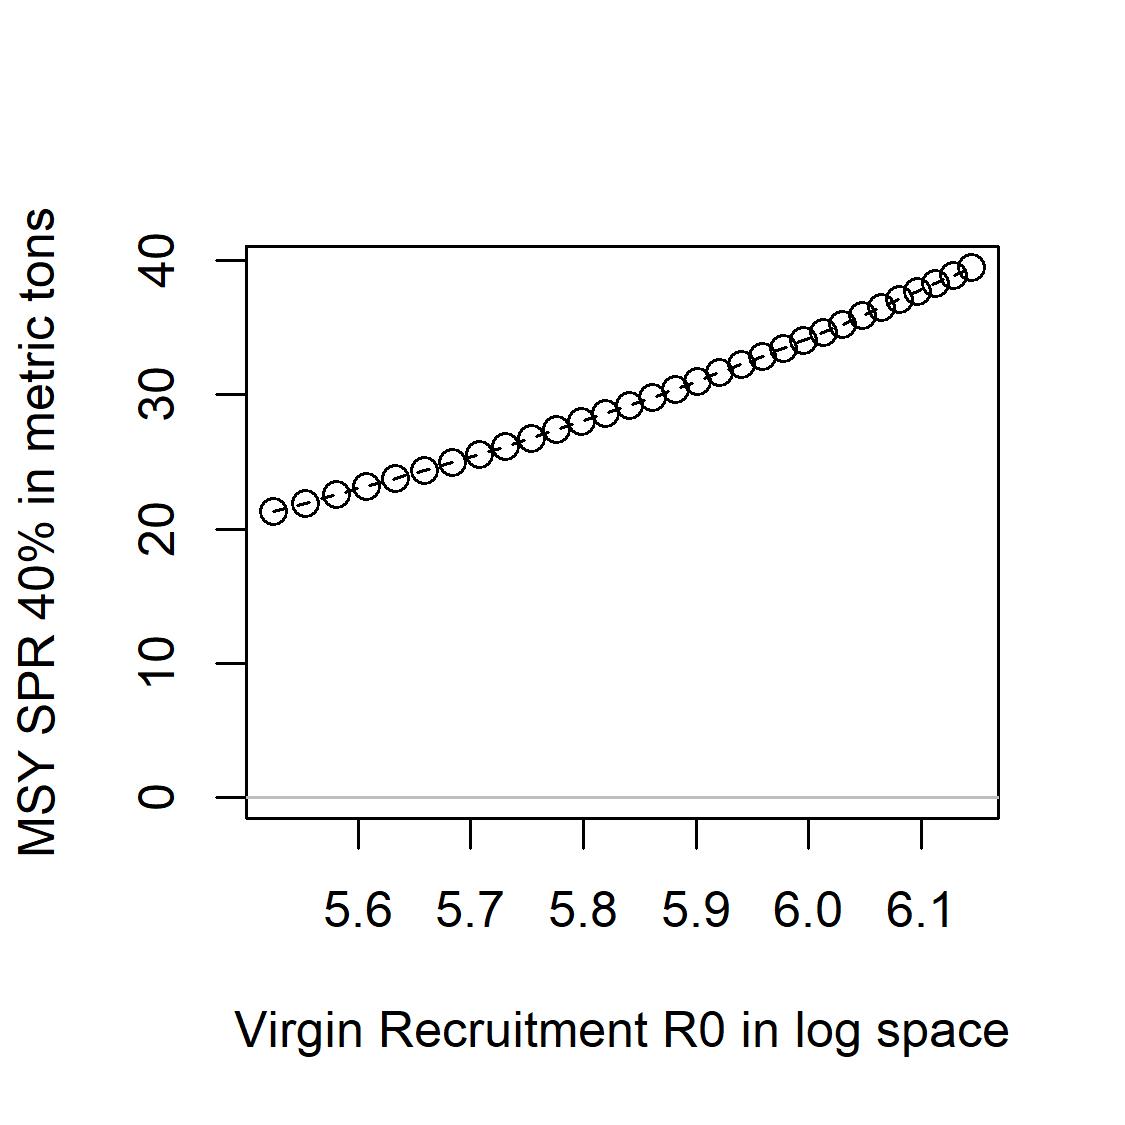
Figure8.13: EstimatesoftheMSYproxy(basedonSPR40%)acrosstherangeofunfished recruitmentvaluesexploredintheSt.ThomasandSt.JohnYellowtailSnapperlikelihood profile.Theseestimates,expressedinmetrictons,areshownformodelscenariosv4_m3, v8_m3,andv19_m3.
(a) v4_m3
(b) v8_m3
(c) v19_m3
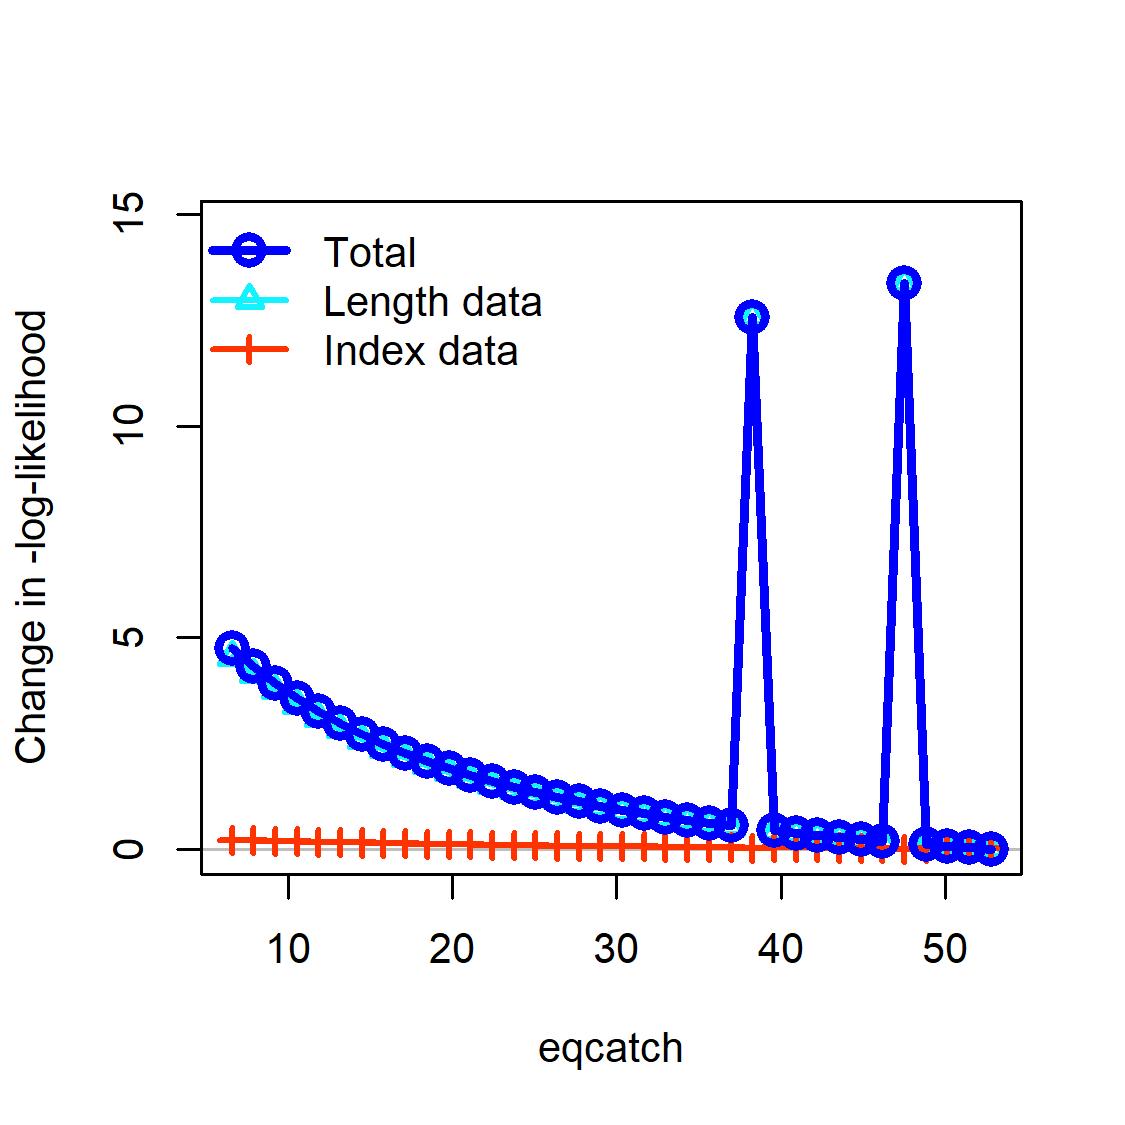
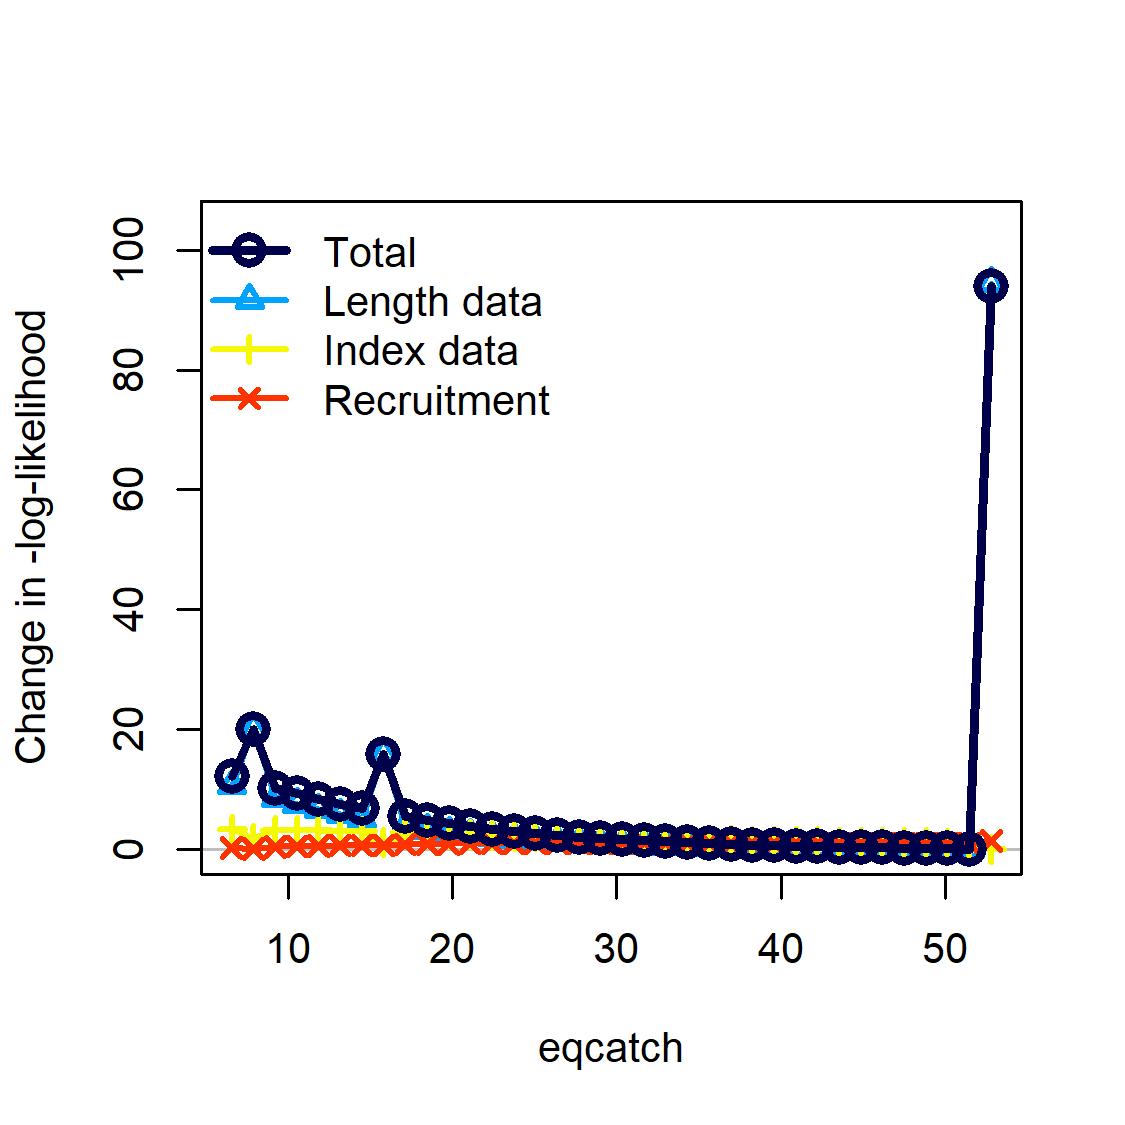
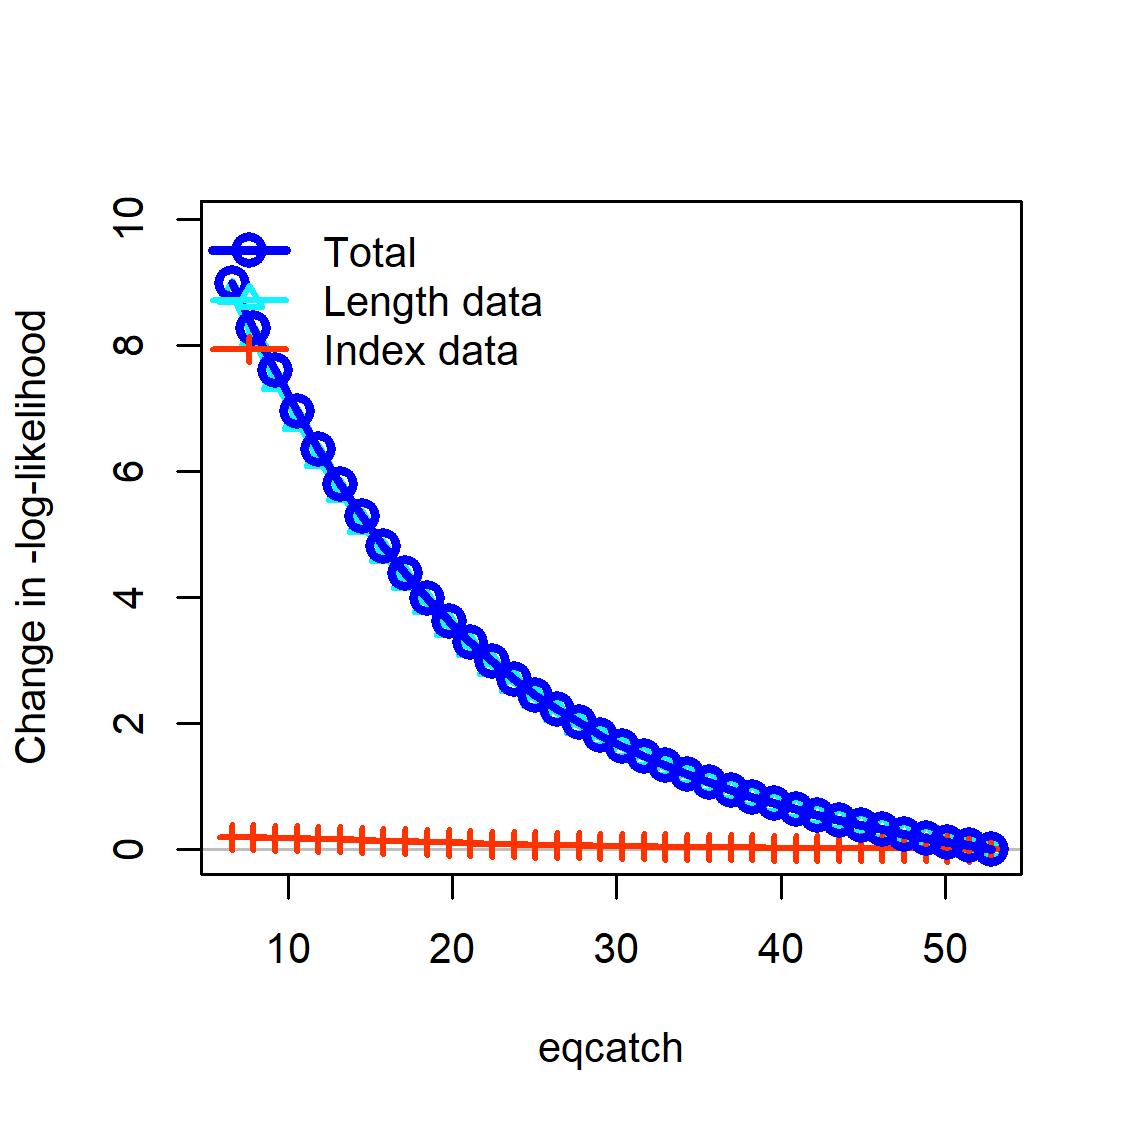
Figure8.14: TheprofilelikelihoodforthefixedinitialequilibriumcatchforSt.Thomasand St.JohnYellowtailSnapperacrossmodelscenarios(v4_m3,v8_m3,andv19_m3).Each linerepresentsthechangeinnegativelog-likelihoodvalueforeachofthedatasourcesfitin themodelacrosstherangeoffixedequilibriumcatchvaluestestedintheprofilediagnostic run.
(a) v4_m3
(b) v8_m3
(c) v19_m3
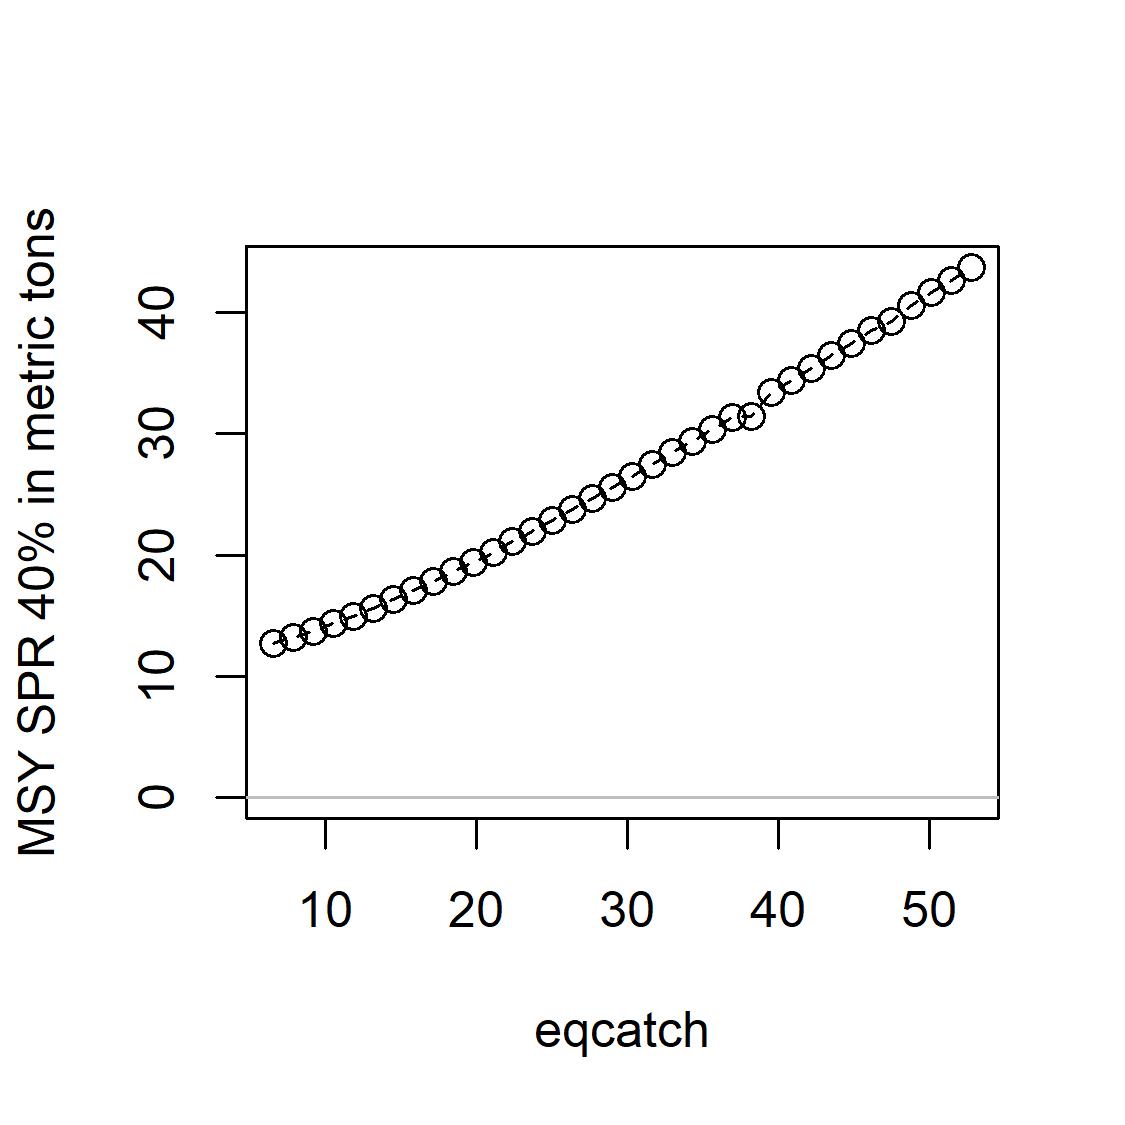
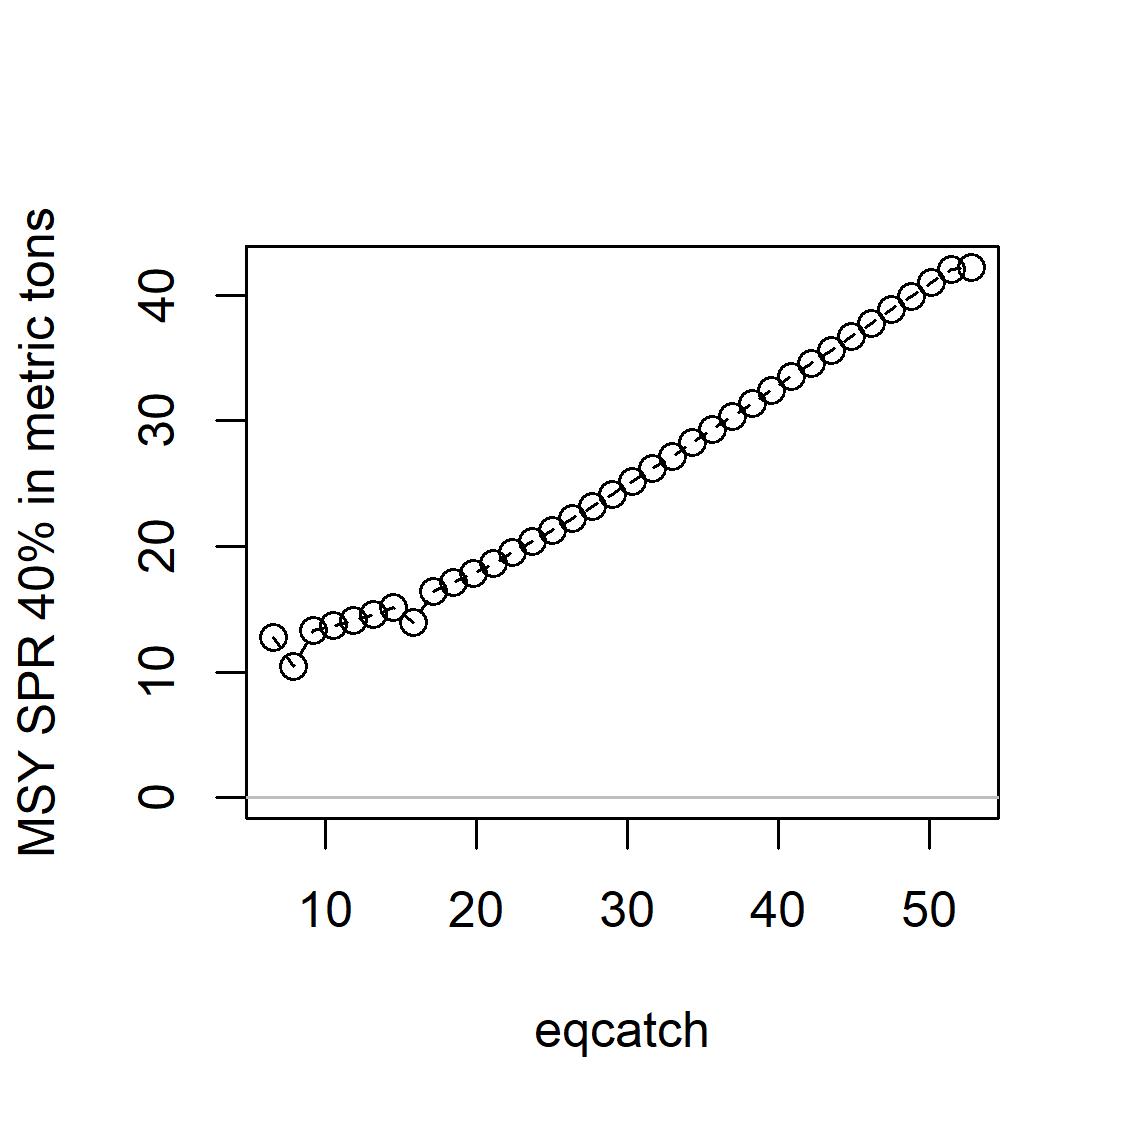
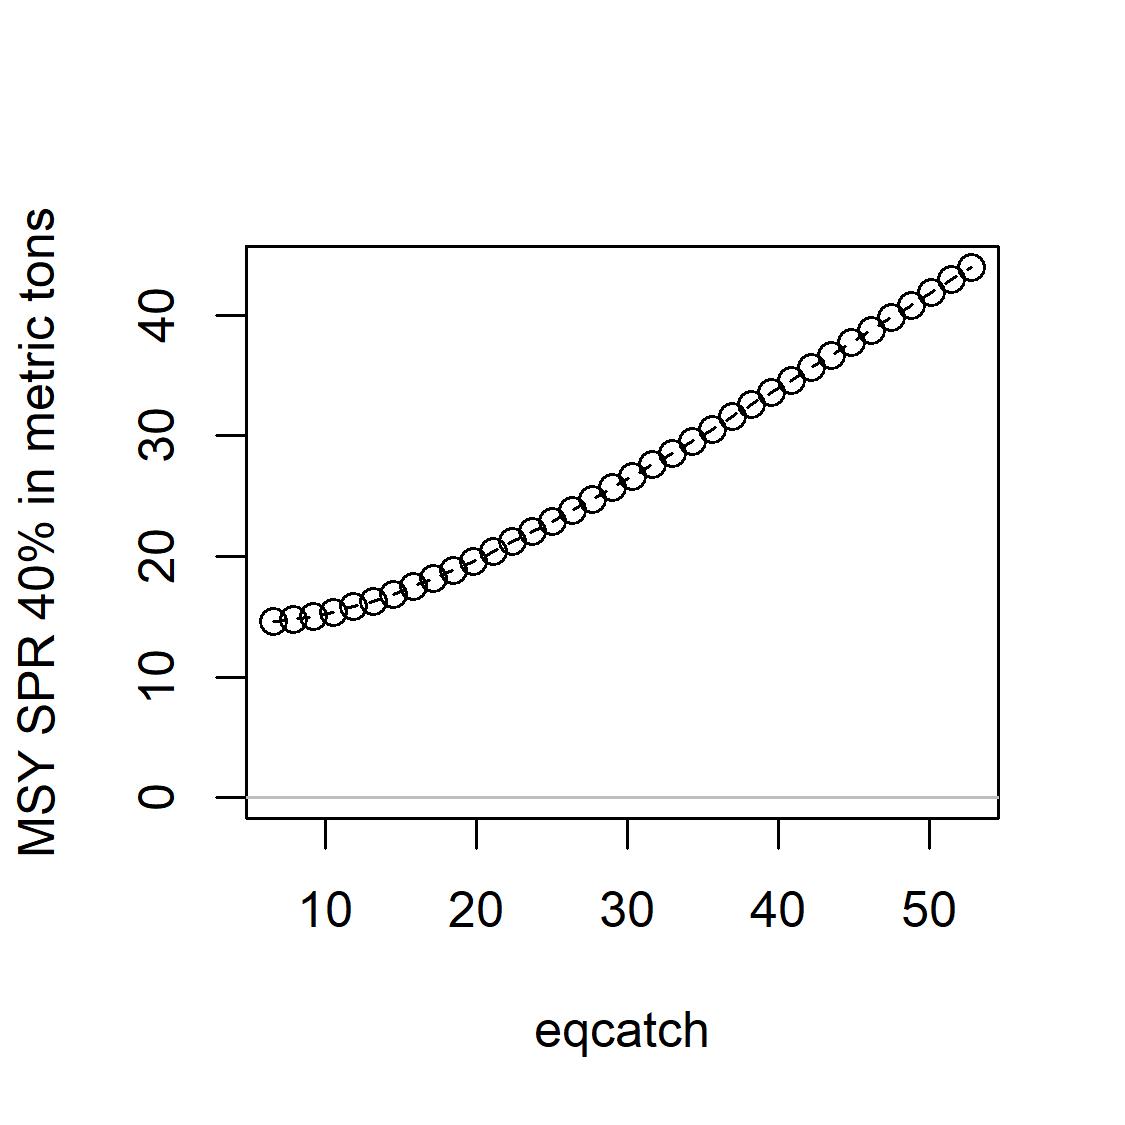
Figure8.15: EstimatesoftheMSYproxy(basedonSPR40%)acrosstherangeofinitial equilibriumcatchvaluesexploredintheSt.ThomasandSt.JohnYellowtailSnapper likelihoodprofile.Theseestimates,expressedinmetrictons,areshownformodelscenarios v4_m3,v8_m3,andv19_m3.
(a) v4_m3
(b) v8_m3
(c) v19_m3
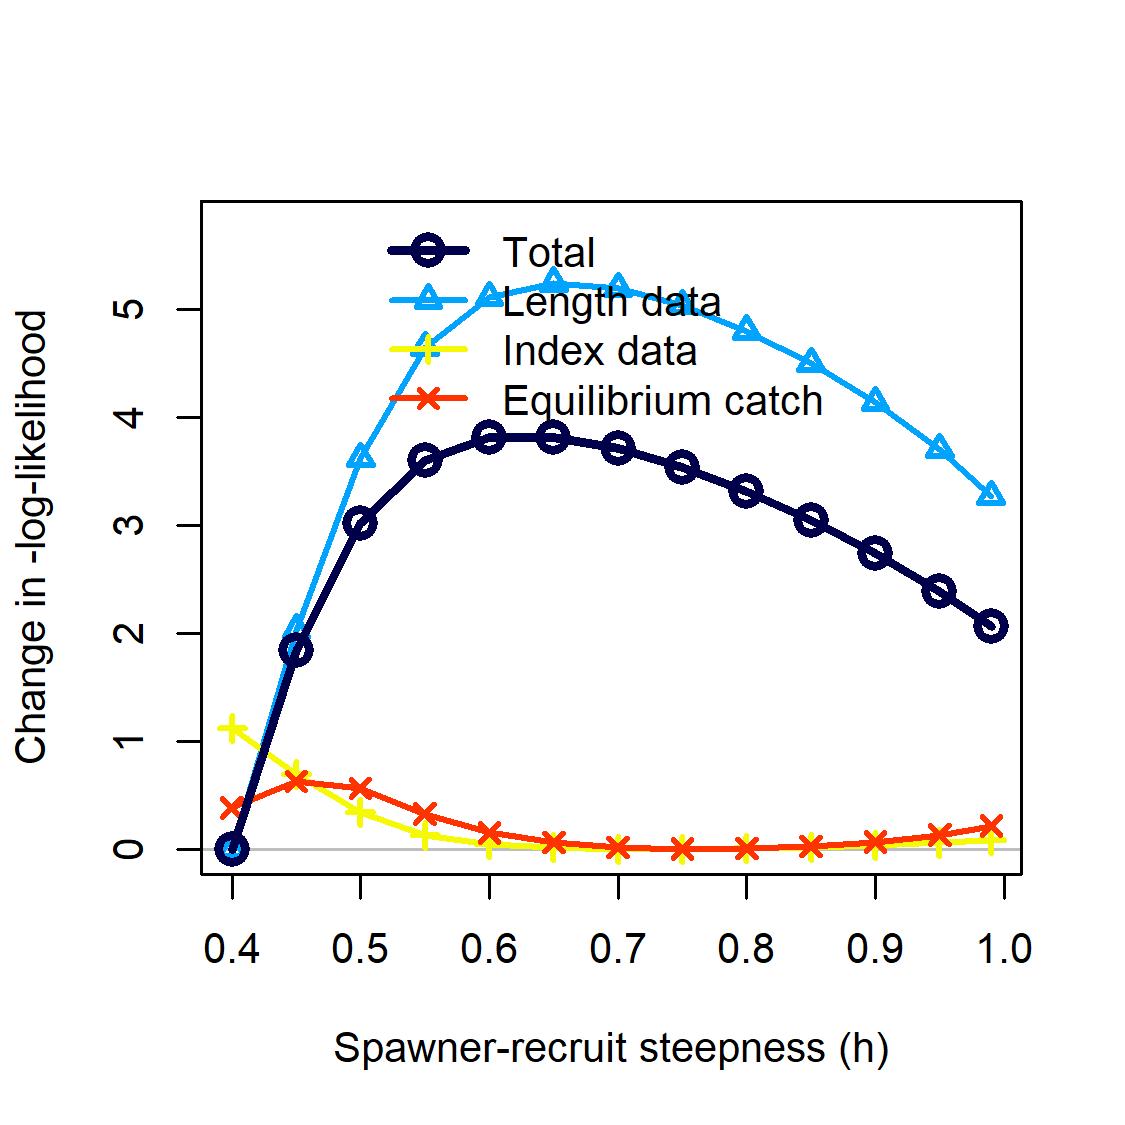
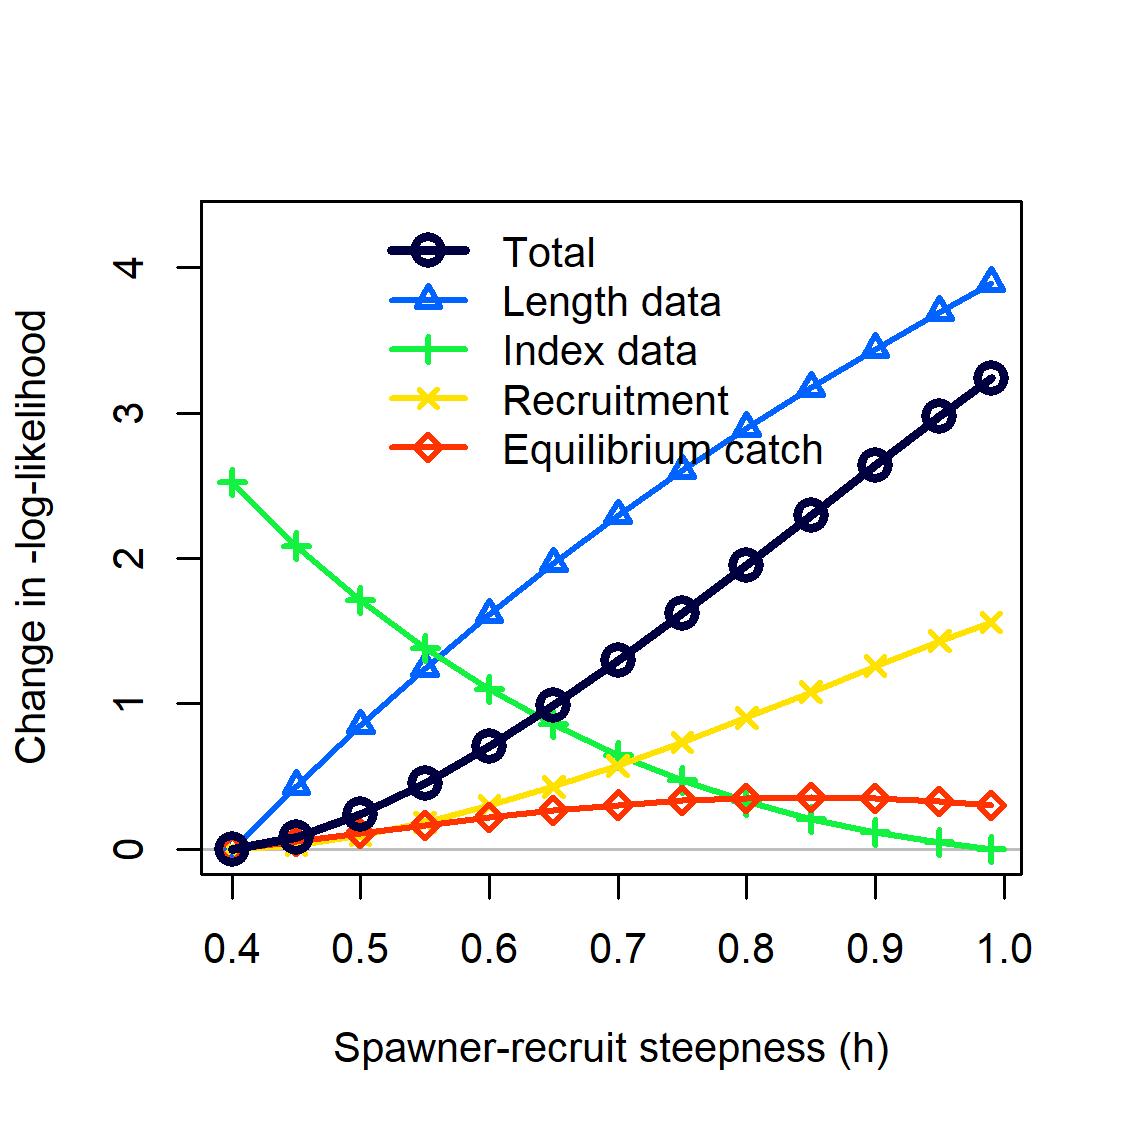
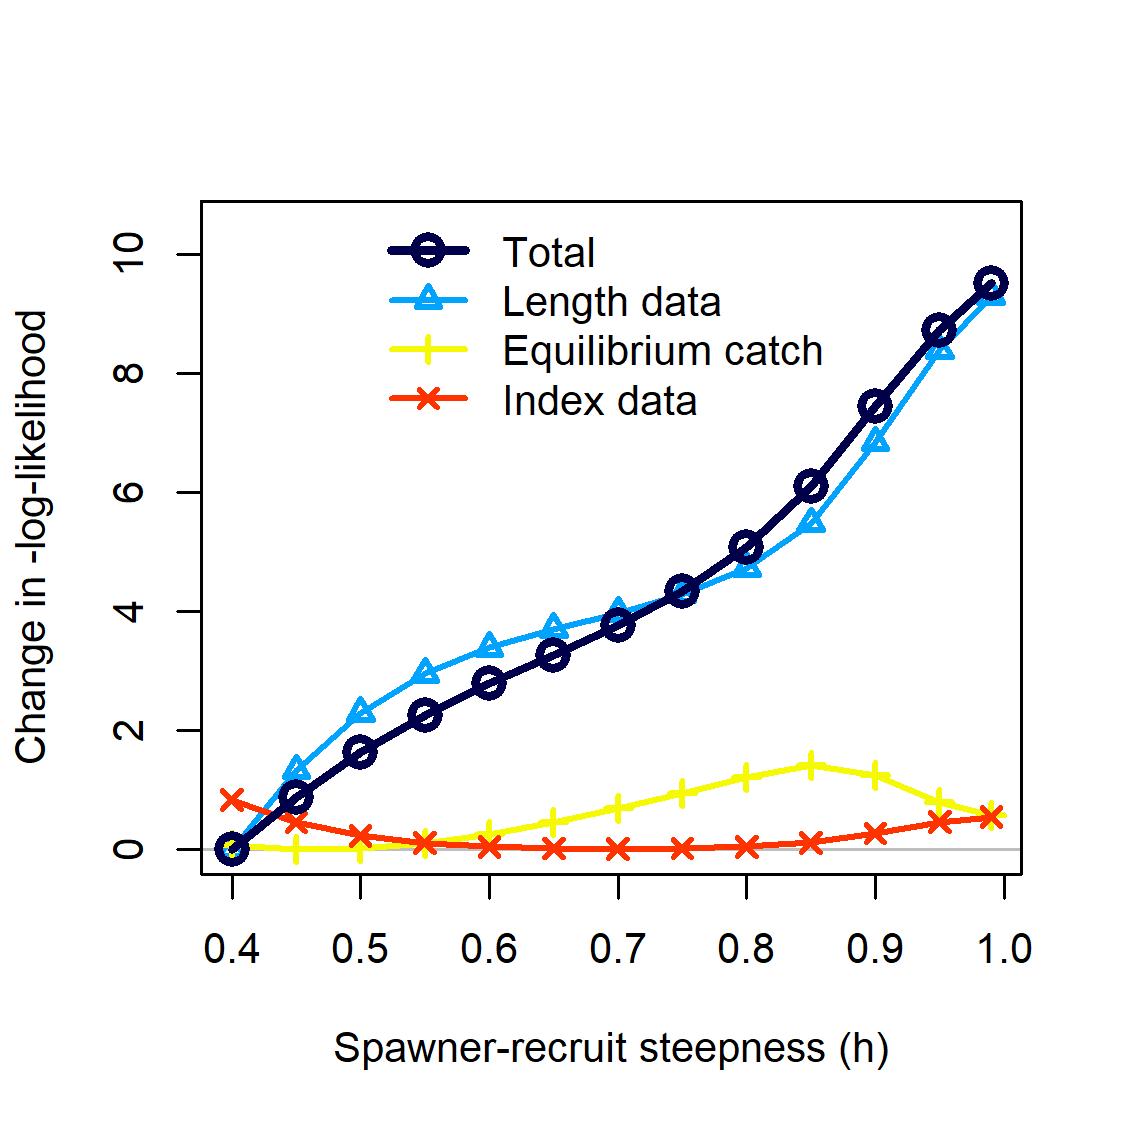
Figure8.16: TheprofilelikelihoodforthesteepnessparameteroftheBeverton–Holt stock-recruitfunctionforSt.ThomasandSt.JohnYellowtailSnapperacrossmodel scenarios(v4_m3,v8_m3,andv19_m3).Eachlinerepresentsthechangeinnegative log-likelihoodvalueforeachofthedatasourcesfitinthemodelacrosstherangeoffixed steepnessvaluestestedintheprofilediagnosticrun.
(a) v4_m3
(b) v8_m3
(c) v19_m3
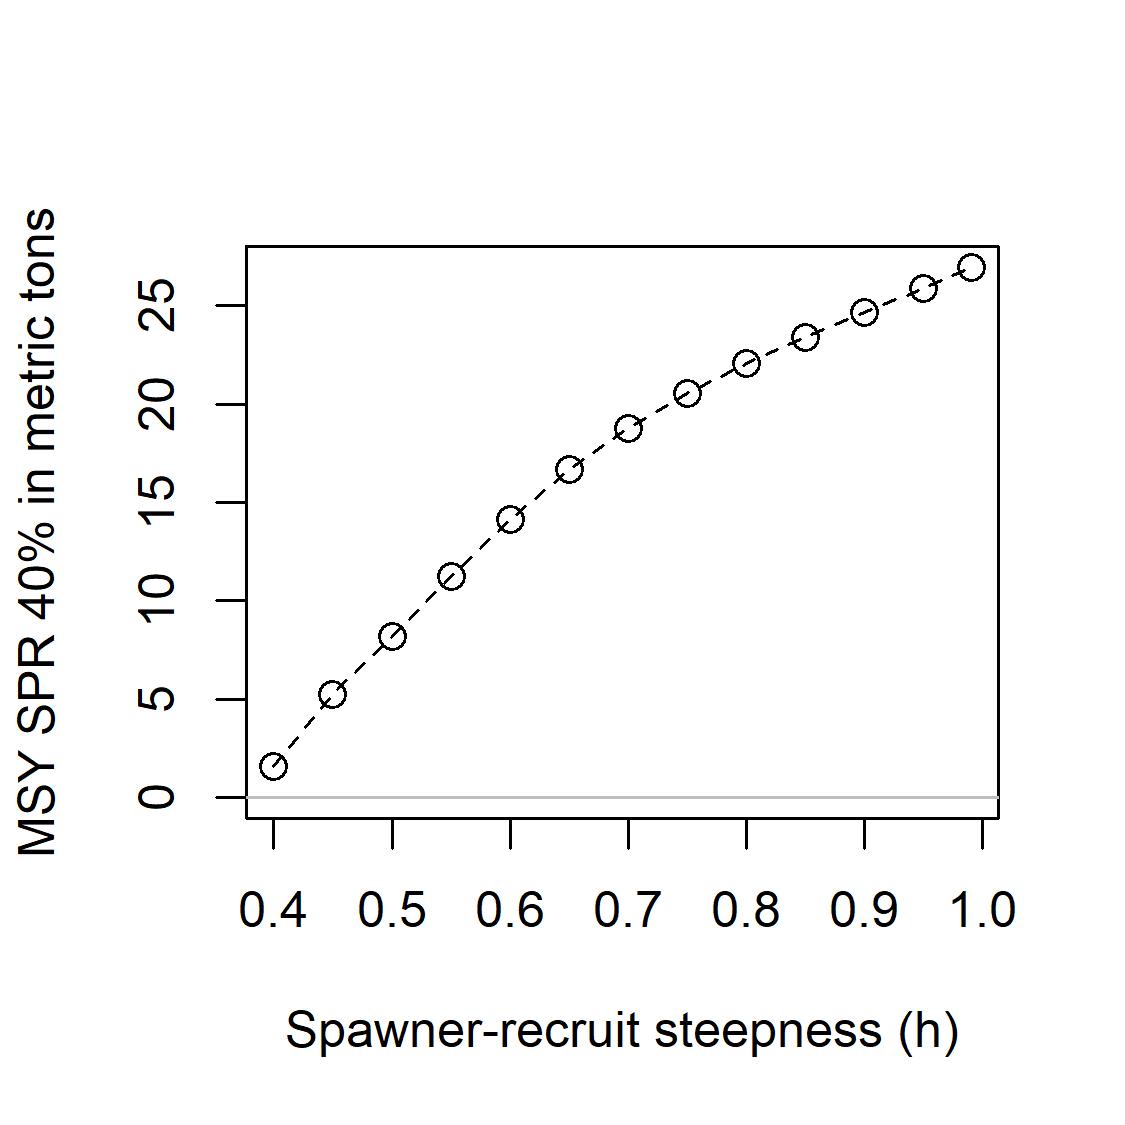
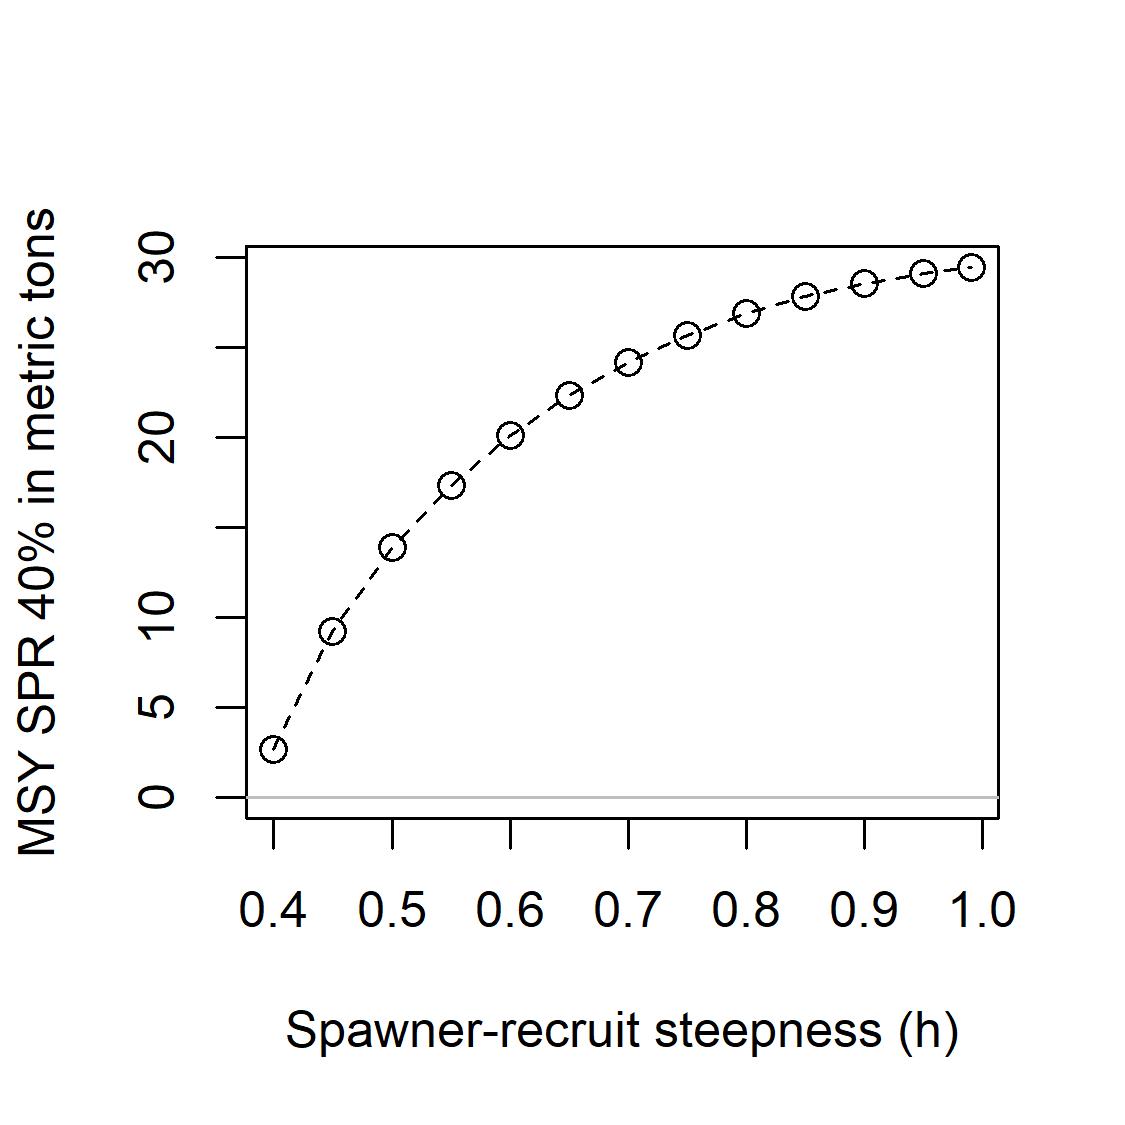
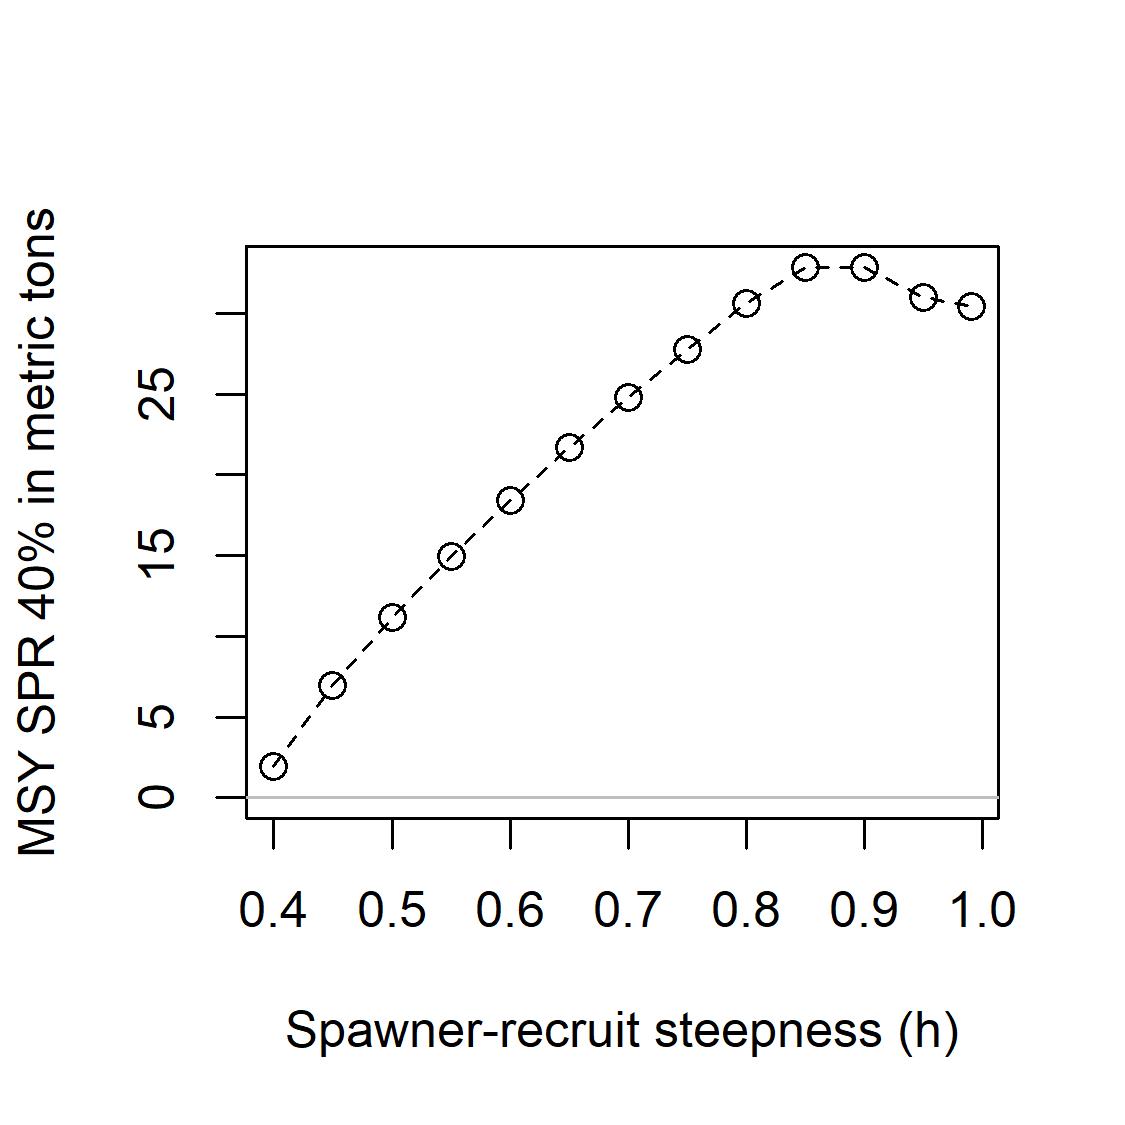
Figure8.17: EstimatesoftheMSYproxy(basedonSPR40%)acrosstherangeofsteepness valuesexploredintheSt.ThomasandSt.JohnYellowtailSnapperlikelihoodprofile. Theseestimates,expressedinmetrictons,areshownformodelscenariosv4_m3,v8_m3, andv19_m3.
(a) v4_m3
(b) v8_m3
(c) v19_m3
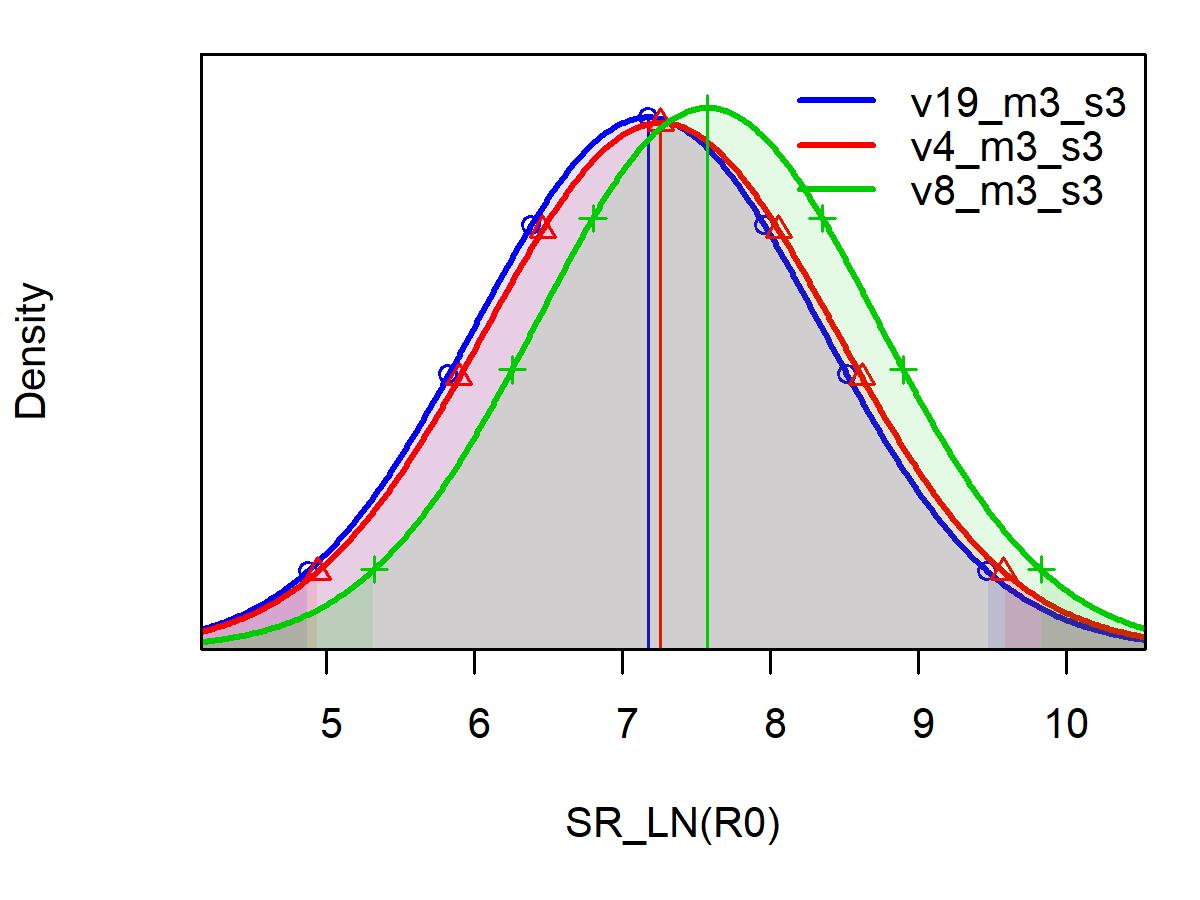
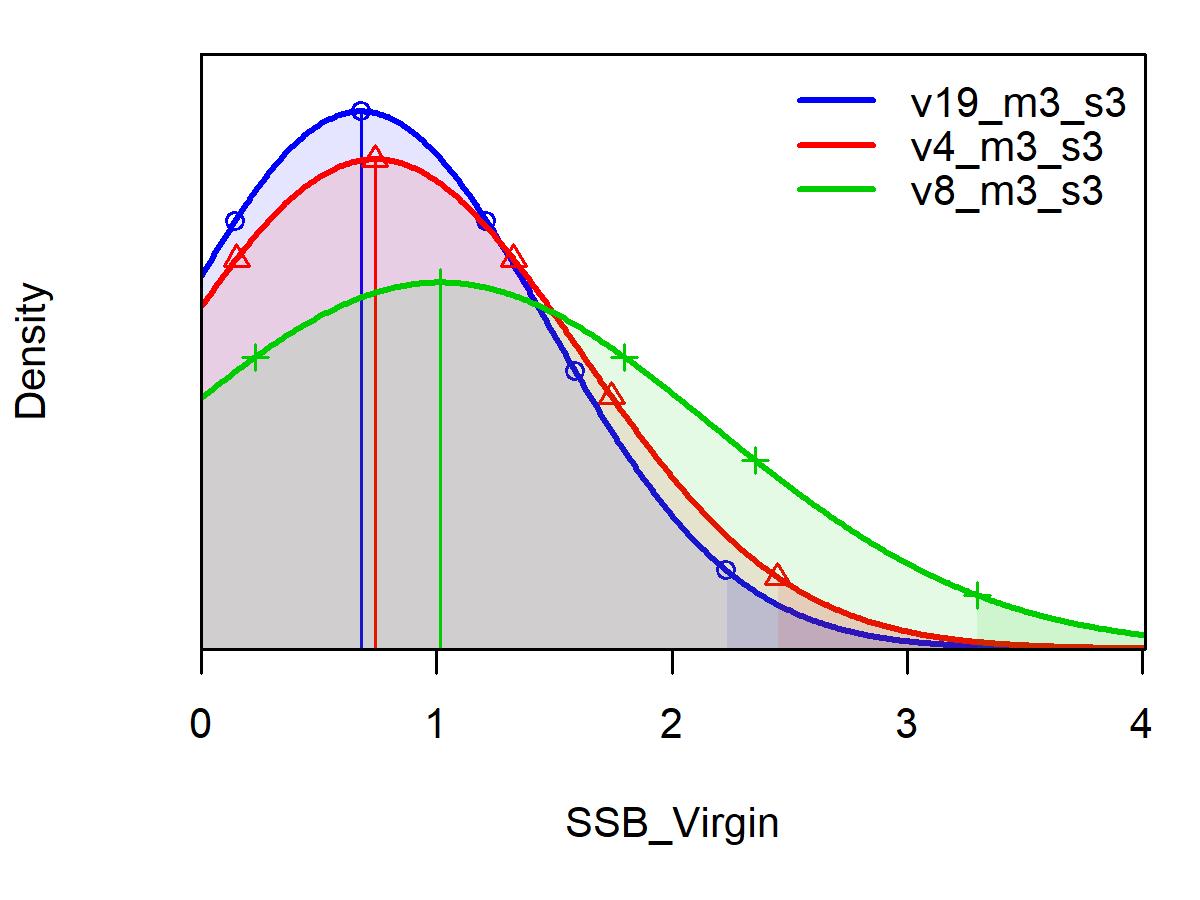
(a) Unfishedrecruitment(R0) (b) VirginSpawningStockBiomass
Figure8.18: St.ThomasandSt.JohnYellowtailSnapperparameterdistributionfor(a)the naturallogoftheunfishedrecruitmentparameteroftheBeverton–Holtstock-recruit functionand(b)virginspawningstockbiomassinmetrictonsacrossmodelscenarios (v4_m3_s3,v8_m3_s3,andv19_m3_s3).
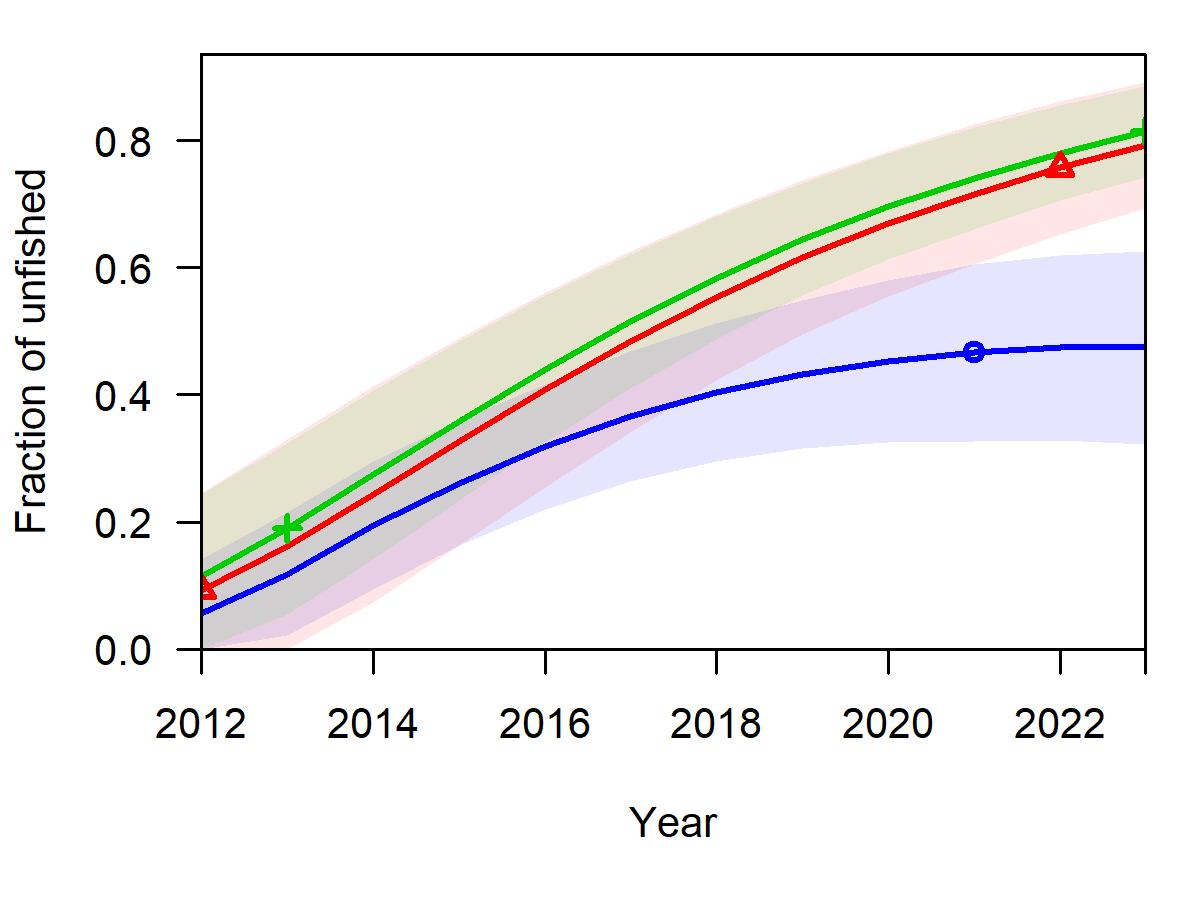
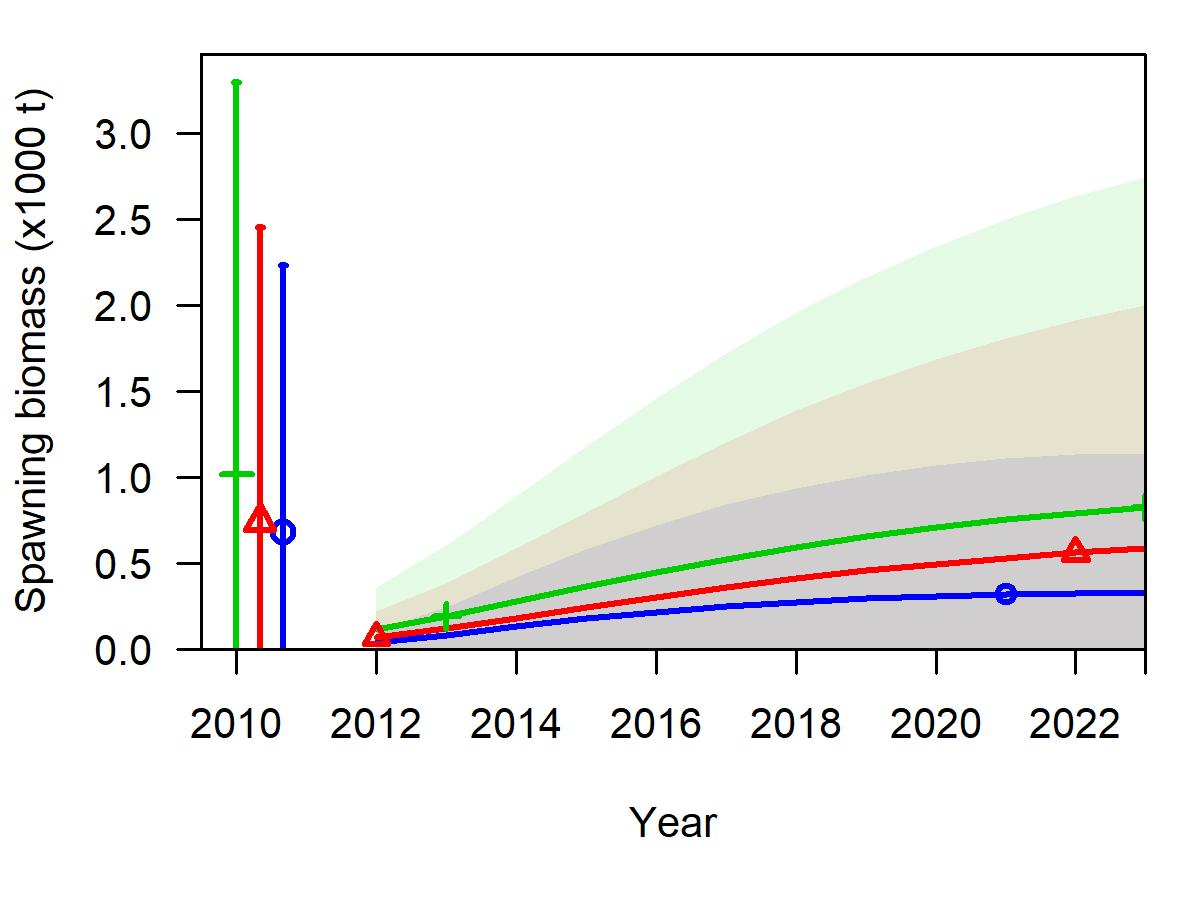
(a) SpawningBiomassRatio (b) SpawningBiomass
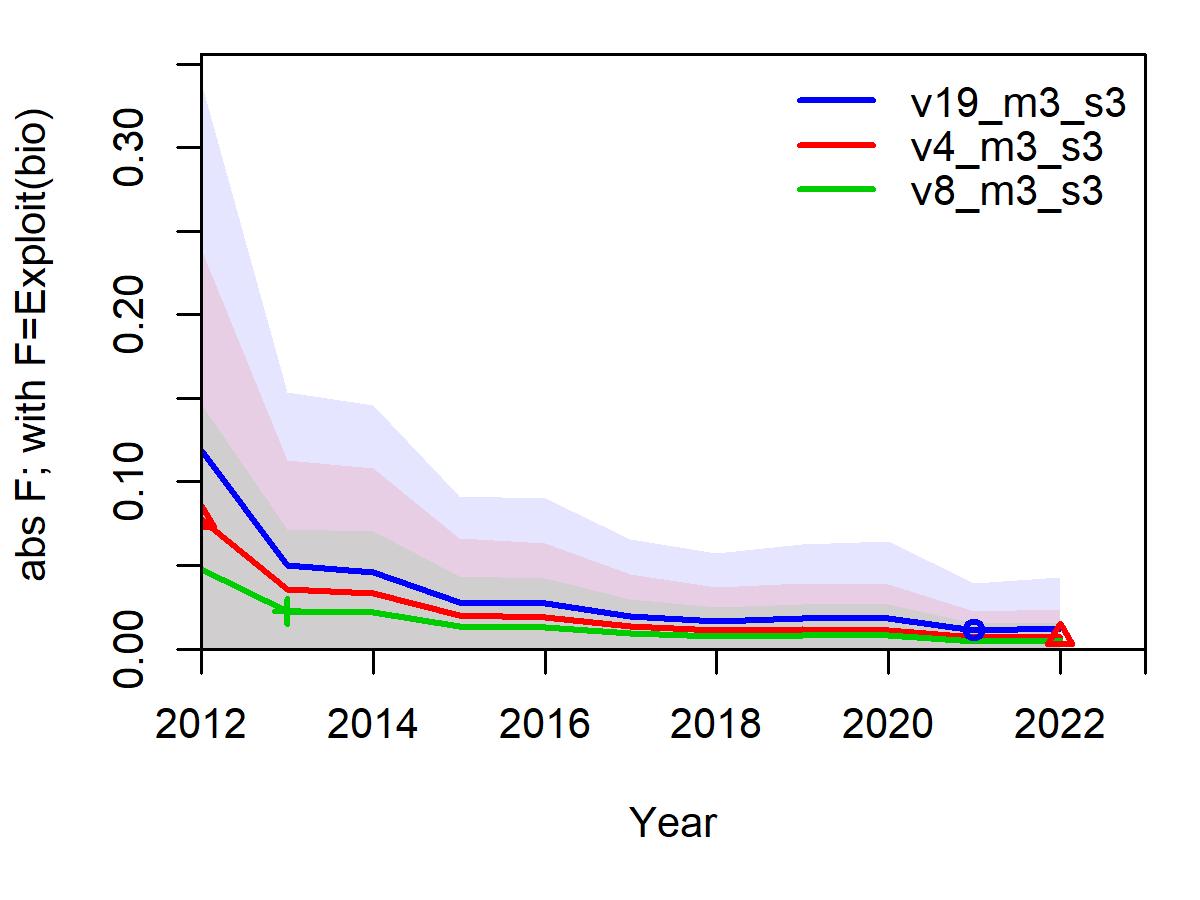
(c) FishingMortality
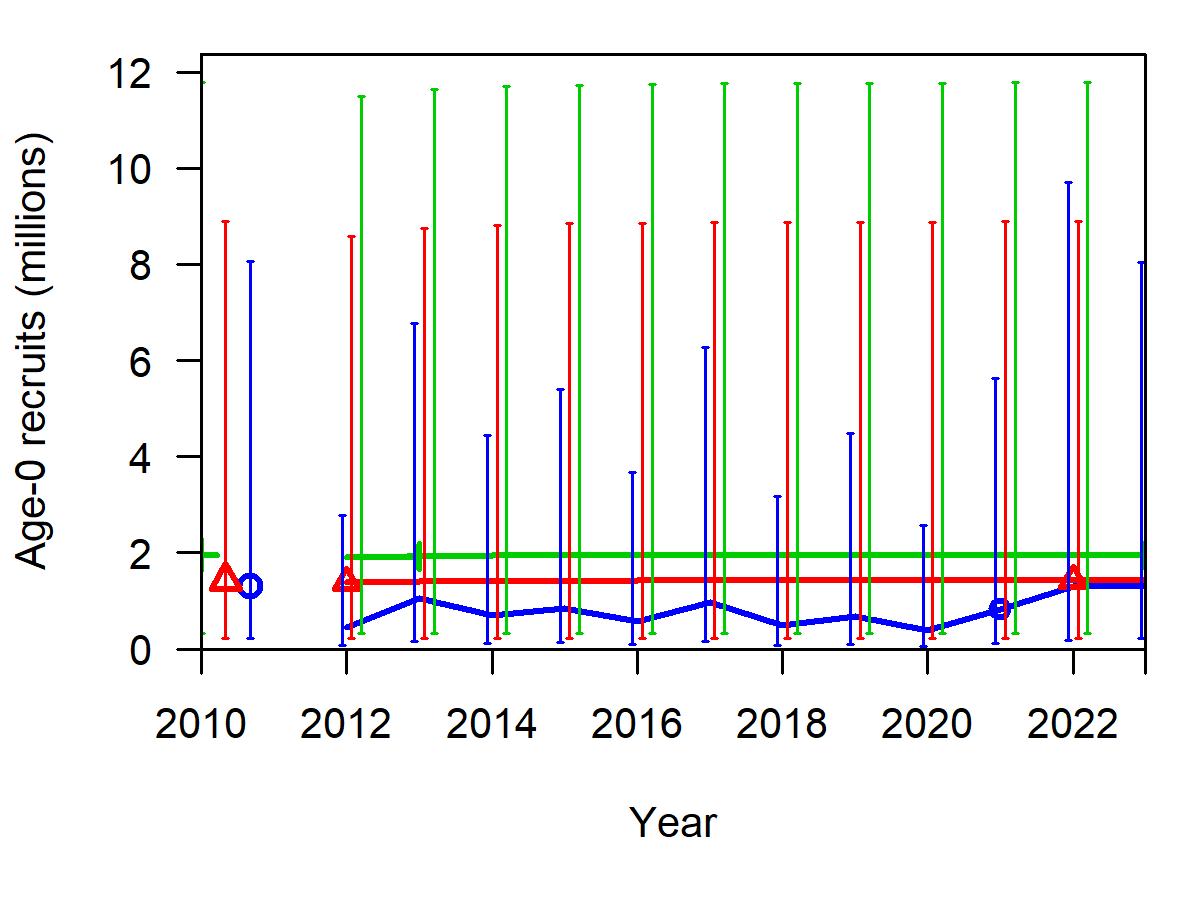
(d) Recruitment
Figure8.19: St.ThomasandSt.JohnYellowtailSnapperderivedquantitytimeseriesacross modelscenarios(v4_m3_s3,v8_m3_s3,andv19_m3_s3).Derivedquantitiesplotted overtimefor(a)therelativespawningstockbiomass(totalbiomass/virginspawning stockbiomass),(b)spawningstockbiomassinmetrictons,(c)fishingmortality(total biomasskilled/totalbiomass),(d)andrecruitmentinmillionsoffish.Theshadedareas andverticalbarsinthederivedquantitiestimeseriesrepresent95%confidenceintervals. Thevaluesplottedpriortothemodelstartyearof2012reflecttheunfishedconditionsand associated95%confidenceintervals.
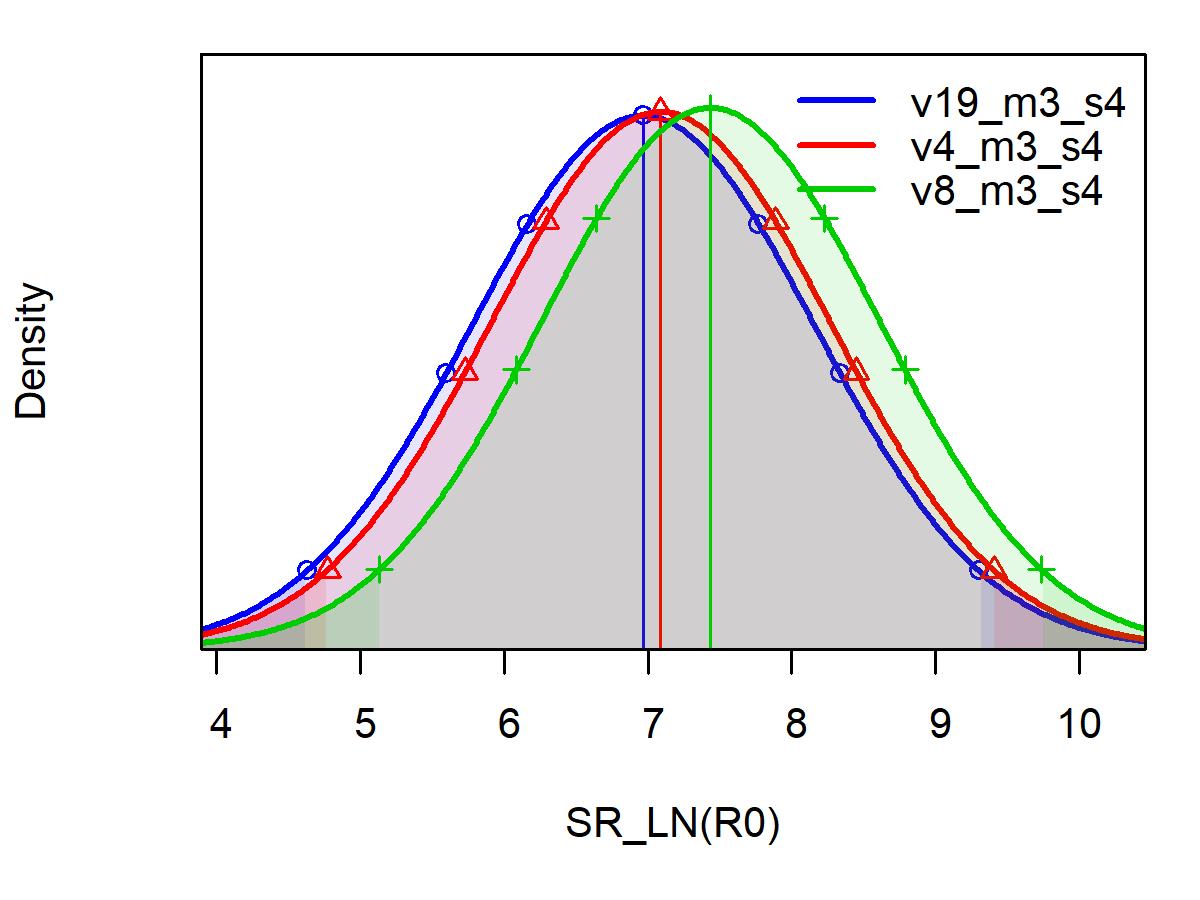
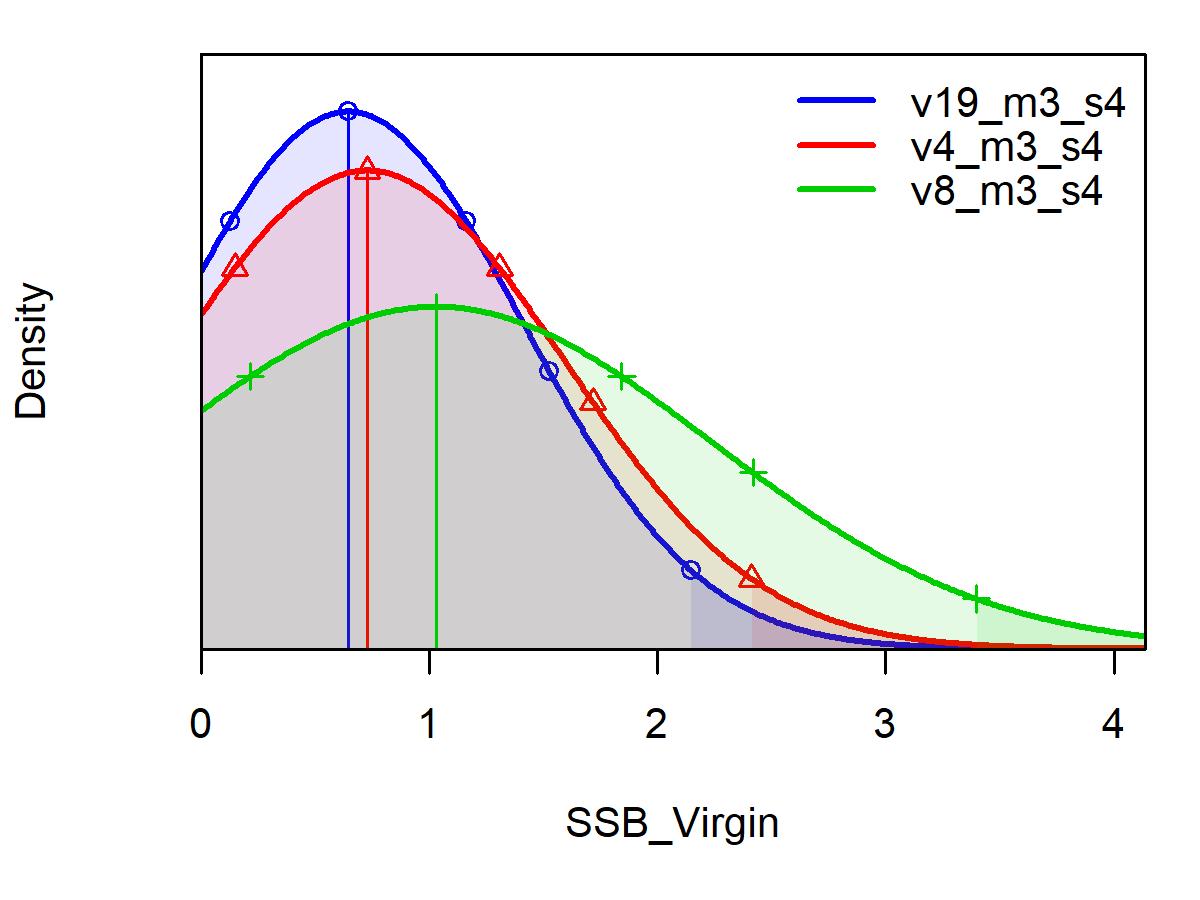
(a) Unfishedrecruitment(R0) (b) VirginSpawningStockBiomass
Figure8.20: St.ThomasandSt.JohnYellowtailSnapperparameterdistributionfor(a)the naturallogoftheunfishedrecruitmentparameteroftheBeverton–Holtstock-recruit functionand(b)virginspawningstockbiomassinmetrictonsacrossmodelscenarios (v4_m3_s4,v8_m3_s4,andv19_m3_s4).
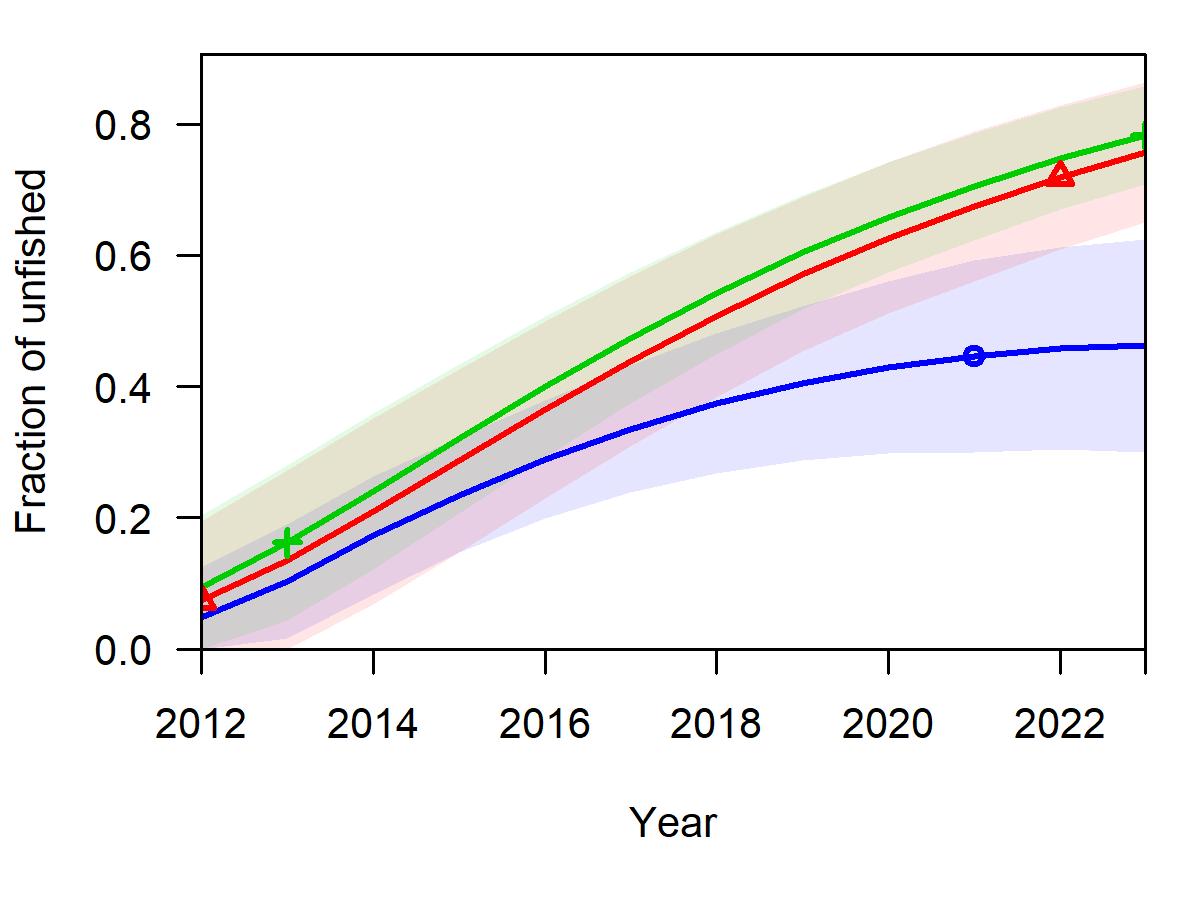
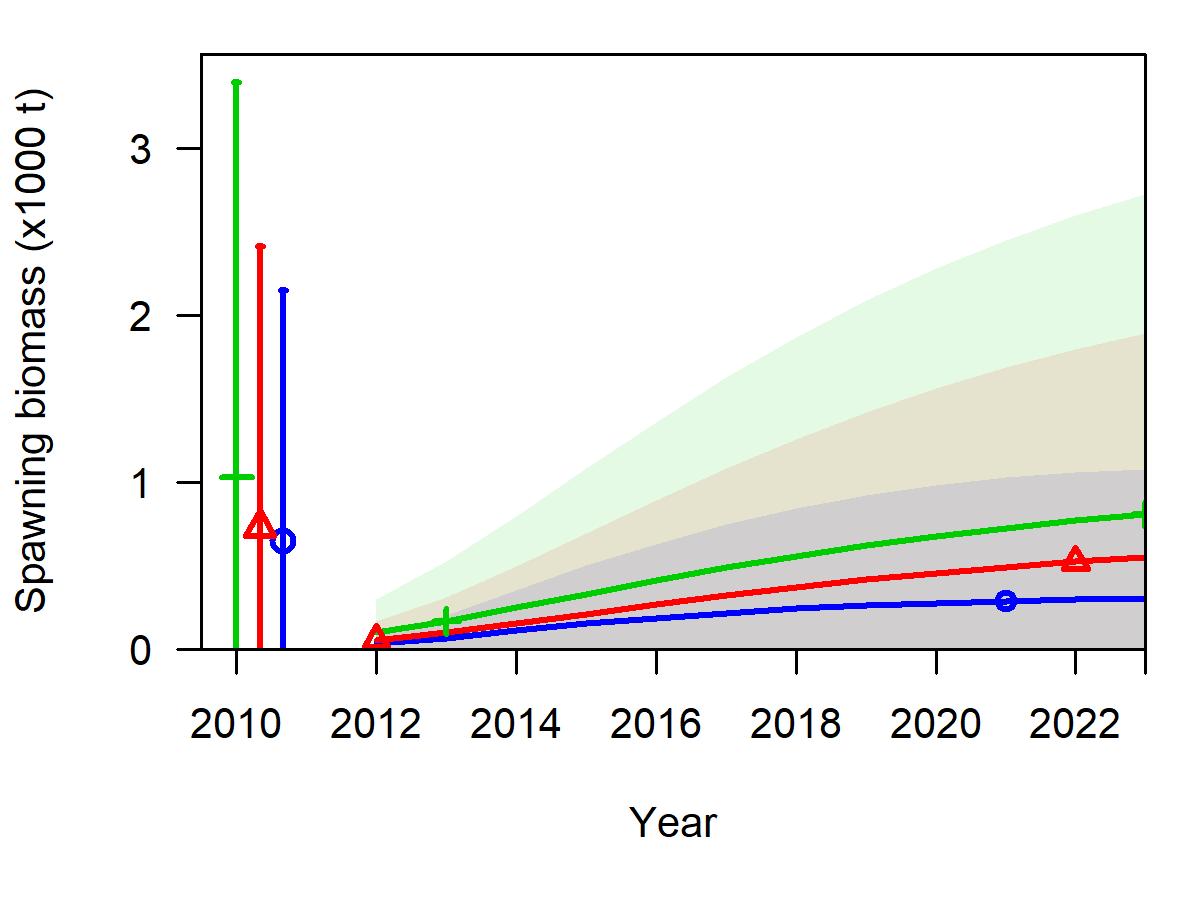
(a) SpawningBiomassRatio (b) SpawningBiomass
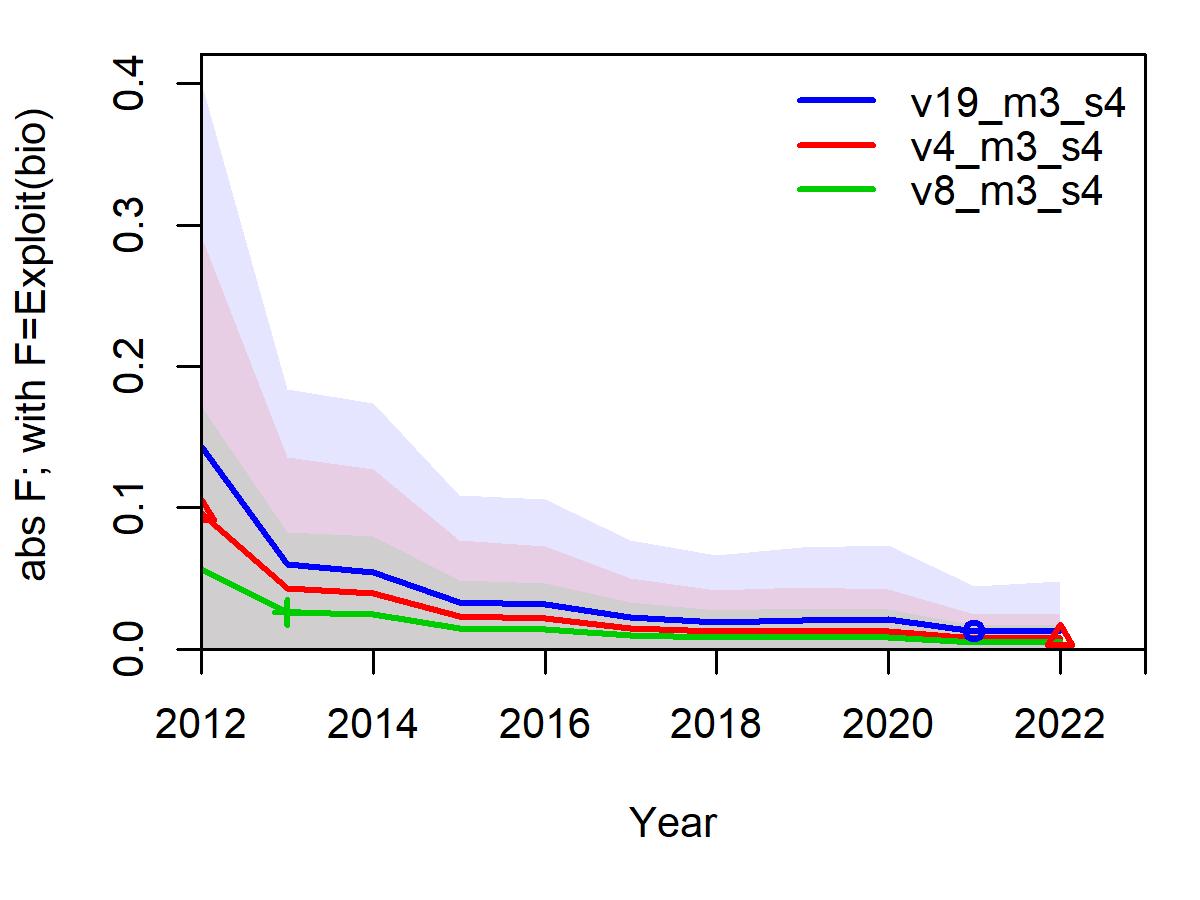
(c) FishingMortality
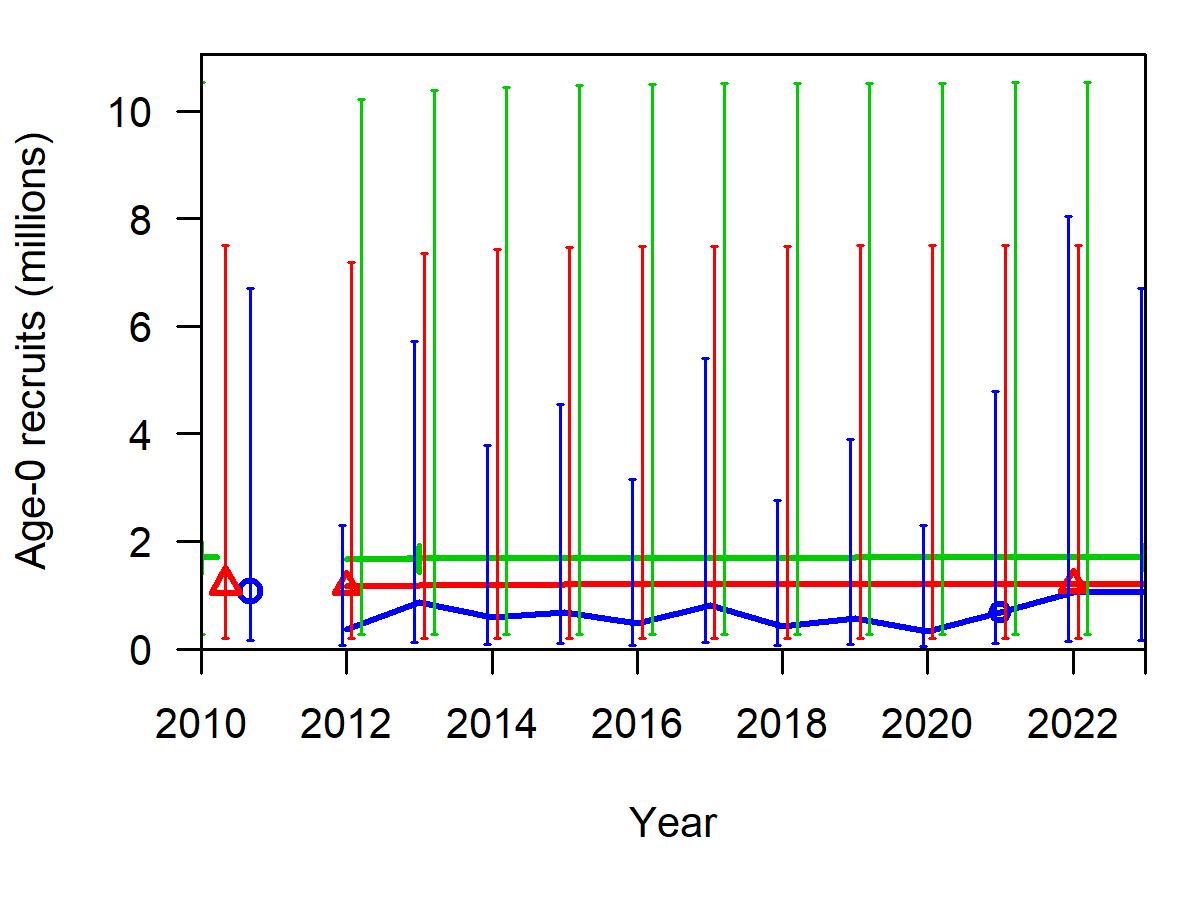
(d) Recruitment
Figure8.21: St.ThomasandSt.JohnYellowtailSnapperderivedquantitytimeseriesacross modelscenarios(v4_m3_s4,v8_m3_s4,andv19_m3_s4).Derivedquantitiesplotted overtimefor(a)therelativespawningstockbiomass(totalbiomass/virginspawning stockbiomass),(b)spawningstockbiomassinmetrictons,(c)fishingmortality(total biomasskilled/totalbiomass),(d)andrecruitmentinmillionsoffish.Theshadedareas andverticalbarsinthederivedquantitiestimeseriesrepresent95%confidenceintervals. Thevaluesplottedpriortothemodelstartyearof2012reflecttheunfishedconditionsand associated95%confidenceintervals.
References
Carvalho,F.,Winker,H.,Courtney,D.,Kapur,M.,Kell,L.,Cardinale,M.,Schirripa,M., Kitakado,T.,Yemane,D.,Piner,K.R.,Maunder,M.N.,Taylor,I.,Wetzel,C.R., Doering,K.,Johnson,K.F.,&Methot,R.D.(2021).Acookbookforusingmodel diagnosticsinintegratedstockassessments. FisheriesResearch, 240,105959. https://doi.org/10.1016/j.fishres.2021.105959 Cope,J.(2024). Stockassessmentcontinuumtool https://github.com/shcaba/SS-DL-tool Cope,J.,&Hamel,O.S.(2022).UpgradingfromMversion0.2:Anapplication-based methodforpracticalestimation,evaluationanduncertaintycharacterizationofnatural mortality. FisheriesResearch, 256,106493. https://doi.org/10.1016/j.fishres.2022.106493 Godwin,K.,Rios,A.,&Dettloff,K.(2024). SEDAR84TripInterviewProgram(TIP)Size CompositionAnalysisofYellowtailSnapper(Ocyuruschrysurus)inSt.Thomas/St. John,U.S.Caribbean,1983-2022 (SEDAR84-WP-10;p.10).SEDAR. https://sedarweb.org/documents/sedar-84-dw-10-sedar-84-trip-interview-program-tipsize-composition-analysis-of-yellowtail-snapper-ocyurus-chrysurus-in-st-thomas-st-johnu-s-caribbean-1983-2022/ Grove,L.J.W.,Blondeau,J.,&Ault,J.(2024). Fishery-IndependentReefFishVisual SurveyPopulationDensityandLengthCompositionforYellowtailSnapperinSt. Thomas/John (SEDAR84-WP-16;p.15).SEDAR. https: //sedarweb.org/documents/sedar-84-dw-16-fishery-independent-reef-fish-visual-surveypopulation-density-and-length-composition-for-yellowtail-snapper-in-st-thomas-john/ Grove,L.J.W.,Blondeau,J.,&Ault,J.S.(2021). NationalCoralReefMonitoring Program’sreeffishvisualcensusmetadatafortheU.S.Caribbean. 55. https://sedarweb.org/documents/sedar-80-wp-02-national-coral-reef-monitoringprograms-reef-fish-visual-census-metadata-for-the-u-s-caribbean/ Hamel,O.S.(2015).Amethodforcalculatingameta-analyticalpriorforthenatural mortalityrateusingmultiplelifehistorycorrelates. ICESJournalofMarineScience, 72(1),62–69. https://doi.org/10.1093/icesjms/fsu131
Hamel,O.S.,&Cope,J.M.(2022).Developmentandconsiderationsforapplicationofa longevity-basedpriorforthenaturalmortalityrate. FisheriesResearch, 256,106477. https://doi.org/10.1016/j.fishres.2022.106477
MartínezRivera,S.,Johnson,K.,&Orhun,M.R.(2024). SEDAR84Commercialfishery landingsofYellowtailSnapper(Ocyuruschrysurus)inSt.ThomasandSt.John,US Caribbean,2012-2022. (SEDAR84-WP-02;p.21).SEDAR. https: //sedarweb.org/documents/sedar-84-dw-02-sedar-84-commercial-fishery-landings-ofyellowtail-snapper-ocyurus-chrysurus-in-st-thomas-and-st-john-us-caribbean-2012-2022/
Methot,R.D.,&Wetzel,C.R.(2013).Stocksynthesis:Abiologicalandstatistical frameworkforfishstockassessmentandfisherymanagement. FisheriesResearch, 142, 86–99. https://doi.org/10.1016/j.fishres.2012.10.012
Methot,R.D.,Wetzel,C.R.,Taylor,I.G.,&Doering,K.(2020).Stocksynthesisuser manual:Version3.30.15. NorthwestFisheriesScienceCenter(U.S.). https://doi.org/10.25923/5WPN-QT71
Ono,K.,Licandeo,R.,Muradian,M.L.,Cunningham,C.J.,Anderson,S.C., Hurtado-Ferro,F.,Johnson,K.F.,McGilliard,C.R.,Monnahan,C.C.,Szuwalski,C.S., Valero,J.L.,Vert-Pre,K.A.,Whitten,A.R.,&Punt,A.E.(2015).Theimportanceof lengthandagecompositiondatainstatisticalage-structuredmodelsformarinespecies. ICESJournalofMarineScience, 72(1),31–43. https://doi.org/10.1093/icesjms/fsu007
Schemmel,E.,Bohaboy,E.C.,Kinney,M.J.,&O’Malley,J.M.(2022).Anassessmentof samplingapproachesforestimatinggrowthfromfishery-dependentbiologicalsamples.
ICESJournalofMarineScience, 79(5),1497–1514. https://doi.org/10.1093/icesjms/fsac075
SEDAR.(2019). SEDAR57StockAssessmentReportU.S.CaribbeanSpinyLobster.232. http://sedarweb.org/sedar-57 SEDAR.(2020). SEDAR64SoutheasternUSYellowtailSnapperfinalstockassessment report (p.457).SEDAR. https://sedarweb.org/documents/sedar-64-southeastern-usyellowtail-snapper-final-stock-assessment-report/ SEDAR.(2022). SEDAR80U.S.CaribbeanQueenTriggerfishPuertoRicofinalstock assessmentreport. https://sedarweb.org/documents/sedar-80-us-caribbean-queentriggerfish-puerto-rico-final-stock-assessment-report/ SEDAR.(2024). SEDAR84U.S.CaribbeanYellowtailSnapperSt.Thomas/St.Johndata workshopreport (p.46).SEDAR. https://sedarweb.org/documents/sedar-84-uscaribbean-yellowtail-snapper-st-thomas-st-john-data-workshop-report/ Shertzer,K.W.,Damiano,M.D.,&Williams,E.H.(2024).SpawningPotentialRatioCan ProvideReferencePointsforFisheryManagementThatAreRobusttoEnvironmental Variability. Fishes.https://doi.org/https://doi.org/10.3390/fishes9120497 Shervette,V.R.,RiveraHernández,J.M.,&PeñaAlvarado,N.(2024). U.S.Caribbean YellowtailSnapperPopulationDemographics,Growth,andReproductiveBiology: AddressingCriticalLifeHistoryGaps (SEDAR84-WP-08;p.29).SEDAR. https: //sedarweb.org/documents/sedar-84-dw-08-u-s-caribbean-yellowtail-snapper-populationdemographics-growth-and-reproductive-biology-addressing-critical-life-history-gaps/ Shervette,V.R.,RiveraHernández,J.M.,&Zajovits,S.(2024). AddressingCriticalLife HistoryGapsforU.S.CaribbeanYellowtailSnapper:Bombradiocarbonofageestimation methodandasummaryoftheregionaldemographicpatternsforsize,age,andgrowth (SEDAR84-WP-07;p.22).SEDAR. https://sedarweb.org/documents/sedar-84-dw-07-addressing-critical-life-history-gaps-foru-s-caribbean-yellowtail-snapper-bomb-radiocarbon-of-age-estimation-method-and-asummary-of-the-regional-demographic-patterns-for-size-age/ Taylor,I.G.,Doering,K.L.,Johnson,K.F.,Wetzel,C.R.,&Stewart,I.J.(2021).Beyond visualizingcatch-at-agemodels:Lessonslearnedfromther4sspackageaboutsoftwareto
supportstockassessments. FisheriesResearch, 239,105924. https://doi.org/10.1016/j.fishres.2021.105924
1.1 LIFE HISTORY RESEARCH RECOMMENDATIONS
Issue 1: Are sufficient life history data available?
-Life history sampling should be done with statisticians to ensure more efficient collection programs (e.g., optimizing sample sizes within size bins).
- Ensure statistically robust sample sizes of small and large size classes of fish.
1.2 COMMERCIAL FISHERY STATISTICS RESEARCH RECOMMENDATIONS
1.2.1 Commercial Landings Research Recommendations
Issue 1: Are analysis-ready commercial landings data available for SEDAR 84?
-Investigate trends in effort, significant socioeconomic and environmental events, and associated effects on the demographics, gears used, and species landed.
-Increased port sampling is needed in St. Thomas and St. John to enable analyses required for quantifying removals.
-Conduct recreational fishery port sampling surveys to determine removals due to recreational fishing.
-Investigate the applicability of hindcasting for all parrotfish combined or other applicable future assessments.
Issue 2: What should the gear fleets be for the commercial landings data?
- Investigate cases where there may be a miscommunication between databases, which can impact the gear types (i.e., hook and line unknown)
-Operationalize a gear grouping process for future SEDAR assessments.
Issue 3: How uncertain are the commercial landings from 2012 - 2022?
- No research recommendation.
Issue 4: Should data outliers in the commercial landings be flagged for additional investigation?
- Operationalize an outlier flagging process for future SEDAR assessments.
1.2.2 Length Composition Research Recommendations
Issue 1: Are analysis-ready size data available for SEDAR 84?
- Increase collection efforts to increase sample size in TIP.
- Work with port samplers and fishers to implement the trip interview program better and ensure critical fishing times are captured adequately (e.g., at night).
- Develop a data management system to link TIP to CCL. A linked system would require changing the overarching structure of collecting fishery-dependent data. A fishery information network system for the US Caribbean could comprehensively resolve this issue.
- Operationalize an outlier flagging process for future SEDAR assessments.
- Investigate if relative weight at a given length has changed across years or clusters of years.
- Examine the number of trips when considering the representativeness of TIP samples; do not limit the investigation to the number of fish or the weight of the catch, samples, and trips.
- Going forward, we need a recommendation on how to do a new sampling strategy that is more holistic.
1.3 RECREATIONAL FISHERY STATISTICS RESEARCH RECOMMENDATIONS
Issue 1: Can tournament data inform recreational removals?
- This data type would be valuable for pelagic species, like wahoo and mahi, with consistent effort and catch. Therefore, this dataset should continue to be explored and standardized for future assessments. There is consistent participation in and support for these tournaments by participants.
1.4 MEASURES OF POPULTAION ABUNDANCE RESEARCH RECOMMENDATIONS
Issue 1: Should the fishery-independent density estimates from NCRMP be used in SEDAR 84?
- Continue DCRMP work in the future.
- Look into National Parks transect data and compare it to the NCRMP data
- Provide RVC to DCRMP comparison for the 2021 year. If they are similar in that year, then what we see in 2022 is more a pulse of large fish than a difference in where the fish are.
Issue 2: Should fishery-dependent information (commercial logbooks) be considered to conduct abundance indices?
- Look into environmental patterns or fisher behavior as an assignment of CPUE or effort that we can use to look into changes in the population.
- Request for USVI fisher to provide their logbooks to further investigate the fisher behavior as an index assignment for CPUE.
2. ASSESSMENT PROCESS RESEARCH RECOMMENDATIONS
To mitigate some of the data uncertainties it is recommended to:
• Expand fishery-independent survey time series and resolution (e.g., retain and use 1-cm length bin data where available).
• Further evaluate natural mortality and growth assumptions. Collect and analyze additional life history data to evaluate the accuracy around growth and natural mortality rates.
• Conduct focused research on historical catches and fishing history to inform and constrain early model conditions.
• Consider using simpler production models or age-structured models with fixed selectivity to isolate and evaluate different data inputs.
• Develop and evaluate model ensembles or uncertainty grids to guide catch advice under different plausible scenarios.
• Investigate stock connectivity to better understand local versus regional recruitment dynamics and their implications for informing steepness.
• Research methods, including simulations, to “right-size” model complexity to match data availability, avoiding overparameterization in data-limited contexts.
• Support Management Strategy Evaluations that are robust to key uncertainties to guide harvest advice.
• Ensure the continuation of fishery-independent survey programs (e.g., National Coral Reef Monitoring Program) with consistent spatial and temporal coverage.
• Maintain and expand commercial catch monitoring programs. Expand port sampling and other fishery-dependent data collection to fill gaps in length composition and effort data.
• The use of initial catch in this assessment was intended to inform an initial starting depletion for the population. However, model evaluations show it also strongly informs maximum sustainable yield estimates. This is an undesirable outcome and additional research into how to decouple these impacts would significantly improve model result reliability.
• At the data workshop, workshop participants emphasized that federal regulations do affect retention, however there were insufficient data on the lengths of discarded fish to inform length-based retention. Explore parameterizing retention to improve selectivity of the commercial fleet and interpret the apparent high selectivity of larger individuals that are poorly estimated by the current models.
3. REVIEW PANEL RESEARCH RECOMMENDATIONS
The RP supports the research recommendations outlined in the DW and AW reports for the U.S. Caribbean Yellowtail Snapper assessment processes. Based on those recommendations, the following were identified as high priority and are listed in order of importance:
St. Thomas/St. John and Puerto Rico Yellowtail Snapper
- Short term
- Investigate the applicability of hindcasting for all parrotfish combined or other applicable future assessments (for St. Thomas/St. John commercial catch data)
- Further evaluate natural mortality and growth assumptions
- Explore the use of natural mortality at age
- Explore parameterizing retention to improve selectivity of the commercial fleet and interpret the apparent high selectivity of larger individuals that are poorly estimated by the current models.
- Request for USVI fisher to provide their logbooks to further investigate the fisher behavior as an index assignment for CPUE.
- Investigate stock connectivity to better understand local versus regional recruitment dynamics and their implications for informing steepness
- Long term
- There are several biases in the current NCRMP survey design. Notably, the survey is conducted over a limited time frame (for two weeks every two years), which would miss seasonal or environmental changes. Additionally, the survey may not be adequately capturing the full size distribution of the population (e.g., upwelling/high turbulence areas that have high density of larger fish, underrepresentation of young of the year etc.). Currently, there is limited DCRMP data, which would target larger, older fish that are in deeper waters and help complement the NCRMP survey. The RP support the following recommendations for the NCRMP and DCRMP surveys:
- Ensure the continuation of fishery-independent survey programs (e.g., National Coral Reef Monitoring Program) with consistent spatial and temporal coverage
- Expand fishery-independent survey time series and resolution
- Continue DCRMP work in the future.
- Look into National Parks transect data and compare it to the NCRMP data
- Maintain and expand commercial catch monitoring programs. Expand port sampling and other fishery-dependent data collection to fill gaps in length composition and effort data
- Increased port sampling is needed in St. Thomas and St. John to enable analyses required or quantifying removals.
- Increase collection efforts to increase sample size in TIP.
- Conduct recreational fishery port sampling surveys to determine removals due to recreational fishing.
The RP also recommends the following:
- St. Thomas/St. John and Puerto Rico Yellowtail Snapper
- Further investigate the population structure of those two stocks.
- Conduct population structure studies through genetics, tagging, fish larvae, otolith microchemistry, or modelling.
- Improve otolith samples
- Reconsider not removing old NCRMP survey data (before 2013/2014; La Parguera)

SEDAR
Caribbean Yellowtail Snapper and Stoplight
SECTION V: Review Workshop Report
August 2025 SEDAR
4055 Faber Place Drive, Suite 201 North Charleston, SC 29405
1. INTRODUCTION
1.1 WORKSHOP TIME AND PLACE
The SEDAR 84 Review Workshop was held in Fort Lauderdale, Florida July 15-18, 2025.
1.2 TERMS OF REFERENCE
1.Evaluate the data used in the assessment, addressing the following:
• Are data decisions made by the DW and AW sound and robust?
• Are data uncertainties acknowledged, reported, and within normal or expected levels?
• Are data applied properly within the assessment model?
• Are input data series reliable and sufficient to support the assessment approach and findings?
2.Evaluate the methods used to assess the stock, taking into account the available data.
• Are methods scientifically sound and robust?
• Are assessment models configured properly and used consistent with standard practices?
• Are the methods appropriate given the available data?
3.Evaluate the assessment findings with respect to the following:
• Can the results be used to inform management in the U.S. Caribbean (i.e., develop annual catch recommendations)?
• Is it likely the stock is overfished? What information helps you reach this conclusion?
• Is it likely the stock is undergoing overfishing? What information helps you reach this conclusion?
4.Comment on the degree to which methods used to evaluate uncertainty reflect and capture the significant sources of uncertainty in the population, data sources, and assessment methods. Ensure that the implications of uncertainty in technical conclusions are clearly stated.
5.Consider the research recommendations provided by the Data and Assessment workshops and make any additional recommendations or prioritizations warranted.
Clearly denote research and monitoring that could improve the reliability of, and information provided by, future assessments.
6. Provide guidance on key improvements in data or modeling approaches that should be considered when scheduling the next assessment.
7. Provide recommendations on possible ways to improve the SEDAR process.
8. Prepare a Peer Review Summary summarizing the Panel’s overall conclusions and recommendations.
1.3 LIST OF PARTICIPANTS
Review Panel
Adriana Nogueira Gassent ......................... Centro Oceanográfico de Vigo / CIE Reviewer
Elizabeth Kadison ..................................................................................... UVI/CFMC SSC
Ernesto Jardim ....................................... Independent Fisheries Consultant / CIE Reviewer
Jorge (Reni) Garcia-Sais CFMC SSC
Lisa Chong ........................................................ Michigan State University / CIE Reviewer
Vance Vicente (Chair) ..................................................... Vincent Associates / CFMC SSC
Analytic Team
Adyan Rios................................................................................................................. SEFSC
Kevin McCarthy......................................................................................................... SEFSC
Appointed Observers
Julian Magras ............................................................................................. St. Thomas DAP
Staff
Emily Ott SEDAR
Graciela Garcia-Moliner .................................................................................... CFMC Staff
Observers
Nathan Vaughan......................................................................................................... SEFSC
Observers via Webinar
Anne Kersting ............................................................................................................ NOAA
David Behring ............................................................................................................ NOAA
Gerson Martinez............................................................................................. St. Croix DAP
Jesus Rivera Hernandez ................................................................................................. USC
John Froeschke........................................................................................................... GFMC
Katherine Godwin NOAA
Kelly Klasnick ......................................................................................................... SAFMC
Maggie Rios ............................................................................................................ DPNRVI
Maria Lopez-Mercer .................................................................................................. NOAA
Nelson Crespo .................................................................................................... PR Industry
Nicole Greaux ............................................................................................................ CFMC
Rachael Silvas .......................................................................................................... SAFMC
Rachel Banton ............................................................................................................ NOAA
Refik Orhun ............................................................................................................... NOAA
Sarah Stephenson ....................................................................................................... NOAA
Sennai Habtes......................................................................................................... DPNR VI
Suz Thomas .............................................................................................................. SAFMC
Virginia Shervette .......................................................................................................... USC
1.4 LIST OF REVIEW WORKSHOP WORKING PAPERS AND DOCUMENTS
Document # Title
Authors
Documents Prepared for the Review Workshop
SEDAR84-RW01 SEDAR 84 Public Comment Public Comment 25 July 2025
Reference Documents
SEDAR84-RD14 Best practices for defining spatial boundaries and spatial structure in stock assessment
SEDAR84-RD15 Good practices, trade-offs, and precautions for model diagnostics in integrated stock assessments
2. REVIEW PANEL REPORT
Executive Summary
Steven X. Cadrina, Daniel R. Goethelb, Aaron Bergerc, Ernesto Jardimd
Maia S. Kapur a,*, Nicholas Ducharme-Barthe b, Megumi Oshima b, Felipe Carvalho b
SEDAR is organized into three main workshops. First is the Data Workshop (DW), during which fisheries, monitoring, and life history data of a fish stock are reviewed and compiled. The second is the Assessment Workshop (AW) during which assessment models are developed and population parameters are estimated using the information provided from the DW. The third step is the Review Workshop (RW), during which independent experts review the input data, assessment methods, and assessment products. The final stock assessment (which is yet completed), includes the reports of all three aforementioned stages along with all supporting documentation. The completed assessment report is then forwarded to the Council SSC (in this case the CFMC/SSC) for certification as ‘appropriate for management’ and development of specific management recommendations.
SEDAR 84 SAR SECTION V REVIEW WORKSHOP REPORT
Now we are in the third stage of the SEDAR 84 process, entitled The U.S. Caribbean Yellowtail Snapper and Stoplight Parrotfish Stock Assessment RW. This review workshop was held between July 15-18, 2025 in Fort Lauderdale, Florida, USA. The review team (or Panel) consists of the Review Panel (RP), the Analytic Team, and of appointed observers.
The RP consisted of five panel members: two CFMC/SSC members and three scientists appointed by the Center for Independent Experts (CIE). The Analytic Team consisted of two members, both from the SEFSC (NMFS). There were four Appointed Observers: three from the CFMC District Advisory Panel of St. Croix (USVI) and one from the CFMC District Advisory Panel of St. Thomas/St. John (USVI). Fourteen additional observers (via Webinar) also participated, which included three from NOAA, two from the regional office (SERO) and two Science Centers (SEFSC and SWFSC). Two staff members (one from SEDAR and one from the CFMC) and one Workshop Observer (from the SEFSC) participated in person.
SEDAR 84 addressed the stock assessments of two data-limited U.S. Caribbean species: Yellowtail Snapper (Ocyurus chrysurus) and Stoplight Parrotfish (Sparisoma viride). The Caribbean Yellowtail Snapper stock has been addressed in two earlier SEDAR stock assessment processes (i.e., in SEDAR 8 and, in SEDAR 46). In the latter, Stoplight Parrotfish stock was also included. At present, both species are classified as reef fish and managed as data-limited stocks under their respective Island Based Fisheries Management Programs.
Although both species are reef fish units, they are very different not only in their systematics, but also in their life histories (e.g., the Yellowtail Snapper is dioecious, having separate sexes), while the Stoplight Parrotfish is protandrous, a sequential hermaphrodite with three sexes). In addition, their feeding habits, their behavior, and their ecological functions differ: the Yellowtail Snapper is carnivorous and preys on the water column (e.g. on small fish and squids) as well as on benthic reef invertebrates (e.g. on decapod crustaceans).
The Stoplight Parrotfish is a macroalgal grazer (herbivorous) and equipped with pharyngeal mills for grinding seaweeds along with sediment, sand, coral, and rock. S.viride employs an excavating grazing mode, and feeds almost exclusively on algae associated with dead coral substrates. Preferred food types are large and sparse turfs growing on carbonate substrates inhabited by endolithic algae (Bruggerman et al. ).
As reported in SEDAR 46, the Yellowtail Snapper (Ocyurus chrysurus) in Puerto Rico had the highest number of recorded length measurements among finfish and the second largest average annual commercial landings. Yellowtail Snapper landings were reported from more handline fishing trips than any other species in Puerto Rico. Throughout the time series, handline has been either the first or second most reported fishing gear in the self-reported commercial logbook data from Puerto Rico.
As indicated in the SEDAR 46 process Stoplight Parrotfish in St. Croix (USVI) was the finfish with both the second most total measured lengths and the second highest average annual
commercial landings. Additional considerations supported the selection of Stoplight Parrotfish as a representative species and the diving fleet as the most appropriate fishery for tracking their abundance. Stoplight Parrotfish landings have been reported from more diving trips in St. Croix than any other finfish since species-specific reporting started in 2011. In addition, diving has been the most frequently reported fishing gear in the self-reported commercial logbook data in St. Croix since 2003. Populations of both of these species are widely distributed throughout the Wider Caribbean Region (i.e. the West Indian Biogeographic Region).
All three stocks were assessed using Stock Synthesis (SS3), an age-structured modeling platform suitable for a range of data availability. While the assessments incorporated appropriate data sources, concerns were raised regarding short time series, limited length composition data, and exclusion of historical survey years. During the RW, the RP requested several model revisions and additional runs for all three assessments. Although SS3 was implemented correctly, the quality and availability of the data were not robust enough to fully support such a complex model. Diagnostics and the additional model runs revealed sensitivities to assumptions about catch uncertainty (fits to the catch vs index data) and estimation of growth. These findings raised concerns about model structural issues or data quality issues (e.g., data conflicts), particularly for the St. Croix Stoplight Parrotfish and St. Thomas/St. John Yellowtail Snapper, where data were especially limited. Even though the Puerto Rico Yellowtail Snapper had a longer time series, the model showed similar issues, such as instability and conflicting signals across model runs and among datasets.
The RP concluded that none of the assessments were reliable enough to inform management decisions as key metrics like Spawning Potential Ratio and depletion were highly sensitive to modeling assumptions, and results varied among runs. The RP recommended further data collection, consideration of alternative modeling approaches, and reintegration of historical information. A combined Yellowtail Snapper model for St. Thomas/St. John and Puerto Rico was explored by the Analyst Team as recommended by the RP. While the model did not converge in the first attempt, the second model run converged. Despite some instability and absence of a fully diagnostic suite for the second model run, this combined model provides a promising first step towards a Yellowtail Snapper stock assessment model.
ADDRESSING THE REVIEW WORKSHOP TERMS OF REFERENCE
TOR1. Evaluate the data used in the assessment, addressing the following:
A. Are data decisions made by the DW and AW sound and robust?
Overall, some decisions made by the Data Workshop (DW) and Assessment Workshop (AW) were supported by the Review Panel (RP), and some were not.
Stock assessment models have been developed for the St. Croix Stoplight Parrotfish, St. Thomas/St. John Yellowtail Snapper and Puerto Rico Yellowtail Snapper using an appropriate approach (Stock Synthesis; SS3).
Data used for the assessments included landings data for appropriate species and gear types, length composition data from the Trip Interview Program (TIP), indices of abundance and length composition data from fisheries independent surveys, National Coral Reef Monitoring Program (NCRMP) and Deep NCRMP (DCRMP), and life history parameters including age and growth from otolith analysis, and reproduction characteristics from gonad studies.
The Analyst Team developed and applied assessments tools, however SS3 may not be compatible with the available data due to data limitations. Input data and configurations were documented, however model assumptions were not documented in the AW report. For example, the F method was not specified in the report, which needed to be changed during the Review Workshop (RW). The type of reference point/management benchmarks used were mentioned (Spawning Potential Ratio - SPR), however the Analyst Team did not define the exact values of the maximum fishing mortality threshold (MFMT) and minimum stock size threshold (MSST). The Analyst Team did not conduct any projections but also did not provide alternative management procedures (default alternative is going back to the previous approach: ratios from landings).
Below are the details for each assessment:
St. Croix Stoplight Parrotfish
For the commercial length distributions, a variety of fishing gears are used to fish for Stoplight Parrotfish. A generalized linear mixed model (GLMM) was applied to find the most representative gear group for the commercial length composition data. This seems valid. An outlier removal was conducted on the commercial landings data, which also seems valid.
It was recommended to only use commercial landings data starting in 2012 because it was not possible to hindcast the data. While the rationale is reasonable, this is concerning for the stock assessment model as the Stoplight Parrotfish has a max age of 30, and this would only give 12 years of data, which does not cover the life span of the species. Also, no CPUE index for the commercial fishery was used as diver hours were considered not the most appropriate effort measure due to divers fished for many species (i.e., multispecies trips) and the nominal catch per unit of effort (CPUE) coefficient of variation (CV) was too high.
Discard mortality is assumed to be negligible for valid reasons (nature of spearfishing). There are no recreational catch records of Stoplight Parrotfish, so recreational landings data could not be included in the model. The recreational catch of Stoplight Parrotfish is considered negligible on St. Croix as they are not easily caught by hook and line and are not targeted as a consumption or trophy fish by recreational spearfishers.
Due to the low sample size of the commercial length composition data, the decision made by DW was to combine the TIP length data across all years (i.e., super-year period) to inform selectivity in the stock assessment model. While the rationale makes sense, it is concerning that
there may not be enough information on the size structure of the population, cohort strength, and/or recruitment and mortality trends.
There are still some limitations and uncertainties about life history (e.g., age-specific natural mortality, fecundity). The maximum age was set to 30. While it seems like this could be a possibility, this should not define what the plus group will be in the assessment. It should be based on available data, which seems like it would be more appropriate to set the plus group to 10-15+.
The calibration method for the index of abundance seems valid; the calibration was used to integrate old (belt transect) and new sampling schemes (stationary point counts), account for domain changes (regionally restricted to island-wide), and estimate for gear correction factors. After calibration, a design-based estimator was applied to obtain an index of abundance. However, only three years of fisheries independent survey length composition data was applied. This seems limited for the stock assessment model, especially considering that the other source of information is from commercial length composition (which was compiled into a super-year period).
St. Thomas/St. John and Puerto Rico Yellowtail Snapper
For the Yellowtail Snapper model in St Thomas/St. John and Puerto Rico, the stock unit should have been explored further. The decision to separate the stocks was made based on administrative needs, which is common when a management system is put in place for the first time. However, the definition of the stock unit for assessment purposes needs to reflect the biology of the species and its dynamics. The management and the assessment units do not need to be the same and can be adjusted to the reality of the management process, which will be better supported if the stock assessment correctly reflects the dynamics of the stock and the reality of the fisheries exploiting the stock. Other island specific comments follow:
St. Thomas/St. John: An outlier removal was conducted on the commercial landings data, which seems valid. For the commercial length distributions, a variety of fishing gears are used to fish for Yellowtail Snapper. A GLMM was applied to find the most representative gear group for the commercial length composition data. This also seems valid.
It was recommended to only use commercial landings data starting in 2012 because it was not possible to hindcast the data. While the rationale is reasonable, this seems concerning for the stock assessment model as the Yellowtail Snapper has a max age of 26, and this would only give 12 years of data which does not cover the life span of the species. No CPUE index was used for the commercial fishery as hook hours were not considered an appropriate measure of effort.
Due to a low sample size of the commercial length composition data, the decision was to combine the TIP length data across all years to inform selectivity in the stock assessment model. While the rationale makes sense, it is concerning that there may not be enough information on the size structure of the population, cohort strength, and/or recruitment and mortality trends.
There are still some limitations and uncertainties about life history (e.g., age-specific natural mortality, fecundity), The maximum age was set to 26. While it seems like this could be a possibility, this should not define what the plus group will be in the assessment. It should be based on available data, which seems like it would be more appropriate to set the plus group 1015+ given the available data.
NCRMP data is restricted to a limited depth (30 m) so only represents shallow water fish, and the majority of the fisheries are in deeper waters (30-65 m). The DCRMP data set was used (surveys up to 45 m) to accommodate for that, however both surveys were limited in the amount of data (time series and length composition data), especially DCRMP. There were some older fisheries independent data sets that were not used which could have been applied in the stock assessment. Decisions about throwing away data should be made with considerations to the performance of the stock assessment data. Because of this decision, there were not enough length composition data and historical trends could not be seen in the index data (flat trend in the recent years when this was not the case in the overall time series).
Puerto Rico: The survey in Puerto Rico has been conducted since 2001, but only the time series from 2014 onward was used in the assessment. Although the sampling coverage before 2014 was different and only became island-wide from that year, the Panel team requested the Analyst Team to include the earlier time series as a separate index to provide information on the stock trend in the earlier years.
There are still some limitations and uncertainties about life history (e.g., age-specific natural mortality, fecundity), The maximum age was set to 26. While it seems like this could be a possibility, this should not define what the plus group will be in the assessment. It should be based on available data, which seems like it would be more appropriate to set the plus group 1015+ given the available data.
The NCRMP only covers a limited depth (30 m) and only represents shallow water fish, and the majority of the fisheries are in deeper waters (30-65 m). Older index and length data before 2014 was thrown out which could have been applied in the stock assessment. Decisions about throwing away data should be made with considerations to the performance of the stock assessment data. Because of this decision, there were not enough length composition data and historical trends could not be seen in the index data (flat trend in the recent years when this was not the case in the overall time series).
The SouthEast Area Monitoring and Assessment Program Caribbean (SEAMAP-C) data was not used as the data was not consistent in terms of methodology, so the decision to exclude this dataset was reasonable. Recreational catch data was also not used due to inconsistencies and mistrust of reporting. No CPUE index was used for the commercial fishery. There was a valid reason not to use it (i.e., gear hours were considered not the most appropriate effort measure).
B. Are data uncertainties acknowledged, reported, and within normal or expected levels?
Some uncertainties were acknowledged in the DW and AW reports, including short time series in landings reports, difficulty in quantifying fisher CPUE, distrust in commercial landings report data, limited samples of fisheries dependent (TIP) length composition data, and incomplete datasets (e.g., not capturing juvenile trends). However, other uncertainties were not acknowledged. For example; there are limitations with the NCRMP data due to seasonality and methodology to accurately capture indices of abundance for large Yellowtail Snapper or juvenile parrotfish.
In Puerto Rico, the NCRMP survey showed a huge increase in Yellowtail Snapper population density (in numbers/m2) in 2012 with high uncertainty, and the reason for this was not explained in the DW report. During the Review Workshop, it was found that this was because of a high density of fish at one the sample events in 2012. It is unclear if this was the result of the single large aggregation or an actual increase in the population (effort did shift away from fishing for Yellowtail Snapper and net bans were implemented). This increase in density was not included in the assessment model as the data started in 2014 in the assessment.
C. Are data applied properly within the assessment model?
Based on the model requirements, the best available data used was appropriately applied.
D. Are input data series reliable and sufficient to support the assessment approach and findings?
St. Croix Stoplight Parrotfish
There is a short time series for parrotfish catch reports due to a change in gear type in 2008 and difficulties in quantifying fisher CPUE due to multispecies diving trips during certain parts of the year (i.e. conch season). Additionally, there is very limited TIP length composition data (66 samples in 6 years) and an overall distrust in catch report data. These issues raised concerns about the input data series being sufficient to support such a complex assessment model like SS3.
St. Thomas/St. John Yellowtail Snapper
The data for the St. Thomas/St. John Yellowtail Snapper is also limited in the amount of data available. Without using historic landings data, the time series is limited to only 12 years, for a fish that lives 20-30 years. Using historical data requires estimating Yellowtail Snapper catch based on recent percentages in the catch of snapper and potfish since these groups were not historically separated, which would include additional uncertainty. These issues raised concerns about the input data series being sufficient to support such a complex assessment model like SS3.
Puerto Rico Yellowtail Snapper
The time series for the Puerto Rico commercial catch is longer and there is more commercial length composition data. However, there is still not enough information on a scale of the population because a lot of the historical survey data was thrown out. The survey data that was
retained (2014-2022) had a relatively flat abundance trend, which does not reflect what was seen in the historical index of abundance. There have been changes in regulations that involve size limits and gear bans, indicating that selectivity may be changing over time. This brings another challenge to the stock assessment model, especially with limited data. Moreover, there is no recreational data available in Puerto Rico and recreational fishing for Yellowtail Snapper is significant around the island.
TOR2. Evaluate the methods used to assess the stock, taking into account the available data.
A. Are methods scientifically sound and robust?
Stock Synthesis (SS3) was applied for all three stock assessments (St. Croix Stoplight Parrotfish, St. Thomas/St. John Yellowtail Snapper, and Puerto Rico Yellowtail Snapper). SS3 has been used extensively for many stock assessments across the country and is part of NOAA’s Fisheries Integrated Toolbox. This modeling tool and framework has been validated in many peer reviewed assessments and follows best practices in stock assessment. It is capable of handling a broad spectrum of model complexities, ranging from data-limited to data-rich assessments. SS3 allows for analysts to begin with a simple model structure and incrementally incorporate additional complexity as needed. For example in data-limited applications, there is a wrapper function and package (SS-DL-tool; https://github.com/shcaba/SS-DL-tool) that helps start datalimited assessments within the SS3 modeling framework by building the input files for provided data and life history information. Additionally, the model supports key biological settings, such as hermaphroditism, which is particularly relevant for the St. Croix Stoplight Parrotfish. The Analyst Team conducted an appropriate amount of diagnostic tests to test convergence, validate the model, and test key uncertainties through the r4ss R package; https://github.com/r4ss/r4ss.
B. Are assessment models configured properly and used consistent with standard practices?
Before the RW, there were some concerns about the configuration of the models in SS3. The configurations and assumptions of the models were not all documented in the AW report (e.g., fixed vs estimated parameters, which options were selected within SS3, etc). During the RW, these configurations and assumptions were clarified, and the RP made additional recommendations to explore sensitivities of these choices made by the Analyst Team. For all three assessments, there were a few changes in the configuration and inputs of SS3 during the RW:
● Modification 1: During the RW, the option to model fishing mortality in SS3 (referred to as the “F method”) was modified. The model was initially set to F method 3 (Hybrid F), which treats fishing mortality as tuning coefficients that closely match the input catch data, rather than estimating them as free model parameters. However, early model runs showed a sensitivity: the model fit the catch data tightly but poorly fit the index of
abundance. In response, the RP asked the Analyst Team to explore how different data weights on the catch and index data affected model results — using SE = 0.3 to increase the influence (tighter fit) and SE = 2 to decrease it (looser fit). To enable flexibility in fitting the catch data, the Analyst Team switched to F method 2, which uses the Baranov equation and estimates fishing mortality for each year.
● Modification 2: The standard error units for the NCRMP surveys in SS3 were incorrectly specified in the AW report, but this was fixed during the RW.
● Modification 3: The St. Thomas/St. John and Puerto Rico Yellowtail Snapper models were supposed to have a single sex configuration, but two sexes were turned on for all model runs. The Analyst Team fixed this during the RW.
New base models were created for each of the stock assessments (see Appendix 1 for list of base cases and model runs for). The additional sensitivity tests that the RP requested are also listed in Appendix 1. For all three assessments, the two most critical sensitivity tests were i) the trade-off between fitting the between the commercial catch time series versus fishery independent surveys (NCRMP, DCRMP) and ii) the estimation of growth. When the catch standard error was increased from SE = 0.3 to SE = 2, the growth parameters had to be estimated to achieve convergence.
Another concern regarding the configurations of the three assessment models was the decision to fix steepness at h = 0.99. While the Analyst Team justifies this by stating that the stocks are not a closed population and recruitment may not be strongly tied to the local spawning stock biomass, fixing steepness to 0.99 carries consequential assumptions. Fixing steepness has significant implications for derived uncertainty estimates, and it essentially assumes that recruitment is not influenced by the spawning stock biomass (i.e., random recruitment). This is a strong and questionable assumption as it could overestimate stock productivity. By removing the relationship between spawning biomass and recruitment, this approach reduces the model's sensitivity to stock depletion. During the RW, it was found that steepness could not be estimated in the models. The Analyst Team explored fixing the steepness in the combined St. Thomas/St. John and Puerto Rico Yellowtail Snapper assessment based on the value obtained from the FishLife R package (Thorson et al. 2023) (model run PR_STTJ_RW_2).
Below are the details for each assessment:
St. Croix Stoplight Parrotfish
The use of age 30+ as the plus group was questioned by the RP given the limited amount of data out to the larger length bins in the length compositions and there were not many older aged fish in the growth data (DW report figure 2.3). While this specific sensitivity was not explored for St. Croix Stoplight Parrotfish, reducing the plus group to 12+ was explored for the St. Thomas/St. John Yellowtail Snapper (STTJ_RW_3). The Analyst Team showed that there were no differences between the two plus group configurations, and therefore the configuration of plus group = 30+ was retained for Stoplight Parrotfish. After the RW, it remained unclear if other
model configurations were correctly specified based on the diagnostics (see more details in TOR 4). For example, the standard errors (SE) around the estimate of fishing mortality were high, indicating that the model was not able to estimate fishing mortality well. This could either be an indication of model misspecification or data quality issue (i.e., there is not enough contrast in the length composition data to effectively estimate fishing mortality). There was also poor convergence of F MSY . It should be noted that the Analyst Team is using SPR as the reference point for Stoplight Parrotfish, however the poor convergence of F MSY is another indication of model misspecification or data quality issues as this points to high uncertainty in the fishing mortality estimates.
St. Thomas/St. John Yellowtail Snapper
The use of dome-shaped selectivity for the two fishery-independent surveys (NCRMP and DCRMP) was questioned by the RP as this assumption has strong implications for the representation of large fish in the population and the fishery. Additionally, the choice of age 26+ as the plus group was questioned given the limited amount of data (i.e., length composition) out to the larger length bins and the smaller number of older fish in the growth data in the DW report. It appeared that the large plus group may have influenced the estimation of selectivity, so the Review Panel asked the Analyst Team to reduce the plus group (Analyst Team chose plus group = 12+) for a model run (STTJ_RW_3). The Analyst Team found no differences between the two plus group configurations, and the shape of selectivity for NCRMP and DCRMP remained unchanged. As a result, the plus group configuration of 26+ and dome-shaped selectivity were retained for Yellowtail Snapper (including the Puerto Rico Yellowtail Snapper). After the RW, it remained unclear if other model configurations were correctly specified based on the diagnostics, or issues were related to data quality (see more details in TOR 4). Similar issues to those observed with the St. Croix Stoplight Parrotfish model were evident for this model as well, including high variance around fishing mortality and recruitment estimates and poor convergence of F MSY .
Puerto Rico Yellowtail Snapper
The RP raised concerns about the use of dome-shaped selectivity for the NCRMP survey and the choice of age 26+ as the plus group. These choices were retained based on the tests and additional model runs from the St. Thomas/St. John model. After the RW, it remained unclear if other model configurations were correctly specified based on the diagnostics (see more details in TOR 4). Although this assessment included longer time series than the St. Thomas/St. John assessment, the high variance around fishing mortality and recruitment estimates suggests that the data may not be able to differentiate between these two processes, indicating a potential data quality issue. Similar issues to those observed with the St. Croix Stoplight Parrotfish and St. Thomas/St. John Yellowtail Snapper models were evident for this model as well, including high variance around fishing mortality and recruitment estimates and poor convergence of F MSY .
C. Are the methods appropriate given the available data?
St. Croix Stoplight Parrotfish
The RP was concerned about the short time series (commercial catch, length composition, index of abundance). While SS3 is a flexible and powerful stock assessment model, its performance depends on having sufficient data to inform the model. In this case, data appears insufficient to support the model’s complexity even with data-limited/moderate settings. There are too many uncertainties about key parameters (e.g., initial equilibrium catch, natural mortality, steepness, etc.) and population processes (e.g., growth, recruitment). Additionally, only five years of survey index were available, along with one super year period that includes just 66 TIP trips over the entire time series for commercial length composition (with no age composition). Even though SS3 allows length composition only configurations, SS3 is ultimately an age-structured model that converts lengths to ages, which this assessment does not have enough information or data for. Sensitivity analyses (base model m3_v7, STX_RW_1 and STX_RW_2) conducted during the Review Workshop also showed how sensitive the model outputs were to the trade-off of fits between the commercial catch and NCRMP survey and estimation of growth parameters. The two model runs also showed opposite signals in overfishing and overfished statuses, also indicating the sensitivity of the model. The data was not sufficient enough for the Analyst Team to produce a final assessment model.
St. Thomas/St. John Yellowtail Snapper
Similar to the St. Croix Stoplight Parrotfish stock assessment, the RP was concerned about the short time series and the data appears insufficient to support the complexity of SS3. There are too many uncertainties about key parameters (e.g., initial equilibrium catch, natural mortality, steepness, etc.) and population processes (e.g., growth, recruitment). Only 3-5 years of fisheryindependent survey and length composition data (NCRMP and DCRMP) were available, along with one super-year period for commercial length composition (due to low sample sizes). Even though SS3 allows length composition only configurations, SS3 is ultimately an age-structured model that converts lengths to ages, which this assessment does not have enough information or data for. Sensitivity analyses (base model m3_v19, STTJ_RW_1, STTJ_RW_2, and STTJ_RW_3) conducted during the Review Workshop also showed how sensitive the model outputs were to the trade-off of fits between the commercial catch and NCRMP + DCRMP surveys and estimation of growth parameters. Therefore, the data were not sufficient enough for them to produce a final assessment model.
Puerto Rico Yellowtail Snapper
While longer time series data were available for the Puerto Rico Yellowtail Snapper stock assessment, model diagnostics (e.g., high standard deviations on key parameters, parameters hitting bounds, poor convergence in F MSY ) indicate that either the model was not configured correctly or SS3 may still be too complex given the data quality. Although SS3 allows length composition only configurations, it is still ultimately an age-structured model that converts lengths to ages. Sensitivity analyses (base model m3_v31, PR_RW_1, PR_RW_2, PR_RW_2,
PR_RW_3, PR_RW_4) conducted during the RW showed how sensitivity model outputs were to the trade-off of fits between the commercial catch and NCRMP + NCRMP La Parguera surveys (the latter covering an older, smaller NCRMP survey domain time series from 2002-2012) and estimation of growth parameters. The RP suggested that the Analyst Team investigate combining the St. Thomas/St. John and Puerto Rico Yellowtail Snapper assessments instead of further revising the Puerto Rico assessment. Given that it is unclear if the model is sensitive because of model misspecification or data quality issues, and considering the sufficient length of data, it remains uncertain if SS3 is the appropriate model for this assessment.
TOR3. Evaluate the assessment findings with respect to the following:
A. Can the results be used to inform management in the U.S. Caribbean (i.e., develop annual catch recommendations)?
St. Croix Stoplight Parrotfish
The panel concludes that the model results cannot be used to inform management of the St. Croix Stoplight Parrotfish stock. The additional model runs requested by the reviewers highlighted that the model outcomes, in terms of assessment of stock status, was highly dependent on the decisions made about the model assumptions about catch uncertainty and estimation of the von Bertalanffy growth model parameters.
Depending on the weight assigned to the two main data streams, catch and index, and allowing the model to estimate the growth parameters, the model produced conflicting results, indicating either an underfished or overfished stock (Figure 1), along with vastly different trends in key metrics such as numbers at age and fishing mortality.
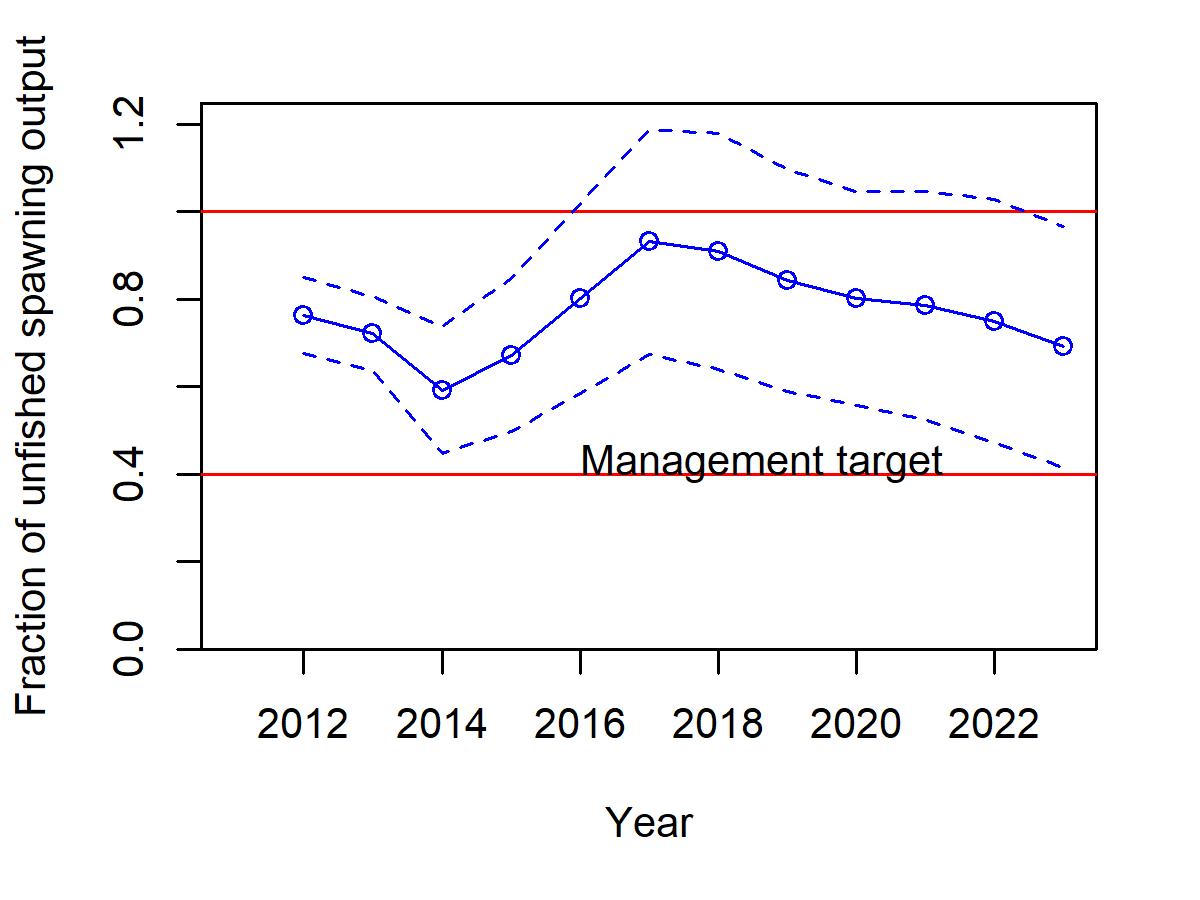
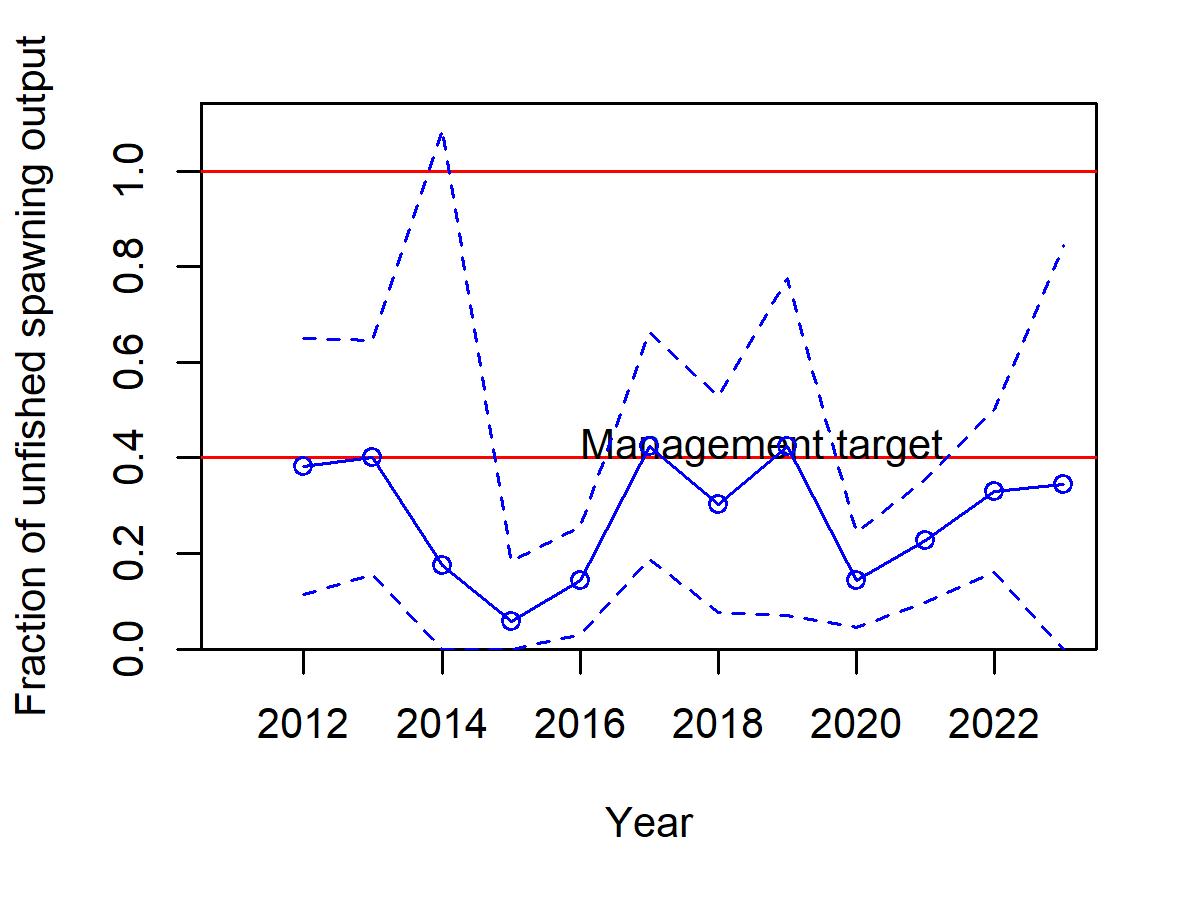
Figure 1 - Depletion level (i.e., fraction of unfished spawning output) estimated by the base run (STX_RW_1; left) and sensitivity run (STX_RW_2; right).
There were also concerning diagnostic patterns (e.g., likelihood profiles, variances in fishing mortality) that further underscore the model's instability. Given the limited datasets, there was a
conflict among the index, length compositions, and commercial catch data, which contributed to the challenges in the assessment model and cannot be easily resolved.
Moreover, the current management framework is based on setting fishing opportunities for a species complex, which includes two indicator species, Stoplight and Redtail Parrotfish, neither of which is currently assessed using analytical models. Incorporating an analytical assessment for Stoplight Parrotfish alone would require adjustments to the management framework to accommodate the use of such results for only one species, which is not a straightforward task.
The panel is unaware of whether and how the management system might be modified to allow for this, adding further uncertainty to the feasibility of using the current results for management purposes. As mentioned in ToR 2, SS3 seems too complex for this stock and fishery. The panel suggests that data poor methods may be more appropriate and in line with the data available, the size of the fishery, and the stock.
St. Thomas/St. John Yellowtail Snapper
The assessment was undermined by a short and fragmented time series across key data streams: length composition, survey indices, and commercial catches, which limited the ability of the model to characterize population dynamics robustly. Furthermore, the stock unit definition remains uncertain, adding another layer of ambiguity that could lead to spurious or misleading model outcomes.
Diagnostic outputs such as likelihood profiles, jitter analyses, and estimated variances in fishing mortality and recruitment revealed instability and sensitivity within the model. The model was highly dependent on the relative fits between catch data and the index of abundance, as well as assumptions around growth estimation. The two primary fishery-independent survey datasets (NCRMP and DCRMP), had conflicting signals and cannot be reconciled within the current modeling framework without arbitrarily favoring one dataset over the other.
While the three current model runs converged to a similar SPR and fishing intensity (1-SPR), suggesting the stock is not overfished nor undergoing overfishing, the second model run, which integrates higher catch standard errors and growth estimation (run code STTJ_RW_2), showed high uncertainty in SPR values and oscillated between overfished and underfished statuses before 2022 (Figure 2). Additionally, temporal trends in overfished status were inconsistent between model runs.
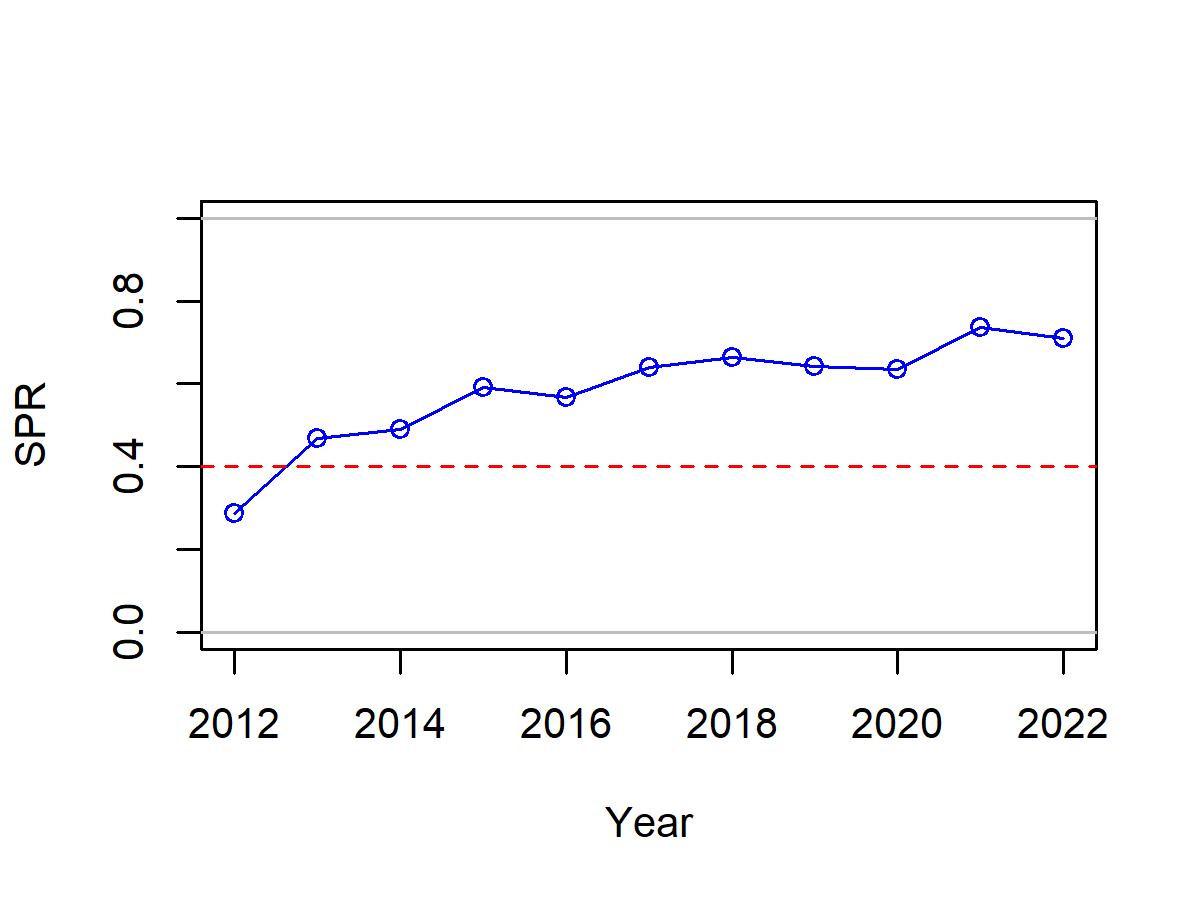
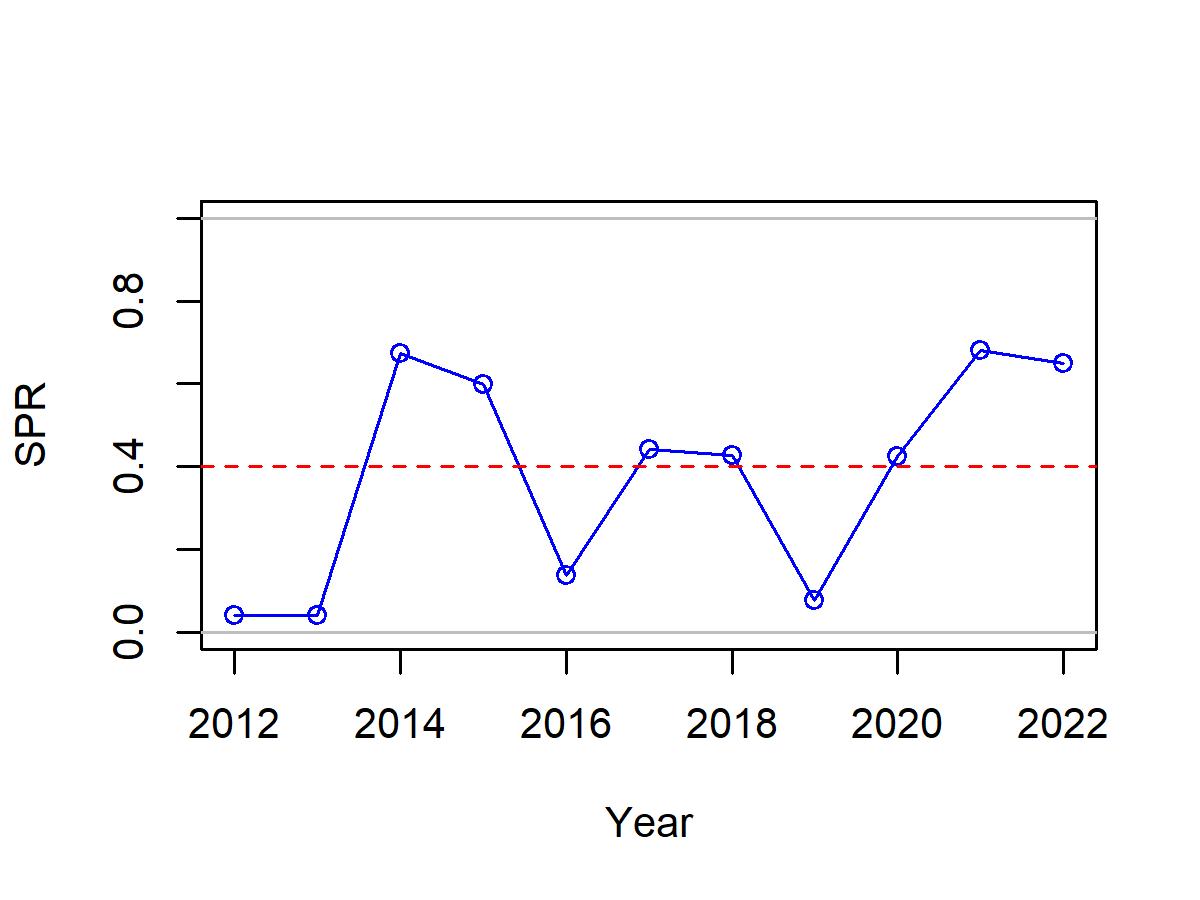
Figure 2 - Spawning Potential Ratio (SPR) estimated by the base run (STTJ_RW_1; left) and sensitivity run (STTJ_RW_2; right) .
Given these limitations, the assessment results are not sufficiently robust to support the development of reliable annual catch limits or other management measures for the U.S. Caribbean region.
Puerto Rico Yellowtail Snapper
The current assessment for Puerto Rico Yellowtail Snapper does not support the development of annual catch recommendations for management in the U.S. Caribbean. Despite having a longer time series compared to the St. Thomas/St. John assessment, the model exhibited instability and high sensitivity, as demonstrated by diagnostic tools such as likelihood profiles, jitter analyses, and large variances in estimated fishing mortality and recruitment. These indicators raised concerns about the model's internal coherence and its ability to provide reliable stock status estimates.
While the issue of stock unit definition is less severe than in the St. Thomas/St. John assessment, due in part to better spatial coverage by the modeled platform, the stock unit definition still contributed to assessment uncertainty. The model also faced unresolved conflicts between different data sources, particularly between commercial catch data, length composition, and the fishery-independent survey.
Although all four model runs converged to a similar SPR and fishing intensity, roughly around the management target, this convergence masked significant historical variability, including periods of overfishing and overfished status. Of particular concern is the second model run (PR_RW_2), which incorporated higher uncertainty in catch estimates and growth parameters; it demonstrated high uncertainty in SPR and depletion estimation (Figure 3).
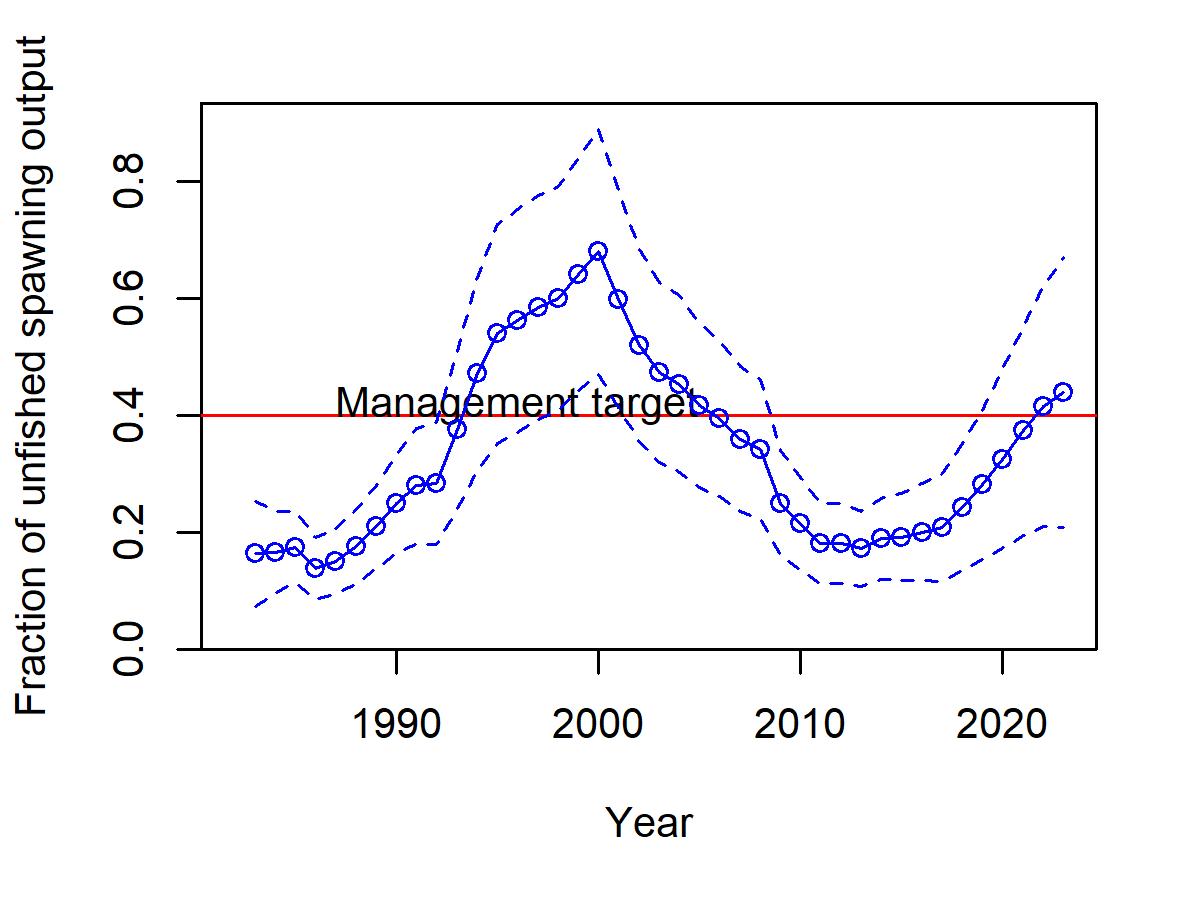
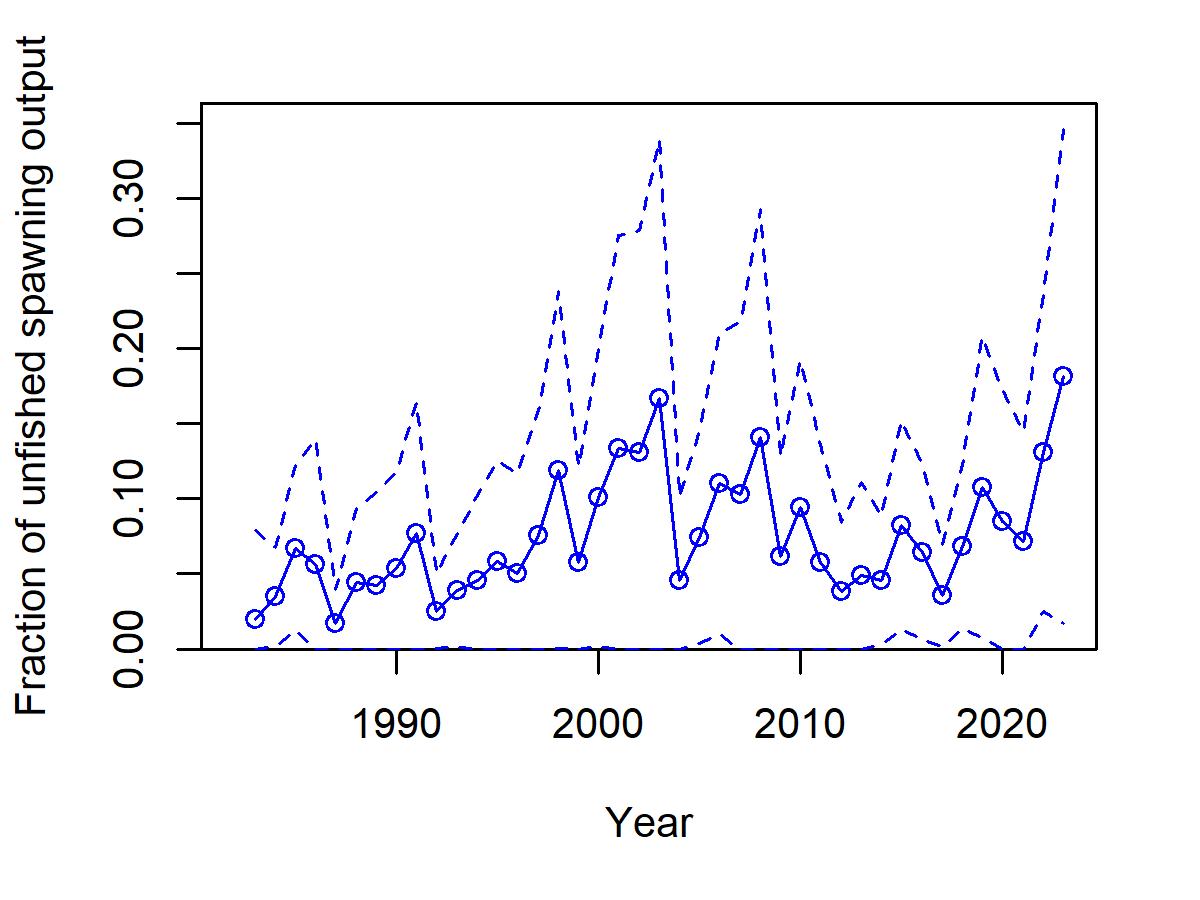
Figure 3 - Depletion level (i.e., fraction of unfished spawning output) estimated by the base run (PR_RW_1; left) and sensitivity run (PR_RW_2; right)
Overall, the combination of model sensitivity to assumptions, data conflicts, and uncertain historical trends limits the assessment’s utility for informing robust, science-based management measures.
B. Is it likely the stock is overfished? What information helps you reach this conclusion?
St. Croix Stoplight Parrotfish
Unknown, the results are too sensitive to model assumptions to allow for a conclusion about this topic. See TOR 2 and TOR 4.
St. Thomas/St. John Yellowtail Snapper
Unknown, the results are too sensitive to model assumptions to allow for a conclusion about this topic. See TOR 2 and TOR 4.
Puerto Rico Yellowtail Snapper
Unknown, the results are too sensitive to model assumptions to allow for a conclusion about this topic. See TOR 2 and TOR 4.
C. Is it likely the stock is undergoing overfishing? What information helps you reach this conclusion?
St. Croix Stoplight Parrotfish
Unknown, the results are too sensitive to model assumptions to allow for a conclusion about this topic. See TOR 2 and TOR 4.
St. Thomas/St. John Yellowtail Snapper
Unknown, the results are too sensitive to model assumptions to allow for a conclusion about this topic. See TOR 2 and TOR 4.
Puerto Rico Yellowtail Snapper
Unknown, the results are too sensitive to model assumptions to allow for a conclusion about this topic. See TOR 2 and TOR 4.
TOR4. Comment on the degree to which methods used to evaluate uncertainty reflect and capture the significant sources of uncertainty in the population, data sources, and assessment methods. Ensure that the implications of uncertainty in technical conclusions are clearly stated.
SS3 includes a set of standard approaches to investigate uncertainties. These tools were applied and presented in the assessment report, and a standard set of diagnostics was used to evaluate model stability for the three stocks. These diagnostics included checks for convergence, correlation analysis, variance evaluation, jitter analysis, residuals analysis, retrospective analysis, and likelihood profiles. Additionally, sensitivity runs were conducted. The base models from the AW were modified during the RW due to configuration errors that were identified (see TOR 2). In addition, a new model combining the two Yellowtail Snapper stocks, following the RP recommendations, was developed and presented on the third day of the meeting. Note that the full set of diagnostics were not updated for the new base models agreed upon during the RW, and nor for the combined model.
US Caribbean Stoplight Parrotfish
During the meeting, the model m3_v7 was presented as the base model, and the methods used to evaluate uncertainty were appropriately applied and explained. However, the model was found to be highly sensitive and not found appropriate to use as a basis for advice, making it difficult to isolate and clearly identify the most influential sources of uncertainty. Several key uncertainties were identified during the RW, particularly concerning initial equilibrium catch, natural mortality (M), and steepness. The model showed strong sensitivity to these parameters. A full set of diagnostics was presented.
Although the model converged successfully and the jitter analysis appeared satisfactory, other diagnostics revealed structural and data-related concerns. A strong correlation was observed between commercial selectivity parameters, whether it is unclear if this is biologically plausible or driven by the model’s tendency to produce knife-edge selectivity. The retrospective pattern showed poor performance, and the likelihood profiles indicated a conflict between the equilibrium catch and the length composition data. The model struggled to reliably estimate equilibrium catch, suggesting that the data may provide limited information on this parameter.
While the fits to the length composition data were reasonably good, the model was unable to simultaneously fit both the commercial catch data and the survey index of abundance well.
During the RW, efforts were made to clarify assumptions related to population dynamics and model configuration, which had been unclear in earlier documentation. The RP recommended several sensitivity analyses, particularly focusing on assumptions around catch uncertainty (i.e., standard errors), growth parameters, and selectivity formulations. These were appropriate steps for testing the model; however, time constraints limited exploration of additional uncertainties, such as estimating fixed parameters (e.g., catchability) or testing alternative model structures.
The new base model agreed upon during the RW, including the modifications described in the section above (see TOR 2; a single-sex structure, F method 2, and corrected survey SE) still showed high sensitivity to assumptions about catch uncertainty and the estimation of von Bertalanffy growth parameters. The model was sensitive to assumptions about growth and the estimation of length at age likely due to the absence of age composition data. Notably, estimates of stock status differed across sensitivity runs (indicating overfished vs. underfished conditions), which further complicates interpretation.
In summary, while appropriate diagnostics and sensitivity runs were conducted, the combination of model instability and interacting uncertainties made it difficult to confidently attribute outcomes to specific sources. This makes it difficult to reach clear conclusions due to the various sources of uncertainty. Further investigation of model assumptions, alternative parameterizations, and potential data conflicts is necessary.
St. Thomas/St. John Yellowtail Snapper
Prior to the RW some concerns were raised about the model configuration, and on the first day of the meeting the RP requested modification to the base model. In the RW, model m3_v19 was presented as the base model, and the diagnostics (without the modifications) to evaluate uncertainty were appropriately applied in the assessment report. These modifications (a singlesex structure, F method 2, and corrected survey SE) are specified in TOR 2. The new base model was presented the second day of the meeting, and sensitivity runs are documented in Appendix 1. This model was found to be highly sensitive, making it difficult to isolate and clearly identify the most influential sources of uncertainty. Several key uncertainties were identified during the RW particularly concerning initial equilibrium catch, natural mortality (M), and steepness. The model showed strong sensitivity to these parameters. The time series was too short and there was conflict between both surveys.
The full set of diagnostics for model m3_v19 are documented in the assessment report. While the model converged, the jitter test showed instability, since it did not consistently converge to the same maximum likelihood estimate (MLE), indicating misspecification or conflicting data. The
likelihood profile for equilibrium catch showed signs of instability, and indicated a conflict between the equilibrium catch and the length composition and index datasets. There were poor retrospective patterns as well.
The new base model was also found to be highly sensitive. It was unable to simultaneously fit the catch and the survey data. Model runs STTJ_RW_1 (SE = 0.3) and STTJ_RW_2 (catch SE = 2 and estimated growth) showed a strong correlation among the commercial selectivity parameters. Additionally, there was poor convergence in Fmsy, suggesting that the data may not provide enough contrast to estimate fishing mortality. There was a conflict between the two fishery-independent surveys and also between commercial catch and length compositions indicating uncertainty in the population trends. In STTJ_RW_3, a sensitivity run explored a 12+ plus group thinking that it will improve the selectivity estimation, but no differences were found. At the end of the meeting, it remained uncertain whether other configurations were appropriate.
In summary, the combination of model instability and interacting uncertainties made it difficult to confidently attribute outcomes to specific sources. As a result, drawing clear conclusions remains challenging. To address this, improvements in data quality, increased data collection, extension of the time series and combining this stock with Puerto Rico are recommended.
Puerto Rico Yellowtail Snapper
Similar to the St. Thomas/St. John assessment, concerns on the model configurations for the Puerto Rico stock were detected previous to the RW and the same changes to the base model were requested (a single-sex structure, F method 2, and corrected survey SE ). The new base model was presented as the base model. However, the model was found to be highly sensitive and not found appropriate to use as a basis for advice, making it difficult to isolate and clearly identify the most influential sources of uncertainty. Also several key uncertainties were identified during the RW in key parameters concerning initial equilibrium catch, natural mortality (M), and steepness and population processes (growth, recruitment).
The full set of diagnostic is found in the assessment report for the initial base model m3_v31, indicating incorrect configuration of the model or problems with the quality of data.While the model converged, the jitter analysis showed instability, the likelihood profiles showed instability in the total and equilibrium catch, and the retrospective revealed different patterns at the terminal year estimates.
Four different sensitivity analyses detailed in Appendix 1 were conducted and presented during the RW. Although the time series was extended, the older survey data were excluded, and only the 2014-2022 series was retained. A key suggestion was to reintroduce the historical time series (as a separate survey since the coverage was different); however, the corresponding sensitivity run (PR_RW_3) failed to converge. Overall, the sensitivity runs showed high sensitivity in models outputs. Additionally, strong correlation among growth parameters was found, indicating
that growth could not be reliably estimated. There was also evidence of conflict between catch, length composition and survey indices indicating uncertainty in the population trends.
In summary, the combination of model instability and interacting uncertainties made it difficult to confidently attribute outcomes to specific sources. As a result, drawing clear conclusions remains challenging. To address this, improvements in data quality, increased data collection, extension of the time series and combining this stock with St. John/St.Thomas are recommended.
Combined St.Thomas/St John/Puerto Rico Yellowtail Snapper
The RP recommended building a combined model using data from both St. Thomas/St. John and Puerto Rico due to uncertainties in the model structure, the recognition that the stocks from St. Thomas/St. John and Puerto Rico are part of a larger population, the short time series available for the stock in St. Thomas/St. John, and looking into the survey índices that peaked in 2012 in Puerto Rico and in 2013 in St. Thomas/St. John. Efforts were initiated, presented and discussed during the RW. While the first combined model run (PR_STTJ_RW_1) did not converge, a second attempt (PR_STTJ_RW_2, fixed selectivity and steepness) successfully converged.
Despite showing some instability, and without evaluating the full set of diagnostics, this run provided a good first step to developing a stock assessment model for the Yellowtail Snapper stock in St.Thomas/St John and Puerto Rico to inform management of this fishery in the U.S. Caribbean. Results of this can be found in the Addendum of the AW report.
TOR5. Consider the research recommendations provided by the Data and Assessment workshops and make any additional recommendations or prioritizations warranted. Clearly denote research and monitoring that could improve the reliability of, and information provided by, future assessments.
The RP supports the research recommendations outlined in the DW and AW reports for the U.S. Caribbean Stoplight Parrotfish and Yellowtail Snapper assessment processes. Based on those recommendations, the following were identified as high priority and are listed in order of importance:
St. Croix Stoplight Parrotfish
- Short term
- Investigate the applicability of hindcasting for all parrotfish combined or other applicable future assessments.
- For example, the proportion of Stoplight Parrotfish could be investigated from 2012, and a mean of that proportion could be applied to split the catches prior to the species-specific split
- Conduct focused research on historical catches and fishing history to inform and constrain early model conditions
- Further evaluate natural mortality and growth assumptions
- Explore the use of natural mortality at age
- Investigate the relationship between the catch and effort of the diving data to document the disconnect between time diving and species-specific targeted effort for species considered bycatch or opportunistically targeted.
- Investigate stock connectivity to better understand local versus regional recruitment dynamics and their implications for informing steepness
- Long term
- Ensure statistically robust sample sizes of small and large size classes of fish
- Maintain and expand commercial catch monitoring programs. Expand port sampling and other fishery-dependent data collection to fill gaps in length composition and effort data.
- Increase collection efforts to increase sample size in TIP
- There are several biases in the current NCRMP survey design. Notably, the survey is conducted over a limited time frame (for two weeks every two years), which would miss seasonal or environmental changes. Additionally, the survey may not be adequately capturing the full size distribution of the population (e.g., upwelling/high turbulence areas that have high density of larger fish, underrepresentation of young of the year etc.). The RP support the following recommendations for the NCRMP survey:
- Ensure the continuation of fishery-independent survey programs (e.g., National Coral Reef Monitoring Program) with consistent spatial and temporal coverage
- Expand fishery-independent survey time series and resolution
- Investigate the potential impact of changes in habitat on the surveys.
- There is an association between the habitat and fish, but we should consider whether the habitat changes the spatial distribution of fish.
- Investigate highly turbid areas that are currently not surveyed.
- Expand fishery-independent surveys to seagrass/mangrove habitats since these areas are essential for recruitment.
- Conduct recreational fishery port sampling surveys to determine removals due to recreational fishing
St. Thomas/St. John and Puerto Rico Yellowtail Snapper
- Short term
- Investigate the applicability of hindcasting for all parrotfish combined or other applicable future assessments (for St. Thomas/St. John commercial catch data)
- Further evaluate natural mortality and growth assumptions
- Explore the use of natural mortality at age
- Explore parameterizing retention to improve selectivity of the commercial fleet and interpret the apparent high selectivity of larger individuals that are poorly estimated by the current models.
- Request for USVI fisher to provide their logbooks to further investigate the fisher behavior as an index assignment for CPUE.
- Investigate stock connectivity to better understand local versus regional recruitment dynamics and their implications for informing steepness
- Long term
- There are several biases in the current NCRMP survey design. Notably, the survey is conducted over a limited time frame (for two weeks every two years), which would miss seasonal or environmental changes. Additionally, the survey may not be adequately capturing the full size distribution of the population (e.g., upwelling/high turbulence areas that have high density of larger fish, underrepresentation of young of the year etc.). Currently, there is limited DCRMP data, which would target larger, older fish that are in deeper waters and help complement the NCRMP survey. The RP support the following recommendations for the NCRMP and DCRMP surveys:
- Ensure the continuation of fishery-independent survey programs (e.g., National Coral Reef Monitoring Program) with consistent spatial and temporal coverage
- Expand fishery-independent survey time series and resolution
- Continue DCRMP work in the future.
- Look into National Parks transect data and compare it to the NCRMP data
- Maintain and expand commercial catch monitoring programs. Expand port sampling and other fishery-dependent data collection to fill gaps in length composition and effort data
- Increased port sampling is needed in St. Thomas and St. John to enable analyses required or quantifying removals.
- Increase collection efforts to increase sample size in TIP.
- Conduct recreational fishery port sampling surveys to determine removals due to recreational fishing.
The RP also recommends the following:
- St. Croix Stoplight Parrotfish
- Conduct population structure studies through genetics, tagging, fish larvae, otolith microchemistry, or modelling.
- Improve otolith samples
- St. Thomas/St. John and Puerto Rico Yellowtail Snapper
- Further investigate the population structure of those two stocks.
- Conduct population structure studies through genetics, tagging, fish larvae, otolith microchemistry, or modelling.
- Improve otolith samples
- Reconsider not removing old NCRMP survey data (before 2013/2014; La Parguera)
TOR6. Provide guidance on key improvements in data or modeling approaches that should be considered when scheduling the next assessment.
Key improvements in data or modeling approaches are:
US Caribbean Stoplight Parrotfish
- If there are enough otolith samples, try to convert length compositions into ages. The conditional age-at-length approach in SS3 allows the incorporation of length and age data whenever available.
- Consider the entire stock complex rather than single species for stock assessment
- Increase the time series for all key data streams: commercial catch, commercial length compositions, NCRMP index of abundance, and NCRMP length compositions
- Consider using model-free approaches (e.g., harvest control rules based on life history and/or fisheries data) or data-limited methods
US Caribbean Yellowtail Snapper
- If there are enough otolith samples, try to convert length compositions into ages. The conditional age-at-length approach in SS3 allows the incorporation of length and age data
- Consider using model-free approaches (e.g., harvest control rules based on life history and/or fisheries data) or data-limited methods
- Explore model-based approaches for analyzing index data, such as spatial-temporal models
- Potential to combine the NCRMP indices from both islands.
- Combine the St. Thomas/St. John and Puerto Rico assessments: This combined SS3 model seems like a good path forward for future assessments. Right now, this combined model cannot be used for management advice because of the instability and sensitivity of the model. With further tweaking of model configurations, it may be possible to obtain a converged, stable model.
TOR7. Provide recommendations on possible ways to improve the SEDAR process.
The SEDAR process was well organized and the meeting was efficient. All background material was provided to the RP on time (two weeks before the workshop). The RP suggests a review of the current terms of references to avoid questions that are not possible to answer. For example for TOR 3a, it asks if the results can be used to inform management (i.e., develop annual catch recommendations). However, the RP cannot provide a response to this as the RW focused primarily on the stock assessment and any comments related to the management procedure fall outside the scope of the assessment. The RP also suggests including additional stock assessment experts in all the workshops, including the DW. Those experts would have helped validate the amount of data that would need to be retained for the stock assessment. For example for the St. Thomas/St. John and Puerto Rico Yellow Snapper assessment, a lot of historical survey data was thrown away due to issues with the different survey domains (regionally restricted to islandwide) and different sampling schemes (belt transect vs stationary point counts) even though a calibration analysis was conducted to integrate these changes and compiled a single index of abundance (Grove et al. 2022).
TOR8. Prepare a Peer Review Summary summarizing the Panel’s overall conclusions and recommendations.
This report completes the task in TOR8.
References
Bruggemann, J. H., van Oppen, MJH., & Breeman, A. M. (1994). Foraging by the stoplight parrotfish Sparisoma viride. I. Food selection in different, socially determined habitats . Marine Ecology Progress Series, 106(1-2), 41-55. https://doi.org/10.3354/meps106041.
Grove, L.J.W., Blondeau, J., & Ault, J.S. (2022). Fishery-Independent Reef Fish Visual Survey Population Density and Length Composition for Queen Triggerfish in the U.S. Caribbean. SEDAR80-WP-08. SEDAR, North Charleston, SC. 32 pp.
Thorson, J. T., Maureaud, A. A., Frelat, R., Mérigot, B., Bigman, J. S., Friedman, S. T., ... & Wainwright, P. (2023). Identifying direct and indirect associations among traits by merging phylogenetic comparative methods and structural equation models. Methods in Ecology and Evolution, 14(5), 1259-1275.
Appendix 1
Table A1. List of stock assessment model runs developed during the SEDAR 84 Review Workshop (RW).
Model Name Description
STX_RW_1
STX_RW_2
STTJ_RW_1
STTJ_RW_2
STTJ_RW_3
PR_RW_1
PR_RW_2
PR_RW_3
PR_RW_4
PR_STTJ_RW_1
PR_STTJ_RW_2
single sex + F method 2 + catch standard error = 0.3 + corrected survey standard error
STW_RW_1 + catch standard error = 2 + estimated growth
single sex + F method 2 + catch standard = 0.3 + corrected survey standard error
STTJ_RW_1 + catch standard error = 2 + estimated growth
STTJ_RW_1 + plus group = 12+
Single sex + F method 2 + catch standard error = 0.3 + corrected survey standard error
PR_RW_1 + catch standard error = 2 + estimated growth
PR_RW_1 + La Paraguera survey + selectivity spline
PR_RW_3 + estimated growth
PR_RW_3 + STTJ fleet and STTJ survey
PR_STTJ_RW_1 + estimated length at maximum age + fixed selectivity + steepness = 0.8
For the Stoplight Parrotfish in St. Croix (STX), the initial model used a single-sex configuration and applied F method 2 (Baranov continuous F) with corrected standard error units for the National Coral Reef Monitoring Program (NCRMP) survey (STW_RW_1) and catch standard error of 0.3. The second model run for Stoplight Parrotfish (STW_RW_2) applied an increased standard error on catch (SE = 2) and estimated growth parameters (growth coefficient and mean length at maximum age).
For the Yellowtail Snapper in St. Thomas and St. John (STTJ), the initial model used a singlesex configuration and applied F method 2 (Baranov continuous F) with corrected standard error units for the National Coral Reef Monitoring Program (NCRMP) survey (STTJ_RW_1) and catch standard error of 0.3. The second model run for St. Croix Yellowtail Snapper (STTJ_RW_2) applied an increased standard error on catch (SE = 2) and estimated growth parameters (growth coefficient and mean length at maximum age). The third model run for St.
Thomas and St. John Yellowtail Snapper (STTJ_RW_3) explored the use of a plus group at age 12.
For the Yellowtail Snapper in Puerto Rico (PR), the initial model used a single-sex configuration and applied F method 2 (Baranov continuous F) with corrected standard error units for the National Coral Reef Monitoring Program (NCRMP) survey (PR_RW_1) and catch standard error of 0.3. The second model run for Puerto Rico Yellowtail Snapper (PR_RW_2) applied an increased standard error on catch (SE = 2) and estimated growth parameters (growth coefficient and mean length at maximum age). The third model run for Puerto Rico Yellowtail Snapper (PR_RW_3) included a survey corresponding to the spatially restricted years of the NCRMP (La Parguera) and a combination of splines and time blocks to model commercial selectivity. The fourth model (PR_RW_4) built on the third model run with estimated growth parameters (growth coefficient and length at maximum age).
The St. Thomas and St. John and Puerto Rico Yellowtail Snapper models were developed with combined data (PR_STTJ). This included two commercial fleets and five surveys (two historical surveys, two NCRMP, and one DCRMP; PR_STTJ_RW_1). The second model run (PR_STTJ_RW_2) built on the first model run with fixed selectivity and steepness (value = 0.8 obtained from the FishLife R package) and estimated length at maximum age.
SEDAR
1Introduction
Thisaddendumprovidessupplementaryanalysesdevelopedindirectresponsetorequests madebytheSEDAR84ReviewWorkshopPanel.Themodelrunsandplotspresentedhere buildontheconfigurationsdocumentedintheSEDAR84AssessmentProcessReportforUS CaribbeanYellowtailSnapperinSt.ThomasandSt.John,USVI.
TheadditionalmodelrunsconductedduringtheReviewWorkshopareintendedto documentexploratoryworkthatmayinformnextstepstowardrefiningtheassessment frameworkforconsiderationbytheCaribbeanFisheryManagementCouncil’sScienceand StatisticalCommittee(SSC).
OnlythemodelrunsreviewedbythepanelduringtheReviewWorkshopareincludedinthis addendum.Whileadditionalexploratoryanalysescouldbepursued(e.g.,steepnessvalues informedbyFishBaseratherthanassumingsteepnessnear1),thesewerenotexamined duringtheworkshop.FutureworktobeconsideredbytheSSCwillintegratefurtherpanel recommendationsandadditionalsensitivityanalysesoncetheReviewWorkshopReportis finalized.
2KeyConsiderations
• AllmodelrunsincludedhereweredevelopedunderthedirectionoftheReview WorkshopPaneltoexploredatauseandmodelbehavior.
• Themodelsremainpreliminaryandsensitivetoconsequentialassumptions(e.g.,initial equilibriumcatch,recruitmentsteepness,selectivity).Furtherworkisrequiredto addresstheseuncertaintiesanddevelopmodelsmorerobustforinformingmanagement advice.
• Atthepanel’srecommendation,anexploratoryrunwasdevelopedcombiningdata fromPuertoRicoandSt.Thomas/St.John.ThismodelrundeviatesfromtheData Workshopguidancetoanalyzeislandplatformsseparatelyandtoexcludespatially restrictedsurveydatafromLaParguera,PuertoRicoandSt.Johnpriortowhenthe surveyswereconductedisland-wide.Thepanelsuggestedthismodelconfigurationinan attempttoretainadditionalinformationtobetterfitlengthcompositionsandstabilize modelinitialization.ThoseresultsareonlyincludedinthePuertoRicoaddendum.
• Thesemodelsdonotrepresentfinalscientificadvice.Theyareintermediatestepsinan iterativereviewprocessleadingtofuturemodeldevelopment,SSCreview,andeventual managementconsideration.
3ModelRuns
IncludedisacompilationofthestockassessmentmodelrunsdevelopedduringtheSEDAR 84ReviewWorkshopheldfromJuly15toJuly18,2025inFortLauderdale,Florida.
BuildingonthemodelsdocumentedintheassessmentprocessreportforYellowtailSnapper inSt.ThomasandSt.John,thereviewworkshoprecommendedseveralrefinementsand exploratorymodelruns.Theinitialreviewworkshopmodeladoptedasingle-sex configuration,appliedtheStockSynthesisfishingmortalitymethodoption2(FMethod= 2),andcorrectedthestandarderrorunitsfortheNCRMPsurveyindexofabundance.This representedadeliberateimprovementoverthesetupreportedintheassessmentprocess report,whichhadimplementedFMethod=3,referredtoasthehybridmethod.Thehybrid methodsequentiallyappliesPope’sandBaranovcatchequationstotunefishingmortalityas afactorbasedonretainedcatchforeachfleet.AsnotedintheSS3manual,thisapproach generallyperformsbestwhencatchesareknownwithhighprecision(standarderror<0.05) andwhentheoverallfishingmortalityisnotsubstantiallyhigherthannaturalmortality.
Incontrast,FMethod=2treatsfishingmortalityasaparameter,whichisoftenmore appropriateincaseswherefishingmortalityisrelativelyhighorwherefleetshaveboth retainedanddiscardedcatch.Changingfrommethod3tomethod2wasthereforean importantrefinement,aswascorrectingtheindexstandarderrorunitsandsimplifyingthe modeltoasingle-sexstructure,giventhatnosex-specificdatainputswereavailableforthis assessment.
Theserecommendationsweremotivatedbytheobservedbehaviorintheinitialmodelswhere catchdatawerefitalmostexactly,largelyduetothecombinationofthehybridmethodand lowuncertaintyonthecatchinputs.SwitchingtoFMethod=2providedthemodelwith greaterflexibilitytobalancethefitbetweenfishery-dependentcatchdataand fishery-independentsurveyindices.ThiswasparticularlyimportantbecausetheNCRMP surveyisastatisticallydesignedsurveyprovidingindependentinformationonabundance trends.
Asecondexploratorymodelrunfurtherincreasedthestandarderroronthecatchand allowedestimationoftwogrowthparameters(thegrowthcoefficient,K,andthemeanlength atmaximumage).Thisrecommendedmodelrunaimedtotestwhetherrelaxingconstraints oncatchandgrowthassumptionswouldallowthemodeltobetteralignwiththesurvey data.
However,thesetwoexploratorymodelsproducednotablydifferentresults,highlightinga significanttradeoff.Thisunderscoresanimportantareaforfurtherinvestigation.Additional workisrequiredtoevaluatemodelweightings,datainputuncertainties,andconfiguration choicestoensureanappropriatebalanceinhowinformationfromdifferentsourcesinforms theassessmentoutcomes.
Athirdexploratorymodelexaminedtheuseofaplusagegroupatage12totestwhether groupingolderfishintoaterminalageclasswouldaffectmodelresults.However,this adjustmenthadnomeaningfulimpactonmodelbehaviororoutputs.
Finally,twopanelrecommendedmodelsweredevelopedwithcombineddatafromPuerto RicoandSt.ThomasandSt.John,USVI.Theseincludedtwofleetsandfivesurveys.This includedtwospatiallyrestrictedNCRMPsurveysfrom2001to2011,conductedinLa Parguera,PRandinSt.John,whichwereincorporatedseparatelyfromtheisland-wide surveys(PRNCRMP,STTJNCRMP,andSTTJDCRMP)thatwererecommendedbythe dataworkshopandincludedintherespectiveassessmentprocessreportmodelruns.Totest formodelconvergence,thesecondmodelbuiltonthiscombinedislandstructurewithfixed selectivityandsteepnessandestimatedlengthatmaximumage.Theresultsofthemodels withcombineddataforPuertoRicoandSt.ThomasandSt.Johndataareincludedinthe PuertoRicoaddendum.
Table 1 summarizesthemodelsdescribedaboveandfiguresareprovidedinSection 6. Foreachmodel,keySpawningPotentialRatio(SPR)plotsareprovidedwithhorizontalred linesindicatingtheMSYproxyof40%SPR.TheSPRplotshowstheestimatedspawning potentialratioovertime.Similarly,theunfishedratioplotpresentsthetimeseriesofthe fractionofunfishedspawningoutput.Lastly,thefishingintensityplotdisplaystheinverseof theSPR(1−SPR).
4ConclusionsandNextSteps
TheseanalysesareexploratoryandwereconductedunderpaneldirectionduringtheSEDAR 84ReviewWorkshop.Furtherworkisrequiredtoevaluateconsequentialassumptions,add sensitivityruns(e.g.,steepnessfromFishBase),andensuremodelsarerobusttouncertainty. Finalrecommendationsandadditionalworkstepswillbedeterminedfollowingcompletionof theReviewWorkshopReport,outsideoftheSEDAR84process.
5Tables
Table1: SummaryofReviewWorkshopSEDAR84modelsforYellowtailSnapperin St.ThomasandSt.John.
Model Description
STTJ_RW_1
STTJ_RW_2
STTJ_RW_3
PR_STTJ_RW_1
PR_STTJ_RW_2
SingleSex,Fmethod2,CatchSE=0.3,andCorrected SurveySE
STTJ_RW_1+CatchSE=2andEstimatedGrowth
STTJ_RW_1+12-yearAgePlusGroup
PR_RW_3+STTJFleetandSTJSurvey; doesnot converge
PR_STTJ_RW_1+EstimatedLengthatMaximumAge andFixedSelectivityand0.8Steepness
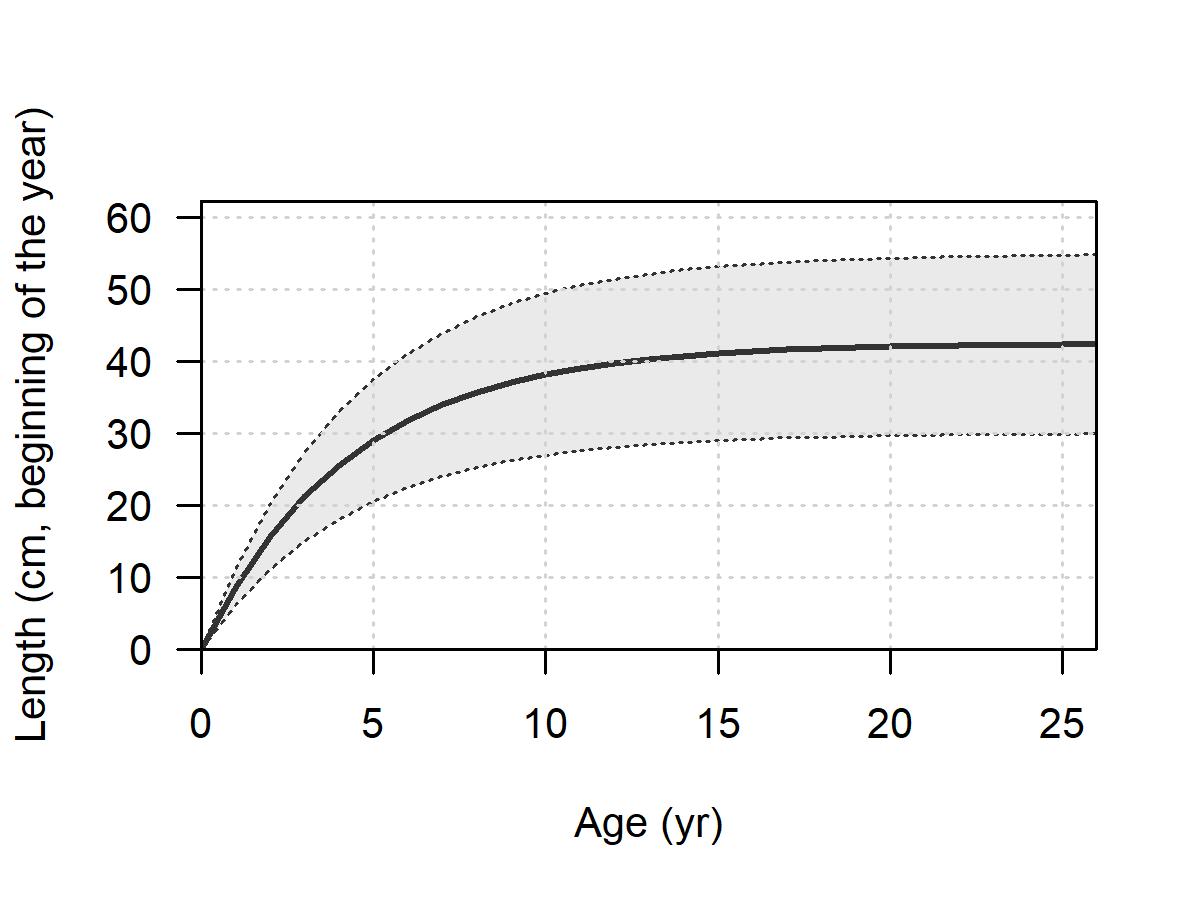
(a) Sizeatage
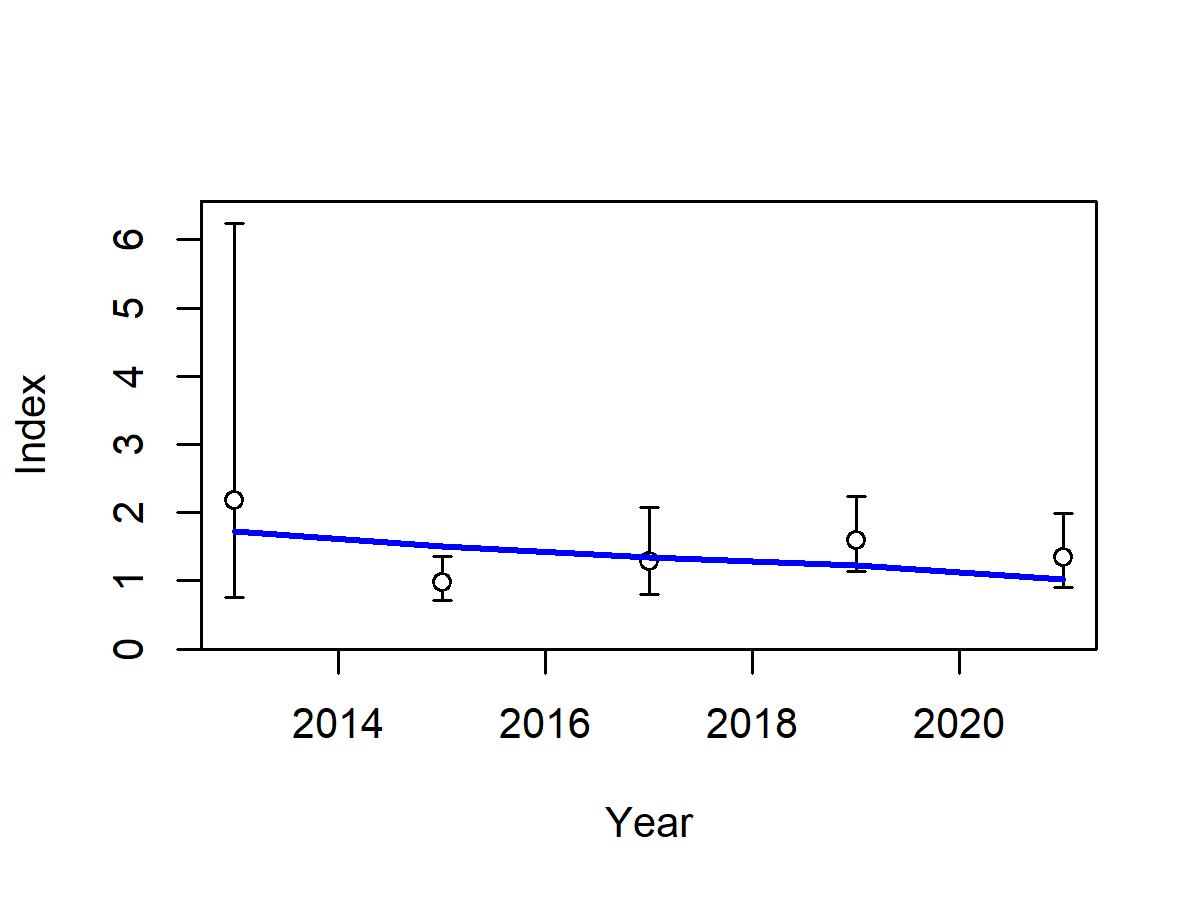
(c) IndexNCRMP
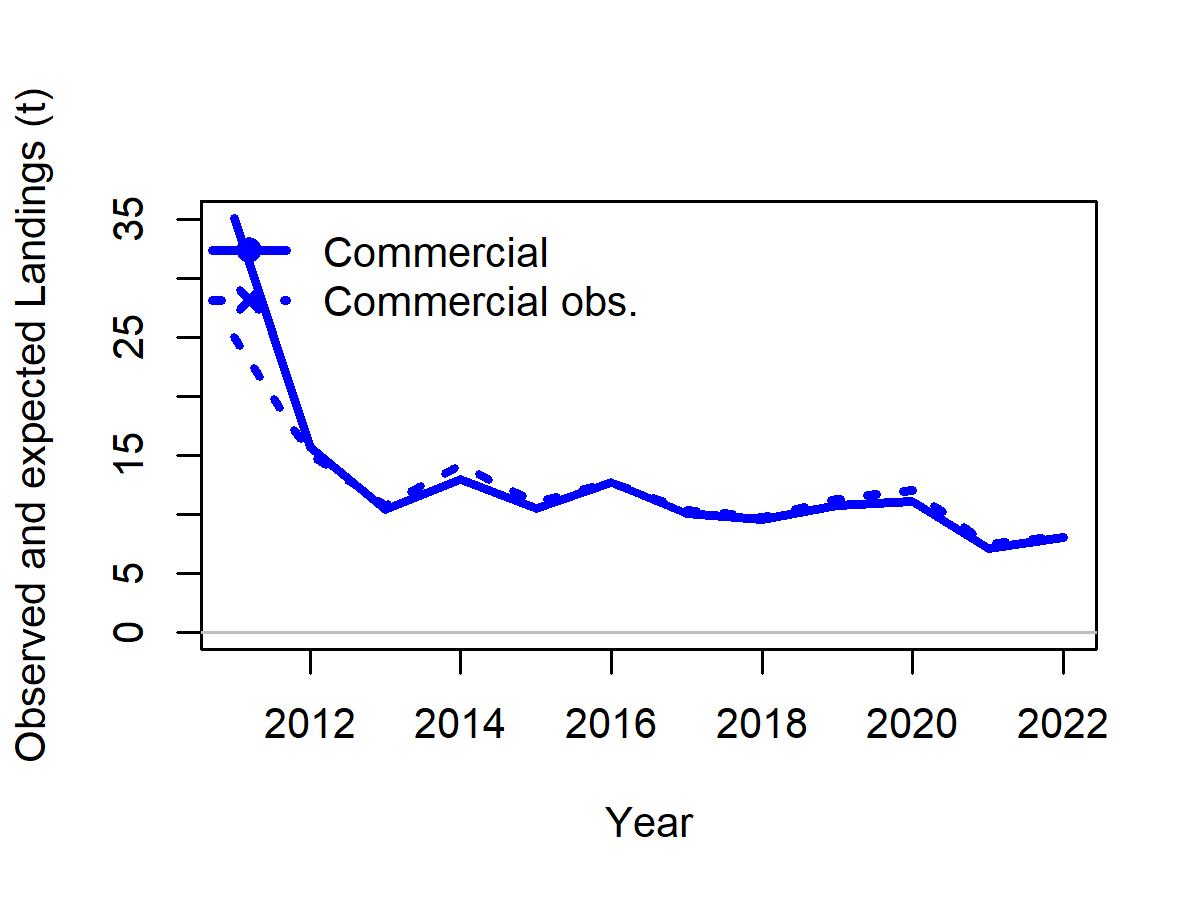
(b) Observedandexpectedlandings
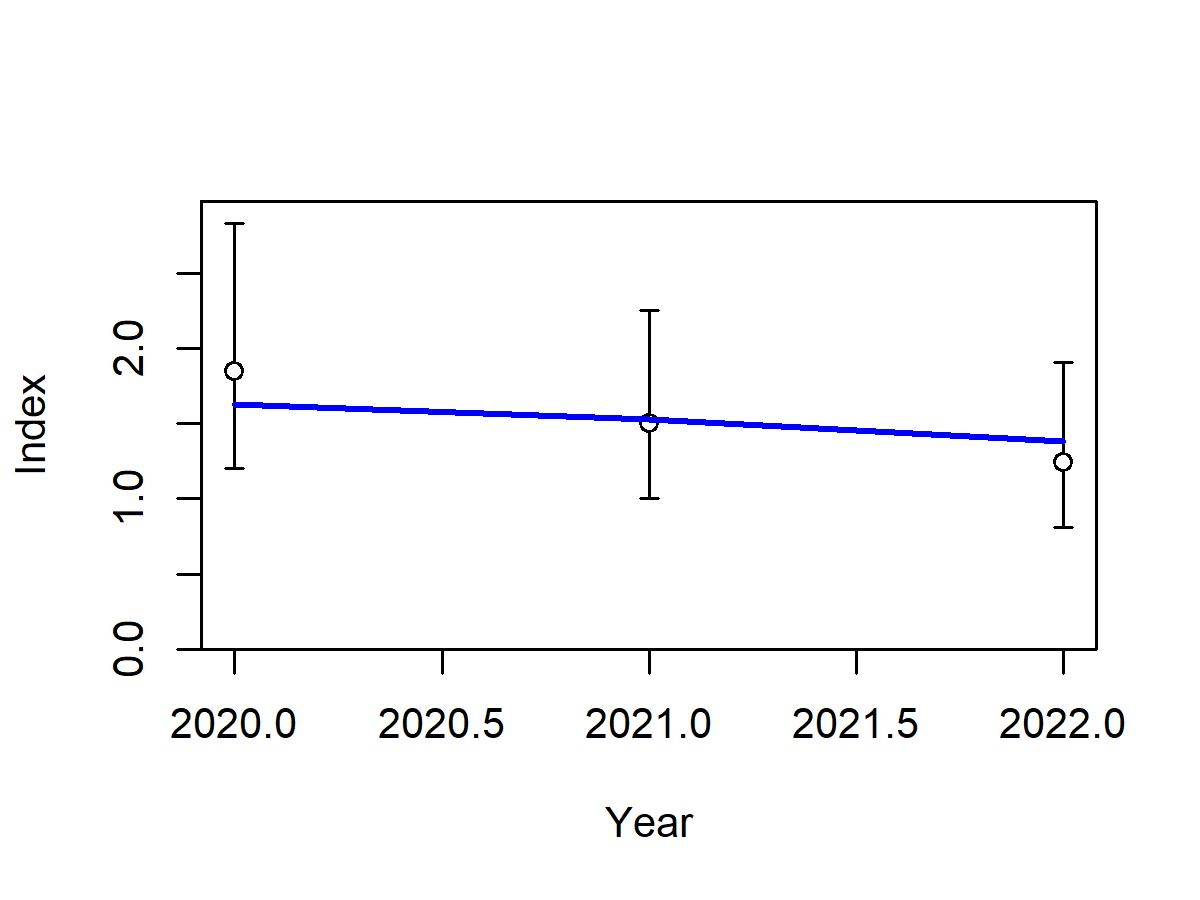
(d) IndexDCRMP
Figure1: St.ThomasandSt.JohnYellowtailSnapperReviewWorkshopModel STTJ_RW_1(a)Lengthatageinthebeginningoftheyear(orseason)inthefinalyear ofthemodel.Shadedareaindicates95%distributionoflengthatagearoundestimated growthcurve;(b)observedandexpectedlandings;(c)FittoindexdatafortheNCRMP survey.;and(d)FittoindexdatafortheDCRMPsurvey.
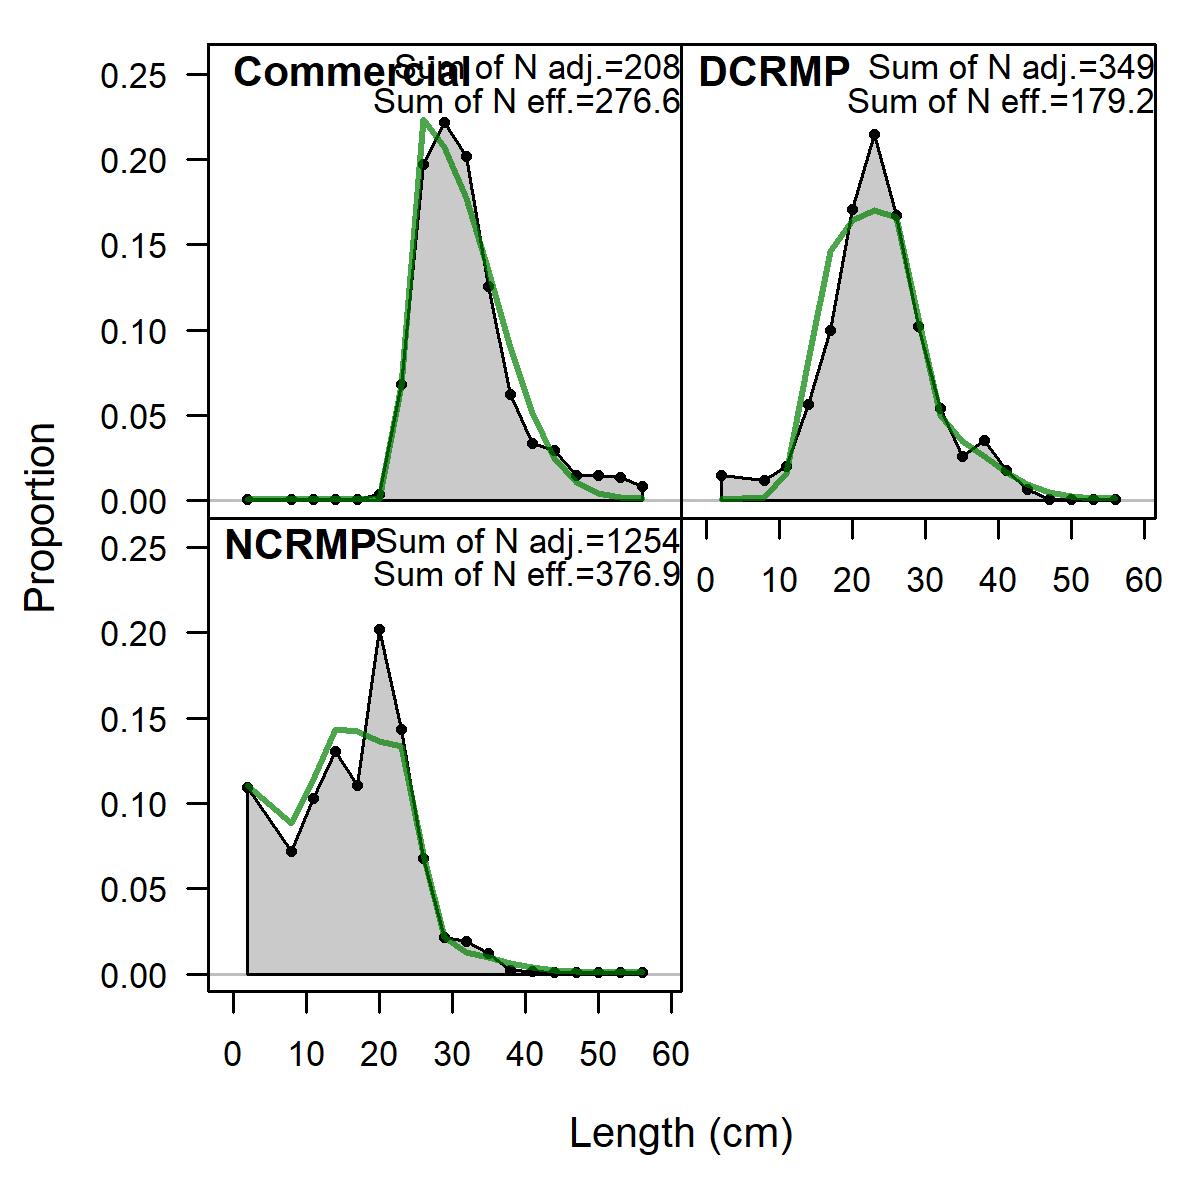
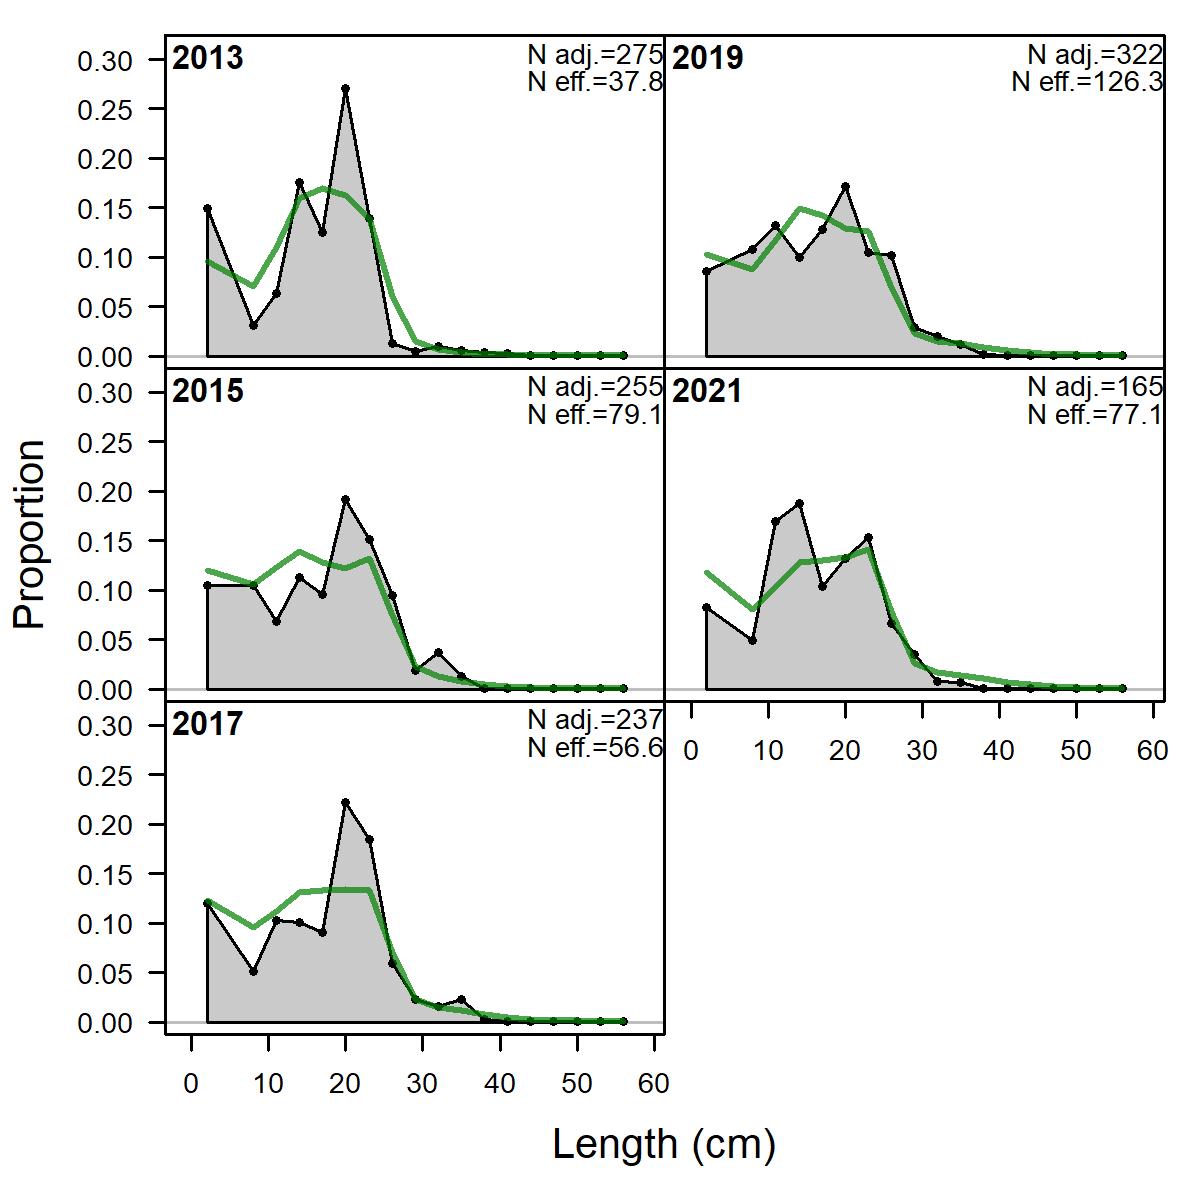
(a) Lengthfitaggregatedacrosstime (b) LengthcompsNCRMP
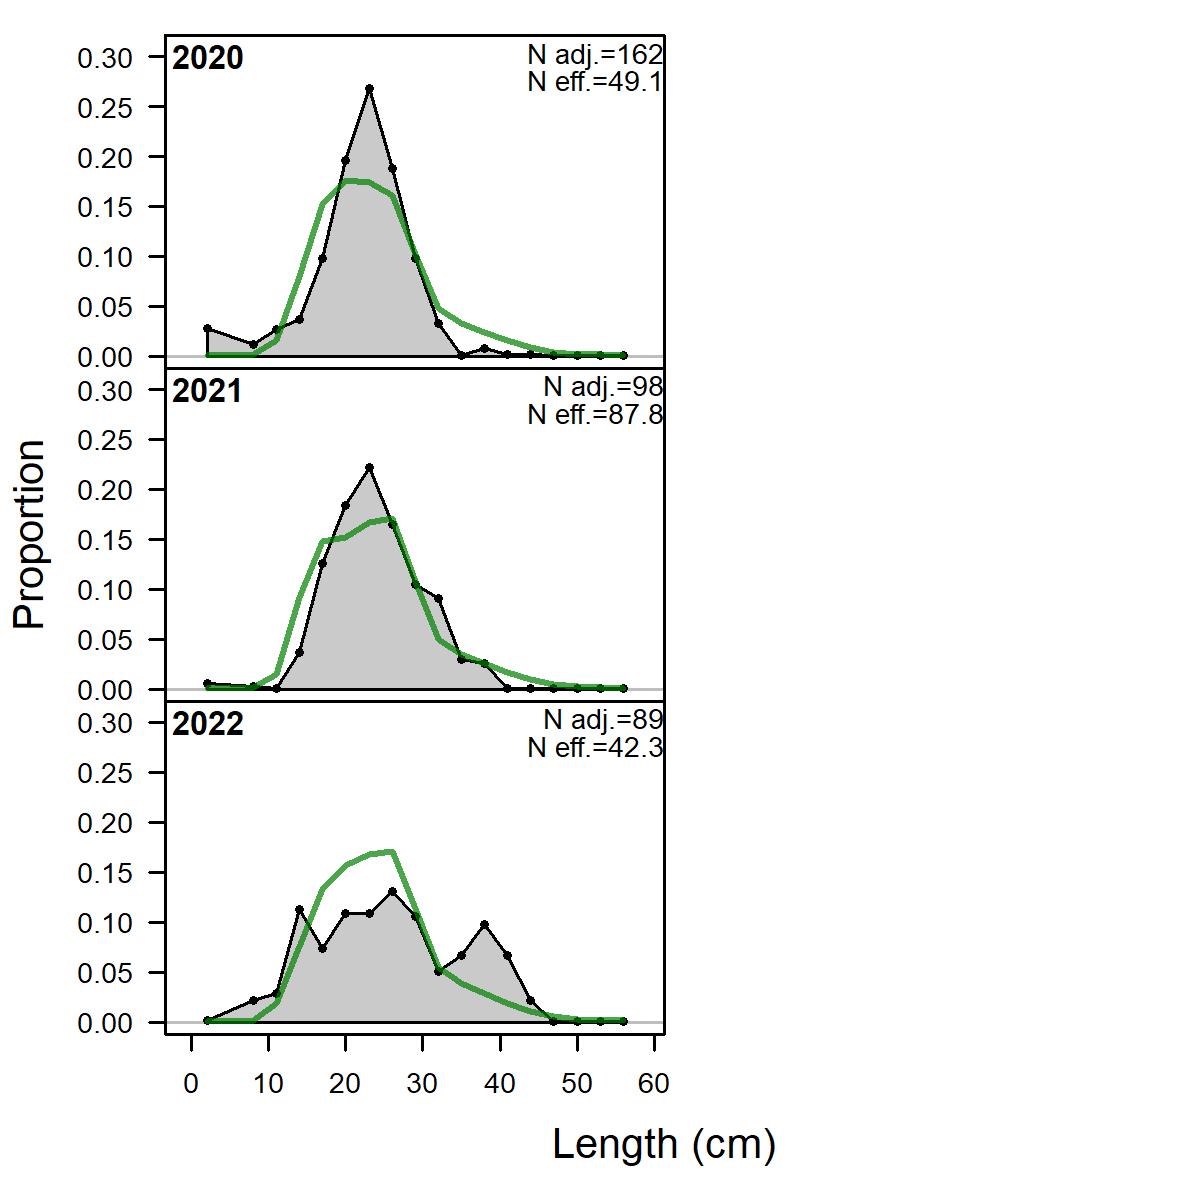
(c) LengthcompsDCRMP
Figure2: St.ThomasandSt.JohnYellowtailSnapperReviewWorkshopModel STTJ_RW_1.(a)Observedandpredictedlengthdistributionsincentimeters,aggregated acrosstimebyfleet;(b)observedandpredictedlengthdistributionsincentimeters,by yearfortheNCRMPsurvey;and(c)observedandpredictedlengthdistributionsin centimeters,byyearfortheDCRMPsurvey.‘Nadj.’istheinputsamplesizeafter data-weightingadjustment.Neff.isthecalculatedeffectivesamplesizeusedinthe McAllister-Ianellituningmethod.
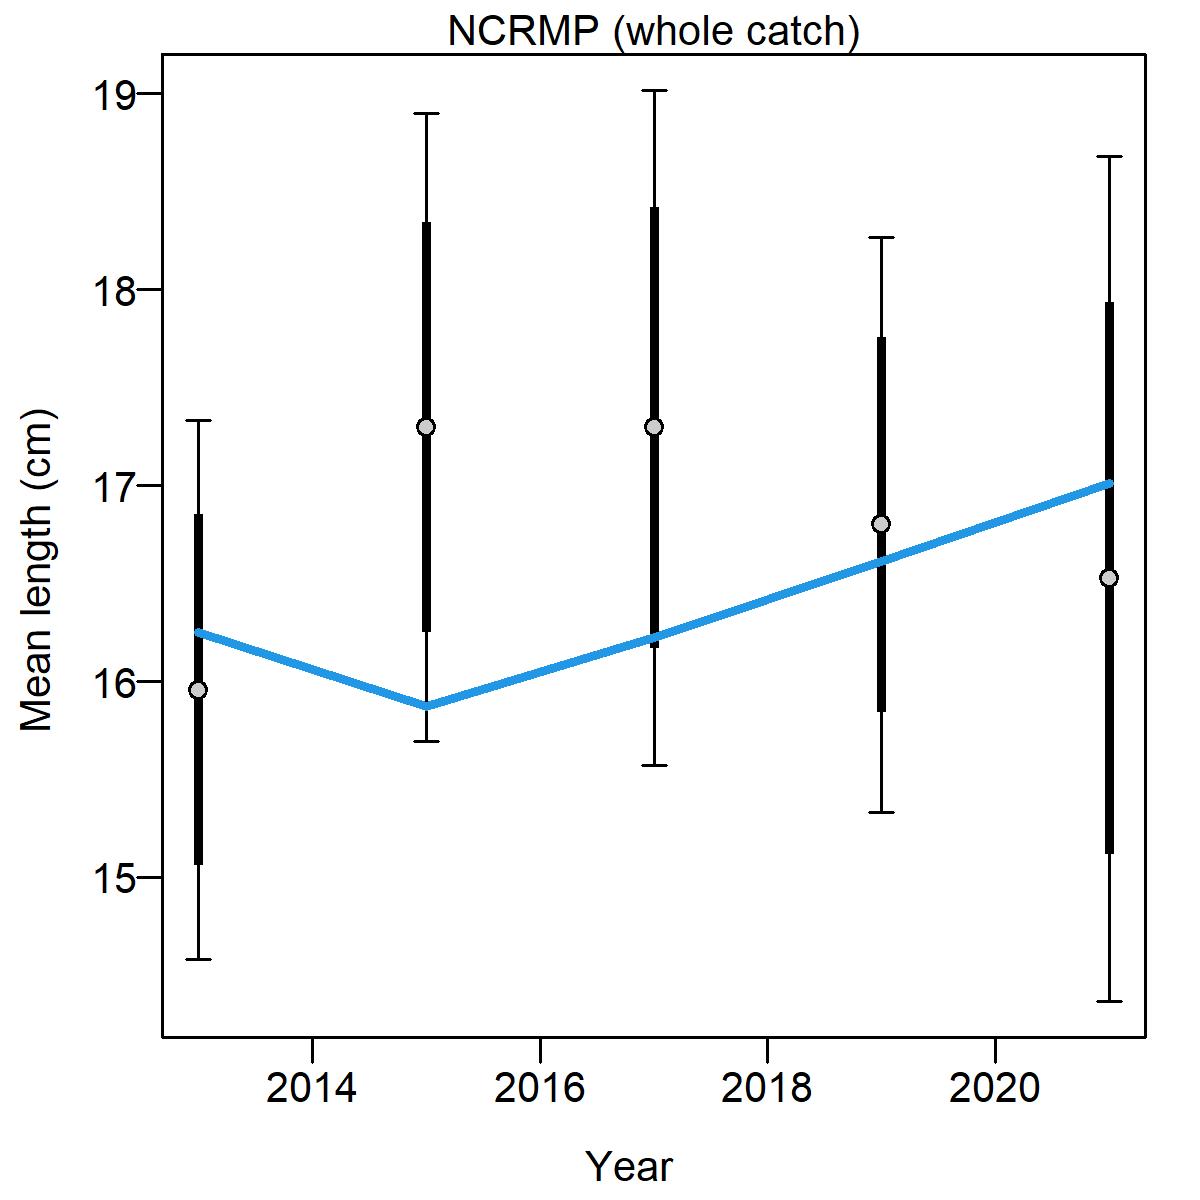
(a) MeanlengthNCRMP
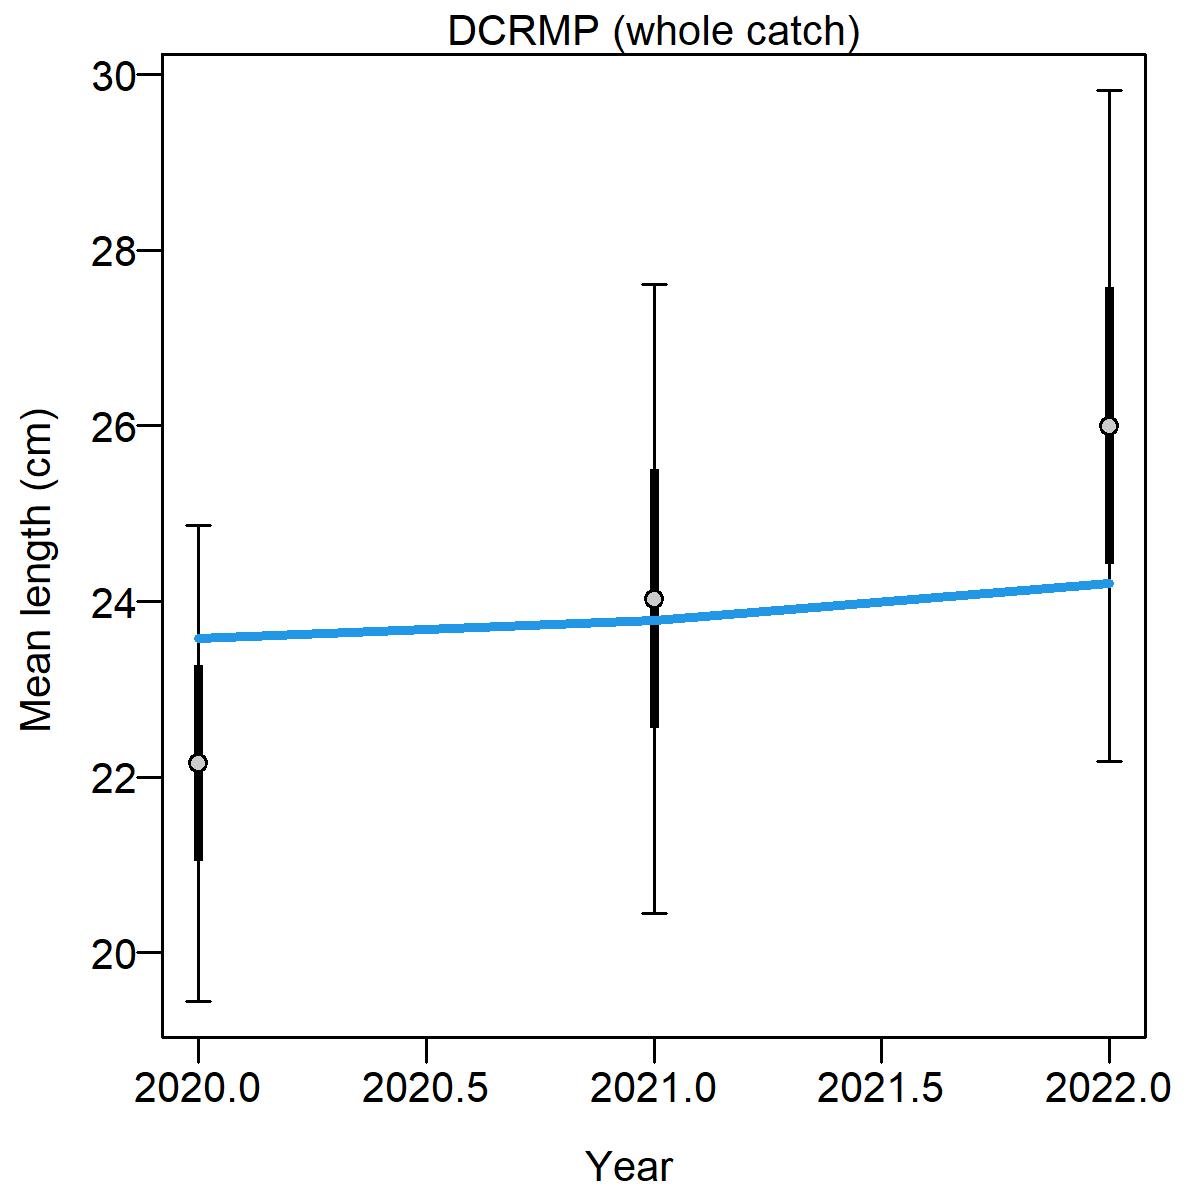
(b) MeanlengthDCRMP
Figure3: St.ThomasandSt.JohnYellowtailSnapperReviewWorkshopModel STTJ_RW_1.Meanlengthforwith95%confidenceintervalsfor(a)theNCRMPsurvey andfor(b)theDCRMP.
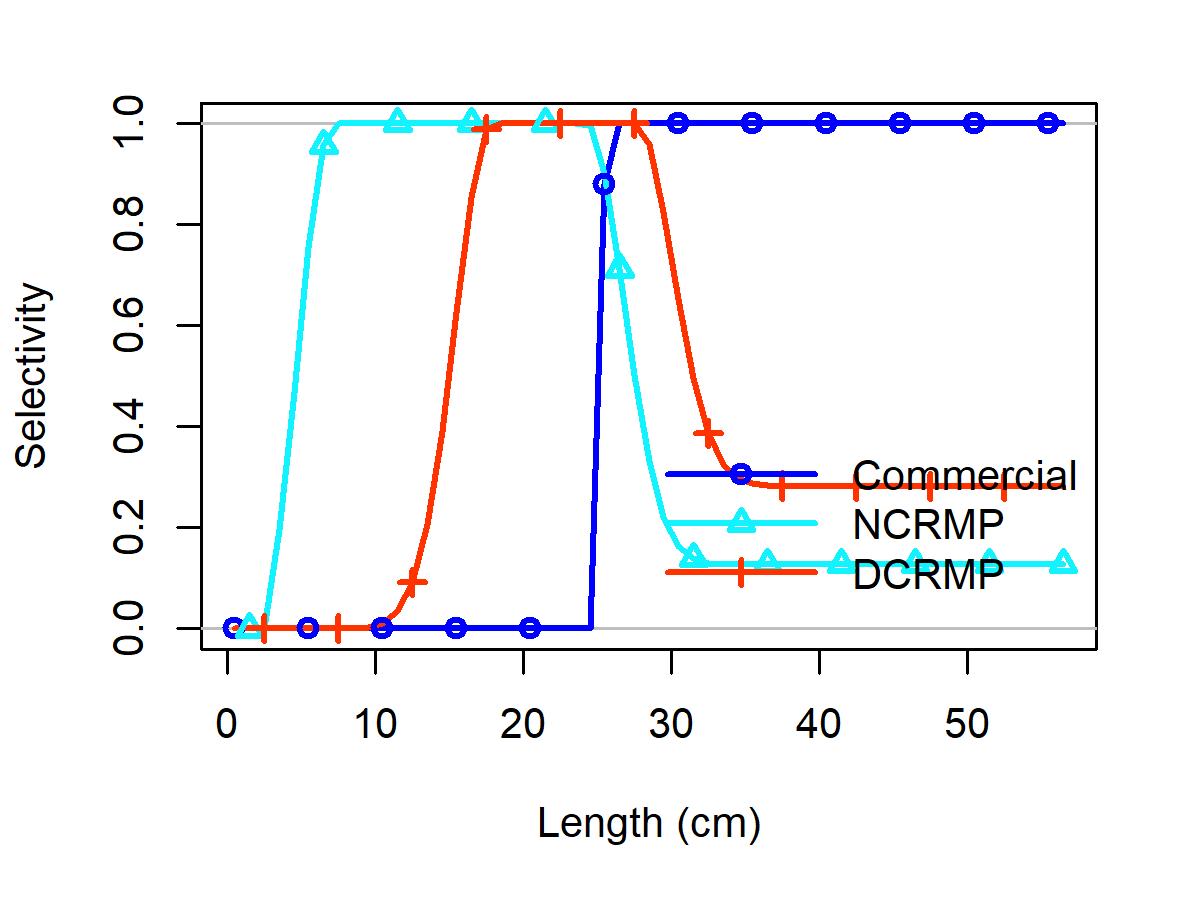
(a) Selectivity
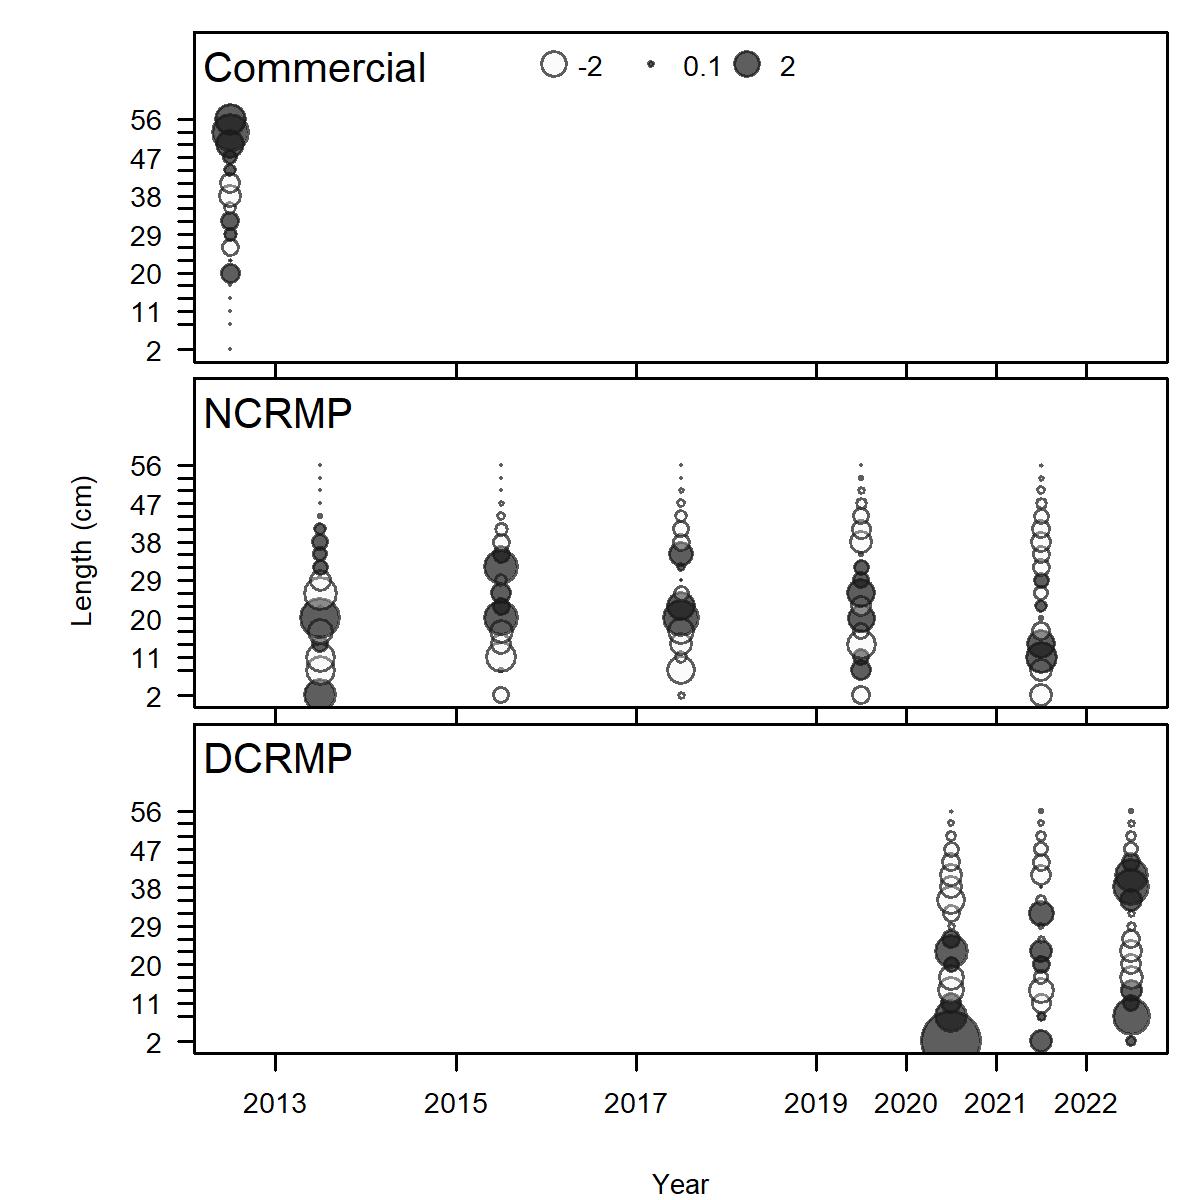
(b) Lengthfit
Figure4: St.ThomasandSt.JohnYellowtailSnapperReviewWorkshopModel STTJ_RW_1.(a)selectivityatlengthbyfleet;and(b)Pearsonresiduals,comparing acrossfleets.Closedbubblesarepositiveresiduals(observed>expected)andopen bubblesarenegativeresiduals(observed<expected).
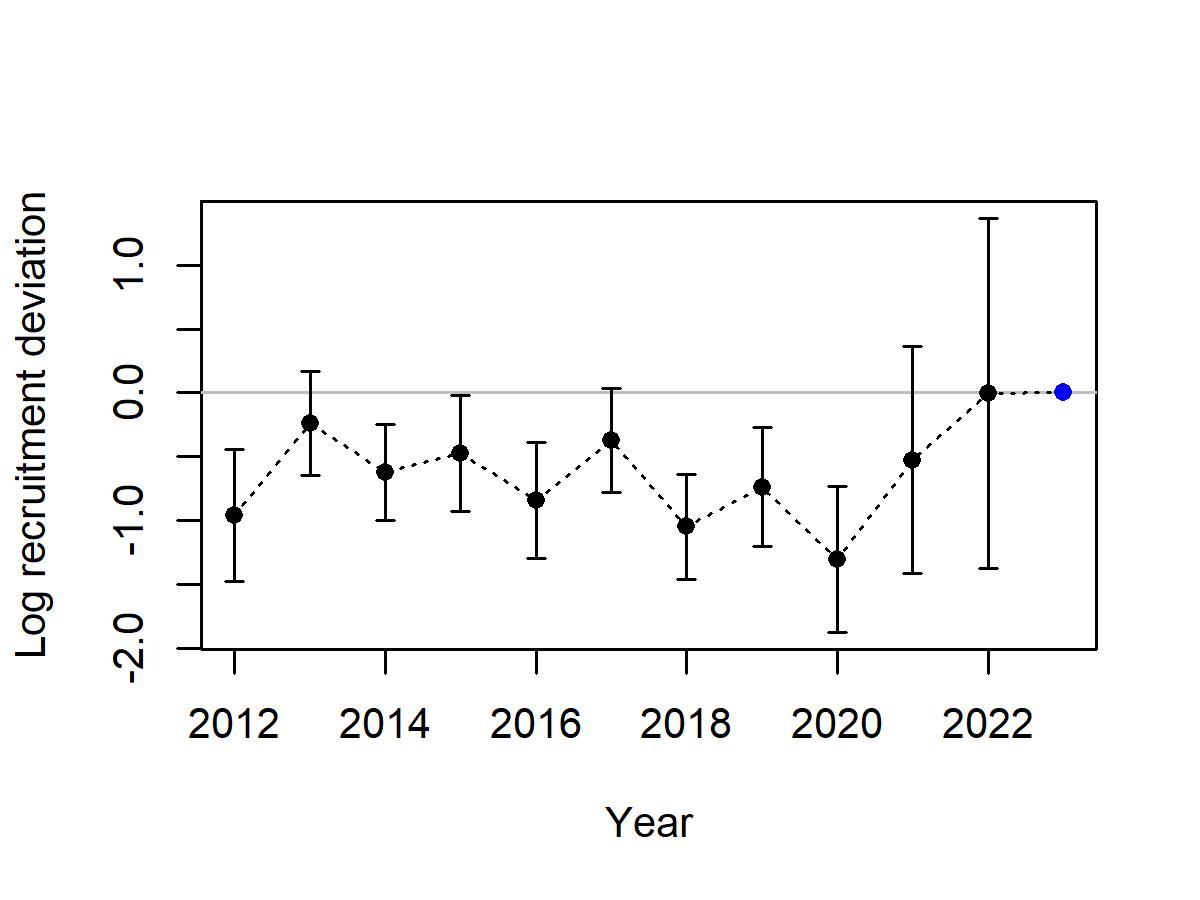
(a) Recruitmentdeviations
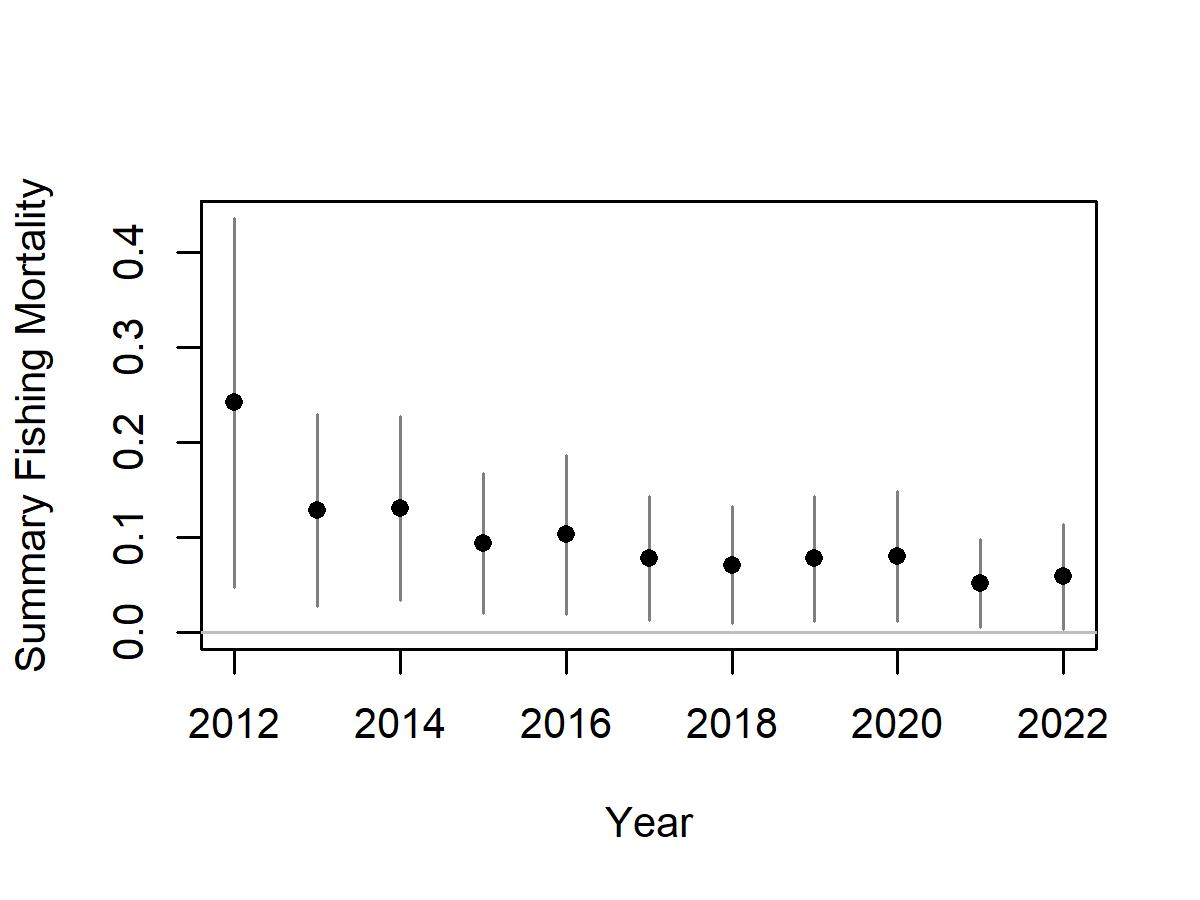
(b) FishingMortality
Figure5: St.ThomasandSt.JohnYellowtailSnapperReviewWorkshopModel STTJ_RW_1(a)Recruitmentdeviationswith95%intervals;and(b)fishingmortality (totalbiomasskilled/totalbiomass).
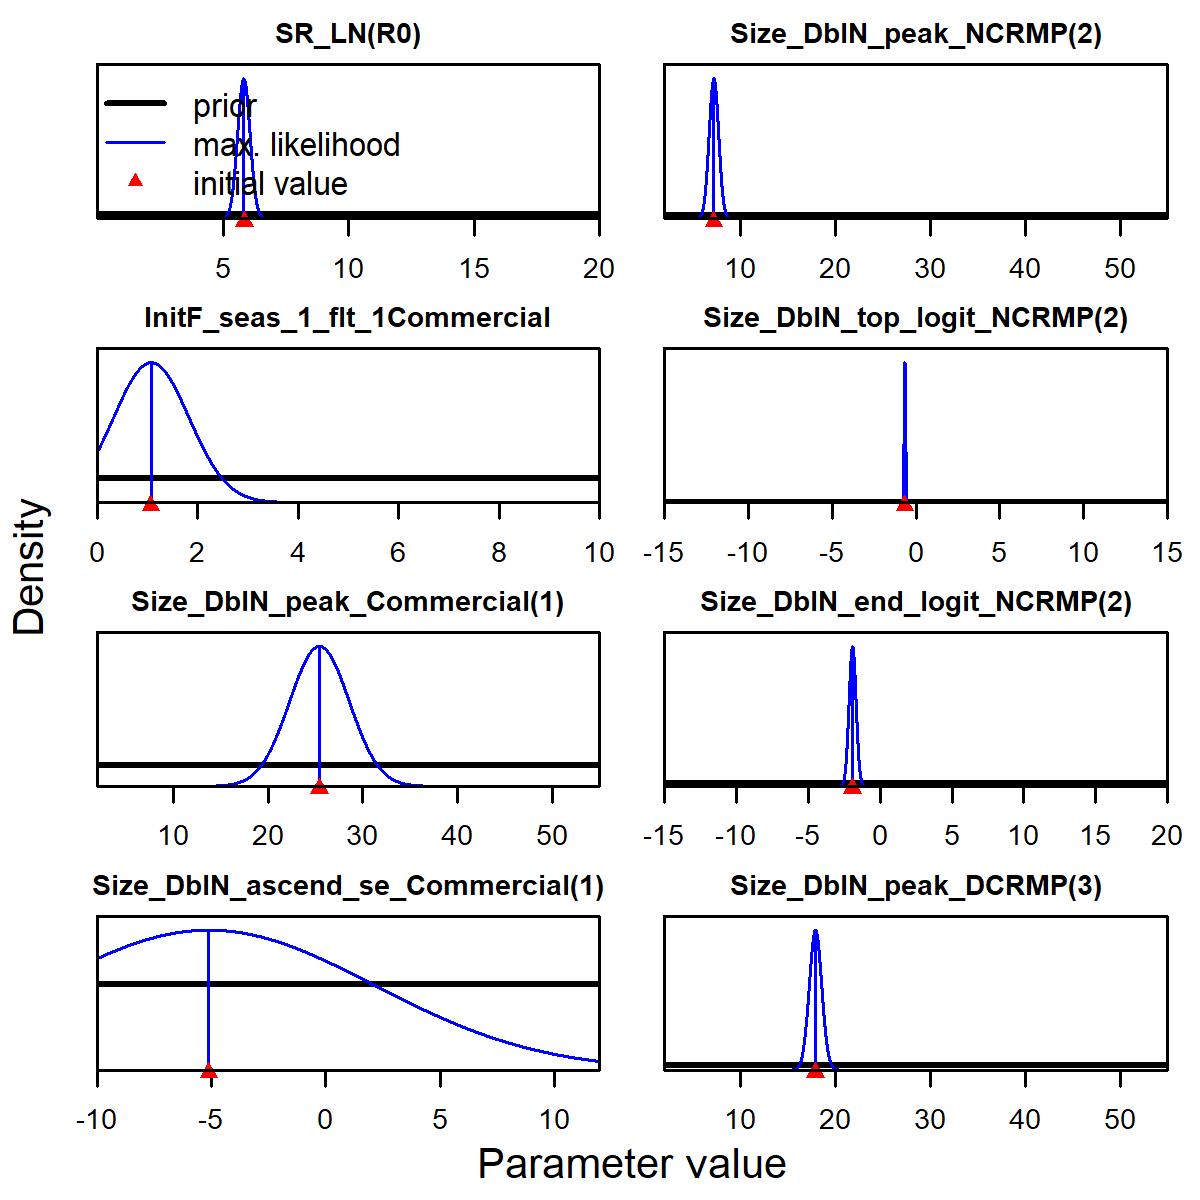
(a) Parameterspg.1of2
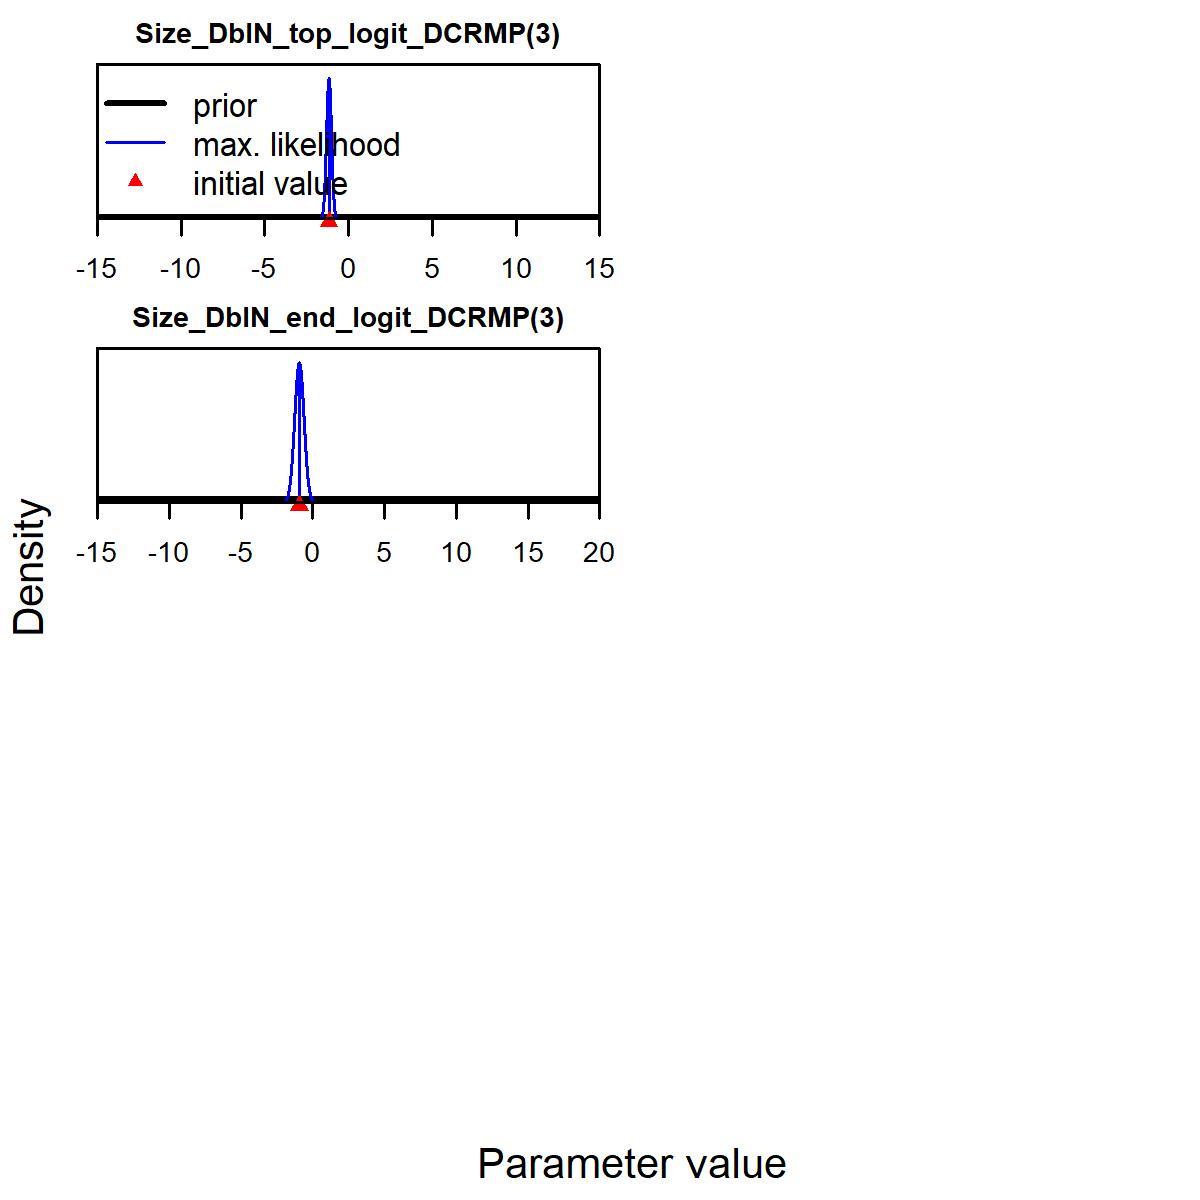
(b) Parameterspg.2of2
Figure6: ParameterdistributionplotsfortheSt.ThomasandSt.JohnYellowtailSnapper ReviewWorkshopModelSTTJ_RW_1.
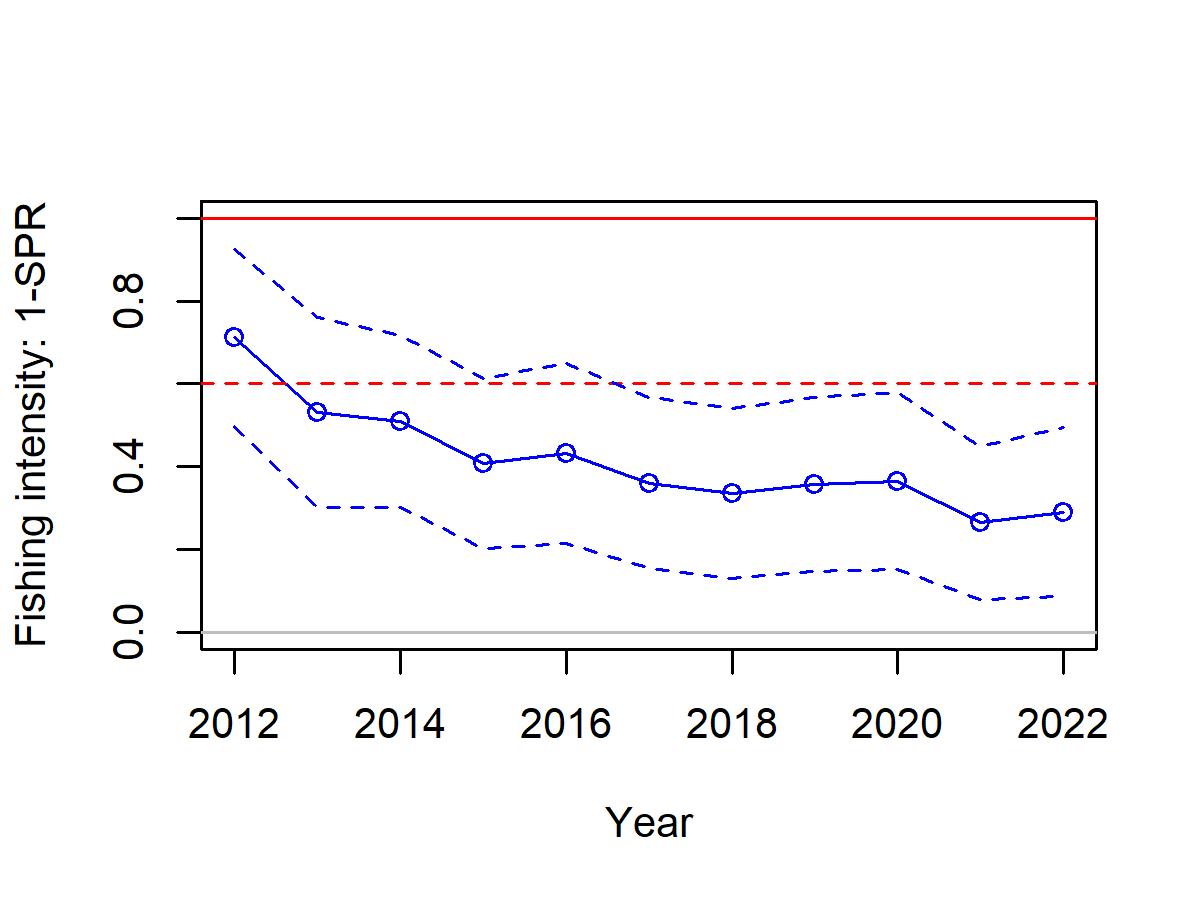
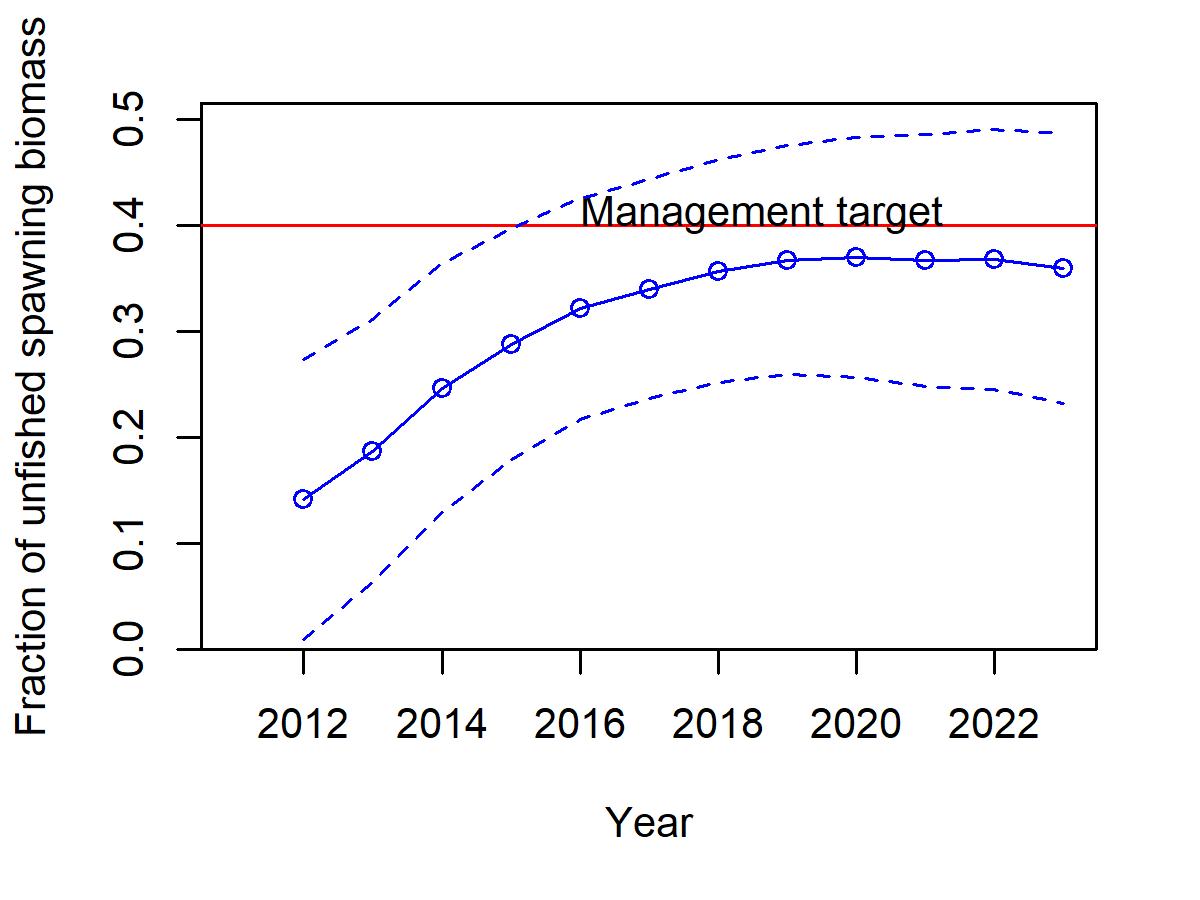
(c) Unfishedratio
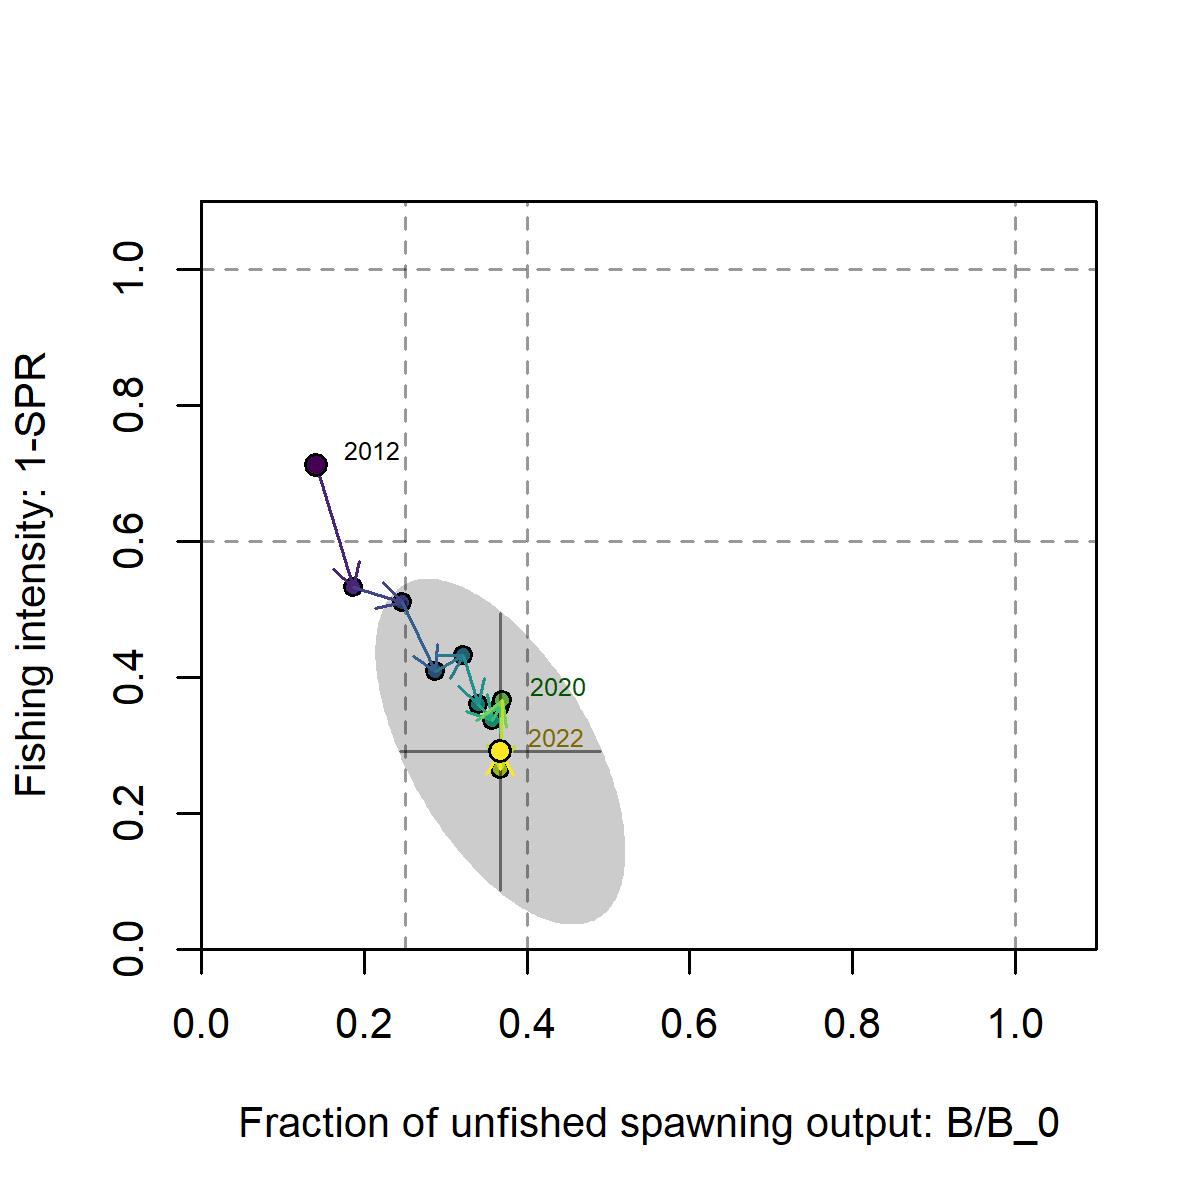
(d) SPRPhase
Figure7: St.ThomasandSt.JohnYellowtailSnapperReviewWorkshopModel STTJ_RW_1.(a)TimeseriesofSPR.HorizontalreferencelineisatSPRtarget:0.4,(b) timeseriesof1-SPR.Horizontalreferencelines1andat1-SPRtarget:1-0.4=0.6;(c) therelativespawningstockbiomass(totalbiomass/virginspawningstockbiomass)with ~95%asymptoticintervals.Horizontalreferencelinesat1andSPRtarget:0.4;and(d) phaseplotofbiomassratiovs.SPRratiowherewarmercolors(red)representearlyyears andcoldercolors(blue)representrecentyears.Linesthroughthefinalpointshow95% intervalsbasedontheasymptoticuncertaintyforeachdimension.Theshadedellipseisa 95%regionwhichaccountsfortheestimatedcorrelationbetweenthetwoquantities:-0.58.
(a) SPR
(b) SPRRatio
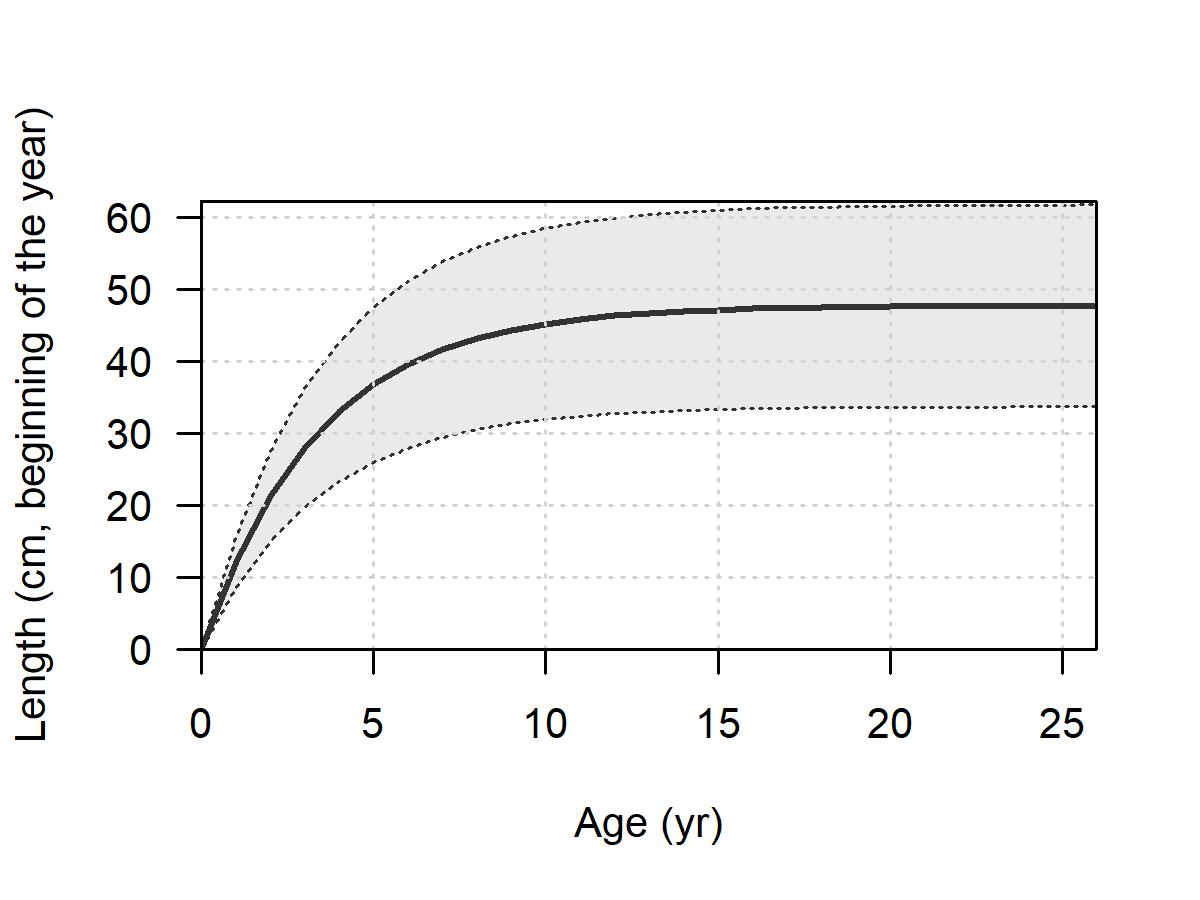
(a) Sizeatage
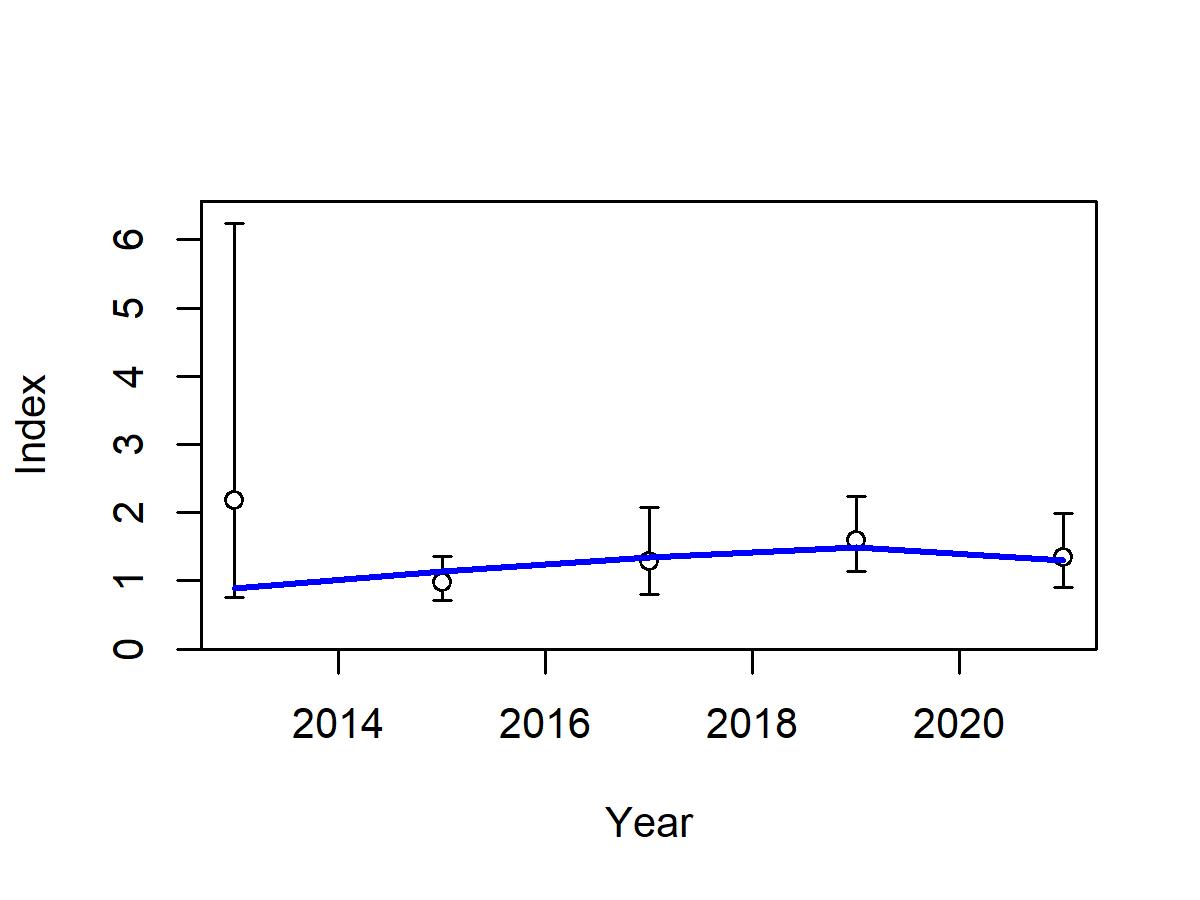
(c) IndexNCRMP
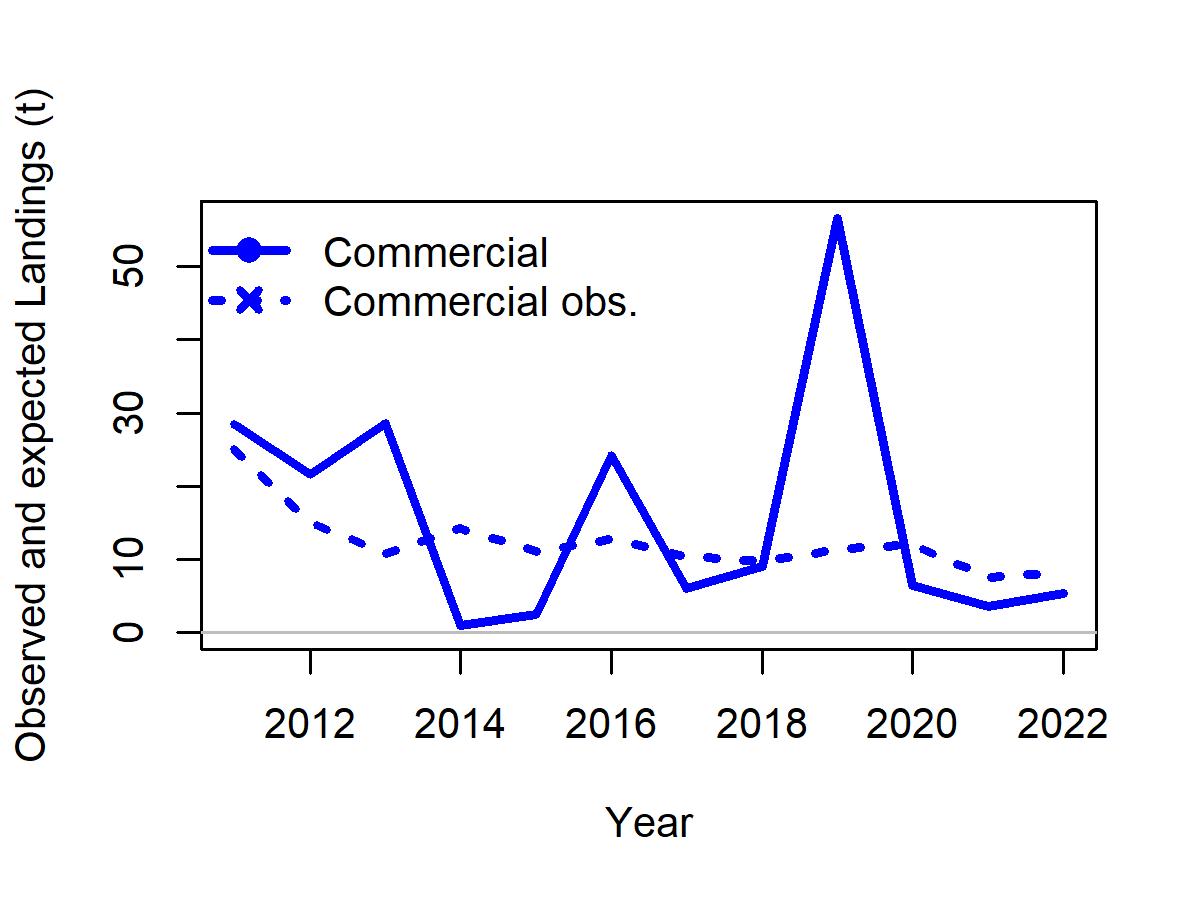
(b) Observedandexpectedlandings
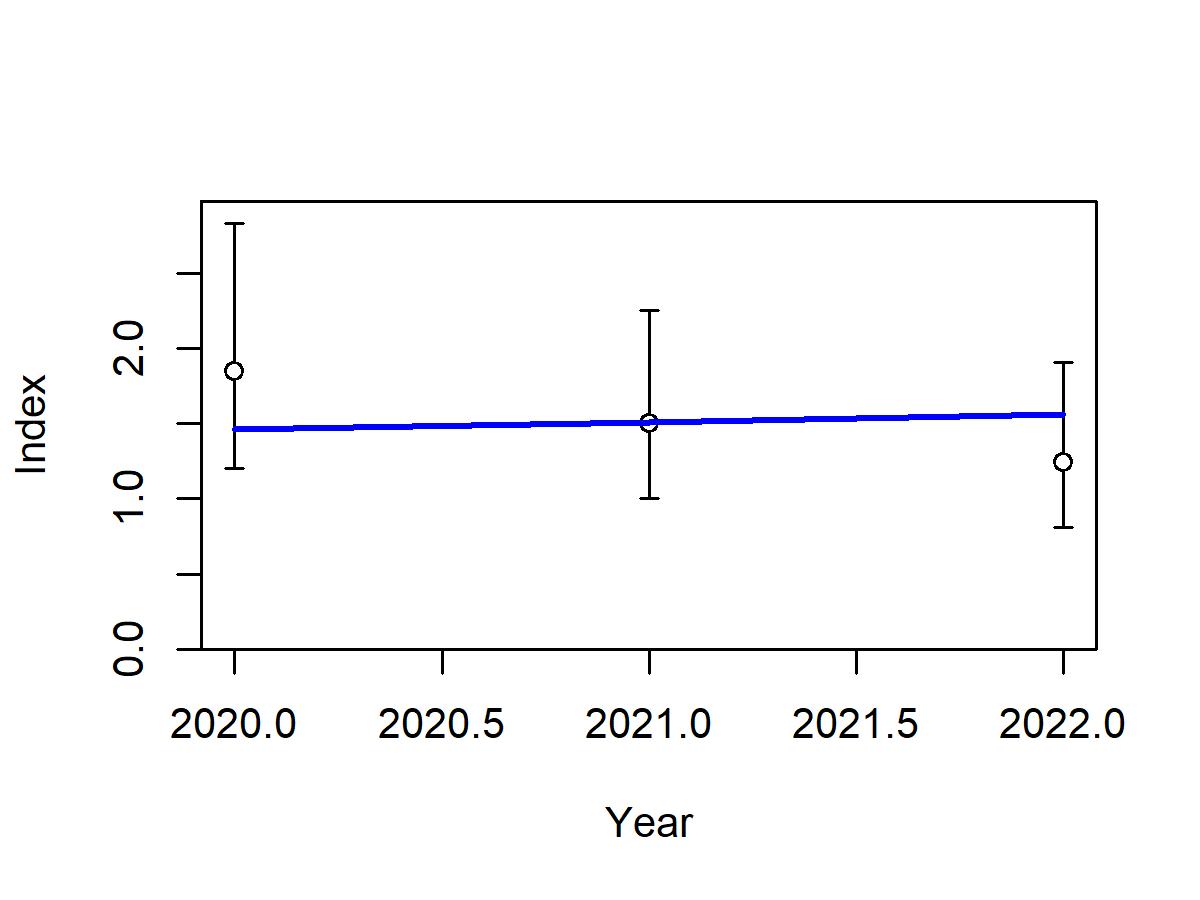
(d) IndexDCRMP
Figure8: St.ThomasandSt.JohnYellowtailSnapperReviewWorkshopModel STTJ_RW_2.(a)Lengthatageinthebeginningoftheyear(orseason)inthefinalyear ofthemodel.Shadedareaindicates95%distributionoflengthatagearoundestimated growthcurve;(b)observedandexpectedlandings;(c)FittoindexdatafortheNCRMP survey.;and(d)FittoindexdatafortheDCRMPsurvey.
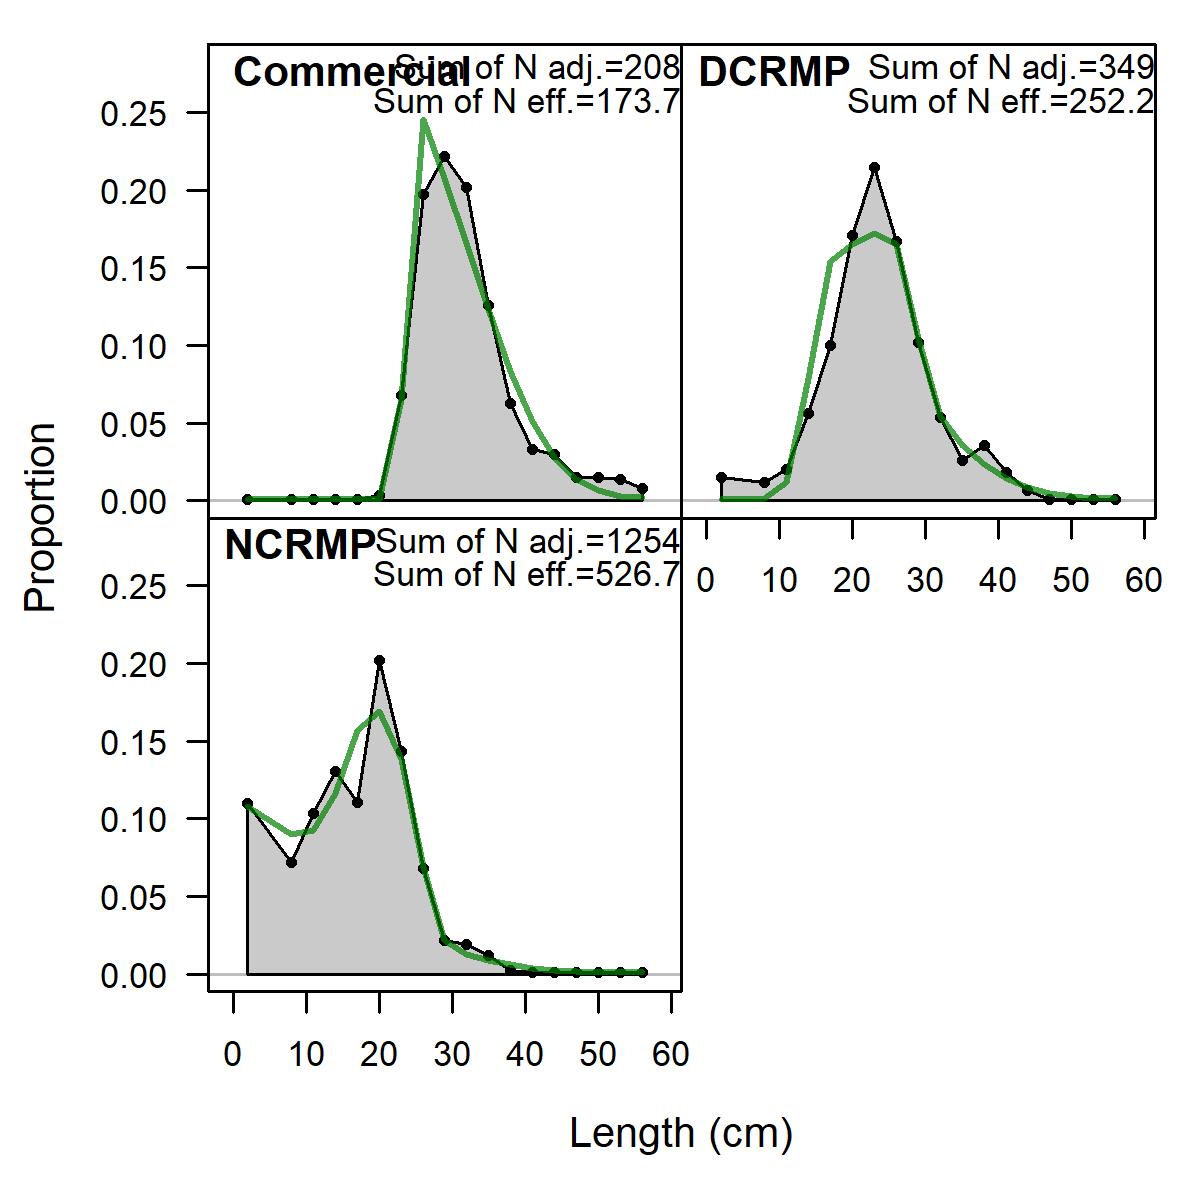
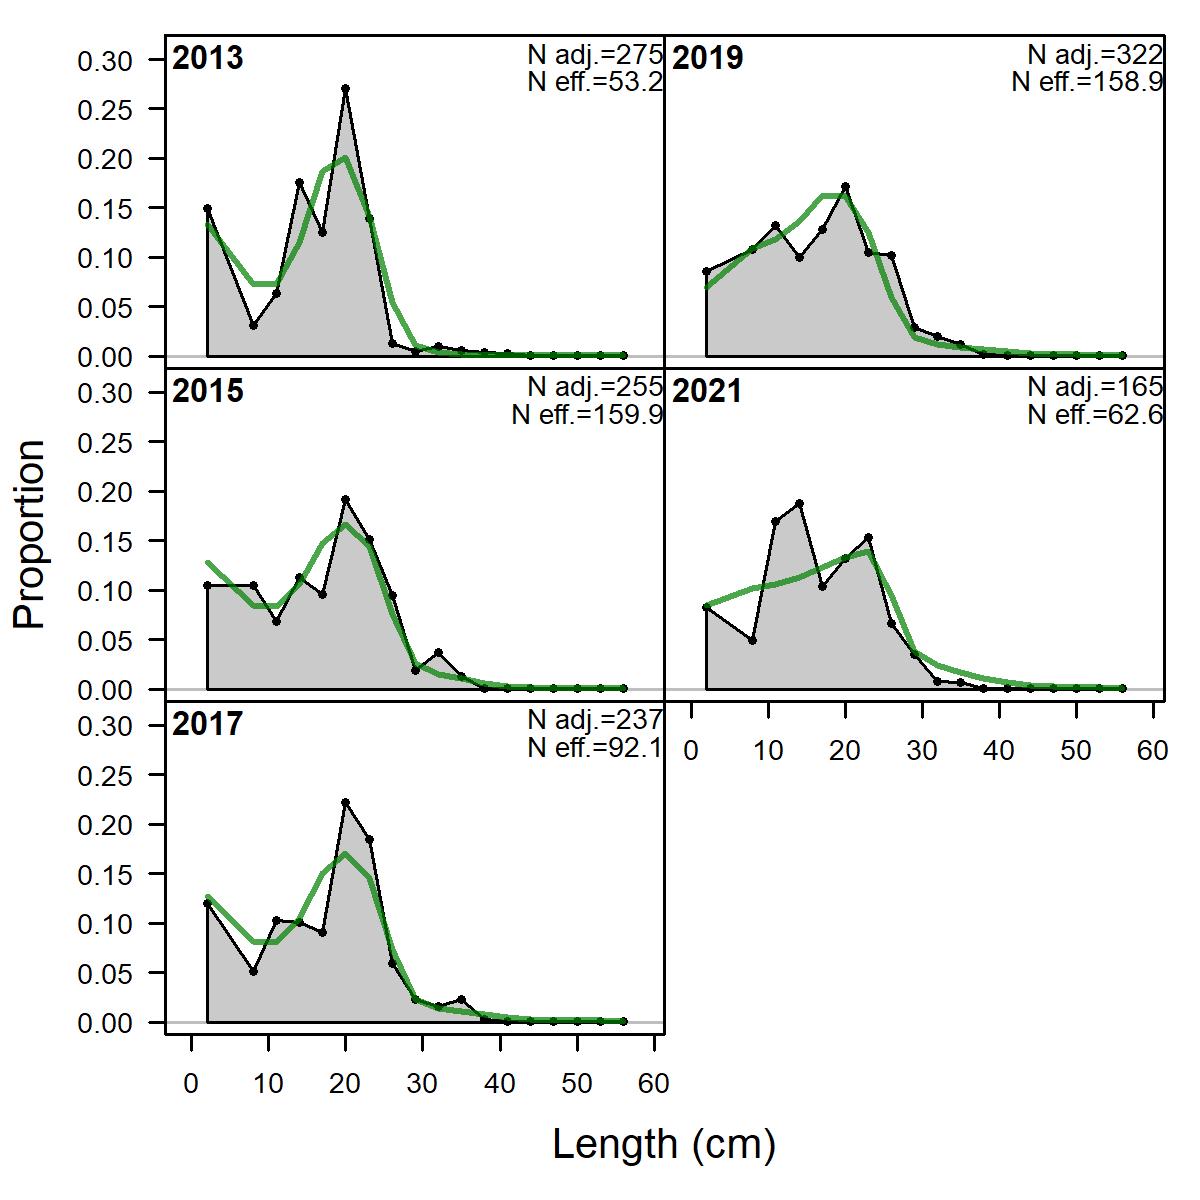
(a) Lengthfitaggregatedacrosstime (b) LengthcompsNCRMP
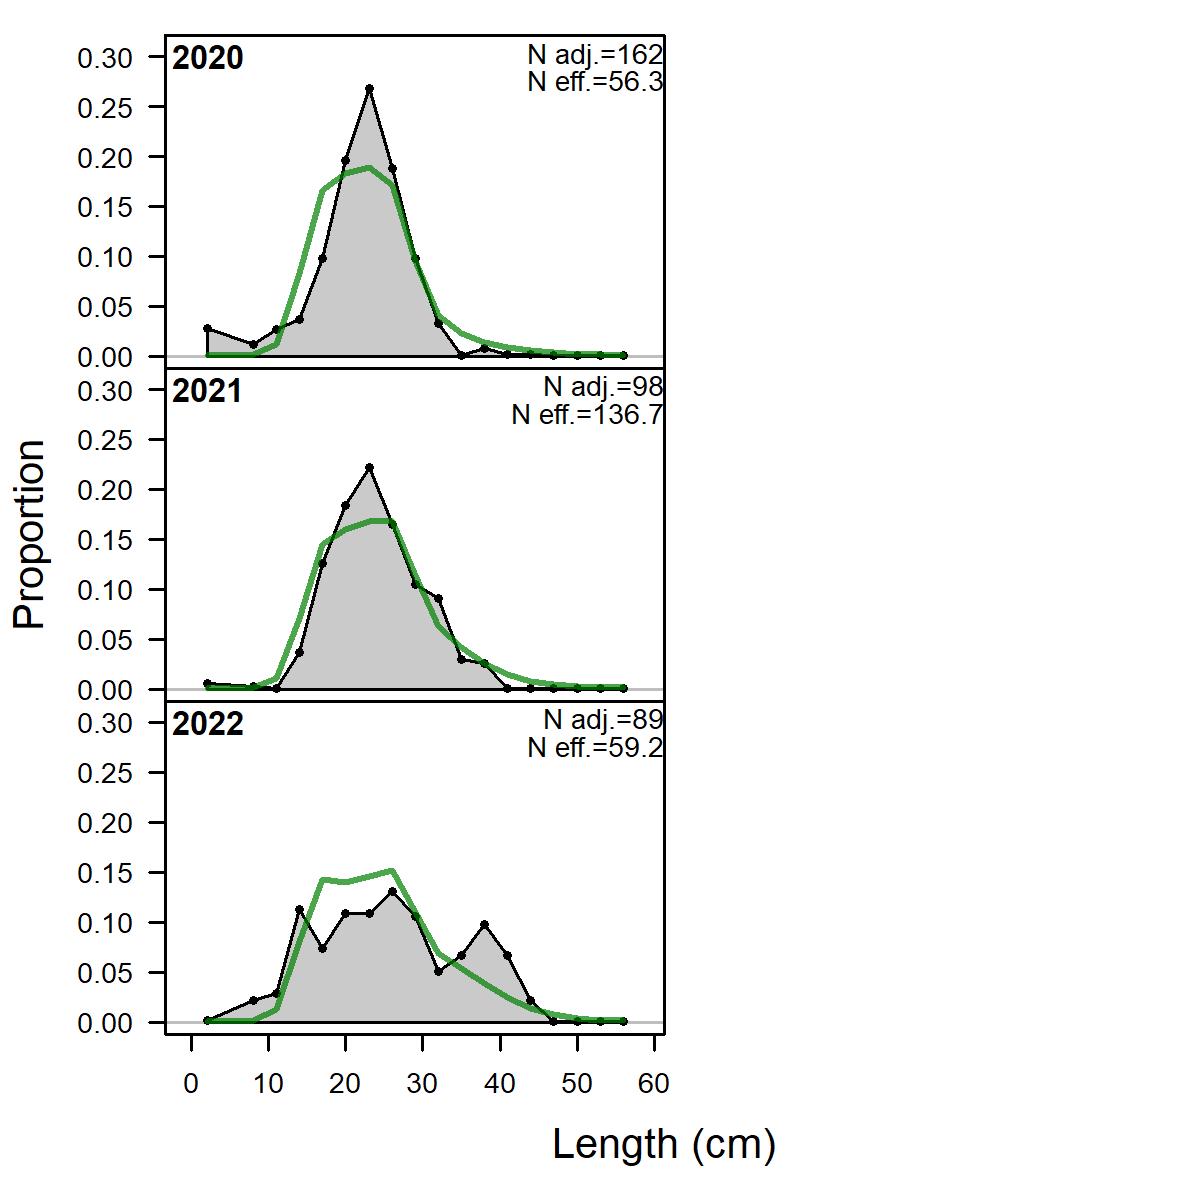
(c) LengthcompsDCRMP
Figure9: St.ThomasandSt.JohnYellowtailSnapperReviewWorkshopModel STTJ_RW_2.(a)Observedandpredictedlengthdistributionsincentimeters,aggregated acrosstimebyfleet;(b)observedandpredictedlengthdistributionsincentimeters,by yearfortheNCRMPsurvey;and(c)observedandpredictedlengthdistributionsin centimeters,byyearfortheDCRMPsurvey.‘Nadj.’istheinputsamplesizeafter data-weightingadjustment.Neff.isthecalculatedeffectivesamplesizeusedinthe McAllister-Ianellituningmethod.
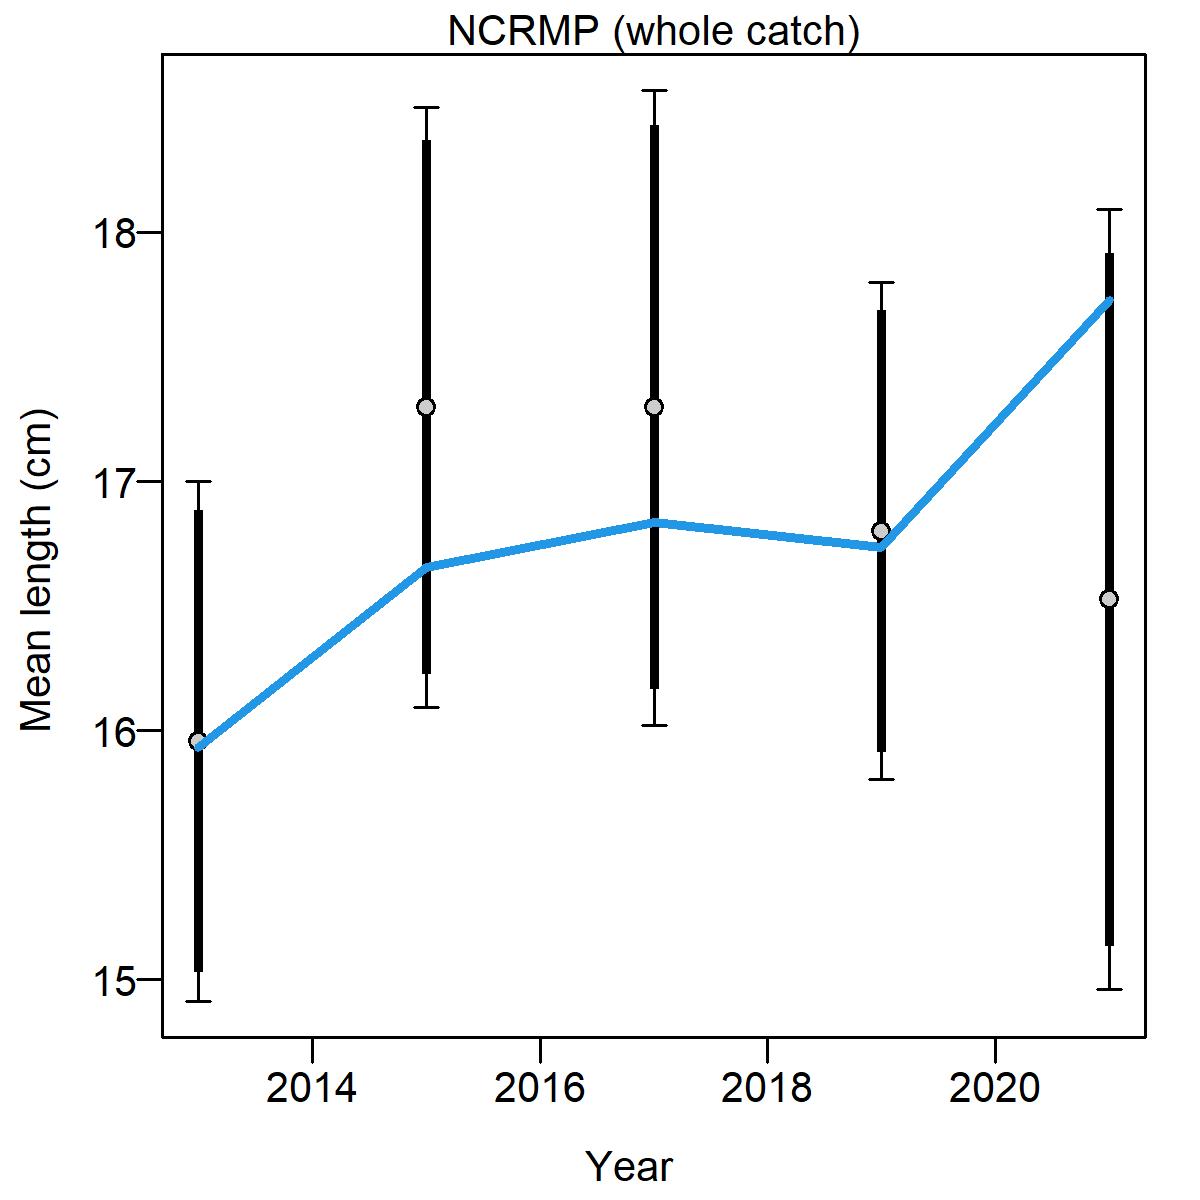
(a) MeanlengthNCRMP
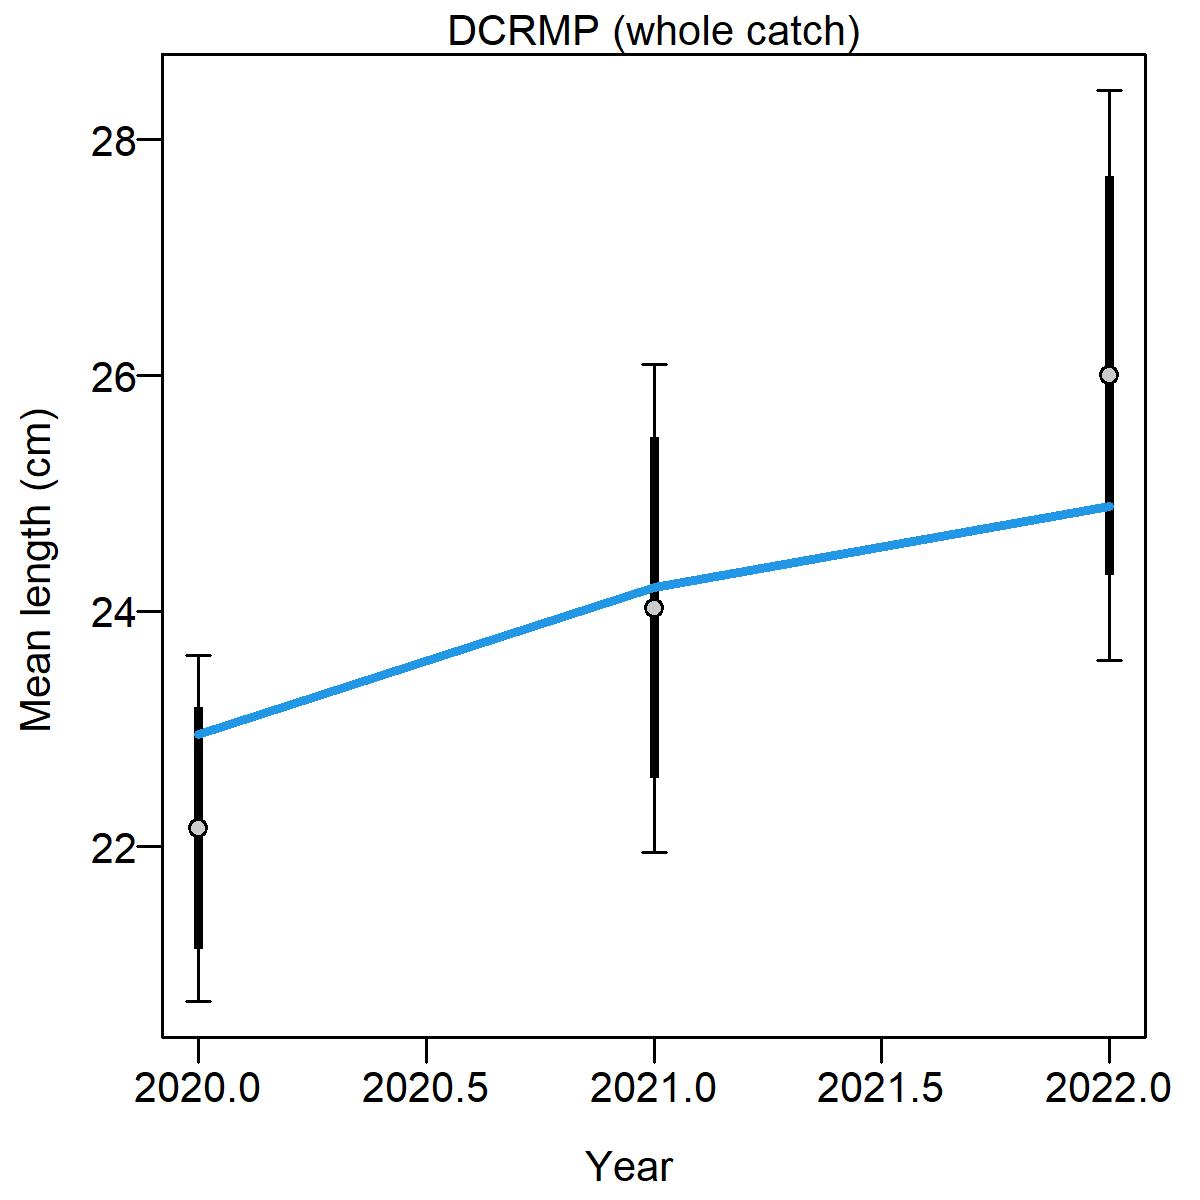
(b) MeanlengthDCRMP
Figure10: St.ThomasandSt.JohnYellowtailSnapperReviewWorkshopModel STTJ_RW_2.Meanlengthforwith95%confidenceintervalsfor(a)theNCRMPsurvey andfor(b)theDCRMP.
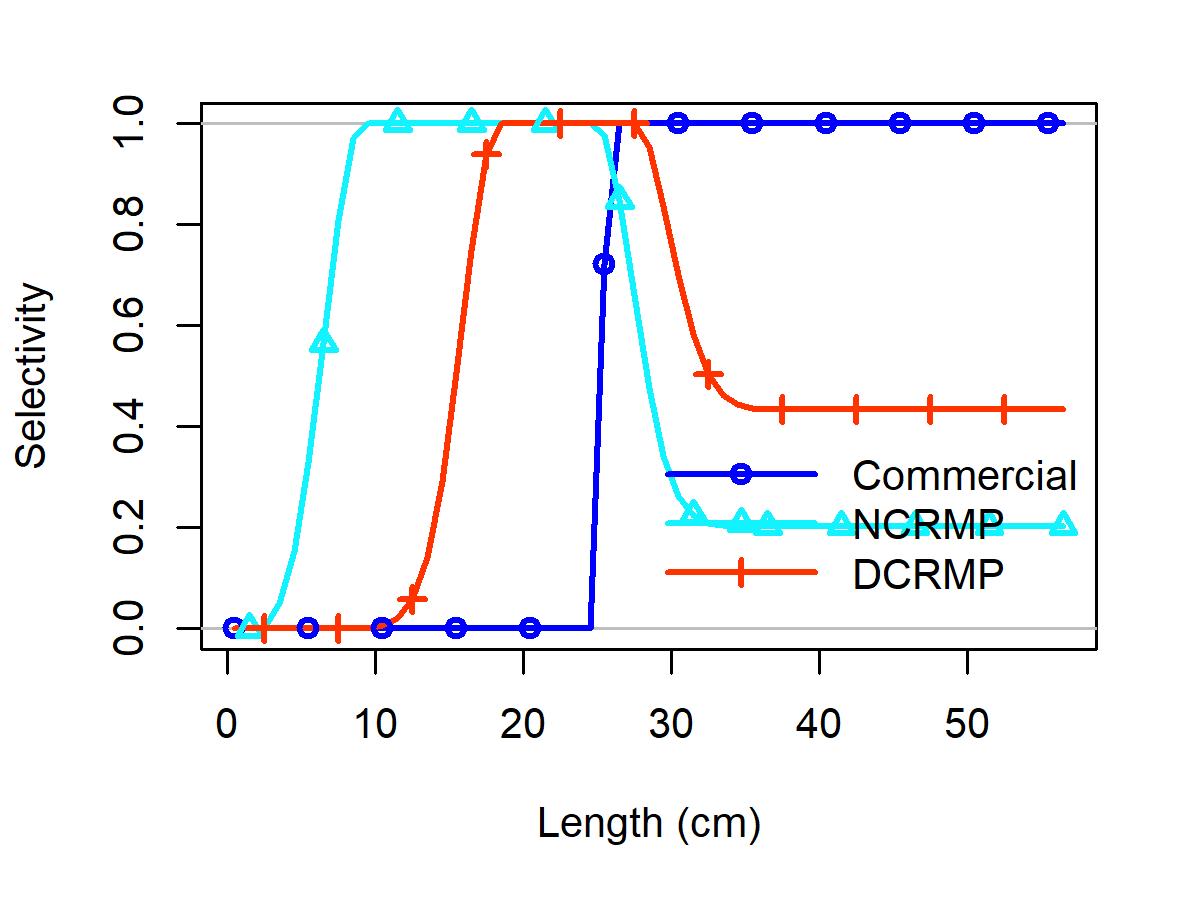
(a) Selectivity
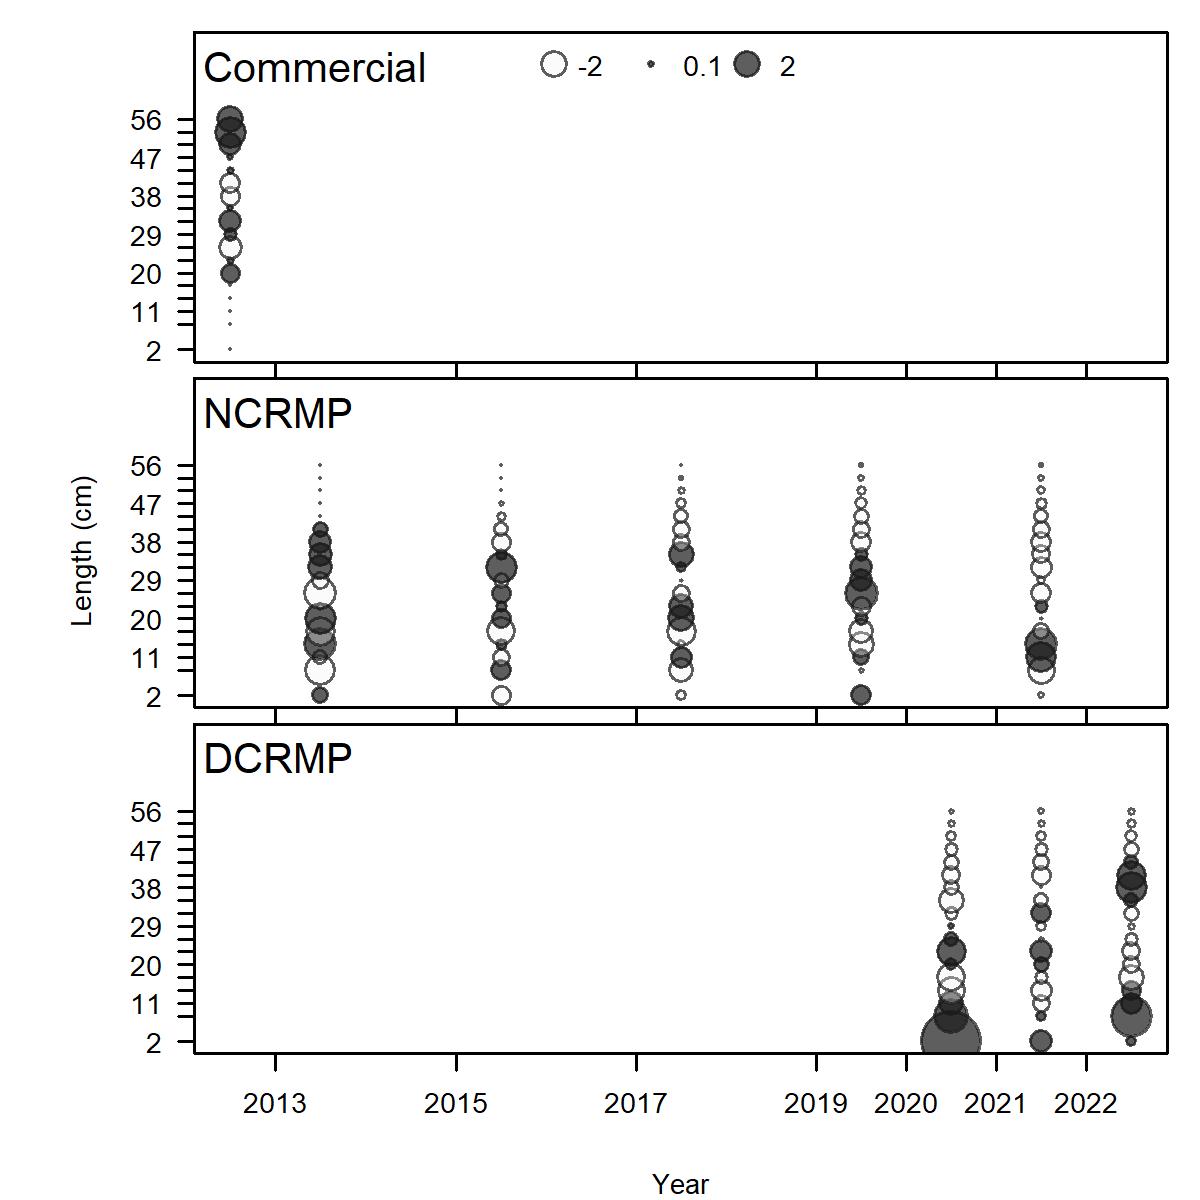
(b) Lengthfit
Figure11: St.ThomasandSt.JohnYellowtailSnapperReviewWorkshopModel STTJ_RW_2.(a)selectivityatlengthbyfleet;and(b)Pearsonresiduals,comparing acrossfleets.Closedbubblesarepositiveresiduals(observed>expected)andopen bubblesarenegativeresiduals(observed<expected).
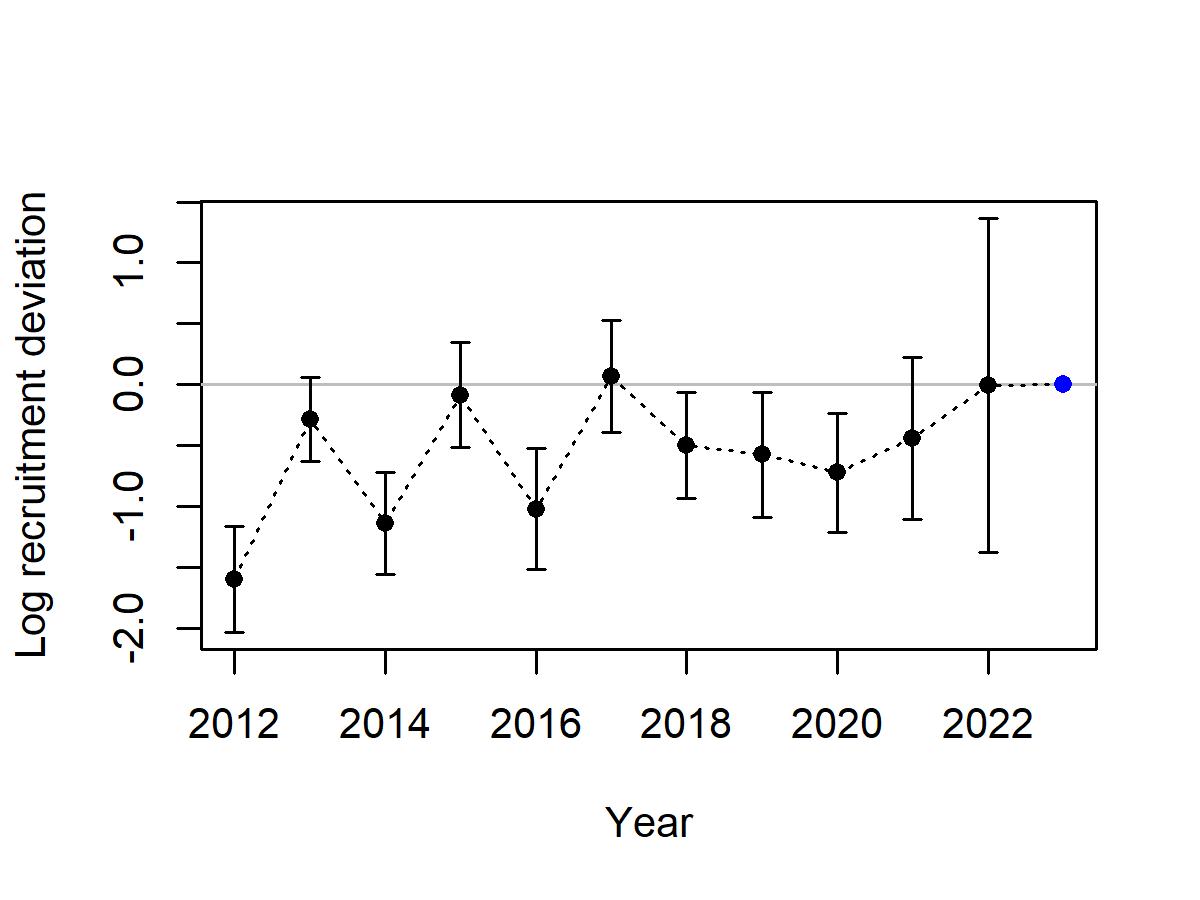
(a) Recruitmentdeviations
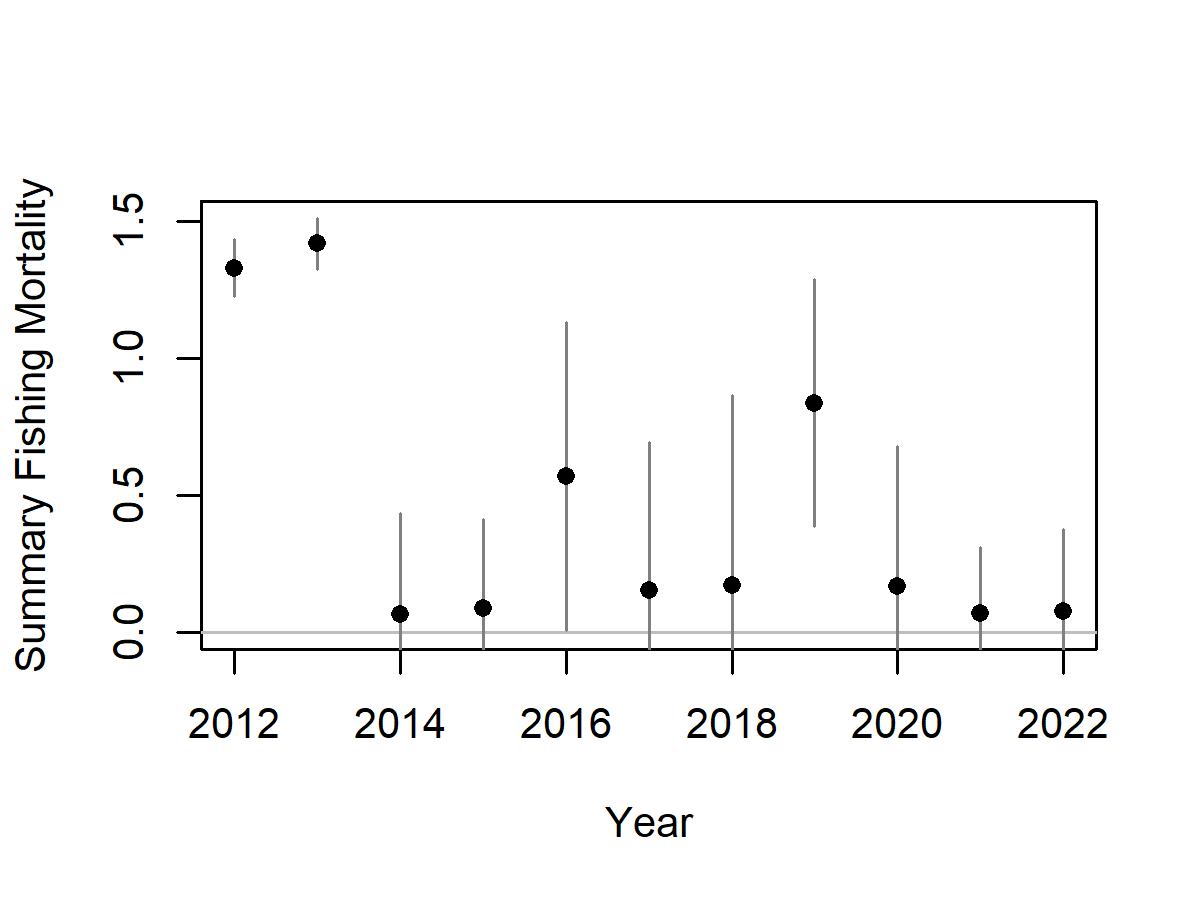
(b) FishingMortality
Figure12: St.ThomasandSt.JohnYellowtailSnapperReviewWorkshopModel STTJ_RW_2(a)Recruitmentdeviationswith95%intervals;and(b)fishingmortality (totalbiomasskilled/totalbiomass).
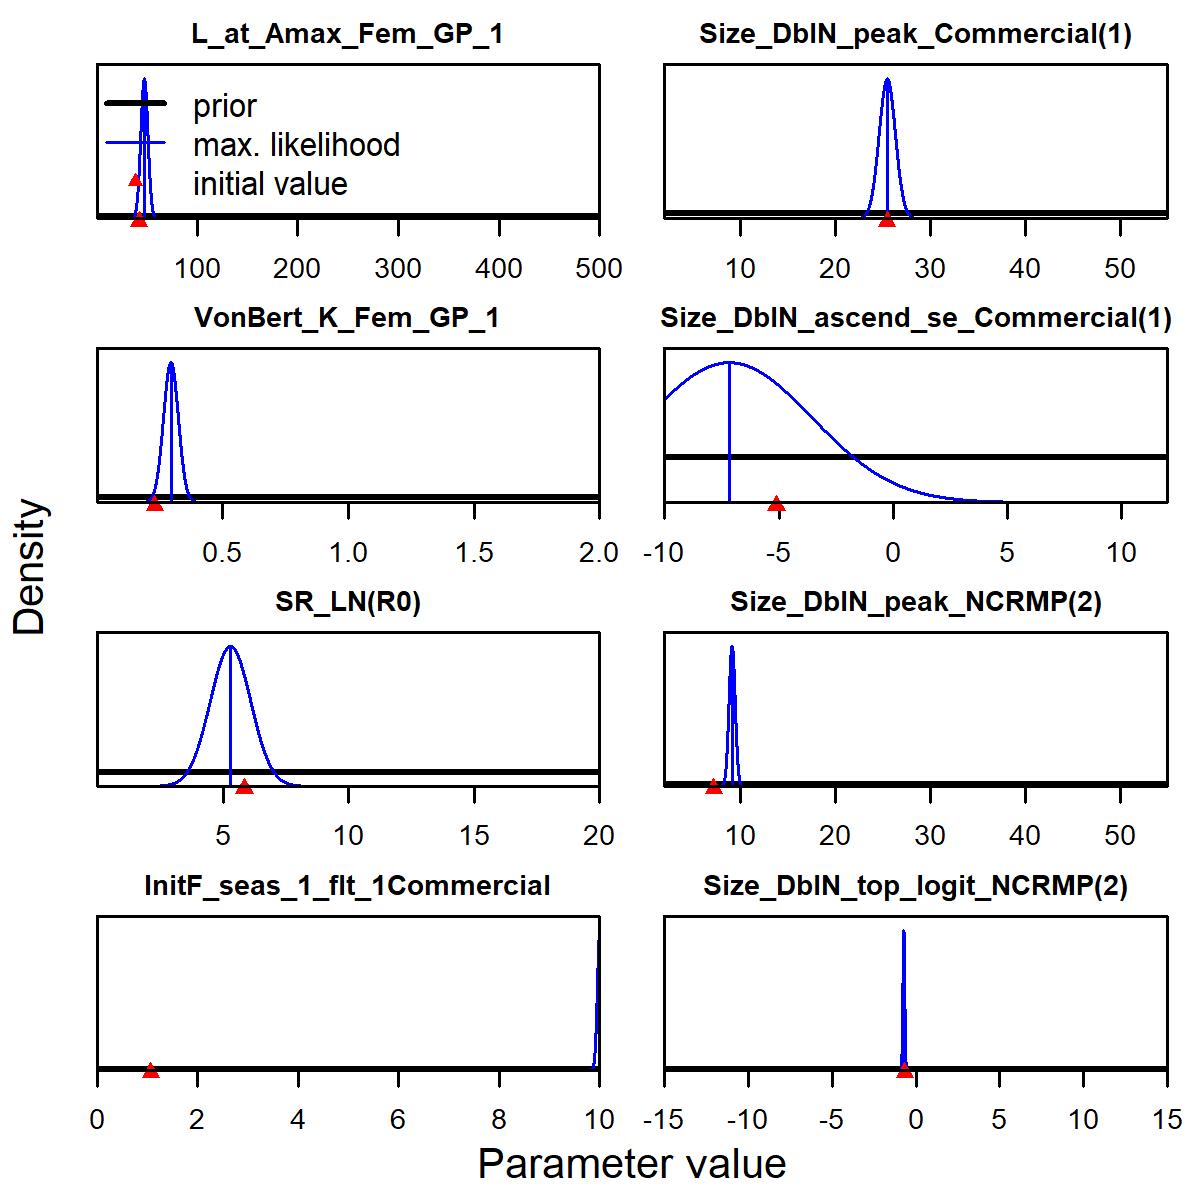
(a) Parameterspg.1of2
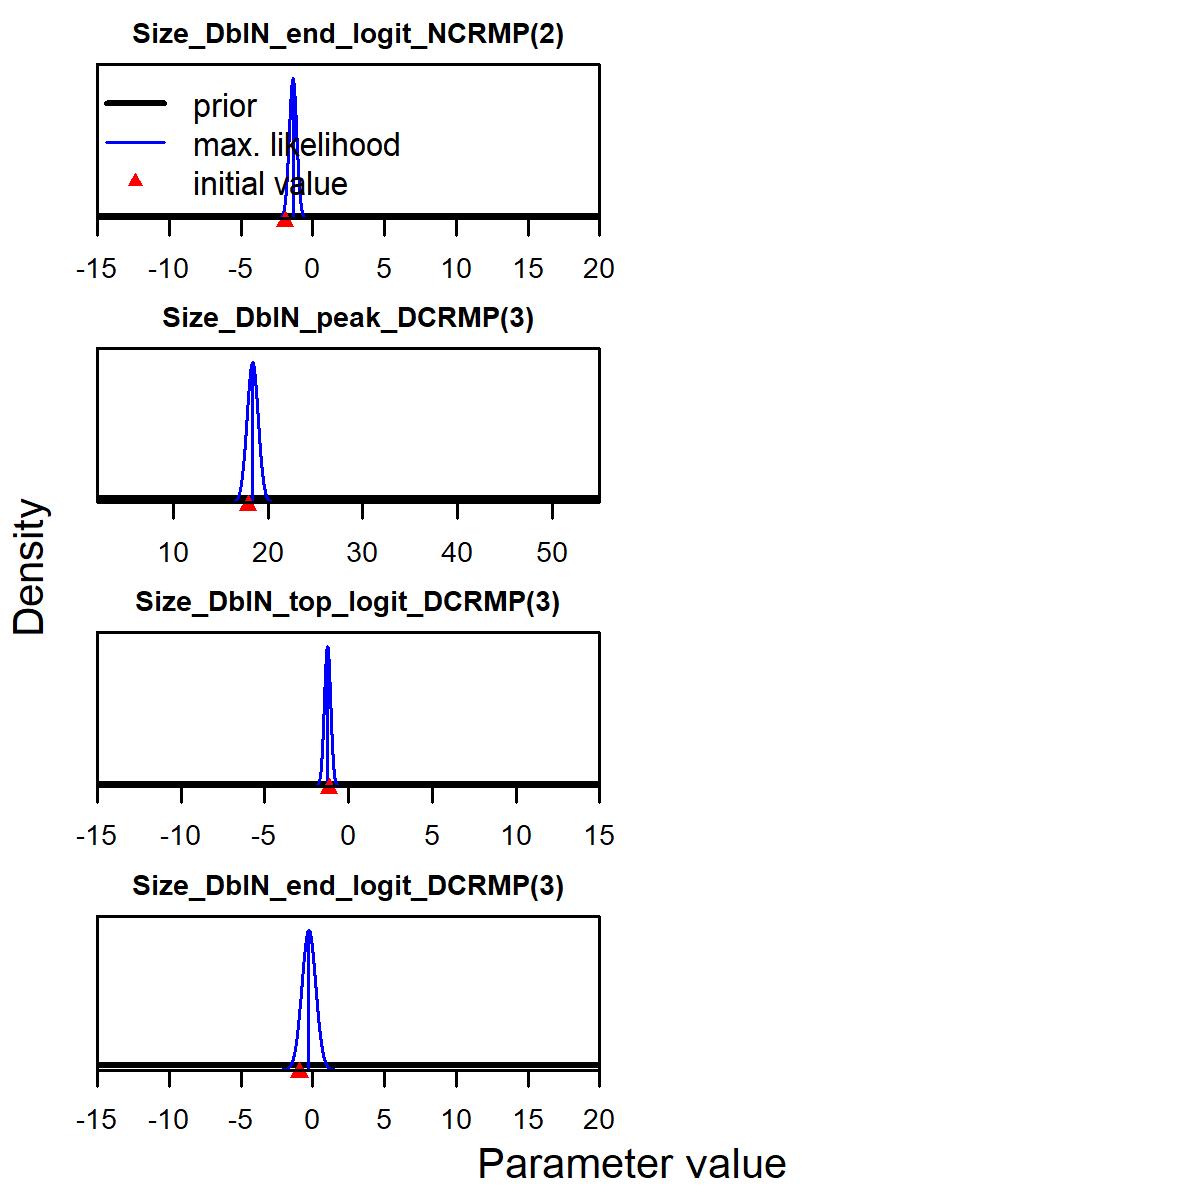
(b) Parameterspg.2of2
Figure13: ParameterdistributionplotsfortheSt.ThomasandSt.JohnYellowtailSnapper ReviewWorkshopModelSTTJ_RW_2.
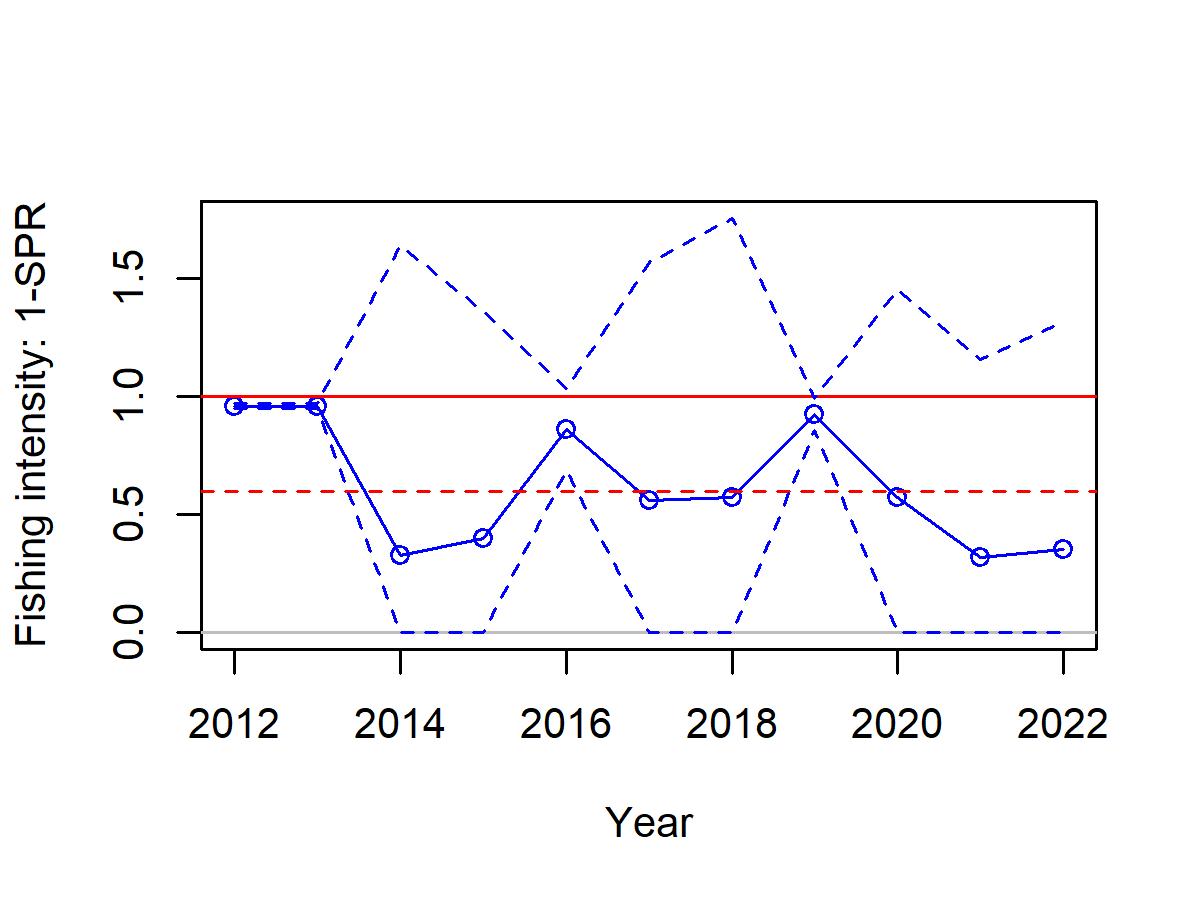
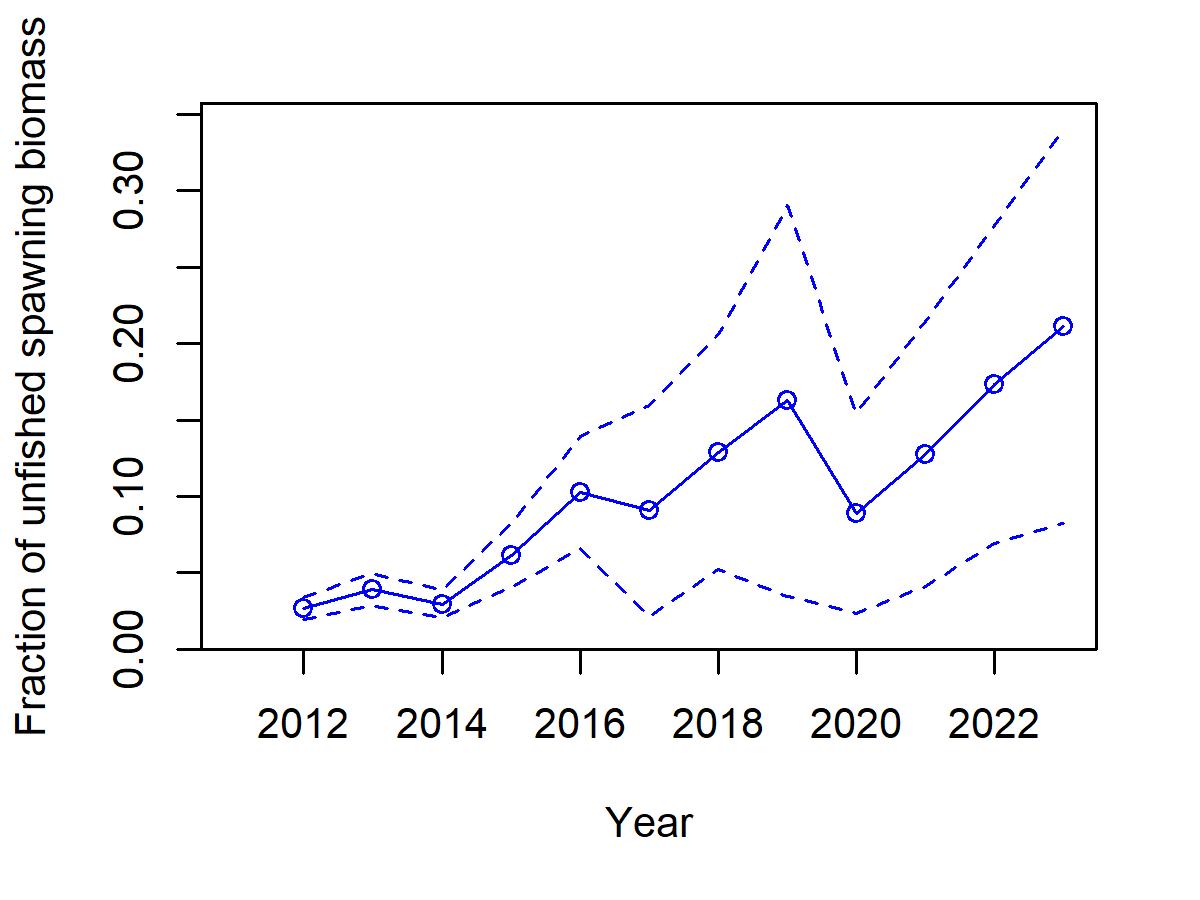
(c) Unfishedratio
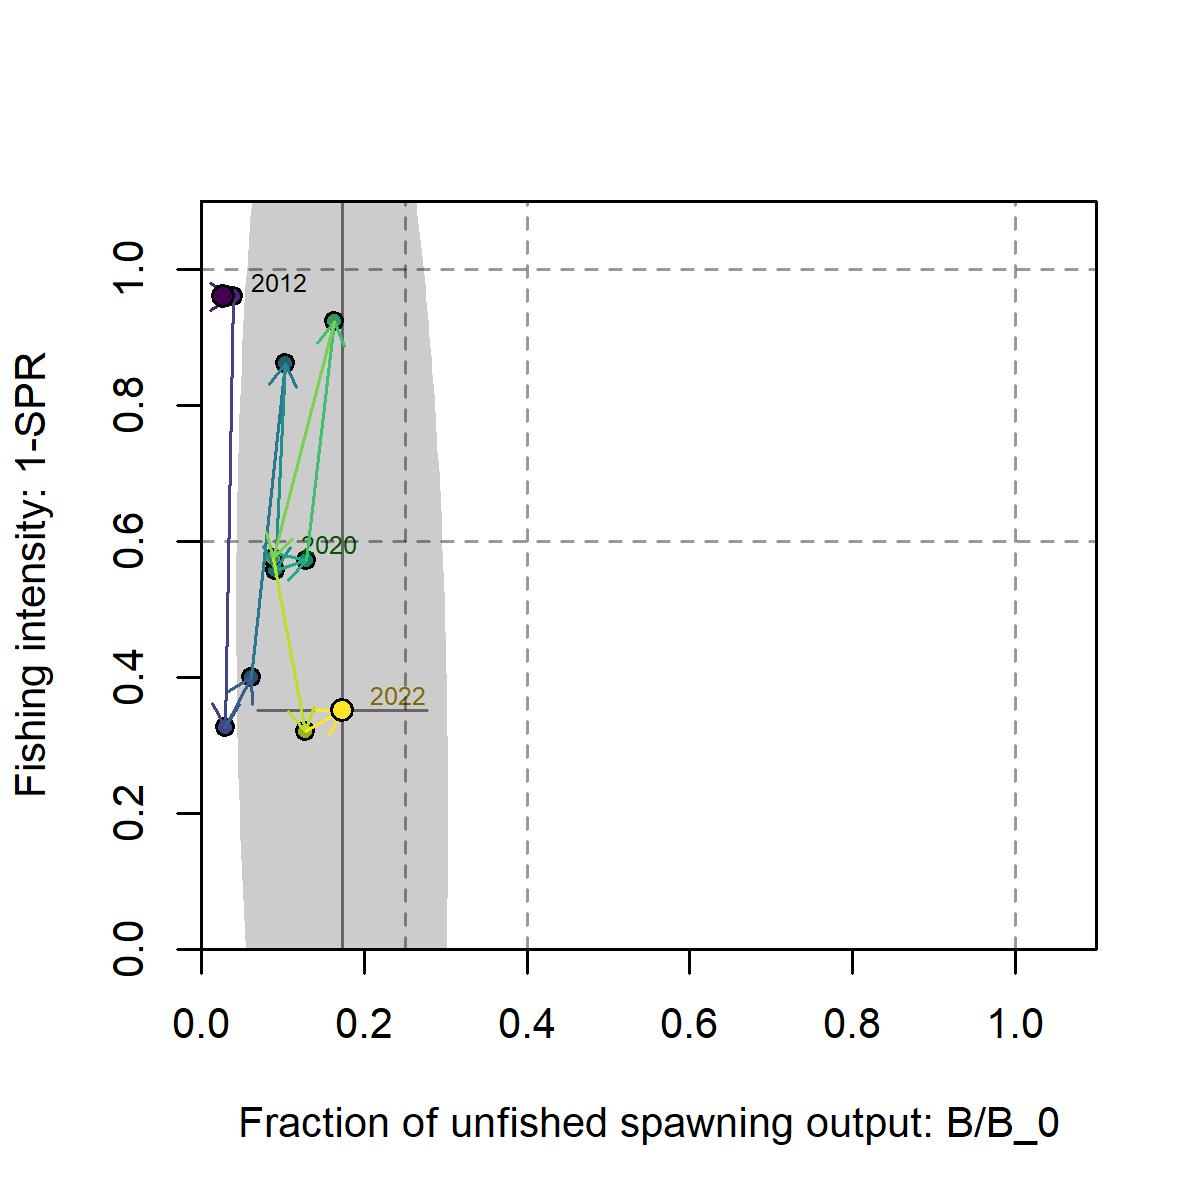
(d) SPRPhase
Figure14: St.ThomasandSt.JohnYellowtailSnapperReviewWorkshopModel STTJ_RW_2.(a)TimeseriesofSPR.HorizontalreferencelineisatSPRtarget:0.4,(b) timeseriesof1-SPR.Horizontalreferencelines1andat1-SPRtarget:1-0.4=0.6;(c) therelativespawningstockbiomass(totalbiomass/virginspawningstockbiomass)with ~95%asymptoticintervals.Horizontalreferencelinesat1andSPRtarget:0.4;and(d) phaseplotofbiomassratiovs.SPRratiowherewarmercolors(red)representearlyyears andcoldercolors(blue)representrecentyears.Linesthroughthefinalpointshow95% intervalsbasedontheasymptoticuncertaintyforeachdimension.Theshadedellipseisa 95%regionwhichaccountsfortheestimatedcorrelationbetweenthetwoquantities: -0.569.
(a) SPR
(b) SPRRatio
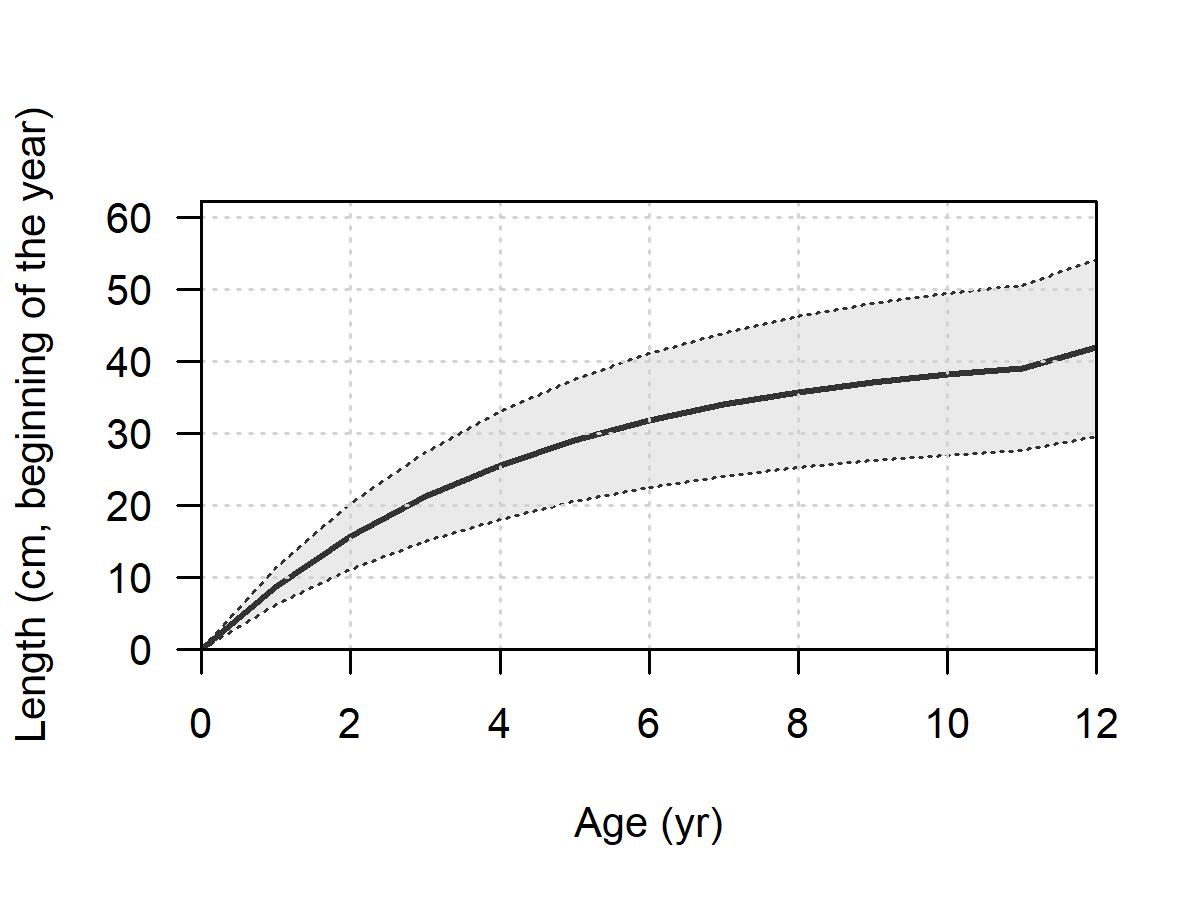
(a) Sizeatage
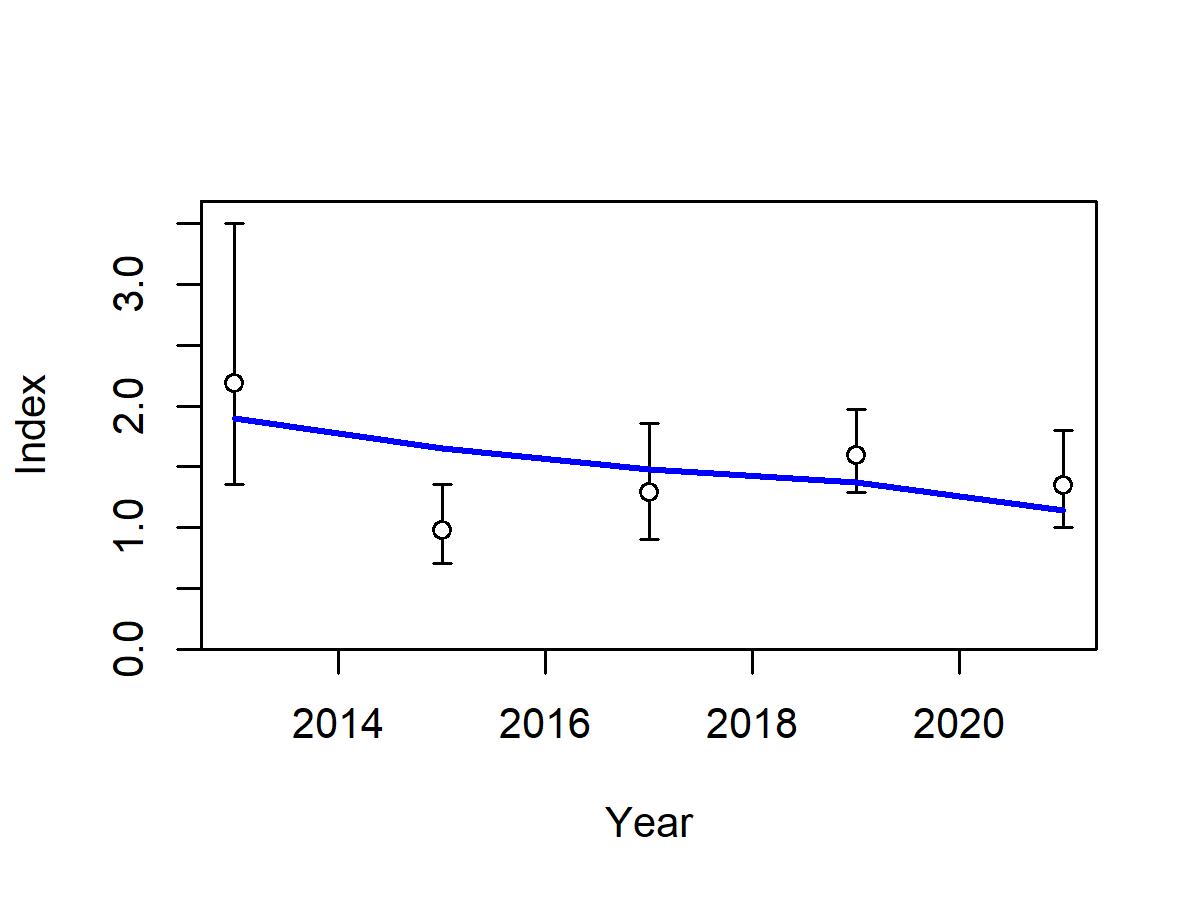
(c) IndexNCRMP
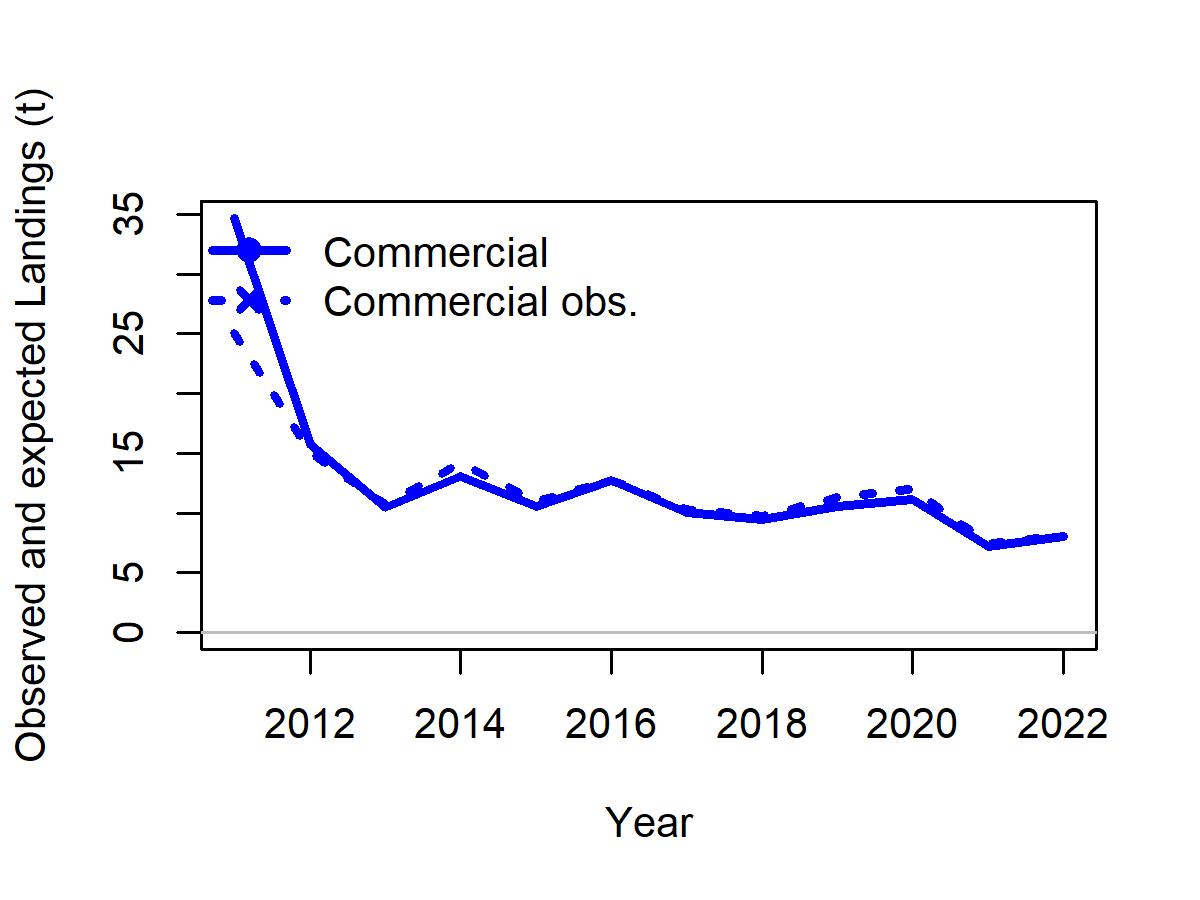
(b) Observedandexpectedlandings
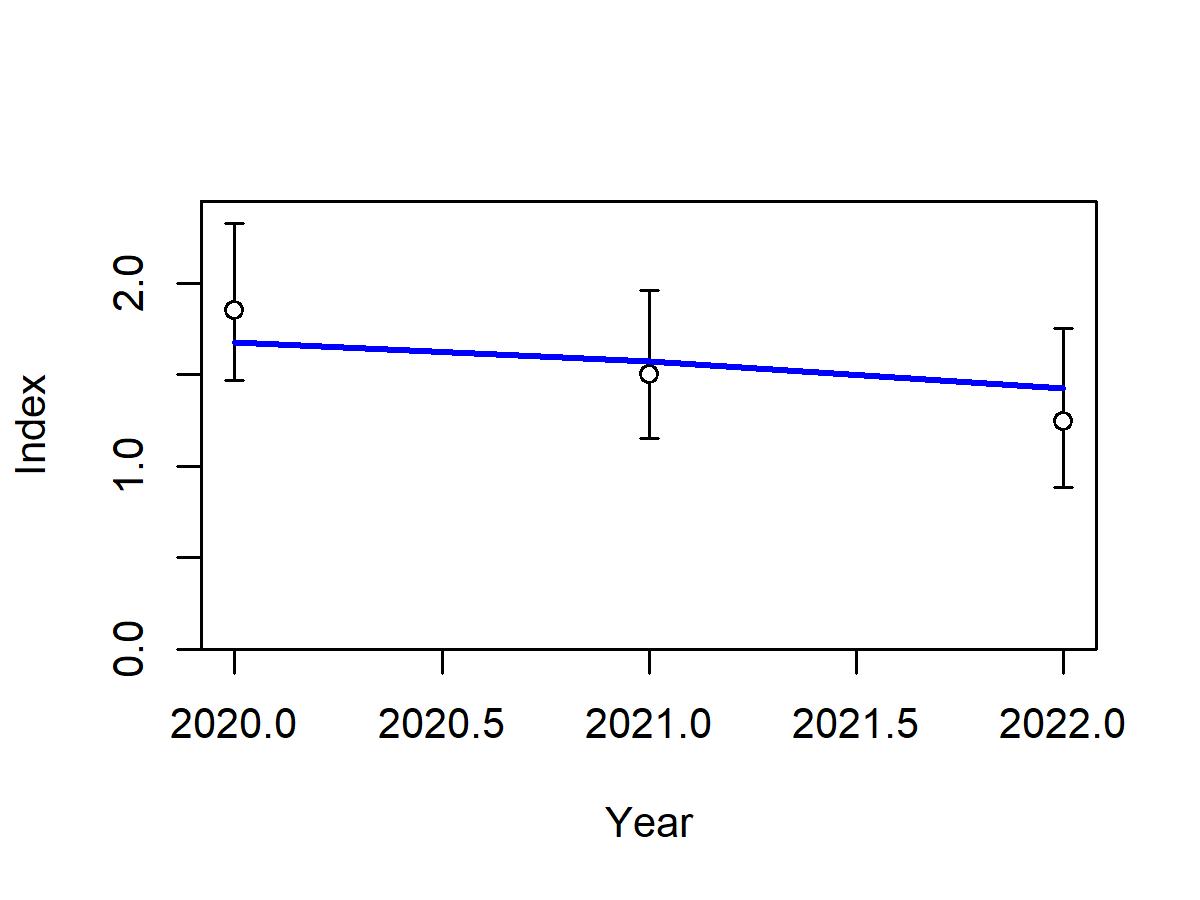
(d) IndexDCRMP
Figure15: St.ThomasandSt.JohnYellowtailSnapperReviewWorkshopModel STTJ_RW_3.(a)Lengthatageinthebeginningoftheyear(orseason)inthefinalyear ofthemodel.Shadedareaindicates95%distributionoflengthatagearoundestimated growthcurve;(b)observedandexpectedlandings;(c)FittoindexdatafortheNCRMP survey.;and(d)FittoindexdatafortheDCRMPsurvey.
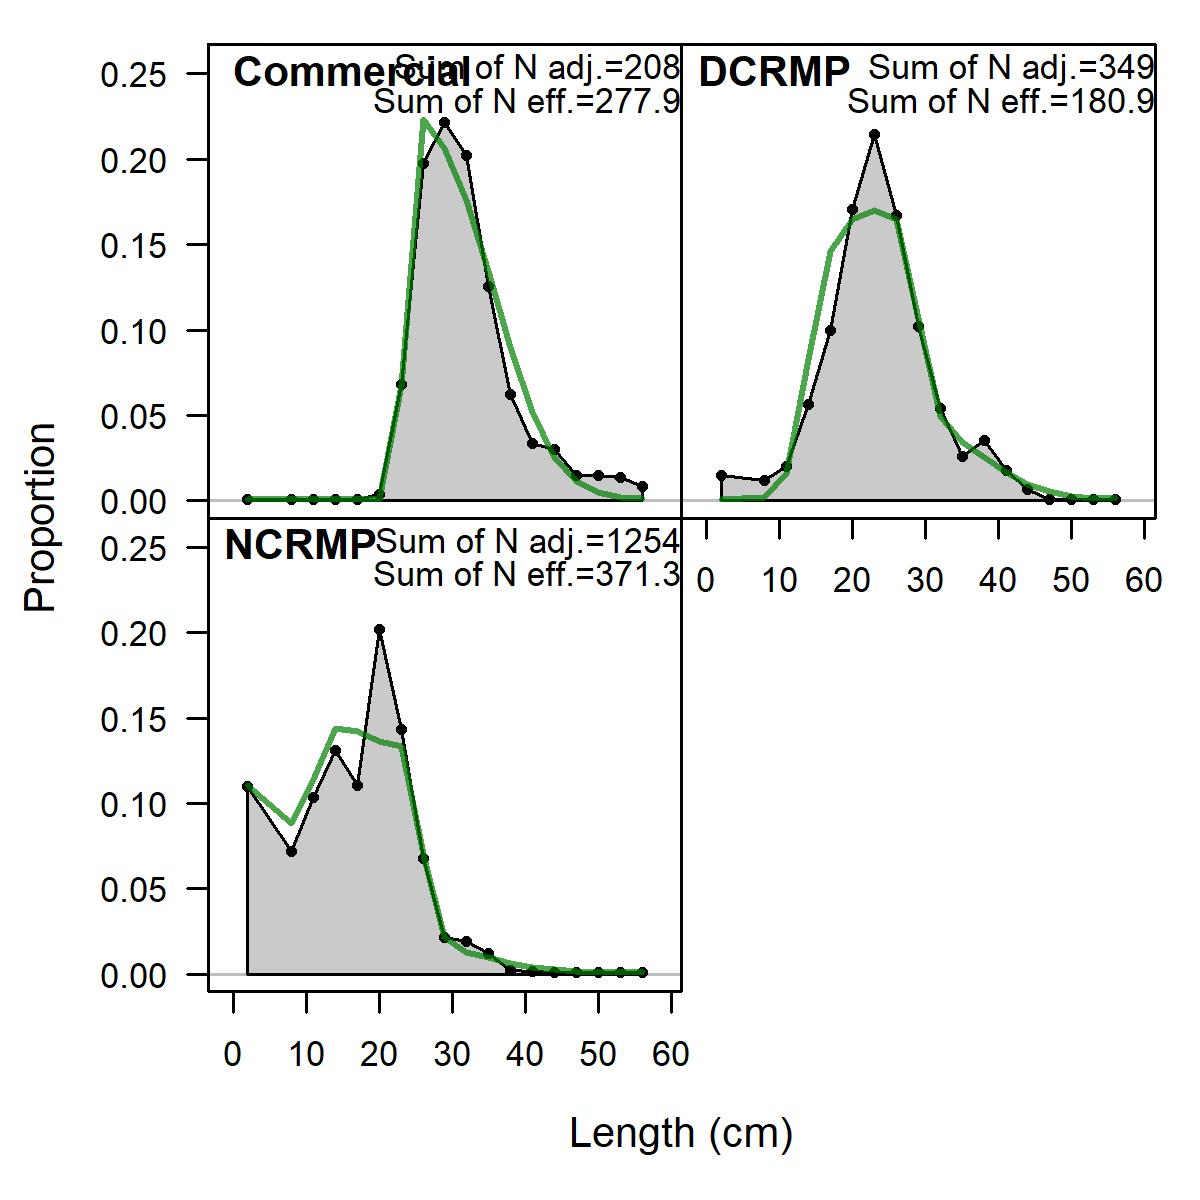
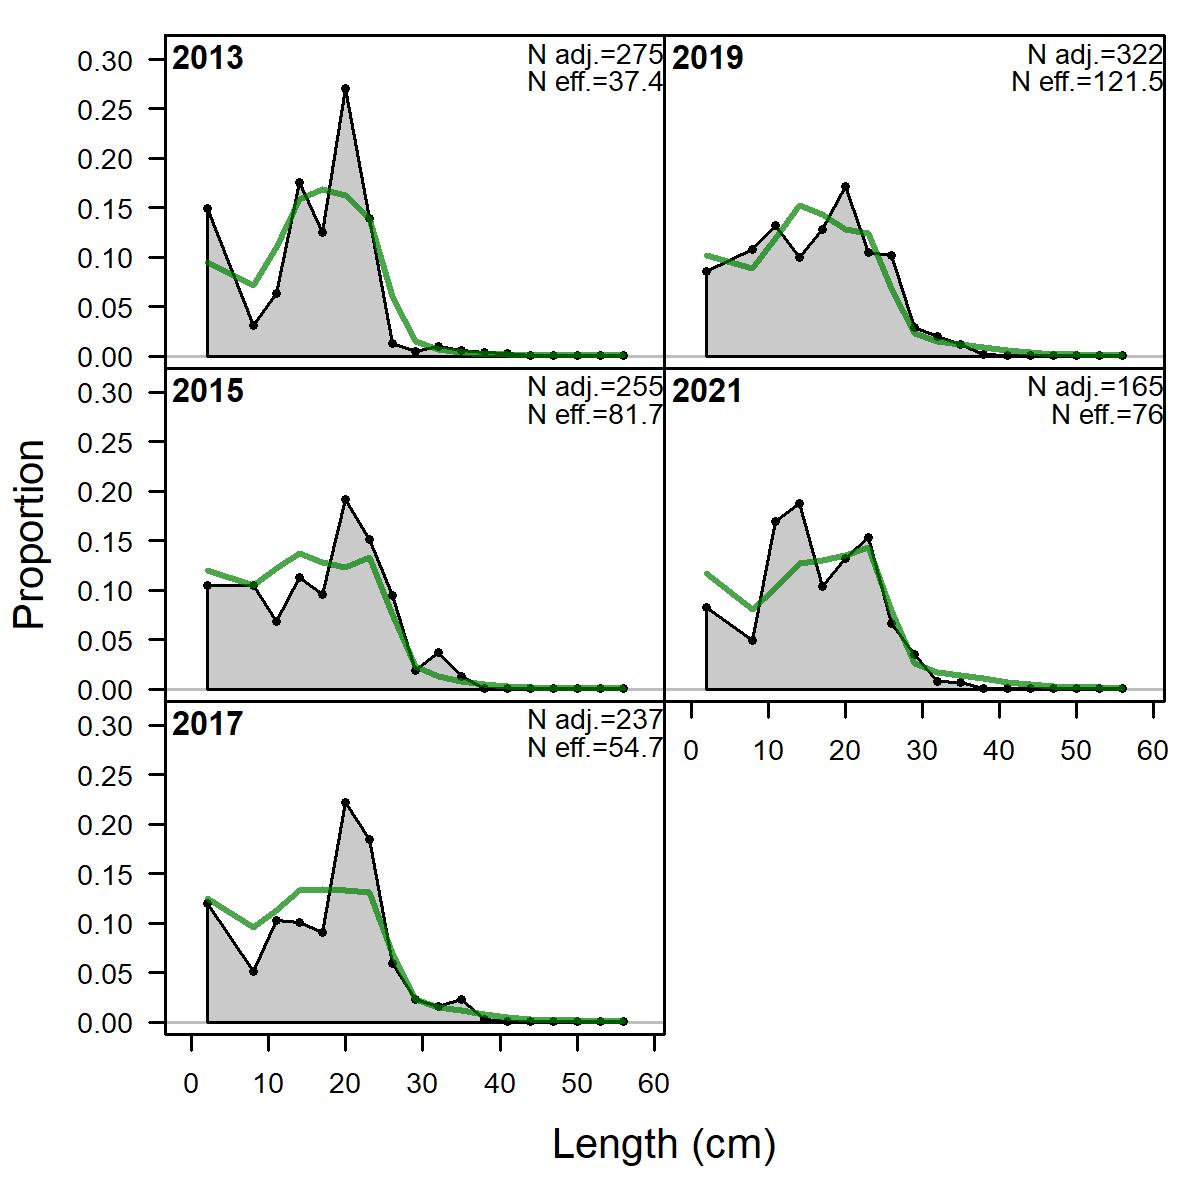
(a) Lengthfitaggregatedacrosstime (b) LengthcompsNCRMP
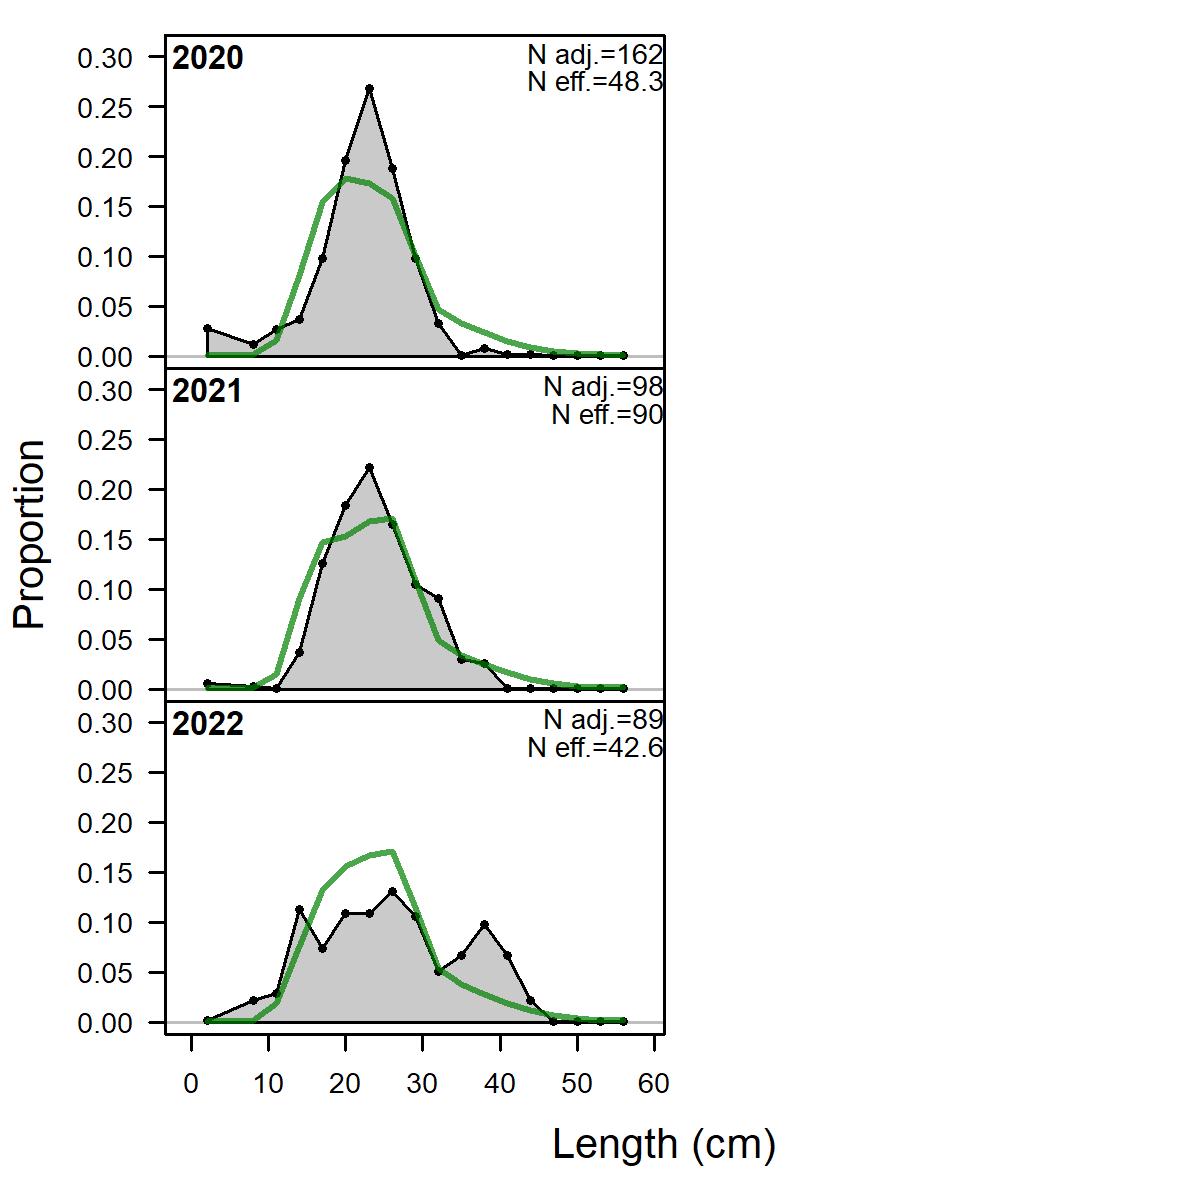
(c) LengthcompsDCRMP
Figure16: St.ThomasandSt.JohnYellowtailSnapperReviewWorkshopModel STTJ_RW_3.(a)Observedandpredictedlengthdistributionsincentimeters,aggregated acrosstimebyfleet;(b)observedandpredictedlengthdistributionsincentimeters,by yearfortheNCRMPsurvey;and(c)observedandpredictedlengthdistributionsin centimeters,byyearfortheDCRMPsurvey.‘Nadj.’istheinputsamplesizeafter data-weightingadjustment.Neff.isthecalculatedeffectivesamplesizeusedinthe McAllister-Ianellituningmethod.
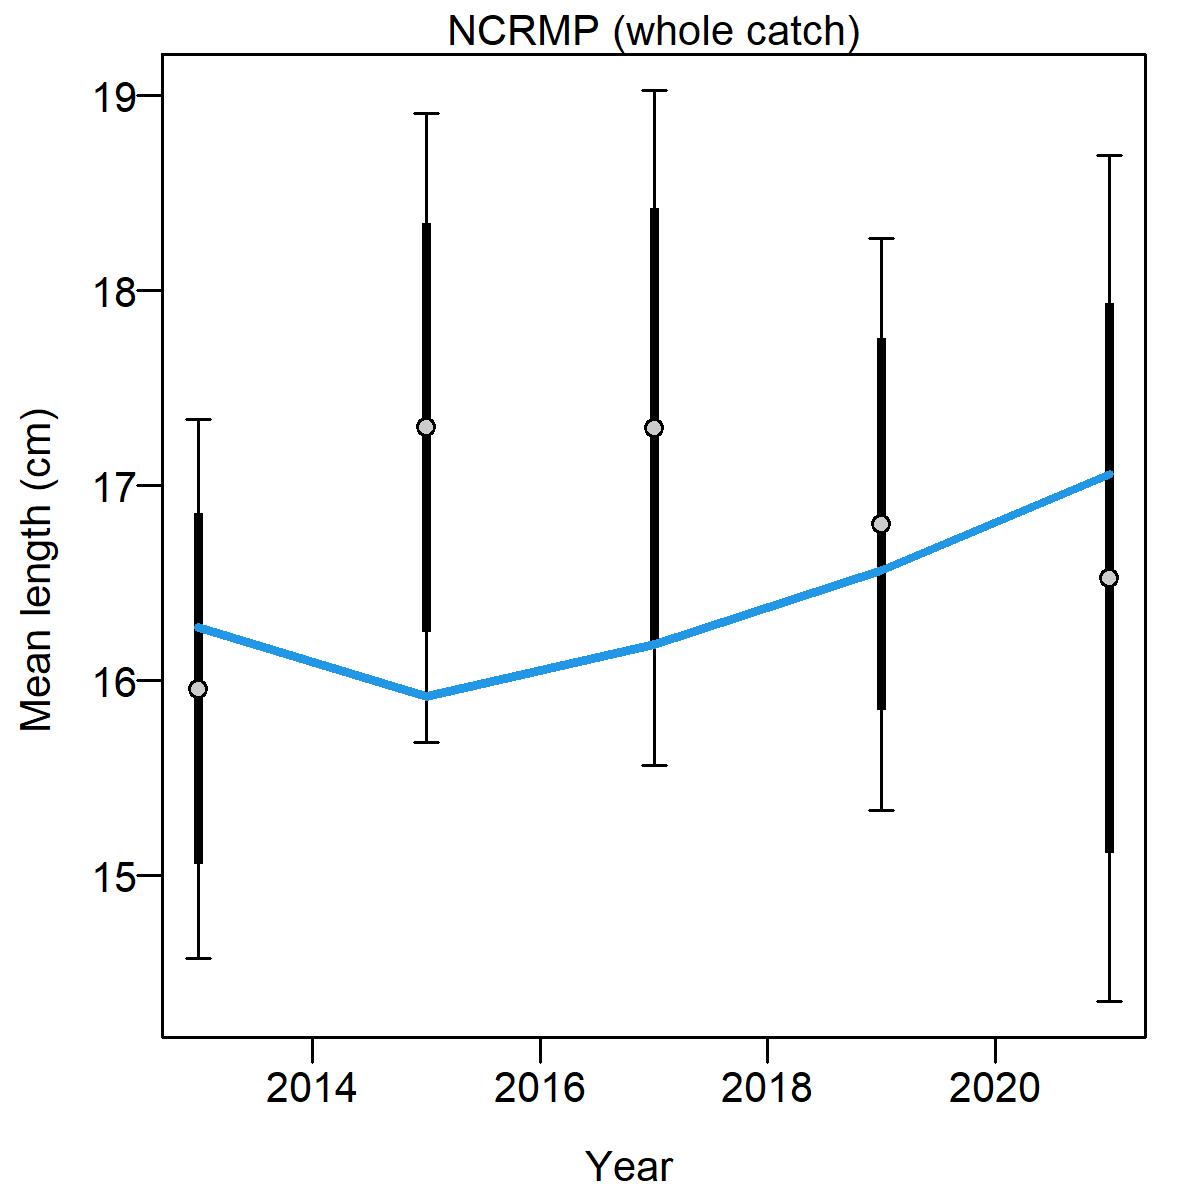
(a) MeanlengthNCRMP
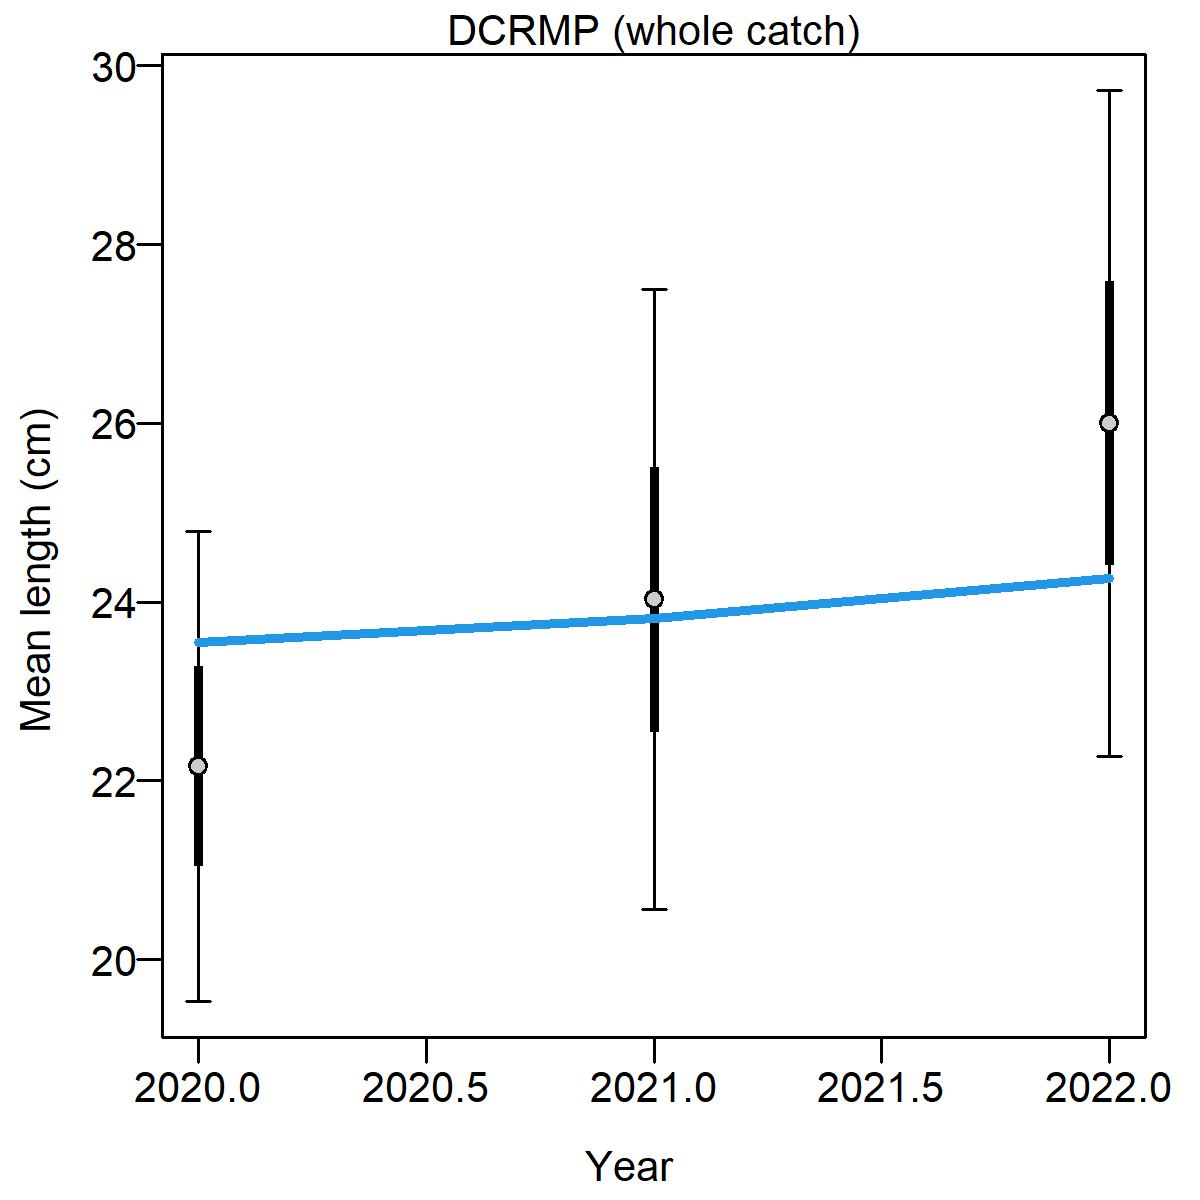
(b) MeanlengthDCRMP
Figure17: St.ThomasandSt.JohnYellowtailSnapperReviewWorkshopModel STTJ_RW_3.Meanlengthforwith95%confidenceintervalsfor(a)theNCRMPsurvey andfor(b)theDCRMP.
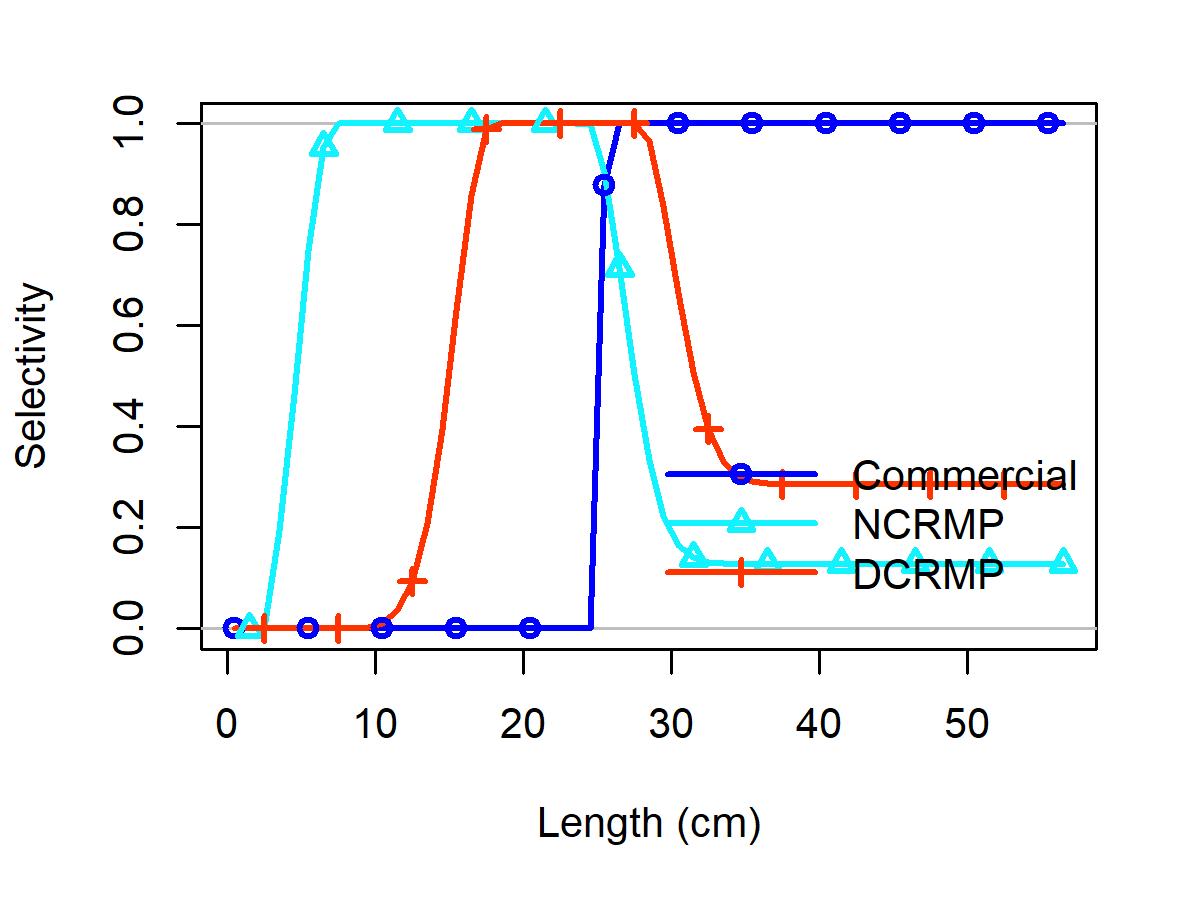
(a) Selectivity
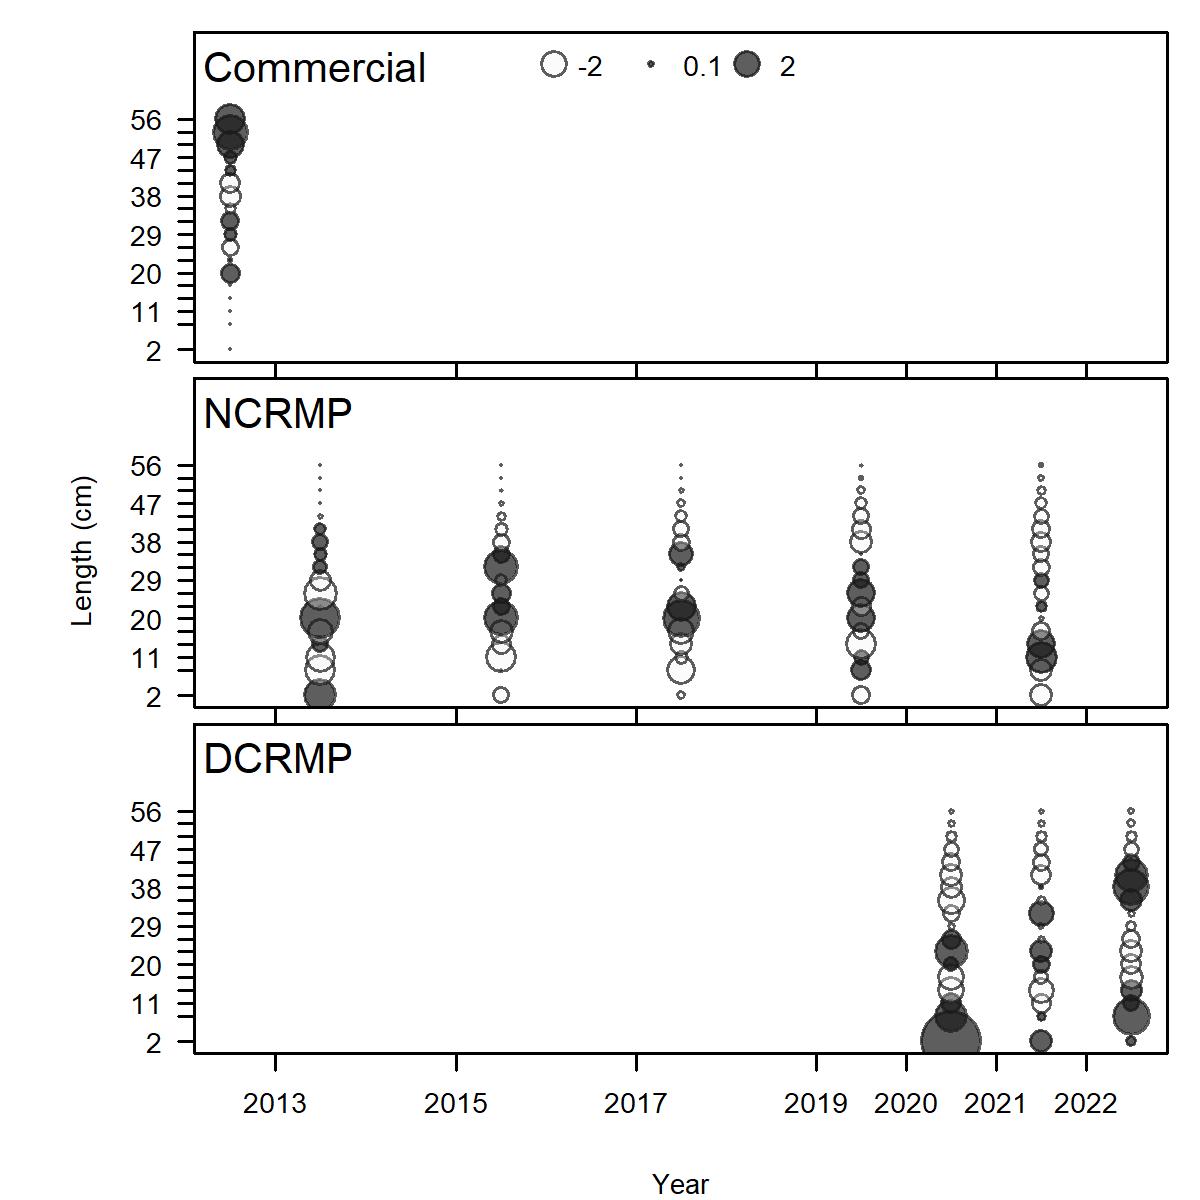
(b) Lengthfit
Figure18: St.ThomasandSt.JohnYellowtailSnapperReviewWorkshopModel STTJ_RW_3.(a)selectivityatlengthbyfleet;and(b)Pearsonresiduals,comparing acrossfleets.Closedbubblesarepositiveresiduals(observed>expected)andopen bubblesarenegativeresiduals(observed<expected).
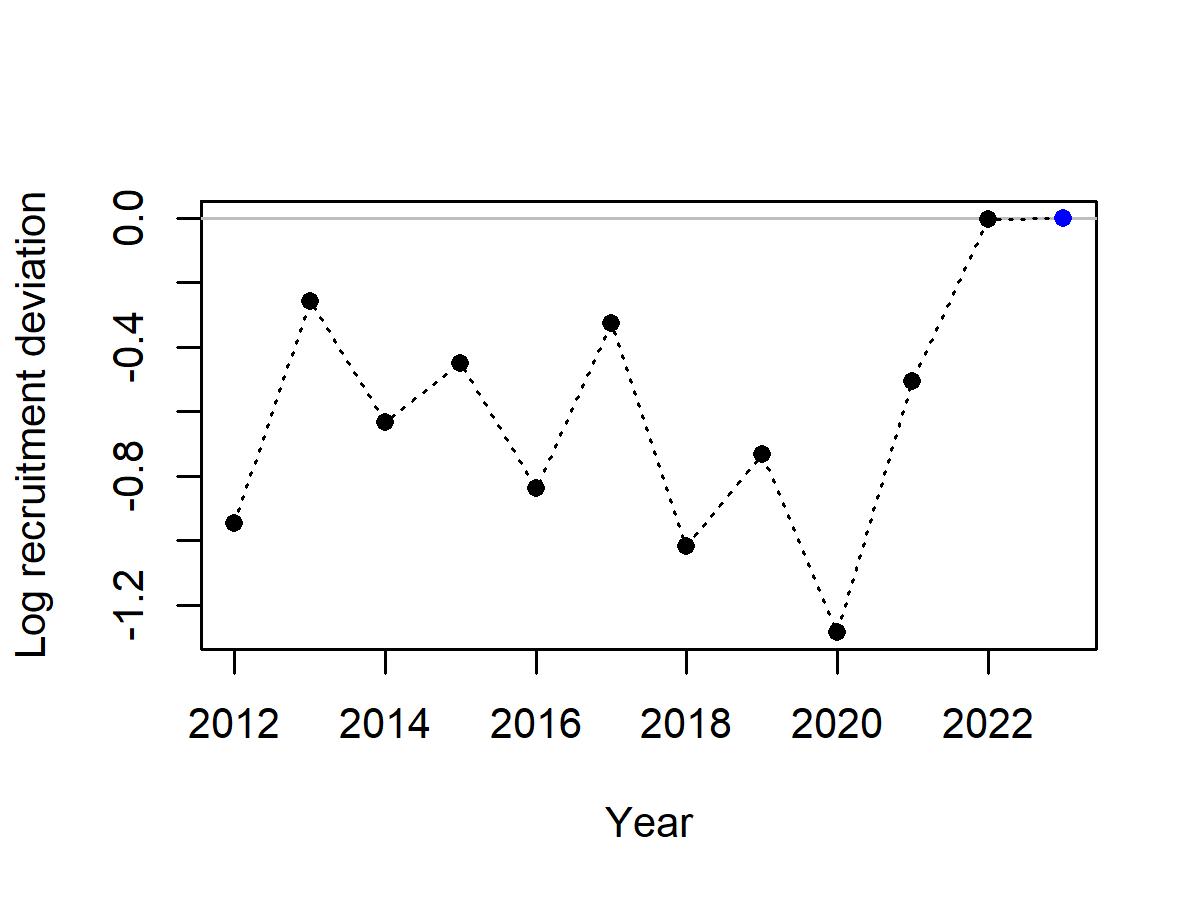
(a) Recruitmentdeviations
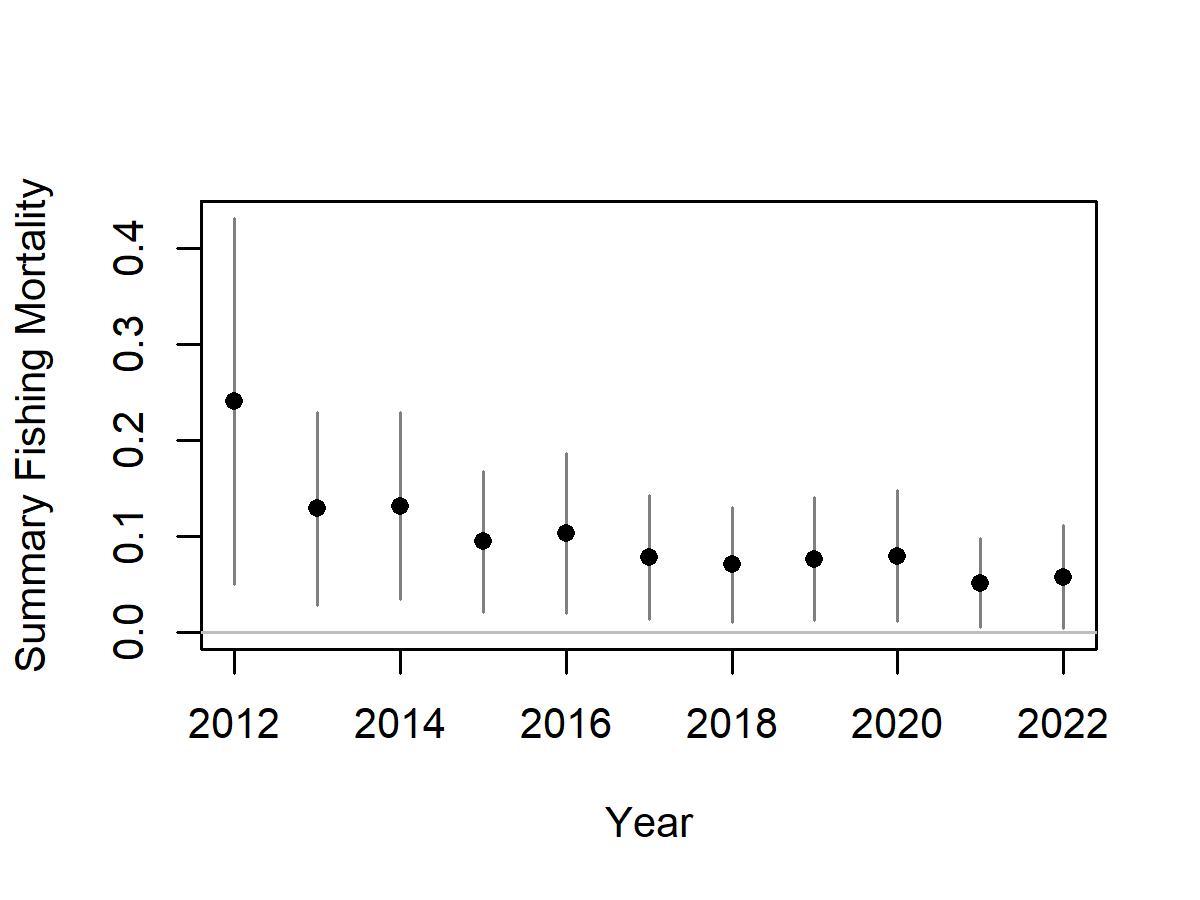
(b) FishingMortality
Figure19: St.ThomasandSt.JohnYellowtailSnapperReviewWorkshopModel STTJ_RW_3.(a)Recruitmentdeviationswith95%intervals;and(b)fishingmortality (totalbiomasskilled/totalbiomass).
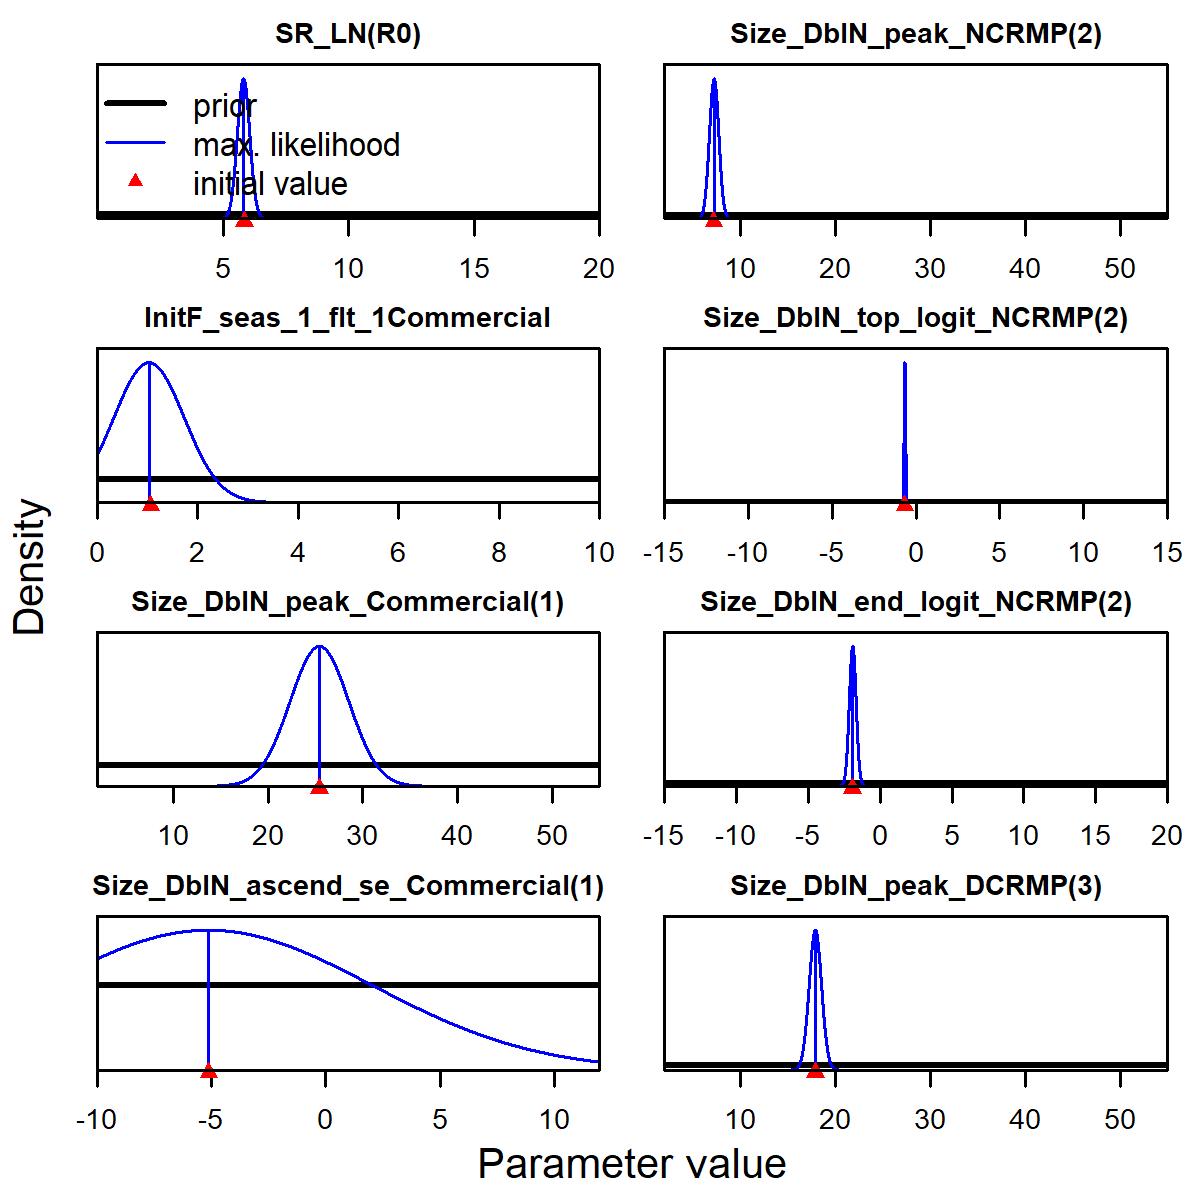
(a) Parameterspg.1of2
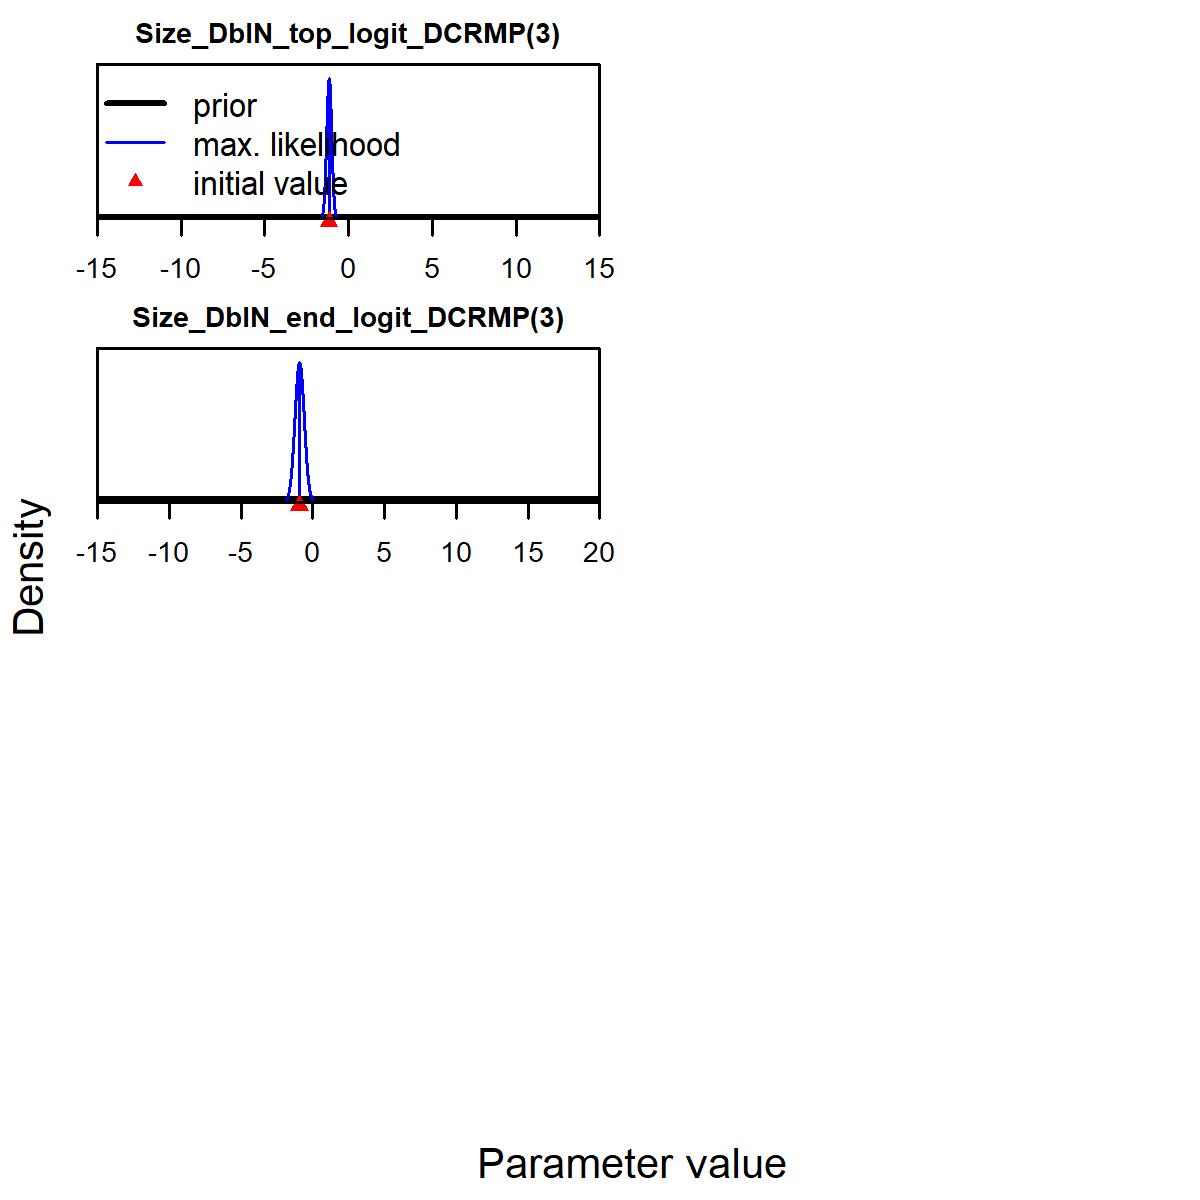
(b) Parameterspg.2of2
Figure20: ParameterdistributionplotsfortheSt.ThomasandSt.JohnYellowtailSnapper ReviewWorkshopModelSTTJ_RW_3.
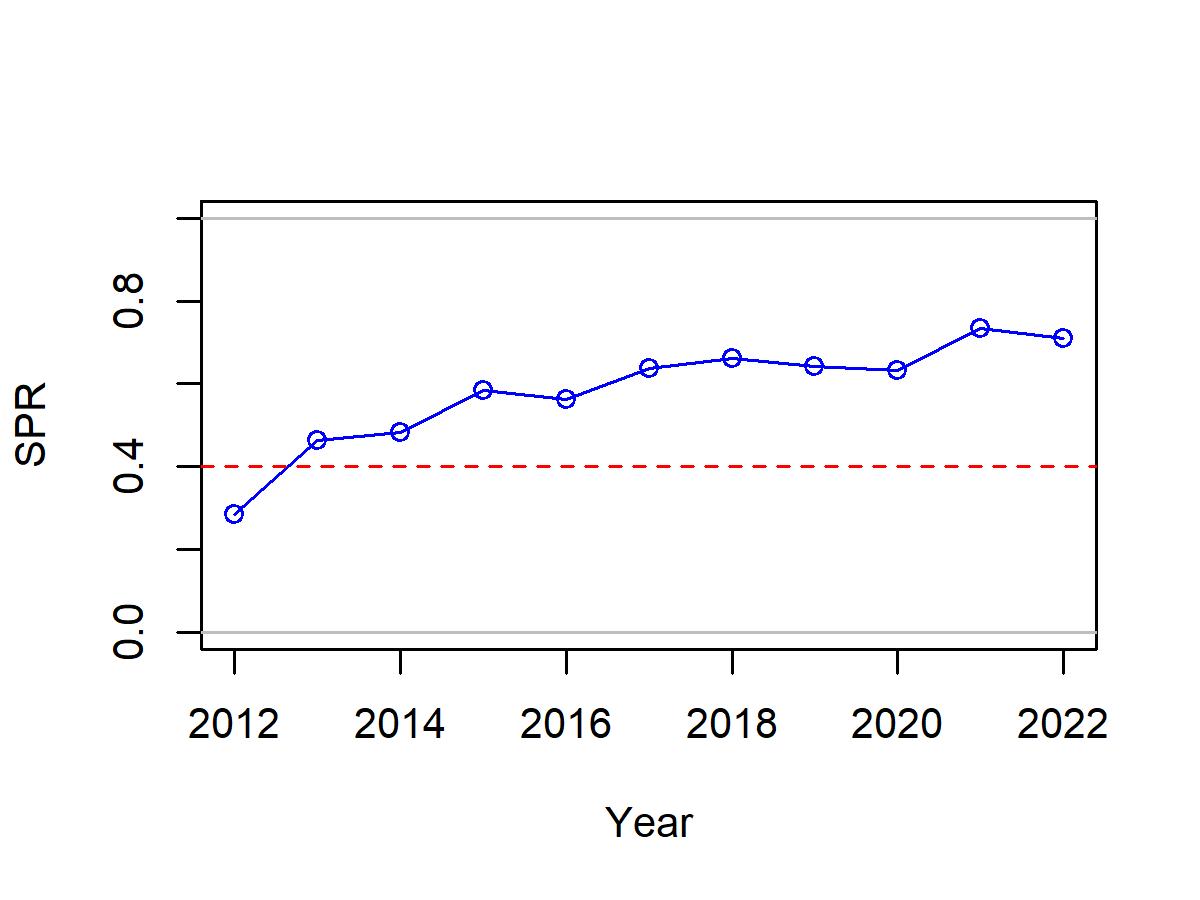
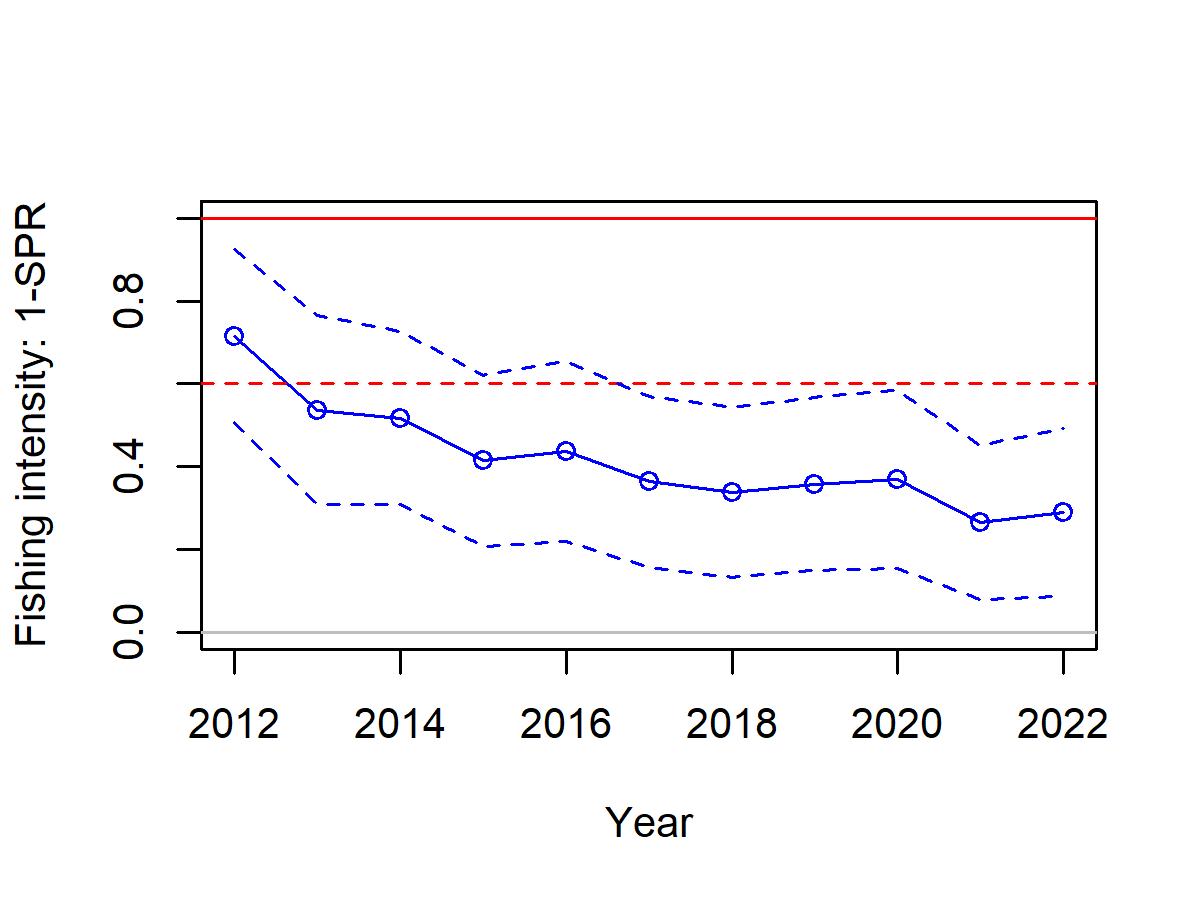
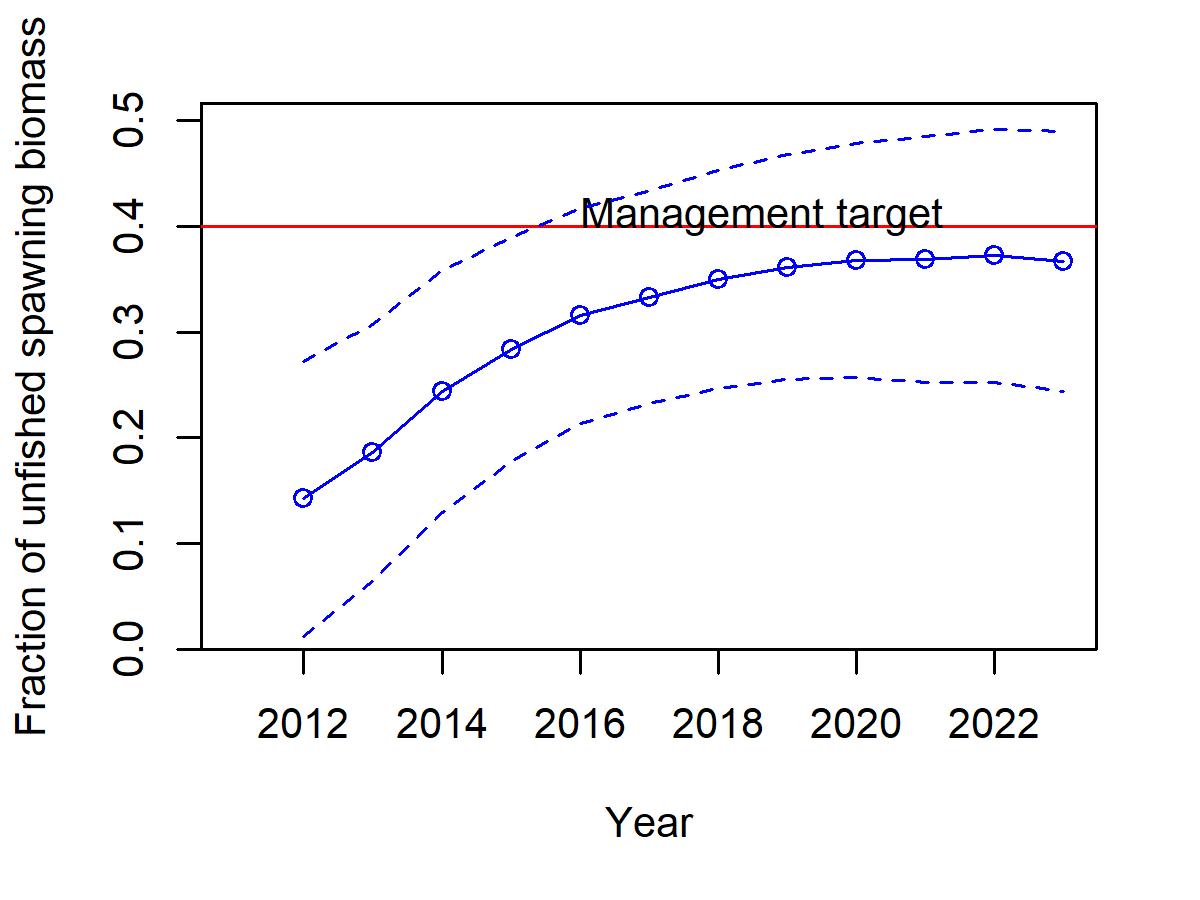
(c) Unfishedratio
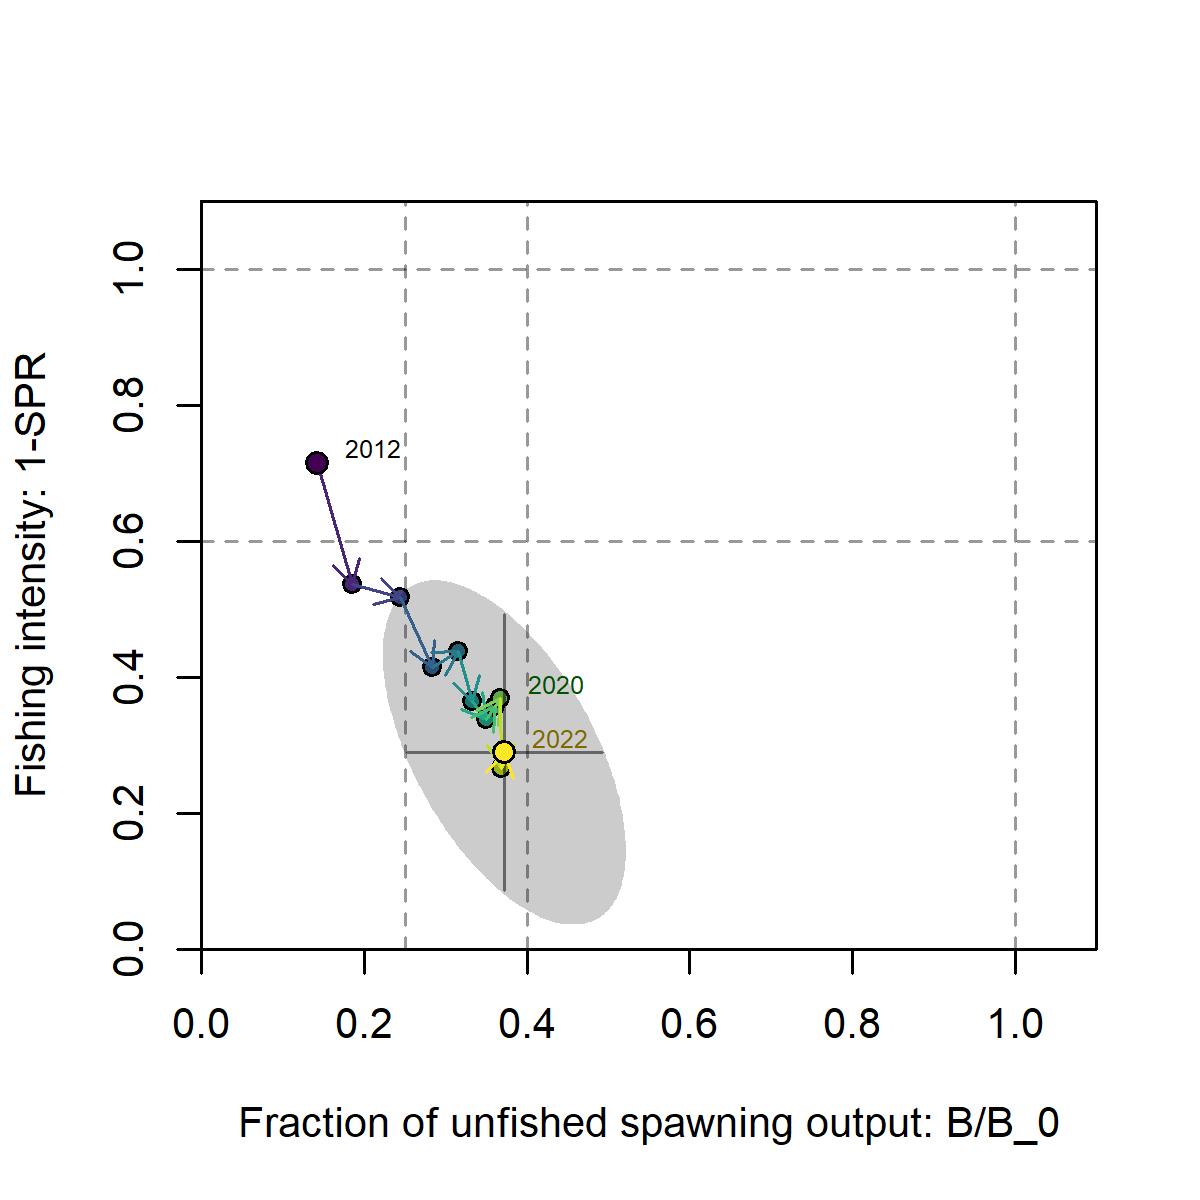
(d) SPRPhase
Figure21: St.ThomasandSt.JohnYellowtailSnapperReviewWorkshopModel STTJ_RW_3.(a)TimeseriesofSPR.HorizontalreferencelineisatSPRtarget:0.4,(b) timeseriesof1-SPR.Horizontalreferencelines1andat1-SPRtarget:1-0.4=0.6;(c) therelativespawningstockbiomass(totalbiomass/virginspawningstockbiomass)with ~95%asymptoticintervals.Horizontalreferencelinesat1andSPRtarget:0.4;and(d) phaseplotofbiomassratiovs.SPRratiowherewarmercolors(red)representearlyyears andcoldercolors(blue)representrecentyears.Linesthroughthefinalpointshow95% intervalsbasedontheasymptoticuncertaintyforeachdimension.Theshadedellipseisa 95%regionwhichaccountsfortheestimatedcorrelationbetweenthetwoquantities: -0.126.
(a) SPR
(b) SPRRatio