Caribbean Climate Vulnerability Assessment
Project Introduction and Updates
Presented By: Presented To:
Harms-Tuohy, Ph.D. Lunch & Learn Program
Chelsea
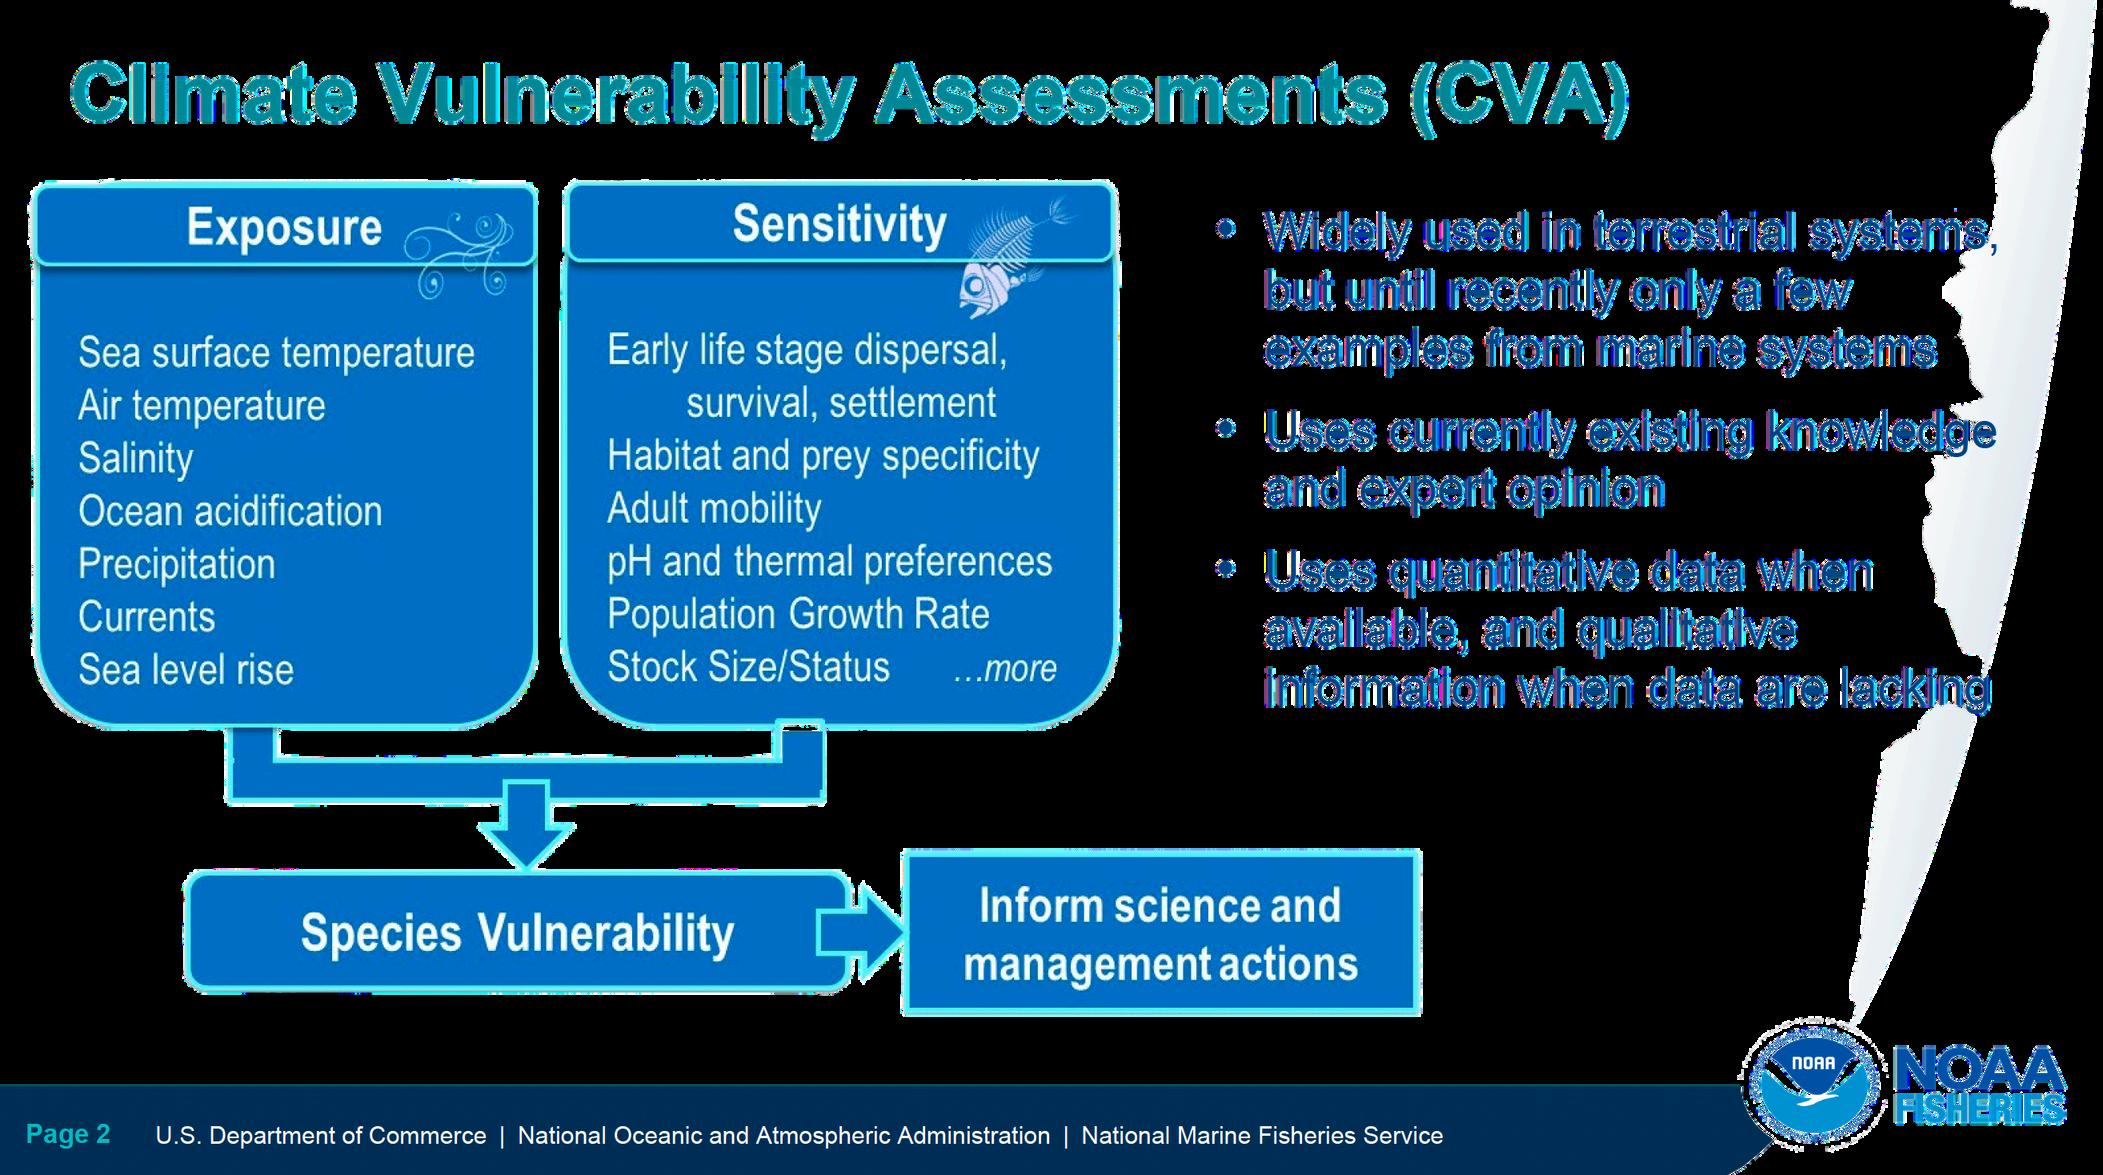
Graphic from NOAA Fisheries HMS CVA Training Presentation
Project Introduction and Updates
Presented By: Presented To:
Harms-Tuohy, Ph.D. Lunch & Learn Program
The process by which we evaluate the vulnerability of a species to changing environmental conditions.
This is a standardized method that considers variability among reviewers to construct a single vulnerability score for that species.
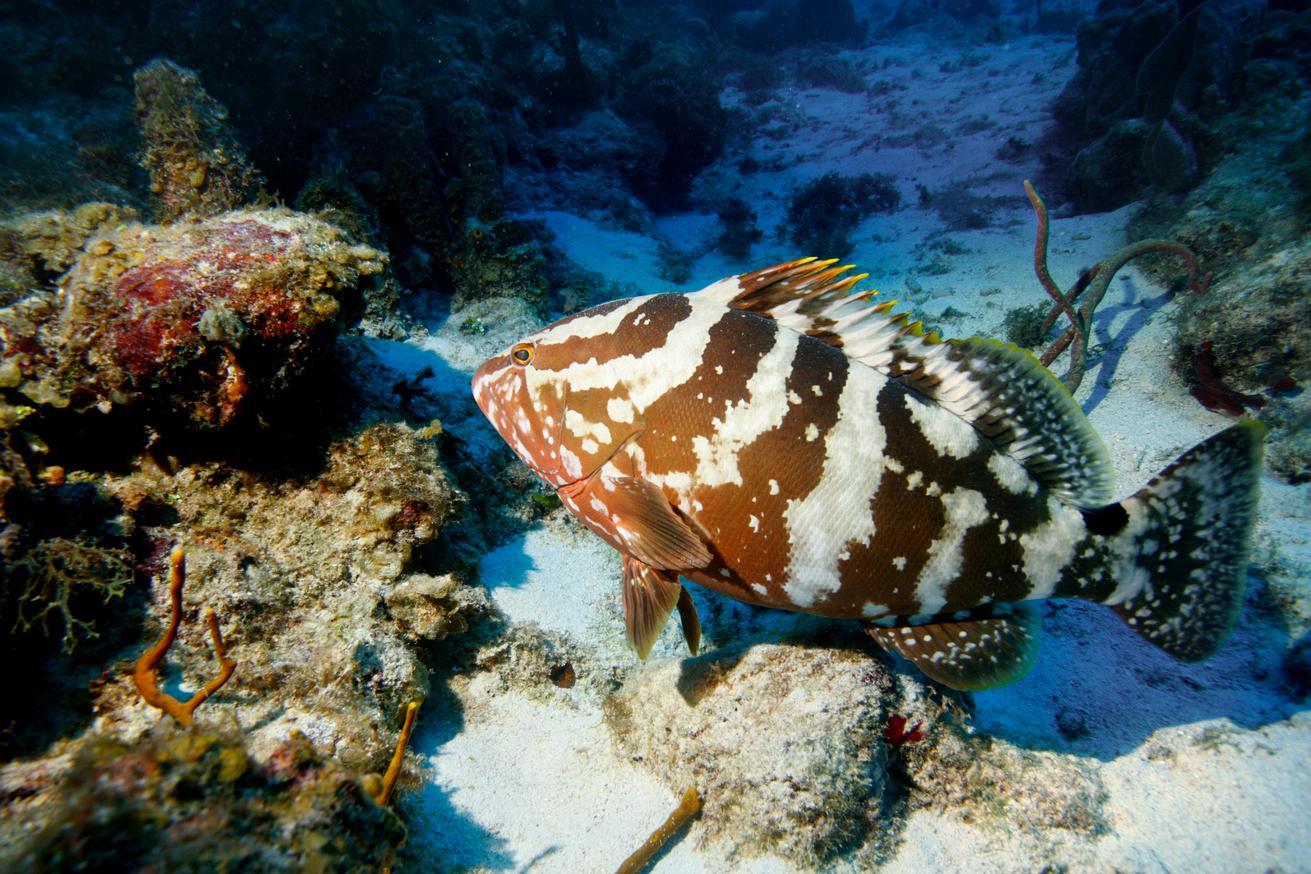
This assessment is biological in nature, requiring expert analysis on the multiple life history stages of key fishery species to evaluate their vulnerability to multiple climate factors.
These species are grouped together for discussion.
Deepwater Snappers Groupers
silk snapper red grouper yellowtail snapper blue runner queen triggerfish queen conch
queen snapper misty grouper lane snapper dolphinfish Gray angelfish spiny lobster
Nassau grouper mutton snapper white mullet hogfish sea cucumbers red hind ballyhoo rainbow parrotfish long spined sea urchin
yellowfin grouper Atlantic thread herring stoplight parrotfish king mackerel
Habitat
Specificity
Sensitivity Rigidity
Complexity in Reproductive Strategy Stock Size or Status Population Growth Rate Spawning Characteristics
Prey
Specificity Species Range Other Stressors
Tolerance to Ocean
Acidification
Mobility and Dispersal of Early Life Stages
Predation and Competition Dynamics
Specificity in Early Life History Requirements Adult Mobility Genetic Diversity
Quantitative Qualitative
Bottom Salinity Mixed Layer Depth
[Chlorophyll-a]
Mean Sea Surf. Temp. Gradient
Sea Surface Oxygen Sea Surface Salinity
Surface pH Bottom Temperature Sargassum Influx
Primary Production Oxygen at 200 m Thermocline Depth
Sea Surface Temperature Precipitation
Surface Wind Speed
Magnitude
Very High (with H certainty): Long-spined sea urchin
Very High (with moderate certainty): Mutton snapper
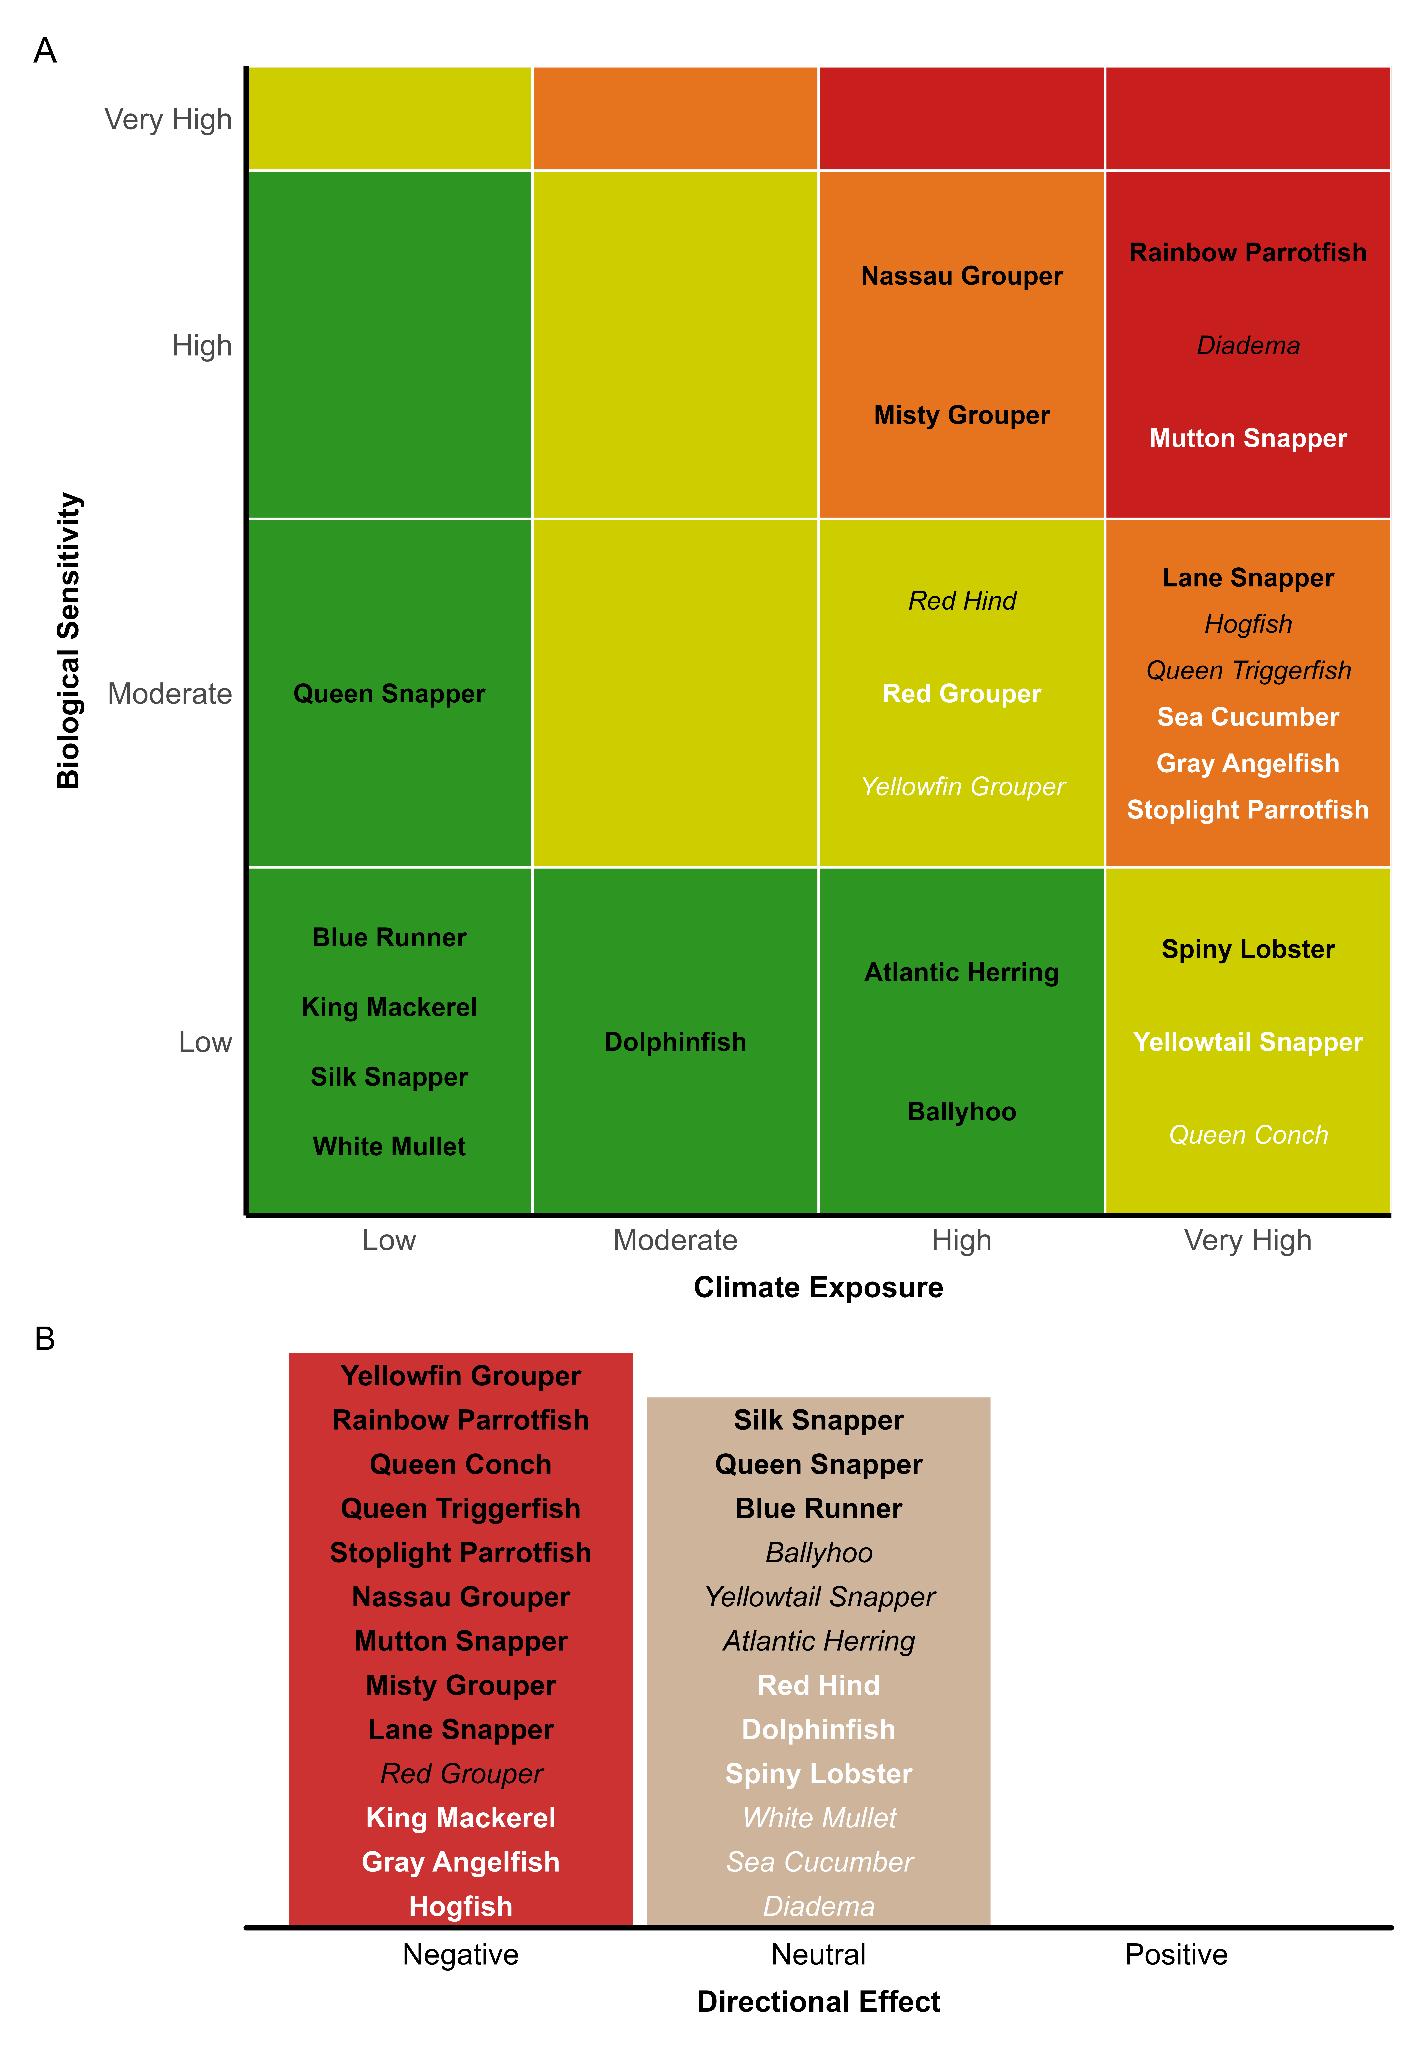
Figure 1 Overall climate vulnerability and directional effect for 25 U.S. Caribbean fish and invertebrate stocks. (A) Overall climate vulnerability scores plotted as a function of Climate Exposure rank (x-axis) and Biological Sensitivity rank (y-axis). Cell fill colors indicate the overall vulnerability rank derived from the NOAA Fisheries Climate Vulnerability Assessment (FCVA) framework: Low (green), Moderate (yellow), High (orange), and Very High (red). Background cell colors reflect the expected overall vulnerability for each Exposure × Sensitivity combination, calculated as the product of the two component scores following the standard FCVA logic model. (B) Dominant directional effect of climate change for each stock, determined by a plurality of reviewer tallies across three categories: Negative, Neutral, and Positive In both panels, text font and color encode certainty in the assigned score based on the proportion of 10,000 bootstrap resampling iterations that matched the assigned rank or category: very high certainty (>95%, black bold), high certainty (90–95%, black italic), moderate certainty (67–89%, white bold), and low certainty (<67%, white italic) Panel A certainty reflects vulnerability rank bootstrap; Panel B certainty reflects directional-effect bootstrap
Figure 1
Overall climate vulnerability and directional effect for 25 U.S. Caribbean fish and invertebrate stocks. (A) Overall climate vulnerability scores plotted as a function of Climate Exposure rank (x-axis) and Biological Sensitivity rank (y-axis). Cell fill colors indicate the overall vulnerability rank derived from the NOAA Fisheries Climate Vulnerability Assessment (FCVA) framework: Low (green), Moderate (yellow), High (orange), and Very High (red). Background cell colors reflect the expected overall vulnerability for each Exposure × Sensitivity combination, calculated as the product of the two component scores following the standard FCVA logic model. (B) Dominant directional effect of climate change for each stock, determined by a plurality of reviewer tallies across three categories: Negative, Neutral, and Positive. In both panels, text font and color encode certainty in the assigned score based on the proportion of 10,000 bootstrap resampling iterations that matched the assigned rank or category: very high certainty (>95%, black bold), high certainty (90–95%, black italic), moderate certainty (67–89%, white bold), and low certainty (<67%, white italic). Panel A certainty reflects vulnerability rank bootstrap; Panel B certainty reflects directional-effect bootstrap.
Black, bold = VH certainty
Black, italic = H certainy
White, bold = M certainy
White, italic = L certainty
Scoring generated by the reviewers; checked for completion
Project start: September 2024
Scoping Phase: September 2024-September 2025
Initial Scoring: October 2025
Results analyzed and finalized
Species narratives in progress
Reviewers provide feedback
Project end: March 2027
Kate Overly
Stacey Williams
Core Team
Chelsea Harms-Tuohy
Katie Flynn
Katharine Tzadik
Species Distribution/Exposure Analyses
Nick Coleman
Holden Harris
Workshop Coordination
Amanda Prieto
Ricardo Lopez
René Esteves
Michelle Scharer
Evan Tuohy
Grisel Rodriguez
Orian Tzadik
Shaun Kadison
Carlos Zayas
Alejandro Acosta
Richard Appeldoorn
Andrew Kough
Bob Glazer
Josh Patterson
Donald Behringer
Reni García
Council Support
Martha Prada
Graciela Garcia-Moliner
Jannette Ramos Garcia
Tarsila Seara
Tyler Loughran
Jennifer Cudney
Wendy Morrison
October, November 2026



In-Person Workshops
Two in Puerto Rico, one in St. Croix; for fishers only
In St Thomas for fishers only
Virtual Presentation
All other interested parties, such as academics, NGOs and other scientists not already involved in the project
Biological Assessment
The CVA is strictly a rapid, scientific process; evaluated by subject matter experts
Stakeholder Input
We want to incorporate fisher and stakeholder feedback in the final report
Useful, informative report for the Council that includes information from all interested parties