Measuring the Blue Economy: The System of National Accounts and use of Blue Economy Satellite Accounts
Measuring the Blue Economy: The System of National Accounts and Use of Blue Economy Satellite Accounts
CDB Working Paper No. 2019/02
Justin Ram
Dindial Ramrattan
Raquel Frederick
Measuring the Blue Economy: The System of National Accounts and use of Blue Economy Satellite Accounts
Measuring the Blue Economy: The System of National Accounts and use of Blue Economy Satellite Accounts
CDB Working Paper No. 2019/02 Measuring the Blue Economy: The System of National Accounts and Use of Blue Economy Satellite Accounts
By Justin Ram, Dindial Ramrattan, Raquel Frederick
October 2019
JEL codes: C8, P44, Q01,
Keywords: Measuring the Blue Economy, Caribbean, Borrowing Member Countries, Caribbean Development Bank.
ISBN 978-976-96338-1-0
Corresponding author’s email address: ramratd@caribank.org
Measuring
Disclaimer
Copyright © Caribbean Development Bank (CDB). The opinions, findings, interpretations and conclusions expressed in this publication are those of the Staff of CDB and do not necessarily reflect the official policy or position of CDB, its Board of Directors, or the countries they represent.
This work may be reproduced, with attribution to CDB, for any non-commercial purpose. The use of CDB’s name for any purpose other than for attribution, and the use of CDB’s logo shall be subject to a separate written licence agreement between CDB and the user and is not authorised as part of this licence. No derivative work is allowed.
CDB does not necessarily own each component of the content contained within this document and therefore does not warrant that the use of any third-party owned individual component or part contained in this work will not infringe on the rights of those third parties. Any risks of claims resulting from such infringement rest solely with the user. CDB does not guarantee the accuracy of the data included in this work.
Any dispute related to the use of the works of CDB that cannot be settled amicably shall be submitted to arbitration pursuant to the UNCITRAL rules. Nothing herein shall constitute or be deemed to constitute a waiver of the privileges and immunities of CDB, all of which are specifically reserved.
Measuring the Blue Economy: The System of National Accounts and use of Blue Economy Satellite Accounts
Acknowledgements
The authors would like to thank Carol Coy, Director-General of the Statistical Institute of Jamaica, and her team for the data and review provided in preparing this working paper. The valuable insight and methodological review of Zia Ahmad Abbasi, Real Sector Adviser at the Caribbean Regional Technical Assistance Centre, were vital in completing this project. Special thanks go to Sonia Hampden, Caribbean Development Bank, who provided executive support and review of the document.
Measuring the Blue Economy: The System of National Accounts and use of Blue Economy Satellite Accounts
Table 1: Fishing industry as a percentage of the agriculture sector’s value
Table 2: Visitor expenditure as a percentage of GDP by country (2014-18)
Table 3: Marine transport as a percentage of transport and storage sector’s value 13 added, selected years, and BMCs with available data
Table 4: Merchandise trade as a percentage of GDP 14
Table 5: Container throughput by country, selected years 15
Table 6: Proposed activities for Jamaica’s Blue Economy Satellite Account 22
Table 7: Blue industry indicators, percentage of gross value added 24 (direct and indirect)
Table 8: Industry output by percentage demand 24
Table 9: Impact of 10% increase in final demand of the hotels and 25 restaurants industry
Figure 2: Supply-use framework
Figure 3: System of national accounts process
Figure 4: Integrated Blue Economy satellite account for Jamaica
Measuring the Blue Economy: The System of National Accounts and use of Blue Economy Satellite Accounts
Abbreviations
BESA - Blue Economy satellite account
BMCs - Borrowing Member Countries
CARTAC - Caribbean Regional Technical Assistance Centre
CDB - Caribbean Development Bank
EUROSTAT - Statistical Office of the European Union
GDP - Gross domestic product
GVA - Gross value added
JMD - Jamaica dollars
mn - million
SNA - System of national accounts
STATIN - Statistical Institute of Jamaica
SUTs - Supply and use tables
Introduction
The objective of this study is to investigate the use of national accounts data in measuring the impact of increased investments in the Blue Economy, which is all economic activities originating from the ocean and its natural resources. The outputs from these activities may be demanded for final consumption, or as inputs into other productive processes (Caribbean Development Bank, United Nations Development Fund, 2018). The measurement of a country’s national output is tied to its national accounting framework, which measures the contribution of individual industries to domestic economic activity. The researchers, therefore, propose to test the adaptability of the current national accounting systems to respond to changes in the outputs of Blue Economy industries.
As Small Island Developing States, countries of the Caribbean Region are pursuing a holistic approach to the resources of the ocean, focusing on the sustainable extraction of marine assets to improve their economic development and production possibilities. It is critical that these activities protect the long-term health of marine and coastal ecosystems for future generations. At the same time, the Region is directly dependent on Blue Economy activities as an important source of energy, food, recreation, and transportation. The Blue Economy is a significant driver of tourism activities in the Caribbean.
To fully understand the importance of the Blue Economy to the Region’s growth, this paper uses available data from Jamaica’s System of National Accounts (SNA) to estimate the direct and indirect growth impact of Blue Economy activities. To conduct the estimate through application of national accounting measurements, the researchers chose to apply a Leontief matrix to measure the intermediate and final demand of productive industries and the interlinkages between them. It is, therefore, possible to quantify the contribution of Blue Economy industries to total domestic output and the supply of Blue Economy products into the activities of other industries. The interindustry analysis can inform policy-makers of potential demand increases in other industries arising out of a strategy to increase final demand within the Blue Economy.
The paper comprises four sections: (a) Blue Economy; (b) measuring the Blue Economy; (c) case study of Jamaica; and (d) way forward. The first section establishes key Blue Economy indicators and highlights the traditional Blue Economy industries in the Caribbean Region. The second section outlines the theory behind measuring Blue Economy activities and explains methodology used in the paper. The third section, case study of Jamaica, applies the measurement techniques from the second section, utilising data from Jamaica’s SNA and estimates the potential intermediate and final demand from increased Blue Economy investments. The conclusion provides a synopsis of the activities required to provide for better measurement of Blue Economy and its contribution to national output.
The Blue Economy
In the Caribbean, the economic potential of the majority of the countries’ maritime exclusive economic zone is significantly larger than that of their land area. In aggregate, the Caribbean’s maritime area is almost 4.5 times the size of its land acreage (Saul, 2008), resulting in more than 70% of the Region’s population settling along the coast and depending on the sea for subsistence and income (Royal Caribbean, 2017). Tourism also accounts for a large share of the total output of many economies and, apart from the dependence on seaports for trade, 64% of the Region’s airports are located on, or near, coastlines (McFadden, 2013).
The ocean provides economic benefits to the Region and sustains the health of the land and populations. The Caribbean is highly vulnerable to climate change and rising sea levels. Defined as ecosystem services, the ocean plays a critical role in carbon dioxide absorption, nutrient cycling and coastal protection, all of which are important needs of Small Island Developing States. These activities ensure clean air, healthy and productive soil and, through reefs, protect the shoreline from rapid erosion. A salubrious ocean is, therefore, vital for the health of the environment and the population. For this reason, the extraction of the resources of the ocean and any land activity must be considerate of potential maritime impacts. The development of Blue Economy is concerned not only with the economic returns of the ocean, but also its care and longevity through sustainable practices.
Blue Economy Caribbean: Traditional Industries
This section of the paper identifies the traditional Blue Economy industries in the Region and looks at some of the key indicators supporting its importance. The three main industries of focus are: (a) fishing; (b) marine and coastal tourism; (c) marine transportation; and the role of the Blue Economy in trade systems.
The ocean is a source of income to households, companies, and governments. Households gain direct benefits from the ocean through economic and subsistence activities, such as fishing, marine and coastal tourism services, marine transportation and related services. Indirect benefits redound through the economic cycle as maritime activities facilitate much of the trade and tourism activities taking place. The traditional maritime industries provide an impulse to growth and development across the Caribbean.
Fishing
The fishing industry, while small in its economic contribution, remains a mainstay for many poor and vulnerable communities in the Region. Small-scale fisheries provide many coastal communities with income, employment and food security. Official labour market statistics exclude the informal labour in this industry, making it difficult to capture and analyse its full relevance. This is especially true when assessing the contribution of women in fisheries, who tend to participate in non-catch activities such as fish processing, packaging, and marketing (Lovell, 2018).
Measuring the Blue Economy: The System of National Accounts and use of Blue Economy Satellite Accounts
Regional economies often focus heavily on land-based agriculture, while minimising the fishing industry’s capacity to spur economic growth and empower vulnerable populations. Similarly, development agencies and donor partners usually include fishing as a sub-set of agriculture investments or, often, leave the industry unstated in policy. However, analysis of the contribution of components of the agriculture sector demonstrates the outsized impact of fishing on the economy. Table 1 shows the respective value added contribution of fisheries expressed as a percent of agriculture. In five of 12 Borrowing Member Countries (BMCs) of the Caribbean Development Bank (CDB), that were surveyed, fishing, accounted for, on average, over a quarter of the total agriculture sector’s value added between 2015 and 2019. In some regional economies, the fishing industry has significant potential to stimulate economic growth, if given the right investments and policy focus (P. McConney, 2009). Country
Table 1: Fishing industry as a percentage of the agriculture sector’s value added, selected years, and BMCs with available data
Source: National statistical offices, central banks. *Or latest available. **2015-19
Marine and Coastal Tourism
The mass tourism model of the Region, which is based on coastal and ocean-related leisure and recreation activities, depends on the health of marine resources. On average, spending by visitors to Caribbean shores was 15% of the gross domestic product (GDP) of the Region from 2013 to 2018. This ratio varied significantly across countries, from as low as 1.5% in the commodity-exporters like Suriname to as high as 80.2% in service-based economies like the Turks and Caicos Islands (see Table 1).
The profile of the typical Caribbean tourist has evolved over the years. He or she is more likely to arrive by cruise ship, to stay for shorter visits, and to spend less in the local economy. Between 1989 and 2014, average daily expenditure declined from USD870 to USD608 per visitor (CDB, 2017). The decline was due to the increase of more budget-minded cruise passengers over long-stay visitors. During this period, cruise arrivals more than tripled while long-stay arrival numbers largely stagnated.
Table 2: Visitor expenditure as a percentage of gross domestic product by country (2014-18)
Source: Authors’ calculations and Caribbean Tourism Organisation.
Measuring the Blue Economy: The System of National Accounts and use of Blue Economy Satellite Accounts
Despite the challenges, tourism still has a significant direct impact on Caribbean economies. Each USD100 increase in tourist spending is estimated to increase the local GDP by USD3554 in that year, and by USD155-160 in the long term. Applying a Blue Economy approach to the development of the tourism industry may help to magnify this impact further, for example by increasing the economic linkages to the local economy and involve disadvantaged groups in the economic gains, while protecting the coastal and marine assets. The Region’s tourism industry benefits from the range of coastal zone and offshore recreational activities that characterise its tourism product. Leisure and recreational activities around the coastline are significant attractions for international visitors and intra-regional tourists
Marine Transportation
Sixteen of 19 BMCs depend exclusively on the sea and air for transportation. While marine transportation tends to account for a smaller share of the sector, as demonstrated in Table 3:, this may be more likely due to challenges faced by the maritime transport sector rather than to higher demand for air transport. For example, financial constraints have curtailed efforts to maintain and modernise Caribbean ports, leading to inadequate infrastructure, inefficient operations, and unnecessarily high transport costs (CDB, 2016).
Table 3: Marine transport as a percentage of transport and storage sector’s value added, selected years, and BMCs with available data
Source: National statistics offices, central banks. *Or latest available. **2015-19.
Measuring the Blue Economy: The System of National Accounts and use of Blue Economy Satellite Accounts
Trade
Maritime trade and shipping provide benefits through intra and extra-regional trade. The geographic make-up of the Caribbean economies necessitates either sea or air transportation for international trade, with the former accounting for almost 90% of all merchandise trade (Deambrosi, 2018), which is significantly high for many Caribbean countries (Table 4).
Table 4: Merchandise trade as a percentage of gross domestic product
Source: World Bank
Maritime transportation is important because of the Region’s role in transshipment within the global shipping industry. The Caribbean is well poised to provide transshipment services for North American trade, given its position at the centre of the so-called shipping corridor between the Panama Canal and Freeport, The Bahamas. The available data suggests that the shipping industry continues to grow in many of the Caribbean countries and can provide a noticeable fillip to economic activity. Jamaica has been an early mover in this area with the recent upgrade of the Kingston Port, positioning the island as the leading trans-shipment hub in the Region. Such activities confirm the importance of this industry to Caribbean economies (see Table 5).
Measuring the Blue Economy: The System of National Accounts and use of Blue Economy Satellite Accounts
Table 5: Container throughput by country, selected years
Source: United Nations Conference for Trade and Development.
Measuring the Blue Economy
This section places attention on the current method of measuring national output throughout the Region and the methodology applied in estimating the intermediate and final demand from increased investments in the Blue Economy. The section is divided into two parts: (a) the system of national accounts (SNA); and (b) satellite accounts and the Leontief matrix.
System of National Accounts
The SNA measures economic activity in an economy through a series of macroeconomic accounts. These accounts are created with strict adherence to internationally agreed standards and principles. The SNA boasts four characteristics that led to its wide acceptance as the main source of national income statistics. The statistics produced from the SNA are: (a) universal1; (b) transparent2; (c) harmonised3; and (d) flexible4. The broad and comprehensive nature of the SNA and the use of the relevant international classifications are critical to ensure comparability between, and within, reporting systems (EUROSTAT, 2014). First established in 1953, the SNA underwent a series of revisions and improvements to reflect changing economic systems and arrangements at the regional and international levels. The most recent iteration, the 2008 SNA, is largely adopted in the developed world and is in use across the Region, although a fraction of the Caribbean economies are still transitioning from the 1993 SNA (see Appendix 1). The 2008 SNA maintained the same accounting rules as the 1993 SNA but made adjustments for closer alignment of industries to other statistical manuals and included more details on the informal sector.
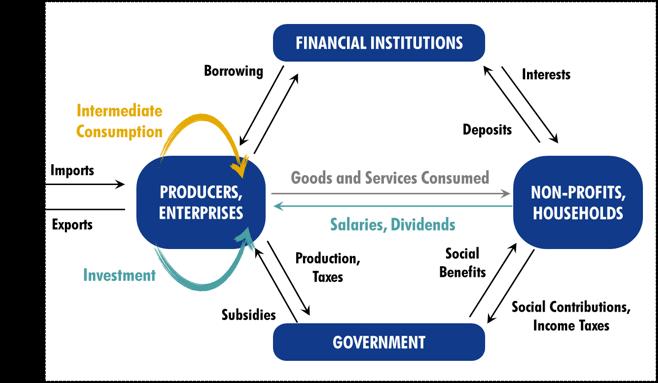
The macroeconomic accounts that are captured within the SNA describes the domestic economy and the relationships between its main economic agents (or institutional units5) of activity. The main economic agents within an economic system are: (a) producers; (b) households and non-profit institutions; (c) government; and (d) financial institutions. The SNA provides the details of these four main economic agents by measuring the production of commodities and the provision of services within the economic system, and the tracking of their uses as inputs into other productive processes (see Figure 1).
1 The SNA accounts for the largest reach of data on total production within an economy. Over time, the data collection and report system evolved to capture significantly larger shares of service output and production flows in and out of a country.
2 The accounting rules and guidelines are internationally developed and clear for public viewing. This has the added advantage of maintaining the interrogation of all data produced.
3 The SNA is harmonised with concepts and classifications that are present in other reporting systems, such as balance of payments, labour force survey methodology, and government finance statistics. This ensures increased complementarity with existing systems.
4 The use of satellite accounts allows a degree of national flexibility where countries can use specialised surveys to focus on areas of interest. Examples of such are tourism satellite accounts in Jamaica; and the use of an energy account in Trinidad and Tobago.
5 An institutional unit is an economic entity that is capable, in its own right, of owning assets, incurring liabilities and engaging in economics activities and transactions with other entities, e.g. CARTAC.
Measuring the Blue Economy: The System of National Accounts and use of Blue Economy Satellite Accounts
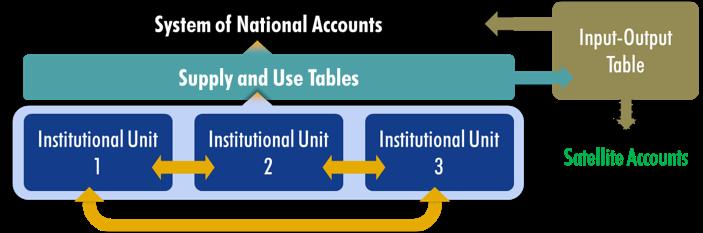
Figure 1: The national economy as captured in the system of national accounts
The compilation of all accounts within the SNA provides high-level indicators of GDP and identifies the main contributing industries and activities to economic output and growth. There are three main approaches to computing GDP using the SNA: (a) production; (b) expenditure; and (c) income. This paper focuses on the production approach because this method is the most used across the Region and can be easily discerned from the various publications of national statistics offices and central banks. Using either the expenditure or income method may exclude future work in countries that are not currently using those methods.
Equation 1 depicts the GDP calculation using the production approach, that is the net value added of the output of economic agents less the intermediate demands from other economic agents. Intermediate demand refers to the use of one economic agent’s output as an input into the productive process of another. To calculate GDP, the SNA identifies the relationships between industries so that intermediate demand and final demand are clearly defined and recorded. Gross value added (GVA) measures the nominal value of goods and services produced in an economy less the cost of all intermediate inputs and raw materials. The addition of taxes and subtraction of subsidies calculates the cost of these goods and services to the consumer.
Equation 1: Total output of an open economy6
GDP at current market prices = GVA at basic prices + taxes on products – less subsidies on products
To compute the GDP, supply and use tables (SUTs) are produced,displaying the production
6 An open economy is defined through the occurrence of international trade, thus exports and imports are part of the productive and consumptive processes.
Measuring the Blue Economy: The System of National Accounts and use of Blue Economy Satellite Accounts
and consumption of all economic agents at a sub-industry level. The SUTs include two tables in the calculation of value added: (a) a supply table capturing information on the output of all institutional units (domestic production and imports); and (b) a use table identifying intermediate and final consumption of goods and services, inclusive of exports. At the end of this process, the output of all institutional units within an industry is summed up, which provides the information on total activities within that specific industry (Figure 2). The sum of all industries activities produces the commonly referenced GDP statistic. This process requires the conduct of industry surveys and use of administrative and business establishment data. SUTs are the only method to generate an accurate and integrated visual of the domestic economy (Statistics Canada, 2019).
Figure 2: Supply-use framework
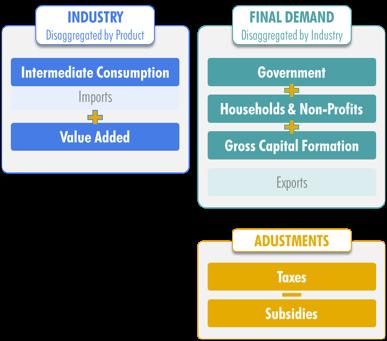
The accounting equation for the SUTs is built on a framework where the total supply must equal the total demand for the industry. To achieve this, the intermediate inputs into each commodity7 must be separated from that industry’s value added–the removal of any double counting of outputs. This step leads to the identification of each unit’s GVA. The GVA for each product is then collated across all commodities within the respective industries to estimate the total output (Equation 2), accounting for adjustments of national taxes and subsidies. In some cases, the disaggregation may capture many units within one sub-industry and this leads to the same outcome, but with less ability to interrogate the data at a micro, i.e. firm, level.
Equation 2: Gross value added
Where, for an economy with n industries, (GVA)^n=∑_(i=1)^n1 productioni – intermediate consumptioni Where:
n = number of economic agents
7 Commodities refer to the actual items produced. A group of commodities forms an industry. For example, the production of different agricultural products (bananas, rice, sugar, etc.) aggregated to provide total agriculture output.
The SUTs feed into the computation of symmetric input-output tables that provide a representation of the producing sectors within an economy and the commodity flows between them (EUROSTAT, 2014). The input-output present the estimated contributions of all commodities into the economic process and depict the relationships in the form of a product-by-product matrix. Such a matrix provides disaggregated information on the relationships between industries and separates demand into domestic and foreign. By estimating the respective intermediate demand of industries, the input-output produce a quantification of the pass-through of resources from one industry to another and assists macroeconomists in estimating the relative indirect contributions of industries to economic growth, which cannot be gleaned from the high-level GDP by industry data.
Figure 3 represents the various linkages between the micro-level data (institutional unit) and the process by which it informs the wider SNA. The aggregation of micro data feeds into the SUTs where data is recognisable within the main activities taking place. The SUTs data then feeds into the input-output table. Some countries produce a basic SNA without the input-output table, but the more elaborate and accurate method uses the input-output table to inform the final SNA. It is useful to introduce the concept of satellite accounts here. Satellite accounts link the central accounts of the SNA and target the computation of industry level data for an area of interest. Examples of currently used satellite accounts are energy, environment, health, and tourism.
Satellite Accounts and the Leontief Matrix
The satellite accounts capture information on a specific area of activity without interfering with the wider process of the SNA. These accounts are interconnected, but more detailed accounts are calculated while computing GVA. The use of satellite accounts requires greater levels of data capture at the institutional level and hinders the use of such accounts in the regional space. In developing SAs, national accountants create a series of interlinked industry tables showing the demands and supplies of the relevant products and services.
It is not possible to create satellite accounts for all economic activities within a country because of the significant time and human resource demands required to capture data and prepare such accounts. Data capture for satellite accounts includes a series of industry surveys collecting information on the inputs and outputs of each process, a system to quantify the intermediate demands from other domestic productive sectors, and computation of each industry’s value
Measuring the Blue Economy: The System of National Accounts and use of Blue Economy Satellite Accounts
added to national growth. Despite the significant resource demands, national statistics offices often prepare satellite accounts for important industries to their respective countries productive process.
The practice of using satellite accounts for ocean-related activities is recent, but increasingly common. In 2015, the Philippines agreed to assess ocean-based economic activities within its SNA using the latest version of the International Standard Industry Classification (Talento, 2016) and in 2016, Portugal launched the first SA for the Seas in Europe (Accounts, 2016). At a disaggregated level, these satellite accounts identify specific activities within maritime and maritime-related industries.
Once integrated within the wider SNA, satellite accounts will provide time series data on ocean-related activities and assist government and industry in identifying the direct and indirect benefits of activities within the Blue Economy. Satellite accounts enable reporting countries to measure and present data on specific areas of economic activity. Such identification is critical to determining the resource needs to develop Blue Economy industries. Essentially, the setting up of the Blue Economy satellite account (BESA) details the demand for merchandise trade and services associated with the Blue Economy. This demand interfaces with the total industry supply of identical products and services. To achieve the assessment of demand impacts from industry changes, the input-output is used to calculate a Leontief matrix. The Leontief matrix represents an economy where a number of industries are operational and measures the relationship of each industry’s demand to the economy’s total output.
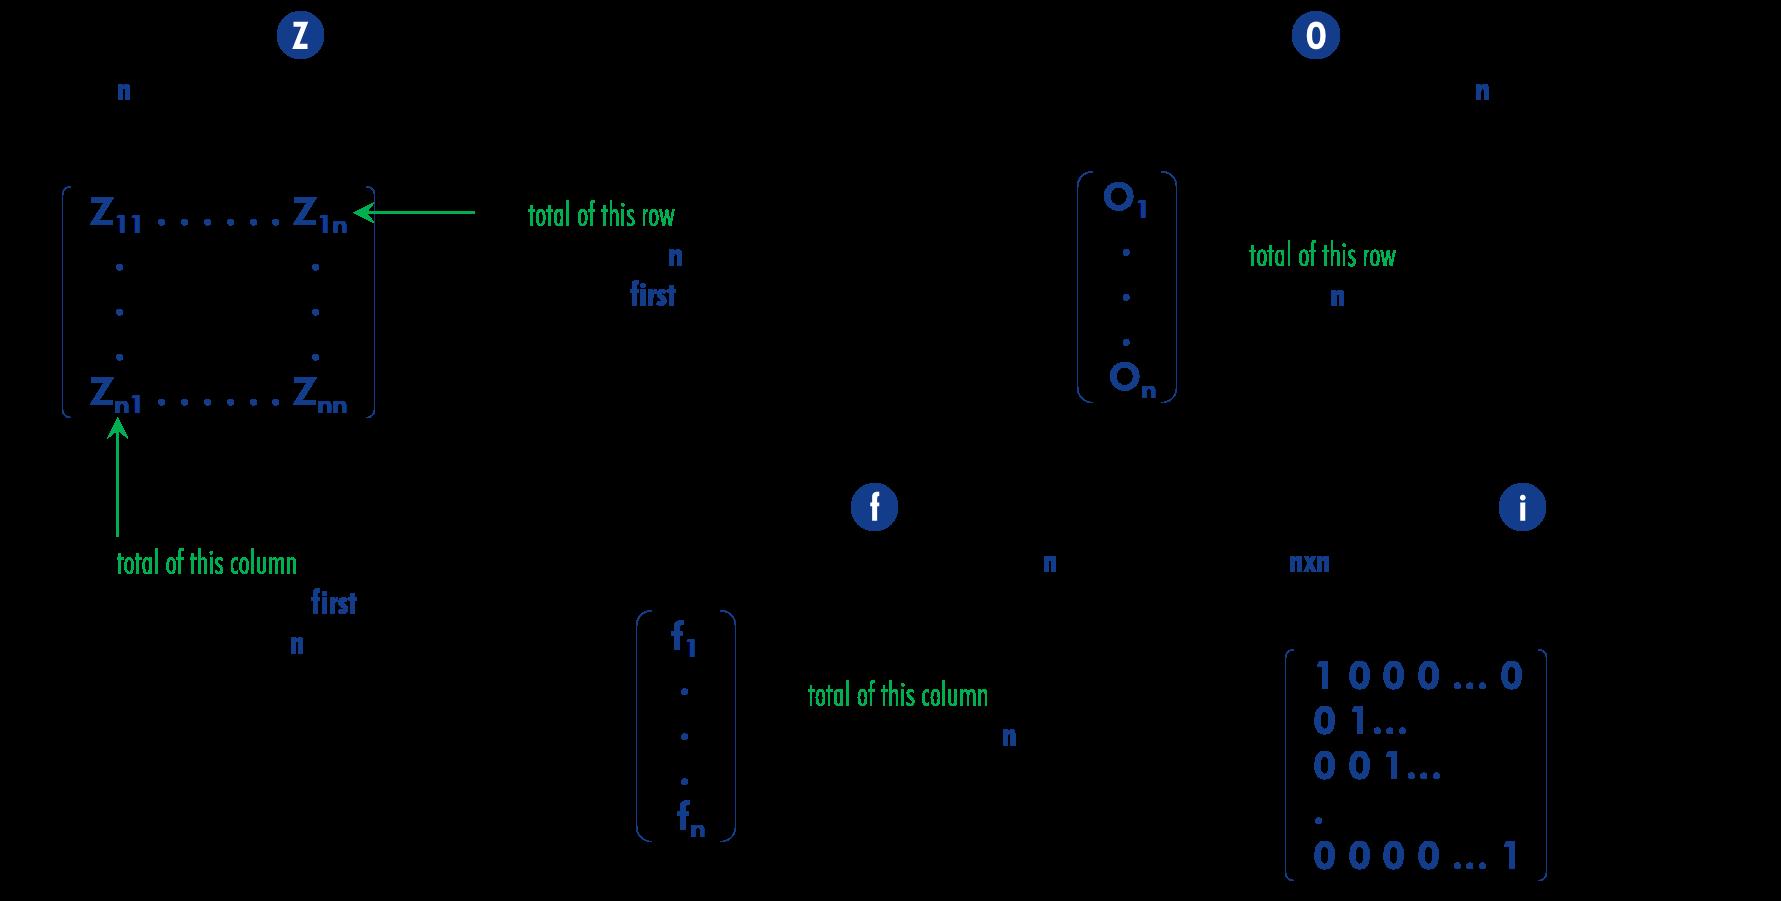
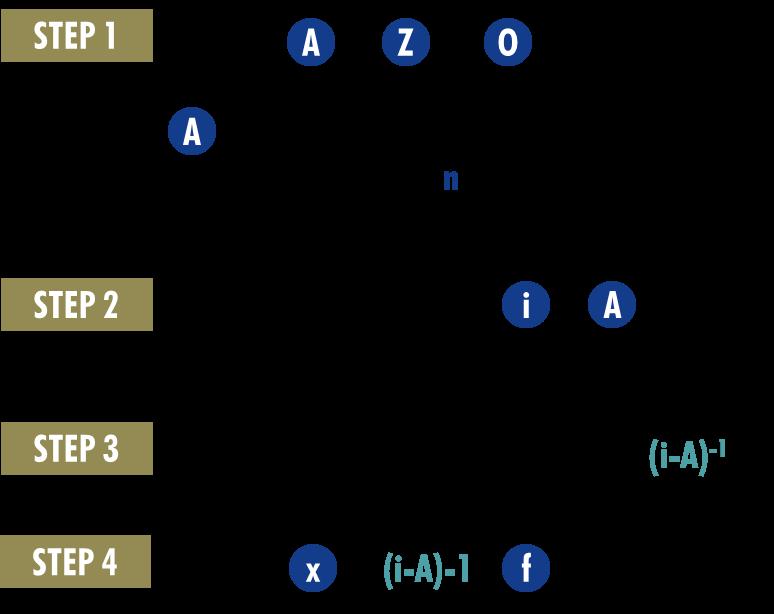
The analysis in this paper utilises a Leontief inverse matrix to estimate the potential output impact resulting from an increase in final demand across the industries of the economic system. The steps in achieving this requires an input-output for the respective country and a series of calculations based on an amalgamation of economic agents into industries. The amalgamation produces an input-output matrix by broad industries (Z matrix) displaying the intermediate supply and use within the industries of the country’s economic system. This amalgamation highlights the inter-industry flows and dependence between producing units. Following the amalgamation, the matrices were measured according to their respective contributions to total value added and their unit matrices were calculated resulting in the industries matrix (A matrix)9.
At the A matrix stage the input-output coefficients are identified and will inform the computation of the total industry requirements. To calculate the industry requirements, a Leontief inverse matrix is necessary. The A matrix establishes the inter-industry relationships and adjustments to final and intermediate demand that result from changes in any of the input industries (the Z matrix, in this case). To do this, the inverse of the A matrix less the identity matrix8 [(I-A)-1] must be calculated. The multiplication of this result by the final demand provides an estimate of total output and intermediate demand for each industry. For analytical purposes, the model allows the researchers to change the final demand of specific industries and measure the estimated changes to intermediate and final demand in the other producing industries of the economy. This assessment can inform policy by providing the necessary evidence to justify increasing
8 The identity matrix is a square matrix with a diagonal of 1’s, and all other elements are 0s. The purpose of the identity matrix is to replicate multiplying by 1 in matrix algebra.
9 All equation are in Appendix 2.
Measuring the Blue Economy: The System of National Accounts and use of Blue Economy Satellite Accounts
investments in one area of production by measuring the potential changes across the wider economic system.
Currently, statistics offices in the Caribbean do not provide enough detail for the disaggregation of Blue Economy industry-specific indicators and the respective contributions to national output. Therefore, the disaggregation of GDP into specific accounts, such as the Blue Economy, requires targeted data capture and analysis on the respective industries. The following case study provides an illustration of the satellite accounts analysis for the major Blue Economy industries in Jamaica. The Statistical Institute of Jamaica provided the SNA and detailed input-output data.