TVET - Technical and Vocational Education and Training
WB - World Bank
SUMMARY DATA SHEET (2012–2016)
THE UNIFIED SPECIAL DEVELOPMENT FUND
Background Funding
Themes and Priorities
Programme Levels
Eligibility of Countries
Allocation of Resources
SDF 8 OPERATIONAL STRATEGY
EXECUTIVE SUMMARY
INTRODUCTION
OPERATIONAL PERFORMANCE
Commitments
Disbursements
SDF 8 Thematic and Programme Highlights
REPORTING ON SDF 8 RESULTS
Level 1: Regional Progress towards Selected CMDG Targets and Development Outcomes
Level 2: CDB/SDF Contributions to Country and Regional Outcomes
Level 3: Operational/Organisational Effectiveness
Level 4: Partnership, Harmonisation and Alignment
FINANCIAL RESOURCES AND PROGRAMME LEVELS
SDF 8 Programme Level Commitment Authority Allocation and Use of Resources FINANCIAL PERFORMANCE AND
SDF Portfolio Analysis
TABLES
Annual Commitments 2013-2016
Annual Disbursements 2009-2016
Total Commitments by SDF 8 Strategic Operational Theme
BNTF 7 Allocations, Approvals and Disbursement as at December 31, 2016
BNTF 8 Allocations, Approvals and Disbursement as at December 31, 2016
CTCS Technical Skills Training Conducted
Summary of Projects Flagged “At Risk” for 2016
SDF 8 Programme Level
SDF 8 Commitment Authority and Use of Funds
SDF 8 Allocation and Use of Resources
Summary of Financial Results, 2012-2016
Summary of Projected Financial Results, 2017–2019
APPENDICES
APPENDIX I
APPENDIX II
APPENDIX III
APPENDIX IV
APPENDIX V
Contributions to the Unified Special Development Fund SDF 1-8
SDF 8 Programme Level, Country Groups and Terms of Lending
SDF 8 Commitments 2013 - 2016
SDF (U) Portfolio Analysis - 2016
SDF Financial Statements
Summary Balance Sheets as at December 31, 2012-2016
Summary Income Statements for the years ending December 31, 2012-2016
Summary of Notes, Encashments and Drawdowns 2016
Projected Balance Sheets as at December 31, 2017-2019
Projected Income Statements for the years ending December 31, 2017-2019
Loans and Grants
THE UNIFIED SPECIAL DEVELOPMENT FUND
Background
The Special Development Fund (SDF/the Fund) was established in 1970 and is the Bank’s largest pool of concessionary funds. This facility offers loans with longer maturities and grace periods, and lower interest rates than those that are applied in the Bank’s ordinary operations. However, the various contributors to the Fund applied an assortment of terms and conditions, which created complexities and inefficiencies in the Fund’s operation. Hence in 1983, the decision was taken to set up a fund with a uniform set of rules and the Special Development Fund (Unified) [SDF (U)] was formed.
All members of the Bank are required to contribute to SDF (U), and contributions are also sought from non-members. With consistent terms, objectives and procurement conditions, SDF (U) sought to overcome the problems associated with individual donors and funding arrangements. Contributions are interestfree and provided on a multi-year basis for an indefinite term. To give focus to the Fund’s operations, a supplementary governance structure that includes an Annual Meeting of Contributors was created. Non-members were also invited to participate as observers in meetings of the Bank’s Board of Directors (BOD) and Board of Governors.
SDF (U) has a four-year replenishment cycle, except for the third replenishment cycle (SDF 4) which was extended by an extra year as a result of additional contributions from a new member of the Bank. The eighth cycle of the Fund started on January 1, 2013 to cover the period 2013 to 2016.
Funding
Over the eight cycles, contributions or pledges of $1,246.2mn have been made to the operations of SDF (U). $224mn (18%) of the contributions/pledges came from borrowing members, with non-borrowing members and non-members accounting for $958.2mn (77%), and $32mn (2.6%), respectively. A total of $33mn (2.6%) in allocations from the net income of the Ordinary Capital Resources (OCR) was pledged to the fund in SDF 7 and SDF 8.
Contributions pledged for SDF 8 amounted to $231.5mn, inclusive of the allocation from the OCR Net Income of $18mn (7.8%). Borrowing members pledged $53.5mn (23.1%) of the contributions and non-borrowing members contributed $160.0mn (69.1%), inclusive of an additional contribution of $5.0mn from one non-borrowing member. Contributions to each cycle by category of membership are shown in the chart on page 8. Details are presented in Appendix I.
CONTRIBUTIONS TO SDF (U)
Themes and Priorities
During negotiations of each SDF cycle, Contributors and the Bank agree on the priorities and issues to be addressed. Over the years, there has been increasing emphasis on poverty reduction directed at the poor and low-income groups. In recent cycles, SDF has given significant support to thematic areas such as environmental sustainability, advancing the climate change agenda, building capacity, and enhancing governance in beneficiary countries. Regional cooperation and integration (RCI), and enhancing the Bank’s development effectiveness have also been key priorities. For SDF 8, the core themes, which are detailed in the Box entitled SDF 8 Operational
PROGRAMME LEVELS SDF (U) 1-8
Eligibility of Countries
The Bank’s Borrowing Member Countries (BMCs) are assigned to one of three country groups1 based on their relative per-capita incomes. The country groups help to determine the terms and conditions for SDF lending (refer to Appendix II). Although all BMCs are eligible for SDF resources, countries in Group 1 do not receive a country allocation. Instead, these countries may benefit from regional projects and support for regional public goods (RPGs), and assistance in the event of a natural disaster.
Allocation of Resources
Since 2001, a Resource Allocation Strategy has been used to allocate both SDF loan resources to eligible countries and BNTF resources to participating
1 There were four country groups for SDF 1 through SDF 7
Strategy, are Inclusive and Sustainable Growth; Citizen Security; RCI; and Environmental Sustainability and Climate Change.
Programme Levels
The programme level for each SDF (U) cycle is financed with new pledges from Contributors, net income generated by the Fund, reflows from loan repayments and, for SDF 7 and SDF 8, an allocation from the OCR Net Income. The programme levels over the eight cycles of the Fund are shown in the chart below. For SDF 8, Contributors approved an overall programme level of $348mn, details of which are given in Appendix II and Table 8.
BMCs. The Caribbean Development Bank’s (CDB) resource allocation formula comprises a country performance or effectiveness component, and a needs component. The country performance element of the formula recognises that countries that have better policy and institutional frameworks are likely to make more effective use of concessionary resources, especially with regard to poverty reduction and broad-based sustainable growth. It, therefore, acts as an incentive to improve policy and institutional performance. The needs component of the formula includes a CDB-developed measure of vulnerability, and, with effect from SDF 8, a variable representing the number of poor people in a country as indicators of country needs.
SDF 8 OPERATIONAL STRATEGY
The operational strategy for SDF 8 was developed within the overarching objective of Poverty Reduction and Human Development. It is based on four core themes, with two cross-cutting themes and an underlying foundation of capacity-building to strengthen good governance. Particular emphasis was placed on a limited number of objectives in each core theme and programme area, taking into account the comparative advantages and capacity of the Bank and SDF, as well as the benefits of continued collaboration with development partners (DPs). A preference will be placed on regional approaches, where appropriate and feasible. The four core themes are:
Inclusive and Sustainable Growth
A limited number of objectives in education and training, agriculture and rural development, economic and social infrastructure, economic and fiscal adjustment, and private sector development. The emphasis on inclusive growth supported activities that created and expanded economic opportunities as well as broadened access to these opportunities to ensure that the citizens of all BMCs benefited.
Environmental Sustainability and Climate Change
Specific objectives in disaster risk reduction (DRR) and disaster risk management (DRM), climate change mitigation and adaptation, including renewable energy (RE) and energy efficiency (EE).
Citizen Security
Crime and security and social protection objectives, reflecting the complex and varied causes of crime and violence, which undermine efforts to facilitate development and growth, and requiring multi-sectoral approaches to enhancing the security of citizens.
RCI
A focus on regional solutions and a limited number of objectives in the areas of RPGs.
Cross-Cutting Themes
Gender Equality and Environmental Sustainability and Climate Change, which are also areas for direct programming.
Other Strategic Issues
Addressing the Millennium Development Goals (MDGs)
Support the acceleration of efforts directed to the Caribbean-specific MDG (CMDG) targets in the areas in which SDF 8 would be focusing; work with Caribbean partners to strengthen the monitoring of results under the MDGs as part of the Bank’s results framework for the SDF 8 period.
BNTF and Haiti
Continue the BNTF, SDF’s flagship programme for community-level poverty reduction, and the special country programme for Haiti.
Development Effectiveness and Targeting Results
Use the Results Monitoring Framework (RMF) to monitor the progress of the programme and commitment to internationally accepted principles for effective development cooperation, as well as the reporting of results through the annual Development Effectiveness Review.
Evaluate the effectiveness of programme implementation and results achievement, including an independent assessment of the Bank’s performance in Managing for Development Results (MfDR).
Allocate SDF resources to eligible BMCs according to SDF needs and performance-based Resource Allocation System (RAS), in order to ensure value for money and to support development effectiveness in the use of SDF funds.
EXECUTIVE SUMMARY
The global development agenda, bounded by the Sustainable Development Goals (SDGs), provides systematic action-oriented priorities that hold robust potential to improve livelihoods for many people across the Caribbean.
The Special Development Fund (SDF) and, in particular, the final year of SDF 8, has been important in supporting this early but critical work at the regional level. This 2016 Annual Report is the final report of the eighth cycle of the SDF. The Report, therefore, examines the performance of the Fund in 2016 relative to 2015, in order to provide a sense of annualised dynamics, and also gives an account of the entire cycle juxtaposed against planned activity at the beginning of the period.
The SDF, as a key instrument of development support for the CDB and its borrowing membership, continued to focus on key priority areas that hold strong potential for improving livelihoods in a sustainable manner. Within this context, the report acknowledges the challenging development frame within which many borrowing member countries (BMCs) operate. The twin objectives of poverty reduction and sustainable output growth continued to be undermined by macroeconomic fragility and institutional weaknesses, which adversely affect public policy formulation and execution. Gender biases as well as environmental factors due to the Region’s geography and
location continued to be features of the development landscape. In spite of these development obstacles, the Fund has been able to play a pivotal role in the provision of basic infrastructure, improve access to educational opportunities, strengthen environmental and economic resilience, and create an increasing number of knowledge products to help inform public policy development and execution.
Total commitments continued to be relatively robust in 2016, the final year of the SDF 8 cycle, as countries programmed the bulk of the remaining allocation in critical development areas. In the main, this tendency was consistent with other SDF cycles in which approvals tend to spike during the latter half of the four-year period. Admittedly, this pattern was less pronounced during SDF 8, reflecting, in part, a closer partnership between the Bank and eligible countries within the context of country-strategy programming. At the end of 2016, total commitments amounted to $94.9mn or approximately 1% above the corresponding period in 2015. This brought the total commitment for the cycle to $324.5mn or 98.1% of the original allocation ($330.7mn) for SDF 8. In relation to loans, total approvals registered a double-digit increase (14%) over 2015 and stood at $71.8mn. The number of loans also rose to 17 in 2016, compared with 8 and 14 in 2015 and 2014, respectively. Loans were approved for seven BMCs with the preponderance of the investment targeting outcomes under the thematic areas of inclusive and sustainable growth, environmental sustainability and citizen security. With respect to grant operations, total commitments stood at $23.3mn in 2016 or $7.9mn lower than one year earlier. The contraction is explained, in part, by declines in approvals for Haiti, Regional Public Goods and Climate Change and the Environment.
At the end of cycle, most programmed allocations were fully exhausted. Despite a reduction in subscriptions expected from one country and in internally generated funds, the loan envelope was revised from an initial
allocation of $212.7mn to $228.7mn as a result of the OCR allocation and an additional contribution from the United Kingdom (UK). Based on this revised loan envelope, a total of $233.0mn (or 102% of total resources) was committed. On the grant side, 91.5% of $100mn has also been approved. Basic Needs Trust Fund (BNTF) resources ($10mn) have been fully committed while Regional Public Goods and Capacity-Building setasides had total commitments of 94.6% and 93.3%, respectively.
The SDF continued to play a very active role in Haiti in 2016, consistent with the country engagement strategy (Country Strategy Paper 2013-2016). CDB approved development support totaling $12.2mn for that country and disbursed $4.5mn. This compares with commitments of $15.2mn and disbursements of $9.6mn for the corresponding period in 2015. With respect to the utilisation of resources, at the end of SDF 8, total commitments were $43.5mn, representing 95% of the initial allocation of $46.0mn.
BNTF, which is fully funded from SDF resources, had an exceptional performance in 2016 on the back of a number of operational changes. Disbursements under BNTF 7 and BNTF 8 improved significantly from $5.0mn and $0.5 to $27.5mn and $3.9 mn in 2015 and 2016, respectively. During 2016, 74 sub-projects were completed under BNTF 7 and 8. Some early results from the Programme show that 11,297 students (5,817 males and 5,480 females) benefited from the construction or upgrading of 138 classrooms with additional educational support facilities such as bathrooms, administrative spaces, and facilities for the disabled; 406 teachers (32 males and 374 females) received training and certification in specific areas of early childhood education; 5,474 households were provided with access to improved sanitation services and water supply and 11,032 persons (4,544 males and 6,488 females) benefited from new or upgraded community road infrastructure, including farm access roads.
The original programme for SDF 8 was $348.0mn and comprised loans to be allocated to eligible BMCs ($208.0mn), a loan allocation to Suriname of $10.0mn, as well as loans for natural disaster mitigation and rehabilitation for $30.0mn, and set-aside grant resources of $100.0mn. With respect to allocation, the approved RAS was used to allocate loans to eligible BMCs as well as the set-aside of $10mn for BNTF 8. Omitting the structural gap of $17.3mn, a base level of $330.7mn was programmed. On account of differences in the opening commitment authority, notwithstanding marginal increases in internally generated funds and new contributions, the base level (at the end of the cycle) was reduced to $328.7mn. With respect to country utilisation, only one of the ten countries, Montserrat, did not access its allocation under SDF 8. Consequently, this amount of $9.3mn was redistributed to eligible countries with strong demand. Guyana, Belize and Grenada led the way in relation to loan commitments, accounting for $40.6mn, $31.1mn and $27.2mn, respectively. Collectively, these three countries absorbed 46.2% of loanable funds (excluding the set-side for natural disasters).
1. INTRODUCTION
The 2016 Annual Report of the Special Development Fund is the final report of the eighth cycle of the SDF. The Report, therefore, examines the performance of the Fund in 2016, relative to 2015, to provide a sense of annualised dynamics, and also gives an account of the entire cycle juxtaposed against planned activity at the beginning of the period.
The SDF, as a key instrument of development support for CDB and its borrowing membership, continued to focus on key priority areas that hold strong potential for improving livelihoods in a sustainable manner. Within this context, the Report acknowledges the difficult development frame in which many BMCs operate. The twin objectives of poverty reduction and sustainable output growth that is inclusive continued to be undermined by macroeconomic fragility and institutional weaknesses, which adversely affect public policy formulation and execution. Gender biases, as well as environmental factors due to the Region’s geography and location, continued to be features of the development landscape.
The global development agenda, bounded by the Sustainable Development Goals, provides systematic action-oriented priorities that hold robust potential to improve livelihoods. SDF, and in particular the final year of SDF 8, has been important in supporting this early but important work at the regional level.
In order to drill down into the operational substance and performance of the SDF, the report is configured into five sections. Section 2 examines the operational performance of the Fund and highlights critical interventions supported under the respective thematic areas during SDF 8. Section 3 reviews development results achieved to date within the context of SDF 8. Section 4 reports on programme levels and financial resources available during the eighth cycle as well as planned versus actual commitments. The final section shows the financial performance of the Fund for 2016 and makes projections for the period 2017-2019.
2. OPERATIONAL PERFORMANCE OF SDF 8 IN 2016
The operational performance of SDF shows progress in relation to commitment and disbursement levels. The out-turn is provided on an annual basis, as well as through a direct comparison between planned versus actual activity levels in SDF 8 and the previous SDF cycle. Importantly, the section also seeks to gauge the performance of the Fund based on the major themes.
Commitments
Total commitments continued to be relatively robust in 2016, the final year of the SDF 8 cycle, as countries programmed the bulk of the remaining allocation in critical development areas. In the main, this tendency was consistent with other SDF cycles where approvals tend to spike during the latter half of the four-year period. Admittedly, this pattern was less pronounced during SDF 8, reflecting in part a closer partnership between the Bank and eligible countries within the context of country strategy programming. The noticeable difference in approval levels at the end of SDF 8 relative to SDF 7 represented the delayed approval of BNTF 7 of $46mn which occurred during the final year of that cycle (See Chart 1). At the end of 2016, total commitments amounted to $94.9mn or approximately 1% above the corresponding period in 2015. This brought the total commitment for the cycle to $324.5mn or 98.1% of the original allocation ($330.7mn) for SDF 8. In relation to loans, total approvals registered a double digit increase (14%) over 2015 and stood at $71.8mn. The number of loans also rose to 17 in 2016, compared with 8 and 14 in 2015 and 2014, respectively. Loans were approved for seven BMCs with the preponderance of the investment targeting outcomes under the thematic areas of inclusive and sustainable growth, environmental sustainability and citizen security.
The Bank provided support to two BMCs through immediate response loans in the aftermath of Hurricanes Joaquin and Earl. The education sector continued to be a dominant area of activity as the Bank buttressed efforts to widen access and improve quality in three BMCs. These included a skills development and employability project in Guyana, an education quality improvement project in Saint Lucia, and a Technical and Vocational Education and Training (TVET) project in St. Vincent and the Grenadines. The Bank also supported the expansion of basic infrastructure in the water sector. Loans were approved for Dominica (Third Water Supply Additional Loan), Saint Lucia (Eighth Water Supply) and Suriname (Feasibility Study to Upgrade Water Supply). The Bank continued its collaboration with the World Bank (WB) to finance adjustment reforms in Grenada. The Third Growth and Resilience Building Policy-Based Operation (PBO), among other things, seeks to improve public sector management and better targeting of social safety net programmes as well as enhance resilience against natural disasters.
CHART 1: SDF COMMITMENTS 2009-2016 ($MN)
With respect to grant operations, total commitments stood at $23.3mn in 2016 or $7.9mn lower than one year earlier. The contraction is explained in part by declines in approvals for Haiti, Regional Public Goods, and Climate Change and Environment (See Table 1). The Haiti programm was dominated by one project designed to strengthen ruralbased agriculture, while commitments on Climate Change and the Environment declined from $3.6mn in 2015 to $0.3mn in 2016.
At the end of 2016 and the closeout of SDF 8, most programmed allocations were fully exhausted. Despite a reduction in subscriptions expected from Suriname and in internally generated funds, the loan envelope was revised from an initial allocation of $212.7mn to $228.7mn as a result of the OCR allocation, and an additional contribution from the UK. Based on this revised loan envelope, a total of $233.0mn (or 102% of total resources) was committed. On the grant side, 91.5% of $100mn has also been approved. BNTF resources ($10mn) have been fully committed while the Haiti, RPGs and CapacityBuilding set-asides had total commitments of 94.6%, 95.0% and 93.3%, respectively. Following a slow start, commitments for Citizen Security picked up considerably with the approval of path-breaking projects including the Awakening Special Potential by Investing in Restoration and Empowerment of Youth project (Grenada) and the Youth Empowerment Project (Saint Lucia). The approvals for CTCS, Agriculture, and Disaster Response were under their programmed levels at 78%, 70% and 60%, respectively. Overall commitments, for both loans and grants, were 98.1% of the programme at the end of the cycle.
Disbursements
Total disbursements in 2016 bucked a declining trend and rose by 10.7% to $65.2mn relative to 2015. Indeed disbursement activity during the SDF 8 cycle has been consistently stronger than during the seventh cycle (See Table 2). In part, this reflected various Bank initiatives to promote greater operational efficiency. These included a more intensified and aggressive use of the portfolio review instrument particularly in BMCs with significant undisbursed balances; the identification of single points of contact with respect to disbursement management by BMCs, as well as strengthening of in-country procurement systems.
Disaggregating the performance between loans and grants, loan disbursements fell to $28.2mn in 2016 compared with
SDF DISBURSEMENTS 2013-2016 ($MN)
CHART 2
$39.1mn one year earlier. On the other hand, disbursements for grants rose by almost 90% to $37.0mn over the same time period. The bulk of this increase was driven by disbursements for BNTF which rose by over 300% to $26.1mn on account of improvements in the business processes which govern the BNTF arrangements.
TABLE 2
Annual Disbursements 2009 - 2016 ($MN)
With respect to allocations for the strategic operational themes, the outcomes for SDF 8 were broadly consistent with the indicative allocations as per the Contributors’ Report. Inclusive and Sustainable Growth absorbed 60.4% of committed resources compared with an indicative allocation of 66.1%; Environmental Sustainability and Climate Change received 30.5% compared with an indicative 25%; while Citizen Security and RCI got 2.5% and 2.7% compared with initial allocations of 1.1% and 4.4%, respectively (See Table 3).
TABLE 3
SDF 8 Strategic Operational Theme
SDF 8 THEMATIC AND PROGRAMME HIGHLIGHTS
EXPECTED OUTCOMES OF SDF 8 PROJECTS
While it is still relatively premature to fully measure many of the longer-term outcomes and development results of commitments made under SDF 8, some of the impact by a review of the various project objectives and intended outcomes can be gauged. This section provides a broad assessment of the expected outcomes of a selection of approved projects.
Promoting Inclusive and Sustainable Growth
Under this theme, projects are focused on the objectives of education and training, agriculture and rural development, economic and social infrastructure, economic and fiscal adjustment, and private sector development. The Bank supported three BMCs – Guyana, Saint Lucia, and St. Vincent and the Grenadines in the area of education and training. The skills development and employability project in Guyana seeks to help the Government in improving the quality and effectiveness of the TVET system. By improving the quality of the learning environment and the level of instruction, the project will provide the TVET system with stronger governance and management capacity. This in turn will give students better second-chance opportunities and entrepreneurship skills.
In Saint Lucia, the education quality improvement project is designed to improve the quality, equity, efficiency and effectiveness of the education system, making it responsive to the needs of diverse learners. Furthermore, the project aims to provide training and continuous professional development for 120 principals and education officers; 16 teachers and 50 officers/teachers to serve as guidance counselling officers and facilitate curriculum reviews, respectively. Resources were also approved for a TVET
development project in St. Vincent and the Grenadines. Among other things, the investment will seek to strengthen the institutional framework for the coordination and management of TVET; enhance the learning environment for an expanded and improved TVET system; enhance the TVET curriculum in addition to a Prior Learning Assessment and Recognition system; and provide greater access to training opportunities for at-risk youths and adults. As a result of the project, an additional 60 classrooms/laboratories are being built or upgraded, an additional 676 teachers are being trained, and over 10,000 students benefiting from the investment.
The third Belize Social Investment Fund will focus on increasing gender-equitable and inclusive access to climate-related infrastructure, and quality basic social services for poor and vulnerable communities. This will be achieved through investments in social infrastructure (education, health, and water and sanitation) and in social services that include human resource development for enhancing employability.
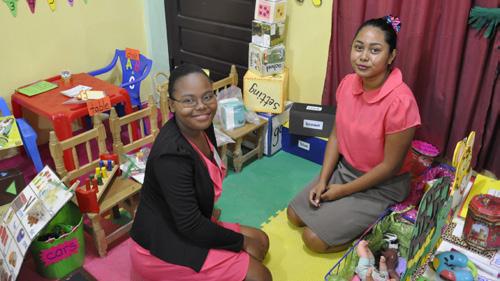
PARTICIPANTS IN AN EARLY CHILDHOOD EDUCATION TRAINING PROGRAMME IN BELIZE, LEARNING HOW TO DEVELOP AND SETUP A PRE-SCHOOL CENTRE
THE CHANGING NATURE OF POVERTY AND INEQUALITY IN THE CARIBBEAN:
NEW ISSUES, NEW SOLUTIONS.
This report sought to rethink traditional policies, approaches and strategies to reducing poverty, providing fresh outlooks that require new frameworks for assessing effectiveness.
Read more at http://www.caribank.org/publications/featured-publications/ poverty-and-inequality-in-the-caribbean-new-issues-new-solutions
This project is aimed at contributing to Belize’s national development objective of poverty reduction in poor communities.
Against a backdrop of difficult macroeconomic fundamentals, high poverty levels, and the need for improved access to electricity services consistent with SDG 7 (Ensure access to affordable, sustainable and modern energy for all), Suriname also benefited from assistance in the power sector. The power project seeks to improve the reliability and increase the capability and operational flexibility of EnergieBedrijven Suriname sub-transmission. It also seeks to make similar improvements to the distribution network on the Energie Voorziening Paramaribo and the Energie Voorziening Nickerie power systems. It is expected that this will result in the delivery of quality power supply to customers in an efficient manner in addition to the use by EnergieBedrijven Suriname of self-owned renewable energy
(RE) plants for electricity production.
The Bank continues to promote evidence-based policy development and knowledge creation in areas critically important to economic growth and reducing poverty in its BMCs. Within this vein, the Bank commissioned a regional study focused on enhancing productivity and growth in the Caribbean. The principal focus of the study is to identify critical strategies for accelerating regional medium and long-term growth. It will also consider shortcomings with respect to the policy, regulatory, and institutional infrastructure in areas critical to the acceleration of regional growth and propose appropriate remedies.
Two projects were approved to deepen inclusive and sustainable growth in the MSME sector and the agricultural and rural development sector in Haiti. MSMEs will be strengthened through support for the establishment of a Specialised Micro and Small Business Financing Assessment Unit within the Fédération Le Levier. The project promotes increased access to business loans and saving products and services for micro and small enterprises (MSEs). It will do so by establishing a professional MSE business financing assessment unit in support of Le Levier’s network of savings and credit cooperatives. The Community-based Agriculture and Rural Development project is expected to improve access to better and more inclusive agricultural production systems in the North West Department (NW) of Haiti.
Supporting Environmental Sustainability and Climate Change
MIRCO, SMALL & MEDIUM ENTERPRISE DEVELOPMENT IN THE CARIBBEAN: TOWARDS A NEW FRONTIER
The Bank provided three emergency relief grants and two immediate response loans to fund clean-up efforts after the passage of weather systems in the Region. These included support to The Bahamas, Belize and Haiti which were impacted by Hurricanes Matthew and Earl. In order to reduce the socio-economic disruptions triggered by climate-related events,
Published in May 2016, this study was conducted to assess the status of the MSME sector in 8 BMCs and to highlight critical MSME development challenges and propose a structural approach to address those challenges.
Read more at http://www.caribank.org/publications/featured-publications/ msme-development-in-the-caribbean-towards-a-new-frontier
the Bank also provided assistance to St. Vincent and the Grenadines through a DRR and climate change adaptation project. The project is expected to reduce vulnerability of communities such as Georgetown, Bridgetown and Marriaqua to extreme rainfall and climate change impacts. This is to be achieved by adopting a proactive approach of upgrading road sections and bridge structures at critical locations; upgrading and reconstructing road sections to increase alternate routes (redundancies) for climate change adaptation; and supporting institutional strengthening and capacity building with respect to monitoring and evaluation as well as DRR. Further, the Bank supported natural disaster management capacity-building programmes in Jamaica, while in Grenada, an environmental management system was established to improve the capacity of the Grenada Development Bank to assess and manage environmental and social risks in its operations. On account of Haiti’s fragile fiscal accounts and acute vulnerability to earthquakes and tropical storms, the Bank continued to fund the country’s premium to the Caribbean Catastrophe Risk Insurance Facility (CCRIF).
Citizen Security
Citizen security, covering both crime and security, as well as social protection, continues to be a significant development issue facing a number of BMCs. As mentioned earlier, in 2016 the Bank approved two critical interventions in the Awakening Special Potential by Investing in Restoration and Empowerment of Youth project in Grenada and the Youth Empowerment project in Saint Lucia. Both interventions seek to enhance citizen security. In the case of Grenada, the focus is on establishing an improved gender responsive juvenile justice prevention and response system to divert juveniles and youth from coming into conflict with the law and to rehabilitate young offenders through effective education and psychosocial services. In Saint Lucia, the project is centered on Integrated Youth Court Diversion programmes, including a Youth Recidivism
Reduction programme, an Out-of-School Suspension programme, as well as the implementation of community-based social crime prevention initiatives using a gender-sensitive approach. Additionally, crime prevention through environmental design concepts and principles will be applied to improve community assets located in vulnerable communities. This project is targeted at at-risk children, youth and their families in selected communities in Castries.
Over 2,000 children, youth and their families in the Castries Basin are expected to benefit from the programme. Aware of the vulnerable groups in BMCs and the important role they play in sustaining strong communities and economies, the Bank also invested in projects geared towards social empowerment of youth, and conducted surveys on gender-based violence.
Regional Cooperation and Integration
Projects under this theme cover a broad spectrum of regional solutions. Recognising the importance of and recent growth in the cultural industries of the Caribbean, the Bank approved key initiatives including a project that promotes the digitalisation of Caribbean music. This intervention will identify genderresponsive mechanisms to help increase export earnings of the Caribbean music industry by creating and exploiting new trade and income-generating opportunities and by using digital musical content. It is also anticipated that the administration of copyright and related rights (documentation and distribution) from digitalisation will be enhanced for stakeholders in the Caribbean region, and that more women will increase their participation in the music sector.
In order to strengthen statistical capabilities and improve core data sets, the Bank approved regional capacity-building regarding analysis and dissemination of national population and housing census data. The general objective of the project is to strengthen national and regional statistical capacity as a central input to good governance in BMCs. By demonstrating the use of specific tools
The Study was undertaken by Maritime & Transport Business Solutions B.V. (MTBS) under assignment to CDB with the overall objective of stimulating new perspectives with respect to policies, practices and institutions required to enhance efficiency and improved viability of the Port Industry.
Read more at http://www.caribank.org/publications/featured-publications/ transformation-of-the-caribbean-maritime-port-services-industry
for analysis and dissemination of census data, it is envisioned that countries and development partners will be able to further advance a cooperation agenda on data preparation, analysis and dissemination from the 2010 and 2020 census rounds and promote improved statistical governance within the context of MfDR.
Haiti
The Bank, through the SDF, continued to play a very active role in Haiti in 2016 consistent with the country engagement strategy (CSP 2013-16). CDB worked closely with other DPs, particularly the WB, Inter-American Development Bank and Global Affairs Canada, in capacity building and institutional strengthening in core areas including the non-bank financial sector; the hospitality industry; education and training; DRR; and community-based agriculture and rural development.
During 2016, CDB approved development support totaling of $12.2mn for Haiti and disbursed $4.5mn. This compares with commitments of $15.2mn and disbursements of $9.6mn for the corresponding period in 2015. With respect to the use of resources, at the end of SDF 8 total commitments were $43.5mn, representing 95% of the initial allocation of $46mn.
With regards to improving education access, CDB-sponsored projects continued to achieve significant outputs and outcomes, even though progress in 2016 was significantly impacted by the passage of Hurricane Matthew which caused substantial damage to school infrastructure in general, and specifically to the recently constructed TVET Centre in Jeremie. At the request of the Government
of Haiti (GOH), some funds under the Education for All – Phase II (EFA II) were reallocated to assist in rehabilitating damaged infrastructure, including school feeding and sanitation facilities, replacing equipment and resources, and providing additional meals to ensure that students whose families were significantly affected could have at least one nutritious meal per day. The Bank also agreed that the significant roof damage to the Jeremie TVET Centre will be addressed as part of the new TVET project approved for rebuilding of the St. Martin TVET Centre in Port-au-Prince, which was completely destroyed in the 2010 earthquake.
In relation to targets achieved under EFA, 10,937 students received tuition waivers, while 44,450 received school feeding, with another 7,000 to benefit as part of the Hurricane Matthew response. While construction work had not yet started on the new community schools, students were being supported in their current locations through the provision of teachers and resource materials. Five hundred and twenty-seven students in four rural communities are currently benefiting from this support. To facilitate the completion of school construction in the four communities, CDB extended the terminal disbursement date to December 31, 2017.
Under EFA II, CDB has also been instrumental in strengthening the capacity of Ministère de l’Education Nationale et de la Formation Professionnelle (MENFP) through the co-financing with the WB, of a new Operational Plan - 2016-2021. This is expected to be completed by the end of 2017 and will guide the sectoral policies and priorities for the period. CDB also supported execution of the 2015-16 school census intended to consolidate MENFP’s database on schools and to assist in the registration and accreditation of schools across the country.
With respect to TVET, under the Vocational Training project, two of the three centres were completed and commissioned with over 2,700 students currently benefiting from instruction in a wide variety of skill areas. Funds under the original project have been fully disbursed and the last centre is expected to be completed in early 2017 followed by the roll-out of an $11mn TVET intervention geared to provide im access.
Community-based agriculture and rural development in Haiti is a strategic focus area for CDB. In 2016, SDF supported an important intervention in the NW, which is second poorest Department in Haiti. According to the most recent Haiti Poverty Map (2012), 43% of the population of the NW is classified as poor, and 46% of households classified as food insecure, compared to the national average of 30. Five communes from the NW rank among the 13 most food insecure in Haiti. Residents of the NW depend almost exclusively on
TEACHERS FROM THE MULTI-GRADE TEACHING UNIT IN HAITI ON STUDY TOUR TO JAMAICA
agricultural output for their food and nutrition security. Agricultural output is, however, constrained by a combination of factors including: low and variable rainfall; land degradation with attendant poor soil fertility; and inefficient and poorly adapted agricultural production practices. This combination of factors negatively impacts the income-earning potential and nutritional intake of NW households.
In an effort to break the cycle of poverty and food insecurity in the NW, CDB approved $8mn to help the government in the implementation of the Haiti –Community-based Agriculture and Rural Development Project. The project will seek to improve access to better and more inclusive agricultural production systems in the NW. In keeping with community-based methodologies, the project will co-finance a menu of demand-driven sub-projects including: development of irrigation systems on approximately 400 hectares of agricultural land; rehabilitation of an estimated 1,200 hectares of watersheds linked to irrigations systems/arable land with a view to sustaining water yields and mitigating the impacts of climate change/climate variability flooding and associated soil erosion; capacity building of male and female farmers and farmer groups about climate smart agriculture; and upgrading of critical infrastructure and equipment in support of crop storage and marketing. In order to ensure the sustainability of interventions, the project will support the establishment of water user associations. These associations will, among other things, be responsible for the collection of water user fees and the maintenance of irrigation systems and watersheds.
The Bank also partnered with the Multilateral Investment Fund and Global Affairs Canada to support the creation of a specialised MSE financing business assessment unit, which will be linked to a network of savings and credit cooperatives in Haiti - Fédération des Caisses Populaires Haïtiennes – Le Levier. This initiative is designed to help strengthen the capacity of the financial institutions within Le Levier’s network to better appraise credit applications from MSE clients, thereby improving their access to financing instruments including business loans, and saving products and services primarily for un-served and underserved formal micro and very small male- and female-owned enterprises in Haiti.
Through the CTCS Network, the Bank provided training opportunities in hospitality services, namely food and beverage management, front desk operations and housekeeping. These were delivered to hotel and restaurant employees in Haiti, primarily in Port-au-Prince, Cap-Haitian, Côte des Arcadins
and Les Cayes. A total of 202 hotel and restaurant employees (141 women and 61 men) benefited from the workshops which were followed by in-house TA to participating hotels and restaurants. This included an operational audit of the establishments, which involved recommendations to establish and implement an improved food and beverage management, front desk operations and housekeeping protocols.
With respect to DRR, the Bank continued to support Haiti to meet its commitment to CCRIF 2016-2017 with the payment of the $3.5mn premium as well provide an emergency relief grant following the passage of Hurricane Matthew. Indeed, the importance of the CCRIF instrument to the country’s disaster risk management strategy was demonstrated by the receipt of a $20 mn payout in the aftermath of the hurricane.
BASIC NEEDS TRUST FUND
BNTF is one of the Bank’s key instruments for addressing poverty reduction, through assisting poor and vulnerable communities to improve access to basic public services. The programme provides grant funding for social and economic infrastructure, and skills training to enhance employability and community management.
BNTF finances and promotes sustainable interventions in low-income, vulnerable communities through subprojects designed to improve quality of life and access to basic services. It reinforces the Bank’s commitment to reducing the impact of economic and social vulnerabilities while bolstering efforts at economic growth in BMCs.
BNTF began over 30 years ago as the Caribbean Education Development and Basic Human Needs/Employment Sector Programme targeted at improving living conditions in rural poor and indigenous communities. Since 1992, BNTF has been financed through SDF, with some level of counterpart funding from beneficiary governments. The programme has enjoyed an increasing share of SDF resources since BNTF 3, with $32mn being committed for both BNTF 5 and BNTF 6, and $46mn for BNTF 7. Using the Bank’s resource allocation formula, BNTF funds are allocated to eligible countries which, as at SDF 8, include Belize; Dominica; Grenada; Guyana; Montserrat; St. Kitts and Nevis; Saint Lucia; St. Vincent and the Grenadines; and the Turks and Caicos Islands [Jamaica has been included from BNTF 6].
The success of the BNTF Programme allowed CDB, in 2003, to leverage its comparative advantage and experience in executing community-based poverty programmes to catalyse additional resources. Canada contributed the equivalent of $25mn to be administered under the BNTF 5 programme over a six-year period. In 2008, a further $1.8mn was contributed by Canada to the programme to boost the resources allocated to Jamaica. These additional resources enabled the expansion of BNTF’s coverage to include Jamaica, in addition to supplementary funds for existing beneficiaries.
The BNTF 6 Programme, approved in July 2008, was completed in 2014 and a completion report done in 2015. It funded improvements in basic infrastructure and services; increased potential for economic activity through skills training; in addition to capacity building for BNTF country officers in the application of participatory approaches for planning and monitoring of subprojects. Thematic areas such as gender and environmental assessment and the integration of disaster mitigation measures are considered during the appraisal of infrastructure subprojects.
BNTF 7 was approved in October 2012 for $51.7mn (including counterpart contributions). It builds on lessons learned from previous cycles. In December 2014, Contributors to SDF 8 approved a contribution of ten million United States dollars (USD10 mn) for the Eighth Cycle of the Basic Needs Trust Fund Programme (BNTF 8), [SDF Paper “Replenishment of the Resources of the Special Development Fund (SDF 8) - Resolution and Report of Contributors on SDF 8” refers]. Funding for BNTF 8 is estimated at $12.4mn. Similar to BNTF 7, the overall outcome of BNTF 8 is improved access to quality education and human resource development, water and sanitation, and basic community access, transportation and drainage services in low-income, vulnerable communities. Contributors and the Bank agreed that BNTF 7 and BNTF 8 be consolidated and implemented concurrently.
BNTF FUNDING LEVELS
With respect to BNTF operations, BNTF Implementing Agencies in ten BNTF Participating Countries (PCs) continued to develop portfolios of sub-projects which placed emphasis on promoting community empowerment, gender equality, environmental sustainability, and a more holistic approach to community development aligned with national priorities. CDB appraised and approved 19 Sector Portfolio submissions in 2016, comprising 120 sub-projects valued at $18.6mn: $17.7mn in grant resources with $0.9mn in governments’ counterpart financing. A total of 46,491 people (22,590 males and 23,901 females) are expected to benefit through the implementation of these approved sub-projects:
• 6,905 males and 7,957 females in Education and Human Resource Development;
• 3,488 households in Water and Sanitation;
• 5,365 males and 5,465 females in Basic Community Access and Drainage; and
• 10,320 males and 10,478 females in Community Infrastructure.
During 2016, the Dominica country projects were impacted by extensive reprogramming following Tropical Storm Erika as the country came to grips with the extent of the devastation. This ultimately delayed the commitment of resources in both BNTF 7 and 8 as new initiatives took priority over previously
approved sub-projects. This slippage, which is being actively addressed, is evident in the data that follows. It must be noted, however, that the remaining sector portfolios for all PCs were appraised and submitted for approval by year end.
STUDENTS PLAY AT ST. NINIAN’S PRIMARY SCHOOL IN GUYANA, WHERE BNTF FUNDED AN EXTENSION, WHERE OVERCROWDING WAS ONCE AN ISSUE
4
At the end of the year, 90% of the BNTF 7 country allocations had been approved, consisting of 21 Sector Portfolios and 174 sub-projects valued at $32.4mn. Disbursements under BNTF 7 improved significantly from $5.0mn at the end of 2015 to $27.5mn at the end of 2016. Table 4 and Figure 1 provide a summary of cumulative approvals and disbursements under BNTF 7.
BNTF
7 ALLOCATIONS, APPROVALS AND DISBURSEMENT AS AT DECEMBER 31, 2016
FIGURE 1
BNTF 7 SECTOR ALLOCATION ($’000)
With respect to BNTF 8, the momentum picked up in 2016. By year end 81% of BNTF 8 country allocations had been approved. In total, $8.8mn in resources were committed to 16 sector portfolios containing 53 sub-projects. Disbursements during 2016 for BNTF 8 increased from $0.5mn in 2015 to $3.9mn in 2016. A summary of cumulative approvals and disbursements for BNTF 8 is shown at Table 5 and Figure 2.
BNTF 8 ALLOCATIONS, APPROVALS AND DISBURSEMENT AS AT DECEMBER 31, 2016
FIGURE 2 BNTF 8 APPROVALS
By the end of 2016, the main investments continued to be in the Education and Human Resource Development sector. The Bank approved 77 subprojects valued at $11.0mn to construct or upgrade 133 classrooms, conduct teacher training - mainly in the area of early childhood development - and to support training in agriculture, marketing, webpage design, and music theory and performance for at-risk youth.
The Bank also approved 31 sub-projects to finance the construction and upgrading of approximately 11 kilometres (km) of secondary and farm access roads, for a value of $6.0mn. PCs prioritised their investments in the poorest communities to promote socio-economic development and social inclusion.
PCs also focused on financing interventions to improve water collection, storage and distribution and sanitation in poor vulnerable communities. The Bank approved 12 sub-projects valued at $1.6mn in this sector. These sub-projects aim to improve both the quality and quantity of water and reduce water-borne diseases and time spent collecting water for household chores, which mostly places a burden on women. Water Sanitation and Hygiene training for beneficiaries continues to be incorporated in the design of the water supply sub-projects in Guyana and Jamaica.
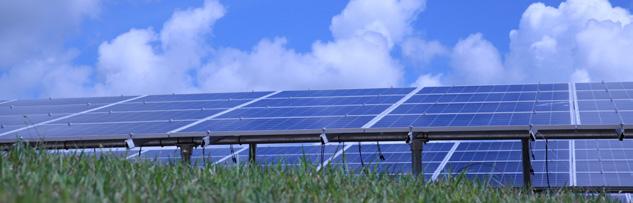
The Bank sustained its commitment to promoting RE solutions and EE in sub-projects. In the Hinterland of Guyana, photovoltaic systems were installed to provide lighting and power outlets in two schools and in seven water supply systems to power solar-powered pumps for the cost-effective distribution of water. Complementary training in the maintenance of such photovoltaic systems has enhanced the sustainability of these initiatives.
During 2016, CDB completed three independent and external reviews of the BNTF Programme: the Mid-Term Evaluation of the BNTF 7 and 8 Programme Cycles; Review of the Monitoring and Evaluation System; and the Systematic Examination of the Governance Structure and Implementation Modality for the BNTF Programme. The recommendations to improve efficiency and effectiveness of BNTF operations and to promote a greater development impact have informed the design of the next cycle of the BNTF programme.
SOME EARLY RESULTS
During 2016, PCs completed 74 sub-projects under BNTF 7 and 8 which are beginning to deliver early benefits to targeted communities
• 11,297 students (5,817 males and 5,480 females) benefited from the construction or upgrading of 138 classrooms, with additional educational support facilities such as bathrooms, administrative spaces, and facilities for the disabled.
• 406 teachers (32 males and 374 females) received training and certification in specific areas of early childhood education.
• A total of 895 persons (385 males and 510 females) graduated from various training activities across the BNTF PCs, most with National or Caribbean Vocational Qualifications in the area of training.
• A total of 5,474 households were provided with access to improved sanitation services and water supply.
• 11,032 persons (4,544 males and 6,488 females) benefited from new or upgraded community road infrastructure, including farm access roads.
• Approximately 1,871 (962 male and 909 females) benefited from newly constructed basic community infrastructure in Grenada and Saint Lucia.
A FRAMEWORK FOR YOUTH EMPOWERMENT AND ENTREPRENEURSHIP
Through TA, CDB developed a proposal for a youth empowerment and entrepreneurship pilot project for at-risk youth in BNTF PCs. This initiative aimed to develop a mechanism which specifically addressed the high levels of unemployment and underemployment among at-risk/underserved young persons. Primarily, the desired outcomes would be increased skills and opportunities for the target population to establish and build sustainable enterprises and to contribute to society in a productive and positive manner. To this end, a series of exercises were conducted to:
a. Develop a catalogue of existing youth-focused programmes, practices as well innovations in that sector within the Region as well as globally;
b. Through a participatory process, identify key gaps within the provisioning in this sector and show where BNTF can be positioned to be more effective; and
c. Craft a framework which outlined the key ingredients to be considered or included in the development and implementation of a youth empowerment and entrepreneurship intervention targeted at vulnerable youth, as well as key partners in various BNTF participating countries. Among these elements were the following:
• A rigorous monitoring and evaluation framework to guide the project implementation process and measure project impact;
• Community support for youth entrepreneurship activities;
• Some level of certification in entrepreneurship development areas, this would mean building a relationship with an existing educational institution or existing entrepreneurship training programme; and
• An innovative approach which will ensure access for youth to financial services.
Building upon data from the previous phases, a project framework was developed to target youth who engaged in risky behavior such as: teenage pregnancy; gravitating to loose ‘corner crew’ structures; no longer expecting to find work; not completing secondary school, likely exiting after four years; experiencing limited family interest in life choices. The framework proposed four distinct objectives which, when integrated, will provide at-risk youth with the support and structure necessary to begin and sustain microenterprises. These are detailed as follows:
a. An extended entrepreneurship engagement component that provides training in technical skills and soft skills, finance entrepreneurship activities, and provides continuous guidance and mentorship to foster successful youth business ventures;
b. Develop life and entrepreneurship skills for at-risk youth;
c. Practice the application of enterprising life skills for at-risk youth;
d. Provide grants to youth to facilitate business startup and growth; and
e. Build an eco-system through on-going business coaches and mentoring that will support enterprise success;
Under BNTF 9, an initiative will be piloted in at least two PCs to target youthat-risk between the ages of 18–24 years. This will serve to mobilise and partner with government entities, non-government organisations community-based organisations and the private sector to work together to support and empower youth to start and operate.
The CTCS Network is the Bank’s principal TA programme, which contributes to MSME development in BMCs. In 2016, the Bank approved $1.3mn that enabled the CTCS Network to implement TA activities aimed at the continued development of MSMEs in the Bank’s BMCs. CTCS has effectively enabled MSMEs to tap into new markets, be more competitive, and expand their operations. As at December 31, 2016, a total of $0.9mn, (approximately 78% of the approved amount), was disbursed for 46 TA activities comprising 4 regional workshops, 35 national workshops and 7 direct TA. A total of 860 business people (556 women and 304 men), benefited from these interventions, which consisted of ongoing training to improve food safety, enhancing production capacities, developing business advisory and management skills, and institutional strengthening.
Given the critical importance of health and safety in the food industry in the Region, food safety training and certification of food service handlers and managers continue to be key areas of focus for the CTCS Network. Three ServSafe workshops were conducted in Dominica, Anguilla, Dominica, and Grenada in 2016. A total of 88 persons were trained (67 women and 21 men) with a total of 62 persons (51 women and 11 men) being certified as Food Protection Managers. ServSafe is a United States of America - based certification developed by the National Restaurant Association Educational Foundation.
PARTICIPANTS’ FEEDBACK MfDR TRAINING
“This method of project writing/planning allows one to undertake a thorough analysis and have a more strategic approach which would actually deliver results. It can be used in the yearly review of my standardisation work plan as standards work is project based.”
Dianne Lalla-Rodrigues – Director, Antigua and Barbuda Bureau of Standards
“This training allowed me to increase my knowledge and skills in developing projects using a more standardized approach.”
JoVaugh Cameron – IT Manager BVI Tourist Board
“I have learned how to develop, manage and execute projects towards achieving intended results. The wealth of knowledge acquired will assist my agency to be more impactful in dealing with government resources.”
Winston Shaw – Director (Acting), Division of Training, Technology and Technical Information, Rural Agricultural Development Authority, Jamaica
PARTICIPANTS IN AN MFDR TRAINING WORKSHOP HELD IN JAMAICA IN MAY.
3
Building on a train-the-trainer workshop in 2015, training in MfDR was provided to 322 business development officers (212 women and 110 men) from a number of business support organisations in 15 BMCs3. Participants were trained to design results-focused projects, taking into consideration gender equality perspectives and principles and gender reporting. In addition, they were provided with programme and project thinking tools, which can be applied in MfDR, including designing and working with RMFs. Based on participant feedback, the workshops strengthened the capacity of business support organisations to prepare improved project proposals and assist the CTCS Network to measure, monitor and report results of TA interventions financed by CDB. This is in keeping with CDB’s MfDR agenda
Based on the demonstrated and potential significant contribution of the creative sector to the economies of BMCs, the CTCS Network conducted training to build the capacity of MSMEs in the music industry in Barbados and developed a business plan to establish a Caribbean Creative Industries Management Unit. A total of 85 persons (47 females and 38 males) were trained in a four-part developmental series of workshops, comprising women in music; the business of music; negotiating and managing contracts; and accessing international markets. Two Sub-Regional stakeholders’ consultations were conducted to guide the development of the Caribbean Creative Industries Management Unit business plan which will be presented to the Heads of Government of the Caribbean Community (CARICOM) for adoption. Sixty-nine persons attended the consultations (32 females and 37 males).
A Regional workshop, in collaboration with the Caribbean Tourism Organization, was conducted to train 16 business advisors (10 women and 6 men) from ten BMCs for the Hospitality Assured Certification Programme in the Caribbean. The advisors will subsequently provide business advisory services to tourism-related MSMEs. The purpose of this project is to strengthen the business performance and competitiveness of tourism-related MSMEs by promoting a culture of quality, service excellence and continuous improvement. Hospitality Assured is a service quality management certification owned by the Institute of Hospitality in the UK and developed specifically for the tourism sector, to promote and reward the highest levels of service and business excellence.
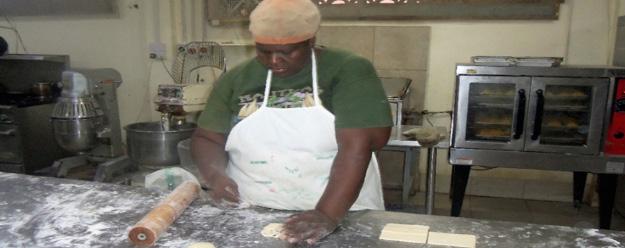
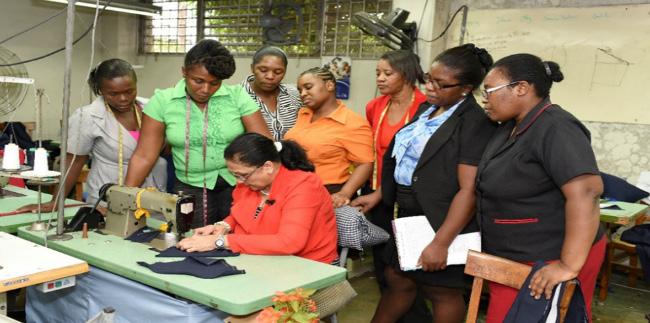
Direct in-plant assistance, inclusive of hands-on training to improve production capacity, was provided to a bakery in Saint Lucia and a uniform manufacturing company Jamaica. At the end of the interventions, both companies were able to introduce new products in response to customer demand. As a result of
sample garments manufactured during the training, the uniform manufacturing company was able to secure a contract to supply ladies’ and men’s jackets, skirts, pants, dresses and blouses to a major hotel in Jamaica.
To improve the delivery of its programme in BMCs, the CTCS Network introduced Letters of Agreement to formalise relationships with cooperating institutions in some of the larger BMCs. During the year, the Letters of Agreement were established with the Georgetown Chamber of Commerce and Industry and the Suriname Business Forum in Guyana and Suriname respectively. This is expected to enhance programme delivery and extend the reach of the CTCS Network and enhance the delivery of TA to MSMEs in those countries
Montserrat; Saint Lucia; St. Kitts and Nevis; St. Vincent and the Grenadines; Suriname; and Trinidad and Tobago.
BMCs: Anguilla; Antigua and Barbuda; The Bahamas; Barbados; British Virgin Islands; Dominica; Grenada; Guyana; Jamaica;
CAKE AND PASTRY TRAINING – SAINT LUCIA
TRAINING IN UNIFORM DESIGN AND PRODUCTION – UNIFORM CENTRE - JAMAICA
During the year, an operations manual was developed for the CTCS Network. This formed part of efforts aimed at strengthening the CTCS Network’s accountability and transparency requirements. The manual incorporates relevant CDB operating policies and outlines various procedures and processes, as well as templates. The manual will be used by CTCS Network staff and other CDB internal boundary partners, as a guidance and reference document to access, coordinate, and manage the programme. The manual is also intended for CTCS Network’s stakeholders in the Bank’s BMCs, especially cooperating institutions that submit proposals to the CTCS Network and assist in the implementation of TA activities. MSME owners and operators, as well as consultants who facilitate the delivery of TA interventions, are also expected to use the manual.
A summary of the number of beneficiaries from CTCS activities in 2016 is provided in Table 6 below.
CTCS Technical Skills Training Conducted
TABLE 6
CTCS COUNTRY PROGRAMMES 2016
SDF PORTFOLIO ANALYSIS
The quality and performance of the SDF portfolio is measured by a Project Performance Index (PPI), using a composite score derived from the application of the Project Performance Evaluation System (PPES). This composite score is a measure of the likely impact of the project relative to the Bank’s development assistance objectives. It is the sum of the weighted scores of six core criteria: strategic relevance; poverty relevance; efficacy; cost efficiency; institutional development impact; and sustainability.
During 2016, the performance rating for the projects under implementation which had an SDF component continued to be was relatively good. There were 51 projects in the portfolio with a total value of $642.0 mn compared with 51 projects in 2015 and 53 projects in 2014 with a value of $322.1mn and $355.7mn, respectively. All projects in the portfolio continued to be ranked as either satisfactory (47.1%) or highly satisfactory (52.9%). This compared with performance ratings of 31.4% (highly satisfactory) and 68.6% (satisfactory) in 2015.
In 2016, the portfolio was dominated by education sector projects (23.5%) followed by the environment and disaster risk sector (19.6%) and the financial, business and other services (13.7%) which made up the bulk of activity similar to 2015. Transport and communications as well as water and sanitation were the other relatively significant categories accounting both for 11.8% of the portfolio. In 2016, the overall average performance rating was ‘Satisfactory’ with a PPI of 5.8, relative to the overall performance in 2015 of 5.9.
Projects “at risk” (Flagged by Project Performance Management System)
PPES includes criteria relating to the scoring of project performance and changes in scores that help to identify projects “at risk5” and those experiencing difficulties. As at December 31, 2016, nine projects were classified as ‘at risk’ up from five projects in 2015. The following summarises the status of projects ‘at risk’.
5 The PPES evaluates project performance at the various stages of the project cycle – preparation/appraisal, supervision and completion. The PPES uses six criteria to rank or gauge performance. These are: strategic relevance; poverty relevance; efficacy; cost efficiency; institutional development impact; and sustainability. Projects are deemed at risk if project performance exhibits more than two of the following six risk criteria: weighted score for any criterion is equal to or below 0.5; a composite performance score below 4.0; a decline in any project performance rating score by more than 15%; timing performance more than 15% behind target; CDB performance unsatisfactory; and Borrower performance unsatisfactory.
TABLE 7
Summary of Projects Flagged “At Risk” for 2016
and capacity constraints
Negative impact of Hurricane Erika NDM
Negative impact of Hurricane Erika
Project was completed in 2016 and undisbursed balance to be cancelled in 2017
• Conditions precedent to first disbursement still pending.
Major delays in design services contract for civil works component.
Delays in meeting in conditions precedent.
Implementation bottlenecks with respect to procurement and weak capacity of Project Unit
Weak inter-agency
• Delays in the procurement of the civil works component.
Efforts are being made to closely monitor the “at risk” projects and facilitate course corrections to put them back on track toward achieving their stated development objectives. In particular, focused attention is being given to strengthen capacity in the area of procurement as well as to improve broader project management skills in BMCs.
3. REPORTING ON SDF 8 RESULTS
This chapter presents the 2016 results of the Bank’s development efforts within the context of the SDF 8 RMF. The RMF, which summarises the Results Agenda of the Bank supported by SDF 8, is anchored by three pillars - MfDR at the country or regional level, MfDR at the institutional or corporate level, and MfDR through partnerships, harmonisation and alignment.
The SDF RMF translates the three pillars of the results agenda into four levels. The progress made by BMCs towards selected CMDG targets and development outcomes are monitored by Level 1 indicators. Level 2 indicators measure the Bank’s contribution to country outcomes through outputs and immediate outcomes delivered in key areas such as education, social and economic infrastructure, and water and sanitation among others. At Level 3, institutional and operational indicators measure improvements to the Bank’s efficiency and effectiveness and progress in relation to the Paris Declaration and the Accra Agenda for Action is covered at Level 4. The status of indicators for the four results’ levels in the approved SDF framework as of December 31, 2016 is presented in the text and tables on the following pages. A detailed presentation and analysis of CDB’s progress on these indicators is provided in CDB’s 2016 Development Effectiveness Review which reviews progress based on CDB’s 2015-2019 Corporate RMF.
Level 1: Regional Progress towards Selected CMDG Targets and Development Outcomes
Level 1 measures regional progress in CMDG targets related to poverty and human development, education, and environmental sustainability. Additionally, it measures per capita GDP growth and RCI efforts. The global economic crisis thwarted much of the hope of achieving a broader set of MDGs in the Caribbean, and targets were not quite achieved in the areas of poverty reduction and sustainable development. As a whole, the Region had already achieved near-universal access to primary education, and sustained this over the period, while also improving access to secondary level education. Meanwhile, BMCs generally struggled with environmental sustainability and climate change resilience, with the Region suffering heightened losses from natural hazard events. However, gains were made in increasing access to improved water sources and sanitation. There was no significant progress on indicators relating to the goal of deepened RCI, an objective of growing importance for the Region’s future economic success.
Data limitations and capacity deficits at the country level limited the collection and reporting on the CMDGs. This challenge will continue to affect monitoring of the SDGs, which is an even more ambitious mandate. CDB will be instrumental in supporting this process, and will incorporate advancements within its RMF going forward.
6.
RMF LEVEL 1
Regional Progress Towards Selected CMDG Targets and Development Outcomes
1 These are based on the MDG targets established internationally and accepted by the Region, which had a target date of 2015.
2 Excludes Suriname, which was not a BMC at the time the targets were set.
Level 2: CDB/SDF Contributions to Country and Regional Outcomes
Level 2 indicators measure the Bank’s contribution to country outcomes, through outputs and immediate outcomes delivered in key operational areas. These including: education and training; agriculture and rural development; social and economic infrastructure; private sector development; and water and sanitation. The results recorded for 2013-2016 reflect those that were expected to be delivered during the SDF 8 period, based on projects approved in earlier cycles and planned approvals early-on in the SDF 8 cycle.
Delivery of planned results was strongest in the following sectors: social and economic infrastructure; private sector development; water and sanitation; environmental sustainability; support for RPGs; and capacity development for the public sector. The variation in percentage of the target achieved across indicators is due to a combination of two main factors: the adjustment of programming according to changes in priorities, since the programming targets were set in 2012, as well as delays in project implementation timelines. Based on regional priority needs evidenced by BMCs’ progress toward the MDGs, CDB increased its focus on supporting environmental sustainability and EE/RE, private sector development and RCI. These were strategically emphasized over social protection and support for national security policies.
Over time, through SDF, CDB has facilitated significant country investment in the education sector. Though originally planned targets were not quite achieved, a strong education focus continued throughout the SDF 8 period. A total of 550 classrooms were built or upgraded, and 3,040 teachers were trained/certified in primary and secondary education. Upgraded facilities and teachers with improved competencies benefited 157,162 students. These results contributed to access to higher-quality education services and improved student success rates.
CDB’s support for agriculture and rural development focused primarily on training stakeholders in improved production technologies. A total of 3,848 stakeholders were trained over the course of SDF 8. Seventy-nine farmers and rural dwellers also benefited from increased access to rural enterprise credit programmes and 992 hectares of newly irrigated or improved land. Results achieved in this sector fell short of what was originally expected due to the cancellation of some projects.
SDF 8 maintained a strong focus on providing improved social and economic infrastructure. Results achieved in community-level infrastructure improvements far exceeded original plans. The majority of these results were delivered under BNTF, the
Bank’s poverty reduction vehicle. A total of 147 community infrastructure works were built or upgraded, providing 471,575 men, women and children with better access to services. Over 18,000 households in rural areas received access to improved sanitation and water supply. In addition, 401,203 men and women benefited from 21 km of sea defences, landslip protection, and urban drainage, as well as 451 km of new/improved roads, providing communities with reduced time and cost of travel, and increased mobility and access to economic opportunities.
Private Sector Development initiatives performed well over the period of the cycle. Responding to high demand, CDB delivered more results in this area than originally planned. Businesses across the Region benefited from enhancements to the business climate and support for increased competitiveness through the delivery of 21 initiatives. A total of 1,067 people, of which 16% were females, benefited from credit and mortgage programmes. Over 2,000 MSMEs, of which 64% were female-owned, benefited from capacity- building support through CTCS and other TA modalities. This was less than originally forecasted.
Planned results were achieved in support of environmental sustainability, and climate change resilience. Seven national/sector policies/strategies/ legal frameworks were developed or implemented to improve capacity for climate resilient conservation, rehabilitation, or sustainable management.
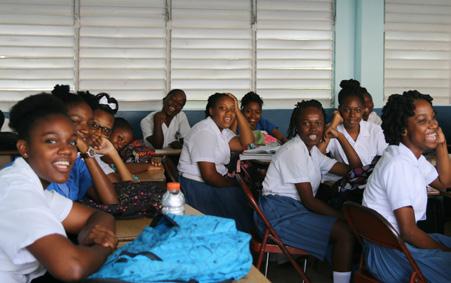
STUDENTS AT ST. JOSEPH’S CONVENT IN ST. VINCENT AND THE GRENADINES
Over 1,000 megawatt hours of energy savings were achieved from RE/EE interventions. The anticipated results with respect to providing communities with improved capacity to address climate change and DRM were not achieved due to implementation delays.
Good progress was made in supporting the creation and strengthening of RPGs, as well as in providing capacity support for public sector reform. Desired progress in these areas was either exceeded or nearly met.
RMF LEVEL 2
CDB’s Contributions to Country and Regional Outcomes through Outputs
INDICATORS
Education and Training (at all levels)
1. Primary and secondary classrooms built or upgraded according to minimum standards (number)
2. Teachers trained/certified in primary and secondary education (number)
3. Students benefiting from improved physical classroom conditions, enhanced teacher competence and access to student loan financing (number)
4. Percentage of secondary school graduates achieving five CXC General Proficiency passes including Mathematics and English by gender:r
5. Proportion of students starting from Form 1 who reach Form 5 (Survival Rate) by gender:r
6. Percentage of students completing at least one Level 1 course in TVET by gender: r
Agriculture and Rural Development
7. Land irrigated or improved through drainage, flood and irrigation works (hectares)
Environmental Sustainability, DRM and Climate Change
21.
Contributions to Country and Regional Outcomes through Outputs
RMF LEVEL 2 C ontinued
CDB’s Contributions to Country and Regional Outcomes through Outputs
INDICATORS
22. National/sector policies/strategies/legal frameworks developed or implemented to improve capacity for climate resilient conservation, rehabilitation, or sustainable management (number)
25. RPGs created or strengthened (e.g. statistical capacity, quality standards, procurement, and debt relief) (number) 1
26. Certification or accreditation systems supporting the free regional movement of goods and persons, created, strengthened, or expanded. (number) 2
National security policies and strategies developed or implemented (Number)3
Social protection policy frameworks developed and successfully implemented (Number)
r This indicator measures regional-level results, not results specific to CDB projects. Therefore, this indicator has been moved to Level 1 in CDB’s 2015-2019 Corporate RMF.
1 Revised indicator replacing legal, regulatory and policy reforms adopted to improve RCI (number)
2 Revised indicator replacing share of intra-regional sea trade from the Organisation of Eastern Caribbean States and other disadvantaged countries (Belize and Guyana) of total intra-regional sea trade.
3 Due to a change in priorities, CDB did not programme achievements in the area of social protection, nor support with national security policies and strategies.
n/a: Data not available
c.a: Insufficient data available to assess progress
.. Not applicable as CDB was not programming in this area
Level 3: Operational/
Organisational Effectiveness
Level 3 indicators monitor operational and organisational effectiveness in six areas. These include operational quality and portfolio performance; resource allocation and mobilisation; strategic focus; capacityuse; use of administrative budget resources; and business processes and practices. Targets were ambitious and, as seen in the table on this page, CDB’s success in achieving them was mixed.
Ninety-nine percent (99%) of projects under implementation in the portfolio were rated either satisfactory or above, exceeding the 2016 target. Project supervisions reports were also completed for all projects. However, progress is still needed with regard to timely reporting on project status and results, as seen by 2016 performance related to the completion of PCRs.
CDB performed well with respect to maintaining its strategic focus. Concessional resources were allocated according to the performance-based allocation system as desired. In order to better align its support with BMC’s existing national development plans and sector strategies, CDB moved away from its original plan to support the use of its National Poverty Reduction Strategy (NPRS) tool and instead invested in the use of the multidimensional poverty index methodology for Country Poverty Assessments.
New or updated NPRSs for BMCs in past five years (Number)1
9. Proportion of financing supporting environmental sustainability and climate change (%)
10. Proportion of financing supporting regional cooperation and development (%)
In 2016, CDB met its business process and practices targets which relate to loan approval and processing times. The average loan processing time in public sector operations, from appraisal mission to project approval, reduced from 17 months in 2013 to 10.6 months in 2016. However, CDB’s disbursement efficiency rate saw a general decline over the programme period to 72% in 2016.
The SDF8 programme performed well in keeping with its strategic focus. As targeted, the majority of resources (71%) were directed to less developed BMCs, and a significant portion (39%) of financing was directed through initiatives supporting environmental sustainability and climate change adaptation/mitigation. However, the programme did not achieve the desired level of focus on supporting regional cooperation and development.
CDB improved the use of its capacity by increasing the ratio of professional staff to support staff, increasing staffing in the operations department, and significantly lowering the vacancy rate for management and professional level positions. Over the course of SDF 8, CDB made strategic investments in key corporate areas such as risk management, evaluation, and audit. Increased administrative expenses reflect these investments, which CDB is focusing on leveraging in order to increase its operational effectiveness.
Level 4: Partnership, Harmonisation and Alignment
Level 4 indicators reflect the principles of ownership, harmonisation, alignment and partnerships consistent with the Paris Declaration and Accra Agenda for Action for promoting development effectiveness. CDB continued to foster development outcomes by striving for country ownership. As seen in the table on this page, CDB did a good job overall at achieving its ambitious targets in these programme areas.
Ownership
1. Number of BMCs with national development strategies, PRSs and Country Poverty Assessments
Harmonisation
2. Percentage of CDB country strategies with explicit consideration of other agencies’ programming.
3. Percentage of financing using common arrangements or procedures (as a % of total financing)
Alignment 4. Percentage of capacity development support provided through coordinated programmes.
5. Projects using common arrangements or procedures (as a % of total financing)1
Partnerships
6. Proportion of CSPs, other DP missions and project financing conducted jointly with at least one other DP
4. FINANCIAL RESOURCES AND PROGRAMME LEVELS
SDF 8 PROGRAMME LEVEL
The SDF 8 cycle overall programme level approved by Contributors was $348mn. The forecast funding includes internally generated resources of $100mn (inclusive of brought forward commitment authority), agreed new contributions of $212.7mn, an allocation of $18.0mn from the net income of the Bank’s OCR and a structural gap of $17.3mn. The structural gap was expected to be filled by new and additional contributions. Therefore, the base funding and minimum programming level was projected at $330.7mn as shown in Table 8. Additional details of the SDF 8 approved programme levels are provided in Appendix 2.
*Actual balance as at 1 January, 2013
As at the end of 2016, the end of the cycle, the actual programme level for SDF 8 amounted to $328.7mn or $2.0mn lower than originally planned on account of three factors. The level of actual commitment authority at the beginning of the cycle was $3.7mn lower than the forecast, while the internally generated resources and new contributions were higher than forecast by $0.9mn and $0.8mn, respectively. Consequently, the size of the structural gap is $19.3mn or $2.0mn higher than in the Contributors’ Report.
COMMITMENT AUTHORITY
Table 9 indicates the actual commitment authority for the period 2013–2016 and the use of those resources during SDF 8. Loan approvals, net of cancellations of $9.4mn at the end of 2016, were $223.6mn while grant approvals, net of cancellations of $1.8mn, were $89.7mn. This translates to available commitment authority at the end of 2016 of $15.4mn to be the carry-over balance to SDF 9.
TABLE 9
SDF 8 Commitment Authority and Use of Funds
*Net of cancellations
ALLOCATION AND USE OF RESOURCES
The original programme for SDF 8 was $348.0mn. It comprised loans to be allocated to eligible BMCs ($208.0mn), a loan allocation to Suriname of $10.0mn as well as loans for natural disaster mitigation and rehabilitation for $30.0mn, and set-aside grant resources of $100.0mn. The approved Resource Allocation System was used to allocate loans to eligible BMCs as well as the set aside of $10.0mn for BNTF 8. Omitting the structural gap of $17.3mn, a base level of $330.7mn was programmed. On account of differences in the opening commitment authority, not withstanding marginal increases in internally generated funds and new contributions, the base level (at the end of the cycle) was reduced to $328.7mn.
Table 10 – SDF 8 Allocation and Use of Resources – provides details of the indicative allocations for country loans and set asides at January 2013, along with the actual commitments for the SDF 8 cycle. Over the four-year period of the cycle, total commitments amounted to $324.4mn. Loan approvals were $233.0mn or 71.8% of the programme. Country loan approvals, including Suriname, amounted to $214.1mn or 66% while loans for natural disaster mitigation and rehabilitation stood at $18.8mn or 5.8%. Grant approvals accounted for $91.4mn or 28.2% of the programme.
Only one of the ten countries, Montserrat, did not access its allocation. Consequently, this amount of $9.3mn was redistributed to eligible countries with strong demand. Guyana, Belize and Grenada led the way in loan commitments, accounting for $40.6mn, $31.1mn and $27.2mn, respectively. Collectively, these three countries absorbed 46.2% of funds available for lending (excluding the set-side for natural disasters).
The set-aside for natural disaster mitigation and rehabilitation of $30mn was not fully committed and was used to bolster poverty-reducing infrastructure upgrades, as well as to fund loans in the area of citizen security in Belize, Grenada and Saint Lucia.
Grant resources were set aside for Haiti, BNTF, capacity-building TA, CTCS, Regional Integration and RPGs, agriculture, immediate disaster response, environmental sustainability and climate change and citizen security. The allocations for Haiti ($46mn), BNTF, capacity building, citizen security, regional integration and RPG and environmental sustainability and climate change were fully committed or substantially committed by the end of the cycle. Only approvals for CTCS, agriculture and immediate disaster response were lower at 78%, 70% and 60%, respectively.
TABLE 10. SDF ALLOCATION AND
5. FINANCIAL PERFORMANCE AND PROJECTIONS
FINANCIAL RESULTS
The financial performance of SDF (U) was somewhat stronger in 2016 relative to 2015. While loans outstanding were virtually unchanged at just over $543mn, on account of near equity between loan disbursements ($28.2mn) and loan repayments ($28.5mn) during the year, most financial indicators showed improvement. Undisbursed balances showed a reversal in the upward trend experienced during the period 2013-2015, contracting by $6.8mn during 2016 relative to the previous year. This reflects improved project supervision and more strategic country engagement, particularly in relation to portfolio reviews. Loan income also showed some expansion (by $0.3mn) to reach $12.4mn by the end of the year. The Fund’s investment income displayed a
significant improvement. For the first during the SDF 8 cycle, investment income exceeded $2.0mn (at $2.3mn) reflecting stronger global capital markets and the accompanying increase in interest rates.
Administrative expenses relating to the Fund declined by almost one million dollars to $15.9mn. Consequently, the net income of the Fund recorded a small loss of $1.0 mn compared with a loss of $2.9mn in the 2015. In 2015, administrative expenses were significantly affected by a number of extraordinary items, including one-off restructuring costs, rising pension costs consequent to an extension in the retirement age, and higher employee costs associated with the filling of vacancies. Table 11 captures a summary of financial results over the past five years.
TABLE 11
Summary of Projected Financial Results, 2012-2016 ($mn)
NOTES, ENCASHMENTS AND DRAWDOWNS
In 2016, a total of $17.5mn in promissory notes was issued by six member countries. This was $22.8mn less than the total notes received in 2015 from eight member countries. Total encashments stood at $22.6mn, which was $22.3mn less than the total promissory notes encashed the previous year. As usual, in accordance with agreements with Contributors and in an effort to avoid exchange rate risks, non-US dollar denominated notes received were encashed when received. Total notes receivable fell by $6.1mn over the review period to $73.2mn at the end of 2015. The current value of total approved contribution to SDF (U) at the end of 2016 was $1,167.9mn compared with $1,201.9mn in 2015 (See Appendix V-3 for details).
FINANCIAL PROJECTIONS
Annual loan growth is projected at 4.9% over the three-year period to 2019 and is expected to reach $622.8mn. This expectation is based on the continued improvement in project supervision and ongoing strengthening of country systems that support project implementation, particularly procurement. Loan income is therefore projected to increase steadily over the forecast period from $12.4mn in 2016 to $14.1mn at the end of 2019 (see Table 12). On the cost side, administrative expenses are expected to be held relatively flat, reflecting increased operational efficiency as well as administrative offsets from the growth activity funded by Other Special Funds. Consequently, net income is forecast to gradually improve to $0.8mn, $1.7mn and $2.2mn in 2017, 2018 and 2019, respectively. The average lending rate is assumed to be 2.5% for the purposes of the projections. Investment yields are expected to be positively impacted by the gradual strengthening of global interest rates.
REGIONAL MEMBERS: BMC s
CONTRIBUTIONS TO THE UNIFIED SPECIAL DEVELOPMENT FUND
(After transfers from earlier SDF and other adjustments) ($mn)
a/ At exchange rates as of dates of payment.
b/ Suriname joined the Bank in September 2013 and Haiti joined in 2007.
APPENDIX I
CONTRIBUTIONS TO THE UNIFIED SPECIAL DEVELOPMENT FUND
c/ Mexico contributed $5 mn and $3.33 mn to SDF Other in 1984 (SDF 1) and 1988 (SDF 2).
d/ SDF 1 contributions include amounts originally contributed to earlier special funds.
e/ No longer a member as of October 2000.
f/ Joined in 1998 subsequent to the Replenishment Negotiations on SDF 4.
SDF 8 PROGRAMME LEVEL, COUNTRY GROUPS AND TERMS OF LENDING
SDF 8 PROGRAMME LEVEL
The Contributors approved an overall programme level for SDF 8 -of $348mn. This is accounted for by $208mn in country loans, $40mn in loans for natural disaster mitigation and rehabilitation and the new BMC Suriname, and $100mn in grant allocations (See Box – Approved Programme Level for SDF 8).
COUNTRY GROUPS AND TERMS OF LENDING
Country Groups are used to determine eligibility for access to the SDF as well as the terms and conditions of lending. SDF Lending Terms vary according to the country grouping. A review of the country classification mechanism was undertaken for SDF 8 and the number of country groups was reduced from four to three, and the number of bands with differential terms was also reduced, from four to two. The country groupings to be used and the lending terms which will apply for SDF 8 are presented in the Box on this page.
COUNTRY GROUPS AND TERMS OF LENDING FOR SDF 8
COUNTRY GROUP COUNTRY TERMS OF LENDING
GROUP 1
(Mainly OCR)
GROUP 2
(Blend of SDF and OCR)
Anguilla
Antigua and Barbuda
The Bahamas
Barbados
British Virgin Islands
Cayman Islands
Trinidad and Tobago
Turks and Caicos Islands
Belize
Dominica
Grenada
Guyana
Jamaica
Montserrat
St. Kitts and Nevis
Saint Lucia
St. Vincent and the Grenadines
Suriname a/, b/
GROUP 3
(Mainly SDF)
Interest rate – 2.5%
Maximum Grace Period – 5 years
Maximum Overall Maturity – 20 years
Interest rate – 2.5%
Maximum Grace Period – 5 years
Maximum Overall Maturity – 25 years
Haiti b/ Interest rate – 2.0%
Maximum Grace Period – 10 years
Maximum Overall Maturity – 30 years
a/ Suriname joined the bank in September 2013 and became a contributor to SDF b/ a set –aside allocation will be used instead of the resource allocation formula
SDF 8 COMMITMENTS, 2013-2016
SDF 8 COMMITMENTS, 2013-2016
SDF 8 COMMITMENTS, 2013-2016 (Classified by SDF 8 themes) ($’000)
APPENDIX III
SDF 8 COMMITMENTS, 2013-2016 (Classified by SDF 8 themes) ($’000)
SDF 8 COMMITMENTS, 2013-2016 (Classified by SDF 8 themes) ($’000)
SDF 8 COMMITMENTS, 2013-2016 (Classified by SDF 8 themes) ($’000)
SDF 8 COMMITMENTS, 2013-2016
SDF 8 COMMITMENTS, 2013-2016 (Classified by SDF 8 themes) ($’000)
SDF 8 COMMITMENTS, 2013-2016
APPENDIX III
SDF 8 COMMITMENTS, 2013-2016 (Classified by SDF 8 themes) ($’000)
SDF 8 COMMITMENTS, 2013-2016
APPENDIX III
SDF 8 COMMITMENTS, 2013-2016
SDF 8 COMMITMENTS, 2013-2016
SDF 8 COMMITMENTS, 2013-2016
SDF 8 COMMITMENTS, 2013-2016 (Classified
by SDF 8 themes) ($’000)
PROJECT
SDF (UNIFIED) PORTFOLIO ANALYSIS-2016
The quality and performance of the SDF portfolio is measured by a PPI, using a composite score derived from the application of the PPES. This composite score is a measure of the likely impact of the project relative to the Bank’s development assistance objectives, and is the sum of the weighted scores of six core criteria: strategic relevance; poverty relevance; efficacy; cost efficiency; institutional development impact; and sustainability. The project performance ratings and the respective composite scores are given below:
PROJECT PERFORMANCE RATING
During 2016, the performance ratings for the projects under implementation that had an SDF component continued to be relatively good. There were 51 projects in the portfolio with a total value of $330.3mn, compared with 51 projects in 2015 and 53 projects in 2014 with a value of $322.1mn and $355.7mn, respectively. All projects in the portfolio continued to be ranked as either satisfactory (47.7%) or highly satisfactory (52.9%). This compared with performance ratings of 31.4% (highly satisfactory) and 68.6% (satisfactory) in 2015. (See Table 1 below).
TABLE 1
SDF (U) PORTFOLIO – PROJECT PERFORMANCE RATING FOR THE YEARS ENDING DECEMBER 31, 2015 AND 2014
COUNTRY PORTFOLIO PERFORMANCE
In 2016, five countries were rated highly satisfactory, while six countries and one regional project were rated satisfactory. Tables 2 and 3 summarise the country portfolio performance for 2016 and 2015.
TABLE 2
SDF PORTFOLIO – COUNTRY PERFORMANCE RATING FOR THE YEARS ENDING DECEMBER 31, 2016 AND 2015
Guyana, Montserrat, St. Kitts and Nevis, Suriname
British Virgin Islands, Dominica, Grenada, Jamaica, Saint Lucia, St. Vincent and the Grenadines and Regional
Anguilla, Belize, Jamaica, Suriname
British Virgin Islands, Dominica, Grenada, Guyana, St. Kitts and Nevis, St. Vincent and the Grenadines and Regional
TABLE 3
SDF PORTFOLIO – COUNTRY PERFORMANCE RATING BY PPI FOR THE YEARS ENDING DECEMBER 31, 2016 AND 2015
Barbuda
and Tobago
SECTOR PORTFOLIO PERFORMANCE
In 2016, the portfolio was dominated by projects in the Education sectorprojects (23.5%) followed by the environment and disaster risk sector (19.6%) and the financial, business and other services (13.7%) which made up the bulk similar to 2015. Transport and communications as well as water and sanitation were the other
relatively significant categories accounting for both for 11.8% of the portfolio. In 2016, the overall average performance rating was ‘Satisfactory’ with a PPI of 5.8, relative to the overall performancein 2015 of 5.9 (See Table 4 below).
TABLE 4
SDF PORTFOLIO – AVERAGE PERFORMANCE SCORES BY SECTOR FOR THE YEARS ENDING DECEMBER 31, 2016 AND 2015
APPENDIX V
SDF FINANCIAL STATEMENTS
V-1: Summary Balance Sheets as at December 31, 2012-2016
V-2: Summary Income Statements for the years ending December 31, 2012-2016
V-3: Summary of Notes, Encashment and Drawdowns 2016
V-4: Projected Balance Sheets as at December 31, 2017-2019
V-5: Projected Income Statements for the years ending December 31, 2017-2019