All rights reserved. No part of this publication may be reproduced, stored in a system, or transmitted in any form or by any means, electric or mechanical, including photocopying, recording or otherwise without the permission of the publisher.
Published by: Caribbean Development Bank
The views expressed in this paper, as well as any errors of commission, or omission, are the sole responsibility of the authors, and do not necessarily reflect the opinion of the Caribbean Development Bank.
FIGURES TABLES
Figure 1.1 Caribbean: Total Contribution of Travel and Tourism to GDP
Figure 2.1 BMCs’ Passenger Boarding per Capita, 2017
Figure 2.2 Passenger Boarding by Country 2007 – 2017
Figure 2.3 Annual Passenger Traffic Growth from the Caribbean 2007 – 2017
Figure 2.4 Destination Markets from the Caribbean by Passengers, 2012 and 2017
Figure 3.1 Change in Global Connectivity 2008 – 2018
Figure 3.2 Change in Regional Connectivity 2008 – 2018
Figure 3.3 Total City-pairs by Destination Region 2009 – 2018
Figure 4.1 Average Revenue per Passenger per Kilometre, by Country, 2016
Figure 4.2 Yield vs Distance by Country
Figure 4.3 TFCs and LIAT Average Fares (One way)
Figure 5.1 Flights between Bridgetown and Kingston
Figure 5.2 Potential New Direct Intra-regional Routes
Table1 Top Extra-regional City-pair Markets to/from the Caribbean, by Average Weekly Seat Capacity 2017
Table 2 TFCs June 2018
Table 3
Incremental Passenger Traffic (000s) (2025)
Table 4 Total Employment and GDP Impacts 2025 - Scenario 4
FOREWORD
Air transport connects the Caribbean with the rest of the world and with its constituent states; and in that regard is an important consideration in the pursuit of sustained economic growth and development for this Region.
Seamless access to markets is vital for increasing competitiveness, productivity, trade, and foreign direct investment in our Region. It is estimated that travel and tourism alone accounted for 15.2% of GDP and 4.3% of jobs in 2017. Most of this would have been thanks to air transport, which in addition would have generated catalytic benefits and jobs for other sectors.
In recent years, the regional aviation industry has come under close scrutiny because of contrasting performance between countries and between categories of trips. While overall air traffic rose between 2007 and 2017, nine of the Borrowing Member Countries (BMCs) of the Caribbean Development Bank (CDB) experienced declines in passenger numbers. Other countries in the Region saw traffic increase over the same period. In addition, air traffic to and from the Region was higher, with few exceptions; but intra-regional traffic fell.
In 2015, the CDB-commissioned report “Making Air Transport Work Better for the Caribbean” shed light on the difficulties facing the industry. Major concerns included poor management and incentives; outside interference; lack of scope for economies of scale; lack of cooperation (between airlines and between airports and airlines); regulatory issues; and policy issues, such as taxation.
This new study entitled “Air Transport Competitiveness and Connectivity” complements the 2015 Report by proposing realistic and practical policy actions to overcome the barriers to intra-regional air traffic and to create conditions that will lead to better service, and therefore enhanced economic activity and job creation.
This study raises awareness about the options available for improving the competitiveness of the regional aviation sector, and in that regard, should be of particular interest to regional policy and other decision-makers.
Wm. Warren Smith, Ph.D., CD President Caribbean Development Bank
ACKNOWLEDGEMENTS
This publication was collaboratively written by a team of authors at CDB (Economics Department) and the International Air Transport Association (IATA).
CDB: Damien Reeves (Economist); Ronald James (Economist); Raquel Frederick (Research Analyst); and Justin Ram (Director, Economics Department).
International Air Transport Association: James Wiltshire (Head of Policy Analysis).
Modelling was undertaken by InterVistas.
We would also like to thank Amos Peters (Economist, CDB) for his inputs, expertise, and thoughtful reviews of early paper drafts.
Also thanks to CDB staff who gave feedback at an internal seminar held in April 2018, and to Annaleen Lord (IATA Area Manager – Caribbean) and Ariela Barquero (IATA Industry Relationships Manager, Caribbean).
Gratitude is expressed to Sonia Hampden and Andria Murrell (Economics Department) for their editorial and administrative support, as well as to the staff of the Corporate Communications Unit for their assistance.
Justin Ram, Ph.D. Director, Economics Department Caribbean Development Bank
ABBREVIATIONS
AA - American Airlines
ASA - Air Service Agreement
ANSP - Air Navigation Service Provider
BMC - Borrowing Member Country
BVI - British Virgin Islands
bn - billion
CARICOM - Caribbean Community
CDB - Caribbean Development Bank
GDP - Gross Domestic Product
ICAO - International Civil Aviation Organization
IATA - International Air Transport Association
LIAT - Leeward Islands Air Transport
mn - million
MASA - Multilateral Air Services Agreement
OECS - Organisation of Eastern Caribbean States
p.a. - per annum
TFCs - Taxes, fees and charges
TCI - Turks and Caicos Islands
USD - United States Dollar
VAT - Value-Added Tax
WTTC - World Travel and Tourism Concil
EXECUTIVE SUMMARY
Air connectivity is a critical element for economic growth and development, especially for the small island nations of the Caribbean.
Additional air services and frequencies mean higher traffic volumes, which in turn help to improve economic competitiveness and therefore create employment opportunities.
Improved and more regular air connections enable economies to attract more tourists (including non-leisure visitors), conduct more trade and attract more foreign investment. Without these important air links, a country’s economy and employment potential could suffer.
Air traffic in the Caribbean has grown, but performance has varied by country.
While there has been robust traffic growth in some countries in the Region, such as the Dominican Republic and Cuba (largely related to tourism), growth has been negative or weak for many other Caribbean nations, including some Borrowing Member Countries (BMCs) of the Caribbean Development Bank (CDB). Overall, traffic growth in the Caribbean has been positive over the past decade but this is driven by growth in extra-regional traffic.
Intra-regional air connectivity has declined over the past decade.
The International Air Transport Association’s index shows a decline at the intra-regional level for all but six countries between 2008 and 2018. This is in contrast to the rise in global connectivity for the majority of Caribbean countries.
Small markets and short sector lengths create a natural hurdle to intra-regional traffic growth.
The airline markets, especially the intra-regional markets, are thin, meaning that providing services is more costly, as airlines struggle to benefit from economies of scale or density.
High operating costs for intra-regional travel are exacerbated by regulatory impediments, taxes and charges.
Growth in air traffic is limited by a combination of:
• high taxes, fees and charges, as they add to the cost of travel;
• barriers, such as a lack of liberalisation in air services and a lack of regulatory harmonisation, exacerbated by the proliferation of agencies and authorities that are responsible for setting and supervising aviation regulation;
• institutional impediments, including inefficient use of air and ground infrastructure, as well as inefficient customs and border processes; and
• inadequate and/or ineffective tourism development and investment, and insufficient or ineffective cooperation between the aviation and tourism sectors.
There are policy remedies available to enhance air services
These include:
• A reduction in aviation taxes – this would make travel more affordable, and would particularly benefit intra-regional travel.
• A reduction in airport charges – lowering charges may allow airlines to operate in markets that are considered thin and where operating costs are important for viability. This may also be a way for airports to attract air services, especially for extra-regional travel.
• Better market access – many studies have shown that the liberalisation of air services has led to greater air carrier competition, more routes, reduced air fares, and higher traffic volumes.
• Greater regulatory harmonisation across the Region –aviation is a global industry and relies on common standards. This is particularly true in the case of a small region such as the Caribbean where the need to comply with multiple regulatory regimes adds to complexity and cost for the key actors, impacting airlines’ ability to operate. A harmonised regulatory regime, consistent with globally-accepted and better regulation principles would simplify the business significantly.
• More efficient operations – air passenger growth could be achieved with more efficient use of airport and air navigation infrastructure, better aircraft utilisation and more efficient customs and border processes.
Adopting these policy remedies could raise long-term employment, adding approximately 207,000 jobs as well as USD3.3 billion (bn) in Gross Domestic Product (GDP) across the Caribbean.
Specifically for the 19 BMCs, the improvement in long-term employment and GDP would be 101,000 jobs and USD1.5 bn respectively. The long term refers to 2025 and is based on a scenario including all of the policy remedies mentioned above, which could lead to 28% more passengers travelling in the Caribbean. Higher passenger numbers would also improve the economics of routes that were previously served indirectly. Moving to direct services would mean more convenience, and generate even more traffic.
These policies could be complemented by measures to stimulate demand and support the development of new routes.
Commencement of new air service will involve significant risk and substantial investment on the part of airlines. There are a number of policy and commercial tools that can be implemented to provide support to carriers and stimulate demand. These include route development funds, start-up financing, joint marketing and guaranteed purchase of a block of seats.
1 INTRODUCTION
The Caribbean Region is mainly an archipelago of islands throughout the Caribbean Sea; the continental states of Belize, Guyana and Suriname are considered Caribbean in the context of this study. The Region’s states are characterised by smallness, in terms of land mass, population and economic size. Formerly agrarian-based economies, services (in particular, tourism) have emerged as the predominant economic activity. Several Caribbean countries relied on agricultural exports as the main source of foreign exchange until the mid-1990s. In the 1990s, however, trade liberalisation resulted in an erosion of preferential agreements with Europe. This meant that the main export products for many Caribbean economies, sugar and bananas, were unable to compete globally and those industries suffered.
The decline in agriculture gave way to the development of the tourism industry, which now accounts for a sizeable share of GDP and foreign exchange earnings of most Caribbean states. A critical element of a well-functioning tourism industry is connection to source markets. Connectivity within the Caribbean and to the rest of the world is based on the availability of sea and air links. However, geography and size (of population and economies) present considerable challenges to connectivity, especially intra-regionally.
Air transport has emerged as the preferred means of travel, both intra-regionally and extra-regionally, to support trade and investments in the Region. The Air Transport Action Group (ATAG) (2016) reports that aviation supports millions
of jobs worldwide, and that for small island states (such as those in the Caribbean) air transport is vital for the provision of services such as healthcare and disaster relief. Air transport is also vital to the Region’s tourism industry, which supports various other businesses as well as being the Caribbean’s primary income earner.
However, in order for the benefits of air transport to be fully realised, proper connectivity is crucial. The International Civil Aviation Organization (ICAO) defines air connectivity as an indicator of a network’s concentration and its ability to seamlessly move passengers from their origin to their destination1 Briceño-Garmendia et al (2015) define it as a measure of non-stop accessibility, expressed as airport pairs being served2
1 ICAO (2013), Worldwide Air Transport Conference (ATConf/6-WP/20).
2 Cecilia Briceño-Garmendia;
But connectivity means different things to the various categories of travellers, and is therefore measured using different metrics. For example, PricewaterhouseCoopers (PwC) (2014) highlights the following:
• Business travellers tend to value convenience and timeliness, and are relatively indifferent to fare levels. Frequent and flexible service that enables passengers to quickly change flights to a more convenient time matter most to this segment. Thus, air connectivity for them could be measured by frequency of service, convenience of schedule, travel time, and number of direct routes available.
• Leisure travellers (which also include visiting friends and relatives) care more about fares, with cost-effectiveness often the most important factor in decisions about whether to travel and where, especially for short breaks. An unacceptably high fare could cause them to change their minds about their destinations. Measurements of air connectivity for this segment should, therefore, include fares.
This paper makes no distinction between business travellers or leisure travellers, because the available data does not allow for such levels of disaggregation. Although travel class may appear to be an obvious proxy, an increasing share of business travellers travel in economy class while many leisure travellers will purchase a business-class fare for the increased levels of comfort and services. Therefore, references to tourist arrivals treat these two groups as homogenous. But the treatment of connectivity is sufficiently broad to cover the determining factors for each group.
Heinrich C. Bofinger; Diana Cubas; Maria Florencia Millan-Placci. Connectivity for Caribbean Countries: An Initial Assessment. Policy Research Working Paper 7169. World Bank Group.
This study provides an overview of air transport connectivity in the Caribbean, looking at both intra-regional and extra-regional travel. In addition, it discusses key impediments to connectivity and the potential benefits from removing or reducing these impediments. Through the use of a modified gravity model it estimates the impact of improving connectivity, both in terms of air traffic and for the wider economy.
This analysis is not limited to the 19 BMCs of CDB. Six additional countries and territories were included in the study in order to compare and contrast, and also to capture their roles as either ’competitors’ or ‘partners’, as part of multi-island itineraries. The additional countries are Aruba, Curaçao, Cuba, Dominican Republic, Guadeloupe, and Martinique.
Tourism Trends
The dominance of regional tourism is reflected in the industry’s overall contribution to GDP and employment. Estimates from the World Tourism and Travel Council (WTTC) (2018)3 show that the total contribution of travel and tourism to Caribbean GDP (including wider effects from investment, the supply chain and induced income impacts) was USD57.1 bn in 2017 (15.2% of GDP) and is expected to grow by 3.3% to USD59 bn (15.4% of GDP) in 2018. It is forecast to rise by 3.6% per annum (p.a.) to USD84 bn by 2028 (17.8% of GDP).
WTTC estimates that travel and tourism directly generated 758,000 jobs in 2017 (4.3% of total employment) and this
Sources: Travel and Tourism Economic Impact 2018.
3 World Travel and Tourism Council. Travel & Tourism Economic Impact 2018: Caribbean. https://www.wttc.org/-/media/files/reports/economic-impact-re search/regions-2018/caribbean2018.pdfp
FIGURE 1: CARIBBEAN: TOTAL CONTRIBUTION OF TRAVEL AND TOURISM TO GDP
is forecast to grow by 2.8% in 2018 to 779,000 (4.4% of total employment). The estimates take into consideration employment across the broad spectrum of the travel and tourism industry, including persons employed by hotels, travel agents, airlines and other passenger transportation services (excluding commuter services). It also includes, for example, restaurant and leisure industries directly supported by tourists.
The growing contribution of travel and tourism to GDP is consistent with increasing international arrivals into the Caribbean from outside. However, there is evidence that tourism within the Region has fallen. For example, between 2005 and 2015 there was an overall increase of 2% in stayover visitors by air to the countries of the Eastern Caribbean Currency Union. But in the same time period, the corresponding number of visitors from within the Caribbean fell by 30%4. For Barbados, the equivalent numbers were 8% and -23%5
Air transport needs to be sufficient to support the projected growth in tourism, as well as the objective of many Caribbean states to diversify their economies. Within the tourism industry, this means making the Caribbean a desirable location for business tourism such as conferences and conventions.
4 Source: Eastern Caribbean Central Bank.
5 Source:
Air cargo, whether in the belly of passenger planes or in freighters, is crucial for the export of perishables including agricultural produce. And business travel is also crucial for other traded sectors. With this in mind, this paper considers the current level of connectivity within the Region, noting how it has fallen in some countries in recent years. In particular, intra-regional connectivity has fallen. This has implications for developing the regional segment of the industry, including multi-destination tourism.
The rest of the paper is as follows:
• Section Two summarises recent developments in air traffic in the Region.
• Section Three discusses connectivity in the Region, and the relationship with tourism and economic growth.
• Section Four considers reasons for constraints on, and in many cases, losses of connectivity.
• Section Five attempts to model improved connectivity and economic outcomes based on identified scenarios.
• Section Six discusses options for building demand on new routes.
• Section Seven summarises the findings, and makes policy recommendations.
Barbados Hotel and Tourism Association.
2 AIR TRANSPORT IN THE CARIBBEAN
Many Caribbean countries are highly dependent on air transport. This can be shown by looking at aviation intensity, which is the volume of air passenger journeys adjusted by the population size of the country. Globally, the average value is approximately 0.5 trips per capita. Figure 2.1 shows that many Caribbean
countries are well above this average. Countries with very small populations, such as the British Virgin Islands (BVI), Cayman Islands, and the Turks and Caicos Islands (TCI) (not shown, for scaling purposes) have in excess of nine trips per resident.
Sources: IATA based on PaxIS, World Bank.
FIGURE 2.1: BMCs’ PASSENGER BOARDING PER CAPITA, 2017
Passenger traffic volumes vary by country. Figure 2.2 shows that in 2017, countries with the highest passenger volumes were the Dominican Republic (6.4 million), Cuba (5.1 million) and Jamaica (2.8 million). This reflects the high volumes of inbound tourism that these countries accommodate. Figure 2.2 also shows that recent growth in passenger numbers has varied by country. Both the Dominican Republic and Cuba experienced rapid growth—8.0% p.a. and 11.4% p.a. respectively between 2007 and 2017. Jamaica grew at 2.8% p.a. Annual growth was also relatively high in Belize, Haiti, and Trinidad and Tobago but was negative in nine BMCs.
Overall, air traffic in the Caribbean grew by 4.9% p.a between 2007 and 2017. This was lower than global growth (5.4% p.a.), as well as growth in South America (6.2%) and Asia (8.8%). However, the Caribbean outpaced North America (2.0%) and Europe (4.4%).
Sources: IATA.
FIGURE 2.2: PASSENGER BOARDING BY COUNTRY 2007 - 2017
Intra versus Extra-regional Travel
Air travel in the Region is characterised by three components:
(1) long-haul routes focused on enabling inbound tourist traffic; (2) an intra-Caribbean network comprised mainly of several short, low-capacity routes between countries; and (3) domestic routes.
For the purpose of this study, we mainly focus on (1) and (2).
Figures 2.3 and 2.4 show that traffic grew between 2007 and 2017. However, when disaggregated, the growth is exclusively attributable to the increases in extra-regional travel, while travel within the Caribbean declined.
In 2017, extra-regional traffic accounted for 76% of total passenger traffic, while intra-regional traffic accounted for 9%. Between 2007 and 2017, extra-regional traffic rose from 12.8 million to 22.6 million (mn), an increase of 76%; while intra-regional traffic fell by 2%, from 2.8 mn to 2.7 mn.
The dominance of extra-regional travel is reinforced by an examination of the top city pairings offering the highest capacity for air travel (see Table 2)8. Extra-regional flows arrive predominantly from the United States of America, Canada and Europe. The largest intra-Caribbean city-pair has less than half the weekly capacity of the largest extra-Caribbean pair.
Sources: InterVISTAS analysis of passenger data supplied by IATA.
8 These are the top city-pair markets in each segment, but do not make up the overall top pairs.
FIGURE 2.3: ANNUAL PASSENGER TRAFFIC GROWTH FROM THE CARIBBEAN 2007-2017
2.4:
DESTINATION MARKETS FROM THE CARIBBEAN BY PASSENGERS, 2012 AND 2017
Sources: Passenger data provided by IATA.
FIGURE
TABLE 1: TOP EXTRA-REGIONAL CITY-PAIR MARKETS TO/FROM THE CARIBBEAN, BY AVERAGE WEEKLY SEAT CAPACITY 2017
Sources: SRS Analyser.
The data show that traffic volumes in the Caribbean can be high from a per-capita perspective. In addition, traffic volumes are growing relatively slowly when compared with the global increase. Regional growth is dominated by a rise in extra-regional travel, which has been occurring at the same time that intra-regional air traffic has been contracting. These trends suggest that intra-regional travel is a key constraint.
This has implications for everyone—for people visiting family and friends, for those who want to conduct business within the Region, and for tourists who want to experience more than one destination when they visit, and are therefore potentially deterred from visiting at all. The relatively slow growth of extra-regional flights, at least in comparison with global growth, suggests that this may also be constrained. But intra-regional growth is a far more significant problem.
3 THE IMPORTANCE OF CONNECTIVITY
In order to illustrate the benefits that air connectivity brings, it is necessary to focus on the catalytic effects that air travel has on the economy. Catalytic benefits are those that are created in addition to the economic activity related to airlines and imports. Catalytic benefits are created by, rather than within, aviation9. In the Caribbean, the relationship between aviation and economic growth is mainly through the facilitation of travel to support the tourism industry, as reflected in the WTTC findings discussed previously. The relationship is also reflected in cargo movement. But aviation can also support other sectors, by lowering the costs of doing business; making it easier to collaborate on research and innovation; and increasing productivity10
Link between Connectivity and Economic Growth
There is a bi-directional relationship between GDP growth outcomes and aviation development11. Air transport can play a key role in facilitating economic development, particularly in developing countries. Conversely, the economic growth of a country can also have significant effects on air transport expansion12
The channels through which air transport activity may impact economic growth are varied. First, air transport is a significant source of foreign exchange. Second, air transport has an important role in stimulating investments in new infrastructure. Third, given the complex mix of transport-related sectors, air transport stimulates other industries through direct, indirect and
induced effects. Fourth, air transport contributes to the generation of employment and the rise in incomes. Fifth, air transport causes positive economies of scale, helping to boost a country’s competitiveness. Finally, air transport is an important factor in the diffusion of technical knowledge.
In recognition of the importance of connectivity, several Caribbean countries have taken steps to increase airlift into their respective territories. For example, St. Vincent and the Grenadines opened its first international airport in February 2017. This now allows for direct international access from and to the country’s key travel source markets, whereas previously this required connecting in Barbados, Saint Lucia or Trinidad and Tobago. Antigua and Barbuda built a new terminal building at the V.C. Bird International Airport to accommodate increasing passenger traffic; and Saint Lucia intends to do the same at the Hewannora International Airport in the coming months. These investments are an important demonstration of the commitment of the Region’s governments to developing the air transport sector. However, providing infrastructure is only one part of the equation. It is equally, if not more, important to create the right conditions to generate the demand that will support a sustainable increase in air connectivity.
Beside improvements to aviation infrastructure, there have also been some positive developments in terms of airlift. New carriers such as JetBlue have entered the airline market, providing extra-regional services and increasing competition among carriers providing airlift to the United States.
9 Dan Elliott. Frontier Economics - The benefits of air connectivity. http://www.futureairport.com/contractors/airports-and-destinations/frontier-economics/
10 See PWC (2014).
11 PWC (2013).
12 Gabriel Brida, Bibiana Lanzilotta, Martín Brindis, Silvia Rodríguez. Long-run relationship between economic growth and passenger air transport in Mexico. September 2014.
Types of Air Connectivity
Air connectivity can be grouped into three main categories: direct, indirect, and hub connectivity:
• Direct connectivity reflects the direct services available from a given country, city, or airport. It can be measured by the number of destinations served. Routes can be weighted by the relative importance of the destination, as well as frequency or capacity.
Measuring Connectivity
• Indirect connectivity incorporates those destinations that can only be reached with one or more stops. Connections can be weighted in terms of quality, with key factors being connecting time at the transit airport and the degree of diversion involved, compared with a hypothetical direct flight.
Connectivity is not simply a matter of the number of routes or number of frequencies operated; it is fundamentally about access to markets and regions. A country or region that has regional and intercontinental linkages to a limited number of destinations will be a less desirable place to do business and to visit. Travel costs for people and for goods will be higher due to the need to purchase multiple flight legs. In contrast, a community with direct access to a broad range of markets, especially the fastest growing markets, will be a lower-cost place to do business and will attract more inbound visitors.
• Hub connectivity is relevant for those cities or airports that function as hubs, and reflects the number of flight combinations that can be connected into credible itineraries, taking into account minimum and maximum connecting times. As with indirect connectivity, connections can be weighted in terms of quality, based on the diversion factor and connection times involved.
To capture this effect, IATA has developed an index of air service connectivity, which aims to measure the quality of the air transport network. The IATA Connectivity Index measures access between an airport, region or country, and the global economy. The Index considers the number and size (in terms of passenger air traffic) of destinations served, as well as the frequency of service to each destination and the number of onward connections available from those destinations. Thus, the Index recognises that connections to major global gateways provide greater global connectivity than connections to the same number of smaller locations.
The Index is calculated from airline schedule data for passenger services and is based on both domestic and international services. It measures the number of frequencies and available seats to a particular destination. It then weights the number of available seats by the size of the destination
airport (in terms of number of passengers handled in each year). This weighting reflects both the size and economic importance of the destination and the potential for convenient onward connections.
For example, Beijing Capital International Airport, as the world’s largest airport, is given a weighting of 1 while Paris Charles de Gaulle Airport, which handles 66% of the number of passengers using Beijing, is given a weighting of 0.66. Therefore, if an airport has 1,000 seats available to Beijing it is given a weighted total of 1,000. But if it also has 1,000 seats available to Paris CDG, these are given a weighted total of 660.
For regional connectivity, the same approach is applied but with the weightings based on the airport within the Region that offers the highest number of scheduled seats on flights within the Region.
The Index is calculated as:
[Number of destinations x weekly frequency x seats per flight]
Weighted by the size of the destination airport
A higher figure for the Index denotes a greater degree of access to the regional and global air transport network.
In 2018, Jamaica and The Bahamas score highest for extra-regional connectivity, while Trinidad and Tobago has the best intra-regional connectivity. (A full list of connectivity scores is provided in Appendix A.) These outcomes are not surprising. Jamaica and The Bahamas are both prime tourist destinations, and their proximity to the continental United States means that there is a significant penetration of international carriers. In terms of regional connectivity, Trinidad and Tobago is the main hub for one of the Region’s largest domiciled carriers, Caribbean Airlines, and is also well served by LIAT.
Route Development: Decline in Connectivity in the Region
Figures 3.1 and 3.2 show trends in connectivity. The first figure shows how Caribbean countries’ global (extra-regional) connectivity changed between 2008 and 2018, while the second figure shows the same for intra-regional connectivity.
FIGURE 3.1: CHANGE IN GLOBAL CONNECTIVITY (2008 – 2018)
FIGURE 3.2: CHANGE IN REGIONAL CONNECTIVITY (2008 – 2018)
Sources: IATA.
Global connectivity has risen in most countries in the Region, with only five countries experiencing a decline. However, in terms of intra-regional connectivity, 16 countries, including 13 BMCs, experienced a drop. This difference in performance reflects the reduction in intra-regional passenger numbers discussed in Section Two. It is further supported by analysis of the number of city-pairs served. Figure 3.3 shows the growth in city-pairs for the Caribbean by destination market.
City-pairs are dominated by extra-Caribbean connections. There is a lack of growth in the number of city-pairs served in the domestic and intra-regional Caribbean markets. This in large part reflects the impact of fleet reduction and route consolidation by LIAT. While some small carriers have taken over these routes, their seating capacities are nowhere near that which was lost by the truncation of the regional carrier’s fleet.
Sources: SRS Analyser.
FIGURE 3.3: TOTAL CITY-PAIRS BY DESTINATION REGION (2009-2018)
Connectivity to source markets is crucial to any country’s tourism strategy, as well as its prospects for developing other sectors to be internationally competitive. The aviation industry plays a crucial role in helping to facilitate tourism; and tourism growth requires sufficient air capacity. While the direction of causality may be uncertain, there is a positive correlation between air connectivity and tourism development. Similarly, the relationship between air connectivity and economic
growth is positive, as is the correlation between tourism activity and economic output. In light of this, the positive outcomes in extra-regional travel are relatively encouraging, although there is still scope for improvement in comparison with some other regions. The decline in intra-regional connectivity, however, is a concern for tourism development as it undermines the industry’s growth potential. It also undermines the competitiveness of other sectors.
4 IDENTIFYING THE CAUSES OF LOST CONNECTIVITY
Previous sections discussed the importance of connectivity for economic growth and noted a decline since 2008 for a number of countries, while this section identifies and discusses possible causes of connectivity loss or limitation. This forms the basis for creating scenarios for improving the situation going forward.
There are various complex and interrelated factors that limit air connectivity growth in the Caribbean. Connectivity is basically determined by the availability and cost of air travel. Factors that influence both availability and cost are:
(1) policy, such as taxation;
(2) regulatory frameworks; and
(3) availability and use of adequate infrastructure. Each of these is discussed below.
The Price of Travel
One possible explanation for the relative lack of intra-regional connectivity is the price of air travel. As a result of the size and archipelagic nature of the Region, the intra-regional air market is relatively small and fragmented. This fragmentation is exacerbated by the different language groups and historical ties across the Region. Even with most islands only having one major airport, the small size of the local markets creates challenging demand-side conditions in terms of establishing commercially sustainable routes.
As with most goods and services, there is a negative relationship between airfares and the demand for air travel. A 2007 literature review of studies spanning the previous 25 years, found that increases in airfare lead to lower passenger traffic demand13. The studies conclude that air travel is particularly price-elastic, especially for leisure travellers, though less so for business travellers.
Travelling within the Caribbean is expensive, as illustrated in Figure 4.1. This shows average revenue per passenger per kilometre, and compares between intra-regional and extra-regional routes. The intra-regional figures are generally higher.
InterVISTAS (2007), ‘Estimating Air Travel Demand Elasticities’.
Sources: IATA PaxIS.
Sector lengths on intra-regional flights are short, and there is limited scope for economies of scale. Many costs are fixed and do not vary significantly as a function of sector length.
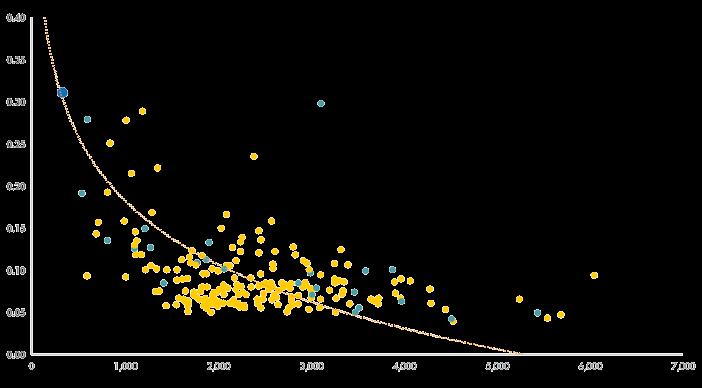
This phenomenon is not limited to the Caribbean. Figure 4.2 presents global level data for 220 countries. It plots yield (in US cents per passenger kilometre, net of taxes, fees and charges) against average sector length. Caribbean countries are marked by dark teal green dots, while the intra-Caribbean average is shown in blue.
As can be seen, there is a clear inverse relationship between yield and trip distance. Data for the Caribbean countries is consistent with this trend, with intra-Caribbean journeys showing short average sector length and very high cost per passenger kilometre.
FIGURE 4.1: AVERAGE REVENUE PER PASSENGER PER KILOMETRE, BY COUNTRY (2016)
Sources: IATA PaxIS.
The inbuilt disadvantages of small markets and short sector lengths are exacerbated by taxes, fees and charges (TFCs) that further increase the cost of travel.
Airport charges are levied for various services supplied to airlines by airports. They may either be included explicitly or implicitly in the airfare that a customer sees. While such charges are not as significant for airlines as fuel, labour and capital costs, they will affect demand to the extent that they are passed on to passengers. Taxes on air travel are generally passed on to passengers. Unlike charges, they do not provide any direct benefit to passengers, as they are collected to fund general government expenditure.
TFCs are high on both extra and intra-regional travel. A CDB study (2015)14 reported that for American Airlines (AA) routes, 6 of 10 destinations with the highest TFCs were in the Caribbean Community (CARICOM). More recent analysis of LIAT ticket data by CDB (see Figure 4.3) found that taxes and charges added 54% (40% from taxes and 14% from charges) to the cost of an average one-way ticket in 2016, suggesting that they made up 35% of the ticket price. By way of comparison, at a global level, taxes and charges make up an average of approximately 15% of the ticket price15 Between 2010 and 2016, LIAT’s average base fare increased by 2%, but taxes increased by 42%. Therefore fares rose by 11%, while the number of tickets sold fell by 18% from 913,000 to 750,000.
FIGURE 4.2 – YIELD VS DISTANCE BY COUNTRY
Sources: LIAT.
TFCs continue to make up a large portion of the overall ticket price in 2018. Table 2 summarises TFCs and fares for return travel from June 6 to 13, on a number of extra-regional and intra-regional routes. TFCs as a share of full fares tend to be much higher for intra-regional flights than for extra-regional flights. This suggests that the distortionary effect of TFCs on demand for travel is greater for flights within the Region.
FIGURE 4.3: TFCs AND LIAT AVERAGE FARES (ONE WAY)
TABLE 2: TFCs JUNE 2018
Sources: LIAT, CAL, Bahamasair, AA, Copa16
The Regulatory Framework Air Service Agreements
Air Service Agreements (ASAs) allow for the movement of passengers and goods between countries. Historically, these were rigid agreements, which included provisions for various aspects of service including: allowable routes; the number of airlines permitted to operate; capacity; and rules on airfares17 However, in recent years some countries such as the United States of America have either partially or fully liberalised their
ASAs with other countries; moving towards open skies agreements, which allow any airline of the countries party to the agreement to fly between any points in those countries.
Many studies from around the world have found that air service liberalisation led to increased competition in markets, providing greater choice and lower fares for passengers, both for business and for leisure18. As a result, connectivity increased, which in turn created further opportunities for air traffic volumes to increase.
16 For return travel between 6 and 13 June 2018, except NAS-PLS (7 and 14 June). As viewed on 11 May 2018.
17 InterVISTAS Consulting (2015), “Economic Impacts of Air Service Liberalization,” http://www.intervistas.com/wp-content/uploads/2015/07/The_Economic_Impacts_of_ Air_Liberalization_2015.pdf
The Caribbean is yet to experience such liberalisation, but some progress has been made. Although the 1996 CARICOM Multilateral Air Service Agreement (MASA) was not fully ratified, a revised MASA was signed by a number of CARICOM member states in February 2018, and the Heads of Government urged countries to take steps towards implementation19. If fully implemented, the MASA will expand “the scope for airlines owned by CARICOM nationals to provide air services throughout the 15-member grouping” and “allow for no restriction on routes, capacity or traffic rights” (Wiredja, 2018). The Organisation of Eastern Caribbean States (OECS)20 as a subset of CARICOM has made further progress. In 2010 the Revised Treaty of Basseterre was signed by OECS members. It stated that OECS members will “facilitate the concept of a progressively more integrated operating airspace” and establish “a single Economic Union Area air space [...] for the purpose of ensuring efficient and safe air traffic management.”
Regarding extra-regional routes, a few Caribbean countries have signed bilateral ASAs with countries such as the United States of America and Canada, as well as the European Union. There is scope for moving to a fully liberalised open skies agreement in the extra-regional market as other Caribbean countries follow suit; the full implementation of the MASA is intended to serve this purpose.
Regulatory Harmonisation
Aviation is, almost by definition, a global industry. It is also highly regulated. This creates a requirement for regulatory harmonisation to ensure efficient operations but also to avoid contradictions and inconsistencies, as well as duplication of cost and time.
The regulatory framework across the Region is not harmonised. The complexity of complying with different laws, regulations and regulatory practices adds to airline costs, and in some cases places direct limits on airlines’ ability to provide service.
This lack of harmonisation is exacerbated by the proliferation of authorities and agencies that regulate different aspects of the aviation sector, meaning that airlines in the Region interact on a day-to-day basis with a myriad of bodies. For example, airlines in the Eastern Caribbean are subject to regulation and oversight by the Eastern Caribbean Civil Aviation Authority and the Barbados Civil Aviation Department; seven airport authorities; and an equal number of customs and border control agencies and health authorities.
Airlines operating throughout the Region have to work with regulations in English, Dutch and French that are modelled after differing standards in Europe, the US and Canada. This presents a level of complexity that is unique within the global regional airline industry.
The amount of time needed for carriers to receive operating licences serves as a ‘tacit form of protectionism’21, to the detriment of the sector. Prospective operators are prevented from entering the market due to the challenges involved in obtaining licensing approval.
A further set of factors which impede efficient intra-regional operations are those barriers which prevent carriers from moving aircraft and staff seamlessly within the Region. For example, customs issues can affect airlines’ ability to quickly ship parts when an aircraft needs immediate maintenance. The impact is increased costs, reduced on-time performance and passenger dissatisfaction.
19 Communiqué issued at the conclusion of the twenty-ninth inter-sessional Meeting of the Conference of Heads of Government of the Caribbean Community 26-27 February 2018, Port-au-Prince, Haiti.
20
21
The OECS is a 10-member grouping of islands spread across the Eastern Caribbean. Together, they form a near-continuous archipelago across the eastern reaches of the Caribbean Sea. They comprise the Leeward Islands: Antigua and Barbuda, St. Kitts and Nevis, Montserrat, Anguilla, and the British Virgin Islands; and the Windward Islands: Dominica, Saint Lucia, St. Vincent and the Grenadines, Grenada, and Martinique.
CDB (2015).
Infrastructure
Infrastructure utilisation in the Region is relatively low. Nassau’s airport has the busiest peak number of hourly movements, with 20 movements between 17:00 and 18:00. The only other airport in the Region with a peak movement volume in excess of 10 is Montego Bay with 16 between 12:00 and 13:00. Although the movement numbers at regional airports are low by global standards, movement profiles show a significant proportion of flights scheduled within relatively concentrated time windows, with airports lightly used at other times.
Overall, there is no strong evidence that airport infrastructure is a binding constraint on connectivity. Runway capacity is sufficient to cater for any feasible assumptions around demand growth, and terminal capacity is generally sufficient too, although there is evidence that there are operational issues at peak times, which affect airside operations. In addition, there are cases where terminal design and layout could be enhanced to smooth passenger flow.
Operating Efficiency
While physical infrastructure does not appear to be a primary limiting factor for connectivity, it may be that the available infrastructure is not being used efficiently, either within the terminal or on the apron. For example, airport operations which allow for sub-optimal processes and practices such as slow immigration and customs processing and long waiting times for checked luggage, lead to queues and other inconveniences, in spite of relatively low traffic volumes.
Intra-regional aircraft utilisation is also low, which affects intra-regional travel. This can be impacted by some airport operations. Sometimes aircrafts appear to be arbitrarily forced
to park on the airport ramp in positions that are inefficient for aircraft operations and inconvenient for passengers. At times, no passengers can disembark before a health inspector arrives at the aircraft. These challenges further affect connecting intra-regional passengers and lead to increased aircraft turnaround times, increasing costs to the airlines and their customers.
Other operational challenges for airlines are the restriction of airport operating hours and/or the imposition of overtime fees for aircraft operations outside of “standard operating hours” or on weekends. This impacts connectivity, by penalising late-evening arrivals and early-morning departures scheduled to maximise regional network connections and facilitate connections to European and North American destinations. Such schedules are not responsive to local passengers’ needs.
From an airline perspective, aircraft utilisation is also low due to scheduling, maintenance policy, and other operational factors. These tend to drive up fixed costs. Flight crew utilisation may also be low because of sub-optimal scheduling. This increases payroll costs and inflates other miscellaneous allowances such as hotel and duty allowance costs, which in turn raise the airline operators’ overhead costs.
Finally, airspace in the Region is fragmented with no fewer than 10 Air Navigation Service Providers (ANSPs) in the Eastern Caribbean alone. Fragmented airspace leads to increased operational complexity, indirect routeings, longer travel times and higher costs. A recent study by SEO Economics found that airspace modernisation across Europe could facilitate a 20% increase in passenger numbers over a 20-year period22
Coordinated Tourism and Aviation Strategies
A lack of tourism development may also be inhibiting global connectivity for some of the islands. As tourism becomes more competitive globally, “high-end” destination quality will require continuous investment. It is prudent for governments to consider diversifying their products and their markets, as traditional tourists can be affected by economic developments in their own countries, which will determine their disposable income and, therefore, willingness to travel (Laframboise et al., 2014).
Given the natural complementarity between aviation and tourism, coordinated strategies and policies can be mutually beneficial for both sectors. A chicken-and-egg scenario exists, whereby sufficient tourism infrastructure (hotels, restaurants, leisure activities) is required to create the demand conditions that make air service viable, yet at the same time hotel owners require sufficient certainty regarding levels of air service in order to make rational investment decisions.
The lack of intra-regional connectivity could be viewed as both a cause and a consequence of the lack of a regional approach to tourism product development. Better connectivity would facilitate multi-stop visits from outside the Caribbean, as well as increase Caribbean-sourced tourism. Multi-destination tourism is becoming more popular with a new generation of holiday makers, who want a variety of experiences (such as beach, ecotourism, food, music) in a single trip. A reliable inter-island network of flights can facilitate this, attracting travelers who may not be interested in a single destination alone.
Having considered the strong link between air transport and economic growth, the constraint on connectivity growth (and in some places its decline) is a concern for the Caribbean, in particular for intra-regional travel.
The preceding section focused on possible explanations for the current level of connectivity. A number of policy barriers were examined, including high levels of taxes, fees and charges; infrastructure and the regulatory environment.
Based on this discussion, four scenarios are modelled, representing reforms that could increase future connectivity and economic growth.
The burden of taxes and charges was found to be disproportionately high for intra-regional routes, coming on top of the natural disadvantage of small and fragmented local markets with short average sector lengths. Taken together, high costs and challenging market conditions constitute the most significant barrier to stimulating demand and developing intra-regional air connectivity. As a result, the modelling that follows includes a differentiated tax scenario addressing the cost of travel, with a more aggressive set of policy measures for intra-regional markets.
• Scenario 1 assumes that lower taxes and charges will lead to cheaper airfares, and stimulate passenger demand. Taxes are reduced by 100% for intra-regional journeys, by 25% for extra-regional journeys, and airport charges are reduced to the level of the 25th percentile of the Caribbean countries, or about USD30. As the intra-regional market is already small, the tax revenue impact of eliminating taxes on intra-regional journeys is anticipated to be modest in most locations.
• Scenario 2 assumes an improved regulatory environment with a more liberalised market, greater harmonisation and fewer restrictions on operation, leading to reduced costs for airlines and increased passenger demand. Liberalisation has been shown to increase passenger demand by up to 30%23, depending on existing levels24
• Scenario 3 assumes more efficient operations, through better infrastructure utilisation (airports and aircraft) and also increased skills in the industry. While there is no evidence that there is insufficient physical infrastructure at the major airports in the Caribbean, there are some operational inefficiencies involving airports, airlines and ANSPs, as well as customs and border processes. As data on these impacts are difficult to gather, the impacts have been postulated. It is assumed that more efficient operations, including smarter use of infrastructure and greater use of technology lead to a 10% increase in traffic. Given that the recent SEO Economics study from Europe estimated a 20% increase in demand from airspace modernisation alone, this is considered a conservative assumption.
• Scenario 4 is a combination of the three previous scenarios. While each of the policy reforms will be expected to have an impact individually, the greatest impacts will result from implementation of a coherent and holistic strategy.
24 Where countries have open skies agreements with the U.S., Europe or Canada, the impact on extra-regional traffic was assumed to be zero.
23 The 30% impact is estimated based on past research on the impacts of liberalisation, though it is at the higher end of the potential impacts. See ICAO (2004), The International Institute of Transport and Logistics (2008), and InterVISTAS (2014).
Methodology
The scenarios show impacts in 2025, against a baseline25 Impacts are measured in terms of the increase in the number of passengers travelling to each location, both from outside and within the Region. In some cases where passenger demand increases sufficiently, a direct service becomes a reality on routes currently only served indirectly. The resulting time savings encourage more passengers to travel on these routes.
The estimated impacts of the lower taxes and airport charges are based on the assumption that the reductions would be largely passed through to passengers as lower fares. A gravity model is used to apply fare elasticities to these reductions to derive the traffic impacts26
In addition, economic impacts are estimated in terms of additional GDP and jobs created. These impacts are broken down as (a) those specific to the aviation sector and its supply
chains; and (b) the wider catalytic impacts discussed in Section One and Section Three—those related to tourism, trade, investment and productivity.
The aviation sector economic impacts—direct, indirect and induced—are based on existing studies containing information on airport, other aviation, and tourism employment levels in recent years27. Relevant GDP and employment impacts are calculated using ratios of multiplier impacts to direct effects, which were gathered from airport economic impact studies.
The wider economic impacts are estimated separately, based on statistical analysis of the contribution of air transport to economic growth. The methodology isolates the air transport contribution by controlling for other growth-contributing factors.
25 To calculate the base traffic in 2025 (without policy changes), InterVISTAS used a country-level passenger traffic forecast provided by IATA. The impact of the policy changes in each of the scenarios were then estimated as additional growth above the base IATA forecast.
26 Elasticities varied for intra-regional and extra-regional travel. From IATA Economics Briefing (2008).
27 For those countries where no such information was available, econometric analysis was carried out using information from the countries for which data was collected.
Benefits to Aviation Markets and Users
Table 3 summarises the results for incremental passenger traffic and growth under the four scenarios. More disaggregated results (domestic, intra-regional and extra-regional traffic) are shown in Appendix B.
Scenario 1 (lower taxes and airport charges), results in an increase, relative to the IATA base forecast, of 2.4 mn passengers (or 5%) by 2025. For CDB’s BMCs, traffic increases by 1.4 mn, or 7%.
Scenario 2 (regulatory reform) produces 5.7 mn incremental passengers (12%) across the Region. For BMCs, the increase in demand is 2.3 mn, or 12%. The increase ranges between countries, from 1% to 30%, depending on the extent of liberalisation already in place and the existing regulatory regime.
Scenario 3 (enhanced efficiency) produces a 10% increase in traffic across the Region.
Therefore, implementation of the full package of policy measures, as modeled in Scenario 4, leads to an additional 5.6 mn passengers (31%) in the BMCs, and an extra 12.7mn (29%) in the wider Region. The overall increase in traffic by country, varies from 14% to 50%.
The improvements from the combined Scenario 4 would allow for greater economies of scale and greater freedom for carriers to expand their services, thereby stimulating the growth of passenger traffic and, in turn, the expansion of viable direct services into and within the Caribbean. This would result in time savings for passengers.
Section Three showed that there is a relative lack of connectivity in the intra-Caribbean market, and in some cases, even the extra-Caribbean market has room for growth. There are currently about 50 routes serving over 10,000 passengers annually (one-way) without direct service28. Only one of these routes is intra-regional. Improved connectivity would provide more itinerary options, direct services, and better connecting options for other routes, thereby boosting the economy and making multi-stop tourism easier. It would also improve business
productivity, for example, by making same-day returns possible rather than having to overnight. This is a serious problem. In many cases, existing schedules mean that one must spend three days away from the office, in order to attend a one-day (or shorter) meeting in another location within the Region.
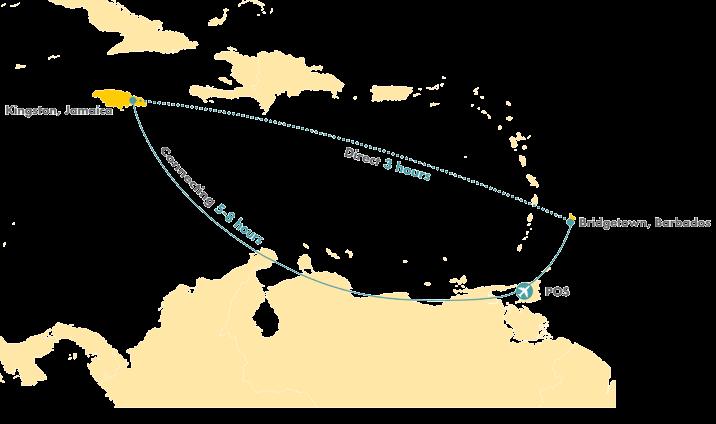
For example, passengers currently travelling between Barbados and Kingston, Jamaica (roughly 20,000 passengers p.a.)29 do not have direct service options (see Figure 5.1). These passengers need to book one or two-stop itineraries, depending on the day of the week that they travel. On days when the one-stop service operates, the shortest available flight combinations range from five to eight hours. If connectivity was improved, these passengers would be able to have direct service between the two cities, with an improved travel time of three hours.
Applying the Scenario 4 passenger forecasts to the current route schedule indicates that as many as 29 new direct routes could be supported by 2025. Four of these services would be intra-regional. But these estimates are likely to be conservative. A broad body of experience demonstrates that the commencement of direct services can stimulate significant additional demand, even in the absence of other policy changes30. Moreover, if smaller aircrafts were deployed on intra-regional routes then the traffic volumes that would be needed to support direct service would be lower.
30 See for example Berry and Jia (2008).
Figure 5.2 provides an indicative illustration of new direct intra-regional services that could be supported if turboprop aircrafts were used. These potential routes are derived from a data-led assessment of the type of service developments that may arise with the policy changes. However, every market is unique, and other political, industry or economic factors may affect the outcome. Thus the analysis is designed to illustrate the potential air service developments, but it cannot be guaranteed that services will develop in this way.
Sources: InterVISTAS Estimates using Great Circle Mapper and Google Flights.
FIGURE 5.1: FLIGHTS BETWEEN BRIDGETOWN AND KINGSTON
5.2: POTENTIAL NEW DIRECT INTRA-REGIONAL ROUTES COMBINED SCENARIO 4
FIGURE
Case Study: Reduction in fees and charges at Cartagena Airport
In terms of the outcomes that can result from reducing taxes, fees and charges on air travel, the case of Cartagena, a city on the Caribbean coast of Colombia, is instructive. Up until 2014, the airport imposed an airport fee of USD92 per passenger. At the start of 2015, the fee was then reduced by almost 60% to USD38. Within less than two years, international passenger numbers increased by 52% and tourist arrivals to Cartagena increased by 47%. During the period, four major new international routes were started as a result of the lower operating costs, giving Cartagena direct service from Atlanta, Fort Lauderdale, Amsterdam and Madrid.
Economic Benefits of Connectivity Improvement
The following paragraph summarises the potential economic impacts of air connectivity improvement under the combined Scenario 4. Additional scenario results, as well as the breakdown of impacts (by aviation and tourism industries, and the wider economy), are included in Appendix B.
Economic Impacts in the Aviation Sector
Table 5.2 shows the total economic impact in terms of GDP and jobs for the combined scenario. These include impacts related to aviation (direct, indirect, and induced), as well as the wider economic benefits discussed previously. In the combined scenario, it is estimated that the policy changes could generate an additional USD3.3 bn of GDP in 2025, of which USD1.8 bn would be in CDB’s BMCs. This would be accompanied by an additional 206,700 jobs across all sectors, including 105,750 jobs in the BMCs.
Sources: Source: InterVISTAS Analysis.
Note: Figures may not add due to rounding.
6 UNLOCKING CONNECTIVITY IMPROVEMENTS
This study has examined policy measures that can address impediments to the development of air connectivity to, from and within the Region. It has also demonstrated the economic benefits that additional connectivity could provide. Nonetheless, a new route represents a considerable risk and investment for an airline, particularly in a relatively small and fragmented market such as the Caribbean. This section considers measures and strategies that could assist in creating the conditions for the start-up of new routes.
New non-stop air services can have significant impacts on the increase in the total number of origin-destination passengers in an airport-pair market. This is mainly due to the significant improvement in the quality of the product. Shorter travel times, increased convenience and more accessible ticket prices can stimulate demand. The extent to which the market will be stimulated varies according to the current price and frequency offered on a particular route. A first direct flight to a market can stimulate demand between 100% and 300%31, with the degree of increase being a function of the size of the market before the start of the new direct service.
While it is true that potential new routes will ultimately be evaluated for their scope to contribute to the overall profitability of an airline’s route network, incentives to assist with start-up costs can be decisive. Such stimuli can come from various sources such as government, airports or chambers of commerce. Among the common of types of start-up assistance are:
• Route development funds: Governments could support the provision of service on specific prioritised routes directly. Funding could be awarded through a specific tender-process with the right to operate the route awarded to the airline requiring the least amount of subsidy. Offering financial support in this way could help attract new operators to the Region.
• Start-up financing: This is a variant of the previous option, specifically aimed at helping the airline with the initial costs of establishing a new route. Commencement of new air service requires a major investment on the part of carriers, for example in terms of marketing, to build route awareness. There is also considerable risk, in that performance might not meet expectations. Moreover, air routes can take up to 24-36 months to reach steady state commercial performance, and start-up support can help cover any revenue shortfall during this period.
• Marketing campaigns: Countries can run a marketing budget for new routes. This may include joint marketing of the route, or destination-based marketing using the airline’s existing communication and advertising channels, such as in-flight entertainment or on-board magazines.
• Promotional fares: Some agencies have created campaigns through which they establish, for a short time and generally on new routes, a subsidy per transported passenger. For example, “Visit Florida”, a state entity of Florida, established an agreement with the airline Southwest Airlines through which Visit Florida offered a subsidy per transported passenger, which translated into a discount of USD25 for the customer.
• Financial risk-sharing: Sharing financial risk can take the form of reimbursement of start-up costs, reduced airport charges for a period, contribution to operating costs (for example, some countries in a joint strategy with their government tourism agencies have signed break-even payment agreements for new airlines to start services), direct subsidies, income guarantees or marketing support.
• Guaranteed block purchase of seats: Another way to reduce the financial risk of opening a new route is to guarantee a certain level of income, for example through block purchase of a share of seats. This may take the form of collaboration with tour operators buying a block of seats. Clearly, for such a strategy to work, the quality of the destination and the availability of suitable tourism infrastructure are critical.
7 CONCLUSION
The study explored the issue of aviation connectivity in the Caribbean which, for two specific reasons, is particularly important. First, the geographical nature of the Region means that connectivity is absolutely critical for the movement of people and for trade. Second, since tourism has emerged as the Region’s primary economic activity, good air connectivity is an extremely significant variable.
The preceding discourse presents the Region as one in which extra-regional passenger traffic and connectivity have grown relatively steadily over the past 10 years, as new international
airlines have added destinations in the Region to their schedules. This augurs well for the continued development of the tourism industry. By contrast, however, that is not the same for the intra-regional segment of the travel market. This segment, over the same time period, has been marked by stagnation or even decline. There are many reasons put forward to explain these developments, primary among which is the cost of travel, which is made costlier by the addition of taxes, fees and charges.
These adverse developments in intra-regional connectivity constrain the movement of people within the Region, which consequently compromises the development potential of moving tourists and travellers within the Caribbean. They also have a knock-on effect on extra-regional activity, as interlining opportunities or other forms of cooperation between airlines could be foregone.
Recognising the significance of aviation connectivity, there are a number of actions that could be taken to improve the air transport service delivery and quality. Given that the shortfall is mainly at the intra-regional level, these will benefit the entire industry as a whole, but will likely impact more heavily on intra-regional connectivity. Actions for consideration include:
• Reducing aviation taxes: This would make travel more affordable, and would especially impact intra-regional travel.
• Lowering airport charges: Reducing charges may allow airlines to operate in markets that are considered thin and where operating costs are important for viability. This may also be a way for airports to attract air services, especially for extra-regional travel.
• Improving market access: Many studies have shown that the liberalisation of air services has led to increased air carrier competition, increased routes and connectivity, reduced air fares, and increased air traffic volumes. Full ratification of MASA would allow for a range of positive developments; but mainly a full liberalisation of the Caribbean airspace. This should allow for increased competition, which in turn could improve quality at a lower cost.
• Strengthening regulatory harmonisation across the Region: Aviation is a global industry and relies on common standards. This is particularly true in the case
of a small region where the need to comply with multiple regulatory regimes increases complexity and cost for the key actors, and negatively impacts airlines’ ability to develop connectivity. A harmonised regulatory regime, consistent with globally-accepted, better regulation principles would simplify the business significantly.
• Improving the efficiency of operations: Air connectivity growth could be achieved with more efficient use of airport and air navigation infrastructure, increased aircraft utilisation and more efficient customs and border processes.
Such measures would help reverse the decline in intra-regional journeys, with positive implications for developing multi-destination tourism in the Caribbean.
These policies could be complemented by measures to stimulate demand and support the development of new routes. Measures to support the viable commercial operation of new routes would further contribute to the development of air connectivity, for example: route development funds, start-up financing, joint marketing of routes and block-buying of capacity.
Greater coordination across governments, with joined-up policy between transport, tourism and other economic ministries will further increase the chances of successful outcomes.
Combining these policy remedies could significantly increase GDP and employment across the Caribbean. Based on a scenario including all of the policy remedies mentioned above, an increase in regional GDP of nearly USD3.3 bn is expected by 2025, providing an extra 207,000 jobs. This is based on an expected 28% increase in passengers across the Caribbean. For the CDB’s BMCs the addition to GDP would be USD1.8 bn, with just over 100,000 jobs.
REFERENCES
Bel, G. and Fageda, X. (2008), “Getting There Fast: Globalization, Intercontinental Flights and Location of Headquarters”, Journal of Economic Geography, Vol. 8, No. 4.
Berry, S. and Jia, P. “Tracing the Woes: An Empirical Analysis of the Airline Industry” NBER Working Paper No. 14503 (November 2008).
Briceno-Garmendia, C., Bofinger, H., Cubas, D., and Millan-Placci, M. (2015). “Connectivity for Caribbean Countries: An Initial Assessment.” Policy Research Working Paper; No. 7169. World Bank Group, Washington, DC. Accessed from https://openknowledge.worldbank.org/ handle/10986/21397
Brida G., Lanzilotta, B., Brindis, M., Rodríguez, S. Long-run relationship between economic growth and passenger air transport in Mexico. September 2014.
Burghouwt, G., Boonekamp, T., Zuidberg, J., & Spijker, V. (2016). “Economic benefits of reducing aviation taxes in Latin America and the Caribbean.” SEO Amsterdam Economics. https://www.iata.org/publications/economics/Reports/170516-FINAL.pdf
Caribbean Development Bank. (2015). “Making Air Transport Work Better for the Caribbean.” Retrieved from https://www.caribbeancmc. com/wp-content/uploads/2015/06/Study_Making-Air-Transport-Work-Better-for-the-Caribbean1.pdf
CARICOM. (n.d.). “Multilateral Agreement Concerning the Operation of Air Services within The Caribbean Community.”
El Perial Management Services. (2015). “A Study on the Factors Inhibiting Intra-Regional Travel in the OECS.” Report for the OECS Commission, April 30, 2015.
Elliott D. Frontier Economics - The benefits of air connectivity. http://www.futureairport.com/contractors/airports-and-destinations/ frontier-economics/
ICAO. (2004). “Jamaica’s Experience with Air Transport Liberalisation.” Regulatory Policy Seminar on “Liberalization Policy and Implementation.” https://www.icao.int/sustainability/CaseStudies/StatesReplies/JamaicaLiberalization_En.pdf
ICAO (2013), Worldwide Air Transport Conference (ATConf/6-WP/20).
Industry High Level Group. (2017). “Aviation Benefits 2017.” Retrieved from https://www.icao.int/sustainability/Documents/ AVIATION-BENEFITS-2017-web.pdf
The International Institute of Transport & Logistics (IITL), Inc. (2008). “Analysis of Canada’s Bilateral Air Services Agreements: Policy Focus on Asia-Pacific Region.” http://www.th.gov.bc.ca/openskies/documents/081227_IITL_Bilateral_Report.pdf
InterVISTAS (2007), ‘Estimating Air Travel Demand Elasticities’. https://www.scribd.com/document/259638535/Intervistas-Elasticity-Study-2007
InterVISTAS Consulting Ltd. (2014). “Transforming Intra-African Air Connectivity: The Economic Benefits of Implementing the Yamoussoukro Decision.” https://www.iata.org/publications/economics/Reports/InterVISTAS_AfricaLiberalisation.pdf
InterVISTAS Consulting (2015), “Economic Impacts of Air Service Liberalization,” http://www.intervistas.com/wp-content/uploads/2015/07/ The_Economic_Impacts_of_Air_Liberalization_2015.pdf
Laframboise, N., Mwase, N., Park, J., and Zhou, Y. (2014). “Revisiting Tourism Flows to the Caribbean: What is Driving Arrivals?” IMF Working paper No. 14/229, https://www.imf.org/en/Publications/WP/Issues/2016/12/31/Revisiting-Tourism-Flows-to-the-Caribbean-What-isDriving-Arrivals-42541
Morphet, H. and Bottini, C. Air connectivity: Why it matters and how to support growth. PwC | Connectivity and growth. https://www.pwc. com/gx/en/capital-projects-infrastructure/pdf/pwc-air-connectivity.pdf
Poole, J. (2010). “Business Travel as an Input to International Trade.” http://www.scu.edu/business/economics/upload/Poole.pdf
PWC. (2013) “Econometric Analysis to Develop Evidence on the Links Between Aviation and the Economy.” Report for the UK Airports Commission, December 2013.
PWC (2014) “Connectivity: Why it matters and how to support Growth” https://www.pwc.com/gx/en/capital-projects-infrastructure/ publications/assets/pwc-connectivity-growth.pdf
Ram, J., Reeves, D., James, R. (2018). “Air Transport Competitiveness and Connectivity in the Caribbean” Working Paper; No. 2. Caribbean Development Bank, Barbados. Accessed from http://www.caribank.org/publications/featured-publications/air-transport-competitivenessand-connectivity-in-the-caribbean
Sumers, B. (2015, June 8). “Latin American, Caribbean Countries Need More Sensible Tax Rules, IATA Says.” Retrieved from http://aviationweek. com/iata-agm-2015/latin-american-caribbean-countries-need-more-sensible-tax-rules-iata-says
The Caribbean Council (2014, September 22). “Who will save Caribbean aviation?” Retrieved from https://www.caribbean-council.org/ will-save-caribbean-aviation/
Wiredja. (2018, February 27). “CARICOM States sign agreements deepening regional integration movement.” Retrieved from http://wiredja. com/news/caribbean/caricom-states-sign-agreements-deepening-regional-integration-movement
Word Travel and Tourism Council (2018) Travel & Tourism Economic Impact 2018: Caribbean. https://www.wttc.org/-/media/files/reports/ economic-impact-research/regions-2018/caribbean2018.pdf