E B ES T
O
ES T . 1 9 8 8
ER
E MONT
TH
●
F
●
TH
EY
PENINSUL
A
Market Update MONTEREY PENINSULA
4Q 2025
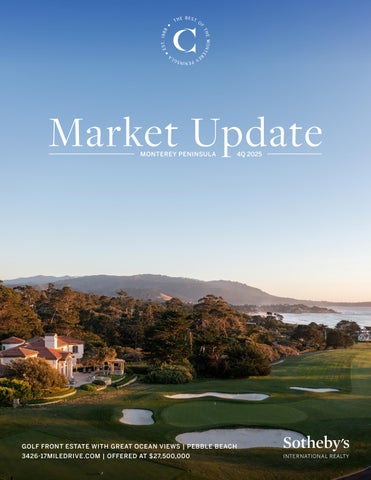
GOLF FRONT ESTATE WITH GREAT OCEAN VIEWS | PEBBLE BEACH 3426-17MILEDRIVE.COM | OFFERED AT $27,500,000
Momentum Builds as Pricing Eases 4Q 2025 | Market Update
The markets across Carmel, Pebble Beach, Carmel Highlands, Preserve, Quail Lodge and Meadows, Tehama and Monterra continued to build momentum this year with 314 sales for a total of $1.13B, which is a nice uptick in deal f low from last year (294), but off a touch from the $1.15B total investment in 2024. The top of the market continues to hold strong, but we’ve seen particular strength in the $1.5-2M and $2.5-3M brackets this year, which is what drove the increased deal f low over last year. Pebble Beach had a particularly strong quarter with 31 deals that closed for $102M, which is about on par for what we expect to see in Pebble in the fourth quarter. Carmel slowed to 29 deals, which is also fairly standard for this area as seasonal buyers tend to focus on ski vacation homes, rather than beach houses. The Highlands had a nice uptick in sales this quarter with 9 escrows, up from the 3 last quarter. The Preserve had 5 sales this quarter, which is a strong quarter for that region. Quail and Tehama didn’t have any sales this quarter, which is a bit of an anomaly for the Mid-Valley area, although Monterra sold a brand-new house for a very strong $6.25M.
Prices have softened overall with buyers getting more room off the list price, with an average 6% discount rate this quarter, double what it was in 3Q25 as sellers finally softened their stance on the list price. While median sales prices appear to be falling, coming in at $2.95M this quarter, down from $3.97M last quarter, this is mostly because more deals are closing at the bottom of the market. As is typical for this market, the top of the market would rather hold than sell in a market dip, which is something we saw this quarter, with 23 listings above $4M come off the market in the 4th quarter. We anticipate most of these to still be available and likely to come back to the market in the spring.
From a larger market perspective, San Francisco and Manhattan had some of their strongest years and quarters as we’re seeing more buyers come back to the city after leaving during the COVID years. Our market tends to trail behind the Bay Area and San Francisco by about 6-9 months, so we’re anticipating a particularly strong spring and summer this year. While there are a lot of headlines that warrant attention these days, the stability of a small, sophisticated town will continue to be a large draw, and we anticipate that to continue through this year.
The Best of Pebble Beach WHERE ELEGANCE MEETS LEGACY IN PEBBLE BEACH 1500VISCAINO.COM | OFFERED AT $9,495,000
4Q 2025 Update Total Annual Sales
Quarterly Sales by Region 4Q2023
1Q2024
2Q2024
3Q2024
4Q2024
1Q2025
2Q2025
3Q2025
4Q2025
Pebble Beach
16
10
24
24
34
25
29
27
31
Carmel
33
28
39
38
27
27
40
49
29
Carmel Highlands
3
2
5
5
13
6
9
3
9
Quail
4
2
7
1
5
8
4
2
0
Preserve
1
3
5
5
3
2
1
2
5
Tehama
0
0
0
2
0
0
3
1
0
Monterra
0
7
2
3
0
1
0
0
1
Total Sales
57
52
82
78
82
69
86
84
75
Information believed to be reliable as obtained from the Monterey County Association of Realtors database and known off-market transactions.
Median Sales Price ($M)
Historic Sales Averages by Price Range Sales Price Range
4Q2024
4Q2025
3Q - 4Q 24
3Q - 4Q 25
10 Year Avg 4Q Sales
3Q - 4Q 10 Year Avg
$8M+
4
6
12
12
5
4
$6.0M-$8.0M
8
5
13
11
5
5
$4.0M-$6.0M
18
11
27
30
10
9
$3.0M-$4.0M
13
12
32
23
11
11
$2.5M-$3.0M
11
11
15
21
9
10
$2.0M-$2.5M
9
9
20
20
9
15
$1.5M-$2.0M
9
15
18
28
16
21
$1.0M-$1.5M
8
5
18
10
17
28
<$1.0M
2
1
5
4
8
15
Total Sales
82
75
160
159
89
117
4Q Region Overview Carmel
$106M
Total Dollar Volume
29
Total Units Sold
37
Average Days on Market
$3M
Median Sales Price
32% less than 3Q 2025
41% less than 3Q 2025
41% less than 3Q 2025
13% more than 3Q 2025
9% less than 4Q 2024
7% more than 4Q 2024
12% more than 4Q 2024
20% less than 4Q 2024
“Carmel slowed down this quarter to 29 deals, which is in line with the seasonal adjustments in demand that we ‘ve seen; the fourth quarter in the past 2 years had 27 and 33 deals close. Downtown Carmel is considered one of the most charming and romantic cities in the country, which means that lots of people are dreaming of owning here one day. This consistent demand, paired with very short supply, keeps prices steady and flattens out market fluctuations. While I know some buyers are hoping for a great steal downtown, that’s unlikely to materialize as we actually saw median sales prices climb this quarter to $3.0M (up from $2.65M last quarter). The good news is buyers are finally starting to see more options come to the market, with 7 listings in the Golden Rectangle and 3 on Carmel Point. While still off considerably from historic averages, it’s worth paying attention to the pipeline. We’re bringing one on Carmelo to the market and two on Scenic in the near future.”
Jessica Canning carmel specialist 831.238.5535
Carmel Highlands
$38.57M 9
Total Dollar Volume
Total Units Sold
104
Average Days on Market
$3.4M
Median Sales Price
296% more than 3Q 2025
200% more than 3Q 2025
51% less than 3Q 2025
76% more than 3Q 2025
29% less than 4Q 2024
31% less than 4Q 2024
19% more than 4Q 2024
22% less than 4Q 2024
“The Highlands market recorded 9 sales in Q4 totaling $38.5M - tripling that of last quarter’s 3 sales. On an annual basis, this sub-market accelerated in 2025 with 27 total sales, outpacing that of last year’s 25 sales. Worth noting there were two oceanfront sales in Q4 at $11.5M and $8.475M which lifted the median sales price for the region to $3.4M (+76% QoQ). All buyers this quarter were secondary-home purchasers, primarily from California, with one buyer from the Midwest – consistent with the common demographics seeking privacy and ocean views that the Highlands neighborhoods have to offer. The Carmel Meadows area enters 2026 with no active listings or pending sales. This tightly held enclave functions as a distinct micro-market, attracting buyers seeking ocean and beach views closer to Carmel-by-the-Sea. Clear fall weather highlighted the dramatic coastal setting that defines the Highlands and likely supported renewed activity after a foggier prior quarter. With La Niña conditions expected to bring increased rainfall in 2026, proactive home maintenance is advisable, particularly for owners considering a spring or summer sale.”
Nic Canning carmel highlands specialist 831.241.4458
The Best of Carmel-by-the-Sea GOLDEN RECTANGLE GEM | CARMEL-BY-THE-SEA DISCREETLY AVAILABLE | OFFERED AT $4,199,500
4Q Region Overview Pebble Beach
$101.8M 31 Total Dollar Volume
Total Units Sold
79
Average Days on Market
$2.58M Median Sales Price
27% less than 3Q 2025
15% more than 3Q 2025
55% more than 3Q 2025
8% less than 3Q 2025
6% less than 4Q 2024
9% less than 4Q 2024
2% more than 4Q 2024
1% less than 4Q 2024
“In the 4th quarter, the Pebble Beach marketplace outperformed seasonally adjusted averages with 31 sales for a total of $102M. Worth noting there were 5 off-market sales in Q4 as razor thin inventory levels were outpaced by demand – especially in the MPCC sub-market. On a broader scale, 2025 recorded 112 total sales, exceeding 2024’s totals by 22% - underscoring consistent demand despite a more selective Buyer environment. As anticipated, the majority of buyers came from the Bay Area (31%), followed closely by locals relocating (28%). The other key buyer markets included Southern California (14%), San Joaquin Valley and Texas (both at 10%). This mix continues to reflect Pebble’s dual appeal as both a primary residence market as well as a lifestyle investment for out-of-area Buyers. Active inventory declined 32% quarter-over-quarter, a typical fourth-quarter pattern, as homes are pulled from the market during the holidays. In practice, this creates a more focused environment where serious buyers are watching closely, even if activity appears muted on the surface. One trend that appeared consistent throughout this quarter was how quickly wellpositioned properties captured attention—even in a quieter season. As we move into 2026, early indicators suggest a similar dynamic: limited inventory, patient buyers, and opportunities emerging for sellers who prepare thoughtfully ahead of the spring market rather than reacting to it.”
Nic Canning pebble beach specialist 831.241.4458
GEM COVE | PEBBLE BEACH 1494CYPRESS.COM | OFFERED AT $57,500,000
The Best of Pebble Beach ICONIC PEBBLE BEACH ESTATE 3957RONDA.COM | SOLD OFF-MARKET
OCEAN VIEW HOME | PEBBLE BEACH 1565RIATA.COM | OFFERED AT $12,750,000
“Two of our top sales this quarter were off market, including our listing at 3957 Ronda Road. We were able to effectively negotiate an above list price offer for this home, which was previously on the market for $9.2M. Creativity and perseverance deliver off market sales for our clients.”
GOLF FRONT ESTATE WITH GREAT OCEAN VIEWS | PEBBLE BEACH 3426-17MILEDRIVE.COM | OFFERED AT $27,500,000
Join Word on the Street for weekly market insights, off-market properties, local highlights and more.
4Q Region Overview Santa Lucia Preserve
$20.65M 5 Total Dollar Volume
Total Units Sold
353
Average Days on Market
$4.68M Median Sales Price
97% more than 3Q 2025
150% more than 3Q 2025
48% more than 3Q 2025
11% less than 3Q 2025
6% more than 4Q 2024
67% more than 4Q 2024
534% more than 4Q 2024
30% less than 4Q 2024
“The Santa Lucia Preserve continues to function as a low-turnover, legacy-oriented market where transactions occur selectively and pricing discipline remains central. The fourth quarter accelerated with four home sales (including our off market sale on Mesa) along with one lot sale. Sold properties reflected an average 43% discount from original list price, signaling a continued pricing reset from pandemic-era peaks. In this environment, buyers remain patient and well-informed, while successful sales tend to follow realistic positioning rather than aspirational pricing. Current offerings include 5 homes, priced from $3.895M to $6.59M, and 36 lots, ranging from $295K to $8.95M. Lot inventory spans both entry-level sites and premium view parcels, reinforcing the Preserve’s long-term, build-oriented nature rather than short-term resale activity.”
Nic Canning Preserve specialist 831.241.4458
Quail Lodge / Meadows
$0M
Total Dollar Volume
0
Total Units Sold
0
Average Days on Market
$0M
Median Sales Price
100% less than 3Q 2025
100% less than 3Q 2025
100% less than 3Q 2025
100% less than 3Q 2025
100% less than 4Q 2024
100% less than 4Q 2024
100% less than 4Q 2024
100% less than 4Q 2024
“Quail was quiet this quarter with no new sales in either Quail Lodge or Quail Meadows. This is a bit of an anomaly for Quail Lodge as we usually see 4-5 sales per quarter, and this is the first time in over 10 years which didn’t have at least one sale. The year as a whole has been strong though, with 14 sales (off just 1 from last year). There are 2 homes currently listed in Quail Lodge, including ours on Poplar Lane, which is almost 4,000 sq.ft. and on the Carmel River. As the market warms back up from the holidays, we anticipate that one moving quickly. There are no homes currently listed in Quail Meadows at this time. We often see an increase in demand in Quail Meadows and Quail Lodge in the spring as families are starting their search prior to summer break.”
Jessica Canning quail specialist 831.238.5535
The Best of Quail CARMEL COMFORT MEETS QUAIL LODGE LUXURY | QUAIL LODGE 8044POPLAR.COM | OFFERED AT $4,450,000
2025 Summary Teháma – 2025 Summary
$17.7M
Total Dollar Volume 75% more than 2024
4
Total Units Sold 100% more than 2024
60
Average Days on Market 17% less than 2024
$9.8M
Median Sales Price 57% more than 2024
“Teháma finished a strong year with 4 sales for a combined $17.7M, which is up considerably from last year. We’re seeing movement across both land and home sales, which shows strong demand for both the short and long term for this community. The four sales included our sale of 15 Alta Madera, which closed for $10.3 (including furniture). There were three lot sales, including 25600 Via Malpaso ($4.5M), 51 Marguerite ($1.75M) and 12 Alta Madera ($1.65M). There is currently one home on the market in Tehama at 53 Marguerite listed for $13.5M, which is a strong house with views and will help boost prices in Tehama in the near future.”
Anita Jones Teháma specialist 831.595.0797
Monterra – 2025 Summary
$7.3M
Total Dollar Volume 81% less than 2024
2
Total Units Sold 83% less than 2024
250
Average Days on Market 43% more than 2024
$6.45M Median Sales Price 24% more than 2024
“Monterra slowed substantially this year to just 2 sales for a total of $7.299M. However, the sale at 8220 Manjares Road came in at $6.45M, which is the highest priced sale in Monterra in over 10 years. The other sale in Monterra in 2025 was 7755 Paseo Venado which was a vacant lot that closed at $849K. The Paseo Venado sale was also one of the highest land price sales that we’ve seen in Monterra in over a year and one of the highest on record. It took the market a little while to adjust to the new insurance and development environment, but it’s encouraging to see these strong sales continue to come through in Monterra.”
Anita Jones Monterra specialist 831.595.0797
The Best of Teháma TEHÁMA LOT WITH CINEMATIC VIEWS | TEHÁMA 42TEHAMA.COM | OFFERED AT $4,900,000
O
ES T . 1 9 8 8
ER
E MONT
TH
●
F
●
E B ES T
EY
THE CANNING ADVANTAGE
TH
PENINSUL
A
BETTER. FASTER. SMARTER.
Our Marketing Approach Delivers Global Reach with Local Precision • Story-first creative: High-end photos and video, custom brochures & website landing page. • Phased launch: Discreet client and in-office exposure, followed by full-scale launch once property goes live on MLS. • Precision digital & print: Targeted email/social/ TV ads + local and national print publications. • Exceptional Reach: Leveraging Sotheby’s International Realty’s global outreach and press, plus our private network of 18,000+ clients.
COASTAL LIVING AT ITS FINEST | CARMEL POINT DISCREETPROPERTIES.COM
For a behind the scenes look at our listings and upcoming events, visit our social pages.
facebook @CanningProperties instagram @CanningPropertiesGroup
©2026 Sotheby’s International Realty. All Rights Reserved. Sotheby’s International Realty® is a registered trademark and used with permission. Each Sotheby’s International Realty office is independently owned and operated, except those operated by Sotheby’s International Realty, Inc. The Sotheby’s International Realty network fully supports the principles of the Fair Housing Act and the Equal Opportunity Act. This material is based upon information which we consider reliable but because it has been supplied by third parties, we cannot represent that it is accurate or complete and it should not be relied upon as such.
Spotlight Hatton Fields, Carmel – 2025 Summary
$33M
Total Dollar Volume
= Equal with 2024
14
33.7
Total Units Sold
Average Days on Market
17% more than 2024
$2.76M
Median Sales Price 12% less than 2024
46% less than 2024
“In Hatton Fields, 2025 recorded 14 sales with an average of 33.7 days on market and homes selling at 3.29% below list price, reflecting improved buyer engagement despite limited inventory. In comparison, 2024 saw 12 sales with an average of 62 days on market and an average 3.57% discount, underscoring a slower pace and slightly softer pricing environment year over year.”
We have a few off-market properties in Carmel coming soon to the market in Hatton Fields, on Rio Vista and two on Scenic Road in Carmel-by-the-Sea. If interested please reach out to us for more information and a private showing.
COMING SOON
Ellen Armstrong Hatton Fields Specialist 831.204.2204
COMING SOON
RIO VISTA
SCENIC ROAD
Access the Unlisted Some of the Peninsula’s finest homes never hit the open
• 4 LISTINGS IN PEBBLE BEACH • 9 LISTINGS IN CARMEL • 4 LISTINGS IN CARMEL VALLEY
market. Reach out to us or visit our website to sign up for
• 6 LISTINGS IN PACIFIC GROVE
access to upcoming and off-market listings.
• 3 LISTINGS IN MONTEREY
Get in touch and let us help you reach your goals team@canningproperties.com 831.238.9718 CanningProperties.com All offerings are subject to errors, omissions, changes including price or withdrawal without notice. If your property is listed with a real estate broker, please disregard. It is not our intention to solicit the offerings of other real estate brokers. We are happy to work with them and cooperate fully. Equal Housing Opportunity. SIR CA DRE# 00899496, Mike Canning DRE#01004964, Jessica Canning DRE#01920034, Nic Canning DRE#01959355, Ellen Armstrong DRE#02046046, Anita Jones DRE# 01926760, Unlicensed Assistants: Nancy Canning & Caroline Garcia.
Simply the Best
$141M+
SALES VOLUME I N 202 5
46
UNITS SO L D IN 2025
13% ±
SOLD OFF MARKET
100+
COMBINED Y EARS OF EXPERI EN CE
2025 Top Sales 30680 Aurora Del Mar, Carmel $14,750,000 – (Seller)
1272 Cantera Court, Pebble Beach - $4,600,000 (Seller)
Pebble Beach (off market) - $10,900,000 (Buyer)
Carmel (off market) - $3,950,000 (Seller)
15 Alta Madera, Carmel - $10,300,000 - (Seller)
2983 Cormorant Road, Pebble Beach - $3,600,000.
575 Aguajito Road, Carmel - $6,500,000 (Buyer)
4077 Los Altos Drive, Pebble Beach $2,563,000 (Seller & Buyer)
Scenic 6SW of Ocean, Carmel-by-the-Sea - $5,822,000 (Seller)
1272 Portola Road, Pebble Beach - $2,500,000 (Buyer)
5473 Quail Meadows Drive, Carmel $5,750,000 (Seller)
8543 Carmel Valley Road, Carmel- $1,650,000 (Buyer)
Carmel (off market) - $5,400,000 (Buyer)
25380 Telarana Way, Carmel - $1,610,000 (Seller)
Carmel (off market) - $5,050,000 (Seller)
Corral De Tierra (off market) - $1,199,250 (Buyer)
Camino Real 3NW of 10, Carmel-by-the-Sea - $4,700,000 (Seller)
1575 Military Ave, Seaside - $1,095,000 (Buyer)
The
1 TEAM for Sotheby’s International Realty nationwide 2020, 2021, and 2022
#
TOP
10 TEAM for Sotheby’s International Realty for 10 years SOTHEBY’S INTERNATIONAL REALTY 3775 VIA NONA MARIE, SUITE 100 CARMEL, CA 93923 CANNINGPROPERTIES.COM