2 minute read
3.3 Microstructure

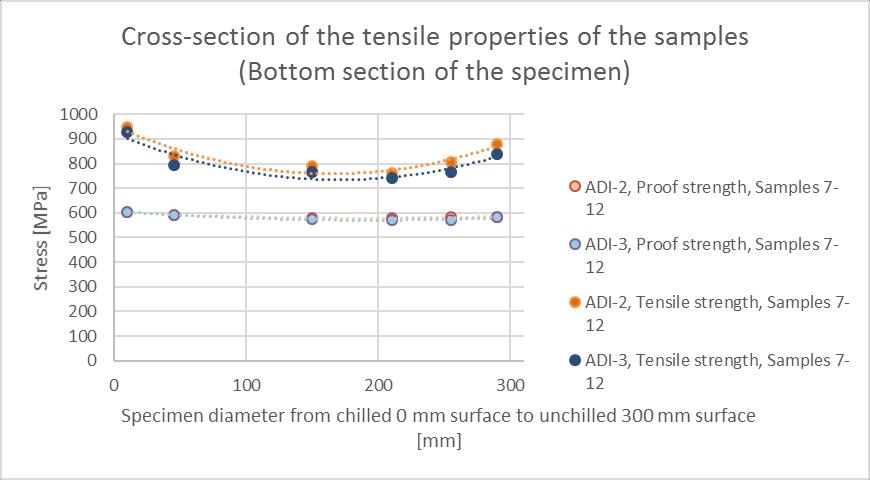
Figure 3: Tensile properties for the middle and bottom cross-section of the specimen, measured from the chilled to the unchilled surface.
3.3 Microstructure
To reveal the different microstructural phases and matrices, a solution of ethanol and nitric acid (98 %��2��6�� and 2 %������3) called Nital was used. Since different phases corrode at different speeds, the etching was done in multiple steps. The steps varied from small etching times to reveal the pearlitic structure, to significantly longer times when revealing ausferritic matrix. SEM investigation pictures shown in Figure 6 indicates that the fracture behavior of ADI2 material transforms from ductile, dimple fracture surface to brittle cleavage in the middle of the material. This is detrimental to the overall fracture behavior of the material and is generally avoided. In contrast, ADI-3 retains the ductile dimple pattern all the way to the middle of the material, implying that it will fracture at least partly in a ductile manner. Figure 7 highlights the change in microstructure, in relation to wall thickness. In this case, ADI-3 seems to retain pearlite free, while ADI-2 forms some after 90 mm from surface.
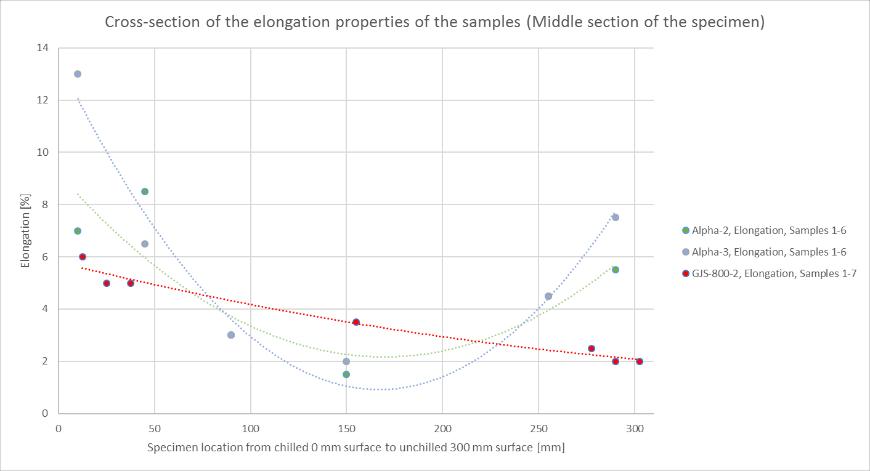
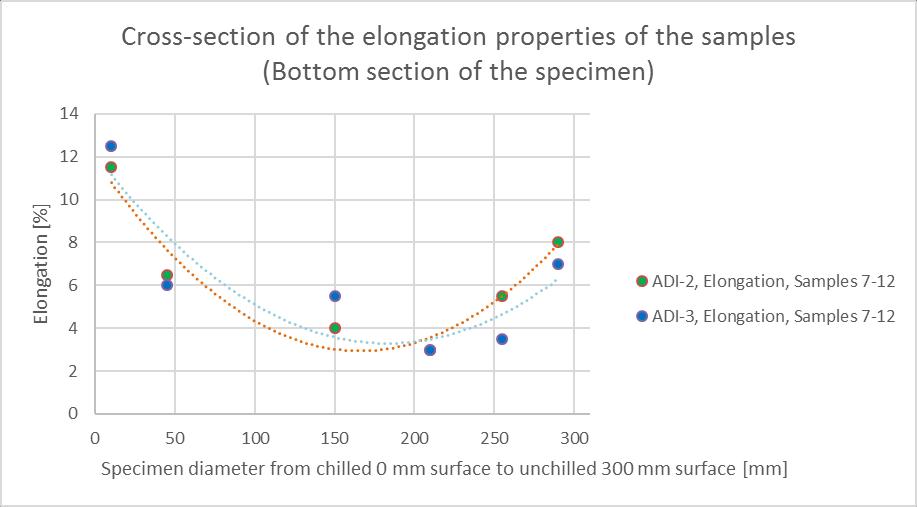
Figure 4: Elongation properties for the middle and bottom cross-section of the specimen, measured from the chilled to the non-chilled surface.
Figure 5: Hardness properties for the middle and bottom cross-section of the specimens, measured from the chilled to the non-chilled surface.
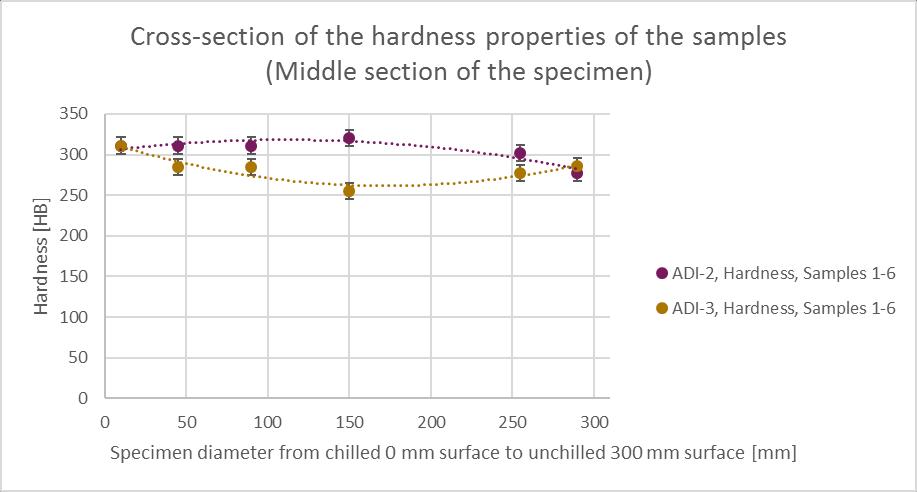

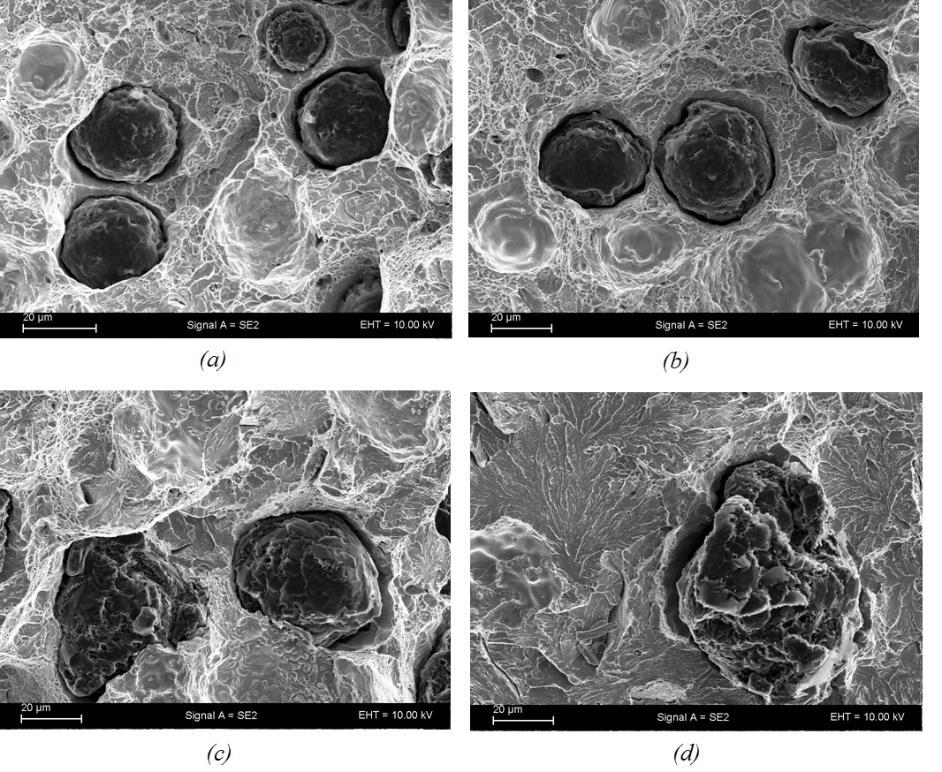
Figure 6: Fracture surfaces of ADI-2 samples at (a) 10 mm, (b) 45 mm, (c) 90 mm and (d) 150 mm depth starting from the chilled side.
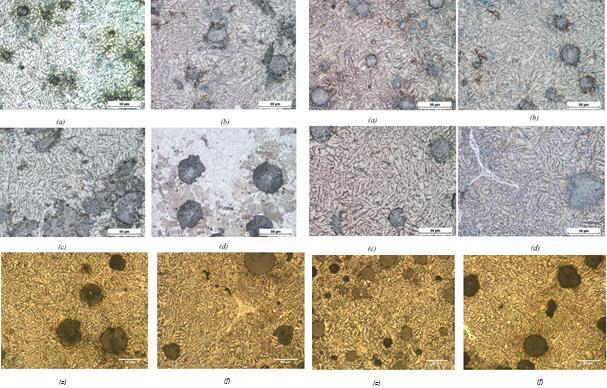
Figure 7: ADI samples (ADI-2 left, ADI-3 right) etched with Nital (2%) and numbered from 1-6 at (a) 10 mm and 75 s etching time, (b) 45 mm and 75 s, (c) 90 mm and 75 s and (d) 150 mm and 75 s and samples 5 and 6 etched with Nital (5%) at (e) 255 mm and 6 s etching time, (f) 290 mm and 6 s and depth starting from the chilled side. Pictures were taken with a 50x objective.