
Sustainability 2025 Report


Camberwell Grammar School
Governance
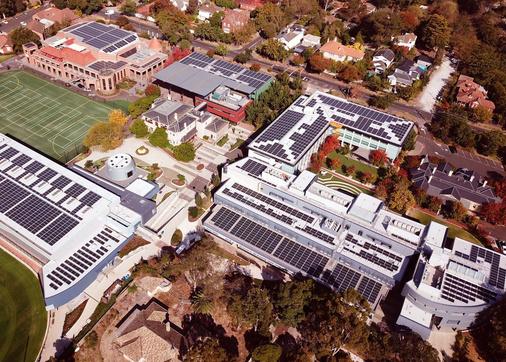
Camberwell Grammar School (CGS), a progressive K–12 boys' school in Melbourne, has championed sustainability for a decade The school council sets the strategic direction, while the Principal and Leadership Team oversee its implementation What began as isolated initiatives was elevated in 2020 to a core strategic pillar, followed by an ambitious 2022 commitment to reach Net Zero by 2030 With 1,375 students as of 2025, the School utilises a comprehensive Sustainability Program Implementation Model to drive this mission
The model integrates three school areas: Strategy, Facilities & Operations, and On-the-Ground initiatives This framework ensures that leadership vision translates into measuring and reporting performance, managing infrastructure and operations and inspiring daily action. By fostering a collaborative wholeschool approach that involves staff, students and families, CGS has moved beyond simple footprint reduction. It has cultivated a lasting culture of sustainability stewardship, ensuring that 10 years of momentum continues to empower the broader community toward a sustainable future.
Sustainability Vision
Camberwell Grammar School is dedicated to working towards a sustainable future by holding sustainability as a core value in our decision-making process In doing so, we aim to lead the education sector and inspire others around the state and country to learn from our experiences
Acknowledgement of Country


We would like to acknowledge the Traditional Owners of the land upon which we work, learn and play: the Wurundjeri Woi-wurrung people of the Kulin Nation We pay our respects to all First Nations Elders, past, present and emerging for they hold the memories, the traditions, the culture and the hopes of First Nation Australians We commit to honouring and respecting the connection First Nation Australians have with the beautiful land upon which this school is built, to extending and strengthening our relationships with First Nation Australians, to listening to their voices and to taking action that will lead to positive change
Principal's Message
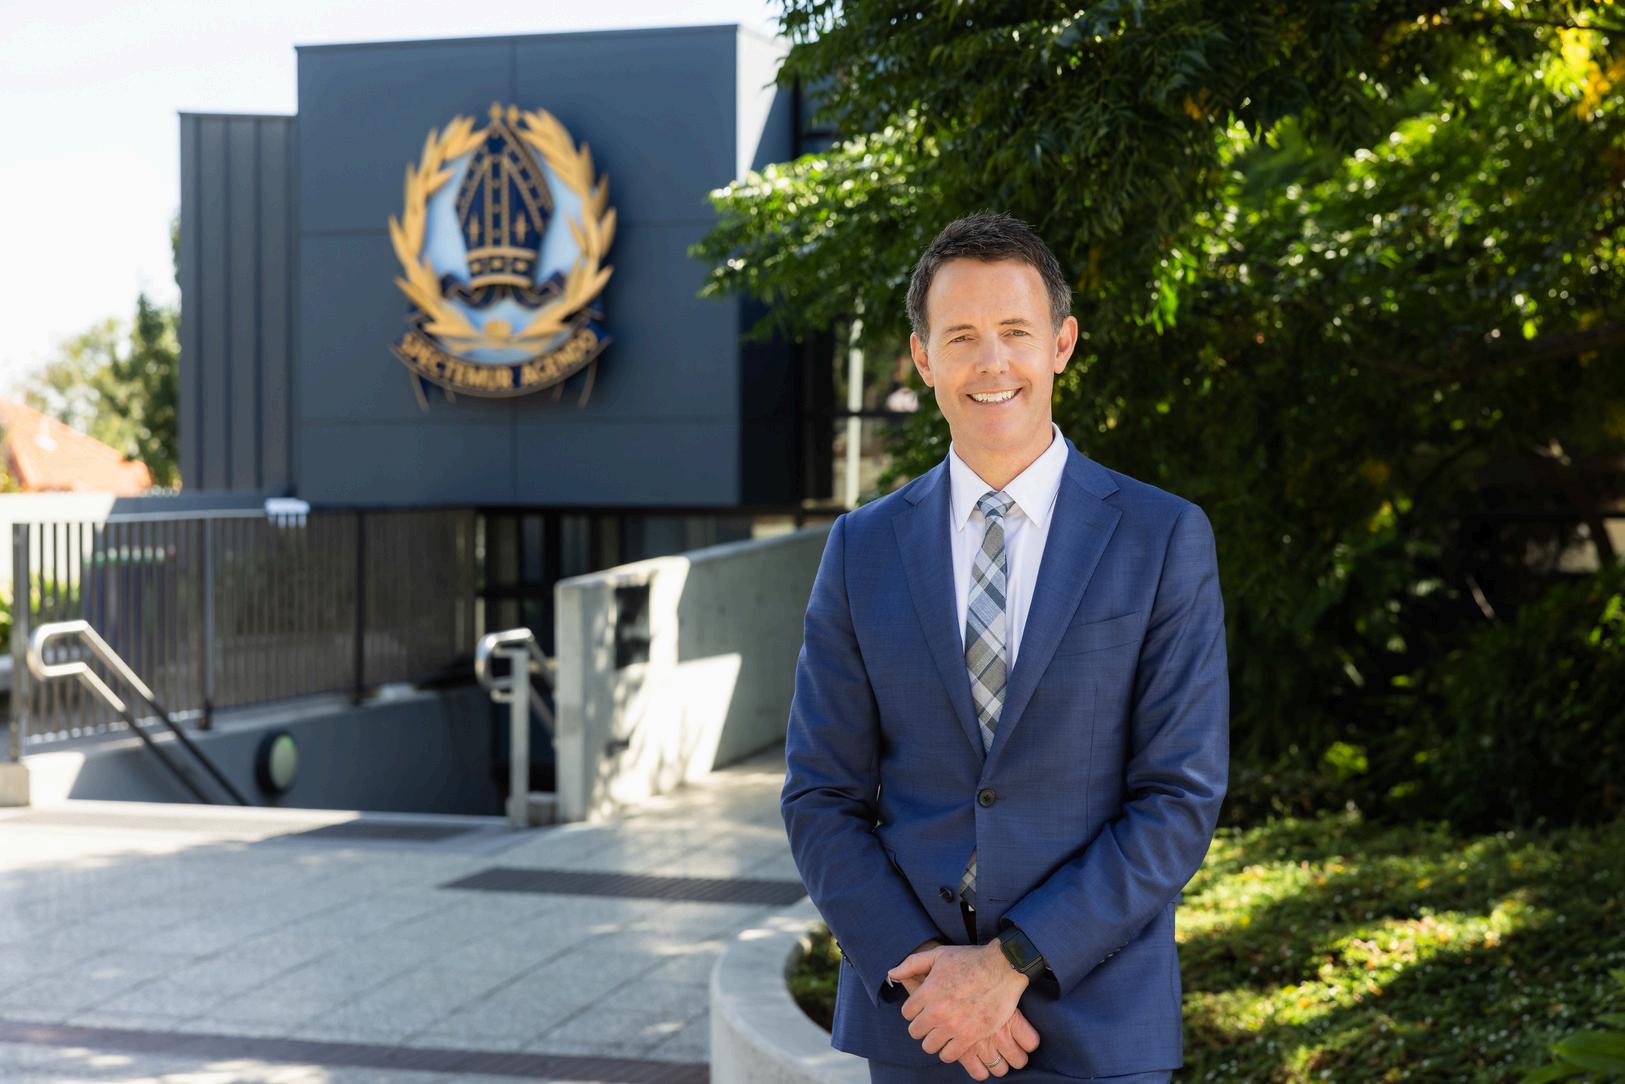
Mr Ben Jeacocke
As we reflect on the 2025 academic year, I am pleased to share an update on our journey toward Net Zero by 2030. This initiative remains a core pillar of our strategic vision, committed to conducting sustainable and secure operations. Our commitment to this goal is rooted in transparency, and the data from the past twelve months provides a rigorous roadmap for our transition.
The 2025 data reveal a mixed trend across our resource categories We are currently outperforming our targets in biodiversity, gas, and recycling, reflecting the success of our initial transition strategies The school was awarded the Victorian Resource Smart Schools Awards Campus Infrastructure & Operations School of the Year finalist for increasing our recycling efforts Most notably, water consumption saw a dramatic 21 6% decrease, alongside a 10% saving in paper and a 6% reduction in gas usage However, challenges remain in our energy and waste profiles While paper and transport fuel are within 25% of their targets, electricity and landfill underperformed by over 50% Specifically, landfill usage increased by 10 5% identifying this as one of our top operational priorities for 2026
We have intensified our focus on data-driven action Our "electrification" program, including the installation of electric heat pumps and high-efficiency hand dryers, has successfully reduced our reliance on gas and bathroom paper towels Improved water infrastructure resulted in a significant reduction of water consumption Furthermore, our enhanced sustainability reporting now provides the transparency and control needed to identify and respond quickly to inefficiencies
Beyond infrastructure, our success is deeply intertwined with community engagement Our studentled action groups and programs ensure our sustainability programs both educate and prepare students to make a meaningful contribution to their communities beyond Camberwell Grammar School These programs and action groups include the Towards 2050 student team’s Open Day, Green Week and term events, garden and beekeeping programs, ‘Fix the Future’ podcast,Junior School Stephanie Alexander Kitchen Garden, Green Ninjas and Birds in the Burbs and Sustainability themed weeks throughout the school year. Our sustainability program promotes engagement from staff, families, visitors and the wider community in the evolving transition to Net Zero. We are proud of our progress and remain committed to the disciplined, data-led action required as we strive to meet our 2030 obligations, ensuring our school remains a leader in sustainable education.

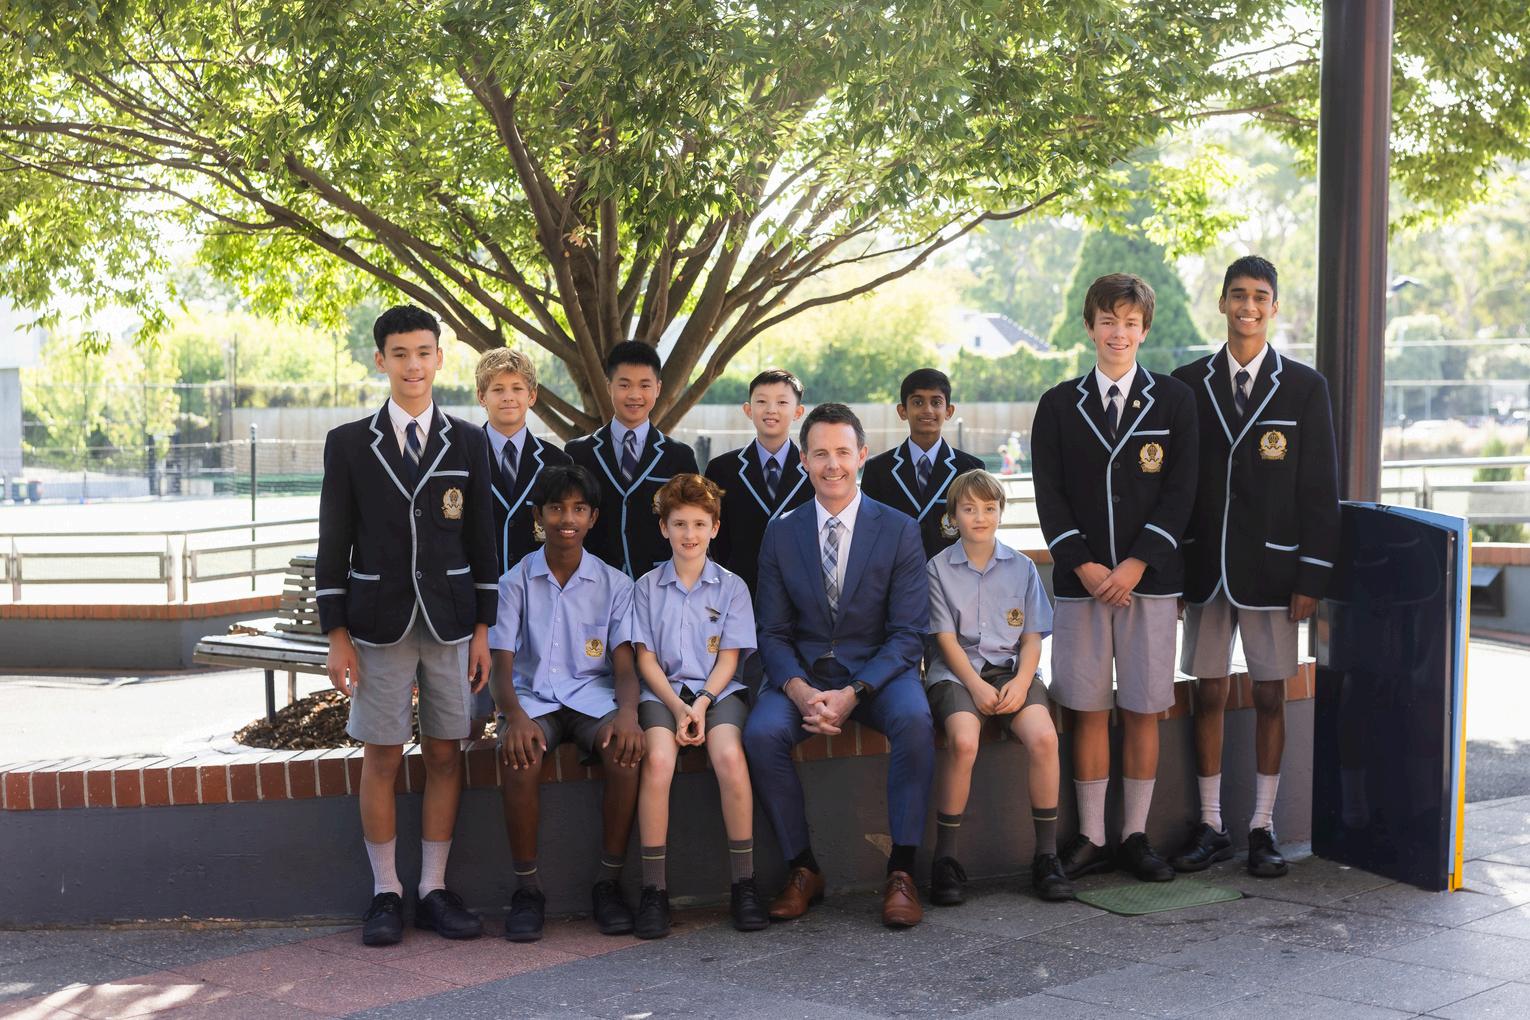
Principal
Sustainability Prefect Message
Ivan Zhang – 2025 Sustainability Prefect
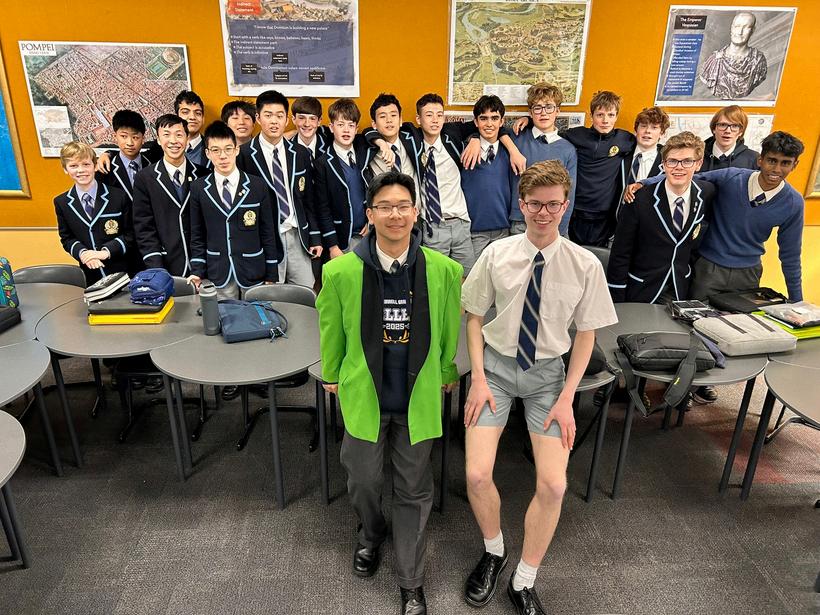
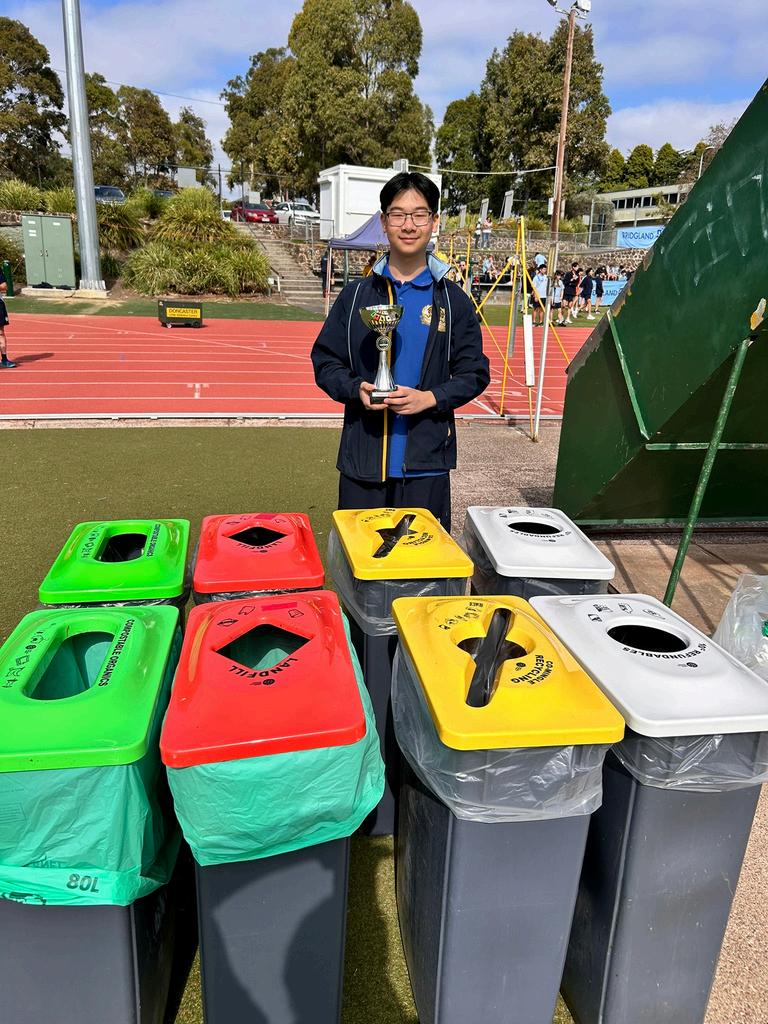
CGS’s sustainability journey reached new heights in 2025, driven by high-impact initiatives aimed at achieving Net Zero targets The year opened with Green Week, featuring biodiversity activities like the Prefect’s Rubbish Relay and a scavenger hunt. Notably, Macneil claimed the Tony Zhang Cup, and the Green Week Concert raised $1,462.85 for the Yarra River Keepers.
Operational improvements further reduced the School's footprint, including the installation of 26 hand dryers to minimise landfill waste. The Towards 2050 student team worked with the Facilities & Operations team to investigate high usage bathrooms, and hand dryer types and and create signage
Engagement remained high through the Schools Tree Day photo competition, and the School was recognised as a finalist in ResourceSmart Schools Campus Infrastructure and Operations School of the Year These achievements stem from the mentorship of Ms Menzies, Mr Hone, Mr Harley, Ms Ponert, Mr Haines and dedicated staff Their guidance has empowered the Towards 2050 student team to pursue ambitious goals
As the year concludes, we thank our staff and welcome Rory Westcott as the group’s next leader

2025 Highlights
Facilities & Operations Projects
Electrification
Under the Victorian Energy Upgrade (VEU) program, 11 end-of-life gas boilers were replaced with high-efficiency electric heat pumps during the April and September term breaks. This transition achieved a 91% reduction in peak demand of each unit, with power requirements dropping from over 160kW to just 12 1kW per unit The project is estimated to abate 20 tCO2 annually – an environmental impact equivalent to planting approximately 2,270 trees
Resource Recovery
Building on the legacy of 2024 Sustainability Prefect Tony Zhang, the Towards 2050 group partnered with the Sustainability and Property teams to replace paper towels in 26 high-usage bathrooms with energy-efficient dryers Powered by 100% renewable energy, this student-led initiative diverts nearly one tonne of waste annually and reduces emissions by 2 5 tCO2e, reflecting CGS’s commitment to impactful, student-driven environmental solutions
Water Management
Leveraging the Schools Water Efficiency Program (SWEP) and Building Management System (BMS), CGS proactively addressed irrigation and facility leaks and tank management These data-driven insights optimised garden irrigation and established a targeted gutter maintenance schedule This monitoring ensured prompt repairs, reducing annual water consumption and demonstrating our commitment to precise, sustainable resource management
Sustainability Reporting Upgrade
The School has upgraded its sustainability reporting with an in-house dashboard that streamlines data ingestion and analysis. This modernised system ensures faster turnaround times and transparency for stakeholders, strengthening the School's leadership through a sophisticated, datadriven approach to tracking environmental performance and emissions.
Campus Infrastrucutre & Operations School of theYear RSSA Finalist
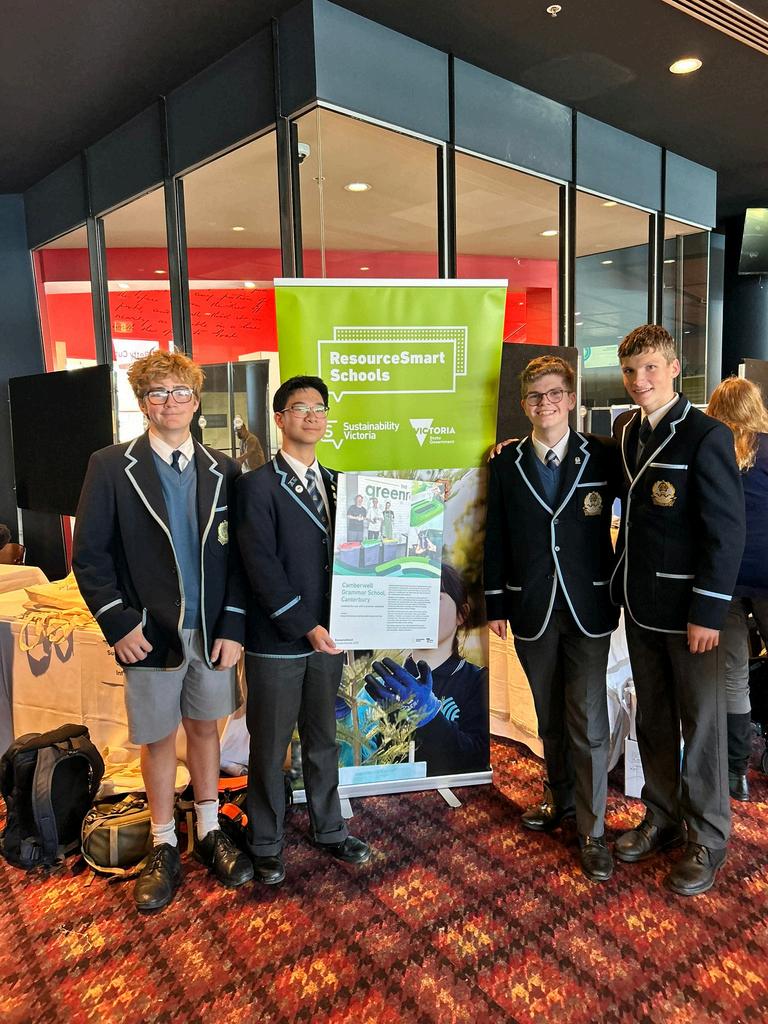
Camberwell Grammar School is a 2025 ResourceSmart Schools Awards finalist for Campus Infrastructure & Operations School of the Year. This honour recognises our strategic facility upgrades and operational improvements that support increasing recycling at the School.
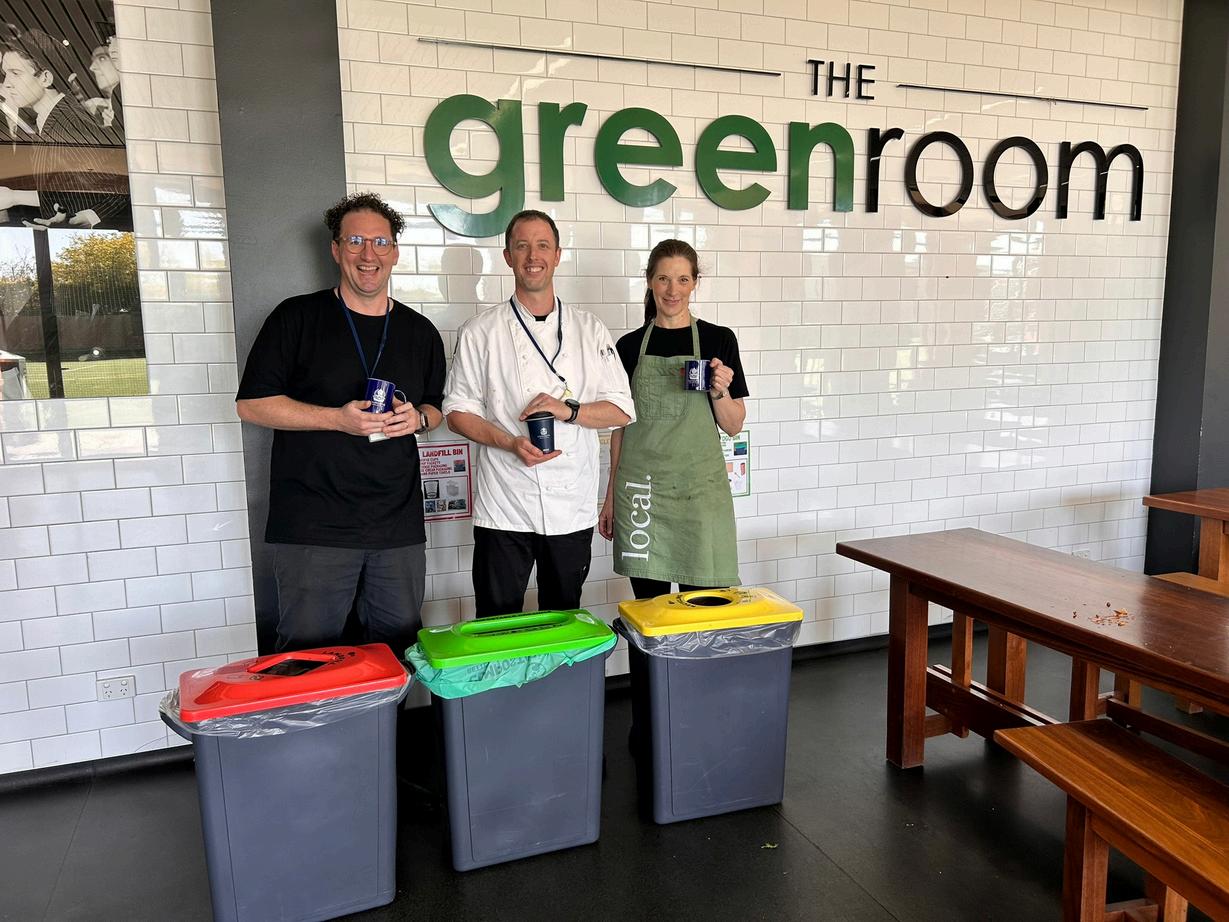
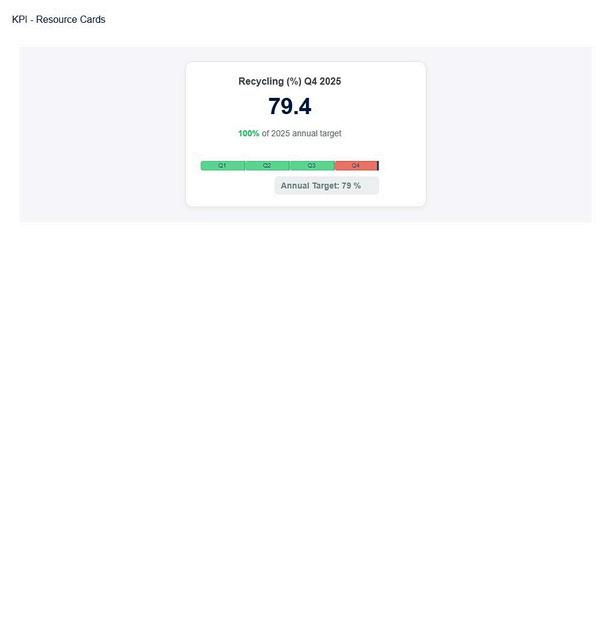
By utilising six distinct waste streams – including FOGO, green, paper and cardboard, co-mingled, and container deposits – we now recycle nearly 80% of our total waste.
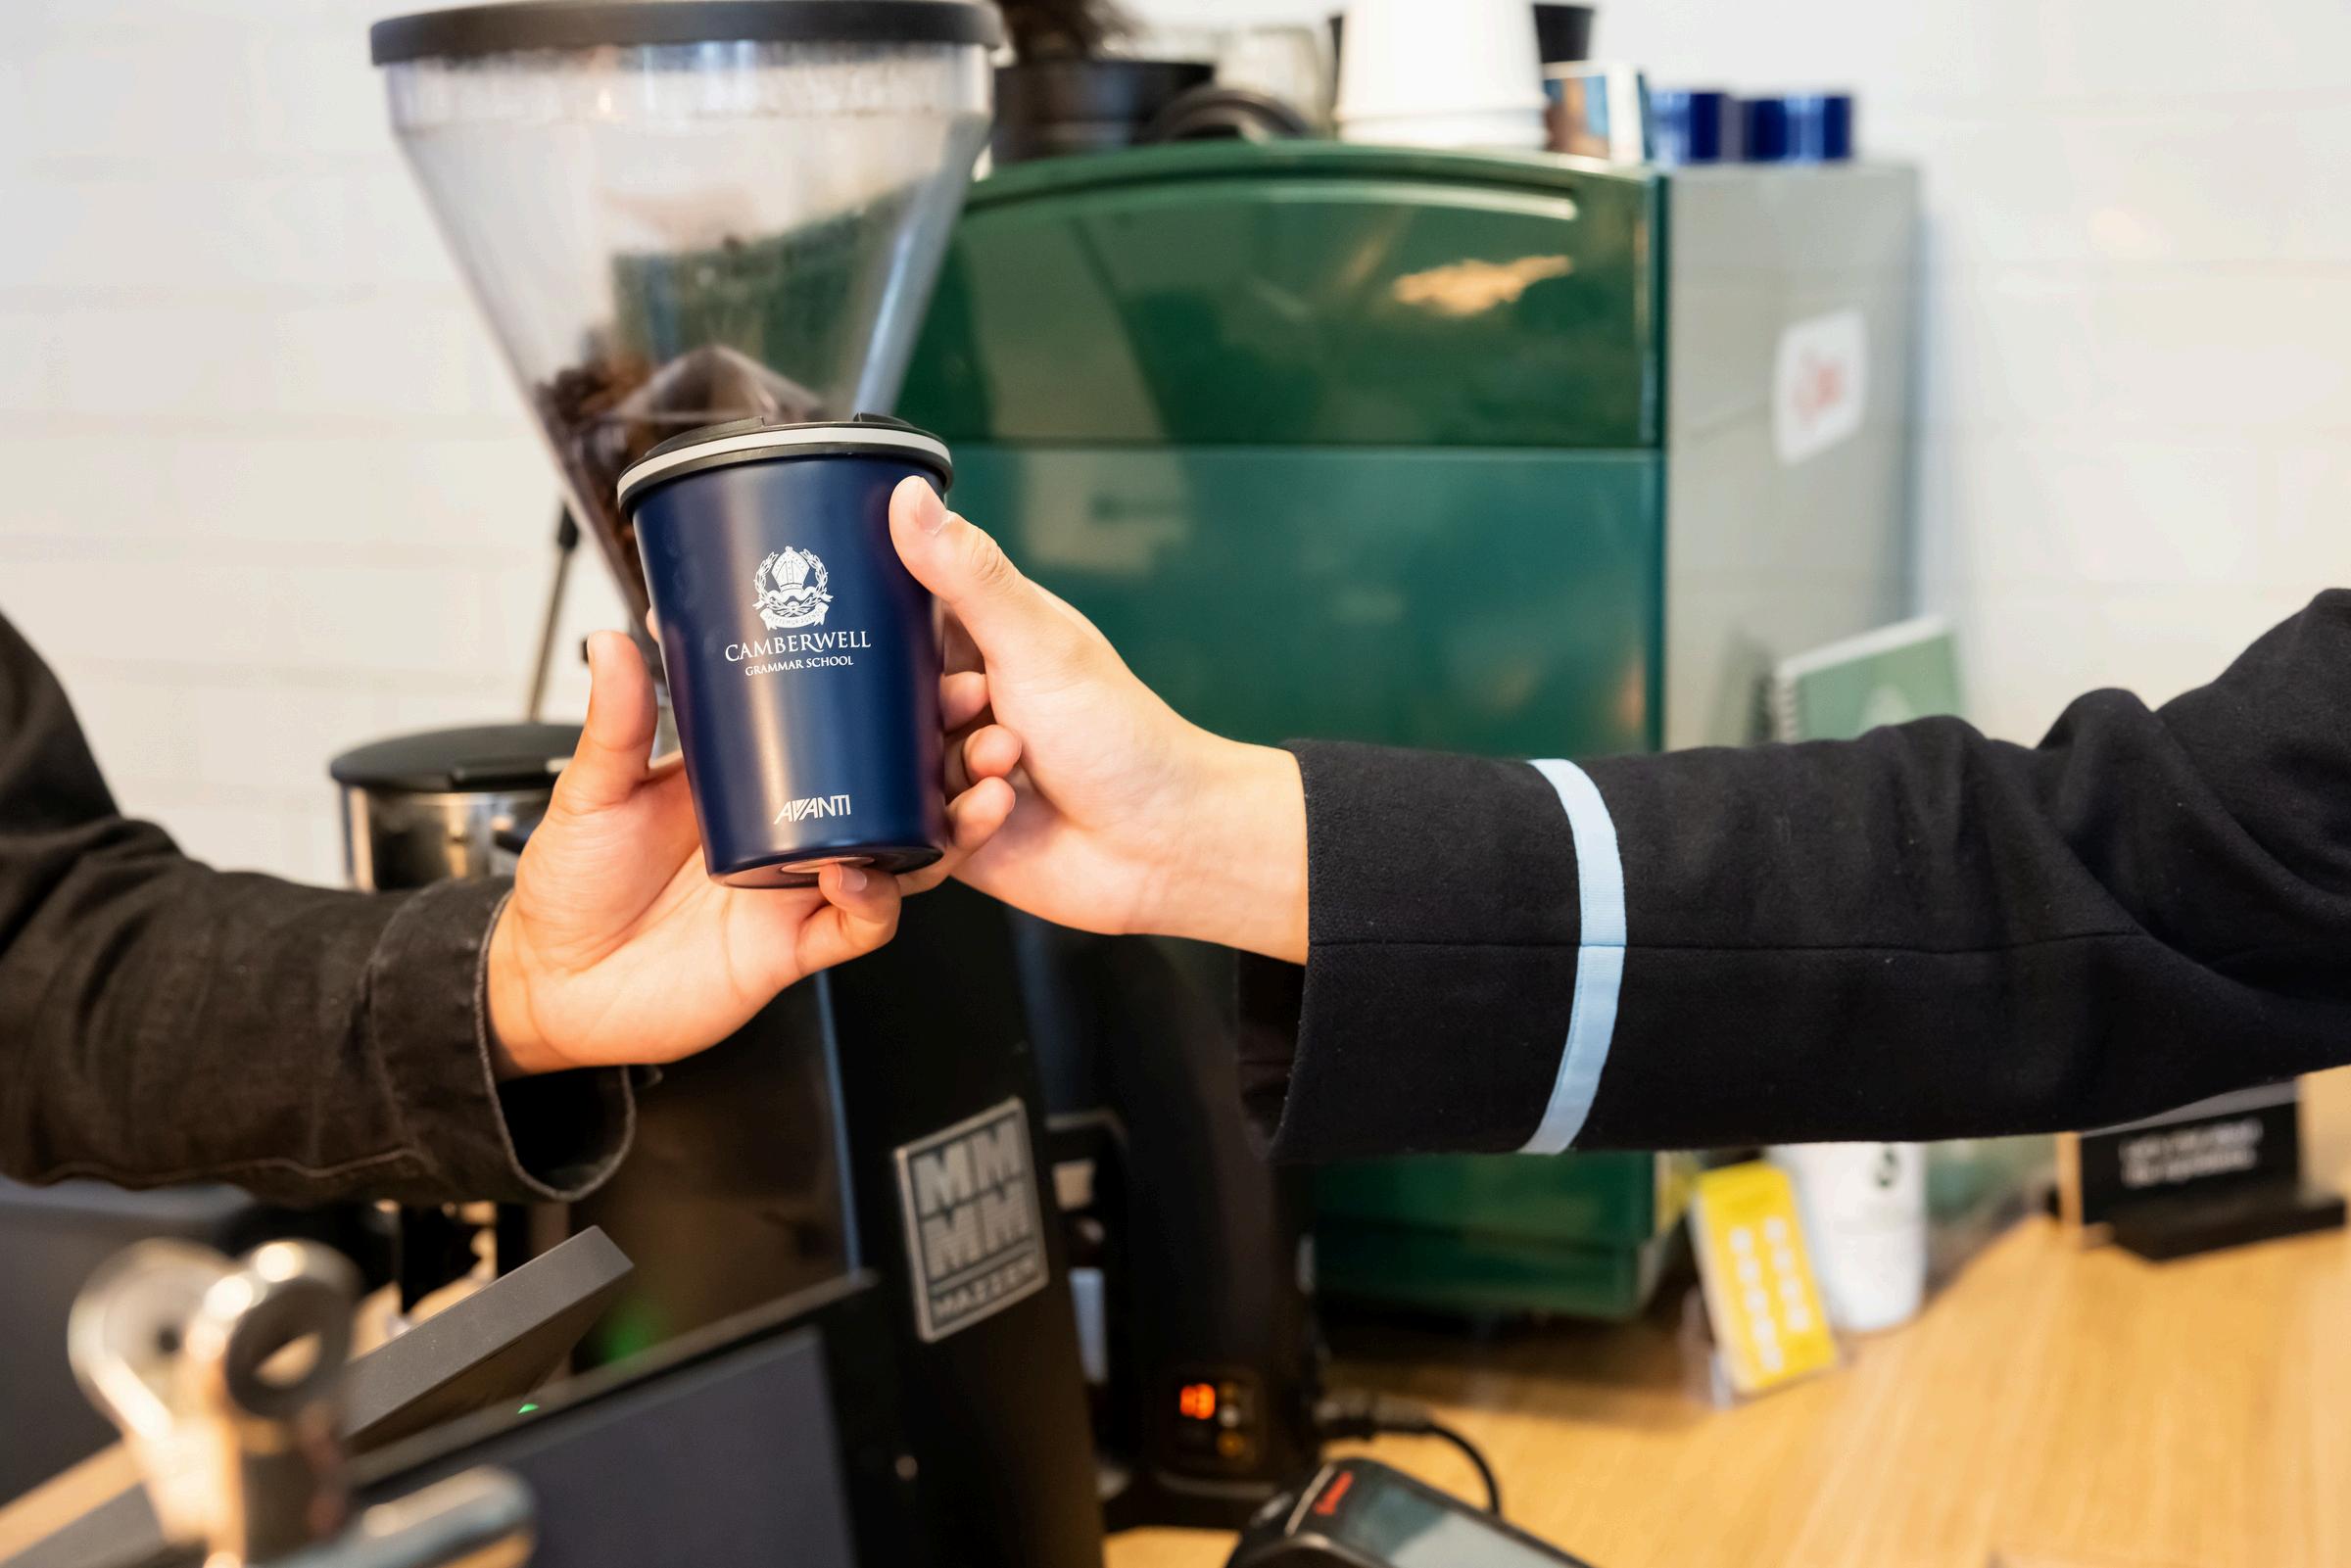
We have prioritised eliminating single-use items in our cafeteria by replacing disposable cups with mugs and phasing out landfill-bound packaging Notably, our Junior School lunches are now served using reusable bowls and cutlery
Our Facilities team diverts furniture and sports equipment from landfill by rehoming it through charitable partnerships We also ensure that books and textiles are consistently recycled or repurposed
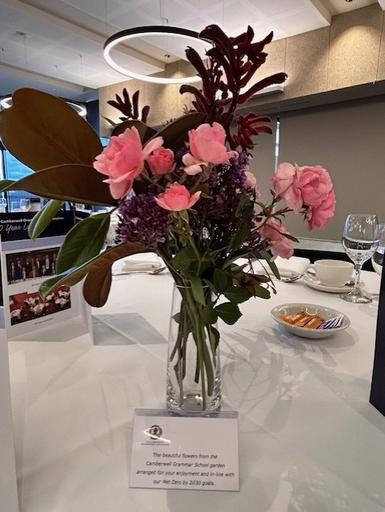
Community-facing Sustainability Hubs further extend our impact These stations provide families with convenient recycling solutions for e-waste, textiles, batteries, stationery, and mobile phones, fostering a culture of sustainability beyond the school gates
2025 Highlights Community Engagement
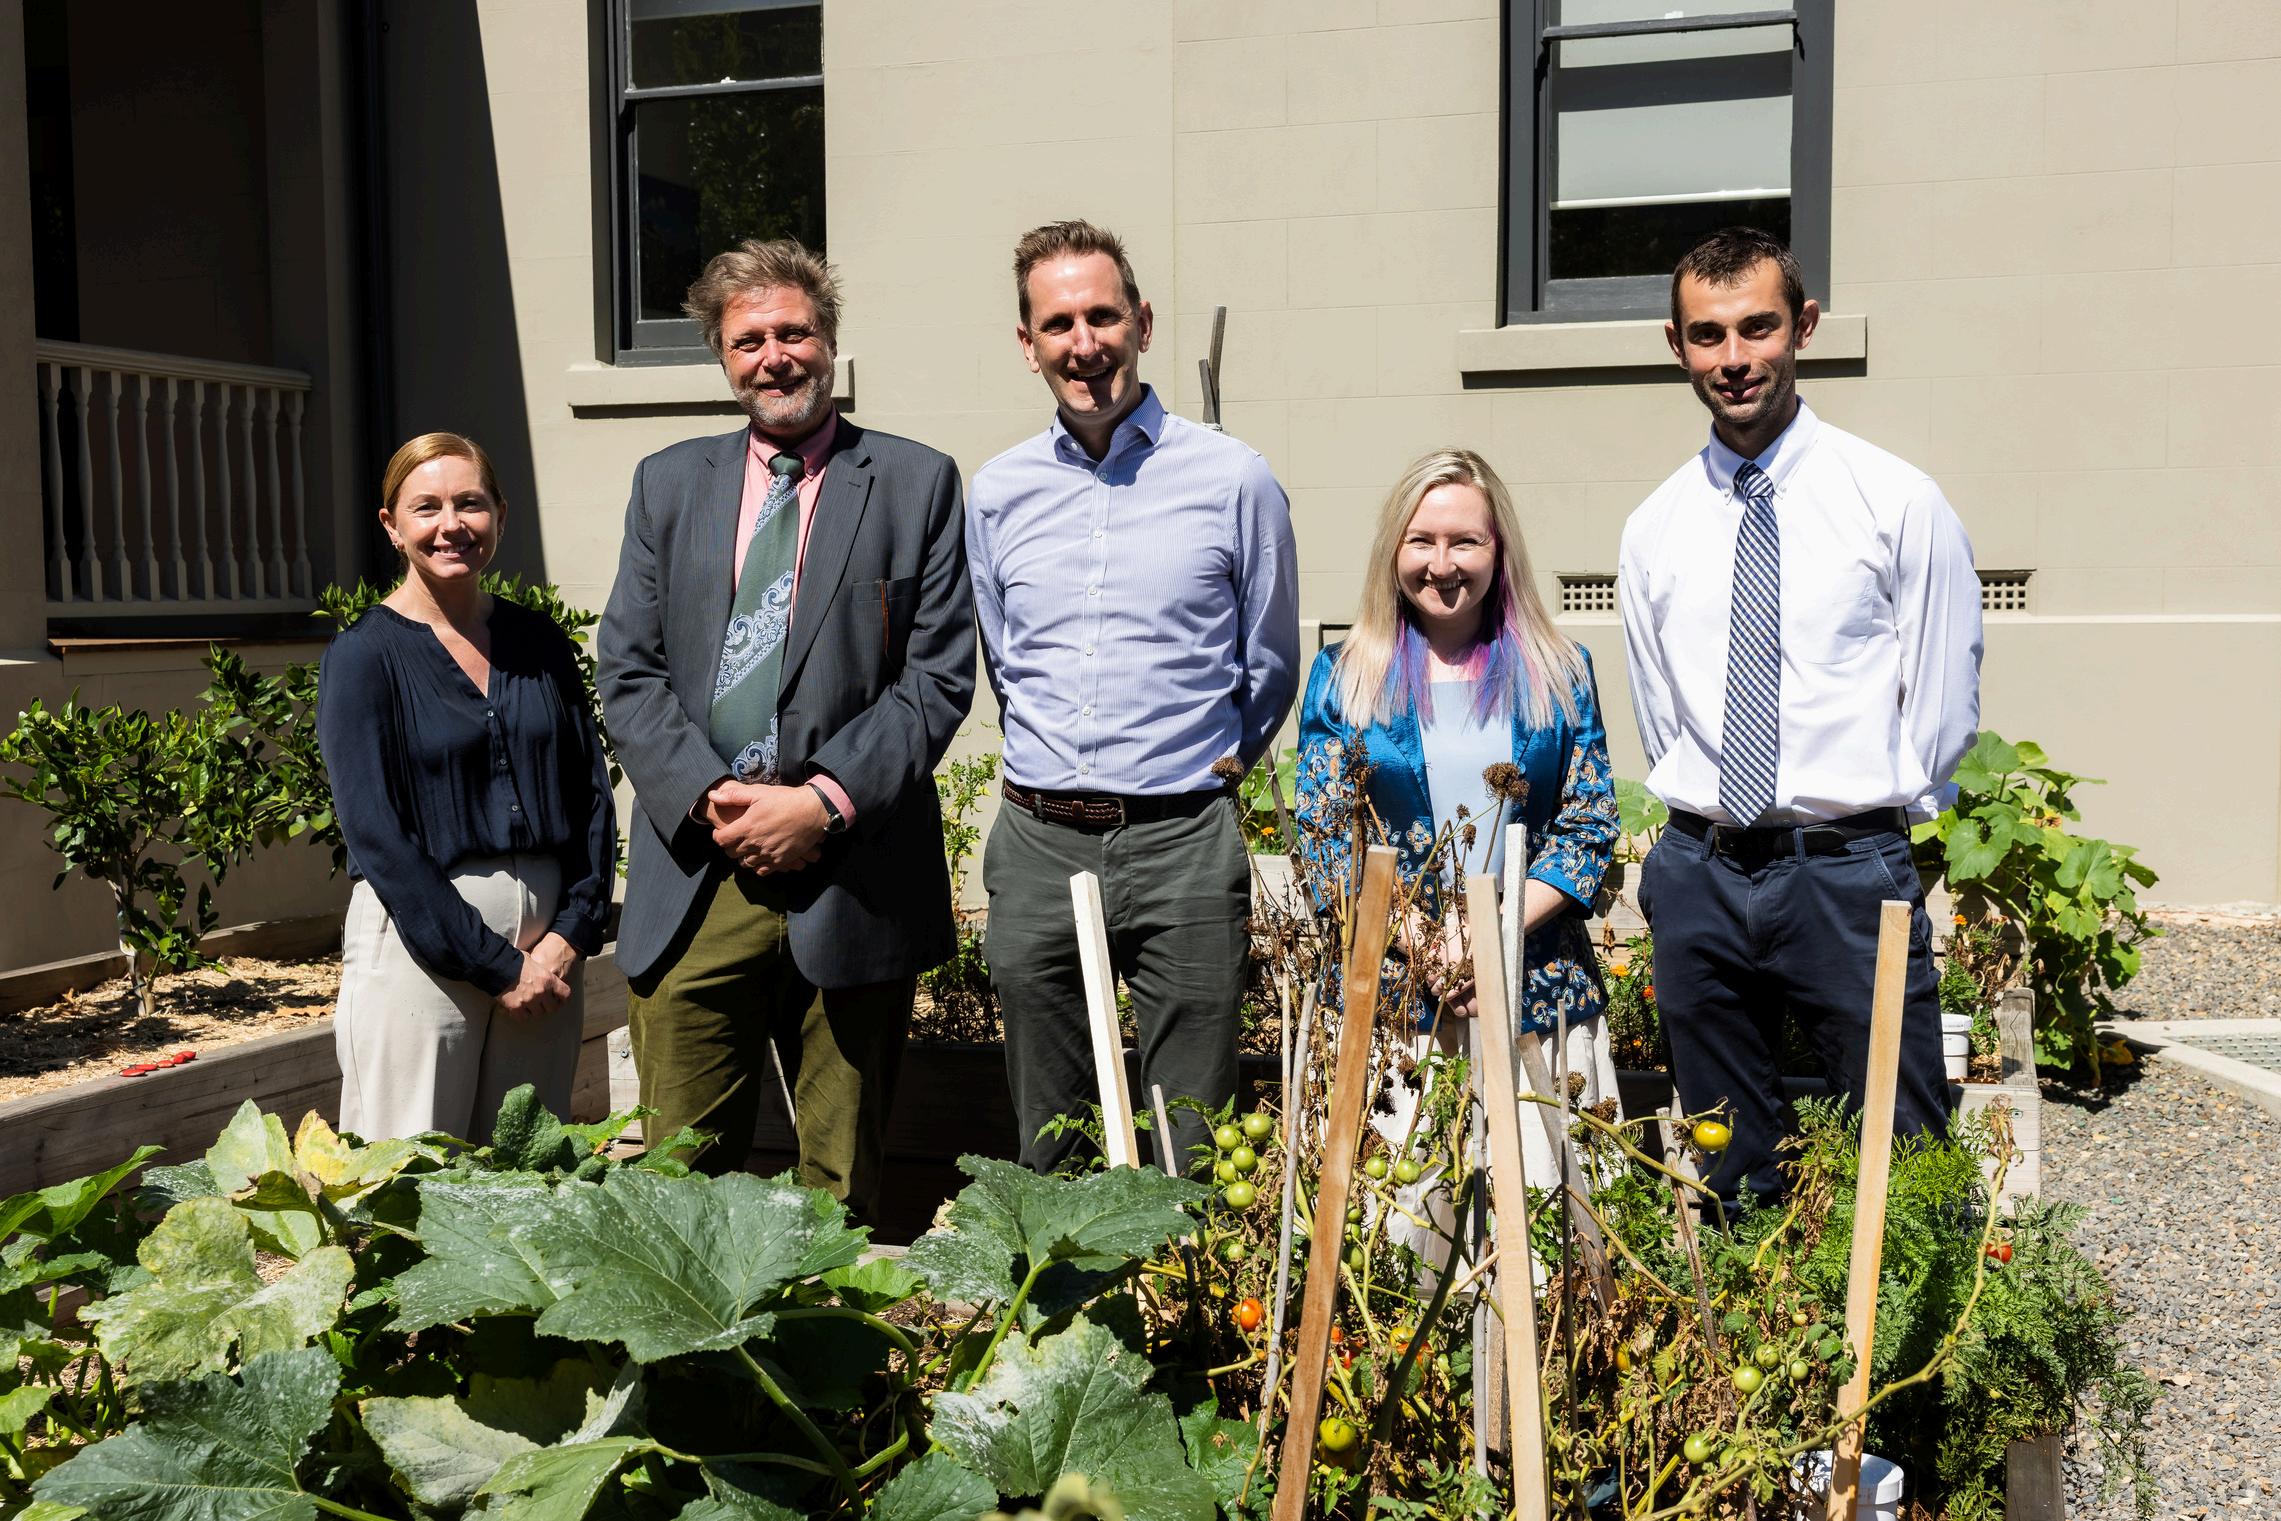
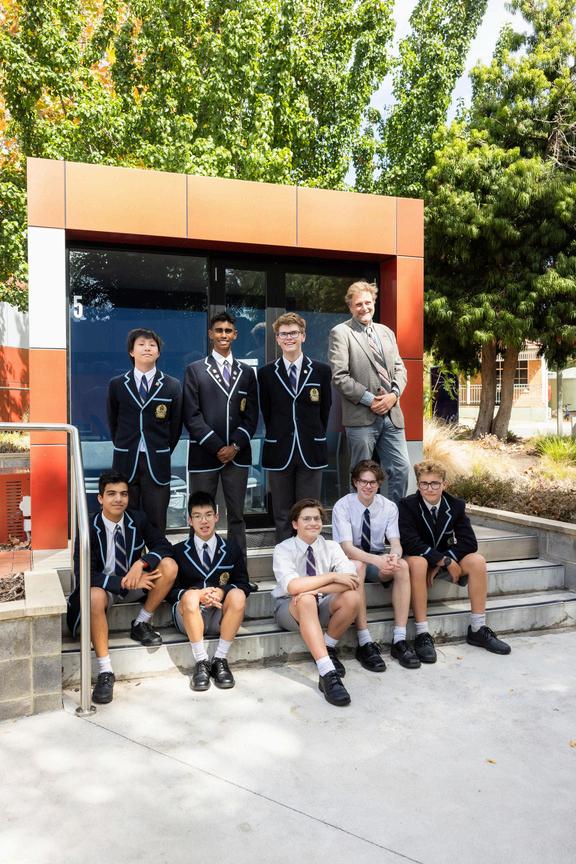
2025 Sustainability Staff Team (L to R): Ms Jo Menzies (Sustainability Project Coordinator), Mr Will Hone (Towards 2050 Sustainability Coordinator), Mr Tristen Haines (Green Ninjas & Stephanie Alexander Kitchen Garden Coordinator), Ms Michelle Ponert (Junior School Sustainability Facilitator) and Mr Tom Harley (Beekeeping and Gardening Facilitator)
Towards 2050 Action
Green Week
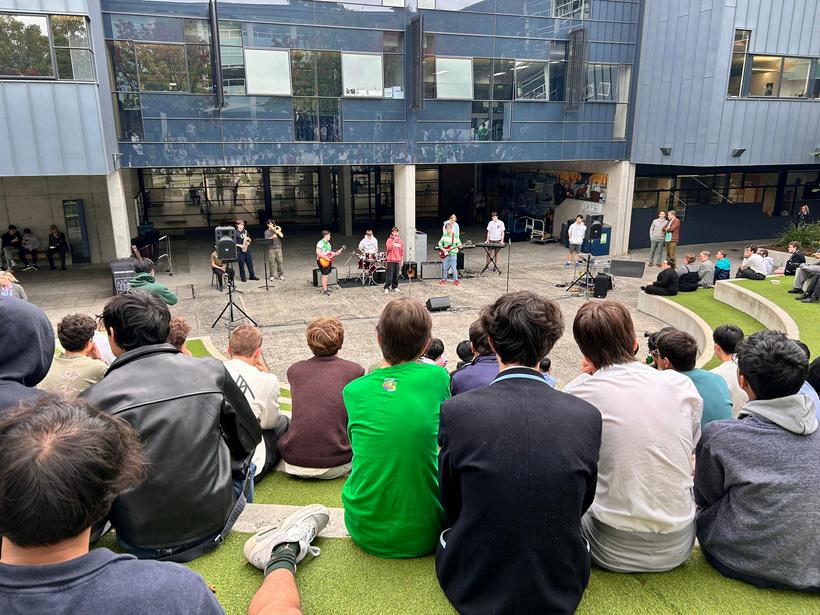
The Towards 2050 student group spearheaded a vibrant 2025 Green Week, engaging Middle and Senior Schools in biodiversity-focused activities like chalk art and scavenger hunts Through a dedicated concert and fundraisers, the community raised $1,462 85 for Yarra Riverkeepers, directly supporting Birrarung ecosystem protection and the School’s enduring commitment to local conservation
Fix the Future Podcast
The Fix the Future podcast is a student created program hosted on Spotify that focusses on solutions journalism The project is shared with other schools and aims to give participating students voice and agency By broadcasting their thoughts around international news of progress to their peers (and anyone who wants to listen), the group hopes to both discover and illustrate that positive change is possible and indeed happening
Towards 2050 Garden Team
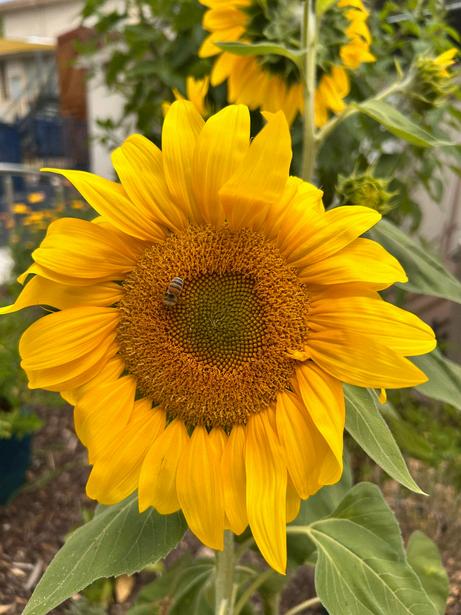
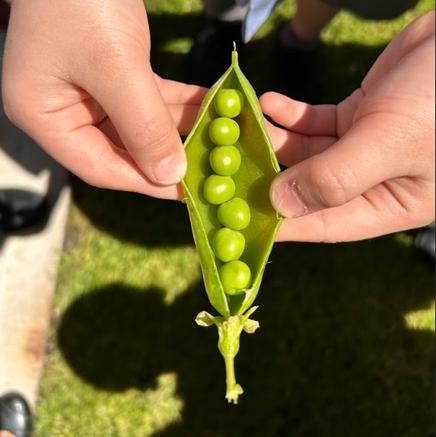
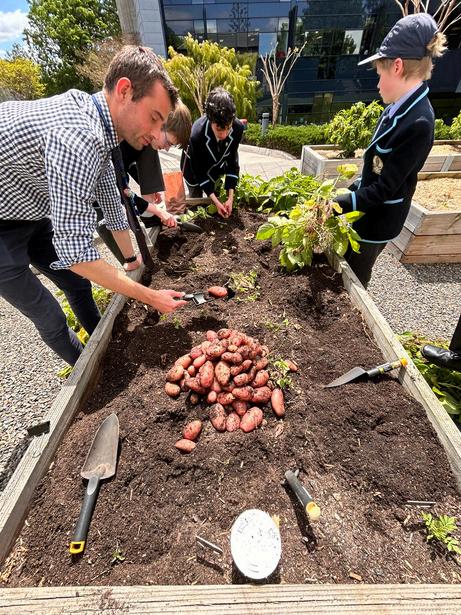
Mr Harley’s Garden Team manages the Kingussie garden through weekly planning, planting and harvesting In 2025, students converted homegrown potatoes into soup and sold tomato plants at Open Day By cultivating pumpkins, flowers, and event bouquets, the program raised funds while teaching the vital cycle from propagation to consumption
Beekeeping Program
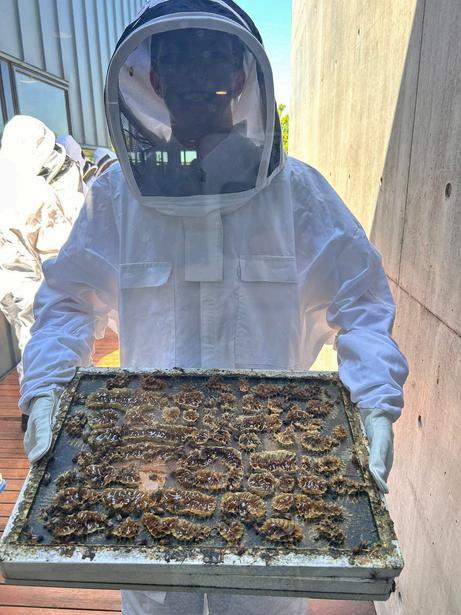
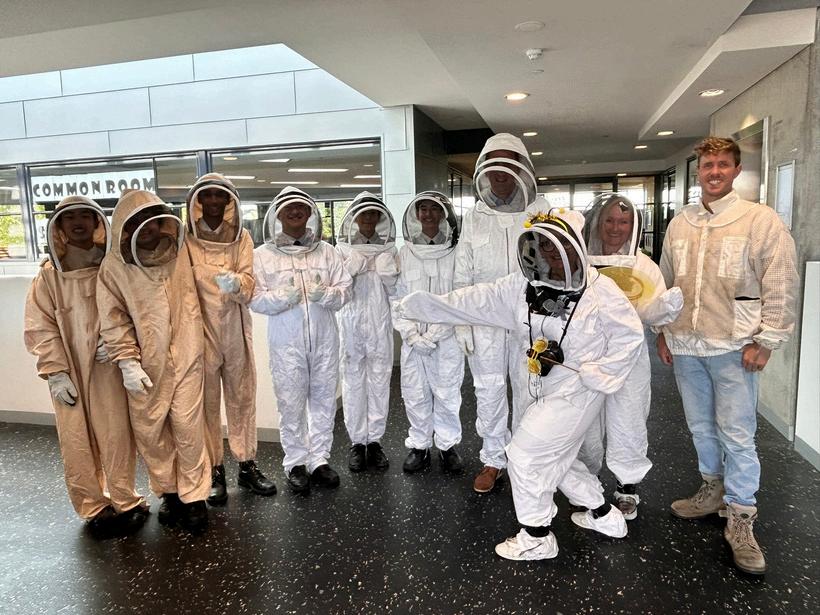
The popular Beekeeping program, led by apiarist Henry, taught students hive maintenance and bee behaviour In 2025, they harvested 30kg of honey featuring student-designed jar labels Using professional tools and protective suits, participants gained hands-on experience Sales proceeds were reinvested, ensuring the program's sustainability and continued education for the School
Open Day
The annual CGS Open Day engages the whole community It is run as a zero landfill waste event, whereby all stall holders utilise recycled or compostable packaging to sell their products The Towards 2050 student stall engages current and prospective families to discuss sustainability while purchasing homegrown plants and honey
Ride2School, Schools Tree Day & Schools Clean Up Day
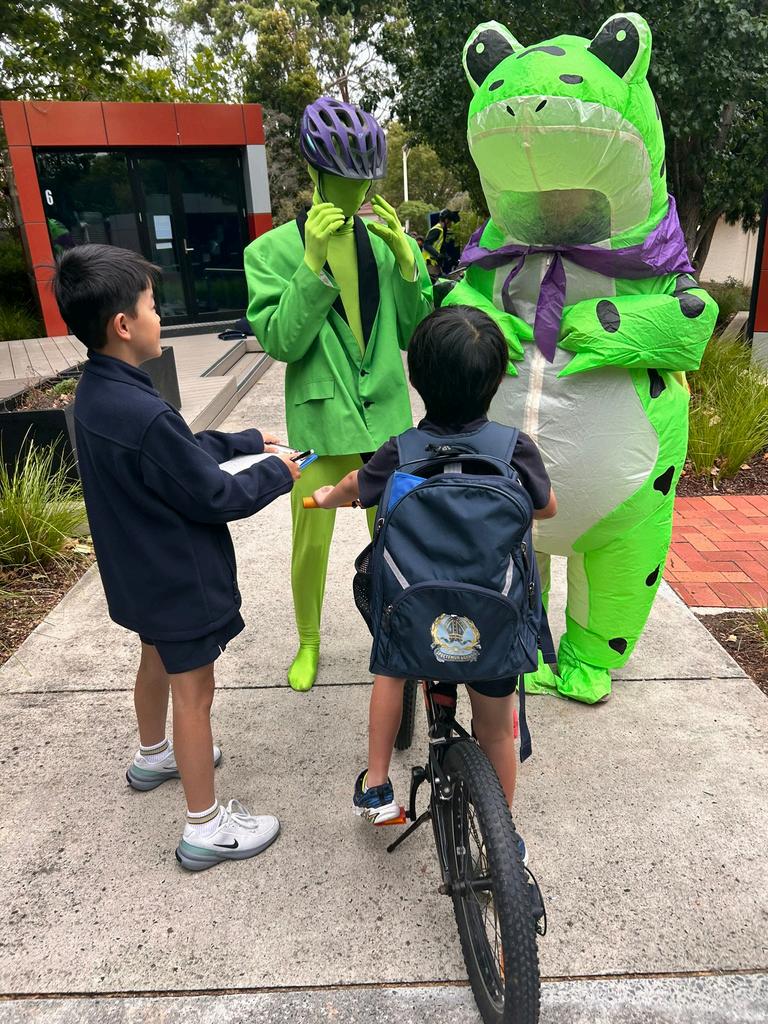
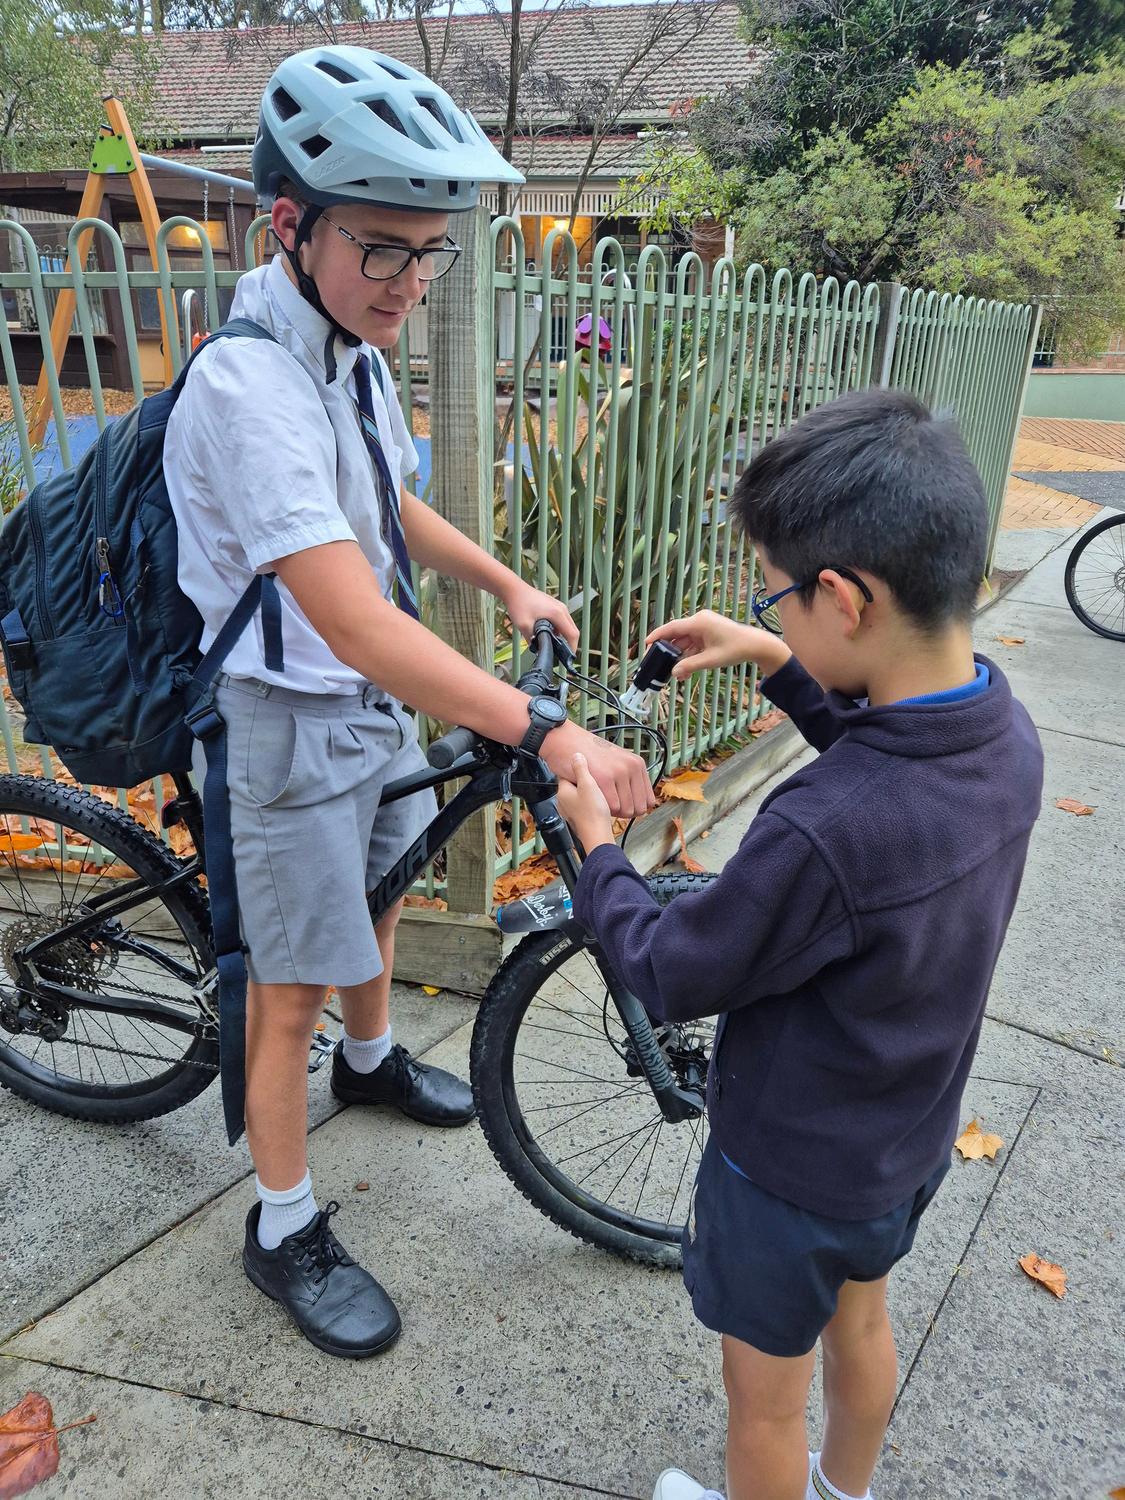
The Towards 2050 team promotes sustainability through themed terms and annual activities. In 2025, highlights included Ride2School Day, travel challenges, Schools Tree Day, planting and a photography competition. A joint Anniversary Trail cleanup with Camberwell Girls Grammar School fostered collaboration. These events, bolstered by quizzes, effectively raised sustainability awareness across the school community.
Junior School Action
Stephanie Alexander Kitchen Garden
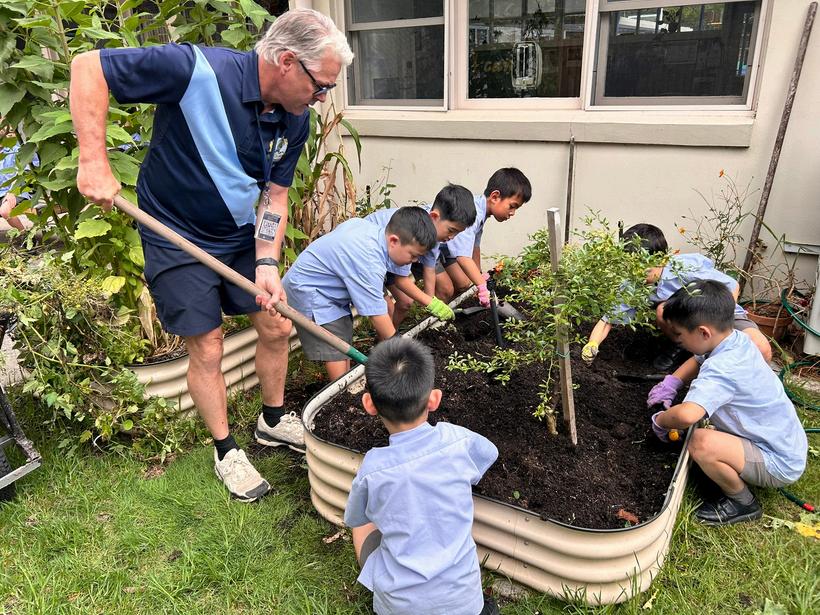
Mr Haines leads the SAKG curriculum program, teaching Junior School students about soil health, plant identification, planting, harvesting and journalling Students prepare and eat their homegrown produce, supported by staff and parent helpers Connection to nature and learning new skills is the foundation to sustainability stewardship
Green Ninjas & Bin Chats
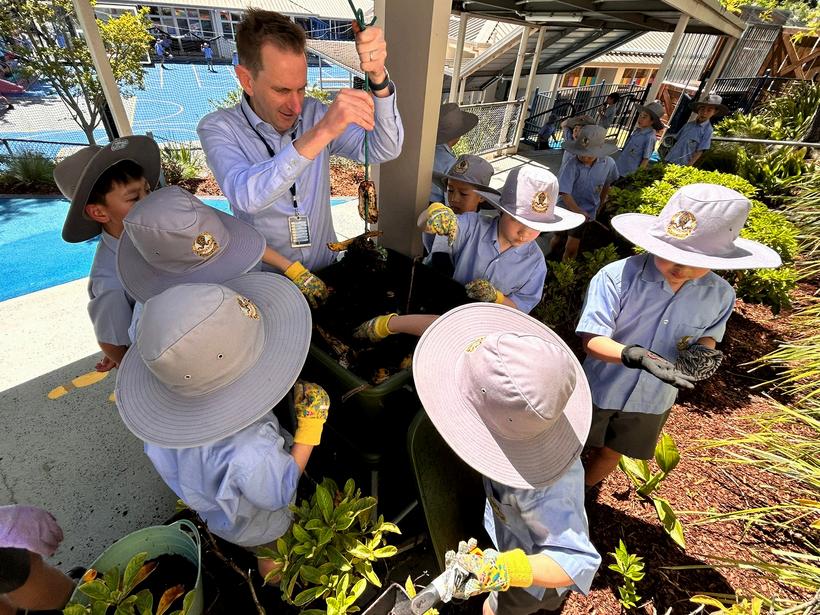
Mr Haines inspires stewardship by engaging Junior School students in weekly Green Ninja and Bin Chat activities Students freely attend the weekly session to learn hands-on worm farming and gardening skills Bin Chats invite curiosity and education about the School's waste streams and reduction targets These hands-on experiences foster engagement and a deep connection to sustainability
Biodiversity Audit and Birds in the Burbs Program
Ms Ponert has developed various Junior School sustainability programs, including Biodiversity Audits and Birds in the Burbs. These initiatives teach students plant and animal identification, field work, and reporting. By engaging directly with their environment, students connect deeply with nature and become proactive stewards dedicated to protecting local ecosystems
Nude Food House Competition, Energy Detective and Ride2School Day
Ms Ponert launched programs targeting excess consumption, notably the Nude Food House Competition. Families reduced single-use packaging and uploaded lunchbox photos to a Padlet - Macneil was crowned the 2025 competition winner. Simultaneously, the Year 5 Executive team conducted an energy audit, analysing consumption across classrooms and organised the annual Ride2School Day, promoting active transport
Middle School Action
Year 7 Sustainability Festival
The three-day Sustainability Festival empowered Year 7 students to recognise their individual agency and capacity for impact Partnering with the Melbourne University Climate Action team, students identified their unique "superpowers" to drive positive action toward a sustainable future The program featured diverse activities led by experts from the City of Boroondara, Yarra Riverkeeper Association, Les Twentyman Foundation, Backyard Honey, and Scouts Victoria, alongside partners like La Trobe University and Camberwell Girls Grammar Through these sessions, students gained practical insights into circular economies, beekeeping, food security, and conservation On the final day, groups presented their findings and authored welcome letters to incoming Year 7s Ultimately, the Sustainability Festival cultivated vital skills and a sense of purpose, proving that student-led advocacy drives meaningful community change.
11
2025 Performance
Net Zero by 2030 Target
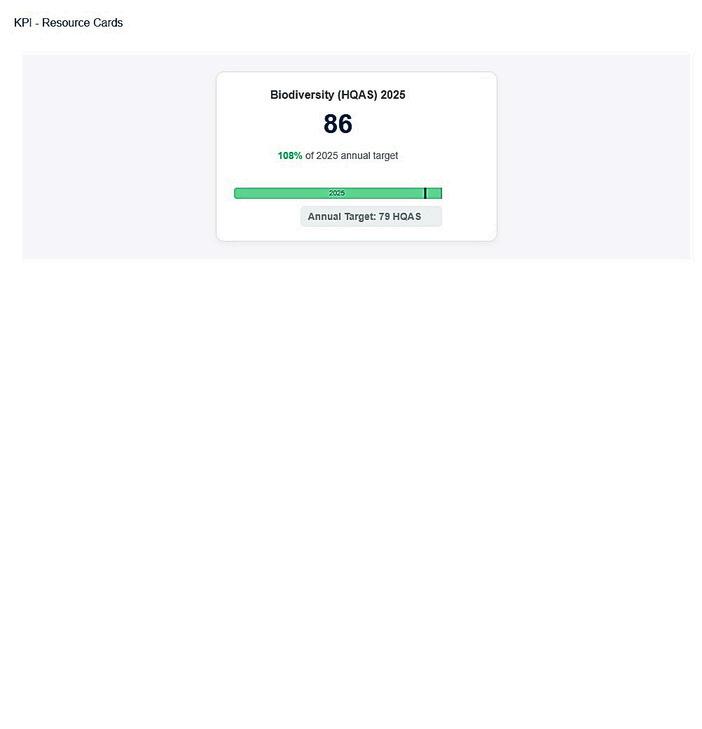
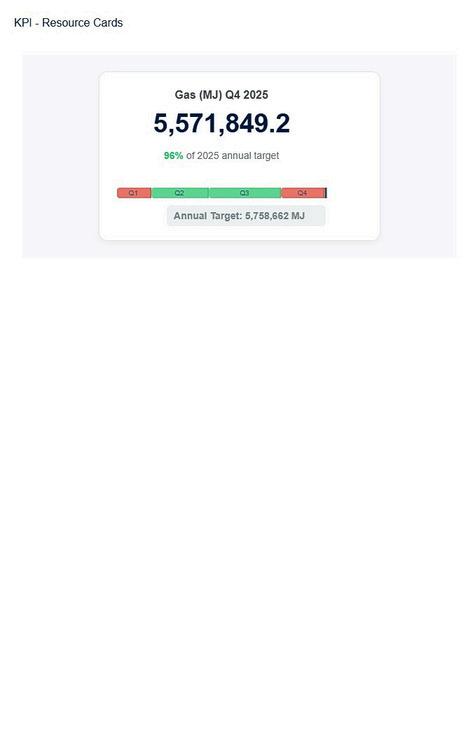
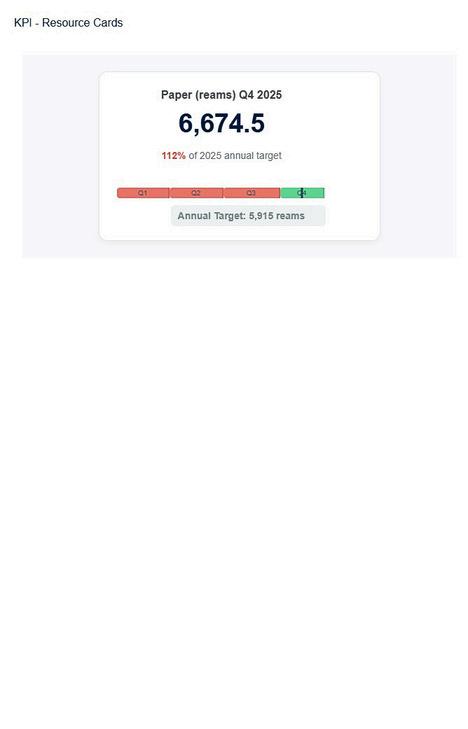
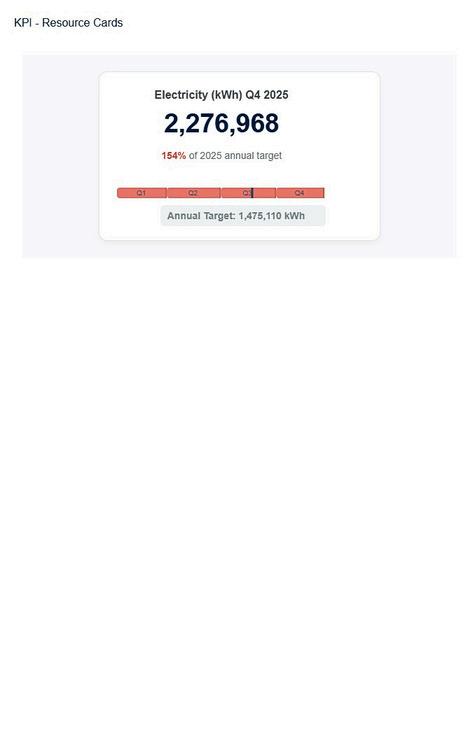
2025 targets were set to align with our Net Zero by 2030 trajectory based on baseline year consumption. While biodiversity, gas, and recycling outperformed their goals, paper, transport fuel, water, electricity, and landfill underperformed. These variances will dictate where we must intensify decarbonisation efforts as 2030 approaches.
Net Zero Target
2025 Performance
Year-over-Year Consumption Trend
This chart illustrates 2025 resource consumption performance relative to 2024 Resources above the line represent a positive trend in conservation and reduced usage, whereas resources below the line indicate a negative trend of increased consumption
Biodiversity
2024 consumption
The 2025 data reveals a mixed trend in sustainability outcomes In the last 12-months, there has been a significant reduction in several key resource areas Water consumption saw the most dramatic improvement with a 21 6% decrease, followed by notable savings in paper (10%) Efforts to preserve biodiversity (9%) and reduce gas (6%) usage also show healthy downward trends, while recycling saw a marginal improvement of 0 4% Conversely, energy and waste continue to be a challenge Generation of landfill saw the sharpest increase at 10 5%, electricity (6 4%), and transport fuel (5 7%) consumption both increased Based on 2025 trends, optimising landfill diversion and electricity reduction strategies will be a top priority for 2026
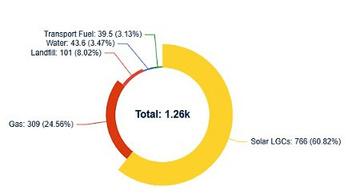
Table 2.
greenhouse
Table 3. 2025 total air travel offset by Greenfleet Australia through tree planting programs.
Measuring our Progress
In this report, we have assessed our progress in 2025 for each sector of the Sustainability Plan 2023-2026 Under each focus area and/or priority for each sector, the status is included along with the associated achievements, progress, actions, next steps and timeframes
Status has been determined using the following matrix:

Completed Ongoing In Progress
The project is completed The approved project has been implemented and is continuously managed and reviewed
A formal, approved plan is in place and implementation is actively underway
Developing Deferred Future
The project is in the planning stage and is actively being developed
Plans exist but are currently deferred due to technological, logistical, cultural or resource constraints
No plans or actions have been taken yet; progress depends on technological, logistical, cultural or resourcing developments
Biodiversity
2025 Spotlight
The 2025 Biodiversity Audit recorded a Habitat Quality Assessment Score of 86, exceeding the annual Net Zero target of 79 by 8.9%. This represents a significant upward trend, marking an 11.6% increase from 2024 and an 18 6% improvement from the 2022 baseline These results highlight the effectiveness of the School’s strategic sustainability initiatives over the past year
This improvement included targeted grounds work Strategic mulching across Q2 and Q3 achieved 100% site coverage, improving soil health, from the 70% mulch coverage recorded in 2024 Furthermore, nearly 600 native plants were established, including Banksia, Westringia, and Waterhousia This was supported by Schools Tree Day, which added 50 indigenous species such as Correa reflexa and Goodenia ovata to the campus
Student engagement through biodiversity curriculum programs also yielded measurable results Initiatives like the Junior School Birds in the Burbs program empowered students to actively monitor local wildlife This increased the official fauna list to 21 observed species, a substantial rise from the 14 species recorded in 2024
Biodiversity Sector Progress
Focus Area
Increase habitat quality
Create climate resilient and water sensitive landscapes
Priority/Action
Enhance habitat quality to support local ecosystems and native biodiversity 2023
Indigenous Flora and Fauna in Boroondara documents shared with the Grounds staff 2024
Incorporate commitment to biodiversity targets in school strategic planning. 2023
Connect to local places by learning about native plants and animals found in adjacent parks 2024
Connect to local places
Partipate in Schools Tree Day 2023
Partner with City of Boroondara to bolster local biodiversity protection and regeneration 2024
Care for Country by learning from Wurundjeri Woiwurrung about ecological and cultural knowledge. 2026
Help Care for Country
Connect students and staff to nature for the cobenefits of health and wellbeing 2024
Help students connect to nature through biodiversity and gardening programs 2024
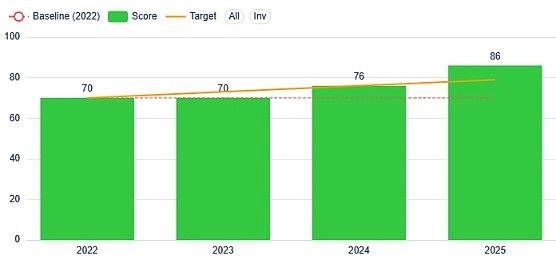
Figure 1 highlights the increase in Camberwell Grammar School’s Biodiversity Habitat Quality Assessment Scores (HQAS) since 2022 (baseline) The 2025 score reflects a 23% increase in biodiversity since the baseline year, a13 2% increase from 2024 and favourably exceeds the 2025 annual Net Zero target by 9%
2025 Biodiversity Summary
Electricity 2025 Spotlight
In 2025, total electricity consumption reached 2,276,968 kWh, a marginal 6 4% increase over 2024 This stability is notable given the installation of 26 electric hand dryers and 11 electric heat pumps The School’s energy mix comprised 68% renewable grid electricity and 32% on-site solar production Of the 885,431 kWh generated by the solar system, the School self-consumed 710,669 kWh (80%), while exporting 174,761 kWh (20%) to the grid Solar seasonal performance peaked in Quarters 1 and 4, meeting over 40% of demand, before dropping to 23% in Quarters 2 and 3
Despite these gains, achieving Net Zero remains a significant challenge Consumption exceeded annual targets by 54%, with Solar Large-Scale Certificates contributing 765 99 tCO2e, 61% of total emissions, making electricity the highest-emitting sector Future efforts will focus on aggressive efficiency measures, including refined HVAC scheduling, the procurement of high-energy-rated appliances, education campaigns and fostering community behavioural changes to bridge the gap toward Net Zero targets
Electricity Sector Progress
Focus Area Priority/Action Timeframe
Install on-site 888kWh solar systems
Purchase 100% renewable energy
Reduce energy consumption
Reducing emissions
Engage the community
Install highest energy rated infrastructure and appliances when replacing new ones Ongoing
Research electric tools, transport, and charging infrastructure to advance the School’s electrification. Ongoing
Analyse underperforming buildings, after-hours energy use, and thermal efficiency 2026
Surrender selling Large-Scale Generation Certificates 2025/2026
Educate students and staff to foster sustainable energy habits and conservation Ongoing
Conduct an Energy Assessment with students. 2025
Implement signage to promote energy conservation and highlight sustainability features Ongoing
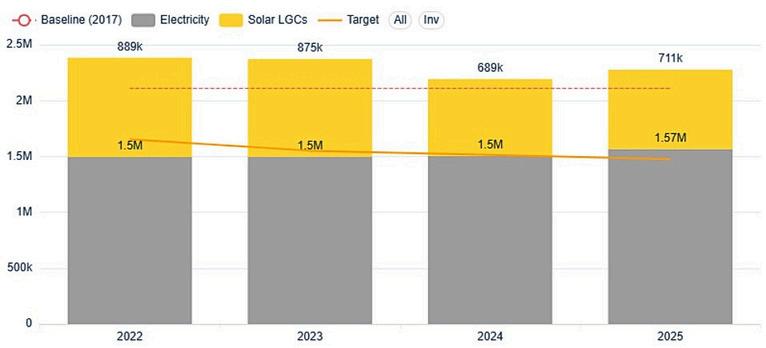
Figure 2 shows that CGS utilises 100% renewable grid electricity, resulting in zero operational emissions. While solar credits (LGCs) are currently sold, associated emissions are included in the School’s GHG reporting. Future surrender of these certificates will substantially decrease the School’s net annual emissions Electricity consumption exceeds the annual Net Zero target substantially and the baseline year consumption
2025 Electricity Summary
Solar:Grid
Export
766.3 tonnes of carbon emitted from solar Large-Scale certificates (LGCs)
100% renewable energy usage, split between 32% on-site solar and 68% renewable grid supply
80% of solar generation consumed onsite and exported 20% to grid
Gas 2025 Spotlight
Gas Sector Progress
Focus Area Priority/Action Time frame
Electrify inefficient and end-of-life gas heaters and gas hot water through VEU grants 2025
Investigate feasibility of adjusting pool temperature and implement findings 2024
Reduce energy consumption
Investigate alternatives to transition away from gas in the Performing Arts Centre Ongoing
Investigate and map gas utilities to support better resource management Ongoing
Investigate alternatives to transition away from gas in the Aquatic Centre 2024
Use signage for gas conservation practices 2026
Engage the community
Use education to engage students and staff in reducing gas consumption 2026
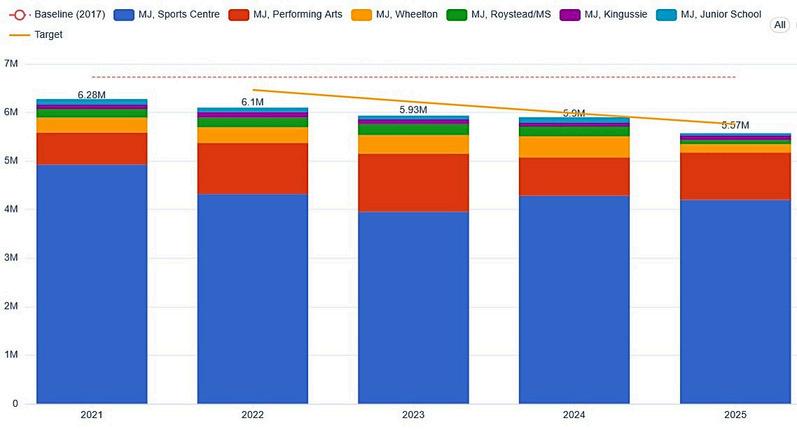
Figure 3 shows the annual gas usage per school building, the 2017 baseline consumption and the Net Zero target There has been a continuous downward trend since the baseline year The Sports Centre is the highest consuming building, due to the gas-heated pool, followed by the Performing Arts building 2025 consumption is 5 6% lower than 2024, 4% under the annual Net Zero target and 17 2% below the baseline
2025 Gas Summary
2025 Actual
5,571,849 MJ consumed 309.41 tonnes of carbon emitted
2025 Performance
5,758,662 MJ target 4% under 2025 gas target
2024 Comparison 5,982,304 MJ consumed 2024 5.6% lower than 2024 usage
Baseline 2022 Comparison 6,725,499 MJ consumed 2017 17.2% lower than 2017 usage
Purchasing & Procurement
2025 Spotlight
In 2025, paper consumption totalled 6,674 5 reams; while 12 8% over the annual target, this marks a 10 1% reduction from 2024 A 50% drop in external printing, driven by digital shifts and fewer Spectemur (school publication) issues, fuelled this trend Conversely, internal printing increased 6% to 5,505 reams (82% of volume) with consistent volumes over Q1-3, dipping during Q4. This represents a 4.4% paper consumption increase from baseline, requiring a review of in-house printing habits in 2026
Waste reduction efforts with Chartwells saw cafeteria landfill packaging significantly reduced by 60% over 18 months through FOGO and recyclable alternatives The School maintained a successful reusable keep cup, mug and container program, inspiring another neighbouring school to adopt the reusable bowl lunch model Additionally, strict procurement guidelines now ensure all school events, such as Open Day and "Friends of" groups' events, prioritise compostable or recycled materials, reinforcing the School's commitment to Net Zero goals.
Purchasing & Procurement Sector Progress
Focus Area Priority/Action
Responsible purchasing & procurement of goods and services
Reduce consumption & Scope 3 emissions
Time frame Status
Incorporate sustainability in the School’s Purchasing & Procurement Policy 2024
Guide vendors and suppliers to Sustainable Purchasing guidelines 2024
Guide vendors and suppliers through the Purchasing & Procurement Policy. 2025
Contract Eastern Press, a carbon nuetral printer for large print jobs. 2022
Commence an inventory of single-use and disposable goods in the School’s supply chain Ongoing
Meet Healthy Eating Standards and expand vegetarian options in the cafeteria 2024
Purchase keep cups and mugs to reduce single use coffee cup usage 2018
Purchase reusable bowls and cutlery to serve Junior School lunch orders 2022
Remove non-recyclable food packaging in the cafeteria. Ongoing
Reduce paper consumption and switch to sustainable sources Ongoing
Commence an inventory of Scope 3 emissions in the School’s supply chain 2026
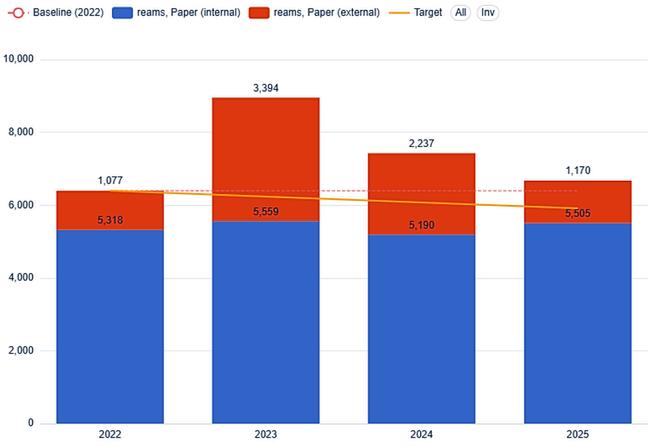
Figure 4 shows the annual internal and external paper usage (2022–2025) "Internal" denotes on-site printing, while "external" refers to publications produced by Eastern Press, a carbon-neutral provider 2022 was determined as the paper baseline year, which determined the Net Zero annual targets
2025 Purchasing & Procurement - Paper Summary
Resource Recovery
2025 Spotlight
In 2025, the School managed 379 8 tonnes of total waste, achieving a commendable 79% recycling rate By diverting 301 6 tonnes from the landfill waste stream, the School successfully met its annual recycling target This success was dominated by garden waste, which accounted for 64% of recycled material, followed by paper and cardboard (8%), commingled goods (4%), FOGO (3%), and container deposit schemes (1%). Key drivers for this performance included the strategic placement of collection bins in public areas and the Facilities team’s commitment to rehoming furniture and fittings rather than utilising landfill skips
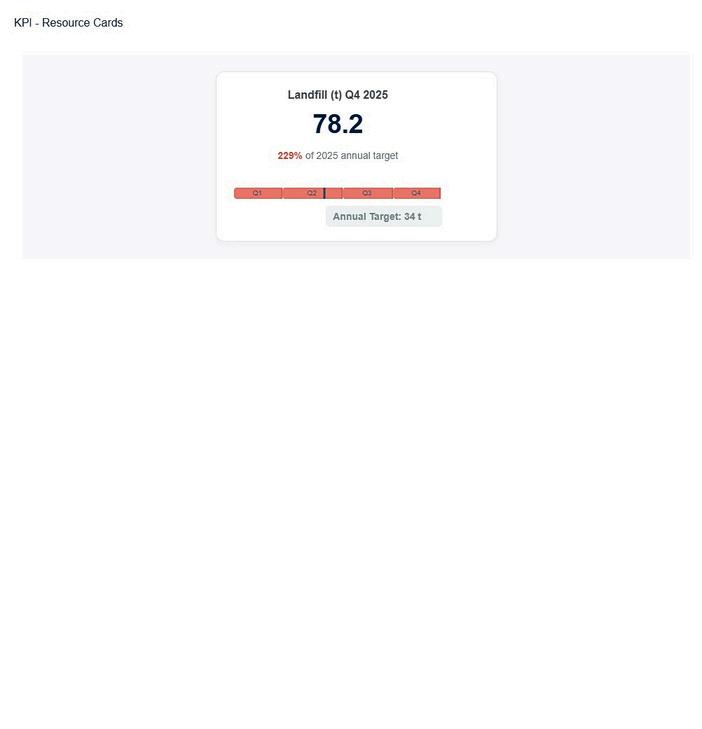
In contrast, the landfill sector significantly underperformed, totalling 78.2 tonnes – a 10% increase over 2024. This figure, which included 9 58 tonnes of bulk construction materials, exceeded the ambitious 32-tonne target by 144% Landfill emissions contributed 110 tCO2e, representing 8% of the School’s total carbon footprint
Moving forward, the School is collaborating with the cafeteria to refine waste reduction strategies. Recent audits highlighted that bin placement directly influences contamination levels, prompting a comprehensive review of signage and communication By researching new disposal innovations, the School aims to bridge the current gap between actual landfill output and its environmental targets
Resource Recovery Sector Progress
Focus Area Priority/Action Time frame
Implement consistent 3-bin station for organics (food), recycling and landfill
Reduce waste to landfill
Reduce single use packaging
Support priorities through purchasing and procurement
2023
Implement Zero Waste hubs to reuse and recycle preloved and preused items 2018
Use clear and consistent signage communications about waste seperation.
2023
Participate in the Victorian Container Deposit Scheme. 2024
Engage students and staff in waste minimisation and circular economy principles. 2024
Implement Zero Landfill Waste Events
Reduce single-use food and beverage packaging
2023
Ongoing
Source products and consumables from suppliers committed to sustainability Ongoing
Prioritise purchasing items that are reusable, recyclable, or easily disposable Ongoing
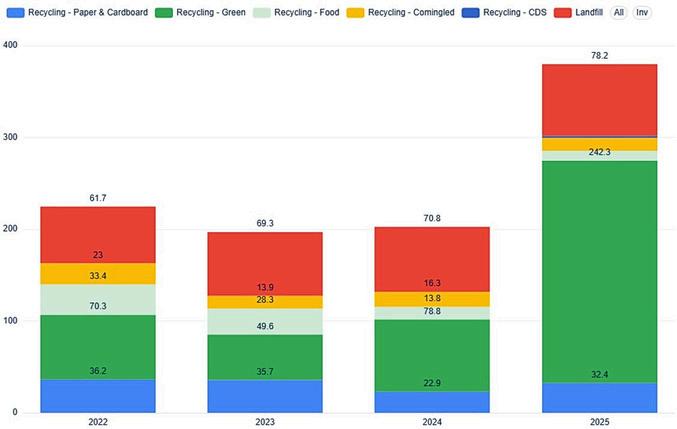
Figure 5 shows the annual collection of landfill and recycled waste (tonnes) - paper and cardboard, green, commingled, food and Container Deposit Scheme (CDS) The significant increase in waste from 2024 to 2025 is due to the change in the tonnage calculation methodology This is explained in Appendix A
2025 Resource Recovery Summary
Transport
2025 Spotlight
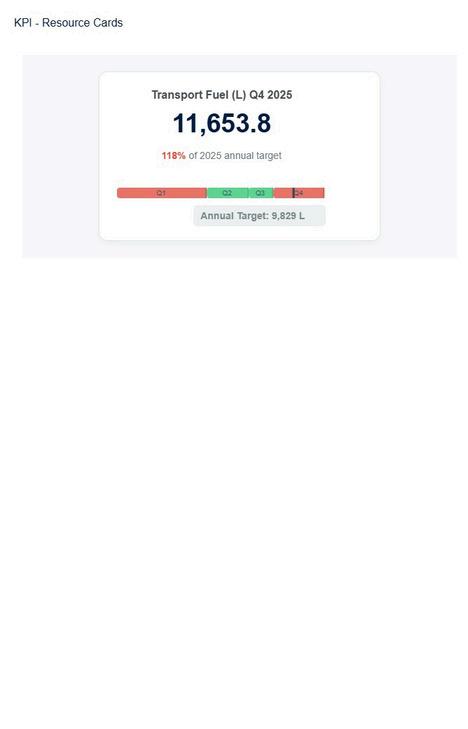
In 2025, there was a notable increase in road transport (litres) and a substantial increase in air travel (kilometres) Road fuel consumption totalled 11,653 litres, emitting 39 tCO2e and exceeding the annual target by 18 6% This represents a 5 7% increase over 2024 and 14% increase since the 2022 baseline year Demand peaked during Quarter 1, accounting for 51% of the annual target due to the heavy camp and tour schedule in March Notably, Quarter 4 consumption exceeded targets by 75 8%, reflecting a shift in program scheduling and an increase in year-end student trips
Air travel reached 198,520 km, a 104% increase since 2024, due to a robust schedule of interstate and overseas tours, including cricket in the UK, music in Europe, and Space Camp in the US Interstate student competitions included Drumline, Robotics and Future Problem-Solving Professional development remained a priority, with staff presenting at global conferences and attending professional events across Australia To maintain the School’s commitment to carbon neutrality, the resulting 228 54 tCO2 in aviation emissions were fully offset through Greenfleet Australia This strategy ensures that vital experiential learning and networking continue, while the School prioritises offsetting emissions from essential activities that cannot be eliminated
Transport Sector Progress Focus
Electric and hybrid vehicles
Digital communications
Transport infrastructure
Hire or purchase electric or hybrid vehicles for education and business travel. Ongoing
Use videoconferencing to substitute travel where suitable Ongoing
Support cycling, scooters and electric vehicles by increasing infrastructure. 2022
Carbon offsetting Offset student and business air transport. 2024
Survey stakeholders to identify barriers and opportunities for sustainable and active travel. 2024
Incentivise sustainable transport in community
Participate in National Ride2School Day. 2024
Incentivise staff and student active transport 2024
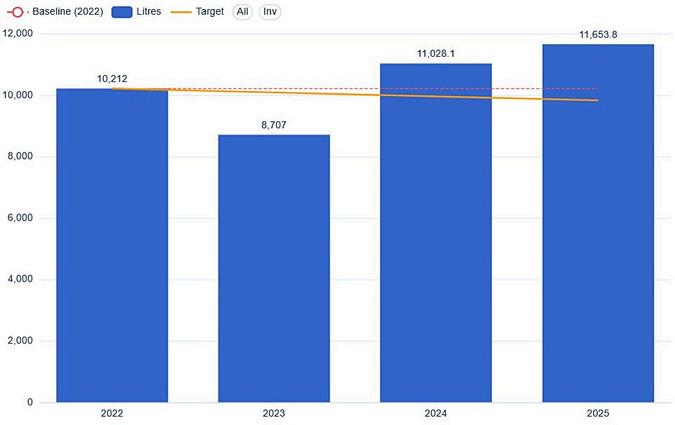
Figure 6 displays road transport fuel consumption relative to the 2022 baseline and Net Zero 2030 targets; monthly data for 2025 is located in the Appendix Air transport figures are also appended; although these have no formal targets, emissions are offset to facilitate continued international educational and professional learning
2025 Road Transport Fuel Summary
2025 Actual
Litres consumed 39.45 tonnes of carbon emitted
Performance 9,829 Litres target 18 57% over 2025 fuel target
Comparison 9,976 Litres consumed 5 7% higher than 2024 usage
Water
2025 Spotlight
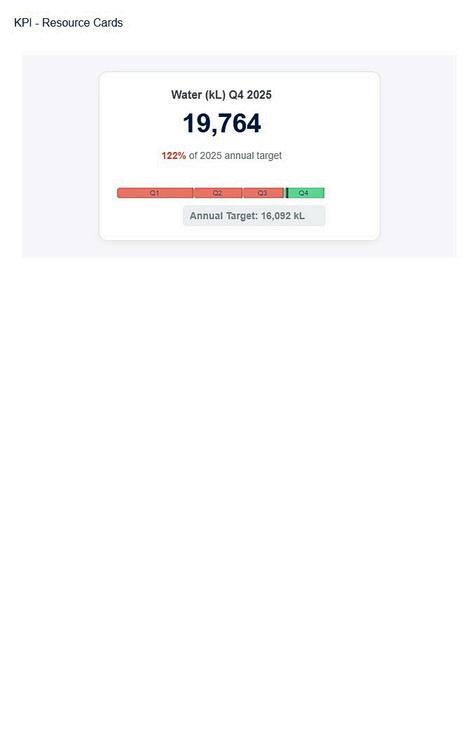
In 2025, total water consumption reached 19,764 kL, resulting in 43 tCO2 emitted Usage peaked in Quarter 1, accounting for 37% of the annual total, before steadily declining to 24% in Quarter 2 and maintaining a lower average of 19% per quarter throughout the second half of the year While the final usage exceeded the annual target of 16,252 9 kL by 22%, the year concluded with a significant 24 16% reduction compared to 2024 and a 1 1% improvement against the 2017 baseline year
This downward trend results from identifying and rectifying infrastructure issues that hampered 2024 efficiency. Enhanced utilisation of the School Water Efficiency Program (SWEP) and Building Management System (BMS) enabled faster response times to high-usage alerts and leaks, contributing to the improved performance observed in the latter half of the year. Furthermore, heavy mulching and planting drought-tolerant native plants ensures a steady decline in water consumption throughout the year.
Water Sector Progress
Focus Area Priority/Action Time frame Status
KAO irrigation system automation and pump upgrade. 2024
Optimise existing rainwater systems
Water efficient design
Optimise rainwater systems via metering, repairs, and expanded reuse connections Ongoing
Map water utilities across the School 2024
Install SWEP loggers on mains and utilise water management 2024
Apply WSUD and integrated water management principles to all refurbishments and new projects Ongoing
Review existing water infrastructure and identify areas of improvment Ongoing
Water efficient standards
Follow the Victorian permanent water saving rules to help manage water efficiency Ongoing
School Water Efficient Program (SWEP) in curriculum 2025
Water education
Embed water conservation and efficiency into curriculum and educational programs. 2025
Promote water stewardship and instill water-saving habits across the School Ongoing
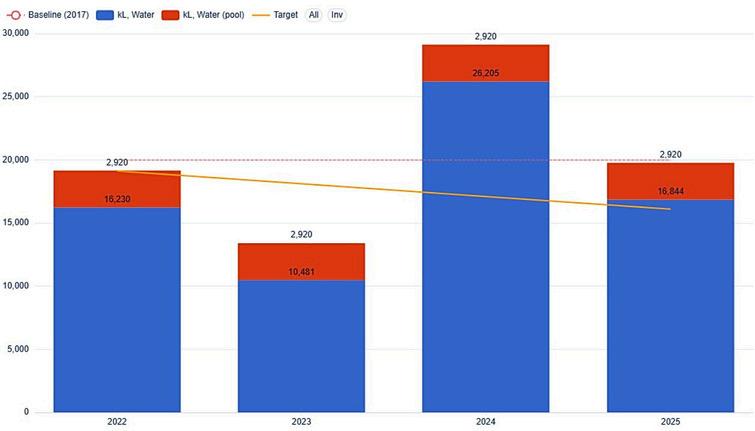
Figure 7 illustrates the annual water usage distribution between the School and the Sports Centre pool water. The 2017 baseline year line and the annual Net Zero by 2030 annual water target are shown. Appendix D details the School’s monthly water consumption results.
2025 Water Summary
Appendix A
Table 4
Greenhouse gas emission boundaries and reported GHG emissions scope
Criteria
Operational Boundary 1, 2 & 3
Acitivity and assets at Camberwell
Grammar School
Electricity 2 & 3
Gas 1 & 3
External facilities Investments Office supplies and consumables Services such as printing, catering, courier marketing
Rationale
Focus is on campus operations with Scope 3 inventory being built out
Transport 3
Scope 2 & 3 of Solar LGCs
Purchased energy from ENGIE is renewable solar and wind
Scope 1 & 3 gas consumption NA
Scope 3 fuel consumption (L) of vehicles hired by the school for student transport (eg student sport)
Scope 3 air travel (km) emissions for student activities and business purposes
Waste 3 Landfill waste FOGO, paper & cardboard, green waste, co-mingled, CDS
Water 3 Reticulated water
Fugitive emissions 1 Refridgerants
Other Scope 3 emissions 3
Scope emissions key
All Scope 3 catergories mentioned in exclusion
Solar generation LGCs are sold to a third party who use the offset This means CGS reports the LGC emissions as an equivalent to grid emissions
Emissions from pool heating, hot water and heating in school buildings
The school supports programs and staff PD, so aviation emissions were fully offset through Greenfleet Australia
Assume 0 GHG emissions from food waste composting and all recycled items
Water processing, distribution and treatment
No data collected
Possible inclusion of Scope 3 in the future
Appendix B
Appendix C
Table 6
Data assumptions and changes for 2025
Appendix D Sector Consumption Graphs
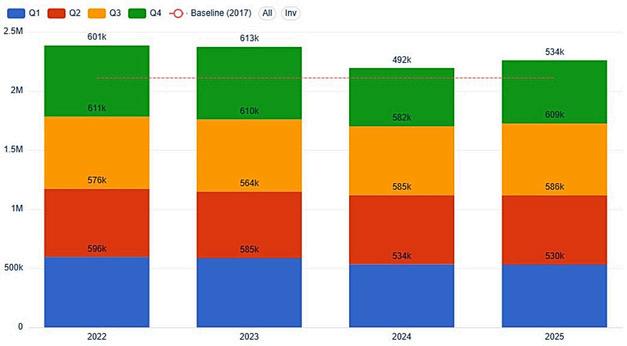
8. Electricity consumption 2022 - 2025 Quarterly (kWh)
Figure 8 tracks quarterly performance from 2022 to 2025 against a 2017 baseline. While 2022 and 2023 consistently exceeded the baseline, 2024 saw a reduction, particularly in Q4 (492kL) However, 2025 shows an increase trend, reflecting the installation of 26 electric hand driers and 11 electric heat pumps, with Q3 being the highest electricity usage period in 2025
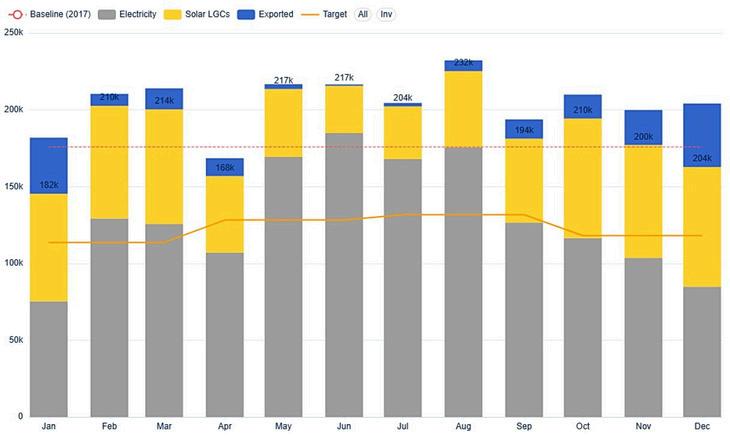
Figure 9. Electricity consumption - 2025 Monthly (kWh)
Figure 9 illustrates monthly electricity metrics against a 2017 baseline and set quarter targets, based on average of 2023/2024 quarter averages. Total output consistently exceeds the target, peaking in August at 232kL. While grid electricity usage fluctuates, solar and exported energy provide a significant contribution, keeping total performance well above the baseline for most months January and December exports were significant due to low demand during school holidays
Figure
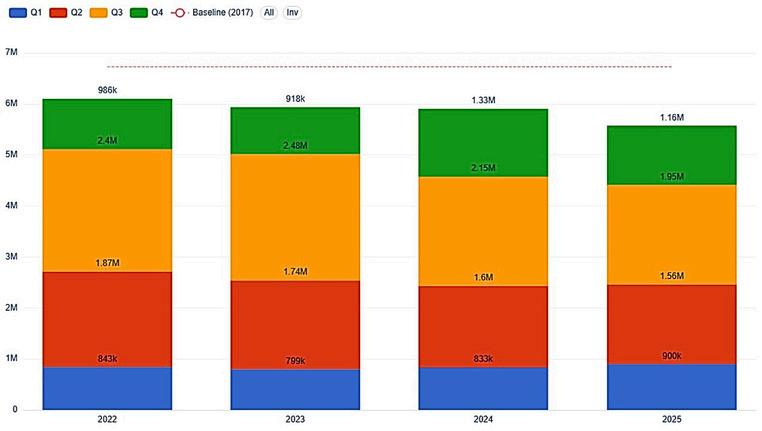
10. Gas consumption - 2022 - 2025 Quarterly (MJ)
Figure 10 shows that annual gas consumption reached a period low in 2025, continuing a steady year-over-year decline Q3 was the highest volume in 2023 The installation of electric hot water heat pumps impacted Q3 and Q4, with notable reductions compared to previous years Total 2025 usage remains significantly below the established historical baseline
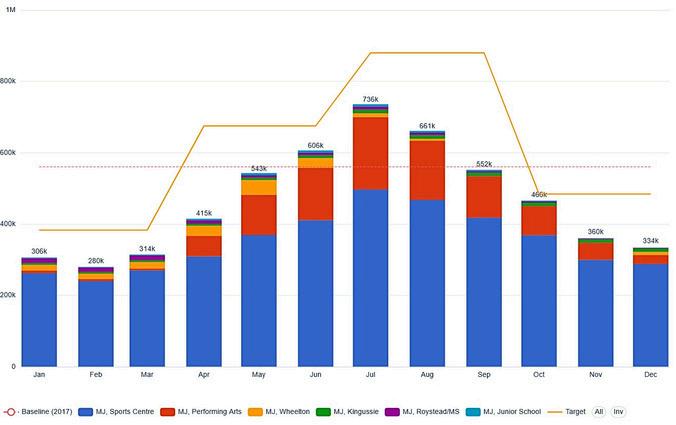
11 Gas consumption - 2025 Monthly (MJ)
Figure 11 Monthly gas consumption peaked in July (736k MJ), driven primarily by the Sports Centre and Performing Arts Centre Usage follows a clear seasonal bell curve, exceeding the 2017 baseline during the mid-year months (June–August) The Sports Centre remains the dominant consumer throughout the year, with February seeing the lowest overall demand Total annual consumption tracked successfully toward Net Zero targets, consistently remaining below the allocated usage threshold
Figure
Figure
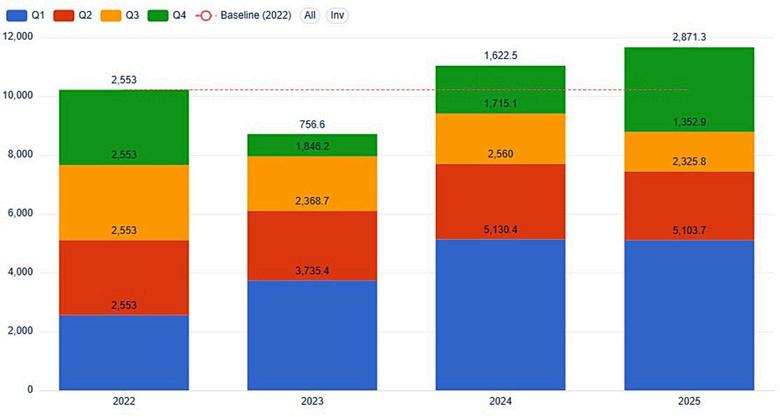
Figure 12 shows road transport figures for 2025 reached a period high, significantly exceeding the 2022 baseline Fuel consumption was the highest in Q1 due to half the annual trips occuring during this period An increase in Q4 was a result of moving trips from Term 3 to Term 4 Overall, the annual trend remains sharply upward
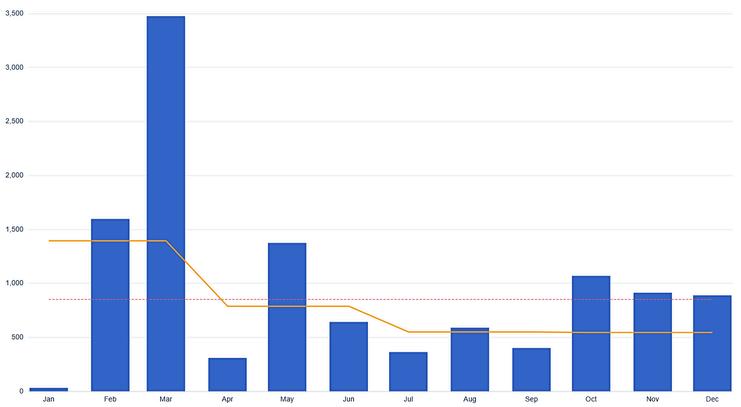
Figure 12. Road transport fuel consumption - 2022 - 2025 Quarterly (Litres)
Figure 13. Road transport fuel consumption - 2025 Monthly (Litres)
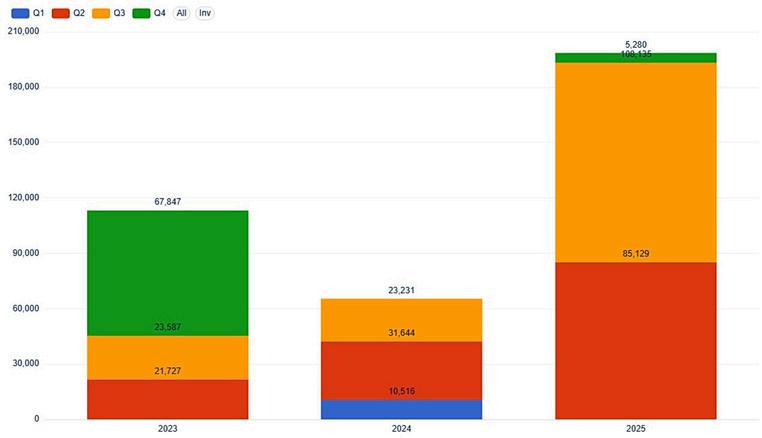
Figure 14 Air transport 2023 - 2025 Quarterly (kilometers)
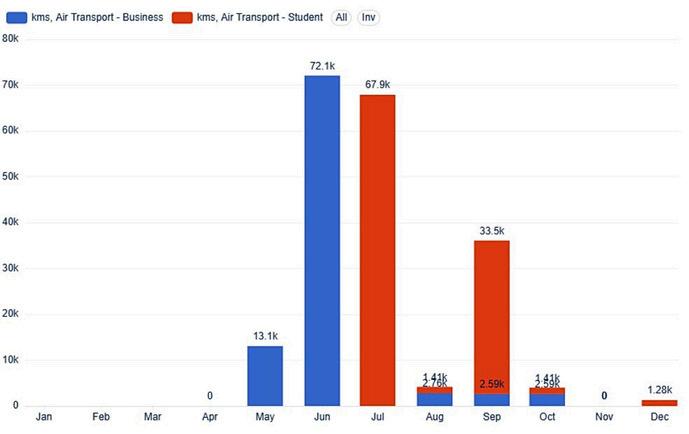
Figure 15. Air transport - 2025 Monthly (kilometres)
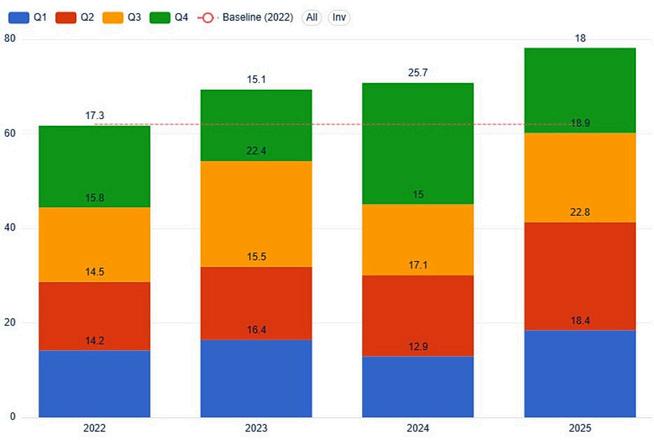
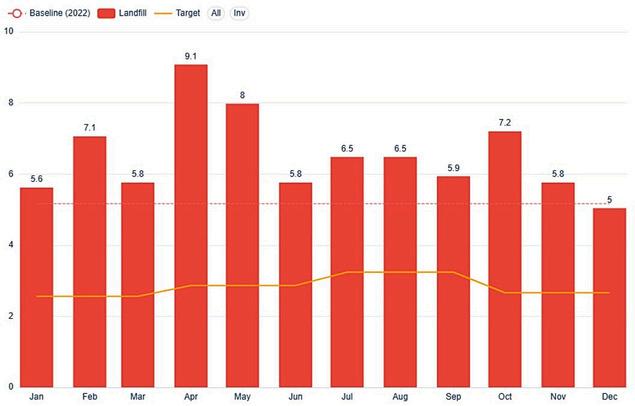
Figure 16. Landfill consumption 2022 - 2025 Quarterly (tonnes)
Figure 17. Landfill consumption - monthly (tonnes)
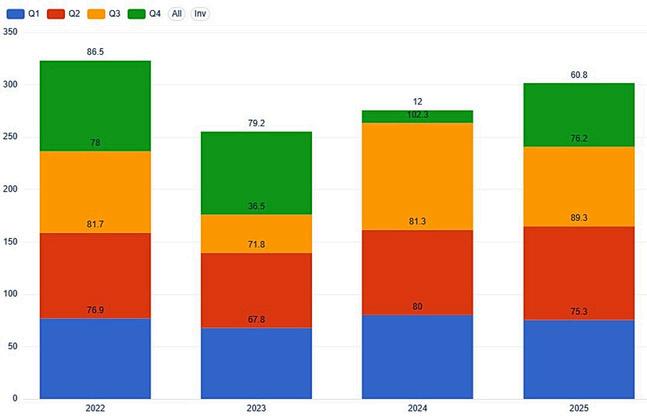
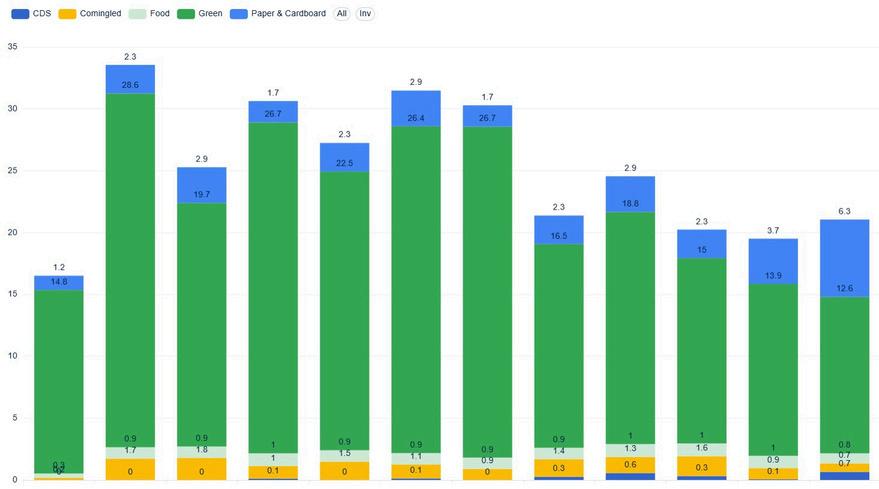
Figure 18. Recycling consumption 2022 - 2025 Quarterly (tonnes)
Figure 19. Recycling consumption - monthly (tonnes)
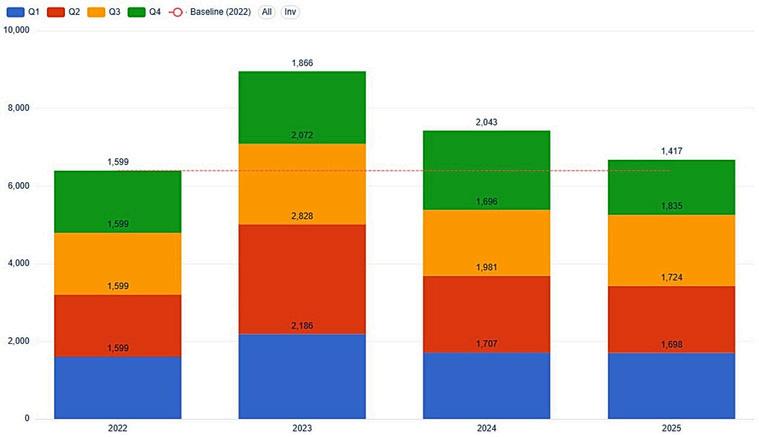
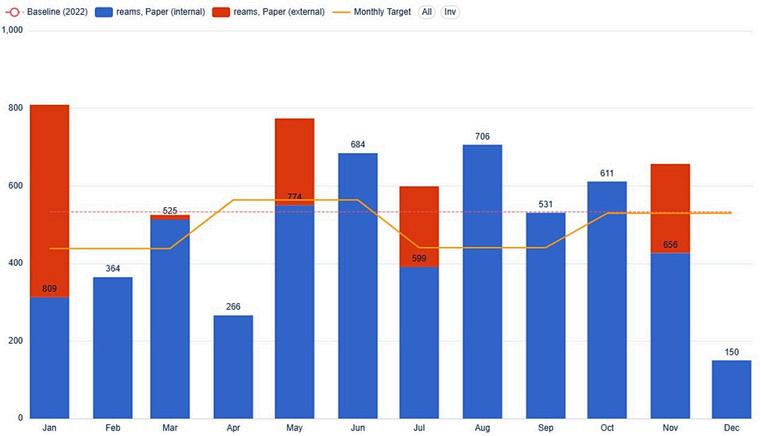
Figure 21 illustrates that monthly paper consumption fluctuated significantly throughout 2025, peaking in January and May due to the production of class booklets and Term 2 practice exams Usage frequently exceeded both the 2022 baseline and monthly targets While internal paper remained the primary driver, external paper contributed substantially to spikes in January, July, and November, reflecting the release of school publications like the Grammarian and Spectemur
Figure 20. Paper consumption 2022 - 2025 Quarterly (reams)
Figure 21. Paper consumption - 2025 Monthly (reams)
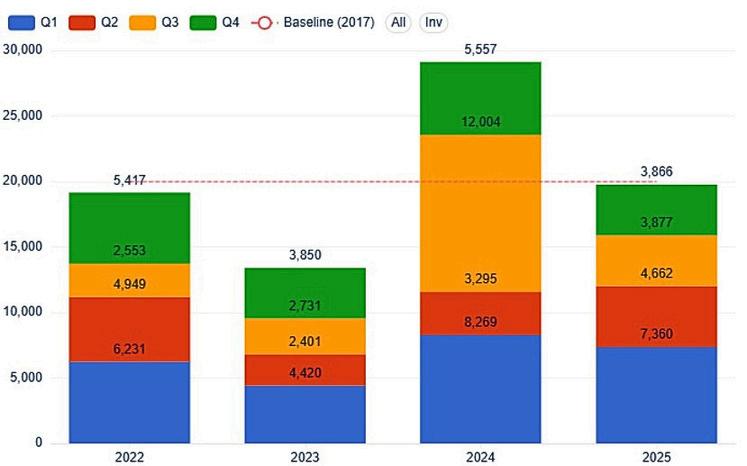
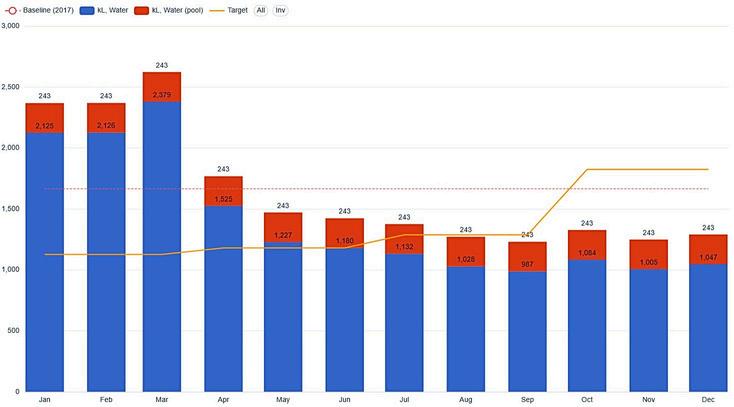
Figure 22. Water consumption 2022 - 2025 Quarterly (kilolitres)
Figure 23 . Water consumption - 2025 Monthly (kilolitres)