Zeroing in on Zero-Emission Trucks
June 2026 Market Update
Overview
By the end of 2025, cumulative zero-emission truck (ZET) deployments in the United States reached 72,309 vehicles, with 12,996 deployments added from July through December, a 99% increase from the 6,526 deployments added in the first half of 2025. This update captures vehicle deployments, including purchased and leased vehicles, for cargo vans, medium-duty (MD) step vans, MD trucks, heavy-duty (HD) trucks, refuse trucks, and yard tractors as of December 2025. After a slower first half of the year, the U.S. ZET market gained momentum in the second half, with ZETs representing 4.14% of all truck deployments from July through December 2025, up from 1.32% in the first half of the year.
Cargo vans remained the largest segment and drove much of the market’s growth in the second half of 2025, rebounding from a weaker first half of the year. After 5,374 cargo van deployments in January through June 2025, the segment added 12,158 more in July through December. At the same time, noncargo-van deployments contributed 838 additional deployments, showing that market growth was not limited to a single segment.
California (12,874), Florida (6,179), and Texas (5,953) are the top 3 states for cumulative ZET deployments, with Florida and Texas swapping places. When adjusting for truck stock and segment, the leading states for normalized ZET scores are California (3.11), New York (.97), and Pennsylvania (.97). These states are performing above the national average and stand out as leaders in ZET adoption relative to market size. Their performance suggests that supportive policy, more favorable economics, and greater awareness and education around ZETs continue to shape where adoption is advancing the quickest.


Total U.S. ZET Deployments 1
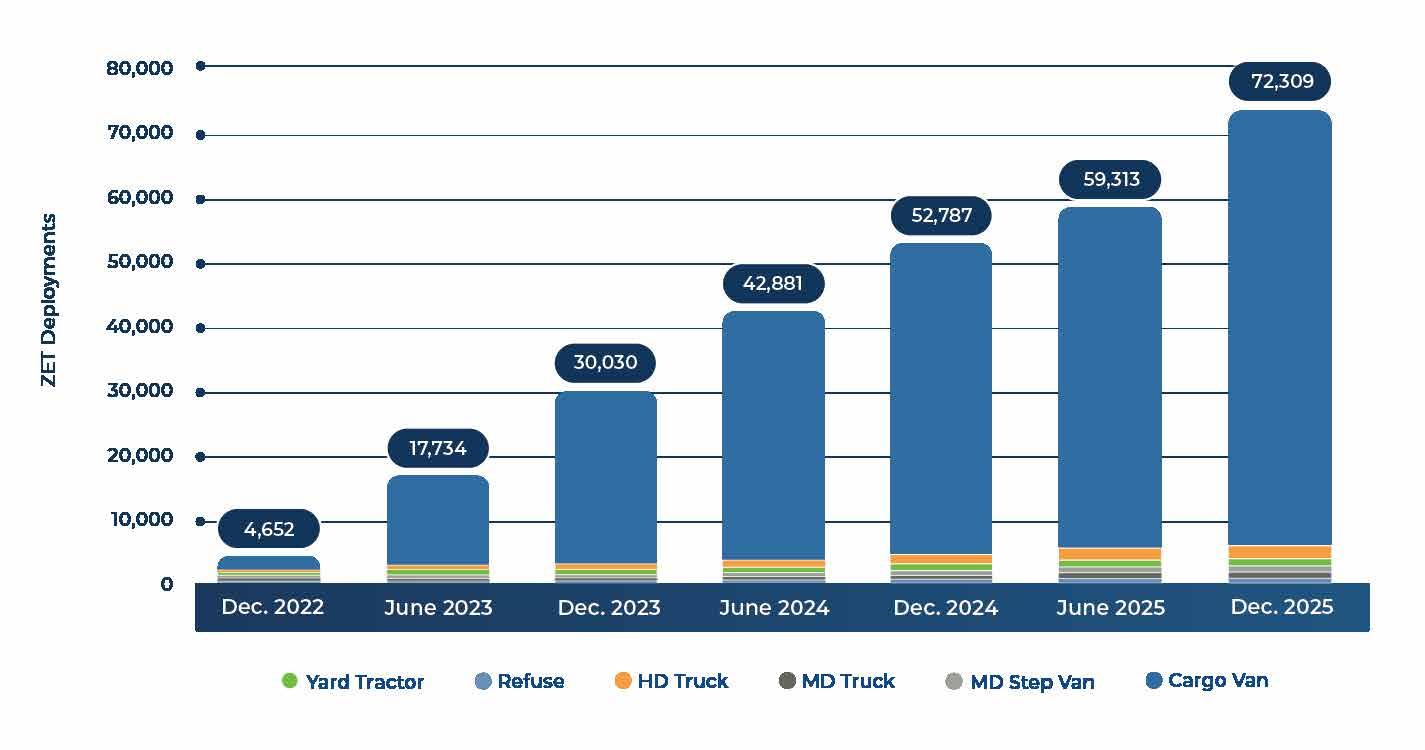
As of December 2025, 72,309 ZETs had been deployed in the United States, across 6 vehicle segments (Figure 1).1 This marks an increase from 52,787 at the end of 2024, meaning the market added 19,522 cumulative deployments over the course of 2025. The second half of the year was especially strong, with 12,996 deployments added between July and December, almost double the 6,526 added in the first half of the year — a 31% year-over-year increase from the same time frame in 2024. The previous year started to see a slowdown in ZET deployments, but the back half of 2025 provided a strong indication that ZETs are still in demand from fleets across the country. Only 1 new hydrogen fuel cell truck was deployed during this time frame, bringing the total to 198, all in the HD truck segment. Challenges with infrastructure, cost, and model
availability prevent hydrogen fuel cell trucks from being adopted more broadly.
In 2025, 120 ZETs were taken out of service and are no longer deployed. But these vehicles may not necessarily be permanently retired; some may have reached the end of a lease, been returned to dealers, entered auction channels, or become available for resale. While still a small number, this movement may signal the early development of a secondary ZET market as vehicles begin cycling beyond their first deployment.
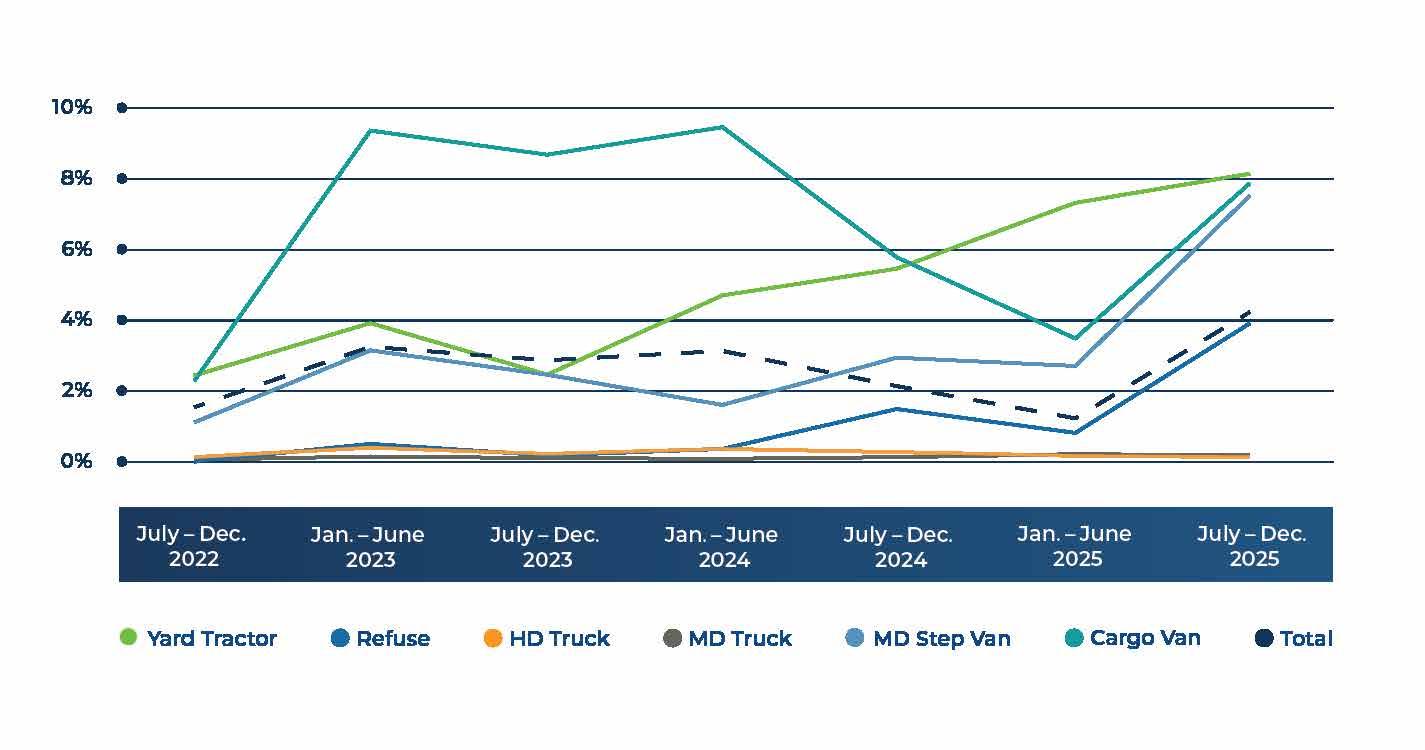
ZET deployments saw their best 6-month performance period to date in the second half of 2025, with a deployment share of 4.14% (Figure 2). The previous high was 3.13%, which was set in the first 6 months of 2023. Total truck sales declined in the back half of the year, with only 314,067 reported sales (-35% year-over-year). Multiple manufacturers, such as PACCAR and Daimler, cited declines in year-over-year sales.
While total truck sales may have dipped, total zero-emission sales did not. This is in part due to a strong
The second half of the year was especially strong, with 12,996 deployments added between July and December, almost double the 6,526 added in the first half of the year — a 31% year-over-year increase from the same time frame in 2024.
1 See the appendix for definitions, data sources, and assumptions made in this market update.

Figure 1: Cumulative U.S. ZET Deployments
rebound from cargo vans, which saw 12,158 new deployments between July and December 2025, their most deployments in a 6-month period to date. The number of cargo van deployments at the start of the year, only 5,374 in the first 6 months, was more than doubled in the back half. This strong rebound could be from fleets taking advantage of expiring
tax credits, greater certainty in business operations after a year of standstill, and greater consumer confidence in zero-emission cargo van technology. Zero-emission cargo vans continue to offer compelling advantages to fleets like ideal dutycycle capability, lower upfront costs, and more streamlined infrastructure for fleets to navigate.
Cargo vans were not alone in making big gains in zero-emission deployment share, with both refuse trucks and MD step vans seeing noticeable increases from our last report (3.02% and 4.94%, respectively). Refuse trucks have recently gained momentum, with early deployments showing a great deal of success, exemplified by initial pilots like Republic Services and Royal Waste. These pilots led to additional deployments; the fleets pointed to operational benefits such as reduced driver fatigue, lower vehicle downtime, and strong performance in start-and-stop duty cycles, in which regenerative braking can help support vehicle range. As fleets continue to pilot zero-emission refuse trucks and gain confidence in their operation, we expect the sector to continue rising in the coming years.
Yard tractors continue to be the leader in zero-emission market share by segment. In the second half of
2025, 219 total zero-emission yard tractors were deployed, representing 8.05% of all yard tractor deployments during that period. This brings the total percentage of zero-emission yard tractors in operation to 3.21%, the most of any segment. The segment has seen an increase in annual deployments every year, and zero-emission yard tractors’ proven operational performance, quick return on investment, and more-manageable infrastructure will help this segment continue trending upward.
Global market trends also highlight how quickly ZET adoption can be scaled under policy and market alignment. In China, new energy HD trucks, including electric, plugin hybrid, and hydrogen-powered vehicles, accounted for 54% of total HD truck sales in December 2025, with more than 45,000 units sold that month. Over the full year, more than 231,000 new energy HD trucks were registered in China, representing a 182% increase from 2024. While these figures reflect a broader category than
Yard tractors continue to be the leader in zero-emission market share by segment. In the second half of 2025, 219 total zero-emission yard tractors were deployed, representing 8.05% of all yard tractor deployments during that period.
ZETs alone, they still underscore the scale and speed at which the HD market can begin to shift when manufacturing capacity, policy support, and market demand are aligned. As the U.S. market continues to develop, this global comparison highlights both the size of the opportunity and importance of maintaining momentum through supportive policy, infrastructure investment, and continued market development.
Despite the slowdown in overall truck deployments, zero-emission deployments did not slow down in the back half of 2025. With a deployment share of 2.44% for all of 2025, the annual ZET deployment share did not deviate from the 2 previous years. 2026 will be a decisive year for understanding how ZET adoption will trend in the near future. An uptick was expected with the federal tax credits expiring on September 30, 2025, though ZET demand may continue to increase; in fact, Harbinger stated their sales surged after the tax credit expired.

States can further accelerate ZET adoption by implementing solutions outlined in the ZET Ahead Dashboard, whether that solution is a Low Carbon Fuel Standard, a zeroemission delivery zone, a workforce training program, or any other policy that helps make it more practical for fleets to deploy ZETs. Future deployment trends will rely on a clearer business case for ZETs and how effectively states use policy, infrastructure planning, and fleet engagement to accelerate ZET adoption.
U.S. ZET
Deployments by State 2
2.1 Total Deployments
State-level deployment patterns continue to reflect where policy support, freight activity, and market readiness overlap. California (12,874), Florida (6,179), and Texas (5,953) are the top 3 states for cumulative
ZET deployments through the end of 2025. This trend remains the same from previous editions, as the majority of ZET deployments are
Top Five States for Total ZET Deployments:
1. California: 12,874
2. Florida: 6,179
3. Texas: 5,953
4. New York: 3,923
5. New Jersey: 3,079
concentrated in states with large truck stock populations. Beyond these leading states, the market is continuing to spread more broadly across the country. Twenty-two states now have more than 1,000 ZET deployments, up from 18 in the last market update. Colorado, Indiana, Oregon, and Tennessee each crossed 1,000 deployments, while Illinois, Michigan, and Washington each surpassed 2,000 cumulative deployments. Together, these results indicate that, although the largest share of deployment remains concentrated in a small number of leading states, ZET adoption is becoming more widely distributed across the country.
The top 3 states also saw the largest 6-month increases in ZET deployments. However, California, Florida, and Texas were not the leaders in all 2025 ZET deployments; North Carolina (1,103) outpaced Texas (944) for third on the annual leaderboard. Louisiana; Alabama; Mississippi; Washington, D.C.; Iowa;
and Idaho were the only states to more than double their total ZET deployments in the past year.
2.2 Normalized ZET Deployments
While total deployment counts show where the largest number of ZETs are located, these numbers do not fully account for differences in state truck stock or fleet composition. To better understand where adoption is advancing relative to market size, we also looked at normalized ZET scores. A positive number means the state is performing better than the national average, while a negative number means a state is performing below the national average, where 0 is the national average.2
When normalizing ZET deployments for vehicle stock and segment, the leaders are California (3.11), New York (.97), and Pennsylvania (.97). These are the states where ZET adoption is most above the national average, indicating which states are most effectively accelerating ZET adoption. Normalizing ZET deployments by
segment offers a fairer way to assess a state’s true progress and, in doing so, better understand how states are performing in the ZET transition.
One change in our methodology from the last report was to account for states with a higher concentration of large fleets, because we noticed that states with a higher concentration of larger fleets all scored higher in their normalized ZET score. Previous research confirmed that large fleets will drive early ZET deployments; however, this can create an uneven playing field when assessing states that are doing the most to accelerate ZET deployments. A state with a small concentration of large fleets cannot be carried by a single fleet and therefore would go unnoticed in our previous method to evaluate their market acceleration efforts. Figure 3 shows the normalized score of each state.
Normalized ZET score leaders have changed from our last report, with New York and Pennsylvania both
2. The appendix contains a full explanation of how we calculate normalized ZET scores and how to interpret the results.
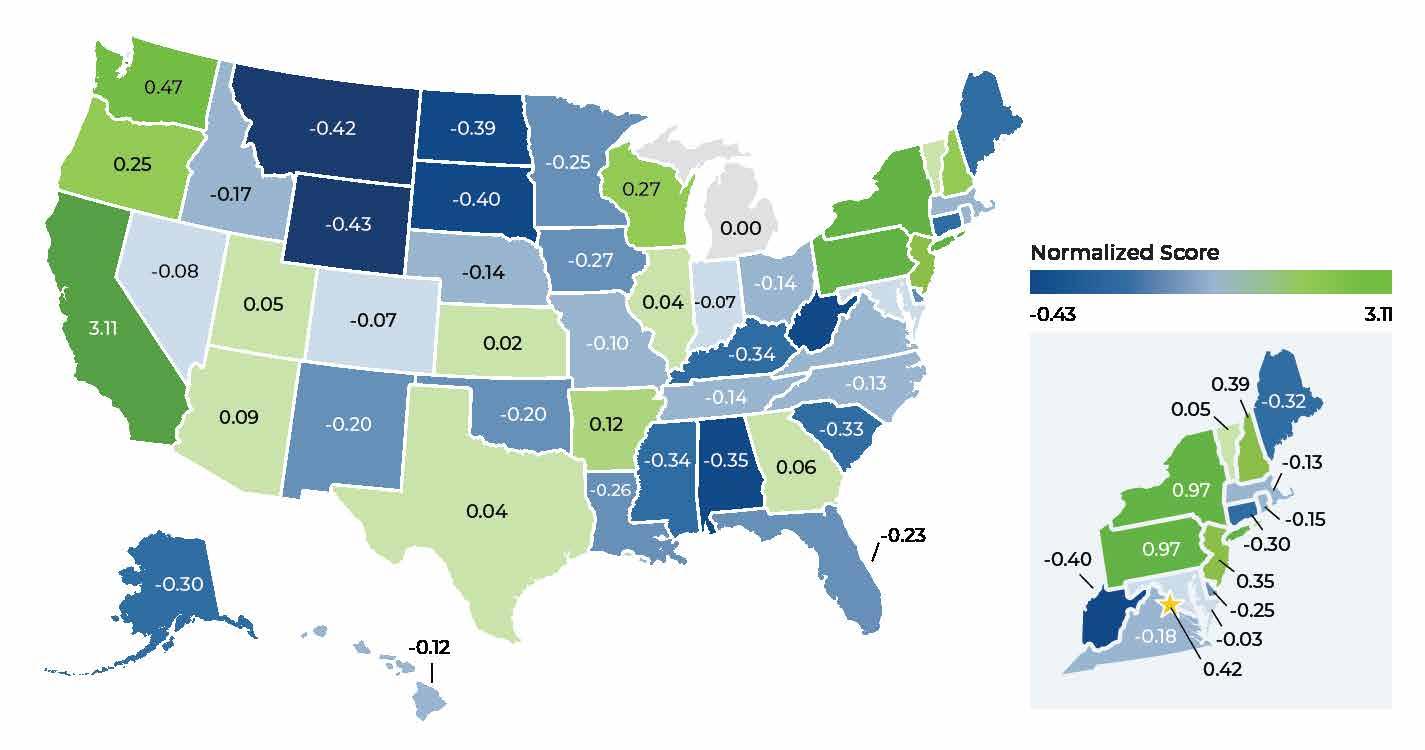
Note: For the normalized ZET score, 0 represents the national average, positive scores indicate above-average performance, and negative scores indicate below-average performance.
U.S. ZET Deployments by State jumping into the top three. Both states had positive ZET scores in the last report and above-average ZET deployment numbers in the back half of 2025. But, crucially, New York and Pennsylvania have both started to deploy a greater diversity of vehicle segments. Our methodology change did help boost these states’ normalized scores as well, as both were in the bottom half of large fleet concentration. Washington remains in the top five, but Wisconsin, New Jersey, and Georgia all dropped out; because of their still-positive ZET score, all three states did not drop far out of the top five. Wisconsin, New Jersey, and Georgia all continue to deploy ZETs at an impressive rate but do have a higher concentration of large fleets, which lowered their scores in our updated model.
New York and Pennsylvania are comparable states. Both are in the top 10 for truck stock, have a very similar fleet composition, and are in the Northeast with similar economic aspects such as electricity
Top Five States for Normalized ZET Deployments:
and fuel pricing. New York has also established a long-standing incentive program, the New York Truck Voucher Incentive Program (NYTVIP), and Pennsylvania has offered many different incentive opportunities as well, PA-FIT being the most recent.3 Both states have taken extra steps to ensure the ZET ecosystem is in place with workforce development, infrastructure make-
3 See the Funding Finder at https://fundingfindertool.org/ for a list of incentive programs in the United States.
ready programs, and statewide clean transportation planning. These factors have undoubtedly helped both states punch above their weight and lead in accelerating ZET deployments for fleets.
California’s continued leadership reflects a more mature policy ecosystem with a wide range of complementary policy approaches
to support ZET adoption. The state has combined long-standing vehicle purchase incentives, infrastructure support, and market-development policies that together make ZET adoption more practical for fleets. Programs such as the Clean Bus and Truck Incentive Voucher Project (HVIP) and Energy Infrastructure Incentives for Zero-Emission program (EnergIIZE) help reduce upfront vehicle and infrastructure costs through point-of-sale vouchers. Broader innovative policies like the Low Carbon Fuel Standard and Cap-and-Trade program help spur investment into zero-emission technology. These policies were guided by extensive planning through multiple zero-emission roadmaps and the state setting emission reduction targets early to align fleets, original equipment manufacturers, infrastructure providers, and others in their investments. These types of policies are not unique to California and can provide a framework for other states looking to accelerate ZET adoption.
Normalizing ZET deployments offers a more accurate picture of state-by-state progress. By leveling the playing field, we can identify true leaders in adoption and spotlight where additional support may be needed.
Florida and Texas both remain outside the top-performing states for normalized ZET score, with scores of .-23 and .04, respectively. Despite their large cumulative deployments, most of those deployments are cargo vans, which are not keeping pace with both states’ large truck stock populations. This contrast highlights an important distinction between total deployments and relative market progress. States with large truck stock populations can inflate ZET deployment counts and dilute relative performance, making normalized scores especially useful for separating market size from true market momentum and for showing where adoption is occurring more broadly across different vehicle segments.

Normalizing ZET deployments offers a more accurate picture of stateby-state progress. By leveling the playing field, we can identify true leaders in adoption and spotlight where additional support may be needed. Our team will continue to refine our model and approach in future iterations of the report to better understand where and why ZET adoption is accelerating across the country.