2 minute read
Appendix B: MRI Methodology

Similar to the TRL methodology, determining a market readiness score begins with the internal CALSTART team, which consists of subject matter experts with expertise in at least one vehicle or equipment segment. This team identifies vehicle and equipment platforms that have scored an eight or above with respect to technology readiness to be assessed for market readiness. Members of the internal CALSTART team assess and record each vehicle or equipment segment’s market readiness on a scale of 0% to 100%, in 25% increments, for each of the six indicators described in detail below. Scores are assessed according to the scoring rubric, which is found below.
Market Readiness Scoring Rubric
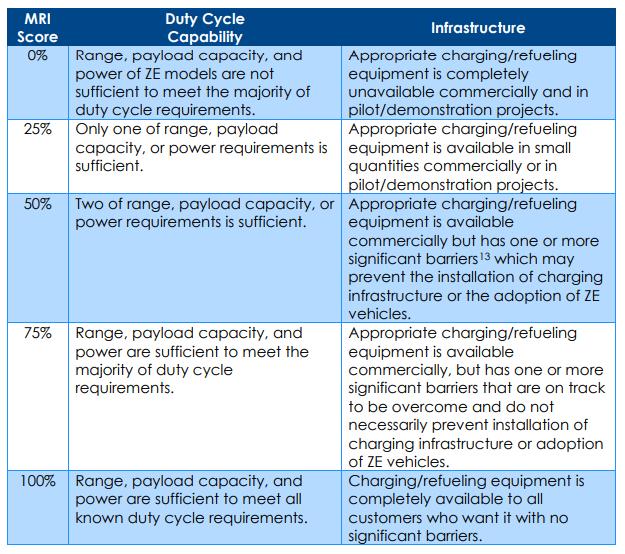
Infrastructure
This category measures the extent to which charging or refueling infrastructure is available and easy to install for a given on- or off-road vehicle platform. A score of 0% represents the case where the appropriate charging or refueling infrastructure is completely unavailable commercially or in pilot/demonstration projects. A score of 100%, on the other hand, represents the case where charging or refueling equipment is completely available.
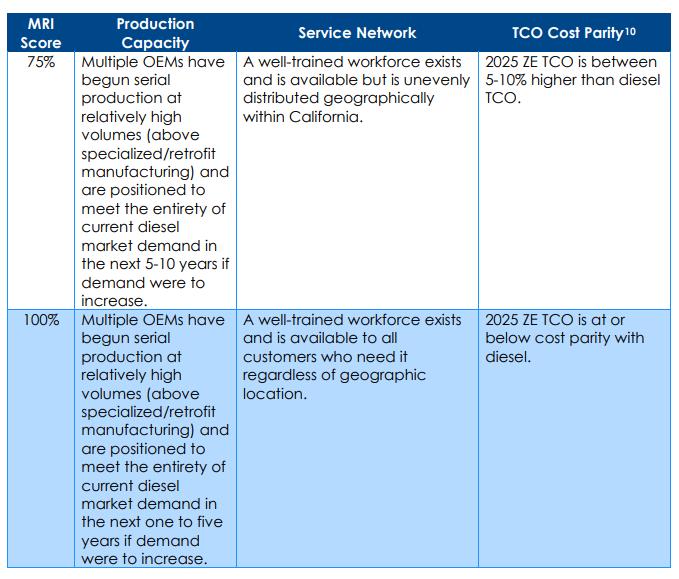
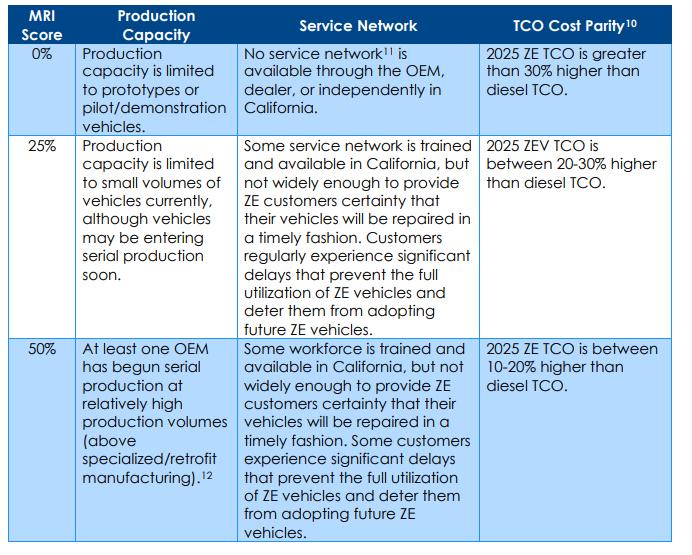
Service Network
Service network measures the existence and accessibility of a workforce for maintenance and repair of the ZE vehicles and equipment. A score of 0% corresponds to the case where no service network is available through the OEM, dealer, or independently in California. A score of 100% corresponds to the case where a developed service network exists that is geographically distributed to serve demand; there are no wait times significant enough to inhibit uptime of the vehicles and equipment.
Production Capacity
This category estimates the current manufacturing capacity of an on- or off-road technology segment, where 0% represents production limited to pilot/demonstration vehicles, while 100% represents the case where multiple OEMs have begun serial production at relatively high volumes and are positioned to meet the entirety of current diesel market demand in the next one to five years.
TCO Cost Parity (With and Without Incentives)
Cost parity is a measure of the difference between ZE TCO and diesel or gasoline TCO. CALSTART conducted TCO analysis on ESBs. The assumptions used in the ESB TCO calculations are displayed below:
Two ESB TCO cases are presented. The first case is “Cost Parity,” which compares the TCO of ESBs directly to traditional buses. The second case is “Cost Parity with Incentives,” under which the TCO calculations for ESBs take into account LCFS credits that are awarded and incentive funding from HVIP. All TCOs are based on projected ESB capital costs in 2025. For both TCO categories, a score of 0% corresponds to the case where the ZE TCO is greater than 30% higher than diesel TCO. A score of 100% corresponds to the case where the ZE TCO is at or below cost parity with diesel.
Duty Cycle Applicability
Duty cycle applicability measures how well a given technology platform can meet the range of duty cycles required of it. For on-road vehicles, a score of 0% represents the case where range, payload capacity, and power of ZE models are not sufficient to meet the majority of duty cycle requirements, while a score of 100% means that ZE models can meet all known requirements. For off-road technologies, a 100% score corresponds to the case where power, lift capacity, and operating time of ZE models are sufficient to meet duty cycle requirements.
MRI Rubric
The rubric used to determine scores for MRI is included below.