8 minute read
Anticipating Dramatic Growth in the Number of older Californians


By Hans Johnson, Eric McGhee, Paulette Cha, and Shannon McConville, with research support from Shalini Mustala
The Population of Older Californians Will Continue to Grow and Diversify. The significant shifts in California’s demographic landscape over the past two decades are projected to continue and even accelerate through 2040. Several key factors are driving these changes: the aging of the baby boom generation, increased longevity, and the long-term effects of past immigration patterns.
The baby boom, from 1946 to 1964, created exceptionally large population cohorts that are now entering older ages. The youngest baby boomers are now 60 years old while the oldest are 78. In 2040, the youngest will be 76 and the oldest will be 94. As this generation ages, the older adult population is increasing significantly. Because of advances in health care and improved living conditions, people are living longer, but they are also living through more disabled years (Tesch-Römer and Wahl 2016).
It is important to note that the COVID-19 pandemic caused a brief— and traumatic—deviation from the long-term pattern of increases in life expectancy. The latest estimates suggest that life expectancy has resumed its pre-pandemic trend of gradually increasing longevity. (1) The Department of Finance projects moderate increases in life expectancies through 2060.
California’s Older Adult Population Will Increase Dramatically By 2040. California’s older adult population (aged 65 and over) is projected to increase by a remarkable 59 percent, from 5.7 million to just over nine million. This growth stands in stark contrast to the projected changes in other age groups. The working-age population (20–64 years old) is expected to increase only three percent, while the population under age 20 is anticipated to decrease by 23 percent. California is projected to have 3.4 million more older adults aged 65 and over, and 1.7 million fewer residents less than 65 years old.
This disproportionate growth in the older population will lead to a significant shift in the state’s age structure. Almost one-quarter of Californians (22%) will be age 65 or older by 2040, a substantial increase from 14 percent in 2020. The old-age dependency ratio (the number of older adults per 100 adults of working ages) is projected to grow from 24 to 38.(2) In other words, there will be 38 older adults for every 100 working adults in the state.
The most dramatic growth is projected among the oldest age groups— or the oldest old (Figure 1). The population aged 80 and over is expected to more than double, increasing by nearly 1.8 million in 2040. This rapid growth in the oldest age groups, driven by both the aging of baby boomers and increases in longevity, is especially significant because of this group’s relatively high personal care and health care needs. The dramatic population increase for this group overwhelms any improvements in well-being. For example, there will be so many more very old Californians that reductions in the share with self-care limitations will not counterbalance a dramatic increase in care needs.
Declines in the state’s child population reflect low birth rates. Like the rest of the United States and most developed countries in the world, California has experienced a sustained decline in birth rates. In California, the total fertility rate—the average number of births in a woman’s lifetime—has fallen from 2.15 in 2008 (just above the level needed to replace the population) to 1.47 in 2020. The Department of Finance (DOF) projects that these low levels of fertility will persist into the future.
Declines in the population aged 16 to 64 are driven primarily by interstate out-migration. For several decades, California has experienced substantial net outflows to other states, particularly among less-educated Californians. International immigration to the state counterbalanced some of this population decline, but the flow of immigrants has been modest in recent years.
Growth in the Older Adult Population Will Vary Across Counties. While all regions of the state will be impacted by growth in the older adult population, regional differences are a key consideration for planning and policy. The DOF population projections provide information at the county level, which we use to provide a high-level picture of how older adults will be distributed across the state.
Increases in the population of adults 65 and older in the Far North region of the state will be much lower than the statewide average. Several counties near the northern border are projected to see little or no growth—including Shasta, one of the largest counties in the region. Many Bay Area counties—including Alameda, Santa Clara, and Contra Costa—will see growth rates in the 70 to 80 percent range. In contrast, counties in the Central Valley (e.g., Kern, Stanislaus, Fresno, and Kings) are projected to have lower than average growth (about 40%), as are Central Coast counties including Santa Barbara and San Luis Obispo. Most large Southern California counties, including Los Angeles, will see increases around the state average (60%); this is not surprising, given that such a large share of the state’s population resides in that region.
When we look at growth among adults aged 85 and older, the regional patterns shift somewhat. Northern California regions stand out with some of the largest increases; in a few counties—including Mendocino, Trinity, and Plumas—the over-85 population will more than triple by 2040. Most large Bay Area and Southern California counties will see their populations age 85 and older more than double. Although counties such as Fresno and Stanislaus will have lower than average increases in older adults, they will see considerable growth (80%) in this age group.
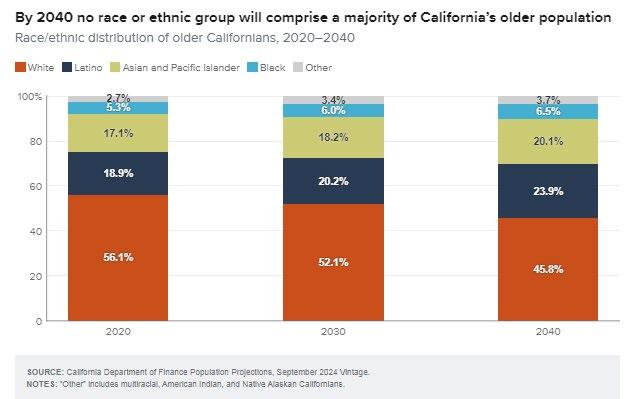
The racial/ethnic composition of California’s older adult population is projected to become increasingly heterogeneous, with no single racial or ethnic group constituting a majority of the older adult population. The number of Latino, Asian, and Black older Californians is expected to double or nearly double by 2040, while the older white population will increase by 30 percent. While whites are projected to remain the largest racial/ethnic group of older adults, their relative share will decrease as other groups grow more rapidly (Figure 3).
California’s Older Adult Population Will Be Diverse.
A key driver of diversity among older adults is the dramatic increase in immigrants from Latin America and Asia in the 1980s. Upon arrival most were young adults, primarily in their 20s and 30s. Those early large cohorts of immigrant arrivals from the 1980s are now in their 50s and 60s, beginning to fundamentally alter the ethnic composition of California’s older population.
It is worth noting that in recent years, migration of older adults, both international and domestic, has not been a primary driver of the growth and diversity of California’s older population.(3) Instead, the growth in the state’s older population is primarily driven by the aging of existing residents, including those who immigrated decades ago, and their increased life expectancy.
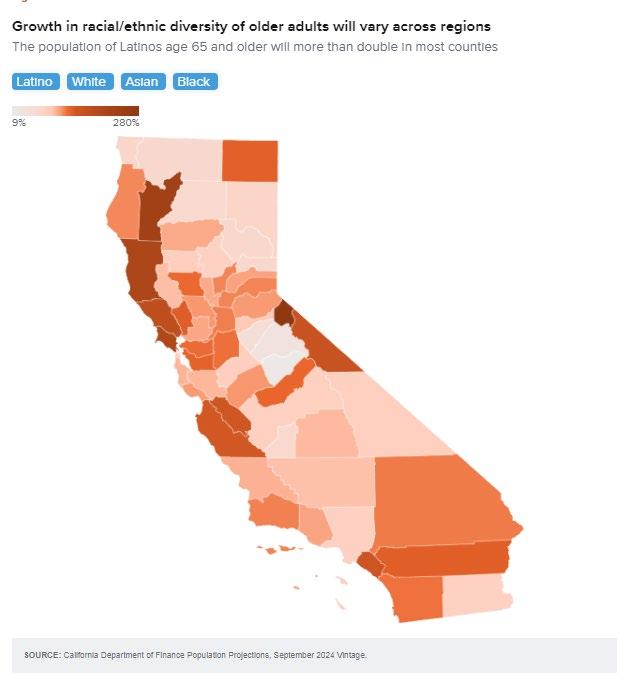
There will also be variation across the state in racial and ethnic changes in the population of older adults (Figure 4). In 2020, only 12 counties did not have a majority-white older adult population; by 2040 that number doubles to 24 counties. As previously discussed, the population of adults 65 and older who identify as Latino and Asian and Pacific Islander will more than double by 2040 and the older Black population will nearly double (90% increase). Counties that will see the highest growth rates in Latino older adults include relatively smaller counties like Mendocino and Marin, along with larger counties such as Monterey and Orange. Among Asian older adults, Santa Clara County will have one of the highest increases, with the number of adults aged 65 and older of Asian and Pacific Islander descent growing from about 98,000 to nearly 225,000.
The share of older adults who are foreign born is expected to increase to over 40 percent by 2040 (compared to 29% in 2020), again reflecting immigration patterns from decades ago. The largest increases will be among 65 to-74-year-olds (Figure 5). The majority of Latino older adults (59%) will be foreign-born, similar to levels today. Almost 9 of 10 Asian older adults will be foreign born. Again, these levels are similar to those of today.
Consistent with trends in population gains among foreign-born older adults, the share of older adults who speak a language other than English at home is projected to increase from 35 percent to 42 percent. According to 2021 and 2022 American Community Survey data, Spanish is the most common language spoken by older adults who speak a language other than English at home (46.9%), followed by Chinese languages, Mandarin or Cantonese (12.1%), Filipino or Tagalog (10.4%), Vietnamese (5.1%), Korean (3.8%), and Hindi and related languages (3.7%). Latino and Asian older adults will remain especially likely to speak a language other than English at home, although both shares are projected to be slightly smaller.