Exploring the Relationship Between Sunspot Activity and Wheat, Rice, and Corn Production Using Time-Series Analysis and Moving Averages
Ryan Song
Senior Thesis | 2026

Exploring the Relationship Between Sunspot Activity and Wheat, Rice, and Corn Production Using Time-Series Analysis and Moving Averages
Ryan J. Song1
Antonios E. Marsellos2
1 Boston University Academy, 1 University Rd, Boston, MA 02215
2Dept. Geology, Environment and Sustainability, Hofstra University, Hempstead, NY, USA
Acknowledgements:
IwouldliketothankDr.AntoniosE.Marsellosandthe Geology,Environment,andSustainabilitydepartmentat HofstraUniversityforprovidingmewiththenecessarytools toconductthisresearch.
Abstract
This project examines the association of sunspots on the yields of wheat, corn, and rice, three staple crops that provide roughly half the calories consumed by humanity (Poutanen et al., 2022). Sunspots are temporary phenomena on the Sun’s surface that are associated with increased solar output, thereby affecting Earth’s temperature and exposure to solar radiation. Sunspots follow an 11-year solar cycle and may influence food production. The correlation between sunspot activity and crop yield data was analyzed using publicly available sources from the Global Surface Summary of the Day (GSOD) and the U.S. Department of Agriculture (USDA). From 1960 to 2000, results showed a strong positive correlation between detrended sunspot activity and wheat and rice yields (r = 0.619, r = 0.712), whereas corn yields and sunspots showed a strong negative correlation (r = -0.671). Compared to rice and wheat, corn yields showed significantly greater variation in output during the analysis period, suggesting that other factors may have affected the supply. After 2000, however, these correlations weakened in all three crops. Advances in agricultural technology, such as precision agriculture and the widespread adoption of genetically modified organisms (GMOs) in commercial crop production, may be why the correlations diverged after 2000. These findings support the hypothesis that periods of high sunspot activity are associated with higher wheat and rice yields to a point. However, over the past 20 years, other
factors may have impacted the wheat yield data independent of sunspot activity.
Background:
Sunspots are temporary dark spots on the Sun that indicate an increase in solar energy associated with higher temperature and solar radiation (Figure 1: Solar Cycles).
Sunspots are visible to the naked eye, and astronomers have recorded sunspot activity for 500 years. Sunspots serve as a proxy for periods of increased solar activity and irradiance, potentially impacting agricultural productivity.
Sunspots occur more frequently during periods of high magnetic activity on the sun, when the sun’s magnetic polarity reverses, resulting in increased radiation and overall total energy. The Sun’s magnetic polarity typically changes every 11 years, forming a Solar Cycle of increased and reduced solar output that is measurable and has been recorded through much of history (Figure 2: Sun’s Energy (Total solar irradiance)). The variation is only about 0.07 to 0.15% between solar maximum and solar minimum, but given the importance of solar irradiation to Earth, the total change in energy delivered is immense (Lindsey, 2025).
Understanding solar variability is critically important because the vast majority of the energy delivered to Earth comes from the Sun. About 342 watts/meter2 of solar energy is delivered annually on every square meter of the Earth’s surface, and the total amount of solar energy is approximately 44 quadrillion (4.4x10¹⁶) watts annually (Lindsey, 2025). The sun’s radiative energy is not static, but fluctuates, with sunspots recognized as an early indicator of changes in solar energy and associated with increased solar
irradiation. Solar wind is created by the constant stream of charged particles from the sun and is recorded by satellites in the upper atmosphere. Total and spectral solar irradiance (TSI and SSI) have been measured since the 1970s (Chatzistergos et al., 2024). Irradiance is measured at the top of Earth’s atmosphere and normalized to the mean Sun-Earth distance (1AU). Long and reliable records of solar surface magnetism as well as of TSI and SSI are crucial for understanding the role of the Sun in climate change (Mohr, n.d.).
Variations in the sun's brightness are due to the evolution of solar surface magnetic regions, most prominently sunspots and faculae. Sunspots are regions with strong magnetic fields that suppress the flow of hot plasma that releases solar energy, and thus the magnetic fields darken and cool their surroundings. In contrast, faculae are ensembles of smaller and brighter magnetic elements. On average, they cover greater areas on the solar surface than sunspots. Faculae typically surround sunspots, but facular elements also form bright regions away from sunspots (The Solar Cycle, a Heartbeat of Stellar Energy, 2025).
Increased sunspot activity is observable and tangible on Earth through atmospheric phenomena like the Aurora Borealis and Australis (Northern and Southern Lights). High sunspot activity causes more and stronger geomagnetic storms, which can induce currents in power lines, increase the drag on low-Earth orbit satellites and cause orbital decay, and damage sensitive electrical instruments (Blumenfeld, 2024). Global positioning satellites and communication
networks may be disrupted. For instance, on March 13, 1989, a coronal mass ejection created an intense magnetic storm and caused a nine-hour outage of Hydro-Quebec’s electricity transmission system (Boteler, 2019). Geomagnetic interference is more powerful and more frequent at the Earth’s magnetic poles because of the convergence of the planets’ magnetic field lines.
The impact of the Solar Cycle on climate change has been studied and found to influence climate variation over long timescales. There are fluctuations in sunspot frequency between solar cycles. Historically, variations in sunspot activity have been linked to regional weather patterns, including cold winters in Europe and droughts in various parts of the world. While solar energy output does have a small impact on Earth's climate, studies have found that the warming effect of recent solar cycles is significantly outweighed by human-caused climate change (Herring, D, 2020). In the past 100 years, sunspot activity increased from 1900 to 1970, and since then, solar activity has declined. Solar activity peaked around 1960, while the rate of global warming has accelerated. The estimated temperature increase due to solar activity is approximately 0.01 degrees Celsius from 1900 to 1970. This is 100 times smaller than the overall warming that has occurred on Earth over the industrial period, which is estimated to be 0.95–1.2 degrees Celsius from 2011 to 2020, compared to the period from 1850 to 1900 (Coddington et al., 2015) (Figure 3: Solar activity cannot explain global warming).
Sunspot activity is an ideal surrogate for longitudinal climate measurements because it has been recorded for millennia. Recordings and drawings of sunspot activity were noted in Chinese texts from 800 BCE and in England by John of Worcester in 1128 CE. With telescopes, Galileo Galilei recorded detailed observations of sunspots in 1610, showing that they occurred on the sun's surface rather than being shadows cast by orbiting planets (Figure 4: Digital Scans of Drawings by Galileo). Daily sunspot counts started in 1749 at the Zurich Observatory. In 1843, Samuel Heinrich Schwabe recognized that the activity waxed and waned over an 11-year period, identifying the solar cycle. In 1852, Swiss astronomer Rudolf Wolf standardized sunspot data into the Wolf sunspot index, now known as the International Sunspot Number (Ri), which is still used today. Sunspot activity has been correlated with other proxy records of solar irradiation. For instance, cosmogenic isotopes such as Beryllium-10 and carbon-14 can be analyzed in ancient ice cores from polar regions and in tree rings to provide a record of solar activity over 10,000 years (Poluianov et al., 2014).
Given the importance of monitoring solar activity, multiple international groups make daily observations of the sun. Satellites focused on recording solar activity are maintained by the National Oceanic and Atmospheric Administration (NOAA) Geostationary Operational Environmental Satellite (GOES) network, Deep Space Climate Observatory, and the Parker Solar Probe. These organizations publish reports of climate and solar activity that are publicly available. Ground-based recordings using magnetograms, radio spectrographs, auroral cameras,
cosmic ray neutron monitors, and sound wave analysis (helioseismology) also track solar activity.
These variations in solar activity may have played transformative roles in society and history. A 2000-year temperature history of the Northern Hemisphere outside the tropics reveals a warm period that peaked around 1,000 A.D. (Medieval Warm Period), preceding the Little Ice Age (Figure 5: NOAA Climate.gov Yearly Temperature in the Northern Hemisphere, 0 to 2000). The Medieval Warm Period, spanning approximately 950 to 1250, was unusually warm, leading to stable crop production, a population boom, and the emergence of the medieval Renaissance. In contrast, the Maunder Minimum (1645-1715) was an extended solar minimum period, when almost no sunspot activity was recorded (Poluianov et al., 2014). The Maunder Minimum partially overlapped with a centuries-long cold spell known as the Little Ice Age (Figure 6: Little Ice Age), which was strongest in the Northern Hemisphere between 1450 and 1850. The coldest part of the Little Ice Age coincided with the low solar activity of the Maunder Minimum, resulting in a 1-degree Celsius drop that impacted crops and caused famine across Europe, including the Irish potato blight (Little Ice Age (LIA) | Britannica, 2026). Grain harvests became less reliable, and the Icelandic Norse stopped farming for grain and abandoned settlements in Greenland(“Abandonment of Norse Settlements in Greenland (c. 1450s),” 2023).
In the modern era, observations have been made regarding the relationship between solar activity and
agricultural productivity. In a 700-year dataset of consumable prices in England, Pustilnik et al. found nonlinear associations between the prices of agricultural commodities and sunspot activity. They found that solar minimum correlated with price bursts. A follow-up study showed that pricing in the modern US wheat market also fluctuated with sunspot activity, leading to changes in maximum and minimum prices (Pustilnik & Din, 2004) Pustilnik believes that this trend is still visible throughout the 20th century, but to a lesser extent and influence. Another study in China examining soy and corn yields estimated that about 5% of the variability in production could be attributed to solar activity (Li et al., 2023).
Wheat, corn, and rice are the three most important agricultural commodities, representing roughly half of the calories consumed by humanity. The importance of these three staple crops cannot be overstated; civilization exists because farming practices domesticated these crops and enabled the production of a surplus of food for storage and trade, expanding human capacity beyond day-to-day subsistence. Fundamentally, they are all grasses, able to be produced at scale, through controlled environmental conditions. However, the climate and environmental conditions for each crop differ, allowing examination of climate change impacts.
My study examines the correlation between wheat, rice, and corn yields and sunspot activity. I hypothesize that because sunspots are associated with increased solar energy, sunspots and yields will have a positive correlation.
These three grasses are the most widely cultivated crops worldwide and are consistently monitored, so small changes in crop yields are more noticeable. They are annual crops that need to be harvested and replanted every year, and the impact on variation in solar activity is likely to be more immediate than with perennial crops.
Method and Materials:
The crop yield data was publicly available through the United States Department of Agriculture’s (USDA) Foreign Agricultural Service (FAS) and accessed by navigating from the home page to the Data and Analysis tab, then to the Production, Supply, and Distribution Online (PS&D) link. The crop yields were accessed on the “Perform a custom query” page, selecting “wheat,” “rice,” and “corn” in the “commodities” column and “Yield” from the “attributes” column from “World Total” before selecting all available market years, which were 1960 to 2013. This was made into a .xls sheet that labeled the crop year between years, i.e., the sheet gave the yields between the year 2006/2007. The data was copied and pasted into a new .xlsx sheet, with the date rounded down, so the yield from 2006/2007 was recorded as the yield from 2006.
Sunspot frequency data came from the Global Surface Summary of the Day (GSOD) dataset maintained by the US National Centers for Environmental Information (NCEI). The NCEI data package on RStudio includes the sunspot numbers. The package includes international sunspot numbers, including sunspot maximum and minimum from 1610 to the present, annual numbers from 1700 to the
Song10 present, monthly numbers from 1949, and daily values from 1818 to the present. The package includes the relative sunspot number with both daily and monthly values.
RStudio (v. 2024.12.1) was used for analysis. This process involved publicly shared R packages: “tidyverse,” “writexl,” “readxl,” “data.table,” “lubridate,” “kza,” and “dplyr” (Barret et al., 2025; Close et al., 2020; Grolemund et al., 2011; Ooms, 2025; Sparks et al., 2024; Wickham et al., 2019; Wickham et al., 2025). After loading the file, I created a dataset using the built-in sunspot data.month dataset using the package “zoo” (Zeileis et al., 2005). After converting it to a time series dataframe with dates, I extracted the year from the dates and found the greatest number of sunspots that appeared per year. Then, a subset of the sunspot data from 1960 to 2013 was extracted.
To analyze the relationship between sunspot activity and crop yield, the datasets were integrated by year as the common temporal variable. Using the “writexl” and “readxl” packages, I created a dataset for the crop yields and combined the data tables for the year, crop yield, and sunspots, ensuring the dates were aligned correctly. I initially created a scatter plot of worldwide crop yields versus sunspot activity to see whether there were any obvious groupings or correlations (Figure 7: Scatterplot of Worldwide Wheat Yield vs. Sunspot Numbers of the Same Year). No obvious findings were evident in the scatter plot directly comparing annual sunspot activity and crop yields. I then produced a type L graph of years versus sunspot number and crop yield (Figure 8: Sunspots and Crop Yield over
Time). To remove long-term trends and reveal short-term fluctuations, I detrended all the data with the Kolmogorov-Zurbenko (KZ) Moving Average (kza). First, I recorded the year-to-year differences in yields. Then I applied the kz moving average with period (m) = 11 and iterations (k) = 3 to both the sunspot and the new data, creating deseasonalized sunspot data and detrended crop yield data, respectively (Figure 9: Detrended Crop Yield and Deseasonalized Sunspot Frequency per Year) (Close et al., 2020). Finally, I checked the r-values for the detrended yield and deseasonalized sunspot data from 1960 to 2000, 2006, and 2013 to assess the strength of the correlation between the two plots.
I also checked for a time lag between sunspots and crop yield with a cross-correlation function (ccf). A ccf plot checks and plots the correlations between the datasets when the dates are shifted. For example, for a lag of 10 years, the ccf would give the r-value for whether the sunspot plot was shifted 10 years to the right or left on the figures. I used the detrended and deseasonalized sunspot and wheat data from 1960 to 2013. I created a ccf plot with the max.lag = 20 years before or after a given wheat data point (Figure 10: Cross-correlation graph of Sunspots vs Crop Yields Investigating Lag). The lag range was set to a maximum of 20 years to investigate the immediate and delayed effects of solar activity on crop yields.
The Kolmogorov–Zurbenko filter separates noise and short-term cyclical behavior from underlying trends in time series data. I wanted to remove the noise from the solar
cycle and identify any noticeable trends in the data. This is why the period was 11: to average out the solar cycle and expose long-term trends. The Kolmogorov–Zurbenko (KZ) moving average replaces each data point with the mean of surrounding values over a defined timespan or interval (m) and repeats this process k (3) times. The CCF allows examination of time-dependent relationships between the two series, enabling me to account for potential lags in their interactions. It measures the correlation between two time series at various lags. In this case: detrended yield vs. detrended sunspot frequency.
Results:
No obvious linear correlation is evident in the raw data from the scatterplot analysis of worldwide yields and sunspot counts, or over time, for any of the three crops (Figures 7, 8). Yields of wheat, corn, and rice all rose considerably during the examination period, likely a consequence of improved modern agricultural techniques. However, the detrended crop yields and deseasonalized sunspot frequency demonstrated several striking correlations from 1960 to 2000 (Figure 9). Detrending adjusts for the upward trend seen in overall production and the sunspot counts during the solar cycle. When looking only at wheat data from 1960 to 2000, the correlation emerges with r = 0.619. From 1960 to 2006, the correlation is r = 0.600. Using the adjusted data and measuring lag for the entire time period with a cross-correlation function, the strongest correlation, with r = 0.871, was found using a lag of 5 years (Figure 10). Rice also showed a strong positive correlation.
Detrended rice yields consistently show a close, positive correlation: r = 0.640 from 1960 to 2013, r = 0.750 from 1960 to 2006, and r = 0.712 from 1960 to 2000. For the cross-correlation function, the maximum r-value for rice was 0.847 with a 3-year lag.
Corn yields, unlike rice and wheat, demonstrated a strong inverse relationship: r = -0.671 from 1960 to 2013, r = 0.399 from 1960 to 2006, and r = -0.032 from 1960 to 2000. For the cross-correlation function, the maximum r-value for corn was -0.454 with a 0-year lag for corn (Figure 10).
The correlations between sunspot activity and crops, both positive and negative, were present from 1960 to 2000. However, after the year 2000, no correlation was observed between the crops and sunspot frequency.
Discussion:
Using a KZ moving average to detrend crop yields and control for Sunspot annual variability, and a cross-correlation function, I found a positive correlation between sunspot frequency and rice and wheat yields from 1960 to 2000 (Figure 9), but the relationship decoupled after 2000. In addition, the correlation strengthens when a 3 or 5-year lag between solar cycles is taken into account, suggesting a delayed effect (r = 0.871). For corn yields, however, I found a negative correlation, suggesting that sunspot activity may actually have detrimental effects on corn production. The relationship between plant growth and solar activity is complex and non-linear. However, multiple studies have suggested that solar irradiance affects
agricultural activity. A study by Pustilnik and Din looked at 700 years of commercial grain prices in the United Kingdom (1260-2000) and found a correlation with sunspot activity (Pustilnik & Din, 2004). While higher radiation levels increase photosynthesis, the relationship is likely more variable. Radiation can alter ions and radicals in the air, affecting condensation and cloud formation. Increased cloud cover can actually reduce solar penetration and heat transfer. Ultraviolet (UV) radiation can have deleterious effects on biological systems. In particular, variances of 10% in biologically active ultraviolet radiation have been reported during the solar cycle, compared with relatively small variances in the visible and infrared spectra (0.1%) (Calderini et al., 2008). In some plants, increased UV radiation is associated with downregulation of growth genes (Molina‐Montenegro et al., 2024).
In the modern era, solar radiation has shown positive correlations with commercial crop yields, including corn and soybean yields. Leng et al. examined the combined and independent effects of temperature, precipitation, and solar radiation on crop yields across the US. They concluded that about 5% of variability can be explained by solar radiation alone, but the complex interaction of factors, including temperature changes, precipitation, and cloud cover, may show higher levels of correlation (Leng et al., 2016). Nevertheless, this sets a precedent for sunspots influencing plant life and supports the idea that crops are impacted by sunspot activity.
The influence of sunspots is multi-layered and can be either beneficial or detrimental. Sunspots indicate increases
Song15 in average global temperature (~0.1 °C) and ultraviolet (UV) radiation (Scafetta, 2014). So, there can be a longer growing season and earlier sprouting. Although high temperatures mean higher water requirements, they can also lead to increased precipitation. Plants can gather more water by absorbing moisture and rainfall. Higher temperatures also lengthen growing seasons, allowing crops to grow and produce food, but they can also push crops outside their optimal range. UV-A radiation can accelerate photosynthetic rates of wheat sprouts (Joshi et al., 1997). However, larger quantities of UV-A or UV-B can be detrimental(Kataria & Guruprasad, 2012; Molina‐Montenegro et al., 2024).
Depending on a crop’s resilience and location, sunspots can help or harm plants.
In this study, corn yields appear to be negatively correlated with sunspot frequency during the 1960 to 2013 study period. Initially, corn appears to show a positive correlation with sunspots until around 1974, but then it quickly turns negative (Figure 9). This contrasts with the behavior of wheat and rice yield, which seem to increase with higher sunspot activity. The reason for this difference is unclear, but it may be related to a variety of factors. One factor may be related to optimal environmental conditions for growth. The ideal average temperature range for growing corn is 68 to 73 degrees Fahrenheit, or 20 to 23 degrees Celcius, and corn needs around 20 to 22 inches, or 51 to 56 cm, of water during the growing season (How Climate Affects Corn Production | Agronomic Crops Network, n.d.).
Meanwhile, wheat growth has a broader optimal temperature range of 16 to 25 degrees Celsius (61 to 77 degrees Fahrenheit) (Optimal Conditions for Wheat Cultivation -
Agriculture Notes by Agriculture.Institute, 2023). Regions with 25 to 150 cm, or 10 to 59 in of rainfall, are best for growing wheat. So, wheat is a more flexible crop than corn and may better capitalize on the higher temperatures and greater solar energy from sunspots. Meanwhile, corn is pushed out of its comfort zone and cannot grow well.
Rice yields have a stronger positive correlation with sunspot frequency than wheat (r = 0.750 for rice from 1960 to 2006, and r = 0.600 for wheat in the same time period). Rice requires significantly more water compared to wheat, needing around 100 to 150 cm of water in the entire growing season (Optimal Climate and Soil Conditions for Rice
Cultivation - Agriculture Notes by Agriculture.Institute, 2023). The best temperature range for rice is 25 to 33 degrees Celsius during the day, and 15 to 20 degrees Celsius at night. The largest rice farmers are in Asia, where the monsoon season provides ample water at the right time. So, the extra energy and warmth provided by sunspots give rice crops more energy to utilize the water and precipitation from the rainstorms.
The rapid increase in yields from 1960 to 2013 and the decoupling between crop yields and sunspot frequency after 2000 across all three crops may be due to improvements in farming techniques and technological advances that buffer or mitigate climate variability. The Green Revolution in the 1960s was a period of modernization that led to the selective breeding of high-yielding crop varieties, especially rice and wheat (Fuglie et al., 2024; Muir, 2023). The development of fertilizer, pesticides, and modern irrigation systems improved yields beyond historical norms, and widespread industrialization
Song17 and consolidation of farming occurred during this period. These new varieties of rice and wheat began to be sold in the 1970s and have continued to improve since. Figure 8, which depicts raw crop yield data for wheat, rice, and corn, shows that crop yields are consistently rising. Thus, the Green Revolution did influence data, but applying the KZ moving average showed that, even when accounting for the overall increase in yields, wheat and rice yields still correlated with sunspots up until 2000. By the 1990s, selective breeding was approved by the US, UK, and Chinese governments (Hamdan et al., 2022) and led to genetically modified products. These policy changes may account for the decoupling seen between yield and sunspots after 2000.
GMOs, or genetically modified organisms, are varieties of crops whose genes are altered to maximize or express certain traits, including higher yield, drought resistance, and resistance to insecticides and pesticides. The development of GMOs began in the 1960s, but their widespread purchase and use started in the late 1990s. Almost all crops have experienced some form of selective breeding for drought resistance and increased yield (Are All Crops That We Eat Genetically Improved?, n.d.). However, genetically altered wheat and rice crops are not widely used now, whereas most corn produced are GMOs. In the US, around 94% of farmers used GMO corn seeds in 2025 (Dodson, 2025). Thus, part of corn’s growing success may be attributed to the popularity and productivity of GMO corn.
The difference in the correlation between corn yields and sunspots, compared with wheat and rice, may reflect the impact of industrialization, consolidation, and commercial
farming. Corn production differs from wheat and rice in some important ways. Unlike rice and wheat, the demand for corn is primarily for industrial purposes, not for direct human consumption, and corn production is heavily reliant on commercial agriculture, with a much higher percentage grown by large consolidated farms using advanced technologies. My data showed a positive correlation between corn and sunspots from 1960 to 1974, but an inverse correlation when the data was aggregated from 1960 to 2000. In 1973, the U.S. Farm Bill encouraged farmers to massively increase corn production, making it a key industrial crop for animal feed, food additives (think corn syrup and oil), and ethanol. While the Farm Bill encouraged all commercial crops, the industrialization and consolidation of corn production were particularly extensive. In contrast, most rice was and still is produced by independent farmers and the degree of consolidation and industrialization is small compared to corn and wheat.
Conclusion:
Sunspots appear to affect crop growth. However, technological and agricultural advancements may have accelerated yields, providing resistance against solar and climate variation. Prior studies suggest that solar activity has a complex and nonlinear impact on plants and agriculture. Many potential factors, including natural disasters, climate change, scientific advancements, specific geography, the length of the growing season, and geopolitical events, influence the yield. Using data from farther back in time, specifying the location and climate, such as along a single latitude and longitude, and incorporating other variables could help clarify these effects.
Knowing the influence of sunspots on crops helps humanity predict future periods of high and low supply, as the sunspot-induced variation can be calculated. As with Pustilnik, fluctuations in the market prices of wheat products, such as flour and cereal, can be predicted using sunspots (Pustilnik & Din, 2004). Future research can examine correlations between sunspots and other plants, such as soybeans, fruits, or root vegetables.
Appendix - Figures, graphs, and other graphics
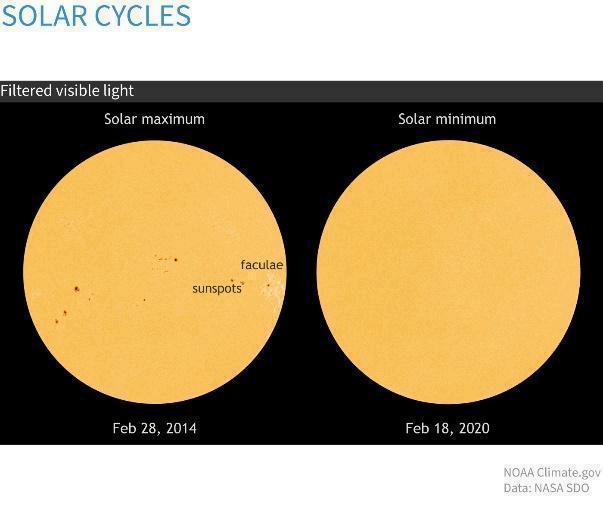
2014, (left), near the maximum of the last solar cycle, and on February 18, 2020 (right), near the solar minimum. Dark patches called sunspots are easier to see than their companion faculae, diffuse bright areas that make the Sun slightly brighter during solar maximum. Adapted from "Climate Change: Incoming Sunlight," by R. Lindsey, October 7, 2021, Climate.gov. Retrieved March 1, 2026, from https://wwwclimate gov/media/13601 Copyright 2021 by NOAA Climate.gov (Lindsey, 2025).
Figure 2
Sun’s Energy (Total solar irradiance)
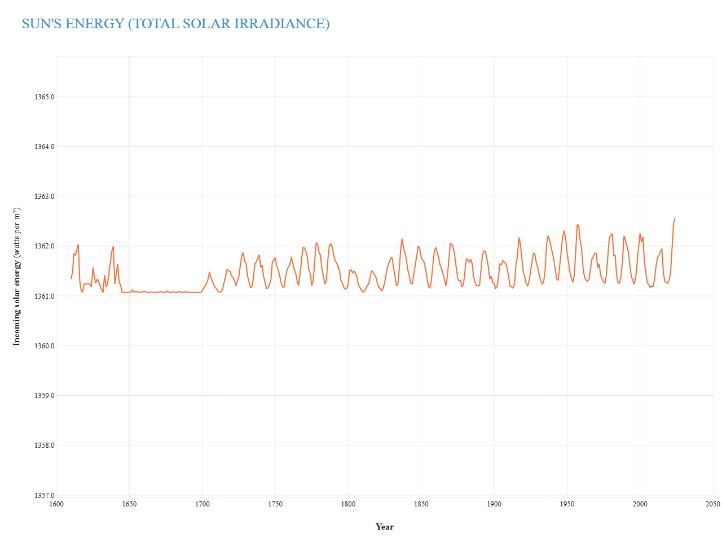
Note. Reconstruction of total solar irradiance based on sunspot observations since the 1600s. During strong solar cycles, the Sun's total average brightness varies by up to 1 Watt per square meter. Changes in the Sun's overall brightness since the pre-industrial period have been minimal, making a very small contribution to global-scale warming. However, the Maunder Minimum, from 1645 to 1710, was a time period when sunspots were significantly rare, and temperatures dropped as well. Based on the Climate Data Record by Coddington et al (2016) Adapted from "Climate Change: Incoming Sunlight," by R. Lindsey, June 27, 2025, Climate.gov. Retrieved March 1, 2026, from https://www.climate.gov/news-features/understanding-climate/clim ate-change-incoming-sunlight Copyright 2025 by NOAA Climate.gov.
Figure 3
Solar activity cannot Explain Global Warming.
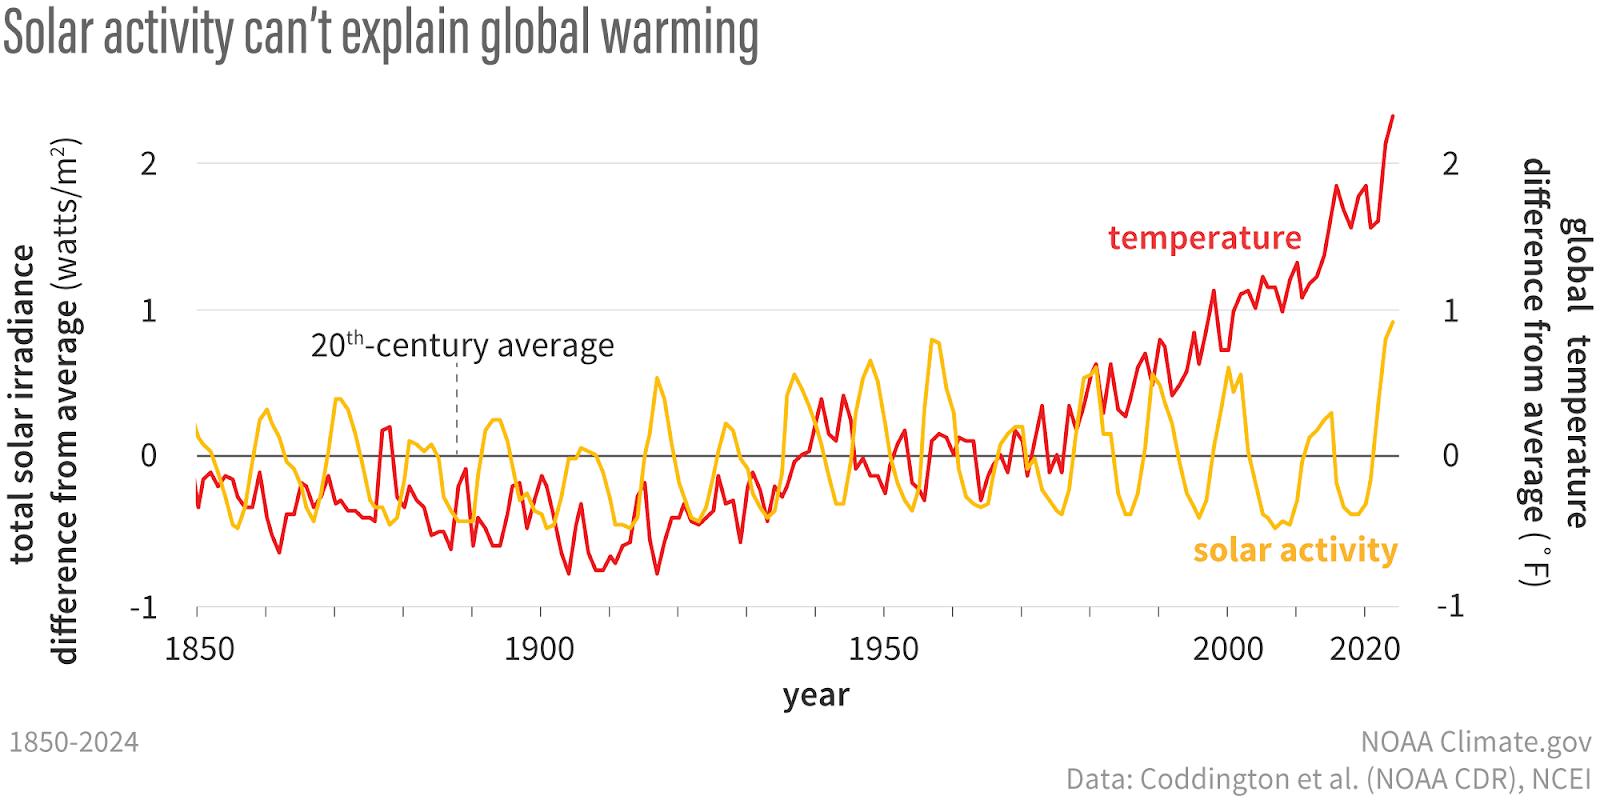
Yearly total solar irradiance (yellow line) and the annual global temperature (red line) from 1850–2024, each compared to the 20th-century average (solid black line) from 1880–2020 Since the middle of the 20th-century, solar activity has declined while global temperature increased rapidly. Based on solar data from Coddington et al., 2017, and temperature data from NOAA NCEI (Climate Change, 2025) From "Climate Change: Incoming Sunlight," by R. Lindsey, June 11, 2025, Climate.gov. Retrieved March 1, 2026, from https://www.climate.gov/media/13196. Copyright 2017 by NOAA Climate.gov (Coddington et al., 2015; Lindsey, 2025)
Figure 4
Digital scans of Drawings by Galileo.
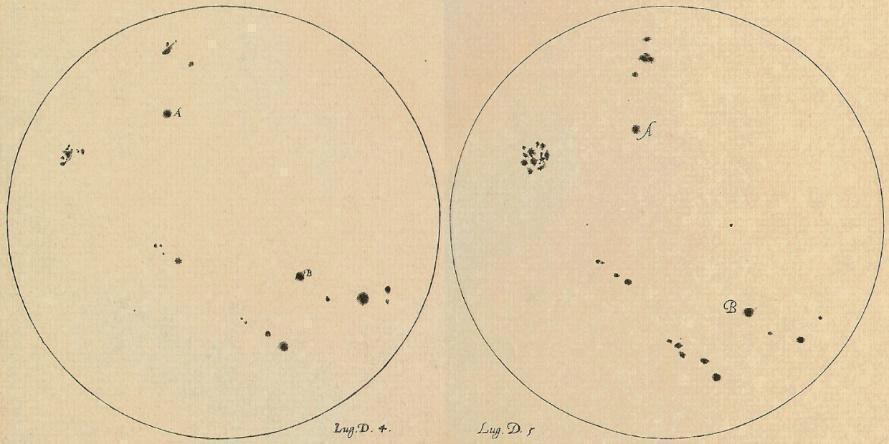
Note. Hand-drawn sketches of sunspots Galileo observed through a telescope on July 4 (left) and 5 (right), 1613 Copyright 2026 by Galileo Project (The Galileo Project | Science | Susnpot Drawings, n.d.).
Figure 5
NOAA Climate.gov Graph Yearly Temperatures in the Northern Hemisphere from Year 0 to 2000.
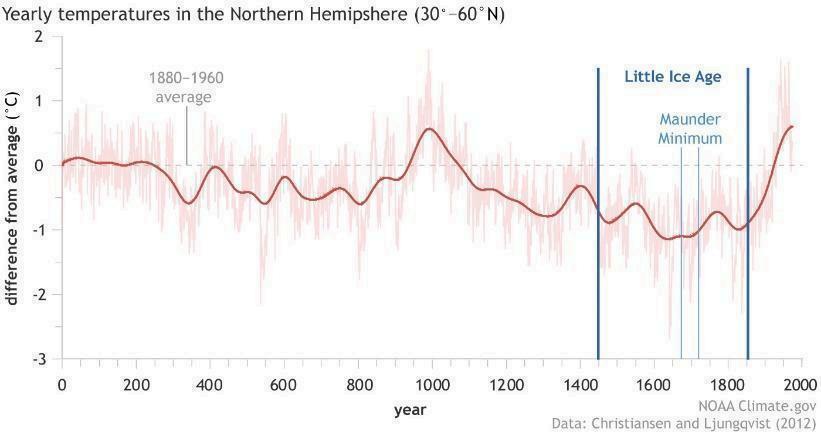
Note. Based on data from Christiansen and Ljungqvist (2012). From "Climate Change: Incoming Sunlight," by R. Lindsey, August 27, 2021, Climate gov Retrieved March 1, 2026, from https://www.climate.gov/media/13202. Copyright 2012 by NOAA Climate.gov (Christiansen & Ljungqvist, 2012).
Figure 6
Little Ice Age
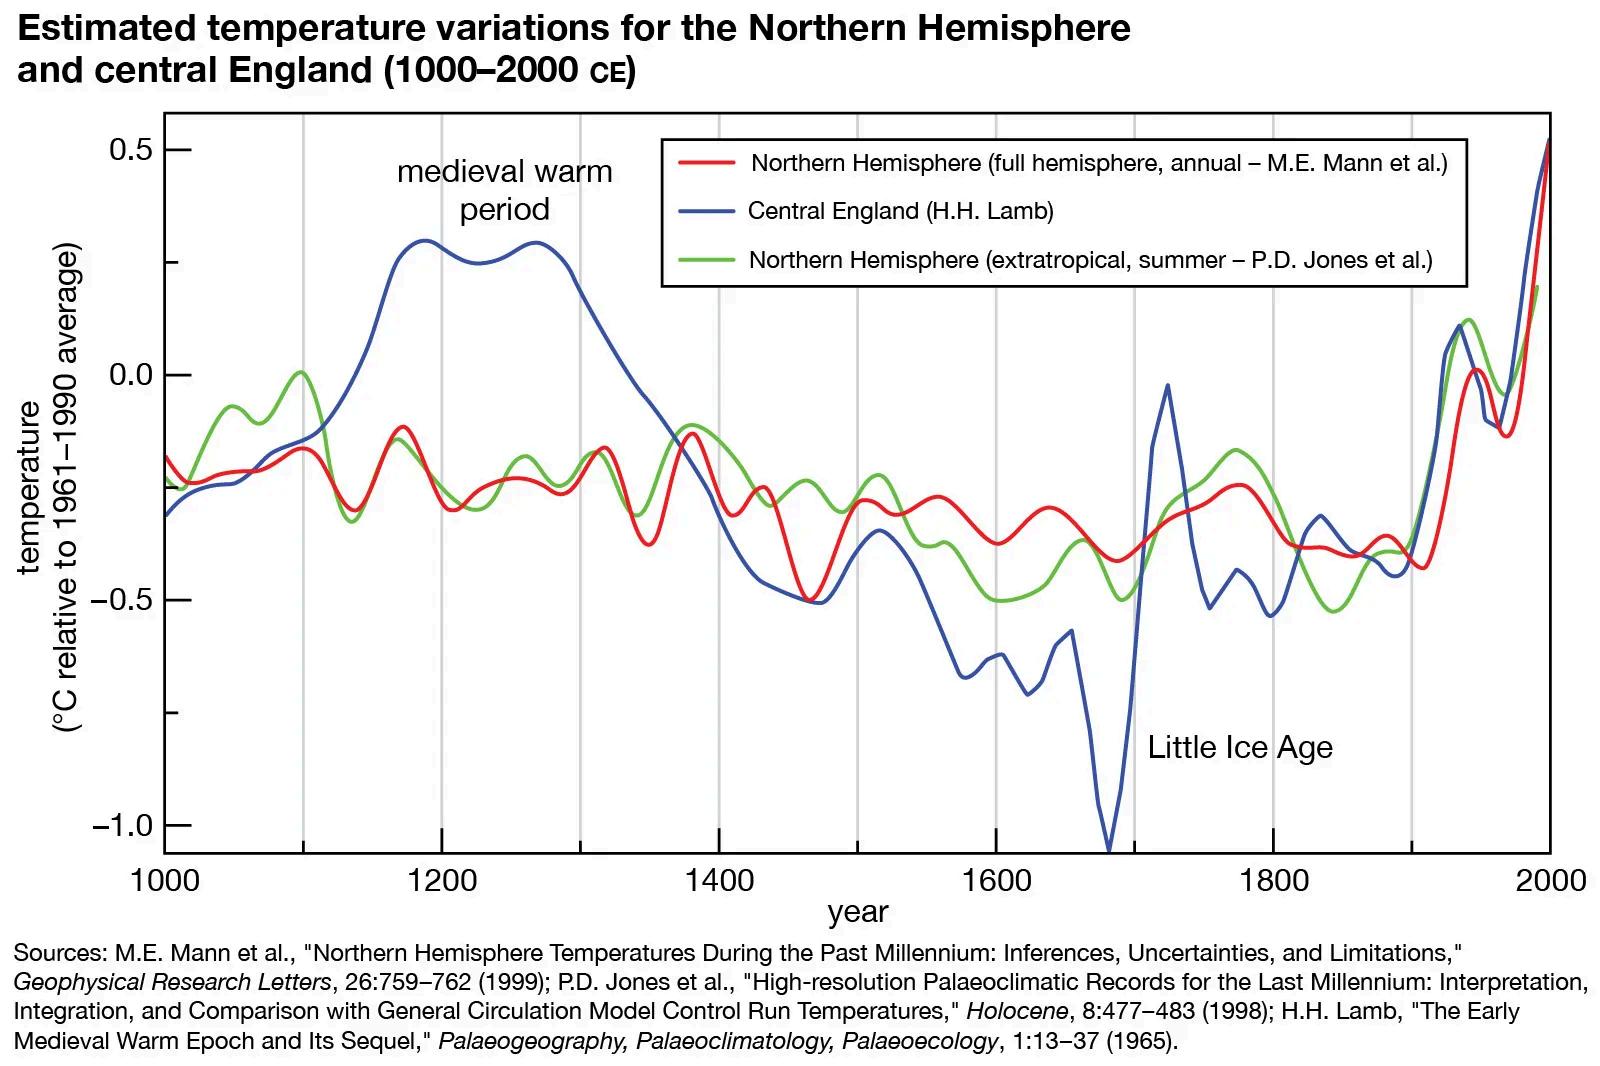
Note. Timing and temperature variations during the Little Ice Age. Two periods of low sunspot activity (1450-1540 and 1645-1715) coincided with some of the coldest years of the Little Ice Age in Europe. The graph shows a 1 to 2 degrees Celsius drop from 1400 to 1500 and the Great Famine of 1315-1317. From "Little Ice Age," by J. P. Rafferty et al., January 30, 2026, Encyclopædia Britannica. Retrieved March 1, 2026, from https://wwwbritannica com/science/Little-Ice-Age#/media/1/34410 6/158081. Copyright 2026 by Encyclopædia Britannica (Little Ice Age (LIA) | Britannica, 2026).
Figure 7
Scatterplot of Worldwide Wheat Yield VS Sunspot Numbers of the Same Year
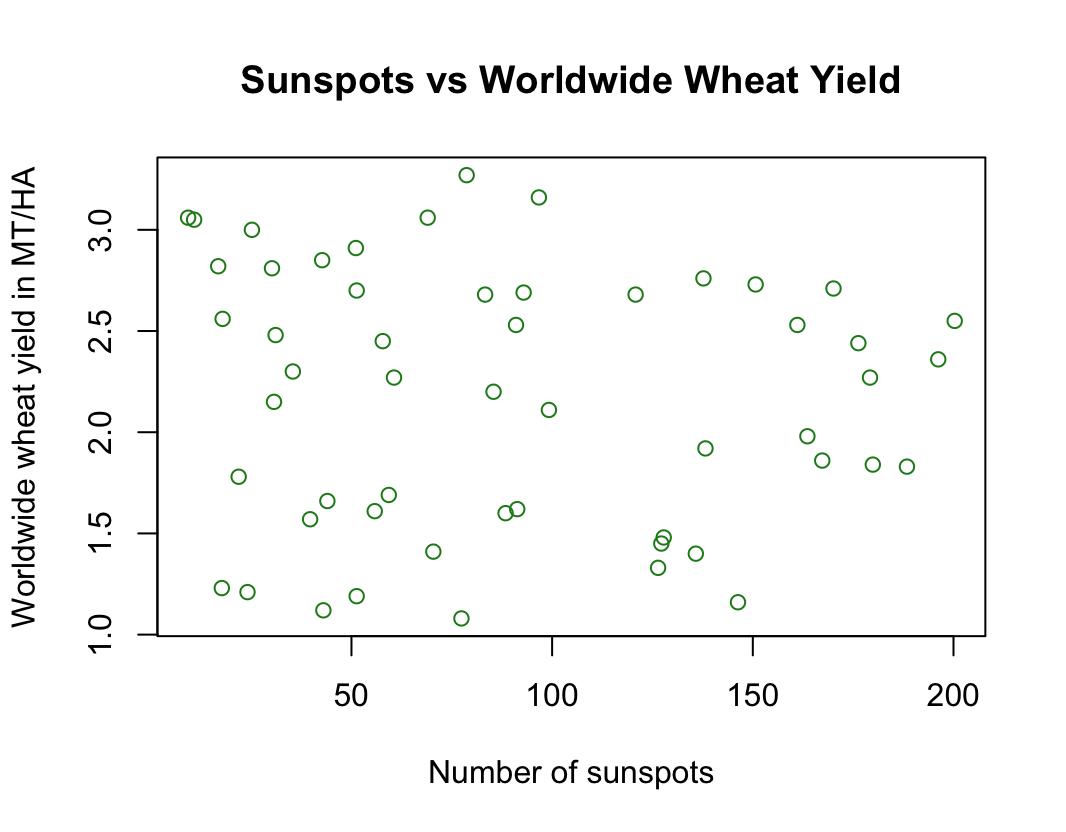
Note. No obvious correlation. x-axis = sunspot numbers, y-axis = worldwide wheat yield in Metric Tons. No obvious correlation. Graph created by Ryan J. Song using RStudioV. 2024.12.1, 2025). Copyright by author.
The Sunspots and Crop Yield over Time
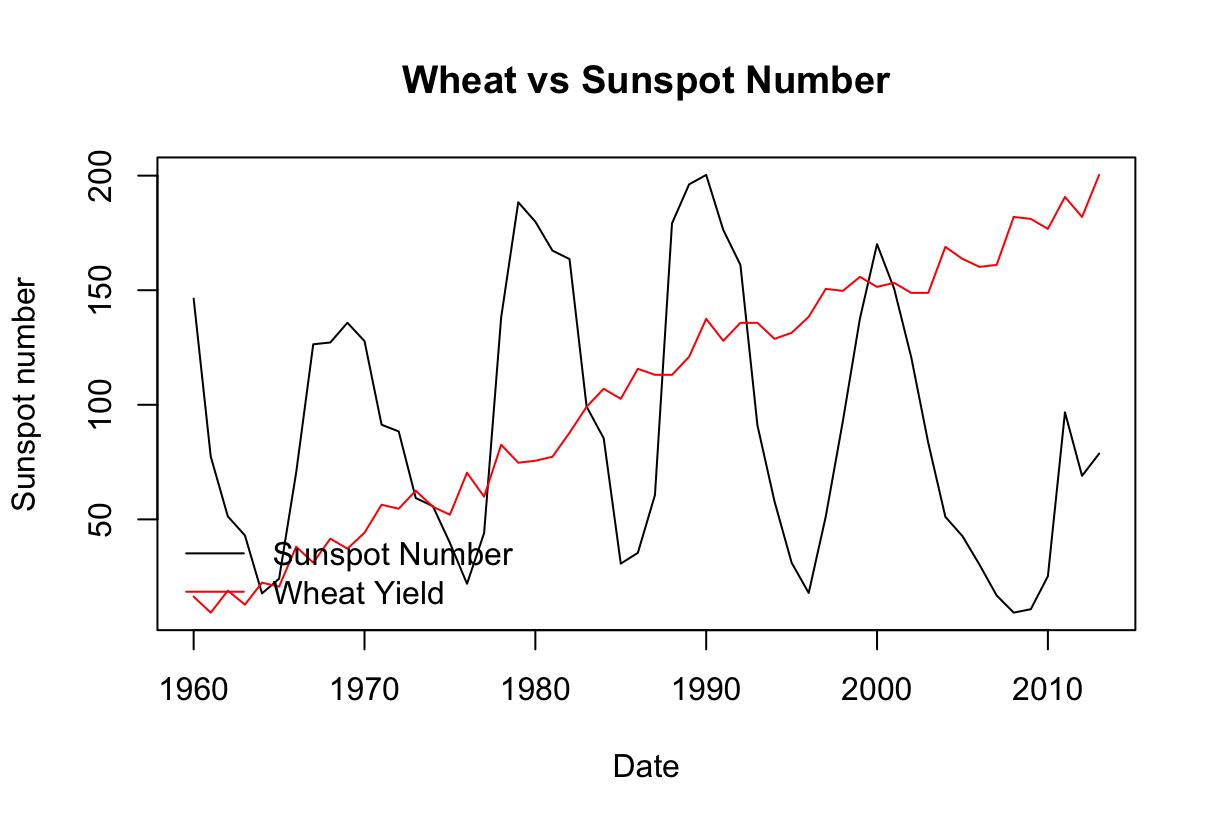
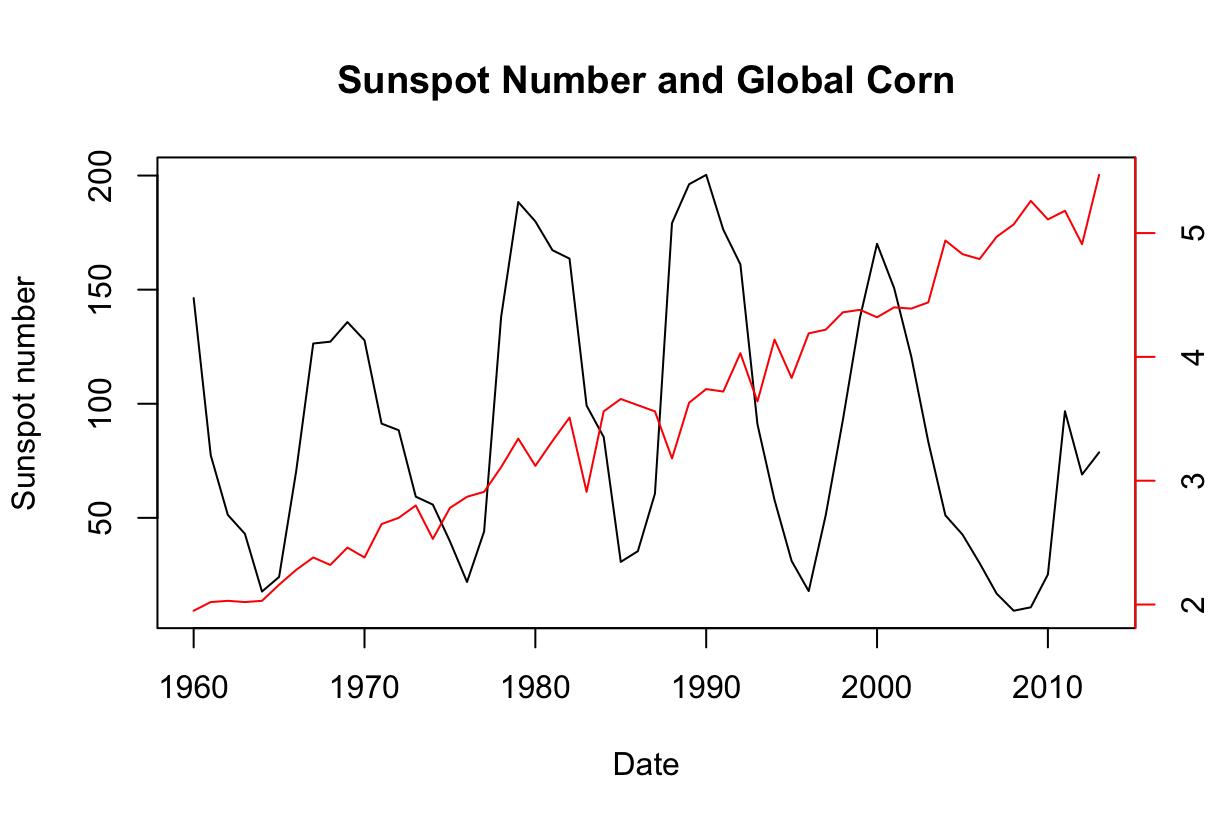
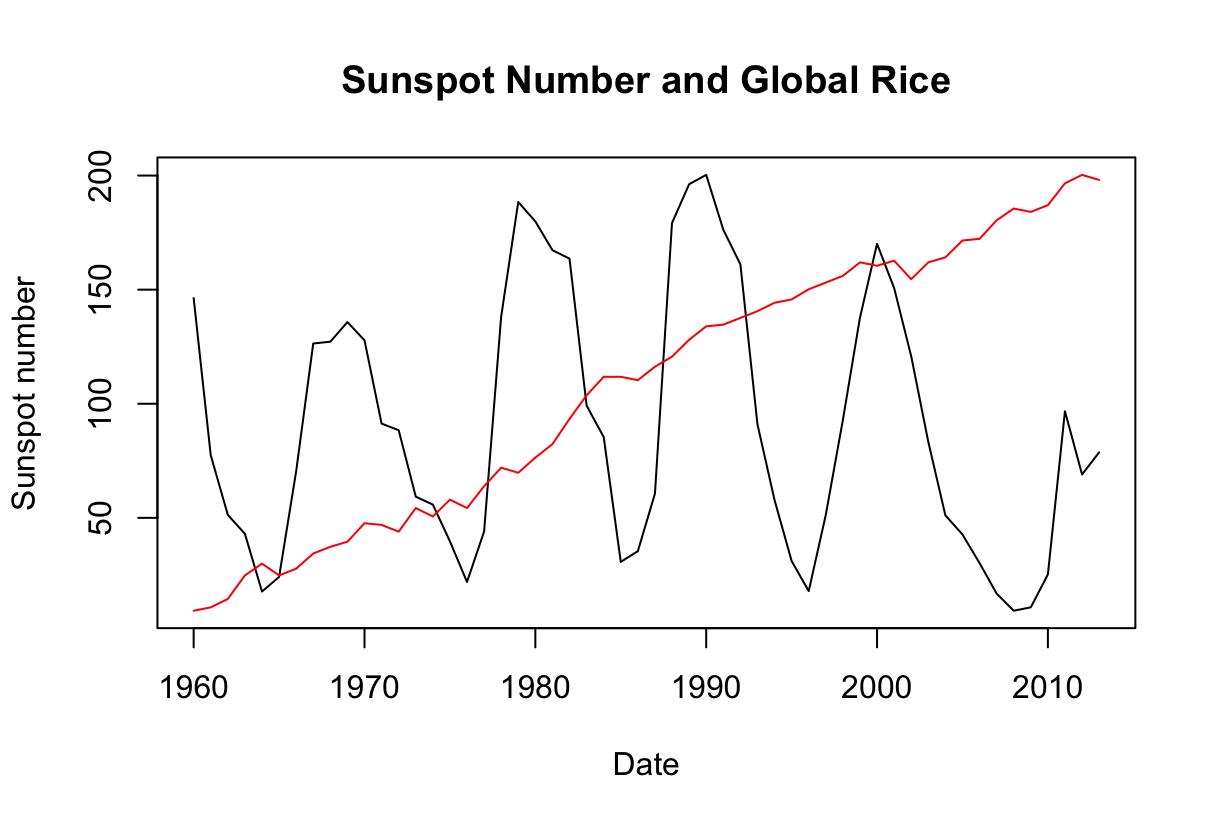
Note. The solar cycle is evident, and crop yields are steadily increasing across all of them. No obvious correlation was observed in the unadjusted linear analysis. Graph created by Ryan J. Song using RStudioV. 2024.12.1, (2025, 2026). Copyright by author.
Detrended Crop Yield and Deseasonalized Sunspot Frequency per Year
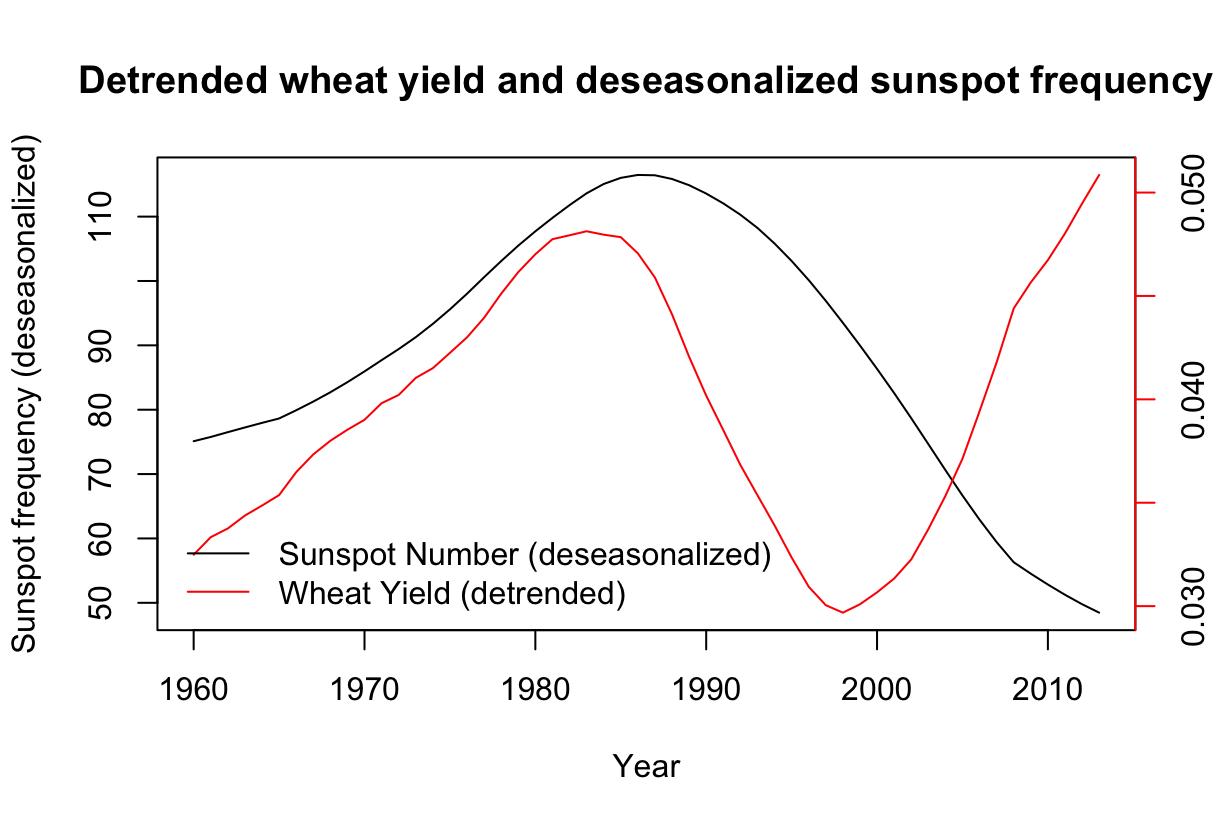
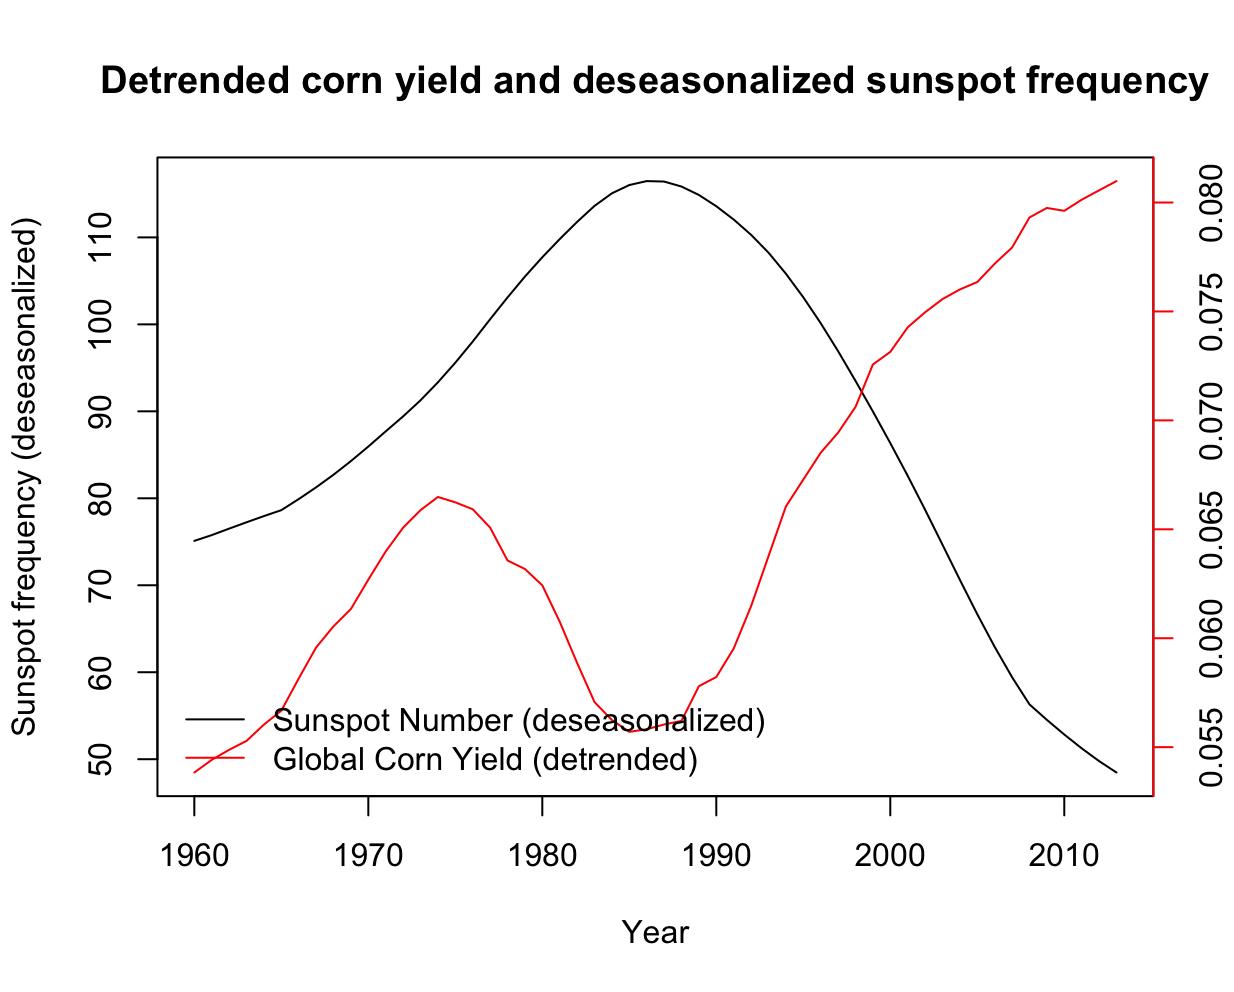
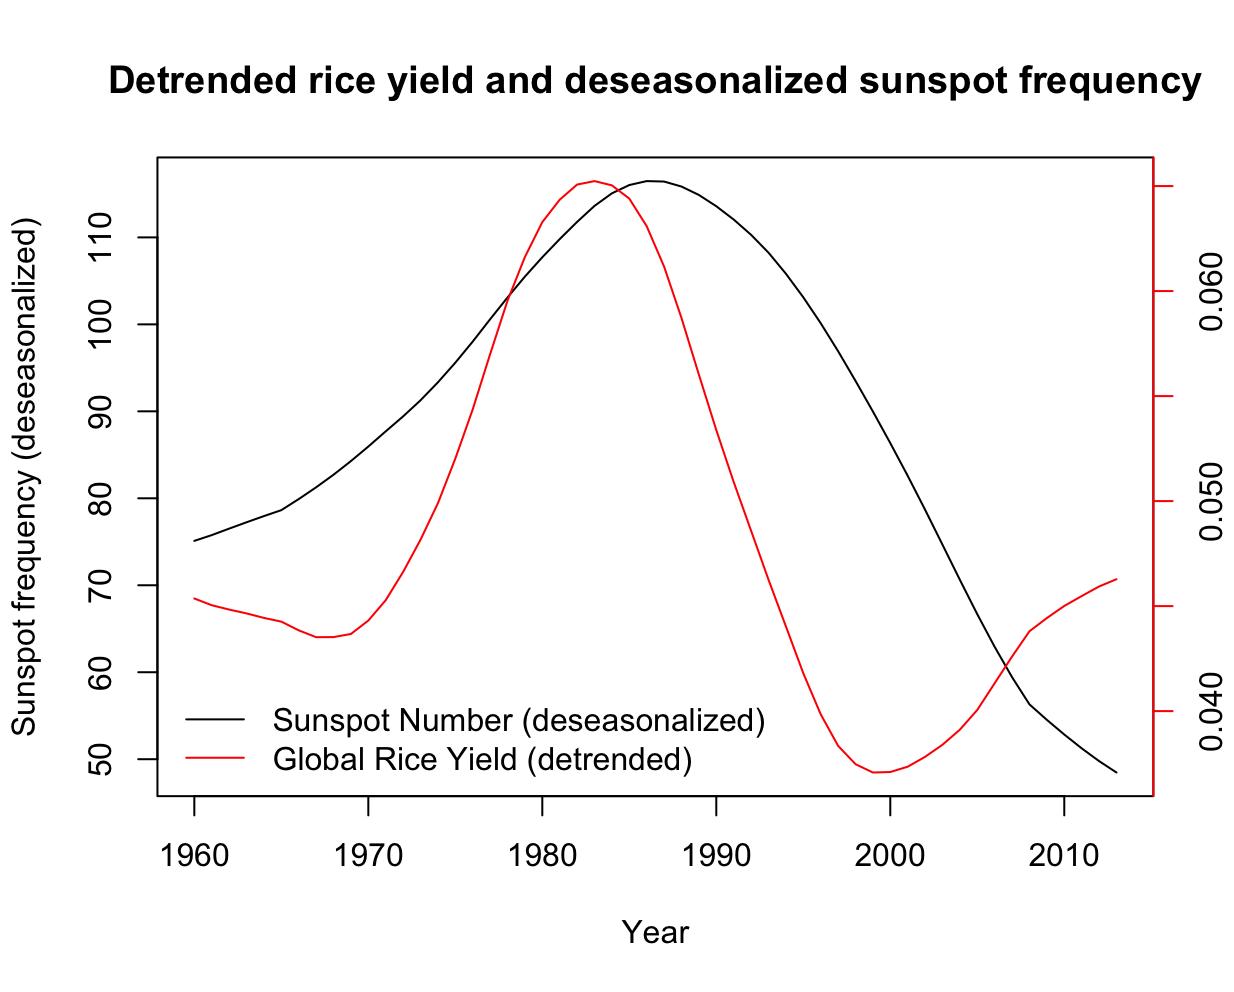
Note. Using detrended and deseasonalized data that adjust for long-term trends from 1960 to 2000, there is a moderate-to-strong positive correlation with r = 0.619, r = -0.032, and r = 0.712 for wheat, corn, and rice yield data, respectively Note that the detrended wheat yields fall after 1980, along with the sunspot numbers, but the correlation is lost after 2000, when the wheat data deviate, along with the rice yield. The detrended corn yields are the inverse of the deseasonalized sunspot frequency after
1974. Graph created by Ryan J. Song using RStudioV. 2024.12.1 (2025, 2026). Copyright by author.
Figure 10
Cross-correlation graph of Sunspots vs Crop Yields Investigating Lag
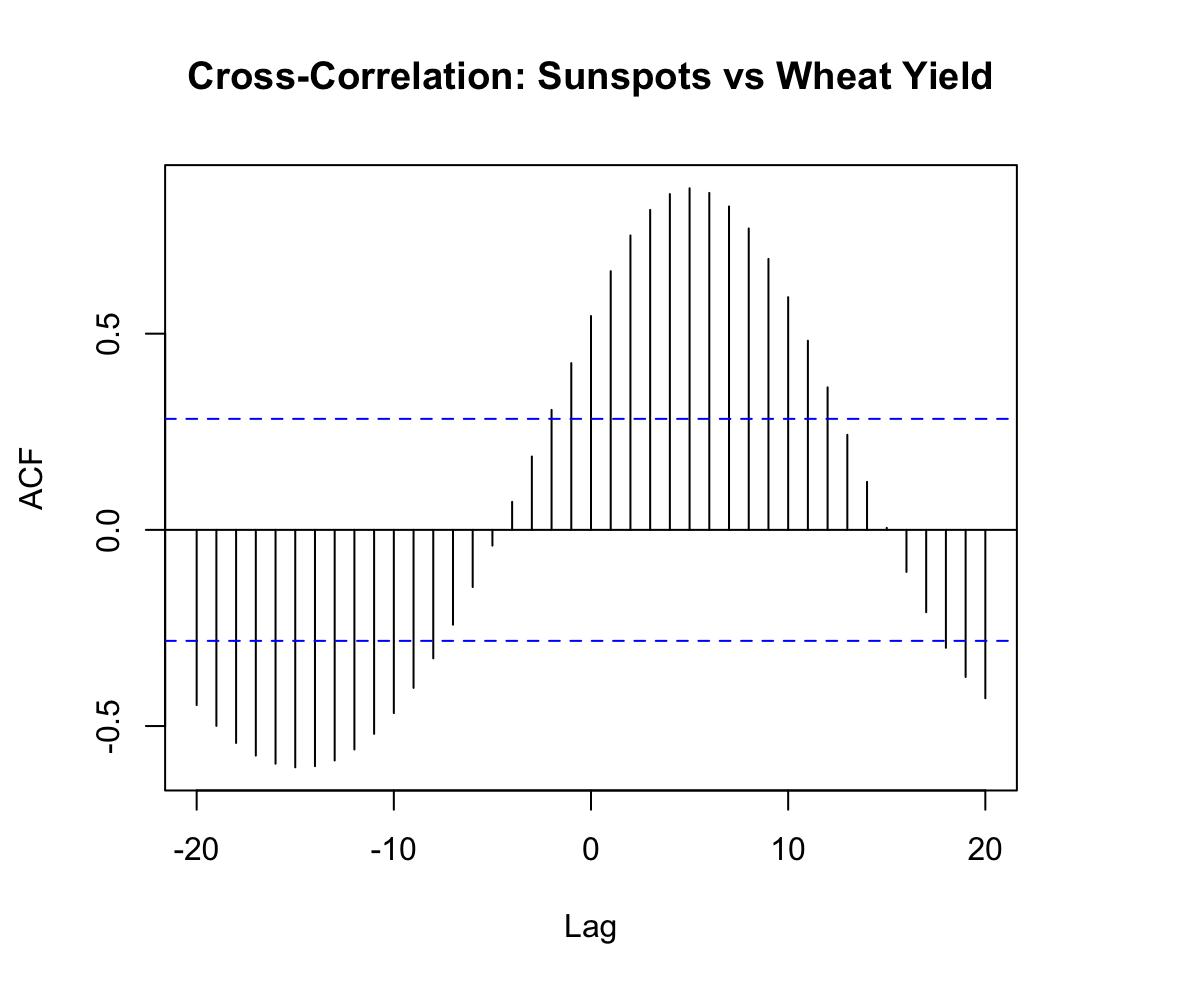
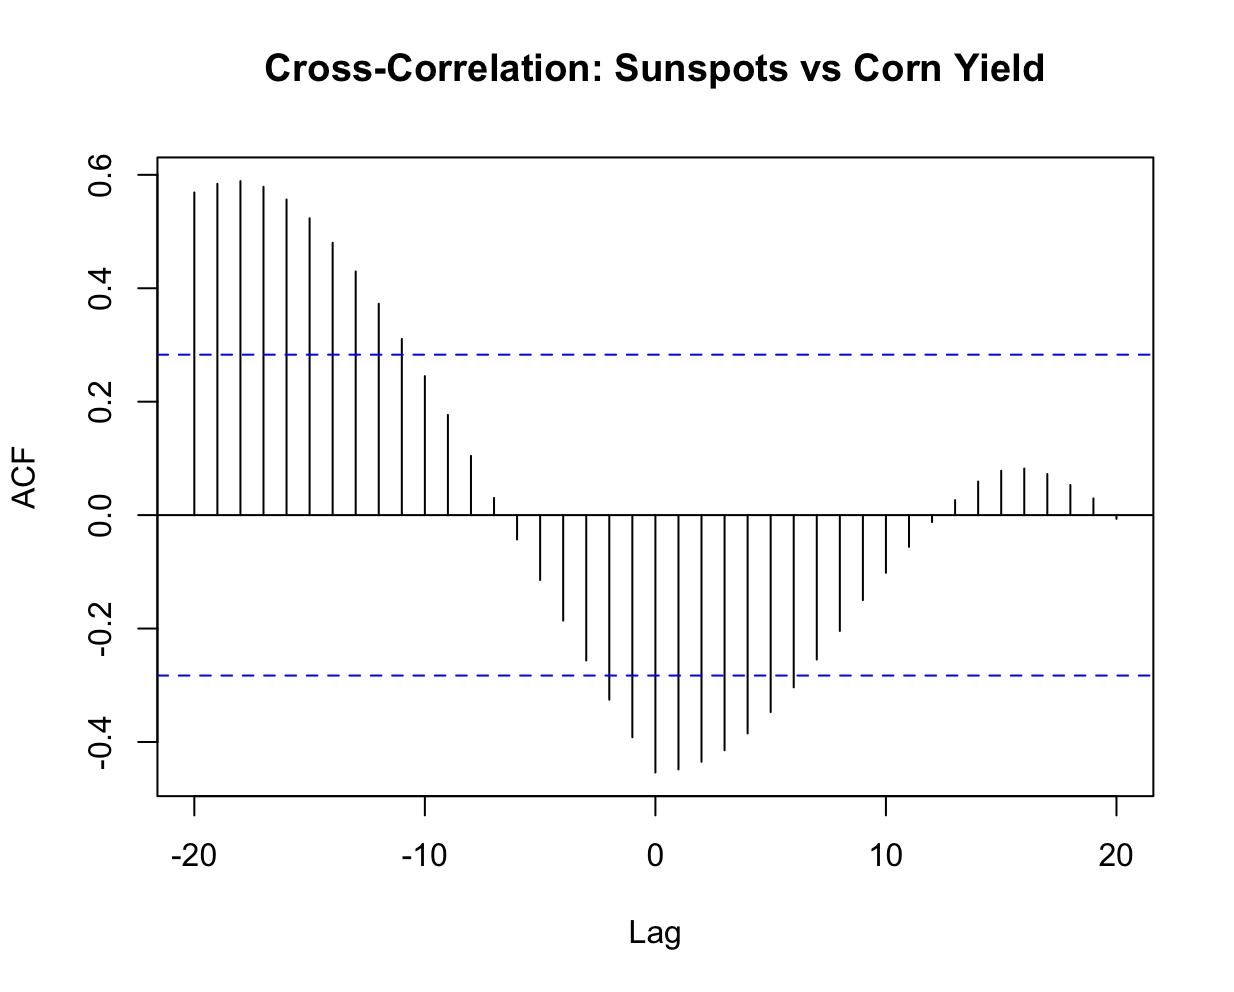
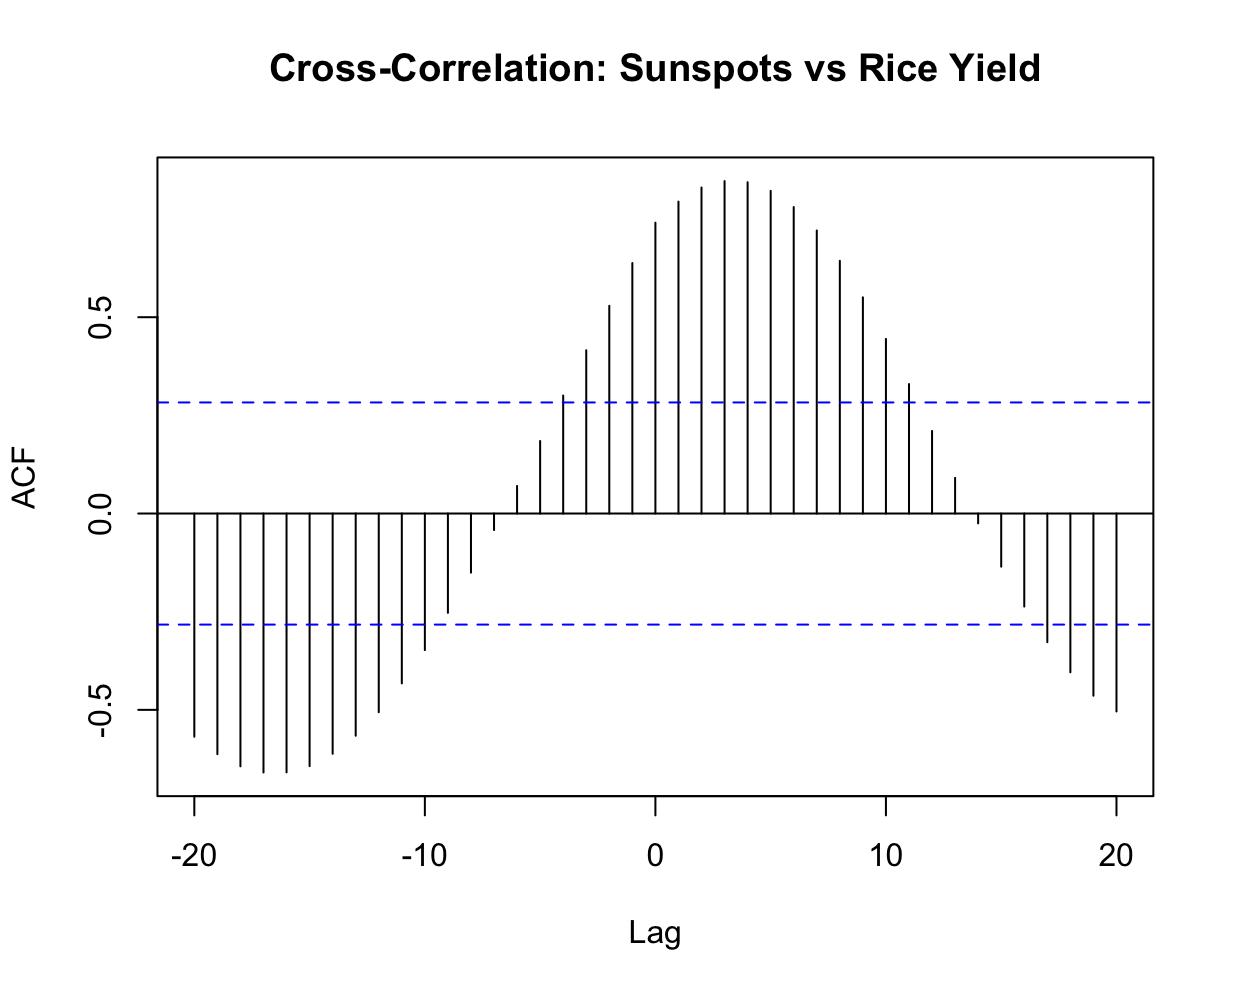
Note. Graph compares deseasonalized sunspots to detrended wheat, corn, and rice yields using the cross-correlation function with lag adjustment up to 20 years earlier (negative lag) or later (positive lag). The largest correlation for wheat yield is r = 0.871, comparing wheat yield from 5 years ago with the current sunspot frequency. The largest correlation of r = -0.454 occurs with a 0-year lag, or r = 0.589 when comparing sunspots from 18 years ago to current corn yield The largest correlation is r = 0 847 between rice yield from 3 years ago to current sunspot frequency. Graph created by Ryan J. Song using RStudio V. 2024.12.1 (2025, 2026). Copyright by author.
Bibliography
Abandonment of Norse Settlements in Greenland (c. 1450s) (2023, June 19) [Climate in Global Cultures and Histories: Promoting Climate Literacy Across Disciplines]. Climate in Arts and History. https://www.science.smith.edu/climatelit/abandonment-of-n orse-settlements/ Are all crops that we eat genetically improved? (n.d.).
Retrieved March 1, 2026, from https://www.nationalacademies.org/news/are-all-crops-that -we-eat-genetically-improved Blumenfeld, J (2024, July 2) It’s Always Sunny in Space (and That’s a Problem for Satellite Teams) | NASA Earthdata [Feature Article]. Earth Science Data Systems, NASA.
https://wwwearthdata nasa gov/news/feature-articles/its-al ways-sunny-space-thats-problem-satellite-teams
Boteler, D. H. (2019). A 21st Century View of the March 1989 Magnetic Storm. Space Weather, 17(10), 1427–1441 https://doi org/10 1029/2019SW002278
Calderini, D. F., Lizana, X. C., Hess, S., Jobet, C. R., & Zúñiga, J. A. (2008). Grain yield and quality of wheat under increased ultraviolet radiation (UV-B) at later stages of the crop cycle. The Journal of Agricultural Science, 146(1), 57–64 https://doi org/10 1017/S0021859607007447
Chatzistergos, T., Krivova, N. A., & Ermolli, I. (2024). Understanding the secular variability of solar irradiance: The potential of Ca II K observations. Journal of Space Weather and Space Climate, 14, 9 https://doi.org/10.1051/swsc/2024006
Christiansen, B., & Ljungqvist, F. C. (2012). The extra-tropical Northern Hemisphere temperature in the last two millennia: Reconstructions of low-frequency variability
Song34 Climate of the Past, 8(2), 765–786.
https://doi.org/10.5194/cp-8-765-2012
Coddington, O., Lean, J. L., Lindholm, D., Pilewskie, P., Snow, M , & NOAA CDR Program (2015) NOAA Climate Data Record (CDR) of Total Solar Irradiance (TSI), NRLTSI Version 2.0 (Version Superseded) [Dataset]. NOAA National Centers for Environmental Information. https://doi org/10 7289/V55B00C1
Dodson, L. (2025, December 12). Adoption of Genetically Engineered Crops in the United States Recent Trends in GE Adoption | Economic Research Service.
https://www.ers.usda.gov/data-products/adoption-of-geneti cally-engineered-crops-in-the-united-states/recent-trends-i n-ge-adoption
Fuglie, K., Morgan, S., & Jelliffe, J. (2024, September 30). Global Changes in Agricultural Production, Productivity, and Resource Use Over Six Decades | Economic Research Service.
https://www.ers.usda.gov/amber-waves/2024/september/gl obal-changes-in-agricultural-production-productivity-and-re source-use-over-six-decades
Hamdan, M. F., Mohd Noor, S. N., Abd-Aziz, N., Pua, T.-L., & Tan, B. C. (2022). Green Revolution to Gene Revolution: Technological Advances in Agriculture to Feed the World. Plants, 11(10), 1297.
https://doi org/10 3390/plants11101297
Herring, D. (2020, October 29). • Herring, D. (2020, October 29). Couldn’t the Sun be the cause of global warming? NOAA Climate.gov.
Https://wwwclimate gov/news-features/climate-qa/couldntsun-be-cause-global-warming. NOAA Climate.Gov. How Climate Affects Corn Production | Agronomic Crops Network. (n.d.). Retrieved March 1, 2026, from https://agcrops osu edu/specialization-areas/corn/how-clim ate-affects-corn-production
Joshi, P. N., Ramaswamy, N. K., Raval, M. K., Desai, T. S., Nair, P. M., & Biswal, U. C. (1997). Response of senescing leaves of wheat seedlings to UVA radiation: Inhibition of PSII activity in light and darkness Environmental and Experimental Botany, 38(3), 237–242. https://doi.org/10.1016/S0098-8472(97)00013-0
Kataria, S., & Guruprasad, K. N. (2012). Solar UV-B and UV-A/B exclusion effects on intraspecific variations in crop growth and yield of wheat varieties. Field Crops Research, 125, 8–13. https://doi.org/10.1016/j.fcr.2011.08.011
Leng, G., Zhang, X., Huang, M., Asrar, G. R., & Leung, L. R. (2016). The Role of Climate Covariability on Crop Yields in the Conterminous United States Scientific Reports, 6(1), 33160. https://doi.org/10.1038/srep33160
Li, Q., Xu, S., Zhuang, J., Liu, J., Zhou, Y., & Zhang, Z. (2023). Ensemble learning prediction of soybean yields in China based on meteorological data Journal of Integrative Agriculture, 22(6), 1909–1927.
https://doi.org/10.1016/j.jia.2023.02.011
Lindsey, R. (2025, June 27). Climate Change: Incoming Sunlight | NOAA Climate gov NOAA Climate Gov https://www.climate.gov/news-features/understanding-clim ate/climate-change-incoming-sunlight
Little Ice Age (LIA) | Britannica. (2026, January 30). https://www.britannica.com/science/Little-Ice-Age
Mohr, K (n d ) Solar Irradiance Science | Earth 610 Web Dev. Retrieved March 1, 2026, from https://earth.gsfc.nasa.gov/climate/projects/solar-irradiance /science
Molina‐Montenegro, M A , Egas, C , Ballesteros, G , Acuña‐Rodríguez, I. S., San Martín, F., & Gianoli, E. (2024). Sunspot activity influences tree growth: Molecular evidence and ecological implications. Molecular Ecology, 33(8), e16813 https://doi org/10 1111/mec 16813
Muir, M. (2023). Green Revolution | Agriculture and Agribusiness | Research Starters | EBSCO Research. EBSCO. https://www.ebsco.com
Optimal Climate and Soil Conditions for Rice Cultivation Agriculture Notes by Agriculture.Institute. (2023, December 2).
https://agriculture.institute/agriculture-fundamentals/optimal -climate-soil-conditions-rice-cultivation/
Optimal Conditions for Wheat Cultivation Agriculture Notes by Agriculture.Institute. (2023, December 10).
https://agriculture.institute/agriculture-fundamentals/optimal -conditions-wheat-cultivation/
Poluianov, S V, Usoskin, I G , & Kovaltsov, G A (2014)
Cosmogenic Isotope Variability During the Maunder Minimum: Normal 11-year Cycles Are Expected. Solar Physics, 289(12), 4701–4709.
https://doi org/10 1007/s11207-014-0587-6
Poutanen, K. S., Kårlund, A. O., Gómez-Gallego, C., Johansson, D. P., Scheers, N. M., Marklinder, I. M., Eriksen, A. K., Silventoinen, P. C., Nordlund, E., Sozer, N., Hanhineva, K J , Kolehmainen, M , & Landberg, R (2022)
Grains – a major source of sustainable protein for health. Nutrition Reviews, 80(6), 1648–1663.
https://doi.org/10.1093/nutrit/nuab084
Pustilnik, L. A., & Din, G. Y. (2004). Space Climate Manifestation in Earth Prices From Medieval England Up to Modern Usa. Solar Physics, 224(1–2), 473–481. https://doi.org/10.1007/s11207-005-5198-9
Scafetta, N. (2014). Global temperatures and sunspot numbers Are they related? Yes, but non linearly A reply to Gil-Alana et al. (2014). Physica A: Statistical Mechanics and Its Applications, 413, 329–342.
https://doi.org/10.1016/j.physa.2014.06.047
The Galileo Project | Science | Susnpot Drawings (n d ) Retrieved March 1, 2026, from
https://galileo.library.rice.edu/sci/observations/sunspot dra wings.html
The solar cycle, a heartbeat of stellar energy. (2025, October 5)
https://www.esa.int/Science Exploration/Space Science/T he _ solar _cycle_a_heartbeat_of_stellar_energy
Wickham H, Averick M, Bryan J, Chang W, McGowan LD, François R, Grolemund G, Hayes A, Henry L, Hester J, Kuhn M, Pedersen TL, Miller E, Bache SM, Müller K, Ooms J, Robinson D, Seidel DP, Spinu V, Takahashi K, Vaughan D, Wilke C, Woo K, Yutani H (2019). “Welcome to the tidyverse.” Journal of Open Source Software, 4(43), 1686 doi:10 21105/joss 01686
Wickham H, Bryan J (2025). readxl: Read Excel Files . R package version 1.4.5, https://CRAN.R-project.org/package=readxl.
Yang, Y, Guo, X , Liu, G , Liu, W, Xue, J , Ming, B , Xie, R., Wang, K., Hou, P., & Li, S. (2021). Solar Radiation Effects on Dry Matter Accumulations and Transfer in Maize. Frontiers in Plant Science, 12, 727134. https://doi org/10 3389/fpls 2021 727134
Zeileis, A., & Grothendieck, G. (2005). zoo: S3 Infrastructure for Regular and Irregular Time Series. Journal of Statistical Software, 14(6), 1–27. https://doi.org/10.18637/jss.v014.i06