Single-CellRNASequencing
RNAsequencingisamolecularbiologytechniqueusedto determinewhichRNAmoleculesarepresentinacellandinwhat quantities.Itallowsresearcherstoidentifywhichgenesareturned on,compareexpressionlevelsacrossconditions,andtrackhow geneexpressionchangesovertimeorinresponsetodisease.Over thepastdecade,thistechniquehasprovedtobeapowerfultoolin cancerresearchforuncoveringgeneexpressionpatternsthatdrive tumordevelopmentandprogression. 8
TraditionalRNAsequencing,knownasbulksequencing, measuresgeneexpressionbyanalyzingRNApooledfrommillions ofcellswithinatissuesample.Whilethisapproachisusefulfor identifyingbroadtrends,itgeneratesanaverageexpressionprofile thatoverlooksthesubstantialheterogeneitythatexistsamong individualcellsincomplextissuessuchastumors. 8,9 Singlecell RNAsequencing(scRNA-seq),whichhasgainedpopularityinthe pastfewyears,overcomesthelimitationofbulksequencingby measuringgeneexpressionatthelevelofindividualcells.By isolatingandsequencingRNAfromthousandsofindividualcells simultaneously,scRNAmakesitpossibletodistinguishdistinct celltypesandstatespresentinasample.Thishigh-resolutionview alsoallowsresearcherstodetectraresubpopulationsthatplaya criticalroleindiseaseprogressionandthatwouldotherwisebe obscuredbybulksequencing.
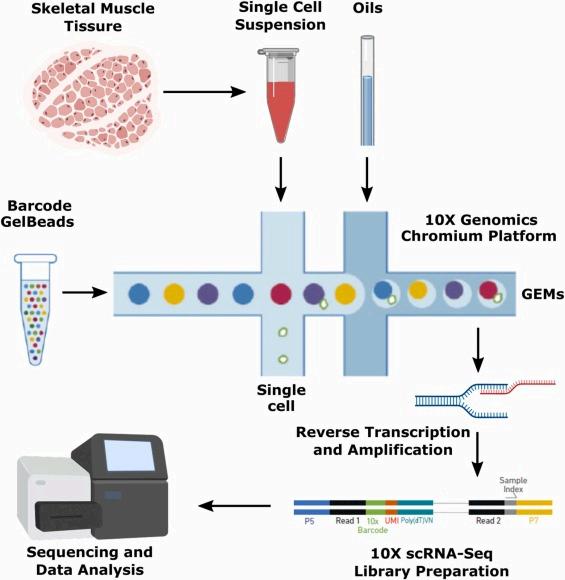
Figure 1. Experimentalstepsofsingle-cellRNAsequencing10
scRNA-seqdataaretypicallygeneratedexperimentallyin molecularbiologylabs.ThestepsareshowninFigure1.First,a bonemarrowsampleiscollectedfromadonorandenzymatically brokendownintoindividualcells.Theresultingcellsuspensionis thenloadedintoamicrofluidicdevicecalled10xGenomics Chromium,whichcaptureseachcellinatinyoildropletalong withabarcodedbead.Wheneachcelllyses,itsmessengerRNA (mRNA)bindstothebarcodedbeads.Theuniquebarcodeensures thateverymRNAmoleculecanlaterbetracedbacktoitsoriginal cell.ThecapturedRNAisthenreverse-transcribedtocDNA, amplified,sequenced,andcomputationallyprocessedtoquantify geneexpressionforeverycell.Thefinaloutputisagene expressionmatrixinwhicheachcolumncorrespondstoagene, eachrowcorrespondstoanindividualcell,andeachvalue representstheabundanceofagivengeneinagivencell.
Sincetheinventionofsingle-cellRNAsequencing,vast collectionsofsingle-celldatahavebecomeavailableacross tissues,conditions,anddiseasescontexts.Manyrecentscientific studiessoughttointegratethesesingle-celldatasetstoaddress complexbiologicalquestions;however,thetechnicaland biologicalheterogeneityarisingfromdifferencesinsample collectionmethods,sequencingplatforms,andlibrarypreparation protocols,whichareprocessesusedtoconvertRNAintobarcoded, sequencing-readyDNAfragments,posedasignificantchallengeto effectivedataintegration.Thislimitationincreasedtheneedfor unifiedmodelscapableofintegratingdiversesingle-celldatasets. 11
Meanwhile,computermodelscalledtransformer architectureshadrevolutionizedlanguageprocessingbycapturing intricaterelationshipsindata.Thesearchitecturespavedtheway forthedevelopmentoffoundationmodels,whicharelarge-scale andself-supervisedAImodelstrainedonvastdatasetsthatcanbe adaptedtovariousdownstreamtasks.Inspiredbythisadvancement inlanguageprocessing,researchersleveragedthesame transformer-basedarchitecturetocreatesingle-cellfoundation modelsthatcanbetrainedondiversedatasetsandanalyze underlyingpatternsinbiologicaldata.
Single-cellGenerativePre-trainedtransformer(scGPT)isa transformer-basedfoundationdesignedspecificallyforsingle-cell biology.Insteadofwords,scGPTtakesgenesasitsbasicunits,and insteadofsentences,itworkswithindividualcells.Theinputto scGPTconsistsofthreemaincomponents:genetokens,expression values,andconditiontokens.Genetokensfunctionasunique identifiersforeachgene,allowingthemodeltorecognizeand learnrelationshipsbetweenspecificgenesacrossmanycells. Expressionvaluesindicatehowstronglyageneisexpressedwithin agivencell.Conditiontokensprovideadditionalcontextaboutthe cell,suchasdiseasestage,treatmentstatus,ordatasetoforigin.
Thisstructureenablesthemodeltocomparecellswhileaccounting forbiologicalcontext.Eachcellinitiallyhasexpressionvaluesfor thousandsofgenes,whicharehigh-dimensionalanddifficultto comparedirectlyacrosscellsanddatasets.ScGPTtransformsthis high-dimensionalinformationintoafixed-lengthvector,also calledanembedding,thatcapturesthekeypatternsingene expressionwhilediscardingredundantinformation. 12,13
Thecoremechanismoftransformermodelsis self-attention,whichenablesthemodeltoconsiderallelementsof theinputatthesametimeandlearnhowtheyrelatetooneanother. Inlanguagemodels,thislearningisachievedthroughaspecial kindofself-attentioncalledcausalmaskedattention,wherethe modeltriestopredictthenextwordsolelybasedonthe informationfrompreviouswords.AlthoughscGPTandGPT languagemodelssharethesamearchitecture,they’reinherently differentduetothenon-sequentialnatureofbiologicaldata.Unlike wordsinasentence,theorderofgenesisinterchangeable,and thereisnospecific‘nextgene’topredict.Thiscoredifference makesithardtoapplythesamemaskedlearningformulationused inGPTmodelstoscGPT.Insteadofenforcingwordorder,scGPT usesmaskedself-attentiontohidetheexpressionvaluesofcertain genesandchallengeitselftopredictthemissingvaluesbasedon theremainingones.Itexamineswhatgenestendtoturnon togetherandworktowardthesamegoal,orwhatgeneshave opposingeffects.Byrepeatingthistaskacrossmillionsofcells,it ultimatelylearnsthefundamentaltranscriptionalpatternsthat defineacell’sstateandfunction. 12
Methods
ComputationalAnalysis
Inthisstudy,scRNA-seqdatawerenotdirectlygenerated inthelabbutratherobtainedthroughthedatabaseGene ExpressionOmnibus(GEO),specificallythedatasetsGSE163278,
GSE161195,GSE120221,GSE124310,GSE156728, phs002476.v1.p1,GSE106218,GSE124310,GSE271107,and thosestoredinhumanatlas.Weusedsinglecelldatafrompatients acrossdifferentstagesofMMandhealthydonors.Thecollected dataunderwentpre-processinginScanpy,apythontoolkit specificallydesignedforanalyzingsingle-celldata.
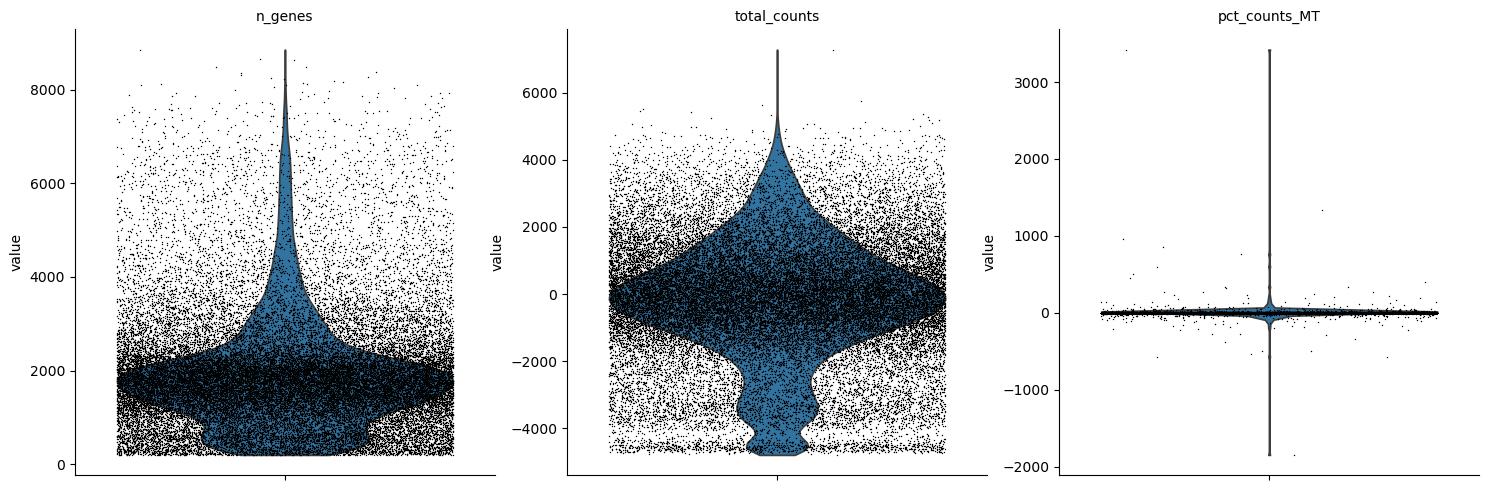
Thefirststepwasqualitycontrol(QC),whichinvolved filteringoutcellsthatweredamagedorcapturedlittletonoRNA duringtissueprocessing.KeyQCmetrics,includingthenumberof detectedgenes,totalRNAcounts,andmitochondrialgene expressionpercell,werevisualizedusingviolinplotstoassess dataqualityandidentifyfilteringthresholds.13 Cellswithhigh mitochondrialcounts,whichisindicativeofcellularstressorcell death,andcellswithlowtotalRNAcountswereexcludedfrom downstreamanalysis.Additionally,genesexpressedinveryfew cellswerealsoremovedtoreducethecomputationalload.Figure2 showsviolinplotsusedforoneofthedatasets.Eachdotonthe plotsrepresentsacell.Althoughmostcellsshowedlow mitochondriaexpression,asubsetdisplayedelevatedvalues consistentwithstressedorlowqualitycellsandweretherefore removedduringQC.
Figure2.Violinplotsvisualizingthenumberofdetectedgenes,totalRNA counts,andmitochondrialgeneexpressionpercell,respectively.
Thenextstepwasnormalizationandscaling.Thequantity ofmRNAcapturedfromeachcellmayvaryduetobiological differencesortechnicalfactorsintroducedduringcellisolationand sequencing.Thesetechnicaldifferencescreatebiasesinthedata:a cellwithmoretotalcountswillappeartoexpresseverygeneata higherlevel,evenifthatisnotactuallythecase.Normalization addressesthisproblembyrescalinggeneexpressionvaluesineach cellaccordingtohowmuchtotalmRNAwascaptured.Inother words,itmakesgeneexpressionvaluescomparableacross differentcells.14,15 Figure3illustratestheeffectofnormalization. Intherightpanel,genesdisplayabroadrangeofvariabilitythat increaseswithmeanexpression.Ontheotherhand,intheleft panel,normalizationremovesthisexpression-dependent relationship,causingmostgenestoclusteraroundtheexpected baseline,whichis0(thisnumbermightvarydependingonthe dataset),whilehighlightingasubsetofgenes(representedwith blackdots)withunusuallyhighcell-to-cellvariability.Thisallows highlyvariablegenestobeaccuratelyidentifiedandselectedfor downstreamanalysis,whichisacrucialcomponentofthe computationalworkflow,sincehighlyvariablegenesaretheones thatdistinguishcellsfromoneanothermosteffectively.
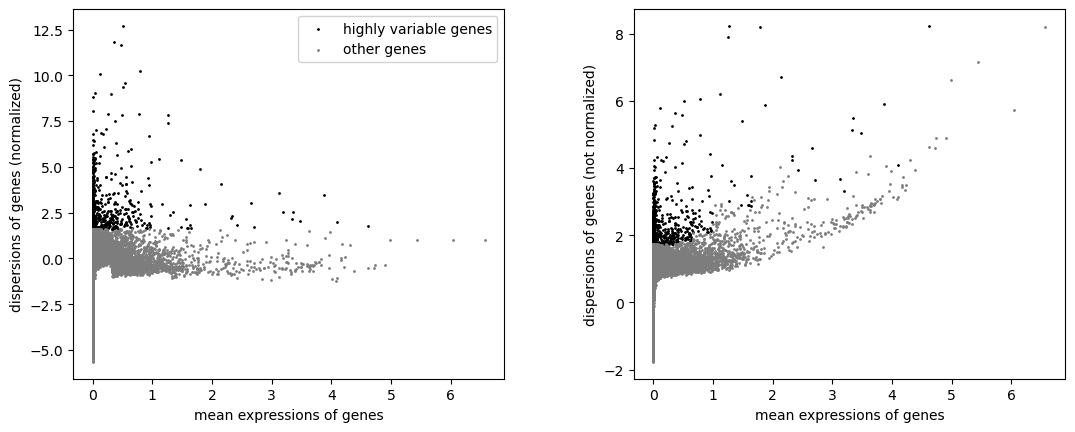
Figure3.Scatterplotsshowingmeanexpressionofgenesversusdispersion beforeandafternormalization.
Normalizationwasfollowedbydimensionalityreduction. Eachcellcanhaveexpressionlevelsforthousandsofgenes,which createsahigh-dimensionaldatasetthatisveryhardtovisualize, cluster,andinterpret.Dimensionalityreductioncompressesthe informationintoasmallernumberofdimensionsthatstillcapture themajorsourcesofvariationacrosscells,whichmakesthe subsequentstepsmucheasierandmoreeffective.14 Principal componentanalysis(PCA)wasusedastheprimarydimensionality reductionmethod,whichtransformedtheoriginalgeneexpression matrixintoanewsetofvariablescalledprincipalcomponents, eachofwhichrepresentsadistinctdirectionofvariationinthe data.Todecidehowmanydimensionstokeepfordownstream analysis,PCAvarianceratiowasexamined,whichindicatesthe fractionoftotalvarianceexplainedbyeachprincipalcomponent (PC).AsshowninFigure4,thefirstfewPCscapturethemajor sourcesofvariationinthedataset.AsadditionalPCsareincluded, eachsuccessivecomponentexplainsasmalleramountofvariance, whichisreflectedinthegradualflatteningofthecurve.Basedon thevarianceprofile,acutoffwasselectedatthepointwherethe varianceratiobegantoleveloff,andonlythePCsprecedingthis cutoffwereretainedfordownstreamanalysis.
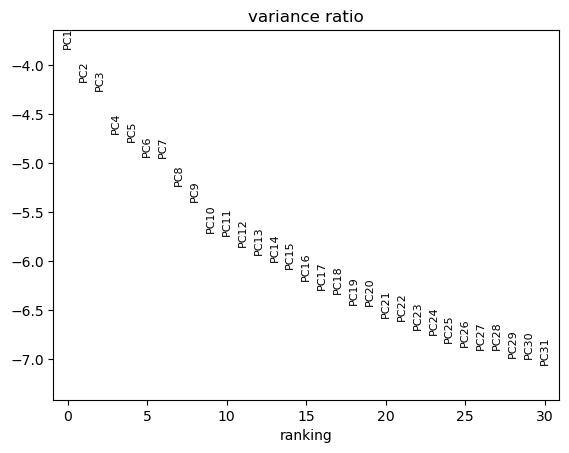
Figure4.Varianceexplainedbyprincipalcomponentsrankedindecreasing order
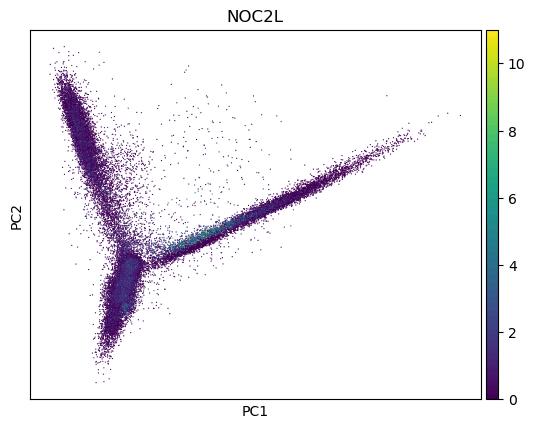
Asthequality-controlstep,cellswerevisualizedinscatter plotsusingthefirsttwoprincipalcomponents,PC1andPC2, whichrepresentthedirectionswherecellsdifferthemostoverall. ToconfirmtheaccuracyofPCAandassesswhetherthe differencescapturedbyPC1andPC2reflectedrealbiologyrather thanrandomvariation,cellswerecoloredbytheexpressionofa knownmarkergene,suchasNO2CL,asshowninFigure5.Ifcells withhighexpressionofagivenmarkeroccupiedaspecificregion ofthePCAplotinsteadofbeingrandomlyscattered,thisindicated thatthevariationcapturedbyPCAcorrespondedtorealbiological differencesbetweencells.
Figure5 Scatterplotofcellsprojectedontothefirsttwoprincipalcomponents (PC1andPC2),coloredbyNOC2Lexpression.
AsseeninFigure5,eachcellwasrepresentedasapointin alower-dimensionspaceafterPCA.AK-nearestneighbors(KNN) algorithmwasthenappliedtocalculatethedistancebetweena givencellandallothercellsinthisPC-reducedspaceandidentify, foreachcell,kclosestcellsasitsneighbors.Repeatingthisprocess foreverycellgeneratedacell-cellgraph,whereeachcellwas connectedtoitsneighborsbasedongeneexpressionprofile.This graphprovidedafoundationforapplyingtheLeidenalgorithm, whichpartitionedcellsintoclusters.Leidenwasrunatmultiple
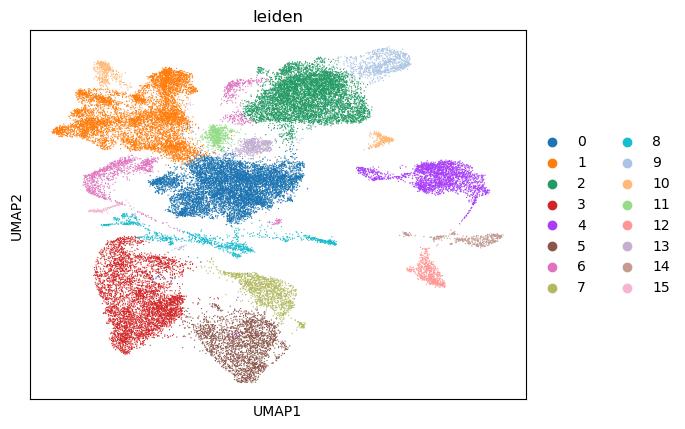
differentresolutions(resolution=0.4,0.6,and1.4)toidentifythe bestscaleforclustering.UniformManifoldApproximationand Projection(UMAP)plots,showninFigure6,werethenusedto generatetwo-dimensionalvisualmapsofdistinctclusters.Each clusterwasrepresentedwithadifferentcolor.WhileUMAP visualizationmadeiteasiertoobservepatternswithinthedataand seehowclusterswerearrangedrelativetooneanother,itdidnot informabouttheclusters’biologicalidentity.
Figure6.UMAPvisualizationofsinglecellscoloredbyLeidenclustering.
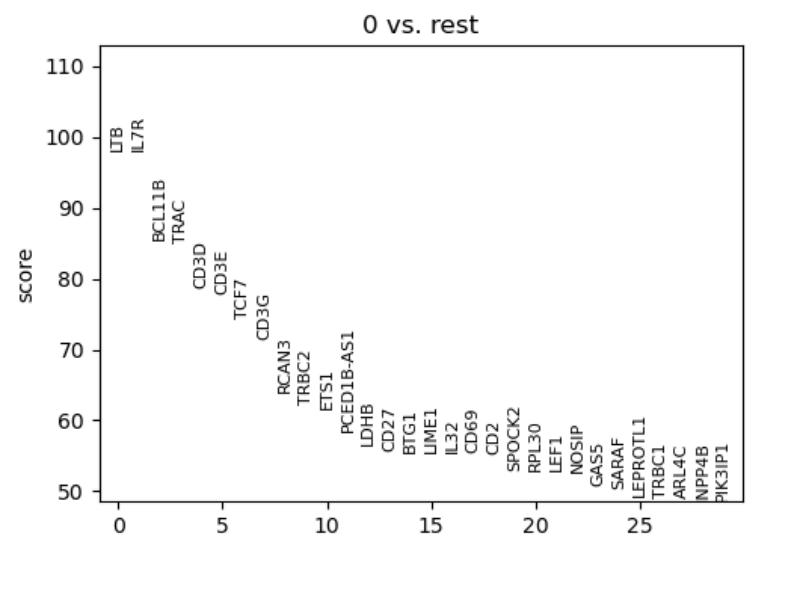
Todeterminewhateachclusterrepresentedbiologically, cellannotationwasnecessary.Thisprocessinvolvedidentifying markergenesthatweremuchmorehighlyexpressedinonecluster thaninothers.Toidentifythesegenes,weconducteddifferential expressionanalysis,specificallytheWilcoxonrank-sumtest,in whichcellswithinagivenclusterwerestatisticallycomparedtoall remainingcellsinthedataset.Figure6illustratesdifferential expressionanalysisforaclusterinoneofthedatasets.Eachgene wasassignedascore,whichisastatisticalmeasureofhow stronglythatgenedistinguishesoneclusterfromtherest.Genes withthehighestscoreswereconsideredthemostinformative markers.Tovalidatetheaccuracyofmarkergenesidentifiedby Wilcoxonrank-sumtest,resultswerecomparedwiththose
obtainedusingat-test,andoverlapbetweenthetwomethodswas assessedusingavenndiagram.
Figure7 DifferentiallyexpressedmarkergenesforLeidencluster0identified byone-versus-restcomparison
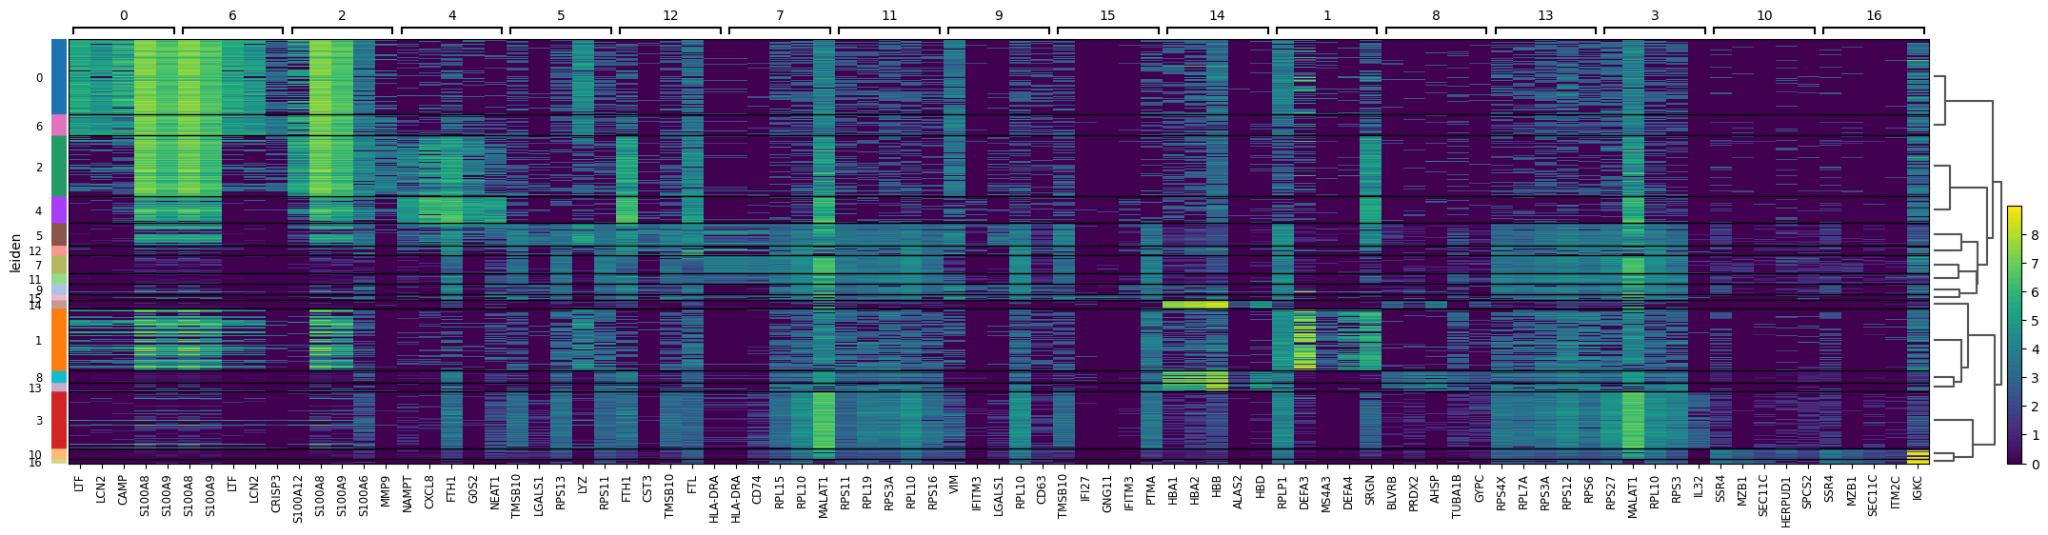
Heatmapswerethengeneratedtovisualizetheexpression patternsoftopmarkergenesidentifiedbyWilcoxonrank-sumtest. Intheheatmaps,suchastheoneillustratedinFigure7,rows correspondedtodifferentclustersobtainedusingLeiden,whereas columnscorrespondedtomarkergenesrankedbytheirdifferential expressionscores.Thecolorintensityreflectedrelativeexpression levels,whichallowedclearvisualizationofgenesthatwerehighly expressedinspecificclustersandlowinothers.Thetopmarker geneswerematchedtowell-knownmarkersfrompublished studies,databasesorreferenceatlases.Basedonthiscomparison,a biologicalidentitywasassignedtoeachcluster,enablingusto interpretthecellularcompositionofthebonemarrow microenvironmentindifferentpatients.
Figure8.Heatmapshowingcluster-specificmarkergeneexpressionacross Leiden-definedcellpopulations
TrainingscGPT
FollowingstandardscRNA-seqpreprocessingandanalysis, curatedgeneexpressionmatriceswereusedasinputforscGPT modeltraining.Themodelwastrainedintwostages:pre-training andfine-tuning.Duringpre-training,scRNA-seqdatafromall sampleswereusedwithoutcelltype,diseasestate,ortreatment responselabels,enablingthemodeltolearngeneralgene expressionstructureandcell-staterepresentationsina self-supervisedmannerthroughmaskedgenemodelingand self-attentionmechanisms.
Theprojectiscurrentlyatthebeginningofthefine-tuning process,wherethepre-trainedmodelwillbeadaptedtospecific downstreamtasksusingadditionalcontextualinformation, includingcell-typeannotations,diseasestagelabels,and treatment-relatedmetadata.ForCAR-Tcellresponseprediction, allsinglecellsfromeachpatientwillbetreatedcollectivelyasa set.Withinthemodel,thesecellswillbecombinedusingan attention-basedpoolingmechanismthatlearnstoassigndifferent weightstodifferentcellsbasedontheirrelevancetotreatment outcome.Cellswhosetranscriptionalprofilesareconsistently associatedwithresponseorresistancewillreceiveahigher attentionweight,whilethosethatcontributeminimallywillreceive alowerscore.Thisweightedaggregationwillproduceasingle patient-levelembeddingwhichwillthenbepassedtoaprediction
layerinsidethemodel.Thislayerisasimplesupervisedclassifier thatwillbetrainedusingknownclinicaloutcomes.During training,themodelwillrepeatedlycompareitspredictedresponse withthetrueresponselabel(responderornon-responder)and adjustitsinternalparameterstoreducepredictionerror.Overtime, theclassifierwilllearnhowspecificpatternsinthepatient-level representationcorrespondtosuccessfulorunsuccessfulCAR-T treatment.
Whenappliedtoanewpatient,thesamestepswillbe followed:thepatient’ssingle-celldatafrombonemarrowwillbe aggregatedintopatient-levelrepresentationusingattention weights,andthenfedintothepredictionlayer.Theoutputofthis layerwillbearesponsescore,typicallyinterpretedasthe probabilityofCAR-Tcelltherapyresponse.Athresholdonthis probabilitywillthenbedeterminedtoclassifywhichpatientsfall intotheresponderornon-respondercategory.
Results
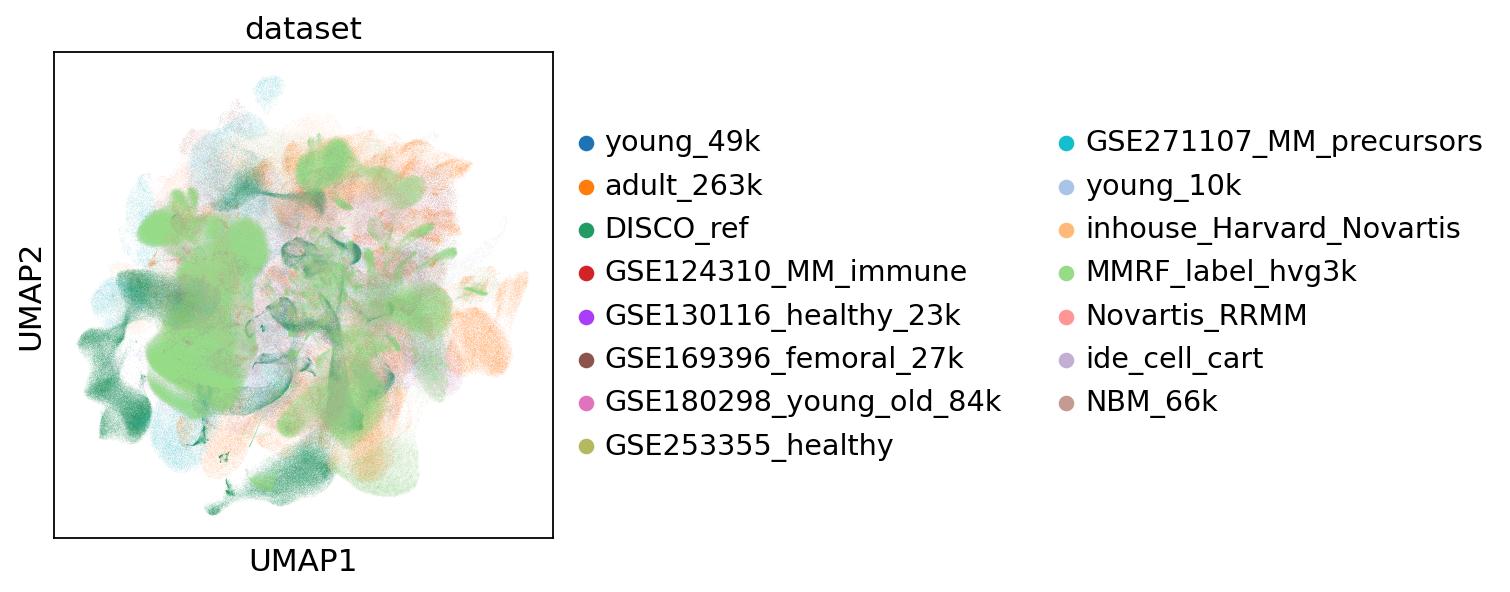
Figure9.UMAPvisualizationoftheintegrateddatasets,coloredbydataset source
Weintegrated14publiclyavailabledatasetsspanning normalbonemarrow(NBM),MGUS,SMM,andMM.After qualitycontrolandfiltering,2,616,376cellswereretainedfor downstreamanalysis,1.56%beingMGUS,1.57%beingSMM,
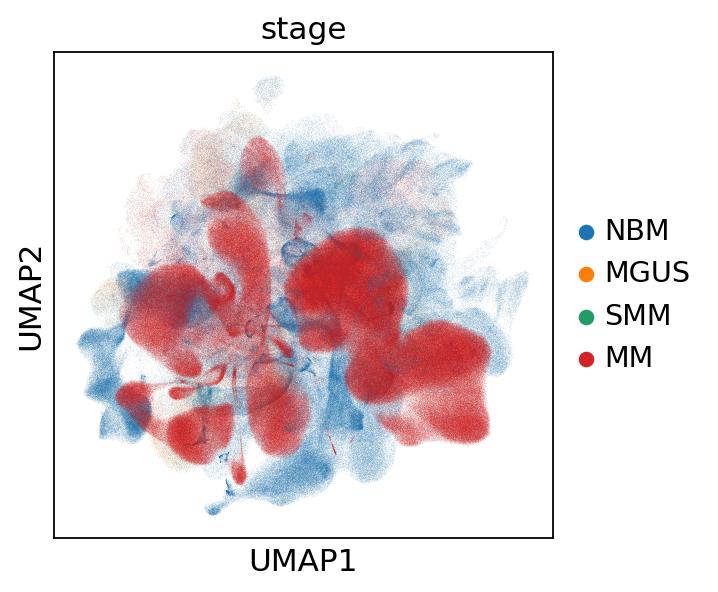
59%beingMM,38%beingNBM.Wecollectedimmune-celldata frompatientsacrossawideagerange,withameanageof44.94 years( 6.32).UMAPvisualizationoftheintegrateddataset± coloredbydatasetsourceshowedextensivemixingofcellsfrom differentstudies,withnodatasetforminganisolatedcluster.This overlapindicatessuccessfulintegration.TheUMAPvisualization infigure9wascoloredbydiseasestage.Normalbonemarrow cellswerewidelydistributedacrosstheembedding.Asdisease progressedfromMGUStosymptomaticMM,theredclusters localizedincertainregionsoftheUMAP,formingdenserareas, buttheystilloverlappedsignificantlywithearlierstages.This findingalignswiththebiologicalunderstandingthatthemalignant transformationinMMisgradual.
Figure10.UMAPvisualizationoftheintegrateddatasets,coloredbydisease stage
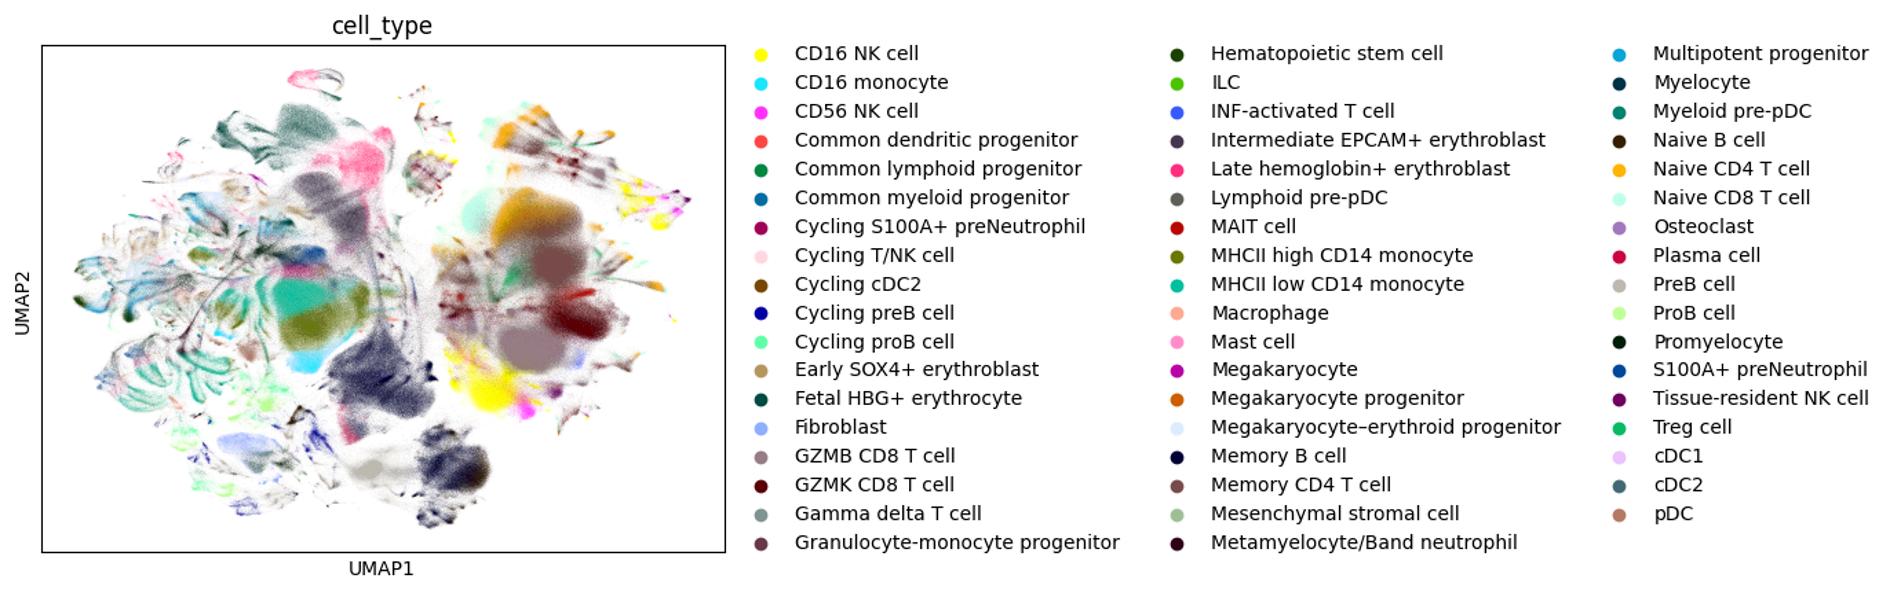
Figure11representsthe UMAPembeddinggeneratedafter thefinaldifferentialexpressionanalysisofallscRNA-seqdatasets includedinthisstudy.Thevisualizationrevealsdistinctclusters correspondingtomultiplebonemarrowpopulations,including malignantplasmacellsaswellasdiverseimmunecelltypessuch asTcells,Bcells,NKcells,andmyeloidpopulation.Withinthe
lymphocytepopulations,bothnaiveandmemoryTandBcells wereidentifiable,whichshowsthatthedatasetcapturesfunctional immunestatesinadditiontocellidentity.Thisdiversityis particularlyimportantforpredictingCAR-Tcelltherapyresponse, becauseCAR-Tcelltherapyworksbygivingpatientsliving immunecellsthatmustmultiplyandremainactiveinthebodyto keepthecancerundercontrol,sotreatmentsuccessdependsnot onlyonthecanceritself,butalsoonhowhealthyandsupportive thepatient’simmunesystemis.Thepresenceofdifferentimmune cellstateslikenaiveandmemorylymphocytesthereforesuggests thatthedatasetcontainsbiologicallyrelevantinformationthatcan helpexplainwhysomepatientsrespondtoCAR-Ttherapywhile othersrelapse.
Figure11.UMAPvisualizationofdifferentcelltypesandimmunestatesthat existinallofthedatasetscollected
Discussion
Acentralobjectiveofthestudyistocreateacomputational frameworkcapableofcapturingcellularheterogeneityrelevantto therapeuticresponse,particularlyinthecontextofCAR-Tcell therapy.Althoughpredictiveperformancehasnotyetbeentested inthefine-tuningstage,theoverlappingtranscriptionalstatesin UMAPSacrossdiseasestagesunderscoretheneedformodelsthat canmovebeyondsimpleclusteringandanalyzeunderlying gene-geneinteractionsandcellularfeaturesthatcharacterizethe bonemarrow.Afterbothpretrainingandfinetuningarecompleted, thescGPTmodelisexpectedtoserveasaclinicallyimportanttool
foranalyzinganewpatient’sbonemarrowprofileinrelationto previouslyanalyzeddataforbothCAR-Tcelltherapyresponders andnon-responders,supportingmoreinformedandindividualized treatmentdecisions.
Limitations
Thisstudyhasseverallimitationsthatshouldbetakeninto account.First,theanalysisreliesonsingle-cellRNA-seqdata derivedfrombonemarrowsampleswhichareobtainedfroma painfulprocesscalledbonemarrowaspiratebiopsythatalotof peopleareunwillingtoundergo.Asaresult,thecurrentlyavailable datasetsarelimitedinsizeandmaynotfullyrepresentthe diversityofthepatientpopulations.Second,althoughmultiple diseasestageswereincluded,clinicalmetadatawereunevenly distributed,meaningthatanunequalnumberofpatientsineach diseasestagewereevaluatedforthestudy.MoreMGUSandSMM dataneedtobecollectedinordertoobtainamoreaccurate representationoftranscriptionalandcellularstatesthatdefineeach diseasestageortherapeuticresponse.Thegoalistotrainthe scGPTmodelonatleast10millioncells.
FutureDirections
FutureworkwillfocusonexpandingthescGPTtrainingto includedatafrompatientsdiagnosedwithothertypesofblood cancerssuchasleukemia,wheresimilarchallengespertainingto cellularheterogeneityandtreatmentresponseremain.Moreover, thecomputationalframeworkoffersanopportunitytoaddress unresolvedbiologicalquestionsinMM,suchastheheterogeneity seeninSMMpatients.Asmentionedintheintroduction,SMMis theintermediatestageonthediseasespectrum.SomeSMM patientscloselyresemblethosewithMGUSandexhibitveryslow diseaseprogression,oftennotrequiringimmediatemedical intervention.Ontheotherhand,someSMMpatientsclosely resembleMMandprogressrapidly,whichindicatesaneedfor
earlymedicalintervention.BecausethescGPTmodelcan differentiatethebonemarrownicheacrossdiseasestages,itcan distinguishMGUS-likefromMM-likeSMMpatients. Thisclassificationhasthepotentialtoprovideinsightinto progressionriskandallowclinicianstomakemoreinformed decisionsastowhetherandwhenatreatmentshouldbeinitiated.
AdditionalImplicationsforTherapeuticResponse
Inadditiontodiseasestageandcell-composition,immune aging,definedastheageofone’simmunesystem,maybea potentialcontributortovariabilityinCAR-Tcelltherapyresponse. CAR-Tcellsdependonthefunctionalcapacityofapatient’s immunesystemforsuccessfulexpansion,persistence,andtumor killingactivityafterinfusion.Astheimmunesystemages,Tcells oftenexhibitreducedproliferativecapacity,increasedimmune exhaustion,andalteredinflammatorysignaling,allofwhichcan compromiseCAR-Tcelltherapy’sperformance.Importantly, althoughchronologicalageinfluencesimmuneage,itisnotthe onlydeterminingfactor.Patientsofsimilaragemaydisplay remarkablydifferentimmunecellstatesduetofactorssuchasprior treatments,diseaseburden,andcumulativeimmunestress.Asa futuredirection,scGPT-derivedembeddingscouldbeusedto quantifyimmuneagewithinmajorimmunecelltypes,and patient-levelmeasurementscouldbeevaluatedatbaselineand earlypost-treatmenttimepoints.Exploringimmuneageatthe singlecelllevelmaythereforerepresentabiologicallyplausible avenueforunderstandingvariabilityintherapeuticresponseand informouranswertothefollowingquestions:WhydoMM patientsatthesamediseasestageshowdifferentresponsesto CAR-Tcelltherapy?Whydopeopleofsimilaragerespond differently?
Conclusion
Acureformultiplemyelomamaystillbeelusive,but advancementsinRNAsequencingtechniquesandAImodelingare pavingthewayforamorecomprehensiveunderstandingofthe diseasepathophysiologyandthebonemarrowniche,whichplaysa particularlycrucialroleinthediseaseprogressionbyallowing complexinteractionsbetweenmalignantplasmacellsandimmune cellpopulations.
ThisstudyintegrateddiversescRNA-seqdatasetsspanning MGUS,SMM,andMM,andanalyzedthemusingPython, performingstepsincludingpreprocessing,normalization, dimensionalityreduction,clustering,andcell-annotation,toretain onlythebiologicallymeaningfulcellularfeatures.This computationalworkflowprovidedafoundationforbuildinga transformer-basedscGPTmodelthatcanunderstandcellular heterogeneityacrossdiseaseprogression.Moreover,themodelis currentlybeingtrainedtogeneratepatient-levelembeddingsfrom thesingle-celldataofCAR-Tcelltherapyrespondersand non-responders,enablingtheexplorationofresponse-associated immunecellstates.Themodelmaythenbeusedasaclinicaltool foranalyzingnewpatients’bonemarrowandpredictinghowlikely theyaretorespondtoCAR-Tcelltherapy.Aslargerdatasets becomeavailable,thismodelcoulddeepenbiologicalinsightsinto mechanismsoftreatmentresistance,andcontributetothe developmentofmorepersonalizedtherapeuticstrategiesforMM.
Inaddition,theinclusionofpatientsacrossawideage rangecouldallowfortheinvestigationofimmuneagingasa potentialcontributortoCAR-Ttherapyefficacy.Futureworkon themodelpromisesevengreaterimpactbyextendingits applicationtootherbloodcancers,includingleukemia,where similarinteractionsbetweenmalignantcellsandtheimmune microenvironmentinfluencediseaseprogressionandtreatment response.
References
1. AbduhMS.Anoverviewofmultiplemyeloma:a monoclonalplasmacellmalignancy’sdiagnosis, management,andtreatmentmodalities. Saudi J Biol Sci. 2024;31(2).doi:10.1016/j.sjbs.2023.103920
2. FairfieldH,FalankC,AveryL,ReaganMR.Multiple myelomainthemarrow:pathogenesisandtreatments. Ann N Y Acad Sci.2016;1364(1).doi:10.1111/nyas.13038
3. AgafonovaA,PrinziC,TrovatoSalinaroA,LeddaC, CosentinoA,CambriaMT,etal.Breakingbarriers:therole ofthebonemarrowmicroenvironmentinmultiple myelomaprogression. Int J Mol Sci.2025;26(15).
doi:10.3390/ijms26157301
4. WangC,WangW,WangM,DengJ,SunC,HuY,etal. Differentevasionstrategiesinmultiplemyeloma. Front Immunol.2024;15.doi:10.3389/fimmu.2024.1346211
5. YangP,QuY,WangM,ChuB,ChenW,ZhengY,etal. Pathogenesisandtreatmentofmultiplemyeloma. MedComm.2022;3(2).doi:10.1002/mco2.146
6. FeinsS,KongW,WilliamsEF,MiloneMC,FraiettaJA. Anintroductiontochimericantigenreceptor(CAR)T-cell immunotherapyforhumancancer. Am J Hematol. 2019;94(S1).doi:10.1002/ajh.25418
7. GregorySY.UnderstandingCAR-Tcelltherapyforcancer: apromising,lessarduouscancertreatment.MayoClinic Press;2024Aug27.Available from:https://mcpress.mayoclinic.org/cancer/understandingcar-t-cell-therapy-for-cancer-a-promising-less-arduous-canc er-treatment/
8. HongM,TaoS,ZhangL,DiaoLT,HuangX,HuangS,et al.RNAsequencing:newtechnologiesandapplicationsin cancerresearch. J Hematol Oncol.2020;13(1). doi:10.1186/s13045-020-01005-x
9. CaiC,YueY,YueB.Single-cellRNAsequencingin skeletalmuscledevelopmentalbiology. Biomed Pharmacother.2023;162.
doi:10.1016/j.biopha.2023.114631
10.JovicD,LiangX,ZengH,LinL,XuF,LuoY.Single-cell RNAsequencingtechnologiesandapplications:abrief overview. Clin Transl Med.2022;12(3). doi:10.1002/ctm2.694
11. BaekS,SongK,LeeI.Single-cellfoundationmodels: bringingartificialintelligenceintocellbiology. Exp Mol Med.2025;57(10).doi:10.1038/s12276-025-01547-5
12.Amanatullah.(2023,September1). Transformer Architecture explained.Medium. https://medium.com/@amanatulla1606/transformer-archite cture-explained-2c49e2257b4c
13.CuiH,WangC,MaanH,PangK,LuoF,DuanN,etal. scGPT:towardbuildingafoundationmodelforsingle-cell multi-omicsusinggenerativeAI. Nat Methods.2024;21(8).
doi:10.1038/s41592-024-02201-0
14.SlovinS,CarissimoA,PanarielloF,GrimaldiA,BouchéV, GambardellaG,CacchiarelliD.Single-cellRNA sequencinganalysis:astep-by-stepoverview.In: Methods in Molecular Biology.Vol.2284.2021. doi:10.1007/978-1-0716-1307-8_19