14 minute read
and 21st centuries? Richard G. Jefferson


An historic herbarium: what can it tell us about the changing flora of Britain in the 20th and 21st centuries?
RICHARD G. JEFFERSON
Advertisement
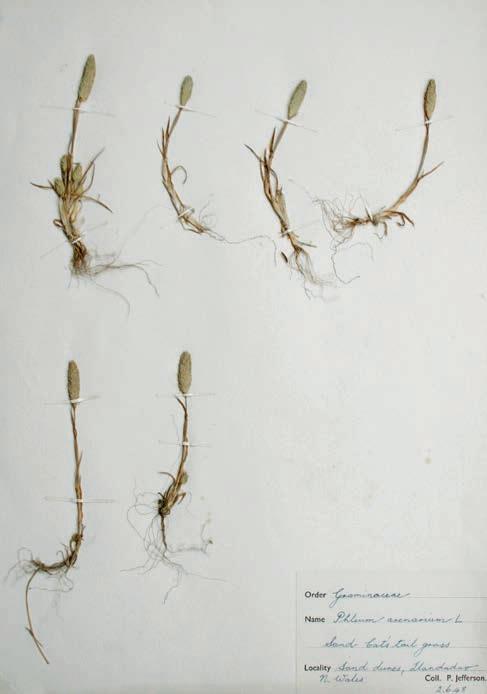
Herbarium sheet of Phleum arenarium (Sand Cat’stail) collected by Peter Jefferson from ‘sand dunes, Llandudno, N. Wales’, 2 June 1948.
Over the last eight decades, the native flora of Great Britain has undergone substantial change with some species extinctions but with many more species having suffered from contractions in range and/or in the number and size of their populations. The 20th century was a period of heightened extinctions in the vascular flora at different geographical scales with seminatural habitat specialist species being particularly extinction-prone (Stroh et al., 2019; Walker, 2003; Walker & Preston, 2006; Walker et al., 2017).
This article describes a small herbarium of vascular plants collected and assembled during the 1940s and 1950s and, with the assistance of the BSBI Distribution Database (DDb), explores what can be concluded with respect of changes in the British flora over the last 80 years or so.
Background to the herbarium
Between 1943 and 1956, my father, the late Peter Jefferson (PJ), put together a small herbarium of flowering plants from a variety of localities across Great Britain. In 2018, the information in the herbarium was collated and documented by the author prior to donation to the Natural History Museum, London (BM). This provided an opportunity to assess whether the information contained in the documentation of each specimen could be used to provide further insights into change in the British flora since the 1930s.
By way of context, my father was a zoologist with an amateur interest in botany. He worked for the Sports Turf Research Institute at Bingley, West Yorkshire (STRI) until 1956 where he researched the effects of the impacts of earthworms on sports turf (e.g. Jefferson 1956). During this period, he resided in Bramley, Leeds. He then lectured in Zoology at Nottingham College of Technology (now Nottingham Trent University). During his stint working for STRI, he was involved in advising on the management of golf courses around the country. This enabled him to visit sites on or within the vicinity of golf courses (but by no means exclusively) and to collect plants from around Great Britain. However, specimens from West and North Yorkshire make up a significant proportion of the collection.
The herbarium
The herbarium consists of 299 specimens of pressed vascular plants mounted on 38 × 28 cm cartridge paper. In most cases, information provided included the locality, habitat and date of collection. The locality is sometimes quite specific, such as a site name, e.g. Austwick Moss, and in other cases more general, e.g. ‘near Rievaulx Abbey, North Yorkshire’. Photographs of two of the specimens are shown on pages 31 and 34.
What information was collated?
Thirty-four specimens were omitted from this analysis where there was (i) no locality information, (ii) species could not be identified and/or had no locality information and (iii) specimens were not identified to species. Non-native species (neophytes) were also omitted. This left 265 species. The information from the herbarium labels was entered into a Microsoft Excel spreadsheet. The locality was then spatially referenced depending on the detail of the site or locality information. In all cases it proved possible to at least allocate a specimen to a hectad (10 × 10 km square) and in many cases more detailed locational information could be determined – tetrad (2 × 2 km square), monad (1 × 1 km square) or 6-figure grid reference.
Following this, records for each species in the respective localities were checked in the DDb, which contains records from pre-1930 to the present. For each of six recording periods (pre-1930, 1930–1969, 1970–1986, 1987–1999, 2000–2009 and 2010–2019) a record was ascribed to one of the following categories: 0 = no record for the species in the relevant hectad; 1 = a record for the hectad but at a different site or locality to that where recorded by PJ; 2 = general non-specific record(s) for hectad (not recorded if 3 applies); 3 = record for PJ site or locality; 4 = combination of 1 and 2 (not recorded if 3 applies).
If there was any doubt about whether a species was extant at the site or locality for a specific time period, then the assumption was always taken that it was ‘present’ rather than ‘absent’. A certain amount of judgement was required, especially when deciding whether a record in the DDb would conform to ‘cliffs near Lyme Regis’, for example.
Other information assembled for each species included the threat status (Cheffings et al., 2005; Dines, 2008; Stroh et al. 2014) and the Ellenberg N value (Hill et al., 2004).
Numbers of species and status
Of the 265 species, there are 9 shrubs/trees and 256 herbaceous vascular plants broken down as follows: 6 aquatic macrophytes, 12 orchids (Orchidaceae), 18 grasses (Poaceae), 3 ferns and horsetails,11 sedges and related taxa (Cyperaceae) and 4 rushes (Juncaceae). Sixty-two species (23%) are listed as threatened in one of the country or GB vascular plant red lists (Cheffings et al., 2005; Dines, 2008; Stroh et al. 2014); of which 71% have an Ellenberg N value between 1 and 3, indicative of low-nutrient conditions.
Distribution
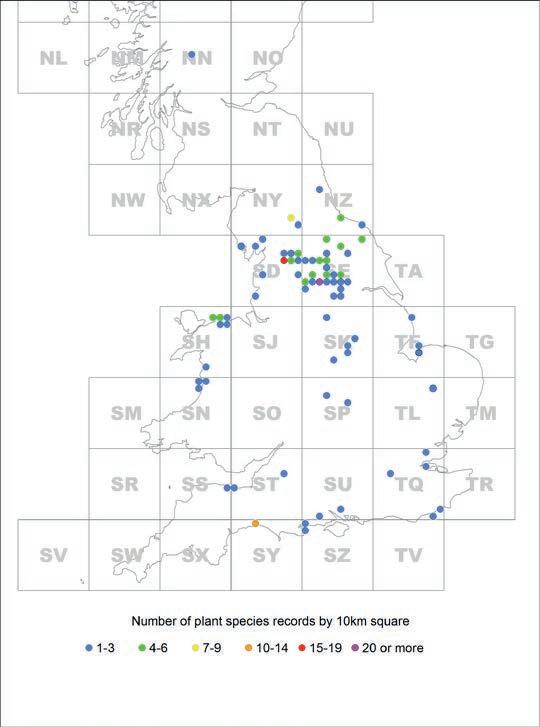
Figure 1 shows the distribution of localities where the herbarium specimens were collected. Of the 265 specimens, over two-thirds (183; 69%) are from North and West Yorkshire with Meanwood (Leeds) accounting for 81 (31%) of the records. This is where my maternal grandparents resided! Some well-known North Yorkshire sites include Austwick Moss, Hole of Horcum and various sites on the Craven limestone of the Yorkshire Dales.
Overall trends and conservation implications
Figure 2 shows changes in the number of site-specific records from post 1930 to 2019. This demonstrates that there has been an increasing pattern of apparent species loss during this period. Thus, post 1930 and up until 1969, 47 species (18%) recorded from a specific locality by PJ were not recorded in the DDb for that period or subsequently, increasing to 163 species (61%) for the period 2010–2019. However, at least for the period 1930 to 1999, there are nonspecific hectad records (2nd bar for each time period
Figure 1. Distribution of the herbarium specimens by 10 km square.
in Figure 2) that all or some could have conceivably been from the PJ locality. If one subtracts these from the loss percentages, these become 1930–1969: 36 (14%), 1969–1987: 41 (15%) and 1987–1999: 45 (17%). Note that these figures include species recorded by PJ that have no records for any period in the DDb, including 6 threatened species (Table 1).
There was a steep rise in apparent species loss from localities from the period 1987–1999 to 2019, equating to a 172% change (Figure 2).
The data, although qualitative, appear to support the conclusions of other studies on floristic change in the British flora in the 20th and 21st centuries (e.g., Walker, 2003; Smart et al., 2005; Walker & Preston, 2006). That is, a continuing overall loss of species over the period 1930 to present.
Of course, interpretation of these findings must be undertaken with caution for a number of reasons. Firstly, decisions relating to the presence or absence of a species where the locality description is non-specific may have resulted in both false positives and false negatives. Secondly, this is not a random sample and the sites from which specimens were collected would have been strongly influenced by personal interest, geographical proximity to residences and site visits for work, and possibly a focus on sites that are likely to have a higher likelihood of species persistence due to the nature of the environment or land tenure, such as unenclosed upland areas, coastal cliffs and golf courses. The wider issues relate to the general limitations of botanical recording such as the unevenness of recording both spatially and temporally (Walker, 2003). This may be due to a range of factors such as the influence of specific recording initiatives (e.g. atlases, sample surveys) and changes over time in the number of recorders in a specific patch, their particular interests and inclinations and levels of expertise. Also, some species may be overlooked or be sporadic in occurrence in a site or area due to having unpredictable or transient life-histories (Walker, 2003).
Threatened species
The herbarium contains 62 species (65 specimens, as three species have two specimens each from two localities) which are classified as threatened in the Great Britain, England or Welsh Red Lists (Cheffings et al., 2005; Dines 2008; Stroh et al., 2014).
Table 1 lists those threatened plant species with herbarium specimens that (i) have no DDb records for the locality or hectad (Table 1a) for any period,
Astragalus glycyphyllos (Wild Liquorice) collected by Peter Jefferson from ‘limestone quarry, Burton Leonard, nr Ripon’, June 1950. There are no DDb records for this species for hectad SE36 for any period.
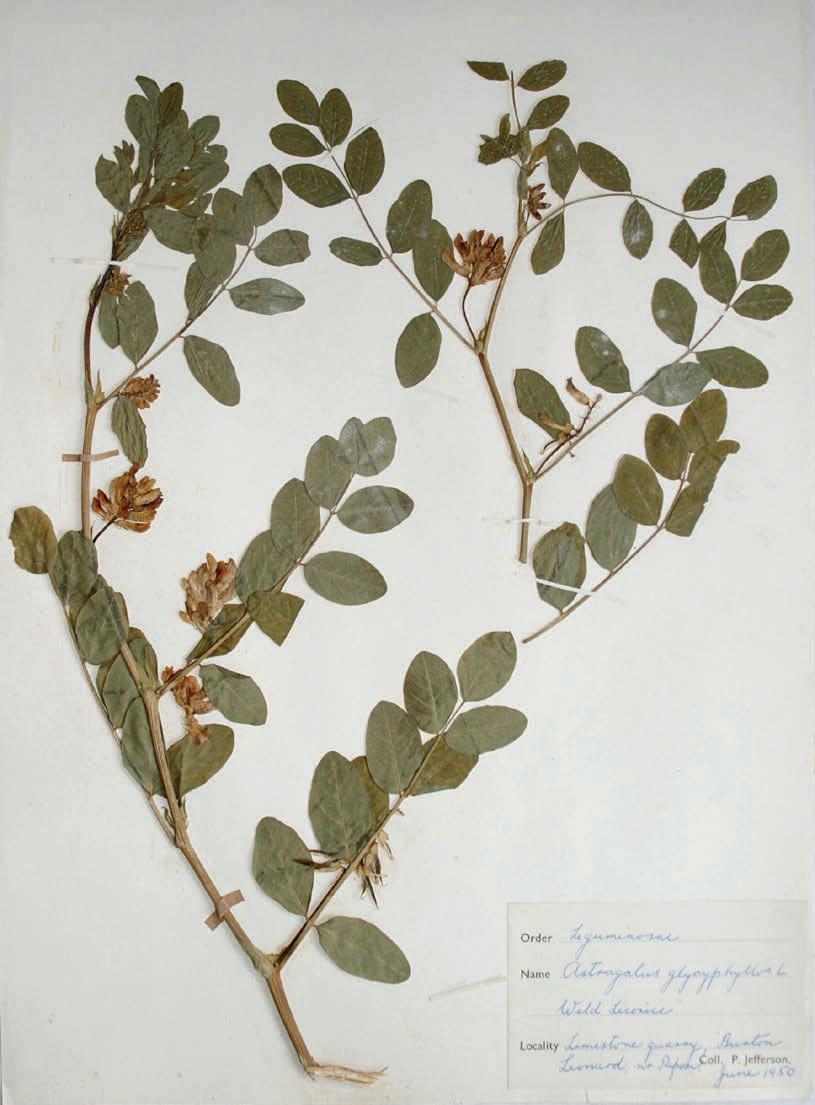
Table 1. Threatened species apparently lost from a locality or hectad
Species Hectad and vice-county (v.c.) Threat status in relevant country; Ellenberg N value in parentheses* Possible cause(s) of ‘loss’ at that locality†
(a) No database records for locality, tetrad or hectad for any period Hordeum marinum (Sea Barley) SH78 v.c. 49 Caernarvonshire LC (England = VU) (6) 1, 2, 4
Hydrocotyle vulgaris (Marsh Pennywort) Linum perenne subsp. anglicum (Perennial Flax) Lysimachia thyrsiflora (Tufted Loosestrife) SE39 v.c. 65 North-west Yorkshire NT (3) 1
TQ79 v.c. 18 South Essex LC (GB = VU) (2) 1
SD38 v.c. 69 Westmorland (with Furness) CR (3) 1, 4, 5
Neottia nidus-avis (Bird’s-nest Orchid) SP37 v.c. 38 Warwickshire VU (2)
8 Scleranthus annuus (Annual Knawel) SE67 v.c. 62 North-east Yorkshire EN/DD (2) 1, 2 (b) Not recorded for locality or hectad post 1969 Anacamptis morio (Green-winged Orchid) SE54 v.c. 64 Mid-west Yorkshire VU (3) 1 Botrychium lunaria (Moonwort) SE76 v.c. 64 Mid-west Yorkshire VU (2) 1, 2, 6 Centunculus minimus (Chaffweed) SU51 v.c. 11 South Hampshire EN (3) 1, 2 Comarum palustre (Marsh Cinquefoil) SE39 v.c. 65 North-west Yorkshire NT (3) 1 Hydrocharis morsus-ranae (Frogbit) SE39 – last record = 1944 – v.c. 65 North-west Yorkshire VU (7) 4, 5
Jasione montana (Sheep’s-bit) Platanthera bifolia (Lesser Butterflyorchid) Pseudorchis albida (Small-white Orchid) SK75 v.c. 56 Nottinghamshire VU (2) SD76 v.c. 64 Mid-west Yorkshire EN (2) 1, 3 1, 6
SE89 v.c. 62 North-east Yorkshire VU (2) 2, 6, 7
Stellaria palustris (Marsh Stitchwort) SE39 v.c. 65 North-west Yorkshire VU (4) 1
(c) Not recorded for locality post 1969 but a there is a more recent hectad record Cerastium arvense (Field Mouse-ear) SP66 v.c. 32 Northamptonshire NT (3) Triglochin palustris (Marsh Arrowgrass) SE26 v.c. 64 Mid-west Yorkshire NT (2) 1, 7 1
* See Hill et al. (2004). Nitrogen (N) values range from 1–9, 1 = extremely infertile sites and 9 = extremely nutrientrich sites. † For other general pressures and threats for threatened species see Preston et al. (2002), Walker et al. (2017), Stroh et al. (2019). Key for possible causes of loss: 1 = conversion to arable cropping and/or intensive grassland (including predrainage) including use of herbicides; 2 = lack of or insufficient management; 3 = development; 4 = changes in watercourse/water body management including drainage and hydrological changes to terrestrial/coastal wetlands; 5 = nutrient enrichment/pollution (water bodies); 6 = extinction due to impact of stochastic event (abiotic or biotic) and/or decline in genetic diversity negatively impacting on a small population; 7 = intensive grazing or cutting; 8 = changes in woodland management including conversion to softwood plantations.
(ii) have apparently been lost from the locality since 1969 (Table 1b) or (iii) lost from the locality since 1969 but remain present in the hectad (Table 1c) post 1969. There are 17 species listed; 27% of the total. Table 1 also tentatively ascribes possible causes for the loss of a species from the locality.
In contrast, Table 2 lists threatened species or those with a very restricted distribution or habitat specialists that have a virtually near-constant presence in a locality since 1930. Of the 15 listed species, all bar one occur in protected areas of one sort or another, at least from the 1950s onwards.
180
160
140
Number of species
120
100
80
60
40
20
0 Nil site specific records non-specific hectad record
Post 1930 Post 1969 Post 1987 Post 1999 Post 2009 Recording period
Figure 2. Changes in the number of site-specific records from post 1930 to post 2009
Table 1 demonstrates the vulnerability of the more specialist plant species to habitat loss, lack of management and eutrophication in particular and is consistent with other more quantitative studies (e.g., Walker et al., 2017). It is evident that a high proportion of these species are associated with infertile habitats (Table 1, column 3) that are sensitive to agricultural improvement and terrestrial and atmospheric nutrient pollution.
On the other hand, Table 2 suggests that habitat or landscape protection measures can have an important role in conserving populations of threatened species. Supporting this contention, when all 62 threatened species are considered, a much higher percentage have post-1987 records when in protected sites than those outside of designated sites. This pattern is marginally stronger when a subset of the threatened species with Ellenberg N values of 3 or less (occurring in infertile to extremely infertile sites) are considered. Walker et al. (2017), for example, present compelling evidence that statutory site protection has contributed to decelerating the declines of many threatened plant species. In addition, some occur in habitats that for one reason or another would be difficult to convert to land uses inimical to the survival of the species. The former might include certain types of wetland, rocky coasts and unenclosed upland habitats.
Summary
These findings appear to be consistent with other studies of change in the British flora over the last 80 years and the probable causes of losses of both threatened and more widespread species. The need for continuing deployment of both existing and new conservation measures and policies will be essential to prevent further declines and to promote recovery of species. In particular, the development of the Governments’ Nature Recovery Network underpinned by Local Nature Recovery Strategies should have a vital role to play.
Acknowledgements
I thank Fred Rumsey (BM) for agreeing to curate the herbarium. This gave me the idea of analysing the information to examine change in the British flora. Iam also grateful to Stephen Edge for preparing the map and to Pete Stroh for comments on the text.
References
Cheffings, C.M. & Farrell, L. eds, Dines, T.D., Jones, R.A., Leach, S.J., McKean, D.R., Pearman, D.A., Preston, C.D.,
Table 2. Threatened species, species with restricted distribution or habitat specialists with a constant or near constant presence from before 1930. Species
Astragalus danicus (Purple Milk-vetch) Status in relevant country
Hectad and 1st record where specified EN NZ52 (1777) Protected site/area status SSSI
Actaea spicata (Baneberry) Cerastium diffusum (Sea Mouse-ear) LC
SE58 (1863) LC SD31 (1840) SSSI SSSI
Draba muralis (Wall Whitlowgrass) LC
SD86 Glaucium flavum (Yellow Horned-poppy) LC (NT England) SS94 SSSI None
Helianthemum oelandicum subsp. incanum (Hoary Rock-rose) Hottonia palustris (Water-violet) LC
VU SH87 SSSI, LNR
SE54 (1888) SSSI, WTNR
Illecebrum verticillatum (Coral-necklace) EN SU20 SSSI, SAC, NP
Lathyrus sylvestris (Narrow-leaved Everlasting-pea) Minuartia stricta (Teesdale Sandwort) Polygala amarella (Dwarf Milkwort) Rubus chamaemorus (Cloudberry) Scheuchzeria palustris (Rannoch-rush) LC SY39 SSSI, SAC
EN NY82 (1844) SSSI, SAC, NNR, AONB
EN SD96 (1904) SSSI, SAC, NNR
LC NY82 (1797) SSSI, SAC, NNR, AONB LC (GB)* NN45 (1912) SSSI, SAC
Thalictrum alpinum (Alpine Meadow-rue) Tofieldia pusilla (Scottish Asphodel) LC
NY82 SSSI, SAC, NNR, AONB LC NY82 (1836) SSSI, SAC, NNR, AONB
* Least concern but geographically restricted to several (6) hectads including Rannoch Moor. Key to column 4: SSSI = Site of Special Scientific Interest; SAC = Special Area of Conservation; NNR = National Nature Reserve; WTNR = Wildlife Trust Nature Reserve; LNR = Local Nature Reserve; NP = National Park; AONB = Area of Outstanding Natural Beauty.
Rumsey, F.J. & Taylor, I. 2005. The Vascular Plant Red
Data List for Great Britain. Species Status 7: 1–116. Joint
Nature Conservation Committee, Peterborough. Dines, T. 2008. A Vascular Plant Red Data List for Wales. Plantlife,
Salisbury. Hill, M.O., Preston, C.D. & Roy, D.B. 2004. PLANTATT –
Attributes of British and Irish Plants: Status, Size, Life History,
Geography and Habitats. Centre for Ecology and Hydrology,
Wallingford. Jefferson, P. 1956. Studies on the earthworms of turf. Journal of the Sports Turf Research Institute 9: 166–179. Preston, C.D., Pearman, D.A. & Dines, T.D. 2002. New Atlas of the British and Irish Flora. Oxford University Press, Oxford. Smart, S.M., Bunce, R.G.H., Marrs, R., Le Duc, M., Firbank,
L.G., Maskell, L.C., Scott, W.A., Thompson, K. & Walker,
K.J. 2005. Large-scale changes in the abundance of common higher plant species across Britain between 1978, 1990 and 1998 as a consequence of human activity: tests of hypothesised trait representation. Biological Conservation 124: 355–371. Stroh, P.A., Leach, S.J., August, T.A., Walker, K.J., Pearman,
D.A., Rumsey, F.J., Harrower, C.A., Fay, M.F., Martin, J.P.,
Pankhurst, T., Preston, C.D. & Taylor, I. 2014. A Vascular
Plant Red List for England. Botanical Society for Britain and Ireland, Bristol. Stroh, P.A., Walker, K.J., Smith, S.L.N., Jefferson, R.G.,
Pinches, C.E. & Blackstock, T.H. 2019. Grassland Plants of the British and Irish lowlands. Ecology, Threats and Management.
Botanical Society for Britain and Ireland, Hertfordshire,
UK. Walker, K.J. 2003. One species lost every year? An evaluation of plant extinctions in selected British vice-counties since 1900. Watsonia 24: 359–374. Walker, K.J. & Preston, C.D. 2006. Ecological predictors of extinction risk in the Flora of lowland England, UK.
Biodiversity & Conservation 15: 1913–1942. Walker, K.J., Stroh, P.A. & Ellis, R.W. 2017. Threatened Plants in Britain and Ireland. Results of a Sample Survey, 2008–2013.
Botanical Society of Britain and Ireland, Bristol.
Richard G. Jefferson
Bell Cottage, Cocking Yard, Burton in Kendal, Cumbria LA6 1LZ


